Abstract
Modeling sanitary sewer overflow (SSO) discharges based on flows measured at pumping stations presents specific challenges distinct from modeling combined sewer overflow (CSO) discharges and is insufficiently studied. This paper presents a methodology aimed at reducing and assessing the uncertainty in SSO estimation. Four lumped models are compared: a time–area curve, linear reservoir, Clark, and simplified numerical modeling using SWMM. Clark’s model delivers the best results, with very reasonable estimates. Although the simplified SWMM model also provides good estimates, factors such as determinism in weir crest height and potential storage in the sewer network introduce additional uncertainties and errors. The attenuation of measured hydrographs at pumping mains leads to an underestimation of both the catchment area and the SSO discharges, which depends on the pump operating frequency and requires further evaluation. The maximum flow rate threshold allowed for the pumping station is a key parameter for SSO frequency and volume; its influence is evaluated in detail. This methodology can also be used to assess unknown overflows upstream of monitored weirs, as it provides estimates of total SSO discharges occurring in a catchment. The results of applying this methodology to two contrasting and paradigmatic pumping stations are discussed.
1. Introduction
The control of combined sewer overflow (CSO) discharges has been an important subject of research and action for decades [1,2,3,4,5]. However, the monitoring of such discharges still tends to focus on the largest subsystems or sites that present a high environmental risk due to the inherent technical, logistical, and operational difficulties and costs [6,7]. Many separate sanitary systems are also responsible for the discharge of untreated wastewater during wet weather due to the inflow of runoff-, groundwater-, and rainfall-derived infiltration and inflow (RDII) into the sanitary sewer system. This issue has only recently received due attention [7,8,9,10,11,12].
In the European Union (EU), the recent Proposal for a revised Urban Wastewater Treatment Directive [13,14] poses new and major challenges for the management of urban water in wet weather conditions. The new Article 5 establishes that “by 31 December 2033, Member States shall ensure that an integrated urban wastewater management plan is established for drainage areas of agglomerations of 100,000 p.e. and above”. By 31 December 2039, these plans shall be enlarged to agglomerations with more than 10,000 p.e. where stormwater overflow (a) poses a risk to the environment or human health, (b) represents more than 2% of the annual collected urban wastewater load calculated in dry weather flow, and (c) prevents the fulfillment of the requirements of six other EU Directives. According to Article 21, competent authorities shall “carry out representative monitoring, at relevant points, of storm water overflows into water bodies and of discharges of urban runoff from separate systems, in order to estimate the concentration and loads” [14].
In the USA, CSO discharges are subject to the National Pollutant Discharge Elimination System (NPDES) permitting program. Sanitary sewer overflow (SSO) discharges, like other point-source discharges from municipal sanitary sewer systems, are prohibited unless authorized by an NPDES permit [15].
SSOs can occur due to several factors. They can be accidental, due to blockages, equipment damage, and power failures, or they can result from chronic problems, such as undue connections from stormwater infrastructure, the penetration of groundwater, and infiltration due to line breaks and sewer defects. They tend to get worse over time if left unaddressed.
Monitoring SSO discharges requires standardized weirs, which do not exist in most locations, or measuring the flow rate upstream and downstream of the overflow structure. There are often no suitable sewers for installing the monitoring equipment, as they require uniform flow and safe access. Sewers that drain the entire upstream catchment (i.e., downstream of the confluence of two or more sewers) are also often too short. Free surface flow, debris, and floating materials in wastewater and the great variability of stormwater raise additional difficulties for the calibration and maintenance of monitoring equipment [16,17,18,19,20,21]. These factors contribute to the absence of monitoring of the flow rate of most CSO and SSO structures.
Sanitation of low-lying areas or coastal areas often requires multiple wastewater pumping stations (PSs), with CSO or SSO being discharged in highly sensitive aquatic environments. Although overflow discharges are seldom monitored, the pumped flow usually is, as electromagnetic or ultrasonic sensors allow measurement in the pressure duct from the outside (without contact with the sewer), with good accuracy and much lower maintenance needs. Measuring the wastewater height in the pumping well can also provide a reliable quantification of the influent/pumped flow rate [21,22].
Fencl et al. (2019) and Van Assel et al. (2023) [21,22] proposed innovative methodologies to estimate inflow and infiltration based on monitoring data at pumping stations.
Distributed and physically based models have commonly been used to estimate combined sewer overflows. These models are built and parameterized based on the physical characteristics (e.g., catchments, sewers, reservoirs, regulators, weirs) of the different modeled subprocesses. In turn, these characteristics have been incorporated as potential sources of uncertainty in the quantification and propagation of errors [23,24,25,26].
However, in separate sanitary sewers with undue stormwater inflows, the contributing area, the SSO discharges’ location, and other characteristics of the catchment are unknown. Therefore, these sewers can only be modeled using lumped conceptual models, whose calibration consists of adjusting a small set of parameters (empirical models). The number of parameters should be as parsimonious as possible, avoiding situations in which several combinations of coefficients fit the model results to the calibration conditions well but generate different results for distinct scenarios.
Sanitary sewer systems can carry flows with four main origins: (i) base wastewater flows; (ii) groundwater inflows; (iii) rainfall-derived infiltration and inflow; (iv) runoff.
One of the most popular models for flow routing in sanitary sewers, the US EPA SSOAP toolbox [27], provides tools for database management and RDII hydrograph generation using the RTK method. This method superimposes three synthetic unit hydrographs, representing fast, medium, and slow flows. It is based on triangular unit hydrographs, each characterized by three coefficients. SSOAP also interfaces with SWMM [28], which is a widely used application for distributed, physically based modeling of urban drainage systems and has a tool to support condition assessment.
The recent SS-WFIUH modeling framework [11] is based on the width function instantaneous unit hydrograph approach and supports sanitary sewer hydrograph separation. With the increasing use of green infrastructure (GI), more deterministic models of the subsurface flow and its interaction with the sewer network and urban streams have emerged [9,10,29,30,31,32,33,34].
Although most modeling studies of flow routing in sanitary sewers have SSO mitigation as one of their main objectives, few address the quality of SSO estimates, contrary to what has happened with combined systems.
While the accuracy of modeling results can easily be assessed for the flow rate at the main trunk sewer, which is measured and can be verified, the questions arise of how reliable the results of the SSO discharges generated by these models are and what precautions/procedures to adopt to improve them and reduce uncertainty. This issue is exacerbated by the application domain of conceptual lumped models being limited to supercritical free surface flows, whereas SSO discharges are likely to occur under sewer surcharge conditions. Furthermore, although pumping stations are prime locations for monitoring, pump operation causes attenuation of hydrographs and discontinuity of data series.
In the SINERGEA Project, a platform was developed for optimized integrated management of energy consumption and SSO discharges in complex sanitation systems, which was validated in the separate sanitary sewer system of Albufeira, Portugal. The flows monitored at the pumping mains of six pumping stations were used to calibrate lumped models aimed at estimating both the pumped flows in wet weather (and the respective energy consumption) and the SSO discharges. One-minute data series had to be used, since runoff is a relevant inflow, catchment concentration times are small, and pump operating periods are short. Simplifications of hydrological models, the attenuation of hydrographs monitored at pumping mains, and the cutting off of hydrographs by SSO weirs are important sources of uncertainty in the SSO discharge estimates.
The main objective of the present work is to propose an innovative methodology to assess and reduce the uncertainty of SSO discharges estimated by mathematical models. The procedure includes the comparison of different hydrological models not only for the monitored sites but also for hypothetical cases with known SSO. The following four models are compared: time–area curve, linear reservoir, Clark, and simplified modeling using SWMM. Hypothetical cases are also used to evaluate the influence on SSO estimates of the hydrograph attenuation due to the operation of pumping stations, as well as the influence of the hydrograph cut-off for different values of the maximum flow rate threshold allowed for the pumping station.
The application of the methodology to the two most paradigmatic Albufeira pumping stations, concerning the complexity of the catchment, flow, and measurement conditions, is presented and discussed.
2. Materials and Methods
2.1. Modeling Methodology for Estimating SSO Discharges
Modeling undue stormwater inflows into sanitary sewer systems based on flow rate measurements at pumping stations presents unique challenges that differentiate it from the modeling of combined sewer systems and require special care. The following aspects stand out: (i) the lack of knowledge about the area and characteristics of the contributing sub-catchments; (ii) the smaller size of the pipes, with a significantly higher probability of surcharge; (iii) the greater weight of the variability of the dry weather flow and the rainfall-derived infiltration and inflow (RDII) component compared with the runoff component; (iv) the intermittent regime of measurements depending on the operation of the pumps; (v) the possibility that the pumps’ operating rules change over time.
In many pumping stations (PSs), the pump stopping and operating periods can be very short, just a few minutes, so the time step of the flow records should not exceed about 1 min.
In this context, the methodology for modeling sanitary sewer overflow (SSO) discharges must (i) use lumped conceptual hydrological models, (ii) be particularly parsimonious in the number of parameters, and (iii) minimize complexity.
More than one combination of hydrological parameters can lead to good calibration results for pumped flows but also to important differences for SSO discharge volumes. To assess the credibility of SSO estimates, parameter sensitivity analyses, the comparison of results from different models, and the evaluation of results for hypothetical sewer systems comparable to the modeled reality are particularly important.
To select the most plausible combination of parameters in the calibration of lumped hydrological models, we propose the following:
- (a)
- Ensuring that the modeled and measured volumes are similar;
- (b)
- Minimizing an indicator of flow rate deviations, such as the sum of squared errors (ΣE2), the Nash–Sutcliffe efficiency coefficient (NSE), or the Kling–Gupta efficiency coefficient (KGE), and graphically analyzing the results [35,36,37,38].
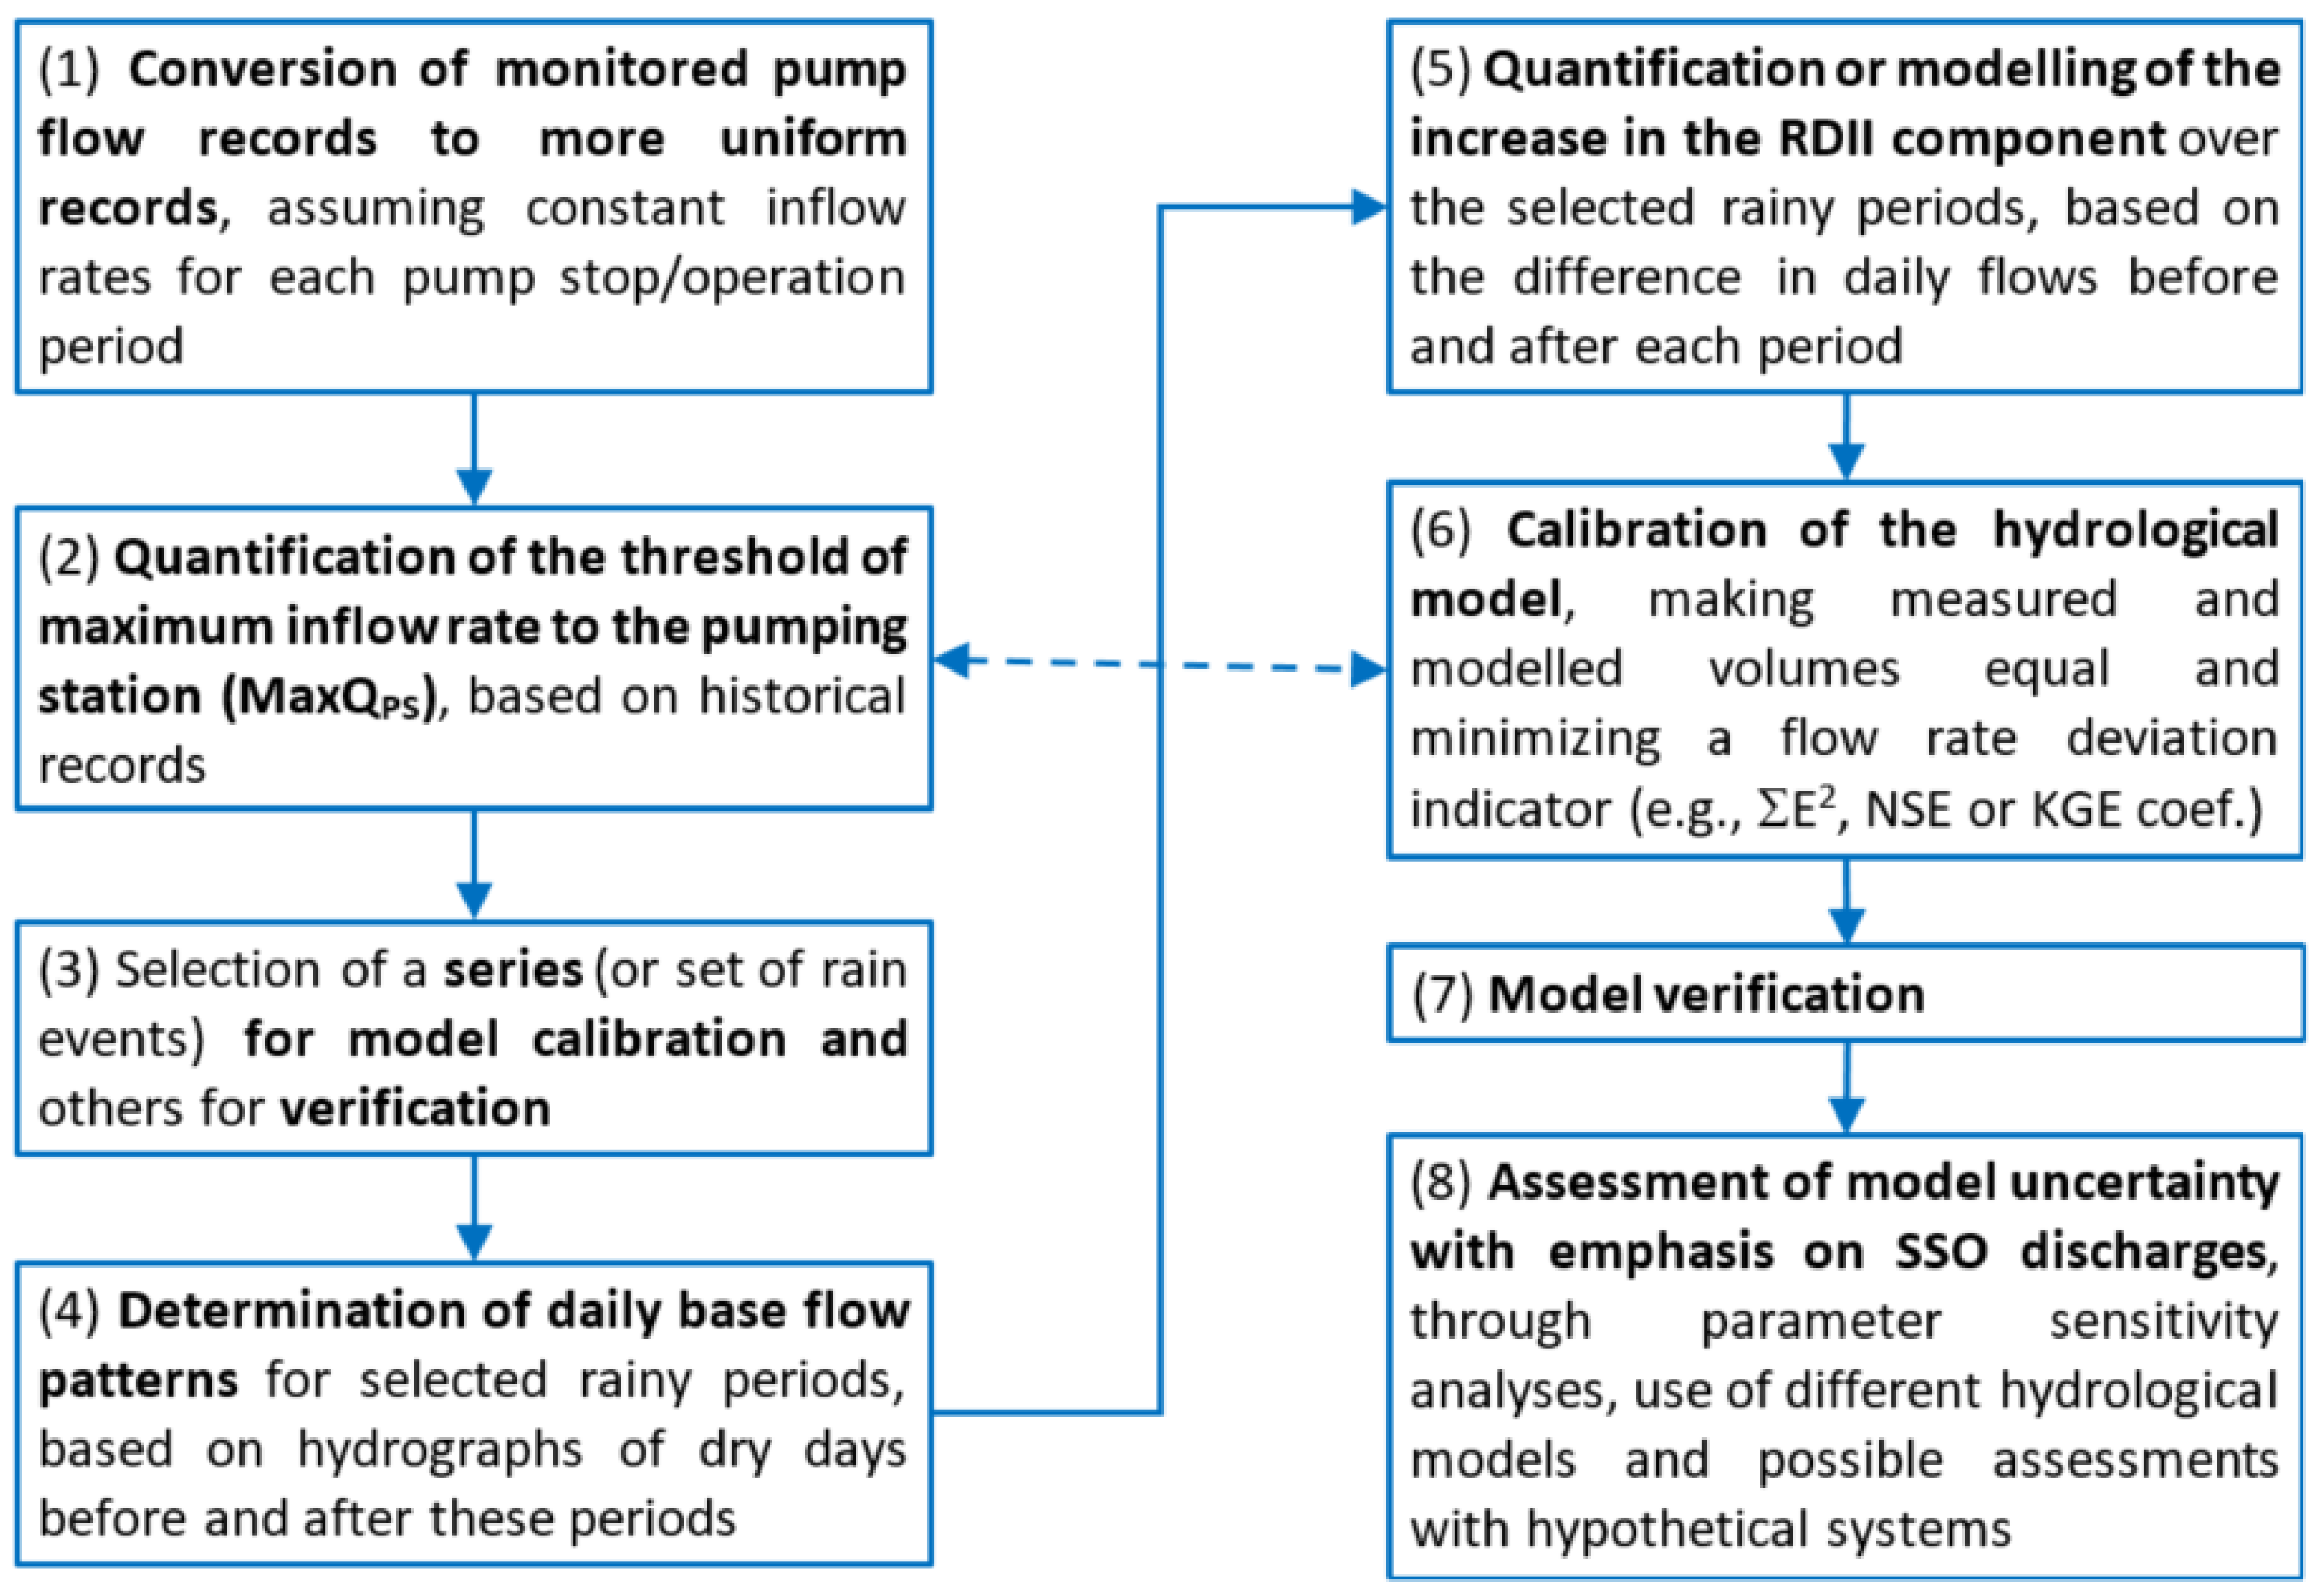
Figure 1 shows the main tasks of the proposed methodology.
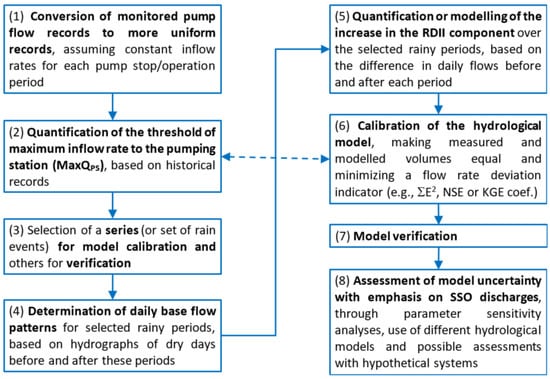
Figure 1.
Modeling methodology for estimating sanitary sewer overflow (SSO) discharges.
The threshold of the maximum flow rate allowed for the pumping station (MaxQPS) does not correspond to the maximum flow rate measured during the simultaneous operation of the pumps, but rather to the threshold imposed by the weir upstream of the PS or by the rules for closing safety valves upstream of the PS. In practice, this threshold can be estimated by calculating the cumulative average of the pumped flows at each instant until the end of the period with very high pumping intensity (including periods without pump operation and even periods in which the flow into the pumping station is cut), as will be demonstrated in the case study. The results of the hydrological model may support a more accurate identification of these periods.
Modeling the slow flows of the RDII component generally requires long data series due to their seasonal variability associated with the precipitation and the water table level [11,12,39,40,41]. Its parameterization does not fall within the scope of the described approach.
From here on, this paper refers to hydrological models as those that simulate runoff inflows (the fast flow of RDII) and include only the slower inflows in the RDII component.
2.2. Hydrological Models Used
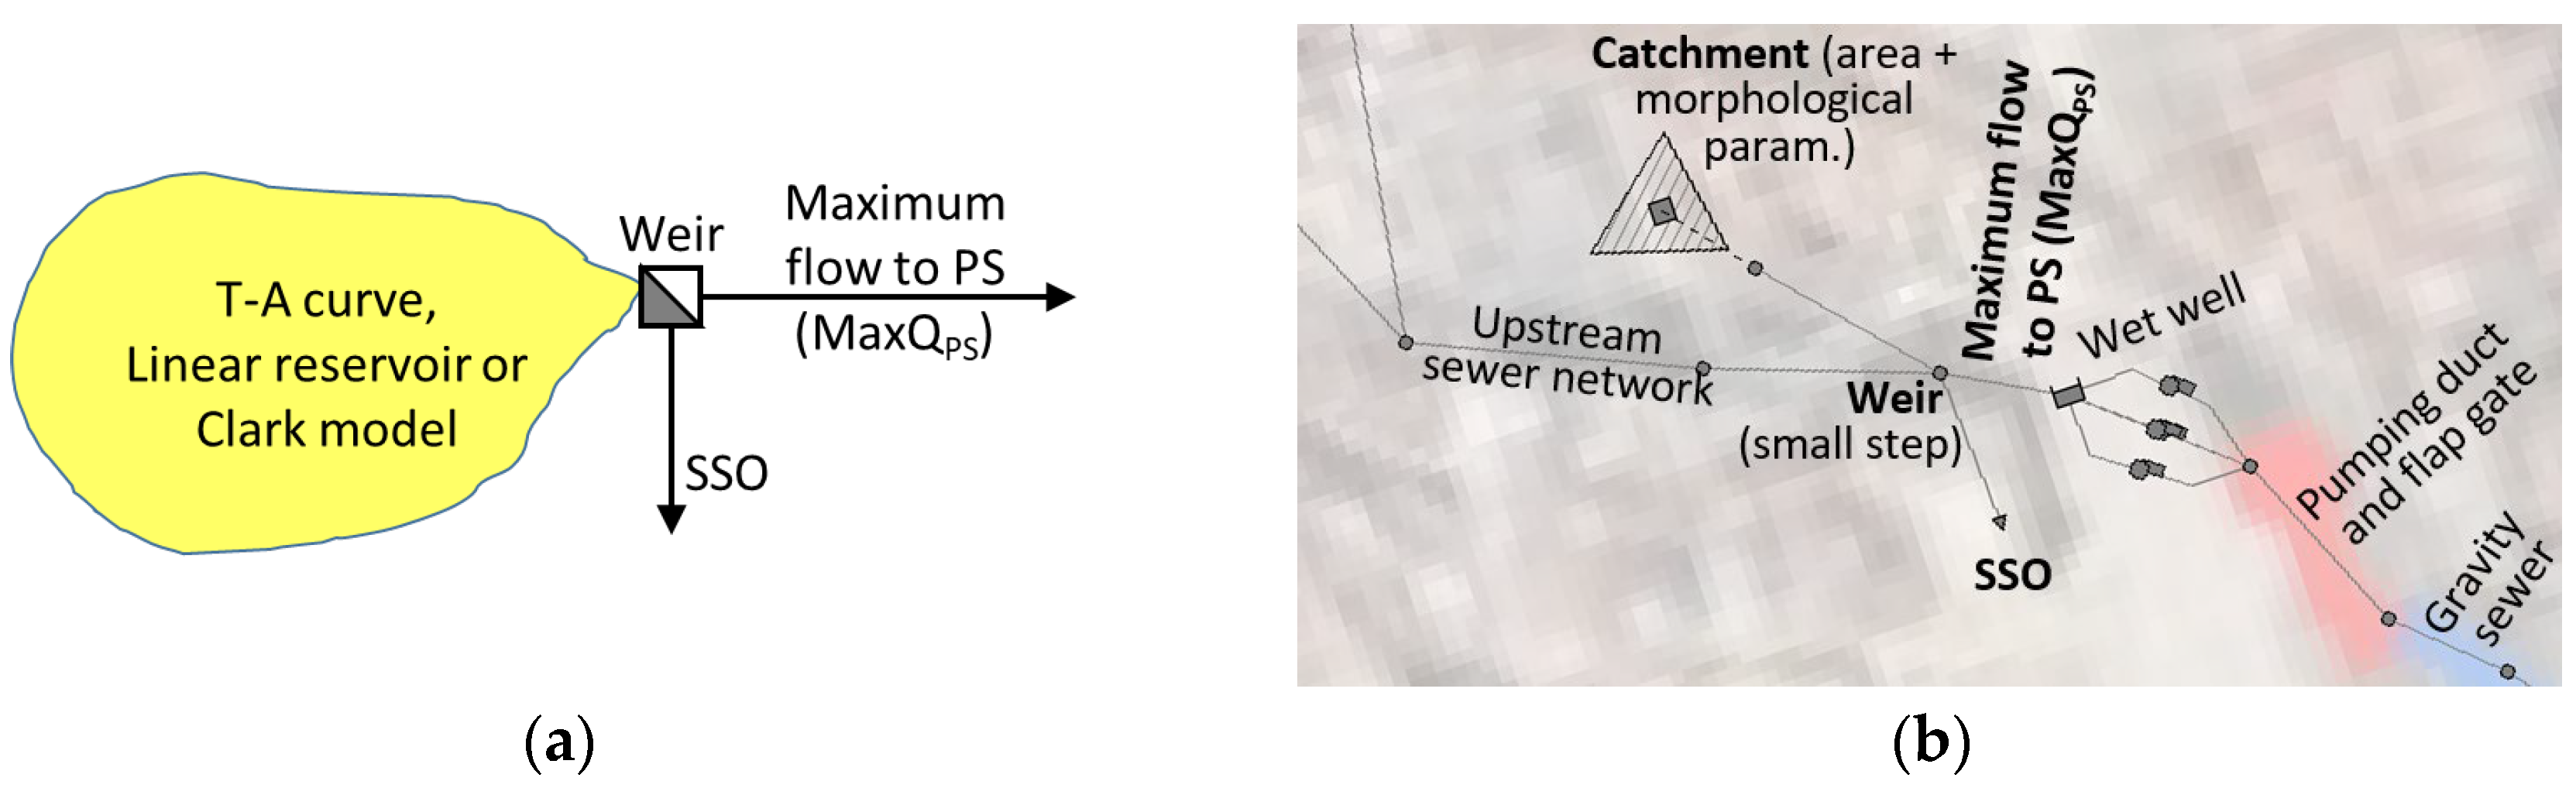
Initially, a purely conceptual model was used. This model considers a catchment area, the convolution of the hydrograph by a hydrological model, and an SSO weir that shaves the inflow to the PS from a pre-defined threshold (Figure 2a). The S4-DRAINAGE model [42,43] was used, which has automatic calibration routines for several hydrological models.
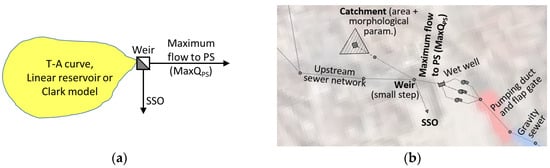
Figure 2.
Lumped modeling scheme using (a) pure conceptual models and (b) SWMM.
Then, a catchment, an SSO weir, and a sewer pipe with a predefined maximum flow rate were modeled upstream of each PS of the SWMM model [28] of the Albufeira interceptor system (Figure 2b).
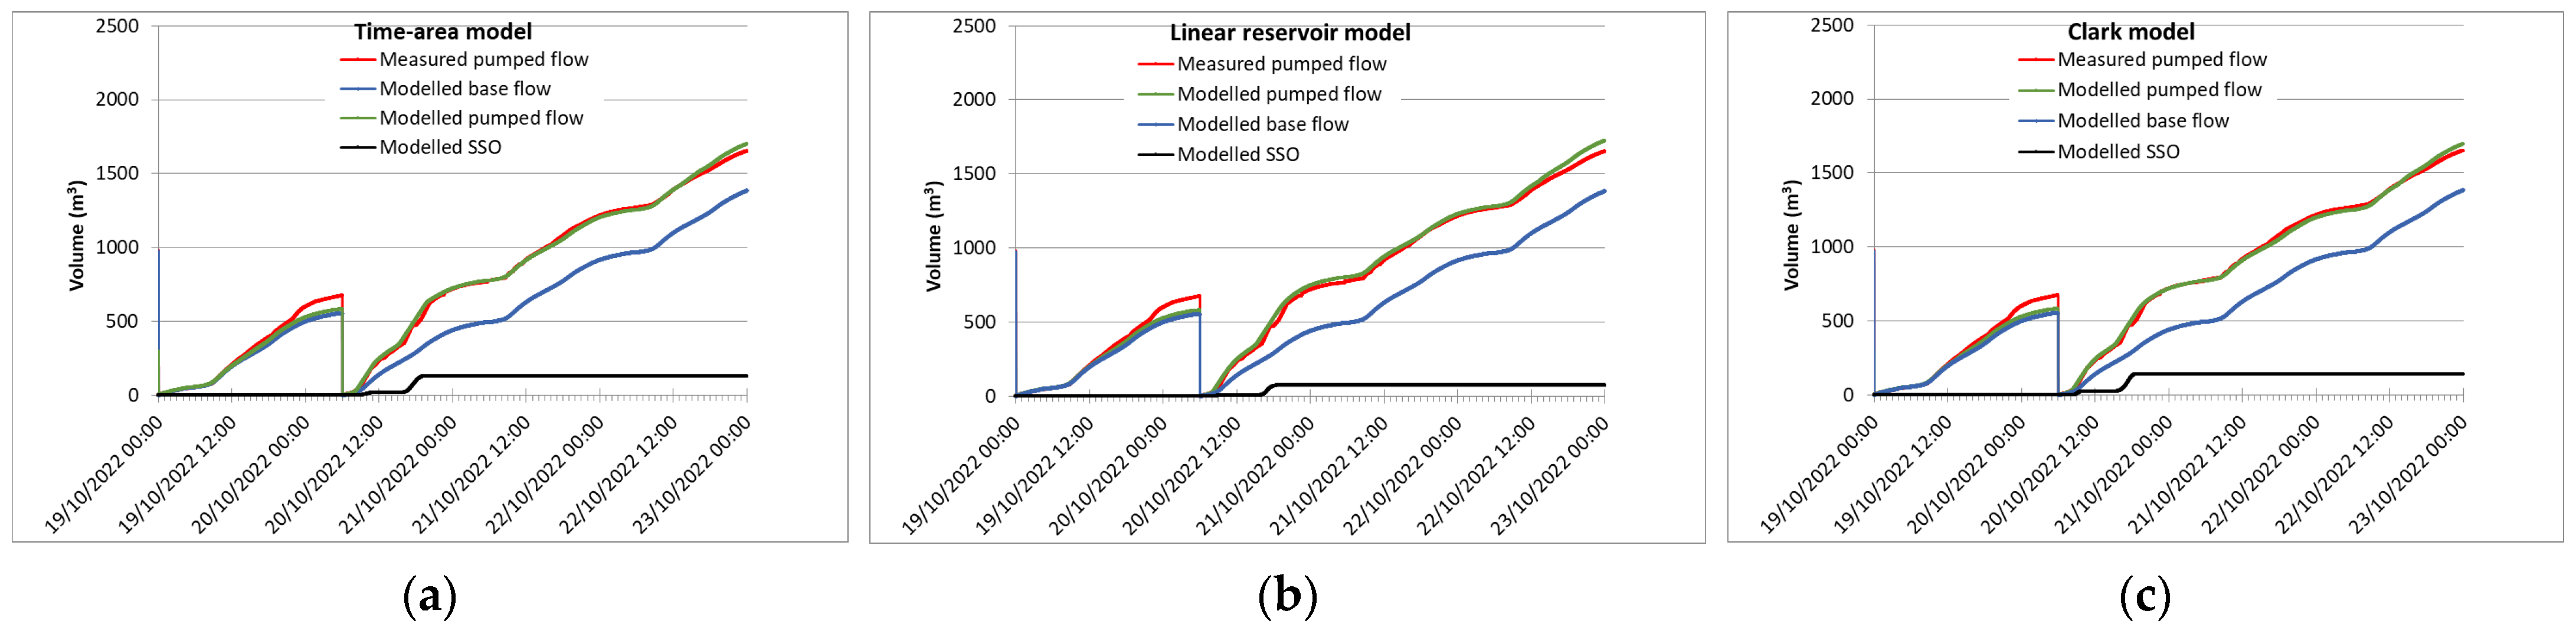
The following four models are compared herein [44,45,46]:
- (a)
- The time–area curve, which is considered linear, meaning that the only calibration parameter is the translation time interval (t). For the linear time–area relationship, the instantaneous unit hydrograph is rectangular, with a duration equal to the catchment concentration time (tc) and ordinate equal to 1/tc expressed in terms of the unit precipitation per unit of time (e.g., mm/h).
- (b)
- The linear reservoir model, whose only calibration parameter is the attenuation coefficient of the hydrograph as it passes through the reservoir (K).where I(t) is the rainfall volume per unit time over the catchment at time t (e.g., mm/h), and O(t) is the runoff rate downstream of the catchment at time t (mm/h). In the form of finite differences and solving in order to O(t + dt), this yieldswith and .
- (c)
- The Clark model, which considers the routing of the time–area hydrograph through a linear reservoir to provide diffusion, requiring two calibration coefficients if the linear time–area relationship is used (t; K). Trying to maintain a single calibration parameter in the Clark model, a sensitivity analysis was carried out considering one of the coefficients as half, equal to, or double the other. As the best results were obtained by keeping the two coefficients equal (t = K), the parameterization of the model continued with this rule, with good results always being obtained, as will be seen below.
- (d)
- The simplified SWMM model, considering a single 100% impermeable catchment with a square shape, fixed Manning coefficient (0.05 s.m−1/3), and zero hydrological losses, in which the catchment slope (i) is the only calibration parameter.In the context of this work, SWMM was used to simulate the hydrodynamics in the sewer networks using the full Saint-Venant equations for both cases described in the next sections: the Albufeira interceptor system and the hypothetical case to validate the methodology.SWMM allows for a very detailed description of catchments, including their hydrological losses, low-impact development features, and the kinematic equation for flow convolution. However, the estimation of the stormwater inflows to each of the pumping stations was carried out herein in a simplified and conceptual way, as described above (Figure 2b).
The calibration of the models consisted of obtaining the pair of values “catchment area; hydrological model coefficient” that equated the modeled volume to the measured volume and led to the lowest sum of squared errors.
2.3. The Albufeira Case Study
The SINERGEA Project developed a platform to optimize the management of energy consumption in sanitation systems, floods, and SSO discharges into bathing waters, which was validated in the city of Albufeira, Portugal, and its neighboring coastal area. The main stakeholders of the case study are Águas do Algarve S.A., the water utility that manages the Albufeira wastewater interceptor sewer and treatment system, the Municipality of Albufeira, which is responsible for the management of the local territory, urban streams, and separate sewer networks, and the Portuguese Environment Agency.
The Albufeira sanitary interceptor sewer system serves several coastal urban–tourist developments and has ten PSs, two submarine outfalls, and a wastewater treatment plant.
The Águas do Algarve S.A. remote management system monitors flow rates in the pumping mains of six of the ten PSs, whose 1 min records were used to calibrate mathematical models for wet weather.
The models were calibrated for a succession of rainfall events from late December 2021 and were verified for events occurring in March and October 2022.
This paper presents the results of the two PSs with more distinct characteristics: Vale1 PS, with high dry weather flow, high pumping capacity, and reduced attenuation of the hydrograph shape in the pumping well, and Fer2 PS on the opposite side.
2.4. Hypothetical Case to Validate the Methodology and Sensitivity Analysis of the Parameters
The validation of the methodology was carried out for a hypothetical system, which was intended to be at least as complex as all of the Albufeira subsystems in terms of flow propagation in the catchment, attenuation of measured hydrographs, and SSO discharge conditions.
For this purpose, a 100 ha catchment was modeled, consisting of 40 sub-catchments with 2.5 ha each, of which 5% generate runoff (it is believed that in most real cases, the area contributing to undue inflows to the sanitary sewer system does not exceed 5% of the total catchment area).
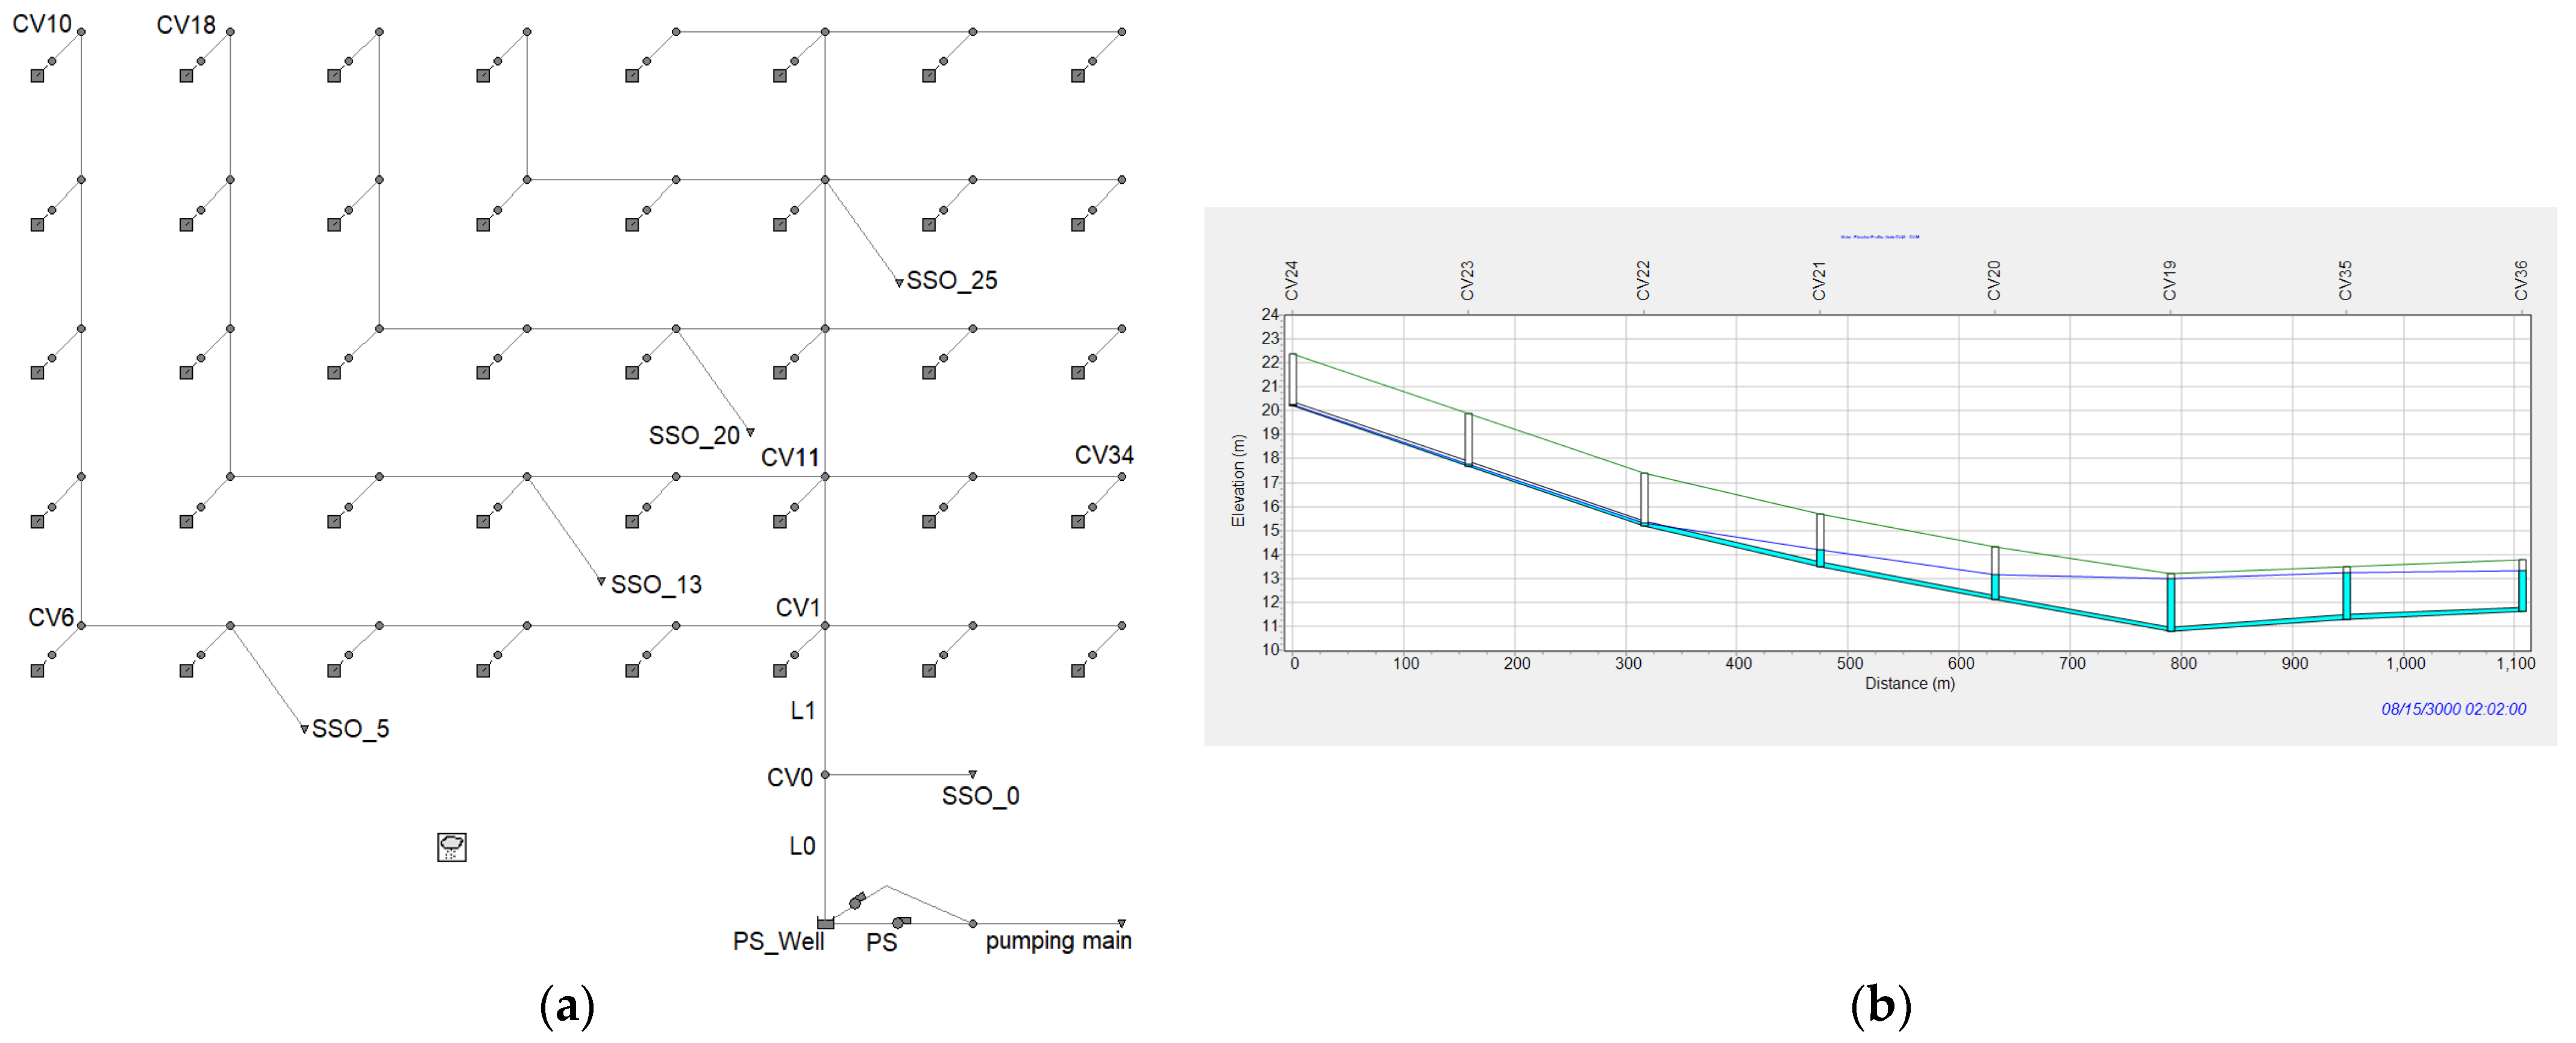
The catchment has a shell-shaped altimetry, with high slopes upstream but reduced slopes downstream. The sewer system was designed based on good practice for a high population density, resulting in downstream sewers with a minimum regulatory slope of 0.3% and diameters of DN315 and DN400. However, to increase the complexity of flow conditions, namely, in the surcharge during subcritical flows, several sewers have depths greater than 2 m (Figure 3).
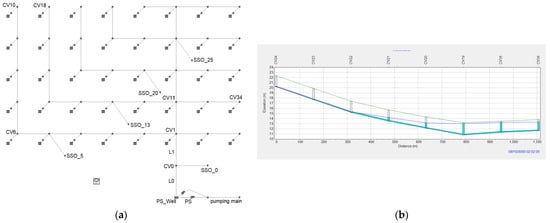
Figure 3.
SWMM model of the hypothetical system: (a) plan; (b) longest longitudinal profile during a peak flow.
A constant 18.4 L/s dry weather flow (DWF) was distributed across the 40 nodes of the model, and simulations were carried out using the series of precipitation events selected to calibrate the Albufeira model for the following threshold of the maximum flow rate allowed for the pumping station (MaxQPS): 30, 60, 90, 120, and 150 L/s. These thresholds vary between 1.6 and 8 times the value of the average dry weather flow.
There is a SSO weir immediately upstream of the PS (SSO_0), which discharges whenever the water height at CV0 exceeds 0.5 m (the inlet offset of the overflow sewer). To prevent flooding throughout the catchment, there are four additional SSO weirs upstream: three of them overflow when the water height at the upstream node exceeds 1.0 m (SSO_5, SSO_13, and SSO_20), and the other overflows when the water height exceeds 1.5 m (SSO_25).
The results of the SSO discharges for different MaxQPS values will be compared with those obtained with the four hydrological models described in Section 3.2 for the following two main scenarios:
- (a)
- Calibration using the flow rates measured upstream of the PS to evaluate the behavior of the hydrological model.
- (b)
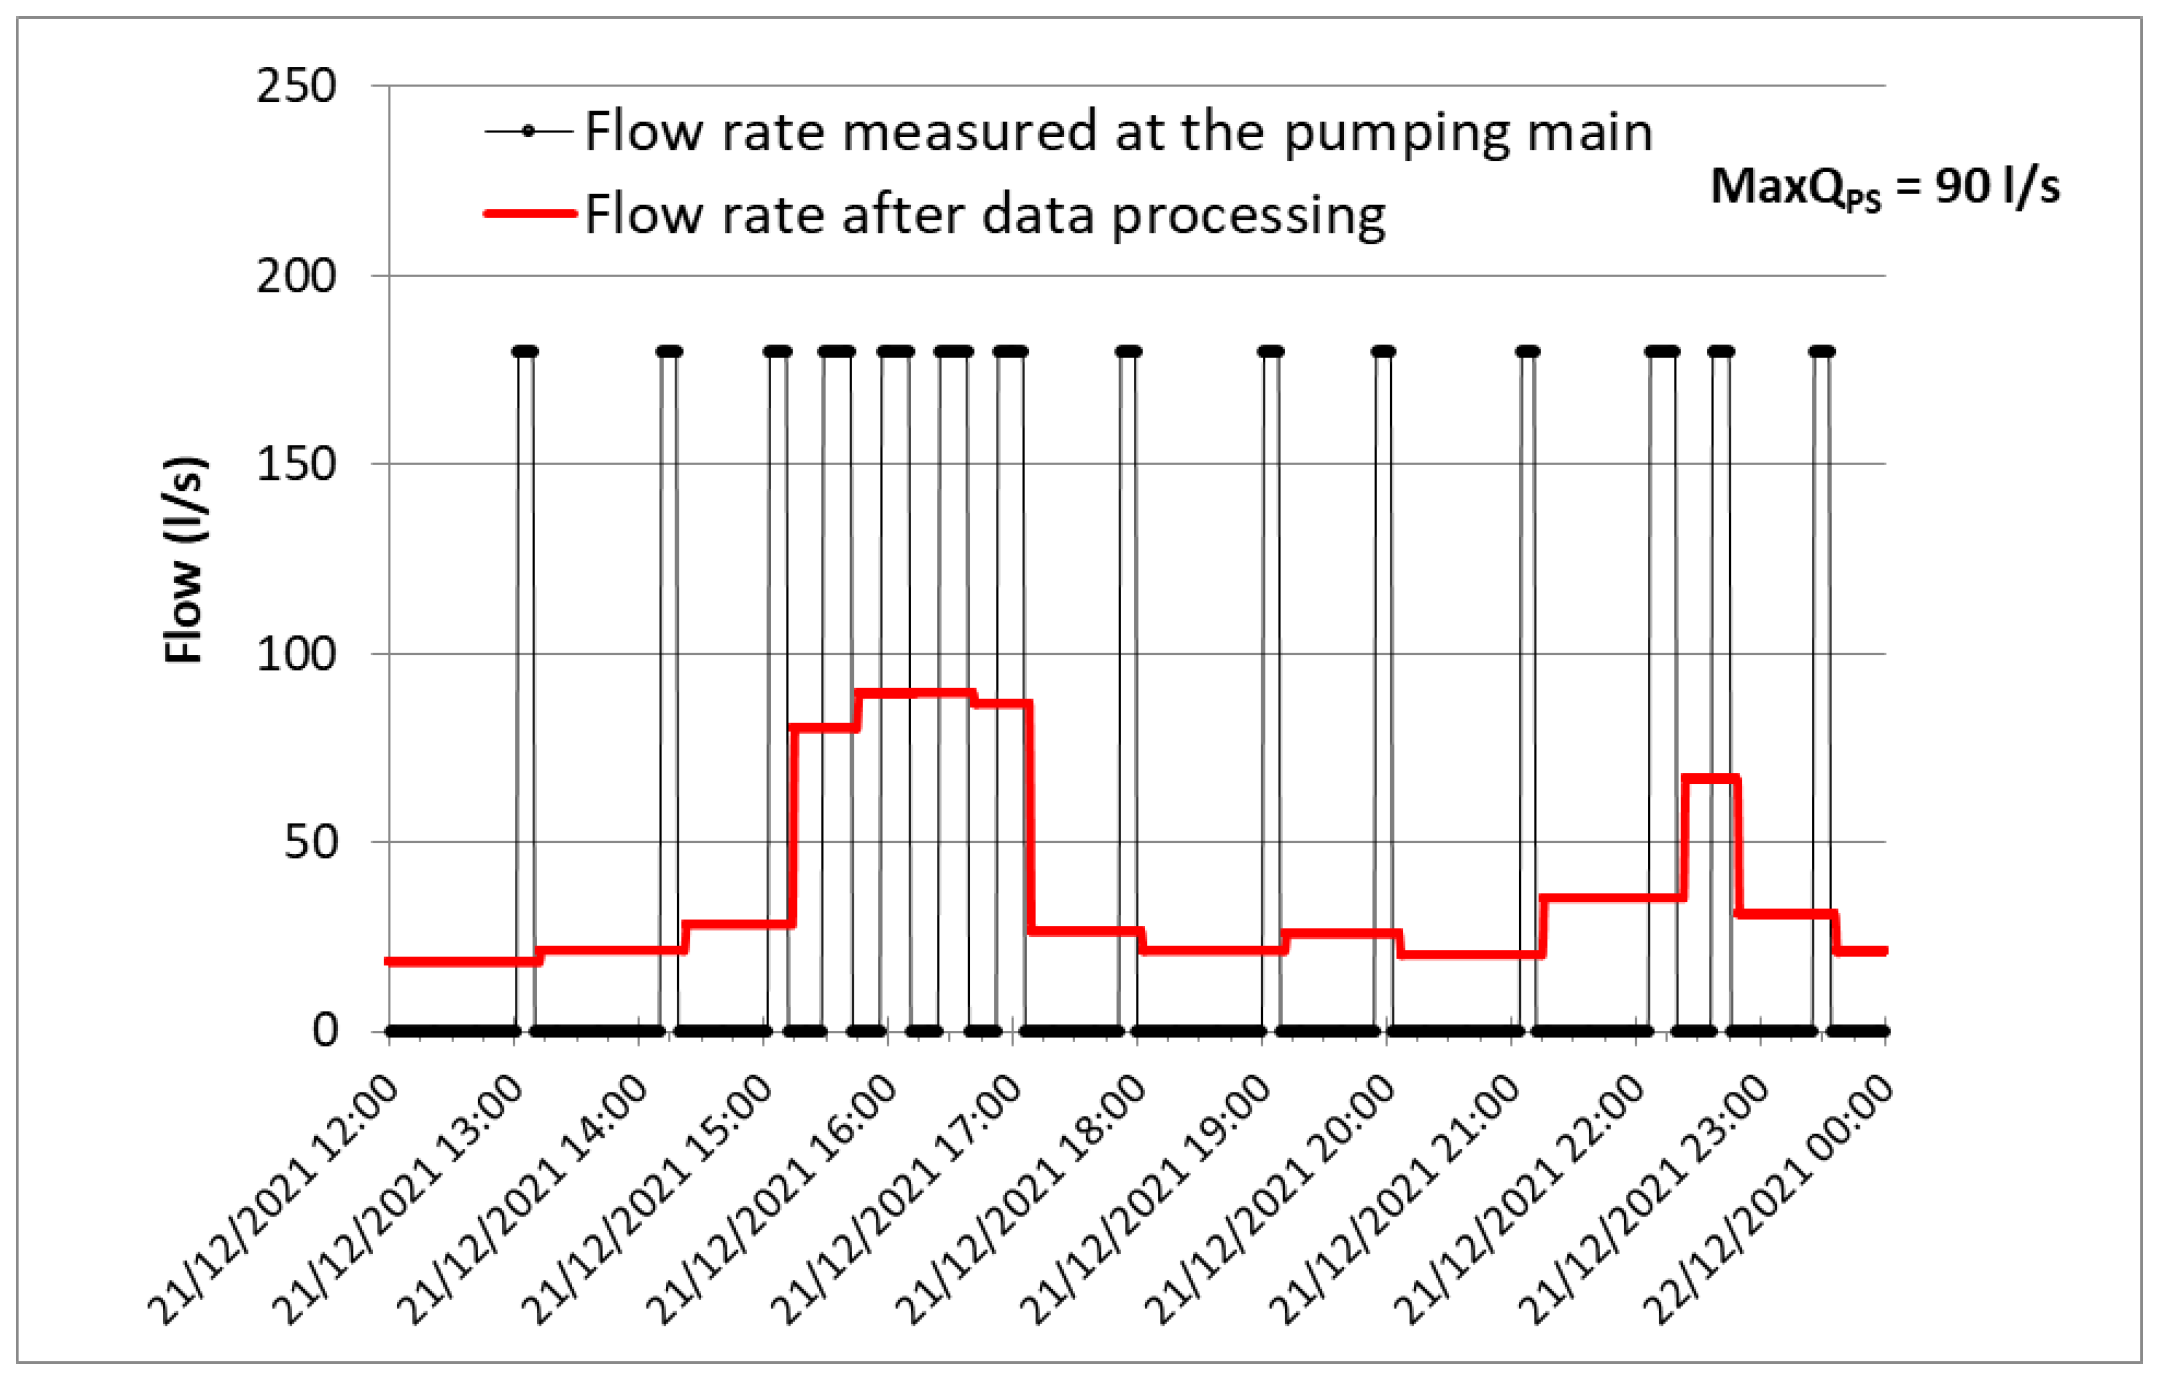
- Calibration using the flow rates measured downstream of the PS and treated as indicated in the first task of the methodology described in Section 3.1; in this case, the errors in the results caused by discontinuous measurement at the pumping main are added to the errors of the hydrological model studied in the previous paragraph. We sought to create a significantly more conservative scenario than that of practically all PSs in Albufeira, which was possibly close to the case of Fer2 PS; in the example of Figure 4, pump stop and start cycles lead to constant flow rate values for more than 60 min during dry weather and 30 min during heavy precipitation peaks.
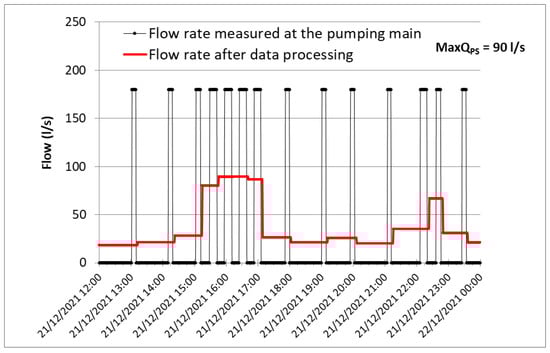 Figure 4. Discontinuous flow measurement at the pumping main of the hypothetical case and data processing for modeling.
Additionally, the SSO discharges of the models described in paragraph (a) will be verified for both one of the events selected to verify the Albufeira model and a 2-year return period design hyetograph (lasting 4 h and centered on a tip of 1 h).
3. Results and Discussion
3.1. Hypothetical Case to Assess the Methodology
For the series of events selected for calibration, the stormwater generated in the hypothetical case was 3043 m3. The sanitary sewer overflow (SSO) discharges varied between 1638 m3 for MaxQPS = 30 L/s and just 30 m3 for MaxQPS = 150 L/s, which correspond to, respectively, 54% and 1% of the stormwater generated. Practically the entire volume of SSO discharges occurred in the weir located immediately upstream of the PS (SSO_0).
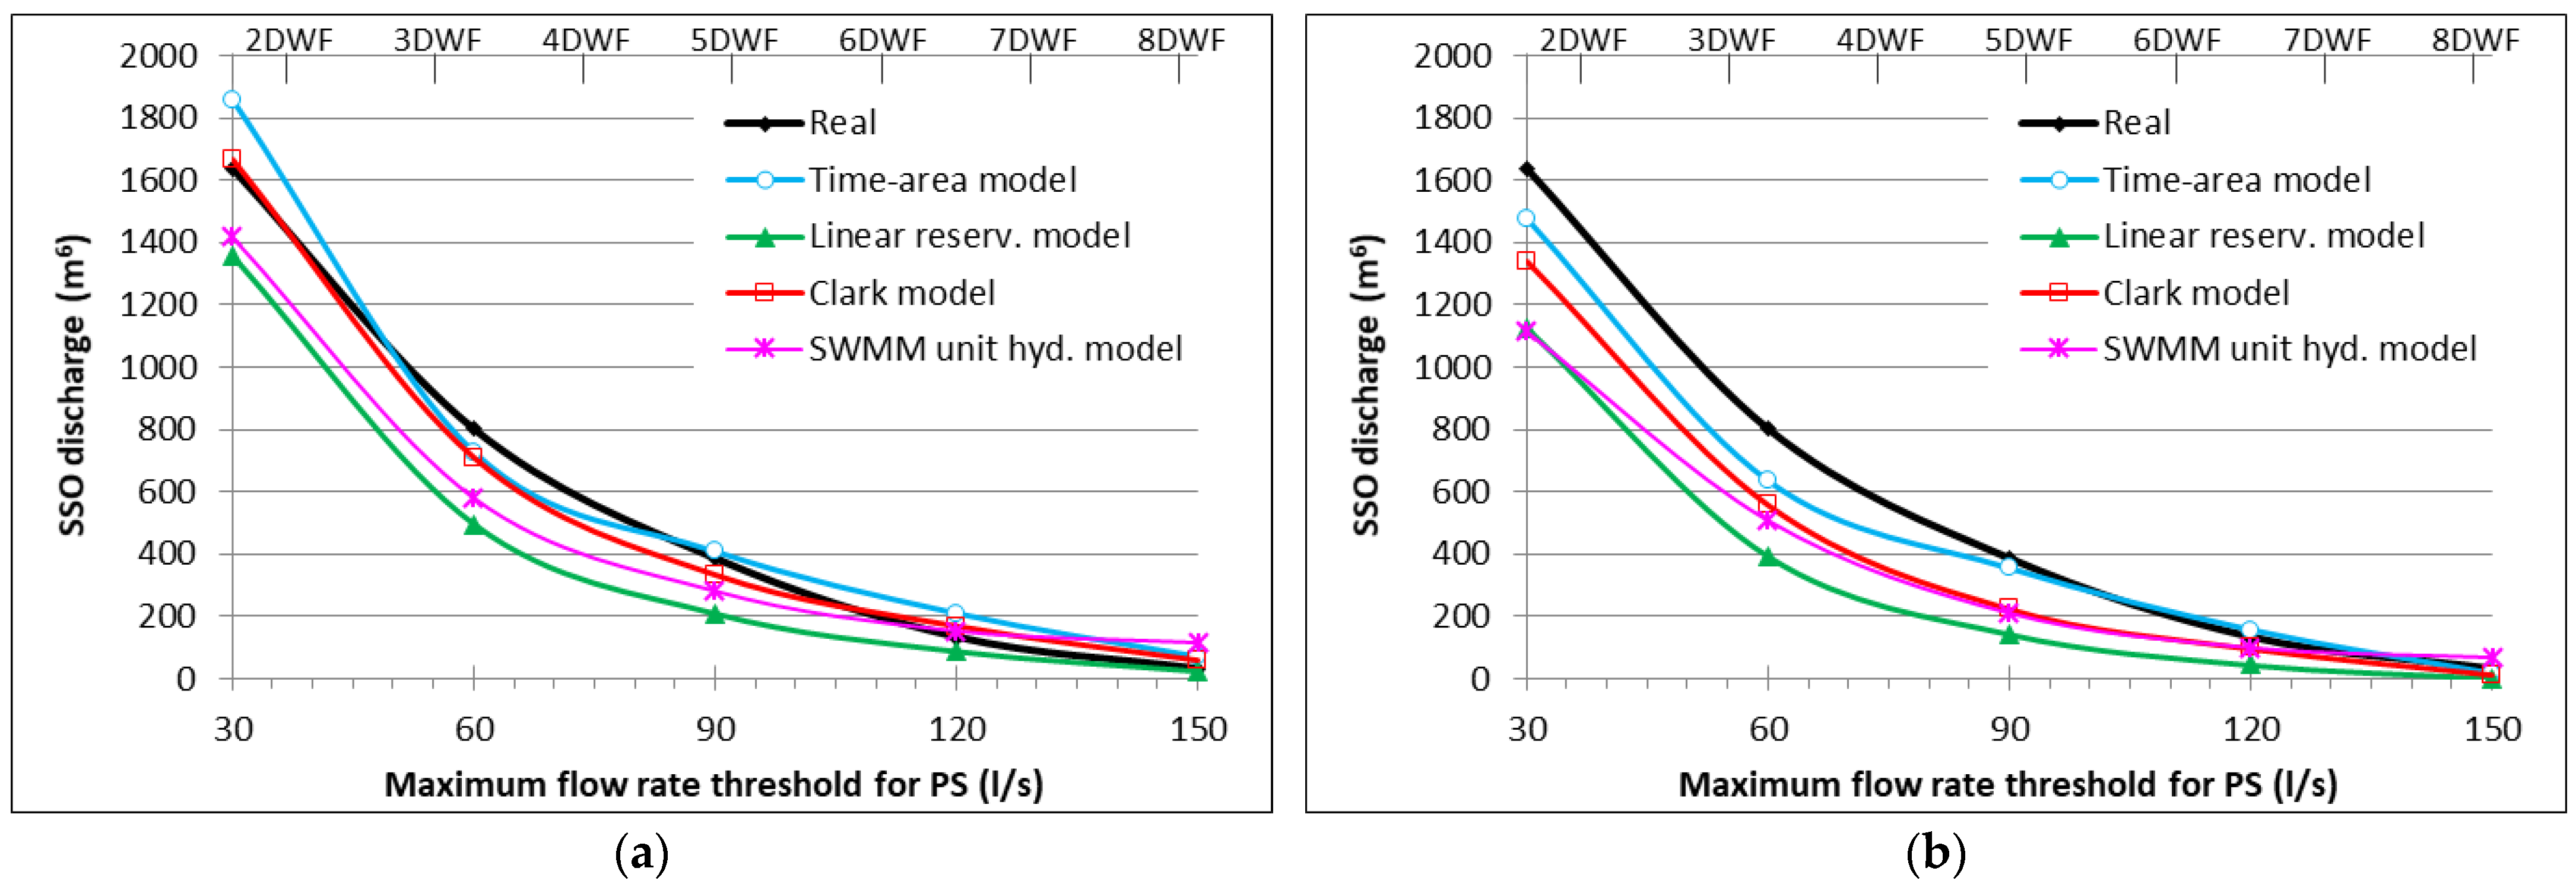
Figure 5 presents the SSO discharge values for different MaxQPS values and compares them with the results obtained with the four hydrological models, which were calibrated as described previously. The corresponding relative errors are presented in Figure 6.
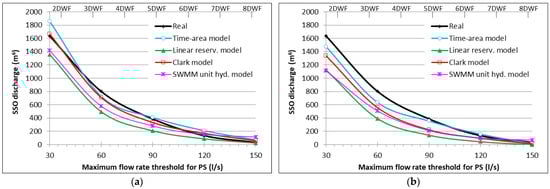
Figure 5.
SSO discharge results obtained with the different models when calibrated against flow rates measured at (a) the pumping station (PS) inlet and (b) the pumping main (DWF = dry weather flow rate).
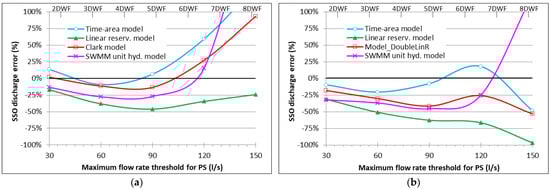
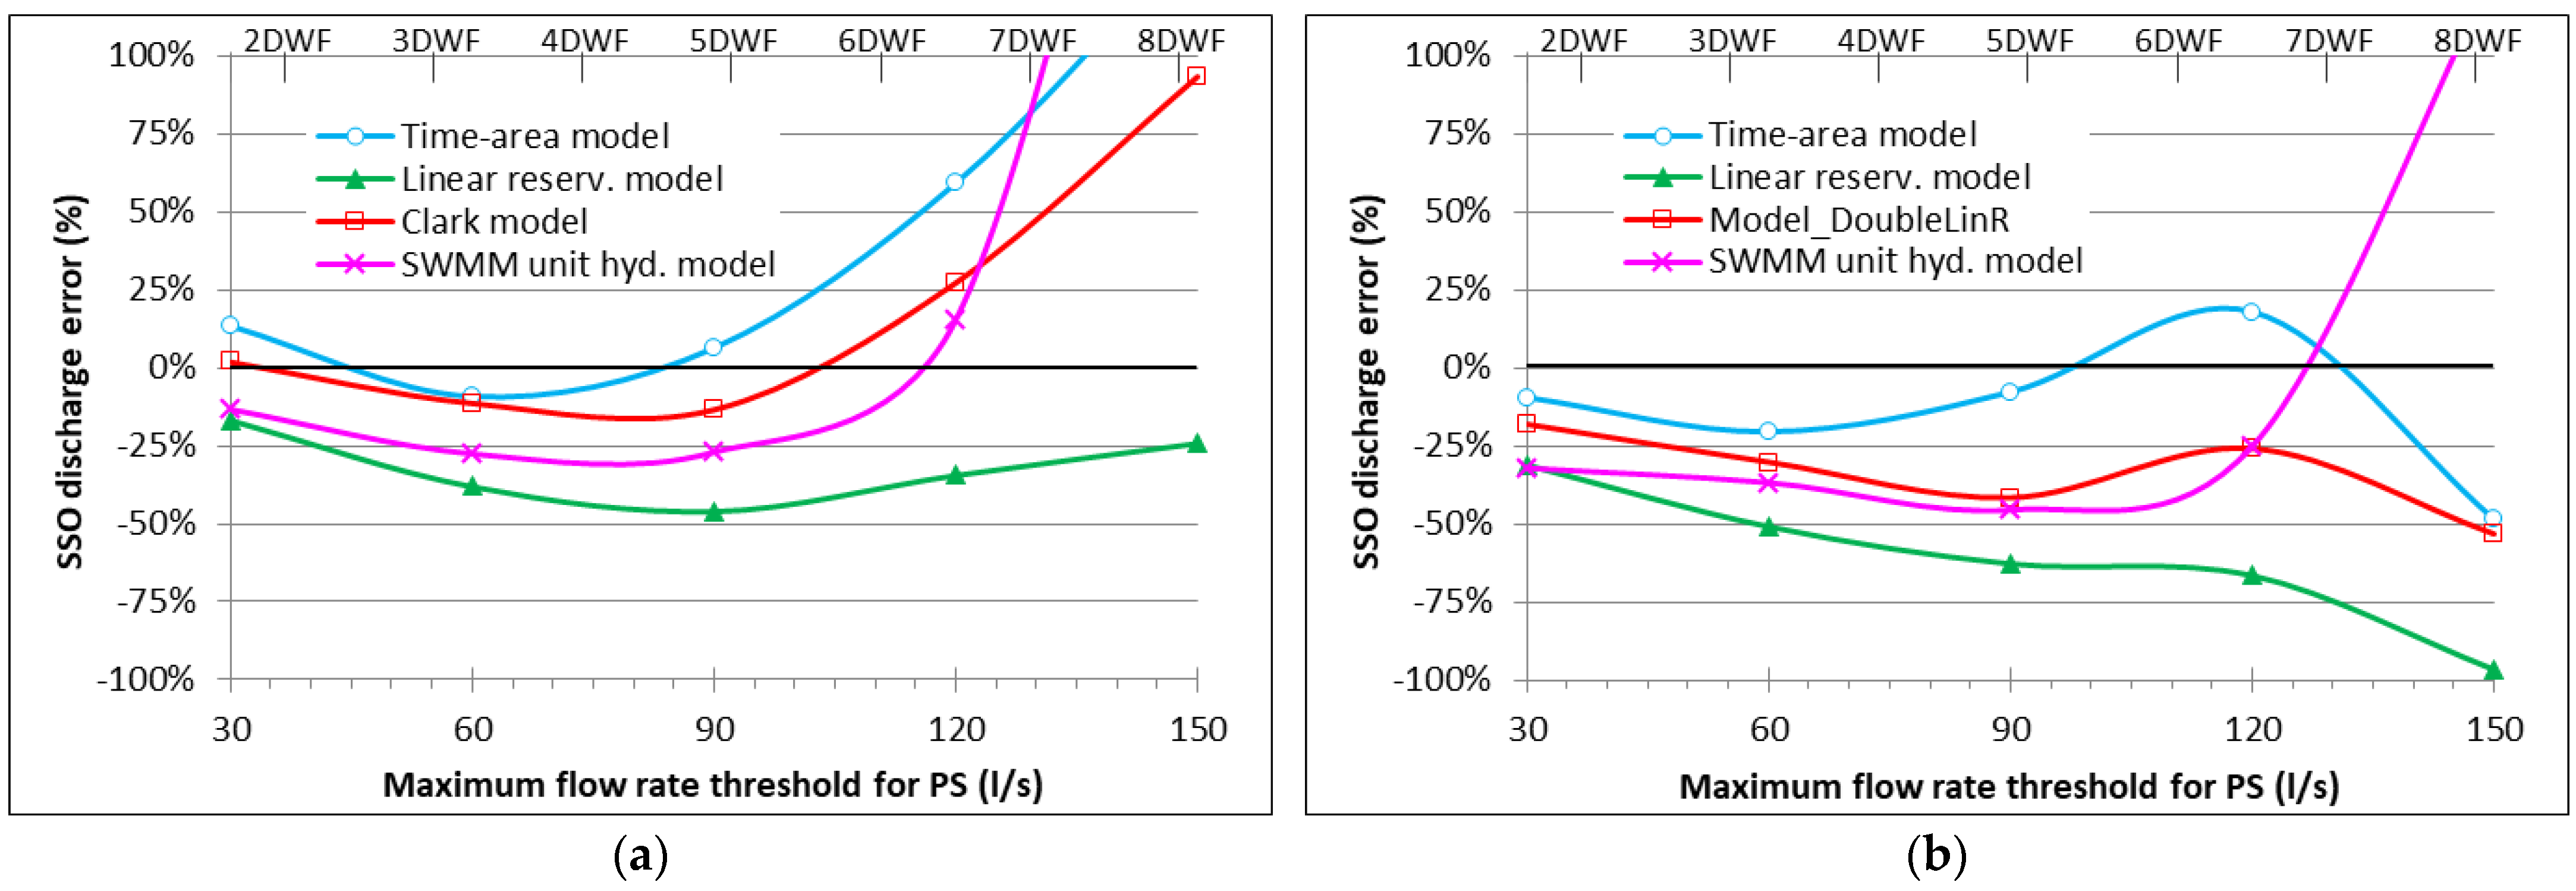
Figure 6.
Relative errors in SSO discharge obtained with the different models when calibrated against flow rates measured at (a) the PS inlet and (b) the pumping main.
3.1.1. Models Calibrated against the Flow Rates Measured Upstream of the PS at the L0 Sewer
For the models calibrated against the flow rates measured at the L0 sewer, upstream of the PS (graphs on the left side of Figure 5 and Figure 6), the Clark model is the one that provides SSO discharge values closest to the observed values, with relative errors of less than ±25% for all MaxQPS values below approximately 120 L/s (or up to 6.5 times the dry weather flow in the upper axis). For MaxQPS = 150 L/s, the relative error increases to close to 100% due to the SSO discharge being very small, just 30 m3, i.e., 1% of the total runoff.
The linear reservoir model is the one that leads to the lowest CSO discharge values that are furthest from the observed values.
The time–area curve model leads to the highest values of SSO discharges.
The lumped SWMM model generates SSO discharges that are always below and further from the measured value than those of the Clark model. For MaxQPS = 150 L/s, this model leads to a significantly higher SSO discharge that is further from reality than those of all other models, which is attributed to excessive surcharge modeling upstream of the PS weir (weir SSO_0). It should be noted that in the lumped SWMM model, the SSO discharge depends on the height of the weir crest and the flow head line in the upstream sewers. In this case, the catchment of the lumped SWMM model was connected to node 11, and two weirs were modeled, the PS weir (SSO_0) and another weir upstream of node 11, to avoid flooding and unaccounted discharges. The elevation of the weir crests influences the total head line upstream of the PS and, consequently, the SSO discharged. These determinism issues in the simplified SWMM model are additional factors of uncertainty in relation to the other three lumped models.
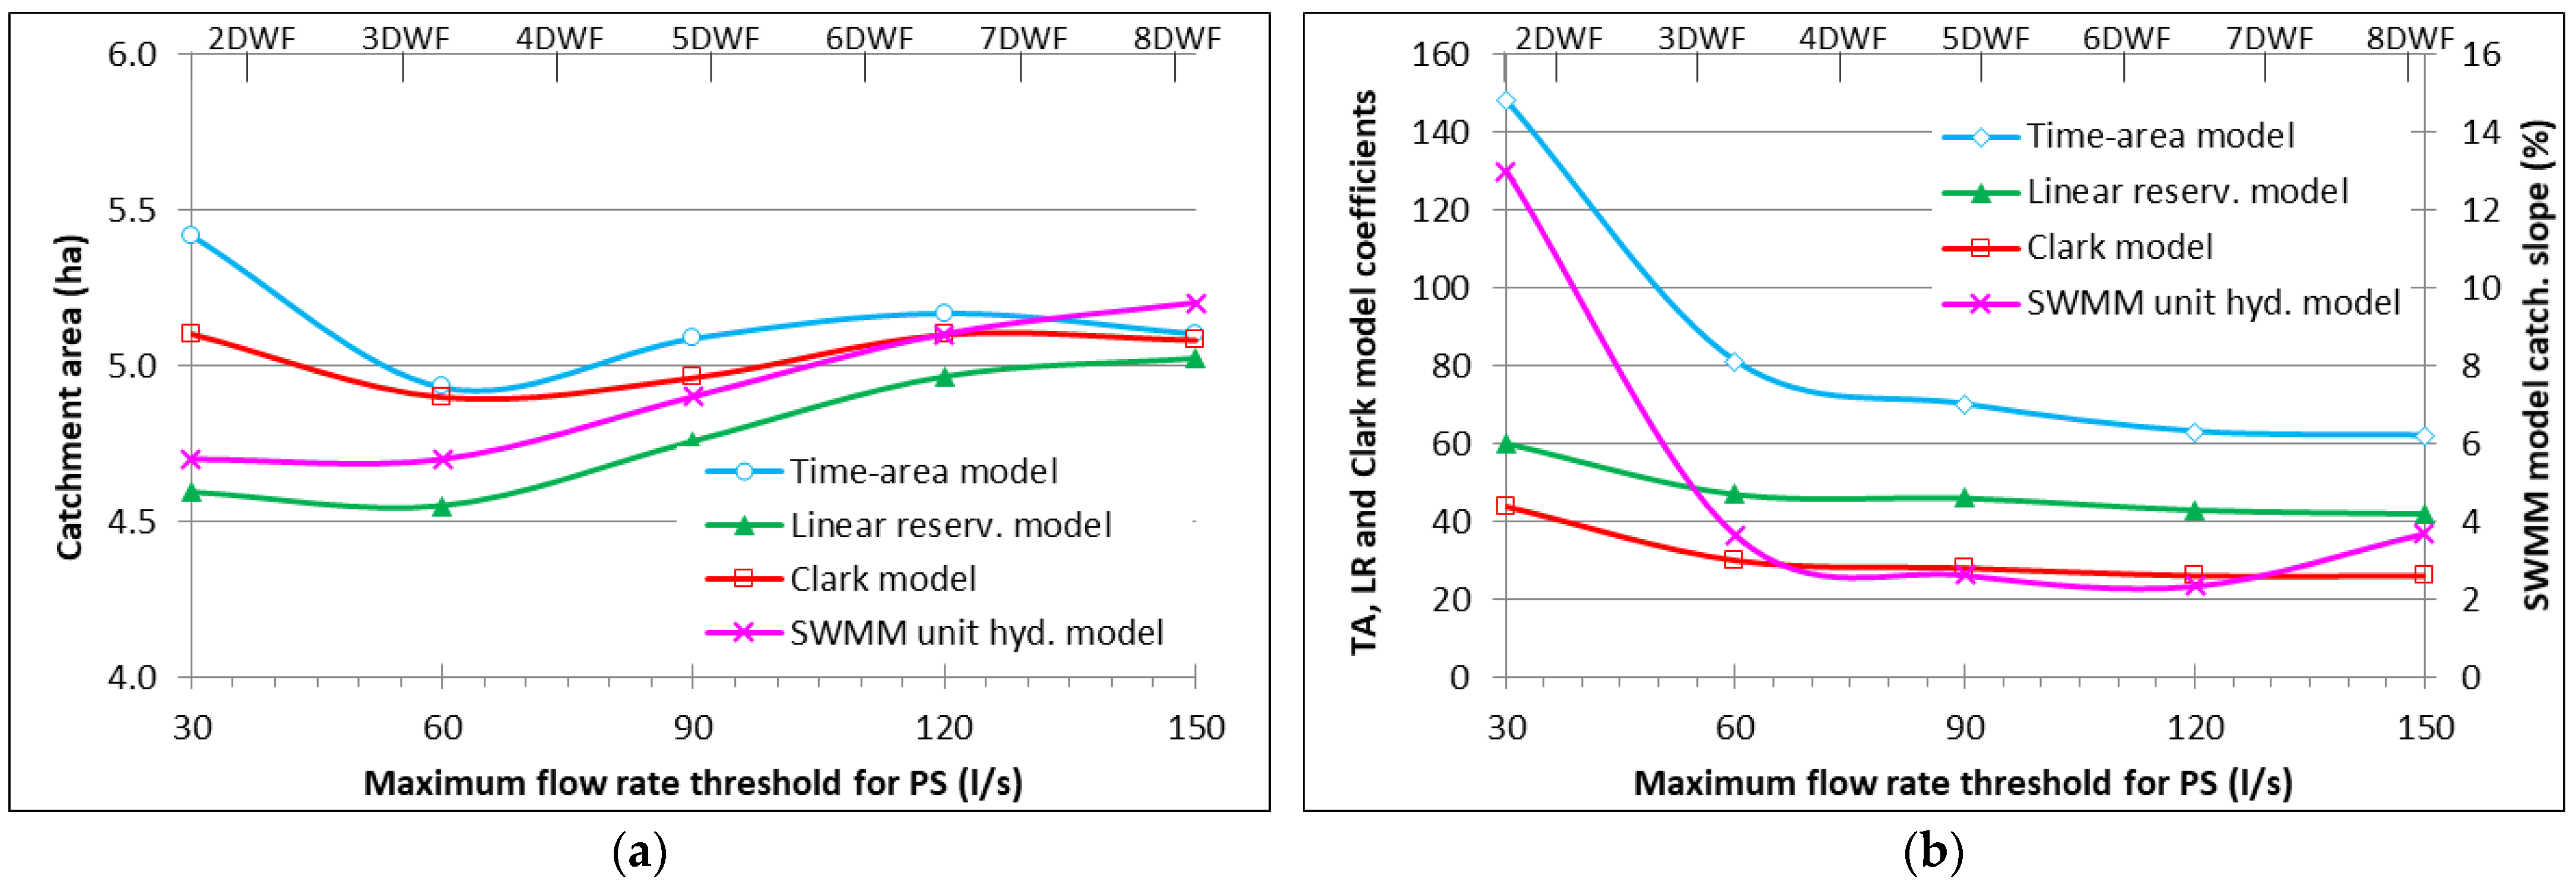
Clark’s model is the only one in which the catchment area remains very close to 5 ha for all MaxQPS thresholds, with a variation that does not exceed ±2%. For MaxQPS = 30 L/s, there is a substantial increase in the characteristic coefficient of some models, which is attributed to the effect of the significant increase in the surcharge conditions in the downstream sewers (Figure 7).
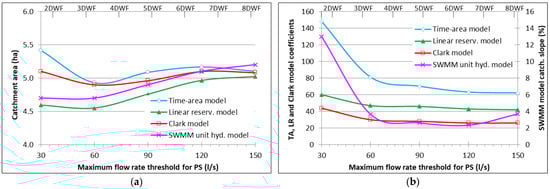
Figure 7.
Model parameters obtained with the different models when calibrated against flow rates measured at the PS inlet: (a) catchment area; (b) hydrological model coefficient.
3.1.2. Models Calibrated against the Flow Rates Measured at the Pumping Main
For the models calibrated against the flow rates measured at the pumping main (graphs on the right side of Figure 5 and Figure 6), the SSO discharges of all models decrease as a consequence of the attenuation of the measured flow hydrographs. The higher the MaxQPS value, the smaller the difference in SSO values.
Although a very significant attenuation in the pumping well has been modeled, the relative errors of the SSO discharges from the Clark model were below 42% for all MaxQPS cases. For MaxQPS values up to 120 L/s, the relative errors of the time–area curve model were between ±20%, and those of the linear reservoir model were between −30% and −67%.
3.1.3. Model Verification
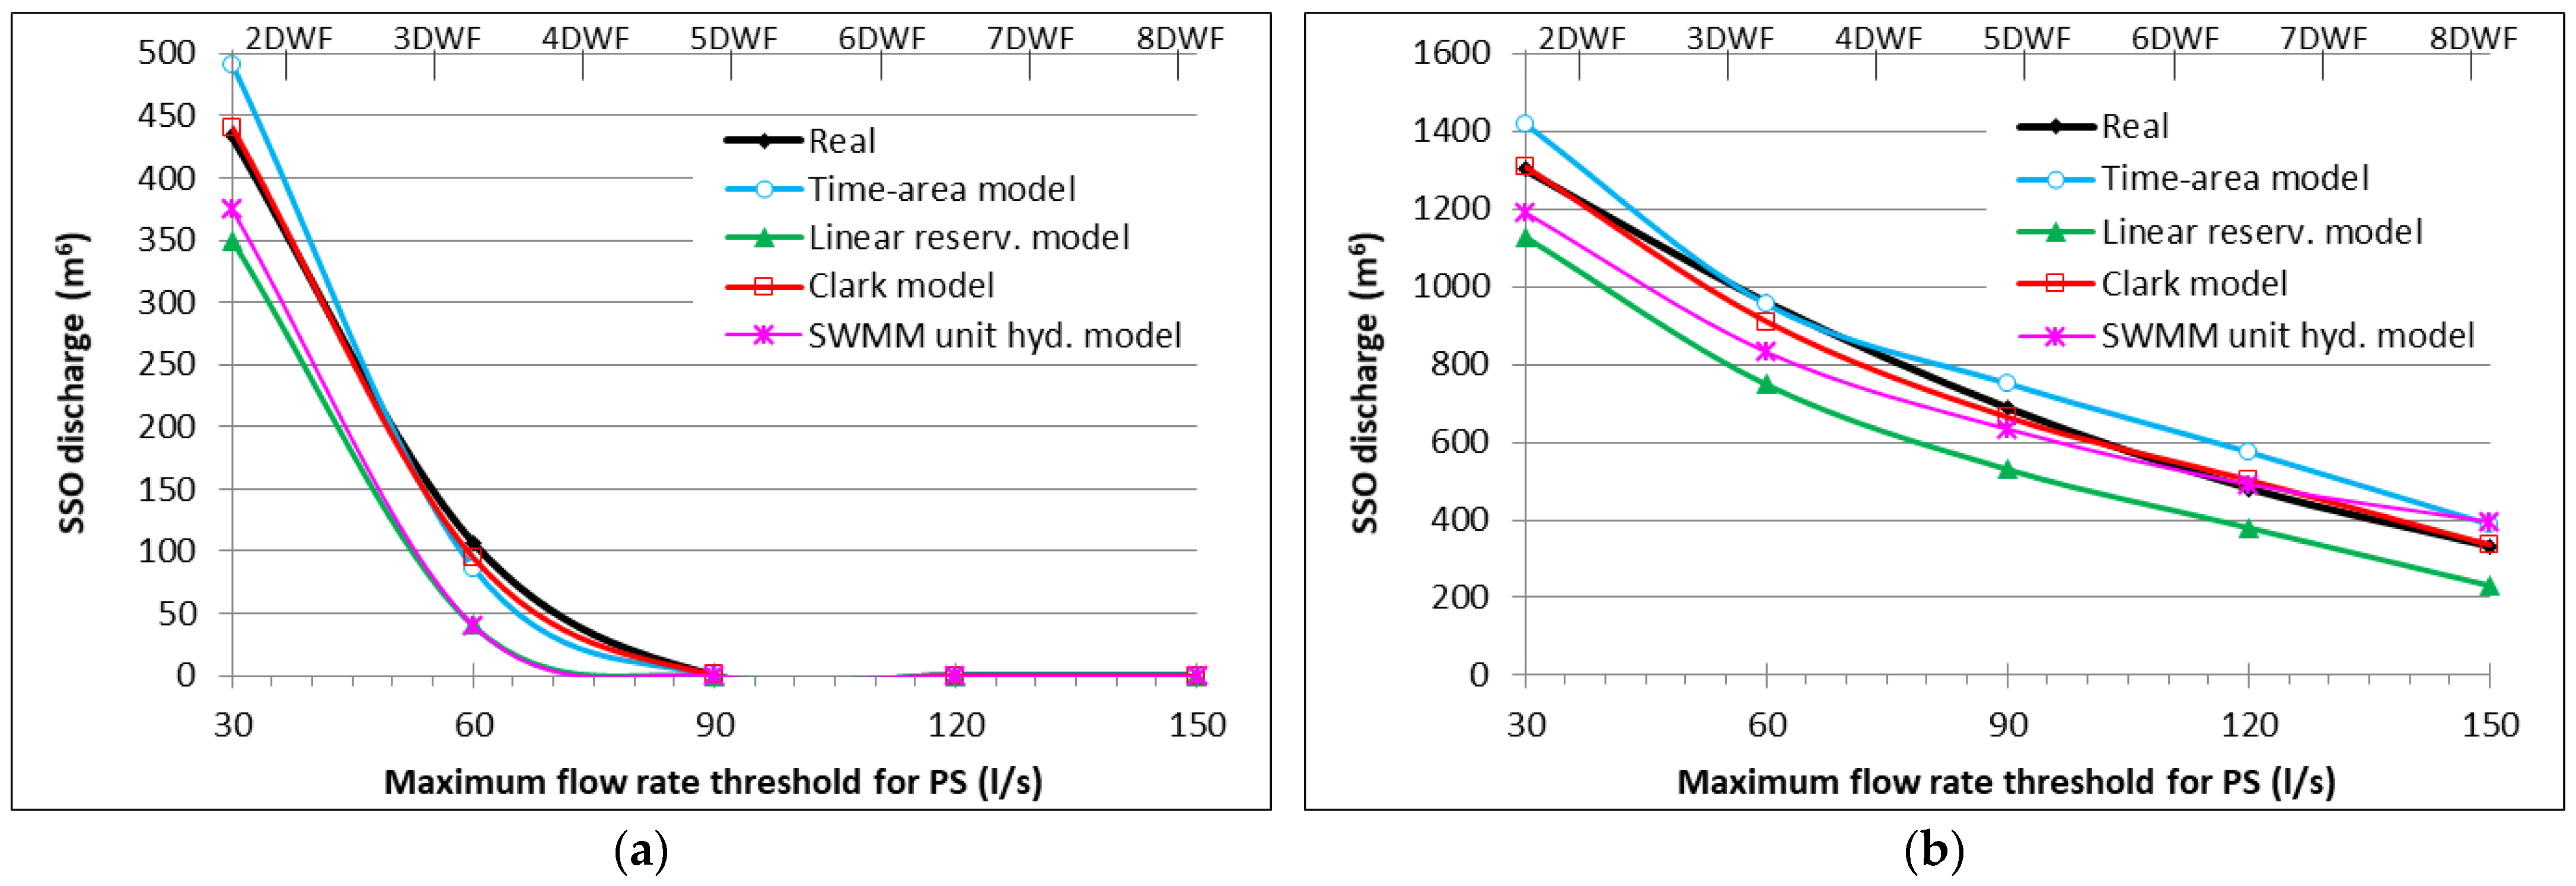
Models calibrated based on the flow rates measured upstream of the PS (at the L0 sewer) were verified for two cases: for the October 2022 events used to verify the Albufeira models and for a design hyetogram with a 2-year return period, a 4 h duration, and a 1 h centered tip. For both cases, excellent results were obtained in relation to the flow rates measured at L0 (the results are not shown to avoid overloading).
For the October 2002 events, the errors in estimating SSO discharges were less than ±20% for MaxQPS = 30 L/s and were less than 62% for MaxQPS = 60 L/s for all models. Clark’s model led to almost zero error for MaxQPS = 30 L/s and only −11% for MaxQPS = 60 L/s. For the design precipitation with a 2-year return period, relative errors were obtained for SSO discharges between −5% and +2% for the Clark model, between −13% and +19% for the simplified SWMM model, between −8% and −30% for the linear reservoir model, and between −1% and +19% for the time–area curve model (Figure 8).
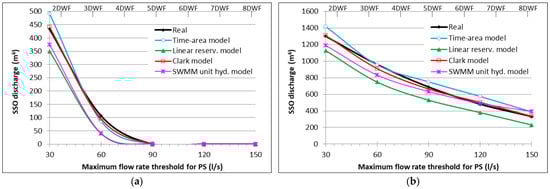
Figure 8.
SSO discharge results obtained with the different models for the two verification events: (a) October 2022 precipitation; (b) 2-year return period design precipitation.
We conclude that the Clark model maintained very good SSO discharge results for both small and large rainfall events in the verification and that the results of the other models are quite satisfactory.
For the calibration events, the SSO discharges through the SSO_5, SSO_13, SSO_20, and SSO_25 weirs were, in total, around 6 m3, and they were negligible compared to the volume discharged by the weir SSO_0 located next to the PS. However, for the verification event with a 2-year return period, the upstream SSO weirs became more important to avoid flooding; they corresponded to 19% of the total SSO discharges for MaxQPS = 30 L/s and reached 70% of the total SSO discharges for MaxQPS = 150 L/s.
The results described above highlight a very important issue: the SSO discharges estimated with the lumped models correspond to the totality of SSO discharges occurring throughout the catchment (in this example, they correspond to the sum of discharges SS_0, SSO_5, SSO_13, SSO_20, and SSO_25). In other words, they are not limited to discharges from the weir located close to the PS but to the discharges that occur in the entire upstream catchment.
We conclude that the proposed methodology can also be useful for estimating whether there are unknown SSO discharges upstream of PSs in which both the pumping main and the SSO weir are monitored.
3.2. Albufeira Case Study
3.2.1. Vale1 Pumping Station
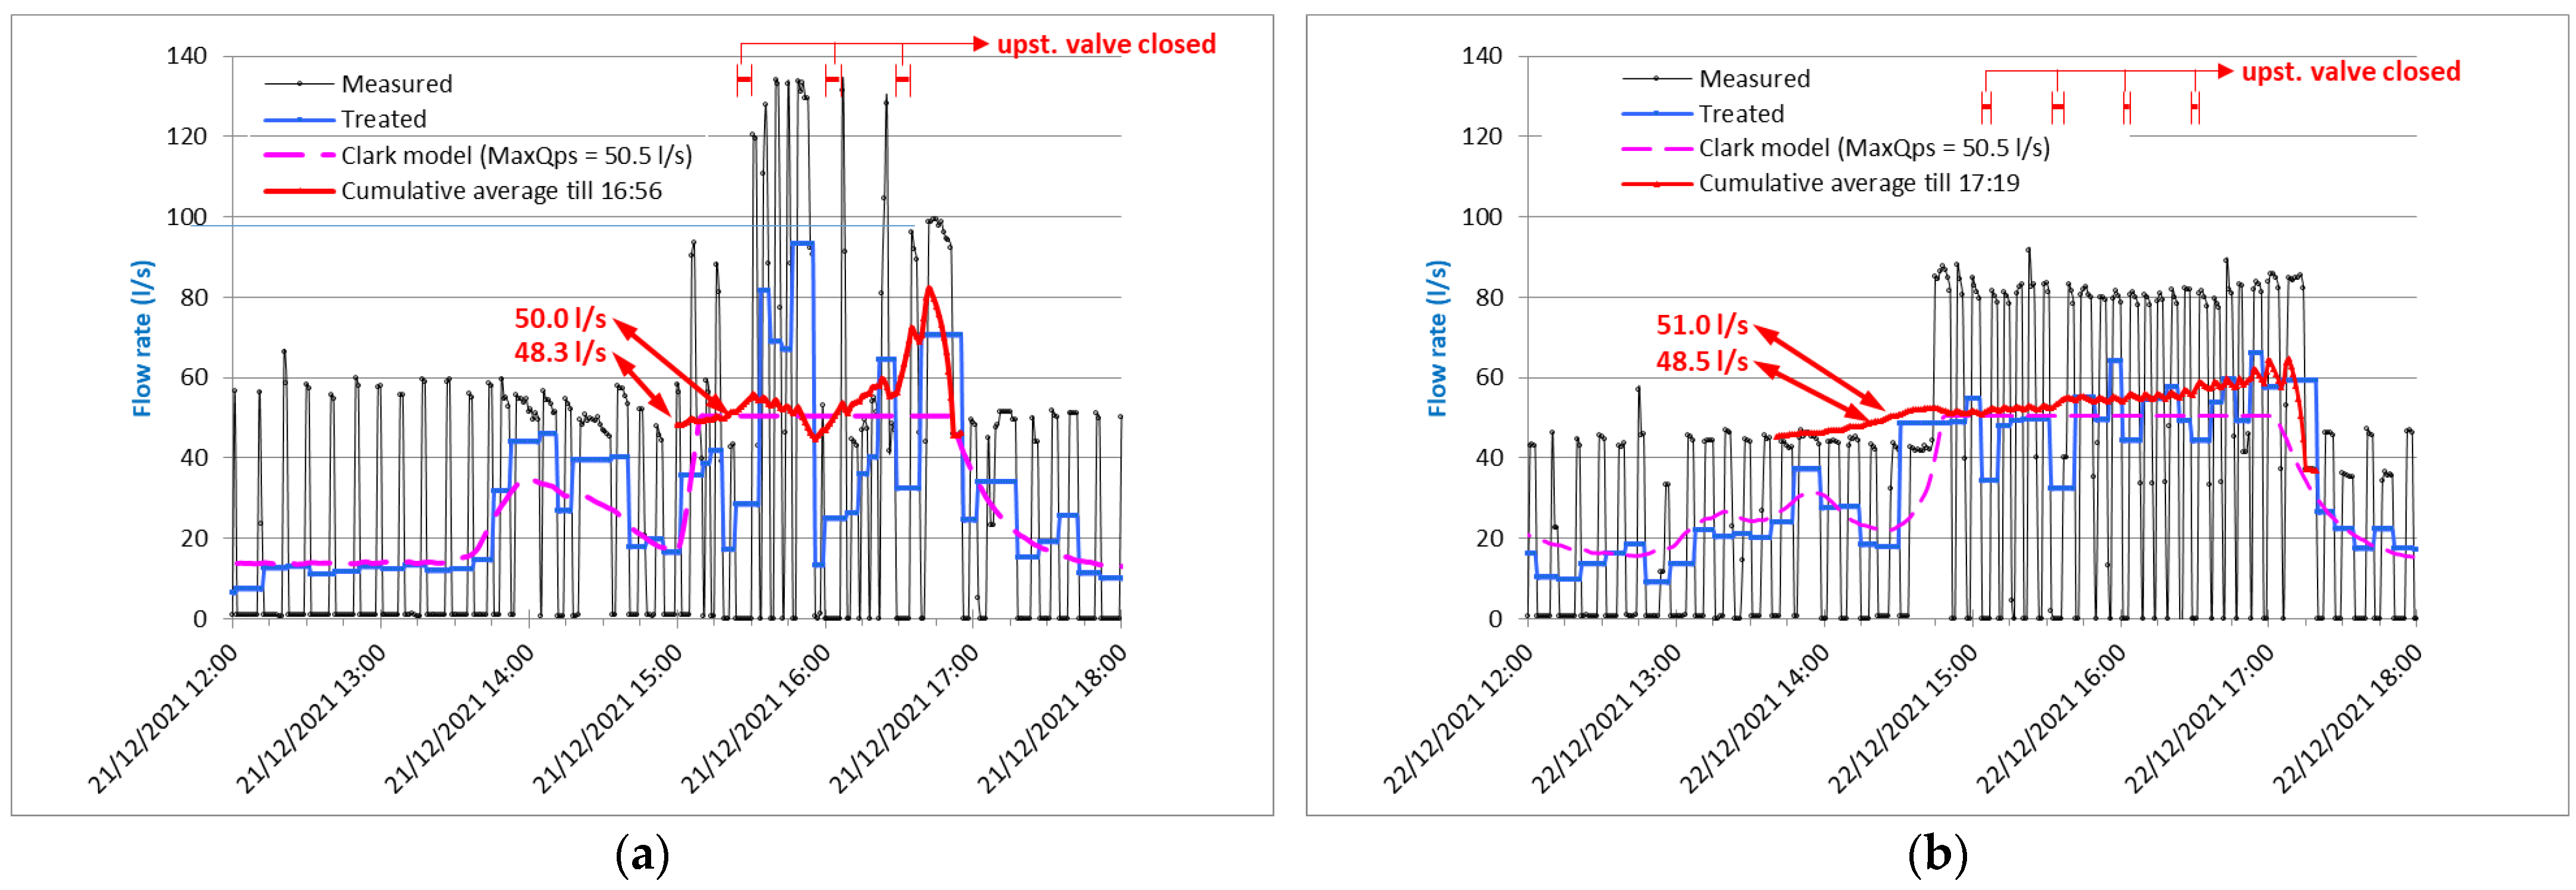
At both the Vale1 PS and Fer2 PS, the threshold for the maximum flow of wastewater into the PS (MaxQPS) is controlled by the closing and opening of a safety valve depending on the water height in the pumping well (Figure 9). Furthermore, although the operating rules of the pumps are theoretically known, it is not easy to relate their operation to the water height in the pumping well due to factors such as the progressive start-up of the pumps. Therefore, the MaxQPS values were determined based on the analysis of the hydrographs and included periods with the upstream valve closed. The red curve in Figure 9 corresponds to the cumulative average of pumped flow rates from each moment until the end of the period with very high pumping intensity.
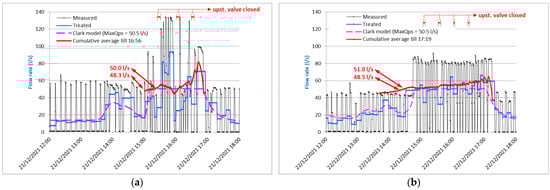
Figure 9.
Treatment of flow records measured at the Vale1 PS and quantification of the maximum inflow threshold for the PS (MaxQPS) for the two most intense rainy events: (a) 21 December; (b) 22 December.
At the Vale1 PS, pump stop and start cycles last less than 10 min, so the attenuation of hydrographs due to this factor is reduced. The MaxQPS threshold is relatively well defined for the 22 December 2021 event, on the order of 51 L/s, and appears not to exceed 50 L/s for the 21 December 2021 event. The average value of 50.5 L/s was adopted, and its maximum variation is certainly below ±5% (between 48 and 53 L/s). A similar value was identified during the model verification periods.
Some increase in the contribution of the RDII component was observed in the December 2021 events for all Alfufeira PSs. This increase did not occur in the March and October 2022 verification events. At the Vale1 PS, the wastewater volume pumped on the days before and after the set of precipitation events (20 and 26 December, respectively) increased by 60%, from 739 m3/day to 1187 m3/day (from 8.5 L/s to 13.7 L/s). Linear growth was assumed over these six days in all PSs to keep the model simple (without risk of data manipulation) and because it seemed appropriate given the dry periods on rainy days.
Due to a failure in the flow records between the 23 and 25 of December at the Vale1 PS, the models at this PS were calibrated only for precipitation events until 6:20 pm on the 23 December (Table 1 and the left-side graphs of Figure 10).

Table 1.
Calibration parameters and results of the different models for the Vale1 PS (from 21 December 2021 12:00 to 23 December 2021 18:20).
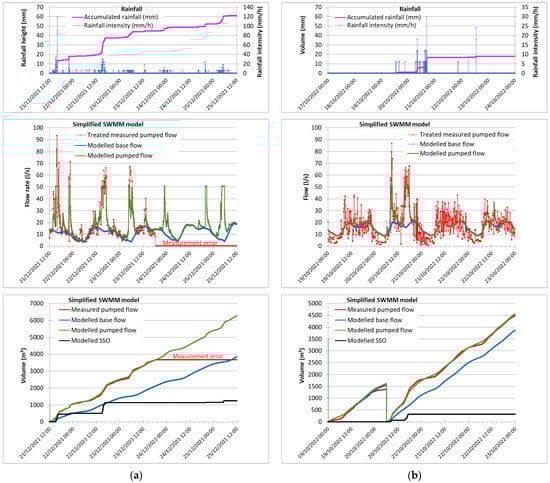
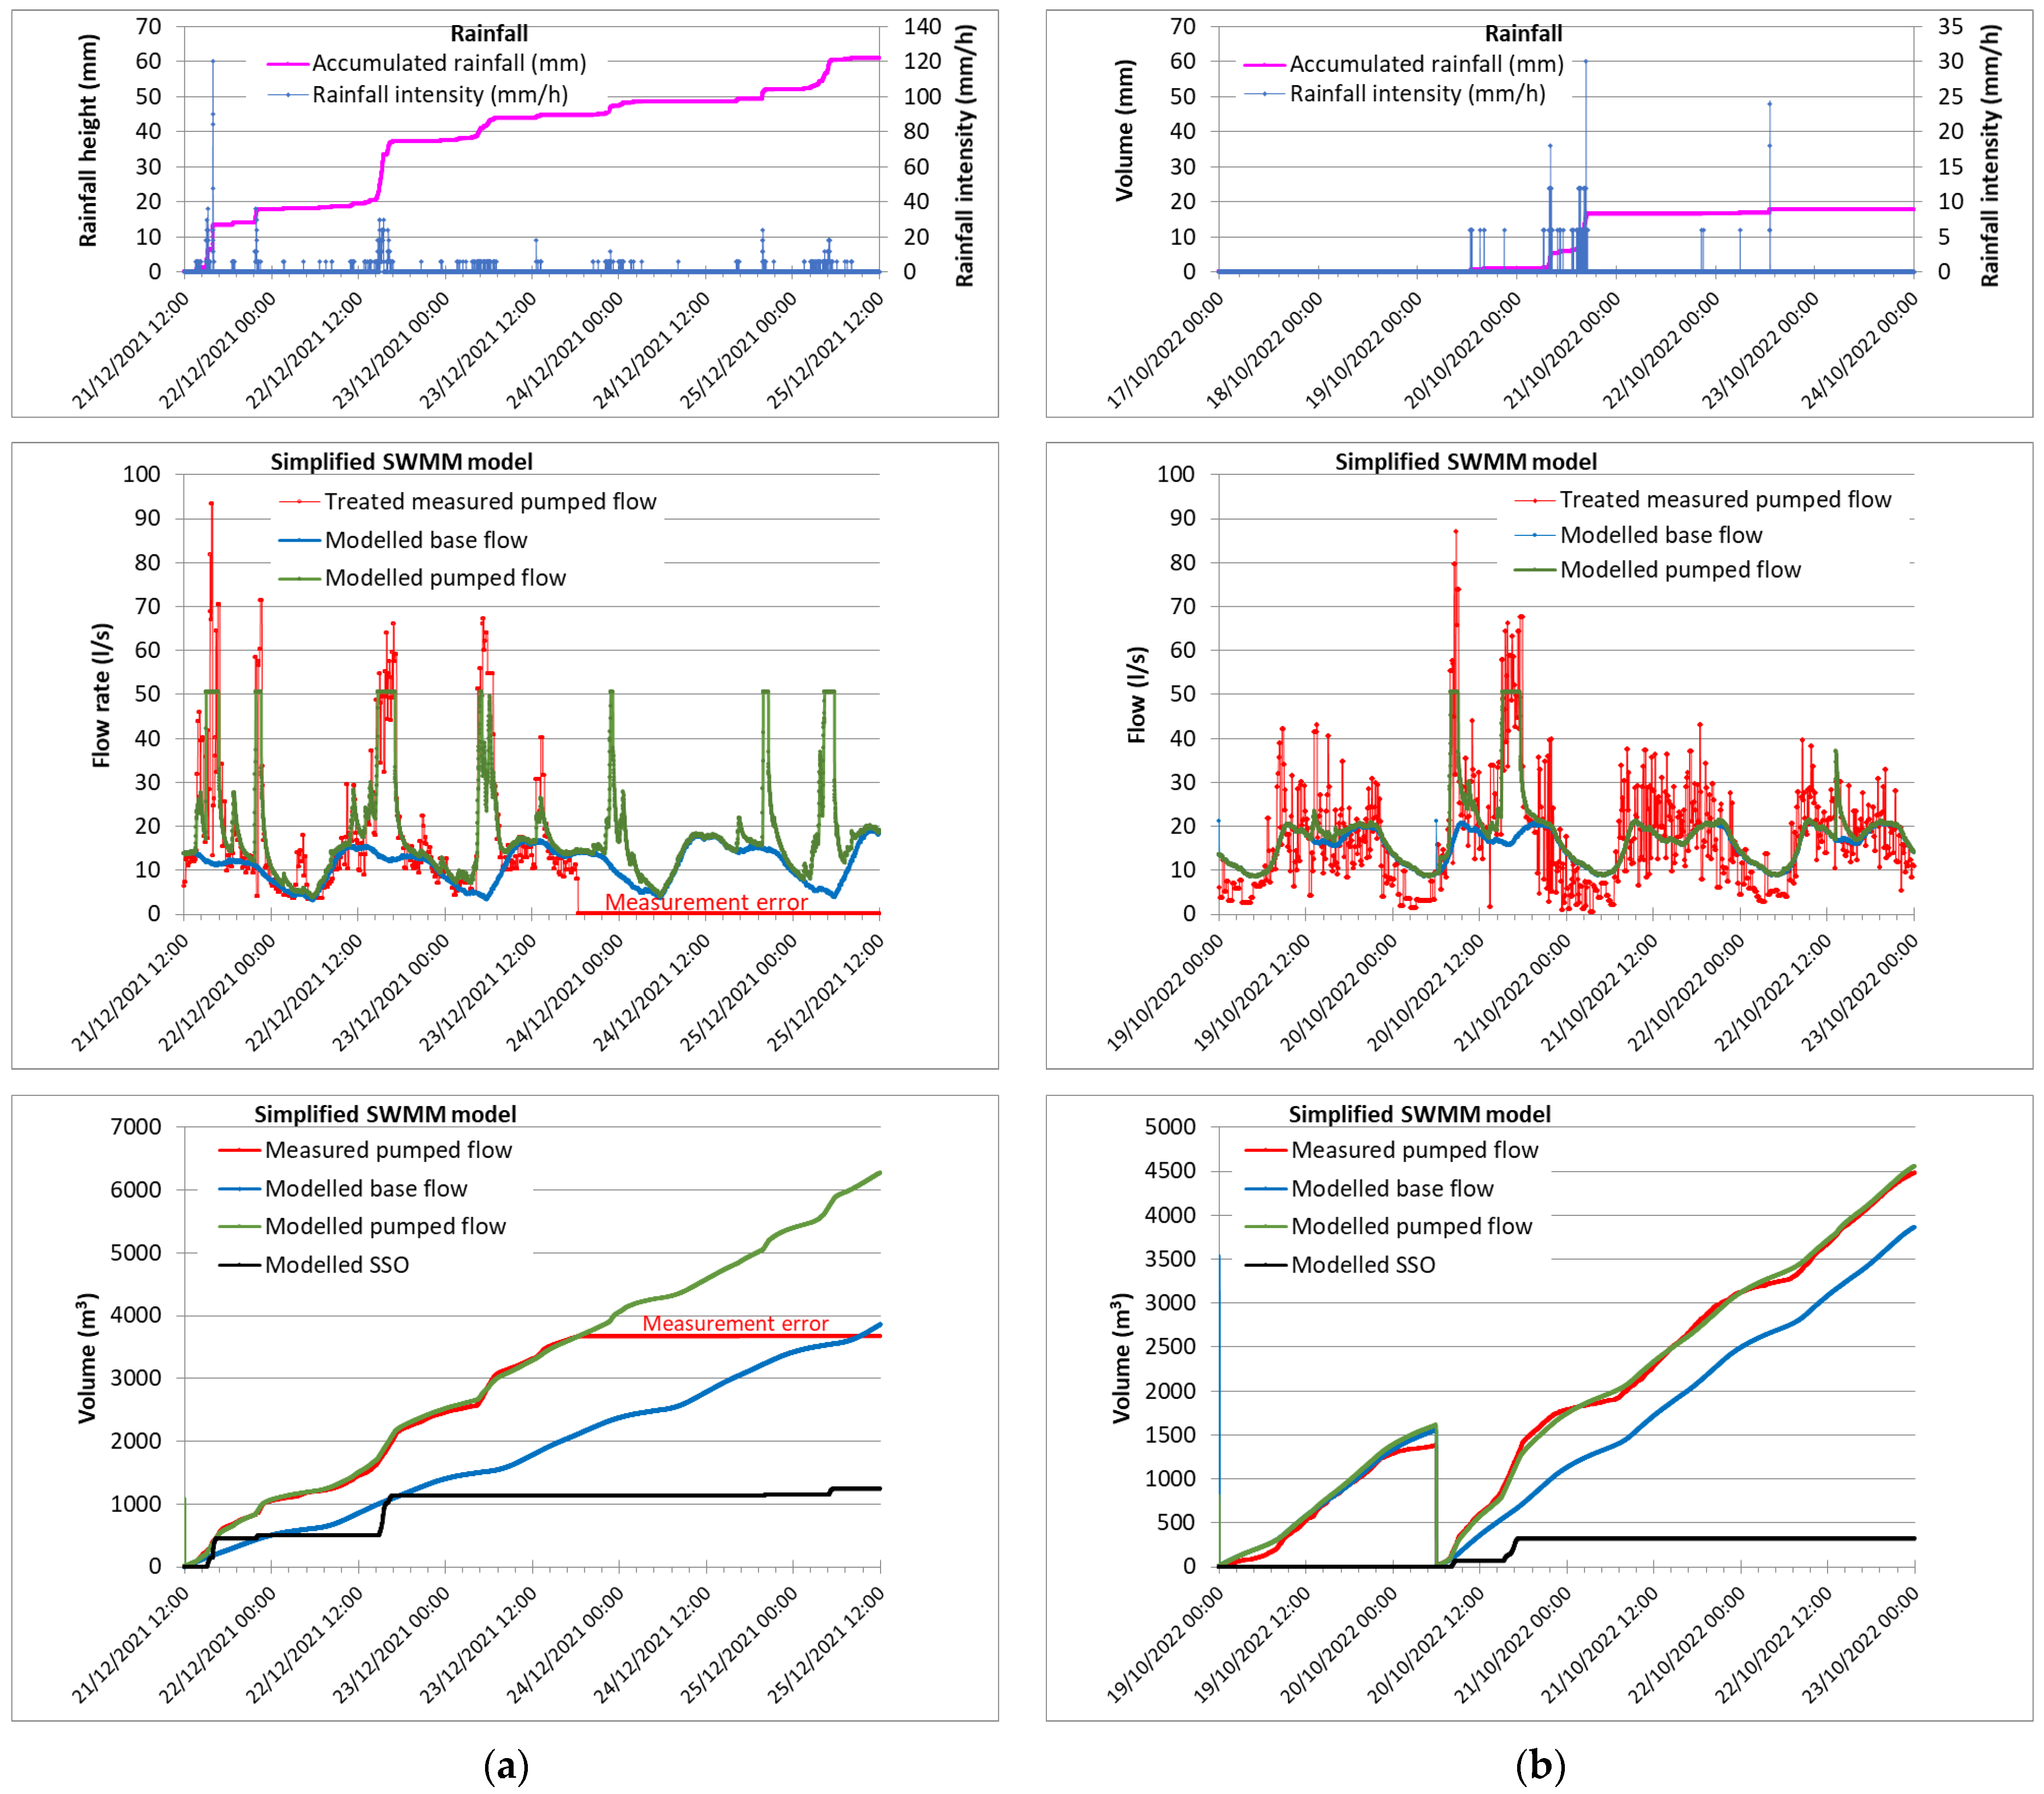
Figure 10.
Calibration and verification of the pumping flow rates at the Vale1 PS using the simplified SWMM model and estimation of the SSO discharges: (a) calibration; (b) verification.
As in the hypothetical case study presented in Section 3.1, the largest and smallest SSO volumes were provided, respectively, by the time–area curve model and the linear reservoir model (Table 1).
The Clark and simplified SWMM models gave very similar results. Based on the study findings in Section 3.1, it is believed that these will be the most reliable results. Considering that the MaxQPS threshold is on the order of 4 to 6 times the average dry weather flow, the findings in Section 3.1 also suggest that these results tend to be slightly under-estimated, with an error that should not exceed −30%, apart from errors resulting from flow measurement and the spatial variability of precipitation.
A very good agreement is observed between the modeled and measured variables for the calibration period (green and red curves in Figure 10, respectively), except for the early morning event of 23 December, in which the modeled flows are lower than the measured ones. This difference is attributed to the spatial variation of precipitation, an aspect that is not included in the analysis presented in Section 3.1. The black curve in the accumulated volume graphs (bottom graphs in Figure 10) concerns the SSO discharges.
Very satisfactory results were obtained for the October 2022 verification period. From 19 October 2022 00:00 to 23 October 2022 00:00, pumped flow differences of 307 m3 were obtained using the simplified SWMM model, and they were between 275 m3 and 287 m3 for the remaining models. Most of this error is concentrated in the small event that occurred on 19 October, as can be seen in the lower-right graph of Figure 9, which is attributed to the spatial variability of precipitation or the greater hydrological losses during the first storms of October. Some difference in the shape of the hydrographs is observed because an average daily pattern for this time of year was used instead of the pattern estimated based on pre- and post-storm records.
SSO discharges during the October events were 369 m3 for the Clark model and 315 m3 for the simplified SWMM model. Again, the time–area model provided a larger SSO discharge (390 m3), and the linear reservoir model provided a lower value (294 m3).
As concluded in Section 3.1.3, the estimates obtained refer to the overflow in all SSO structures throughout the catchment upstream of the monitoring section and not only in the PS safety weir.
3.2.2. Fer2 Pumping Station
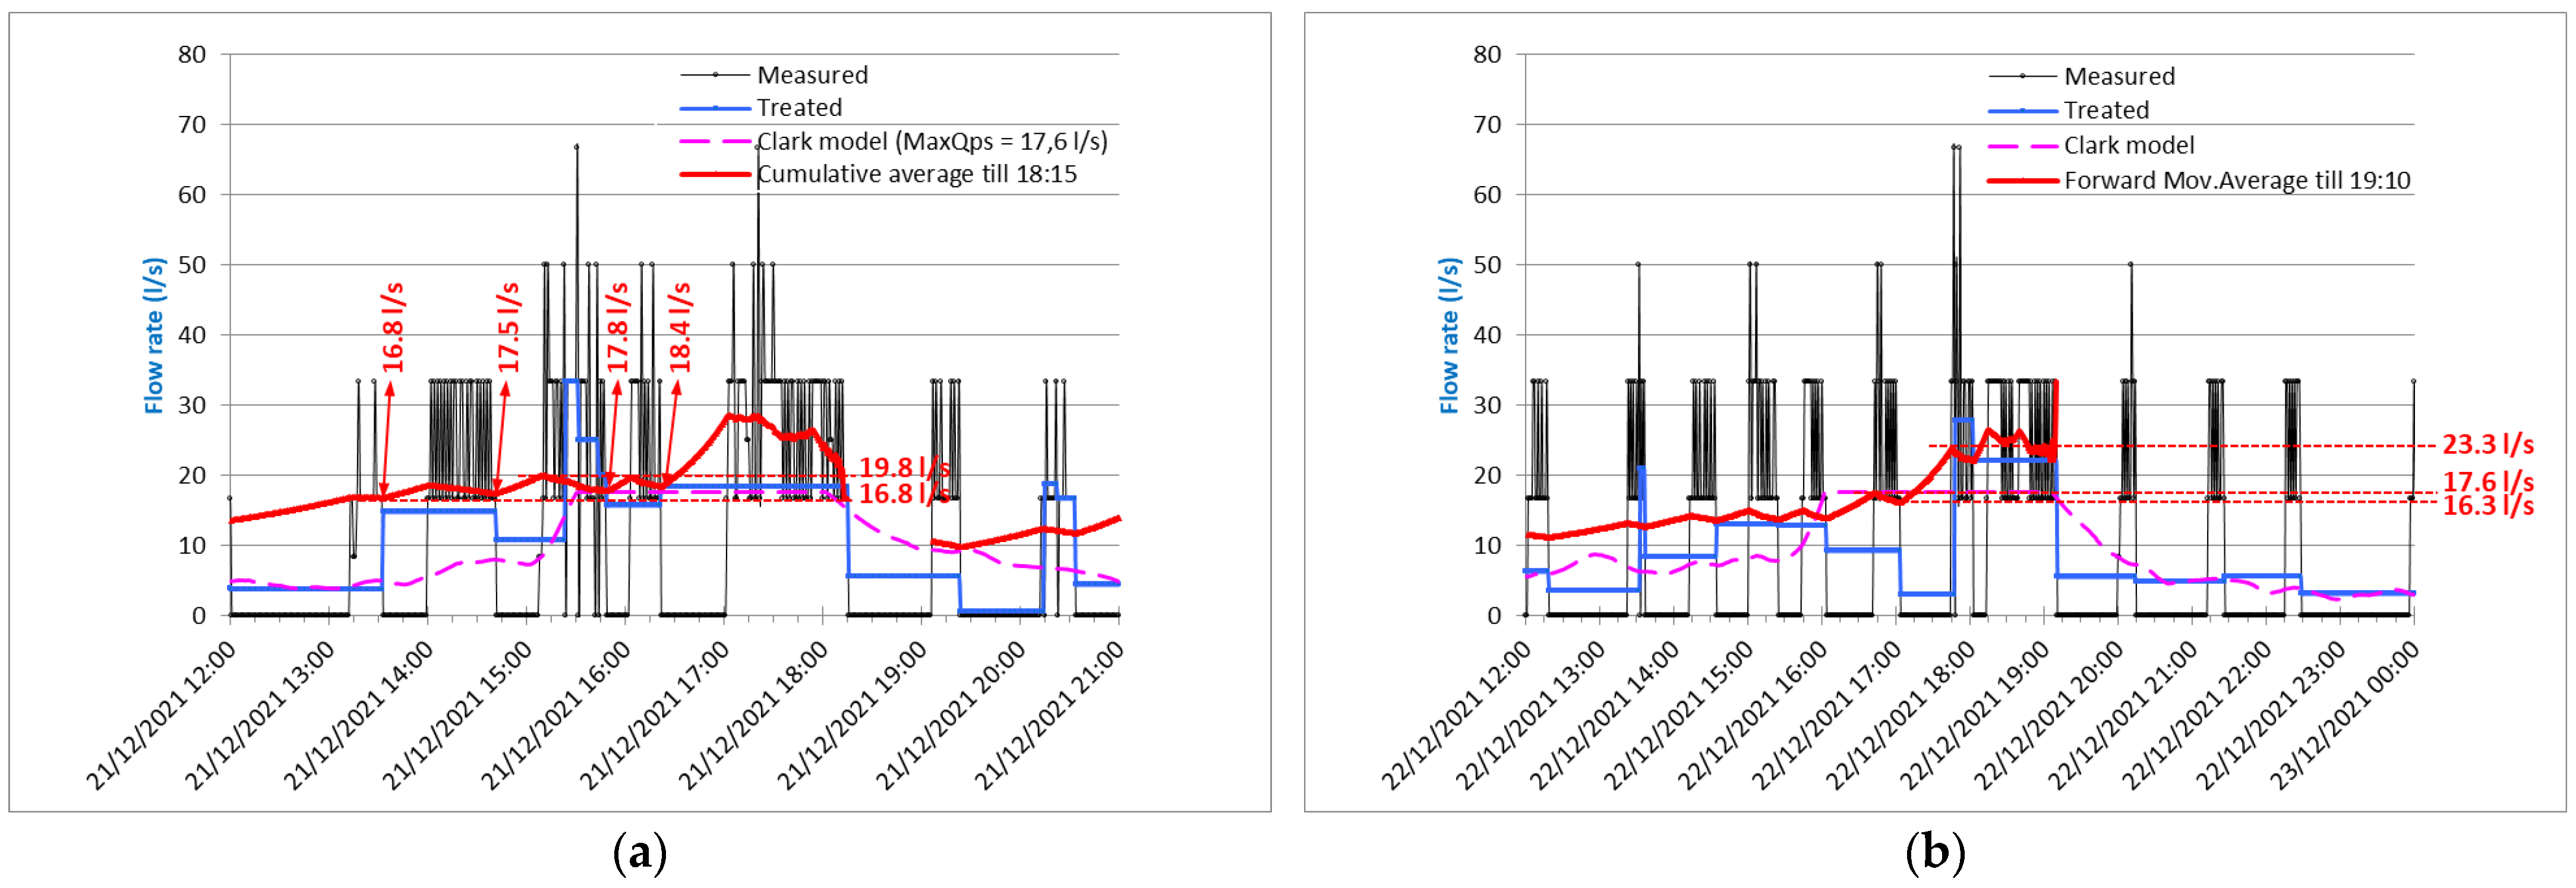
In the Fer2 PS, there are rainy periods in which the pumps operate for more than 1 h, with stops lasting several minutes due to the closure of the upstream safety valve (Figure 11). The attenuation of the hydrographs measured in the pumping main will, therefore, be more pronounced and will be closer to the second example of the hypothetical case study in Section 3.1, in which estimates of SSO discharges tend to be clearly underestimated.
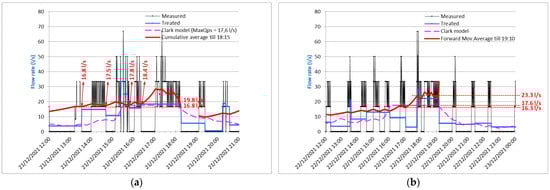
Figure 11.
Treatment of flow records measured at the Fer2 PS and quantification of the maximum inflow threshold for the PS for the most intense rainy events: (a) 21 December; (b) 22 December.
The high concentration time of the catchment and the effect of closing and opening the upstream valve make it difficult to determine the MaxQPS threshold. The response hydrograph from a lumped model provided important assistance in this determination (Figure 11). A careful analysis of the graphs presented in Figure 11 shows that the MaxQPS threshold is between 16.8 and 18.4 L/s, with an average value of 17.6 L/s being adopted (a variation of ±5% in relation to the average value).
The volume of wastewater pumped by the Fer2 PS in the days before and after the precipitation events increased from 218 m3 to 286 m3 (30% increase, from 2.5 L/s to 3.3 L/s). A linear growth of the RDII component was considered between 20 December 2022 and 26 December 2022.
For the calibration period, the MaxQPS threshold is 5 to 7 times the average dry weather flow. For this relationship, in the hypothetical case described in Section 3.1, the error of the SSO volume estimates for the model calibrated against flow measurements at the pumping main was between −25% and −40% for the Clark model.
The Clark and simplified SWMM models were those that led, respectively, to higher and lower volumes of SSO discharges for both calibration (Table 2) and verification.
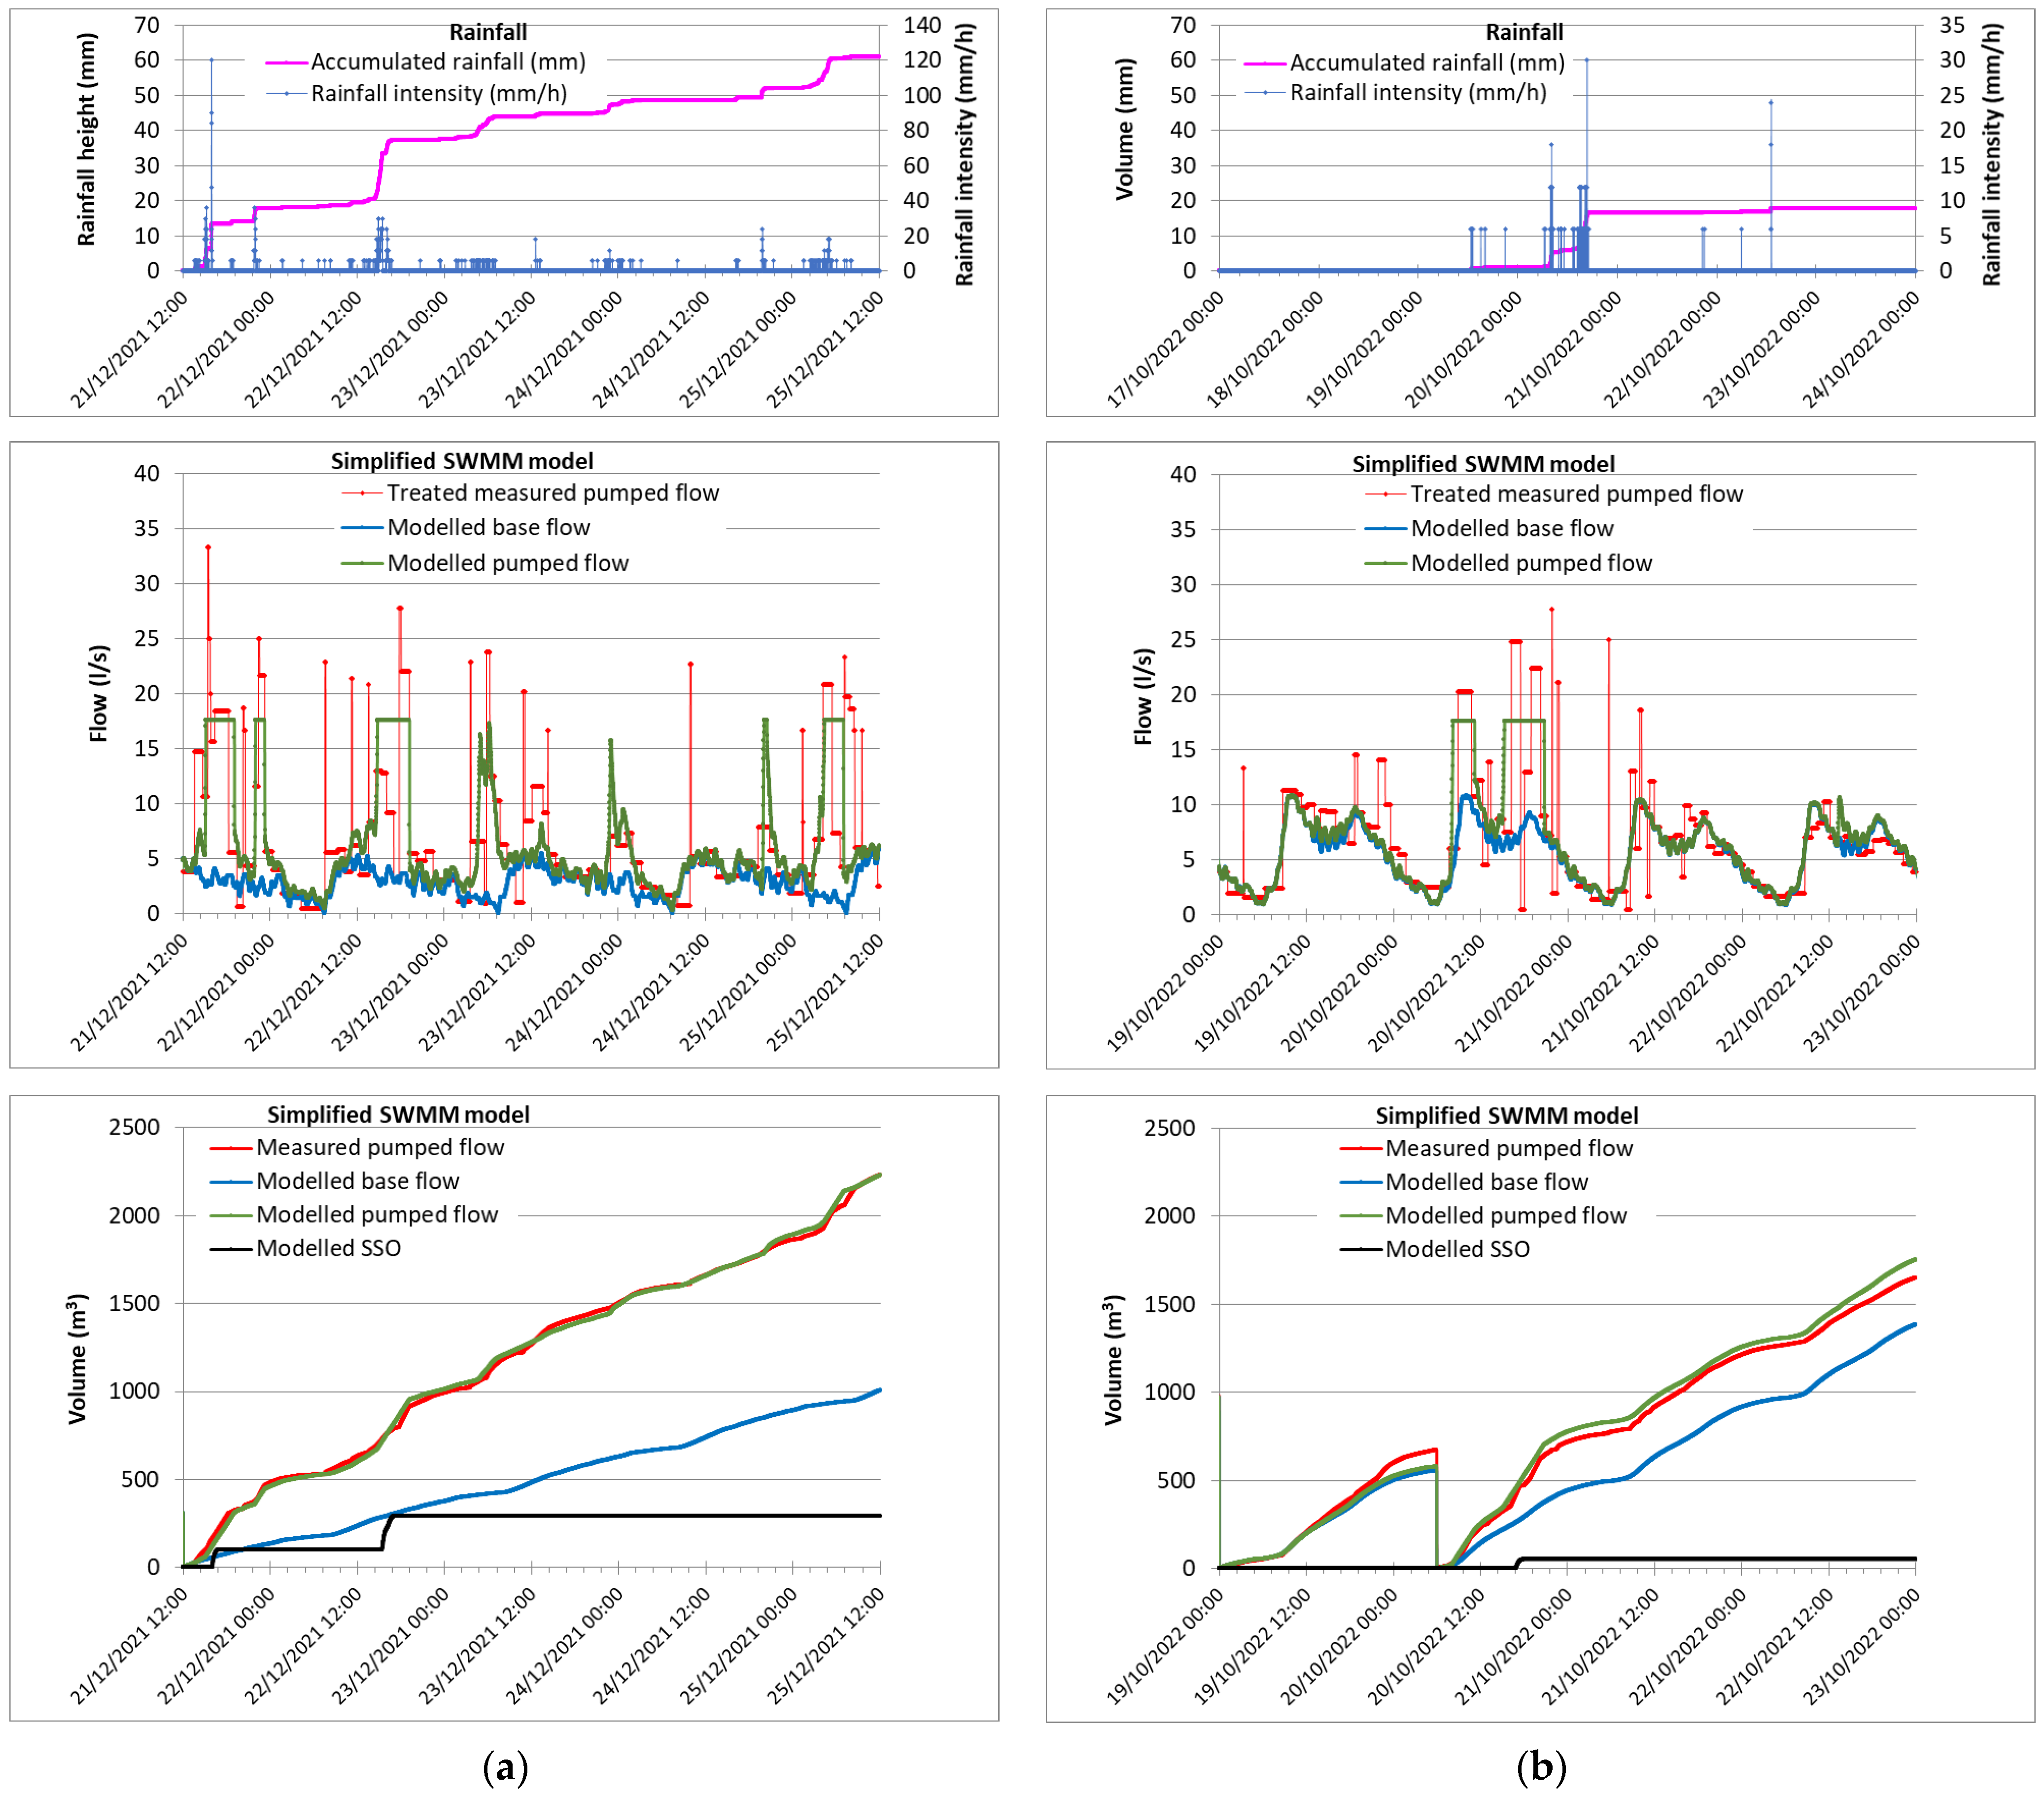
The simplified SWMM model was the only one whose verification results for the October 2022 events, although acceptable, cannot be considered good (lower-right-side graph of Figure 12 vs. Figure 13). The reduced SSO discharge led to the pumped flow rates exceeding the measured value with some significance. The worst results of the simplified SWMM model are attributed to the additional uncertainty introduced by the discharge height of the SSO weir and possible storage in the sewer network, as had already been identified in Section 3.1.1.

Figure 12.
Calibration and verification of the pumping flow rates at the Fer2 PS using the simplified SWMM model and estimation of the SSO discharges: (a) calibration; (b) verification.
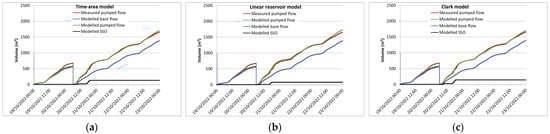
Figure 13.
Verification results at the Fer2 PS using (a) the time–area model, (b) the linear reservoir model, and (c) the Clark model.
The four hydrological models presented very good verification results for the March 2022 rain events. The simplified SWMM model was the one that provided the best results, with an error in the pumped stormwater volume of only 36 m3 in 435 m3, i.e., 8% [47].
Table 2.
Calibration parameters and results of the different models for the Fer2 PS (from 21 December 2021 12:00 to 25 December 2021 12:00).
Table 2.
Calibration parameters and results of the different models for the Fer2 PS (from 21 December 2021 12:00 to 25 December 2021 12:00).
| Model | MaxQPS (L/s) | Area (ha) | Model Coefficient | Σ(E2) 1 (m6) | Pumped Stormw. (m3) | SSO Vol. (m3) |
|---|---|---|---|---|---|---|
| Time–area curve | 17.6 | 2.642 | t = 187 min. | 118,450 | 1221 | 385 |
| Linear reservoir | 17.6 | 2.442 | K = 97 min. | 105,559 | 1221 | 261 |
| Clark | 17.6 | 2.687 | t = K = 60 min. | 112,744 | 1221 | 412 |
| Simplified SWMM | 17.6 | 2.500 | i = 2.010% | 119,826 | 1221 | 294 |
Note: 1 Sum of squared errors.
4. Conclusions
Hydrological models duly calibrated against flow rates measured at trunk sewers, including pumping ducts, can provide very reasonable estimates of sanitary sewer overflow (SSO) discharges.
The proposed methodology aims to reduce and evaluate the uncertainty in estimating SSO discharges. Four hydrological models were compared:
- Clark’s model provided the best results, which can be classified as good for most cases and quite satisfactory for others.
- For all cases studied, good results were obtained from the Clark model considering a routing coefficient equal to the storage coefficient.
- The time–area curve model tends to overestimate SSO discharges.
- The linear reservoir consistently underestimates SSO discharges.
- The simplified SWMM model generally provides acceptable estimates of SSO discharges, although the determinism in weir crest height and the potential storage in the sewer network are sources of uncertainty and error.
The threshold of the maximum flow rate allowed into the pumping station (MaxQPS) is a key parameter for SSO frequency and volume, the influence of which was evaluated in detail in a hypothetical case.
The attenuation of measured hydrographs at pumping mains leads to an underestimation of both the catchment area and the SSO discharges. The extent of this underestimation depends on the frequency and duration of pump on/off cycles, which can be further studied through hypothetical cases.
For instance, the comparison with the hypothetical case suggests that both the Clark and simplified SWMM models underestimate the SSO results for the Albufeira Vale1 pumping station by up to 30%, with little hydrograph attenuation (and a MaxQPS to average dry weather flow ratio of around 4 to 6). However, in the Fer2 pumping station, where significant attenuation occurs in the pumping well, SSO discharges should be quite underestimated, possibly with an error between around 25% and 40% for the Clark model. Although the Clark model leads to the lowest uncertainty, the time–area curve model may lead to a lower error, as this model tends to overestimate the SSO discharges.
These results highlight the need to consider corrections when analyzing SSO results from lumped hydrological models. To achieve a more robust assessment of uncertainty and confidence intervals, more sophisticated approaches can be employed, such as Monte Carlo simulations with hypothetical scenarios and the incorporation of additional uncertainty sources, such as measurement errors and spatial variability in precipitation [23,24,25,26].
The proposed methodology using lumped modeling provides estimates of total SSO discharges occurring in the whole catchment, allowing the assessment of unknown SSO discharges upstream of pumping stations where both the pumping main and SSO weir are monitored.
Purely conceptual models, particularly the Clark model, may provide more accurate estimates of SSO discharges than simplified deterministic models. Adapting the proposed methodology to combined sewer systems with gaps in knowledge about the sewer network and CSO structures could prove useful.
The proposed methodology offers a valuable tool for diagnosing and prioritizing actions to fulfill the obligations outlined in management plans to fight pollution from stormwater, as mandated by the recently revised EU Urban Wastewater Treatment Directive. Because monitoring most SSO discharge sites is too expensive or even technically unfeasible, this methodology can support wastewater utilities, water authorities, municipalities, and other entities responsible for urban, territorial, and environmental planning. Its implementation requires technical–scientific knowledge, which necessitates an increasing involvement of consultants and researchers both in diagnosing local conditions and in identifying, prioritizing, and widely sharing solutions.
Author Contributions
Conceptualization, L.M.D., A.M. (António Martins), A.O., M.R. and A.B.F.; methodology, L.M.D.; software, L.M.D.; validation, L.M.D., A.M. (António Martins), O.S., A.A., M.R., A.O. and A.B.F.; formal analysis, L.M.D.; investigation, L.M.D., A.M. (António Martins), M.R., A.O. and A.B.F.; resources—data curation, O.S., A.A. and A.M. (Ana Mendes); writing—original draft preparation, L.M.D.; writing—review and editing, L.M.D., M.R., A.M. (António Martins), A.O. and A.B.F.; visualization, L.M.D.; supervision—project administration, A.O., L.M.D. and M.R.; funding acquisition, A.O., L.M.D., M.R. and A.M. (António Martins). All authors have read and agreed to the published version of the manuscript.
Funding
This research was co-funded by the European Regional Development Fund (FEDER) under programs POR Lisboa2020 and CrescAlgarve2020 through the SINERGEA Project (ANI 33595).
Data Availability Statement
Data are contained within the article.
Conflicts of Interest
The authors declare no conflicts of interest.
References
- Johnson, C.F. Equipment, Methods, and Results from Washington, D.C., Combined Sewer Overflow Studies. J. Water Pollut. Control Fed. 1961, 33, 721–733. Available online: https://www.jstor.org/stable/25034443 (accessed on 10 May 2024).
- David, L.M.; Matos, R.S. Wet weather water quality modelling of a Portuguese urban catchment: Difficulties and benefits. Water Sci. Technol. 2002, 45, 131–140. [Google Scholar] [CrossRef] [PubMed]
- Quaranta, E.; Fuchs, S.; Liefting, H.J.; Schellart, A.; Pistocchi, A. A hydrological model to estimate pollution from combined sewer overflows at the regional scale: Application to Europe. J. Hydrol. Reg. Stud. 2022, 41, 101080. [Google Scholar] [CrossRef]
- Giakoumis, T.; Voulvoulis, N. Combined sewer overflows: Relating event duration monitoring data to wastewater systems’ capacity in England. Environ. Sci. Water Res. Technol. 2023, 9, 707–722. [Google Scholar] [CrossRef]
- Farina, A.; Gargano, R.; Greco, R. Effects of urban catchment characteristics on combined sewer overflows. Environ. Res. 2024, 244, 117945. [Google Scholar] [CrossRef] [PubMed]
- Montserrat, A.; Bosch, L.; Kiser, M.A.; Poch, M.; Corominas, L. Using data from monitoring combined sewer overflows to assess, improve, and maintain combined sewer systems. Sci. Total Environ. 2015, 505, 1053–1061. [Google Scholar] [CrossRef] [PubMed]
- Spill, C.; Ditzel, L.; Gassmann, M. Small villages and their sanitary infrastructure—An unnoticed influence on water quantity and a threat to water quality in headwater catchments. Environ. Monit. Assess. 2023, 195, 1482. [Google Scholar] [CrossRef] [PubMed]
- Nasrin, T.; Sharma, A.K.; Muttil, N. Impact of Short Duration Intense Rainfall Events on Sanitary Sewer Network Performance. Water 2017, 9, 225. [Google Scholar] [CrossRef]
- Chen, S.; Qin, H.; Zheng, Y.; Fu, G. Spatial variations of pollutants from sewer interception system overflow. J. Environ. Manag. 2019, 233, 748–756. [Google Scholar] [CrossRef]
- Muttil, N.; Nasrin, T.; Sharma, A.K. Impacts of extreme rainfalls on sewer overflows and WSUD–based mitigation strategies: A review. Water 2023, 15, 429. [Google Scholar] [CrossRef]
- Perez, G.; Gomez-Velez, J.D.; Grant, S.B. The sanitary sewer unit hydrograph model: A comprehensive tool for wastewater flow modeling and inflow-infiltration simulations. Water Res. 2024, 249, 120997. [Google Scholar] [CrossRef]
- Montoya-Coronado, V.A.; Tedoldi, D.; Castebrunet, H.; Molle, P.; Lipeme Kouyi, G. Data-driven methodological approach for modeling rainfall-induced infiltration effects on combined sewer overflow in urban catchments. J. Hydrol. 2024, 632, 130834. [Google Scholar] [CrossRef]
- European Commission. Proposal for a Directive of the European Parliament and of the Council Concerning Urban Wastewater Treatment (Recast). Available online: https://eur-lex.europa.eu/legal-content/EN/TXT/?uri=CELEX%3A52022PC0541&qid=1715593129776 (accessed on 10 May 2024).
- Council of the European Union. Proposal for a Directive of the European Parliament and of the Council Concerning Urban Wastewater Treatment (Recast). Final Compromise Text Endorsed at the Permanent Representatives Committee Meeting of 1 March 2024. Brussels, 1 March 2024. Available online: https://data.consilium.europa.eu/doc/document/ST-7108-2024-INIT/en/pdf (accessed on 10 May 2024).
- Sanitary Sewer Overflows (SSOs). Available online: https://www.epa.gov/npdes/sanitary-sewer-overflows-ssos (accessed on 10 May 2024).
- US EPA. Chapter 5—CSS Monitoring. In Guidance for Monitoring and Modeling, EPA 832-B-99-002; US EPA Office of Water: Washington, DC, USA, 1999; p. 37. Available online: https://www3.epa.gov/npdes/pubs/sewer.pdf (accessed on 10 May 2024).
- Jeanbourquin, D.; Sage, D.; Nguyen, L.; Schaeli, B.; Kayal, S.; Barry, D.A.; Rossi, L. Flow measurements in sewers based on image analysis: Automatic flow velocity algorithm. Water Sci. Technol. 2011, 64, 1108–1114. [Google Scholar] [CrossRef]
- Ahm, M.; Thorndahl, S.; Nielsen, J.E.; Rasmussen, M.R. Estimation of Combined Sewer Overflow Discharge: A Software Sensor Approach Based on Local Water Level Measurements. Water Sci. Technol. 2016, 74, 2683–2696. [Google Scholar] [CrossRef] [PubMed]
- Ji, H.W.; Yoo, S.S.; Lee, B.-J.; Koo, D.D.; Kang, J.-H. Measurement of Wastewater Discharge in Sewer Pipes Using Image Analysis. Water 2020, 12, 1771. [Google Scholar] [CrossRef]
- Bertrand-Krajewski, J.-L.; Clemens-Meyer, F.; Lepot, M. (Eds.) Metrology in Urban Drainage and Stormwater Management: Plug and Pray; IWA Publishing: London, UK, 2021; ISBN 978-1-78906-011-9. [Google Scholar]
- Fencl, M.; Grum, M.; Borup, M.; Mikkelsen, P.S. Robust model for estimating pumping station characteristics and sewer flows from standard pumping station data. Water Sci. Technol. 2019, 79, 1739–1745. [Google Scholar] [CrossRef]
- Van Assel, J.; Kroll, S.; Delgado, R. Calculation of Dry Weather Flows in Pumping Stations to Identify Inflow and Infiltration in Urban Drainage Systems. Water 2023, 15, 864. [Google Scholar] [CrossRef]
- Deletic, A.; Dotto, C.B.S.; McCarthy, D.T.; Kleidorfer, M.; Freni, G.; Mannina, G.; Uhl, M.; Henrichs, M.; Fletcher, T.D.; Rauch, W.; et al. Assessing Uncertainties in Urban Drainage Models. Phys. Chem. Earth Parts A/B/C 2012, 42–44, 3–10. [Google Scholar] [CrossRef]
- Moges, E.; Demissie, Y.; Larsen, L.; Yassin, F. Review: Sources of Hydrological Model Uncertainties and Advances in Their Analysis. Water 2021, 13, 28. [Google Scholar] [CrossRef]
- Sriwastava, A.K.; Tait, S.; Schellart, A.; Kroll, S.; Dorpe, M.V.; Assel, J.V.; Shucksmith, J. Quantifying Uncertainty in Simulation of Sewer Overflow Volume. J. Environ. Eng. 2018, 144, 04018050. [Google Scholar] [CrossRef]
- Van Der Werf, J.A.; Kapelan, Z.; Langeveld, J. Real-time control of combined sewer systems: Risks associated with uncertainties. J. Hydrol. 2023, 617, 128900. [Google Scholar] [CrossRef]
- Vallabhaneni, S.; Burgess, E.H.; Burgess, E.H. Computer Tools for Sanitary Sewer System Capacity Analysis and Planning; EPA/600/R-07/111; U.S. Environmental Protection Agency: Washington, DC, USA, 2007. [Google Scholar]
- Rossman, L.A. Storm Water Management Model User’s Manual Version 5.1; U.S. Environmental Protection Agency: Washington, DC, USA, 2015. [Google Scholar]
- Karpf, C.; Krebs, P. Quantification of groundwater infiltration and surface water inflows in urban sewer networks based on a multiple model approach. Water Res. 2011, 45, 3129–3136. [Google Scholar] [CrossRef] [PubMed]
- Bonneau, J.; Fletcher, T.D.; Costelloe, J.F.; Burns, M.J. Stormwater infiltration and the ‘urban karst’—A review. J. Hydrol. 2017, 552, 141–150. [Google Scholar] [CrossRef]
- Choat, B.E.; Bhaskar, A.S. Spatial Arrangement of Stormwater Infiltration Affects Subsurface Storage and Baseflow. J. Hydrol. Eng. 2020, 25, 04020048. [Google Scholar] [CrossRef]
- Bell, C.D.; Wolfand, J.M.; Panos, C.L.; Bhaskar, A.S.; Gilliom, R.L.; Hogue, T.S.; Hopkins, K.G.; Jefferson, A.J. Stormwater control impacts on runoff volume and peak flow: A meta-analysis of watershed modelling studies. Hydrol. Process. 2020, 34, 3134–3152. [Google Scholar] [CrossRef]
- Zhang, K.; Parolari, A.J. Impact of stormwater infiltration on rainfall-derived inflow and infiltration: A physically based surface–subsurface urban hydrologic model. J. Hydrol. 2022, 610, 127938. [Google Scholar] [CrossRef]
- Sebo, S.; McDonald, W. Influence of sewershed characteristics on rainfall-derived inflow and infiltration. J. Am. Water Resour. Assoc. 2022, 58, 1483–1496. [Google Scholar] [CrossRef]
- Nash, J.E.; Sutcliffe, J.V. River flow forecasting through conceptual models: Part 1. A discussion of principles. J. Hydrol. 1970, 10, 282–290. [Google Scholar] [CrossRef]
- Gupta, H.V.; Kling, H.; Yilmaz, K.K.; Martinez, G.F. Decomposition of the mean squared error and NSE performance criteria: Implications for improving hydrological modelling. J. Hydrol. 2009, 377, 80–91. [Google Scholar] [CrossRef]
- Moriasi, D.N.; Gitau, M.W.; Pai, N.; Daggupati, P. Hydrologic and Water Quality Models: Performance Measures and Evaluation Criteria. Trans. ASABE 2015, 58, 1763–1785. [Google Scholar]
- David, L.M.; Mota, T.M. Quality Assessment of Small Urban Catchments Stormwater Models: A New Approach Using Old Metrics. Hydrology 2022, 9, 87. [Google Scholar] [CrossRef]
- An, W.W.; Gianvito, J.M. Kiski Valley WPCA Combined Sewer System Long Term Model Study. J. Water Manag. Model. 2011, 19, R241-17. [Google Scholar] [CrossRef]
- Peche, A.; Graf, T.; Fuchs, L.; Neuweiler, I. Physically based modeling of stormwater pipe leakage in an urban catchment. J. Hydrol. 2019, 573, 778–793. [Google Scholar] [CrossRef]
- Choi, N.; Schmidt, A.R. Rainfall-Derived Infiltration and Inflow Estimate in a Sanitary Sewer System Using Three Impulse Response Functions Derived from Physics-Based Models. Water Resour. Manag. 2023, 37, 305–319. [Google Scholar] [CrossRef]
- David, L.M.; Matos, J.S. Wet-weather urban discharges: Implications from adopting the revised European Directive concerning the quality of bathing water. Water Sci. Technol. 2005, 52, 9–17. [Google Scholar] [CrossRef] [PubMed]
- David, L.M.; Matos, J.S. Combined sewer overflow emissions to bathing waters in Portugal. How to reduce in densely urbanized areas? Water Sci. Technol. 2005, 52, 183–190. [Google Scholar] [CrossRef] [PubMed]
- Borah, D.K. Hydrologic procedures of storm event watershed models: A comprehensive review and comparison. Hydrol. Process. 2011, 25, 3472–3489. [Google Scholar] [CrossRef]
- Beven, K.J. A history of the concept of time of concentration. Hydrol. Earth Syst. Sci. 2020, 24, 2655–2670. [Google Scholar] [CrossRef]
- Jun, C.H.; Yoo, C.L. Relative roles of time-area curve and storage coefficient on the shape of Clark’s instantaneous unit hydrograph: Analytical approach. J. Hydrol. Eng. 2021, 26, 06021001. [Google Scholar] [CrossRef]
- Siemens; LNEC; IST; UAlg; AdA. SINERGEA—Intelligent System to Support the Efficient Use of Resources and the Inundation and Coastal Contamination Emergency Management in Coastal Cities; Final Technical-Scientific Report; Confidential Funding Compliance Evaluation Report; Siemens, S.A.: Amadora, Portugal, 2023; p. 88. (In Portuguese) [Google Scholar]
Disclaimer/Publisher’s Note: The statements, opinions and data contained in all publications are solely those of the individual author(s) and contributor(s) and not of MDPI and/or the editor(s). MDPI and/or the editor(s) disclaim responsibility for any injury to people or property resulting from any ideas, methods, instructions or products referred to in the content. |
© 2024 by the authors. Licensee MDPI, Basel, Switzerland. This article is an open access article distributed under the terms and conditions of the Creative Commons Attribution (CC BY) license (https://creativecommons.org/licenses/by/4.0/).