Article

Subsurface Hydrodynamics of the Southeastern Taoudéni Basin (West Africa) through Hydrogeochemistry and Isotopy

by
Succès Malundama Kutangila
1,*,
Moussa Bruno Kafando
2,
Amadou Keita
1,
Lawani Adjadi Mounirou
1,
Roland Yonaba
1,
Mahamadi Ouedraogo
3 and
Mahamadou Koita
1
1
Laboratoire Eaux, Hydro-Systèmes et Agriculture (LEHSA), Institut International d’Ingénierie de l’Eau et de l’Environnement (2iE), Ouagadougou 01 BP 594, Burkina Faso
2
Ministère de l’Environnement, de l’Eau et de l’Assainissement (MEEA-BF), Avenue Pr. Joseph Ki-Zerbo, Koulouba, Ouagadougou 03 BP 7044, Burkina Faso
3
Direction Générale des Ressources en Eau (DGRE), Ouagadougou, Avenue Pascal Zagré-Secteur 15, Ouagadougou 03 BP 7025, Burkina Faso
*
Author to whom correspondence should be addressed.
Water 2024, 16(13), 1922; https://doi.org/10.3390/w16131922
Submission received: 14 May 2024 / Revised: 14 June 2024 / Accepted: 24 June 2024 / Published: 5 July 2024
(This article belongs to the Section Hydrogeology)

Highlights

  • The Taoudéni Basin aquifers are crucial for Sahel's water security and sustainable development.
  • Hydrogeochemical and isotopic analyses validate the groundwater flow and reveal multiple eventual aquifer systems.
  • Mineralization is primarily driven by silicate hydrolysis and carbonate dissolution.
  • Isotopes (δ¹⁸O, δ²H, and ³H) indicate a minimal recent recharge and the presence of ancient, mixed waters.
  • The findings highlight the need for sustainable groundwater management due to slow renewal and anthropogenic impacts.

Abstract

:
The Taoudéni Basin, spanning 20% of Burkina Faso, holds vital aquifers for the Sahel’s water security and development. However, limited understanding of these aquifers’ hydrodynamics, including the flow patterns, mineralization processes, and renewal rates, hinders sustainable management practices in this arid region. Therefore, this study aims to investigate the aquifer hydrodynamics, mineralization processes and groundwater renewal in the transboundary Taoudéni Basin. Through a combination of hydrogeochemical and isotopic analyses, alongside existing data, this study examines 347 physicochemical samples, 149 stable isotope samples, and 71 tritium samples collected from 2013 to 2022. The findings reveal mineralization and stable isotopes (δ18O, δ2H) spatially aligned with the groundwater flow direction, validating this and indicating potentially multiple independent aquifers. The predominant mineralization mechanisms involve silicate hydrolysis and carbonate dissolution, supplemented by minor processes like evaporitic dissolution and cation exchange. The anthropogenic influence suggests potential groundwater recharge with potential pollution in the “SAC1”, “SAC2”, “GFR”, “GGQ”, and “GKS” geological formations. The stable isotopes (δ18O, δ2H) indicate recharge occurred over 4.5 kyr B.P., while tritium (3H) analysis confirms the presence of old, mixed waters, indicating slow renewal. Overall, this study highlights the minimal recent recharge and limited renewal rates, questions tritium’s efficacy for old water detection, and emphasizes the need for sustainable management.

1. Introduction

The Taoudéni Basin, which is shared by eight West African countries, including Burkina Faso, hosts vital groundwater resources for local communities [1,2,3,4,5]. The World Bank’s work estimated reserves of around 201,888 billion cubic meters for the Burkinabe part of this basin, which represents less than 3% of its surface area [3]. This basin therefore presents significant potential for economic development throughout the West Africa region. However, a lack of crucial knowledge and technical expertise for sustainable groundwater management, coupled with the inability to predict climate change variables, significantly affects these vital resources. Consequently, these waters face growing threats from rising demand due to population pressure, climatic variability, and pollution from as-yet-undetermined sources [4,5,6]. To address these challenges, an integrated approach incorporating techniques like hydrogeochemistry, isotope hydrology, statistics, hydrology, and hydrodynamics, coupled with hydrogeological modeling, is necessary. This study specifically explores the contribution of hydrogeochemical and isotopic tools [7,8,9].
Several studies have demonstrated the significant contribution of hydrogeochemistry and isotopy to the understanding of aquifer hydrodynamics [5,10,11,12,13,14,15,16,17,18,19,20,21]. These approaches enable exploration of the chemical and isotopic properties of groundwater, providing valuable information on the groundwater origins, mixing, flows, and residence times [22].
Concerning the study area, several previous hydrogeochemical and isotopic studies have been carried out [1,5,23,24]. Hydrogeochemistry has been employed to shed light on the processes governing the chemical composition of groundwater and to understand the interactions between surface water and groundwater in the various compartments of the study area, with a particular emphasis on the groundwater flow dynamics [1,23]. Through the study of hydrochemical facies and a few binary diagrams, some of these studies, such as Taupin (2017) and Kouanda (2019), have shown that mineralization is mainly governed by four key processes: dissolution of carbonate minerals, evaporitic dissolution, cation exchange with clay minerals (characterized by Na ion release and Ca ion fixation), and anthropogenic pollution. The impact of anthropogenic activities on groundwater quality has been highlighted by the accumulation of nitrates, and partially sodium, potassium, and chlorides [5,24]. This conclusion was justified in particular by the abundance of magnesian calcic bicarbonate facies [5]. However, some of these mechanisms appear to be partially disconnected from the petrographic composition of the zone, largely dominated by sandstone sedimentation, with local variations in the carbonate cement content [25].
Regarding resource renewal, various studies’ conclusions diverge [1,5,23,24]. Ref. [23], based on data from [1] and using an isotopic approach based on tritium and carbon 13/14, asserted that the area had low recent recharge, indicating a high level of ancient water. Then, ref. [24] observed higher tritium concentrations in the northern part, supporting the hypothesis of significant recharge in this region. However, ref. [5] used tritium spatialization to map the recharge zones, demonstrating higher concentrations in the southern part compared with the northern part, which would favor the idea of recharge preferentially in this part. This spatialization also enabled [5] to suggest abundant recent recharge from the tritium, contrary to the work of [1,23]. It is crucial to note that tritium, a radioactive element released into the atmosphere between the years 1952 and 1962, is constantly decreasing and currently reaches very low values (2–5 TU) [22,26]. Therefore, assessing its level, whether higher or lower, is only valid when considering the sampling period relative to current precipitation (post-early 2000s). It should also be pointed out that higher values may be observed for older periods in areas where the current water supply is nil or insufficient to dilute older water, making spatialization of the tritium content less suitable for mapping recharge [22].
Given these divergent observations, the present study aims to improve understanding of the hydrodynamics and groundwater renewal of the Taoudéni Basin. It adopts an integrated approach combining hydrogeochemistry and isotopy, as well as hydrogeology and petrology. The aim is to improve knowledge of the chemistry and water renewal processes of the Taoudéni sedimentary aquifers. The methodological approach is based on up-to-date sampling and comprises several stages. Firstly, groundwater mineralization is analyzed using statistics, mapping, binary and ternary diagrams, and saturation indices. Next, the question of the groundwater renewal time is addressed using statistical and cartographic analysis of stable (2H and 18O) and radioactive (3H) isotopes. These analyses integrate petrological and hydrogeological knowledge. In addition, the study of the tritium levels considers current concentrations in the environment. This holistic methodological approach will provide an in-depth understanding of the hydrogeological dynamics of the study area.

2. Study Area

2.1. Location

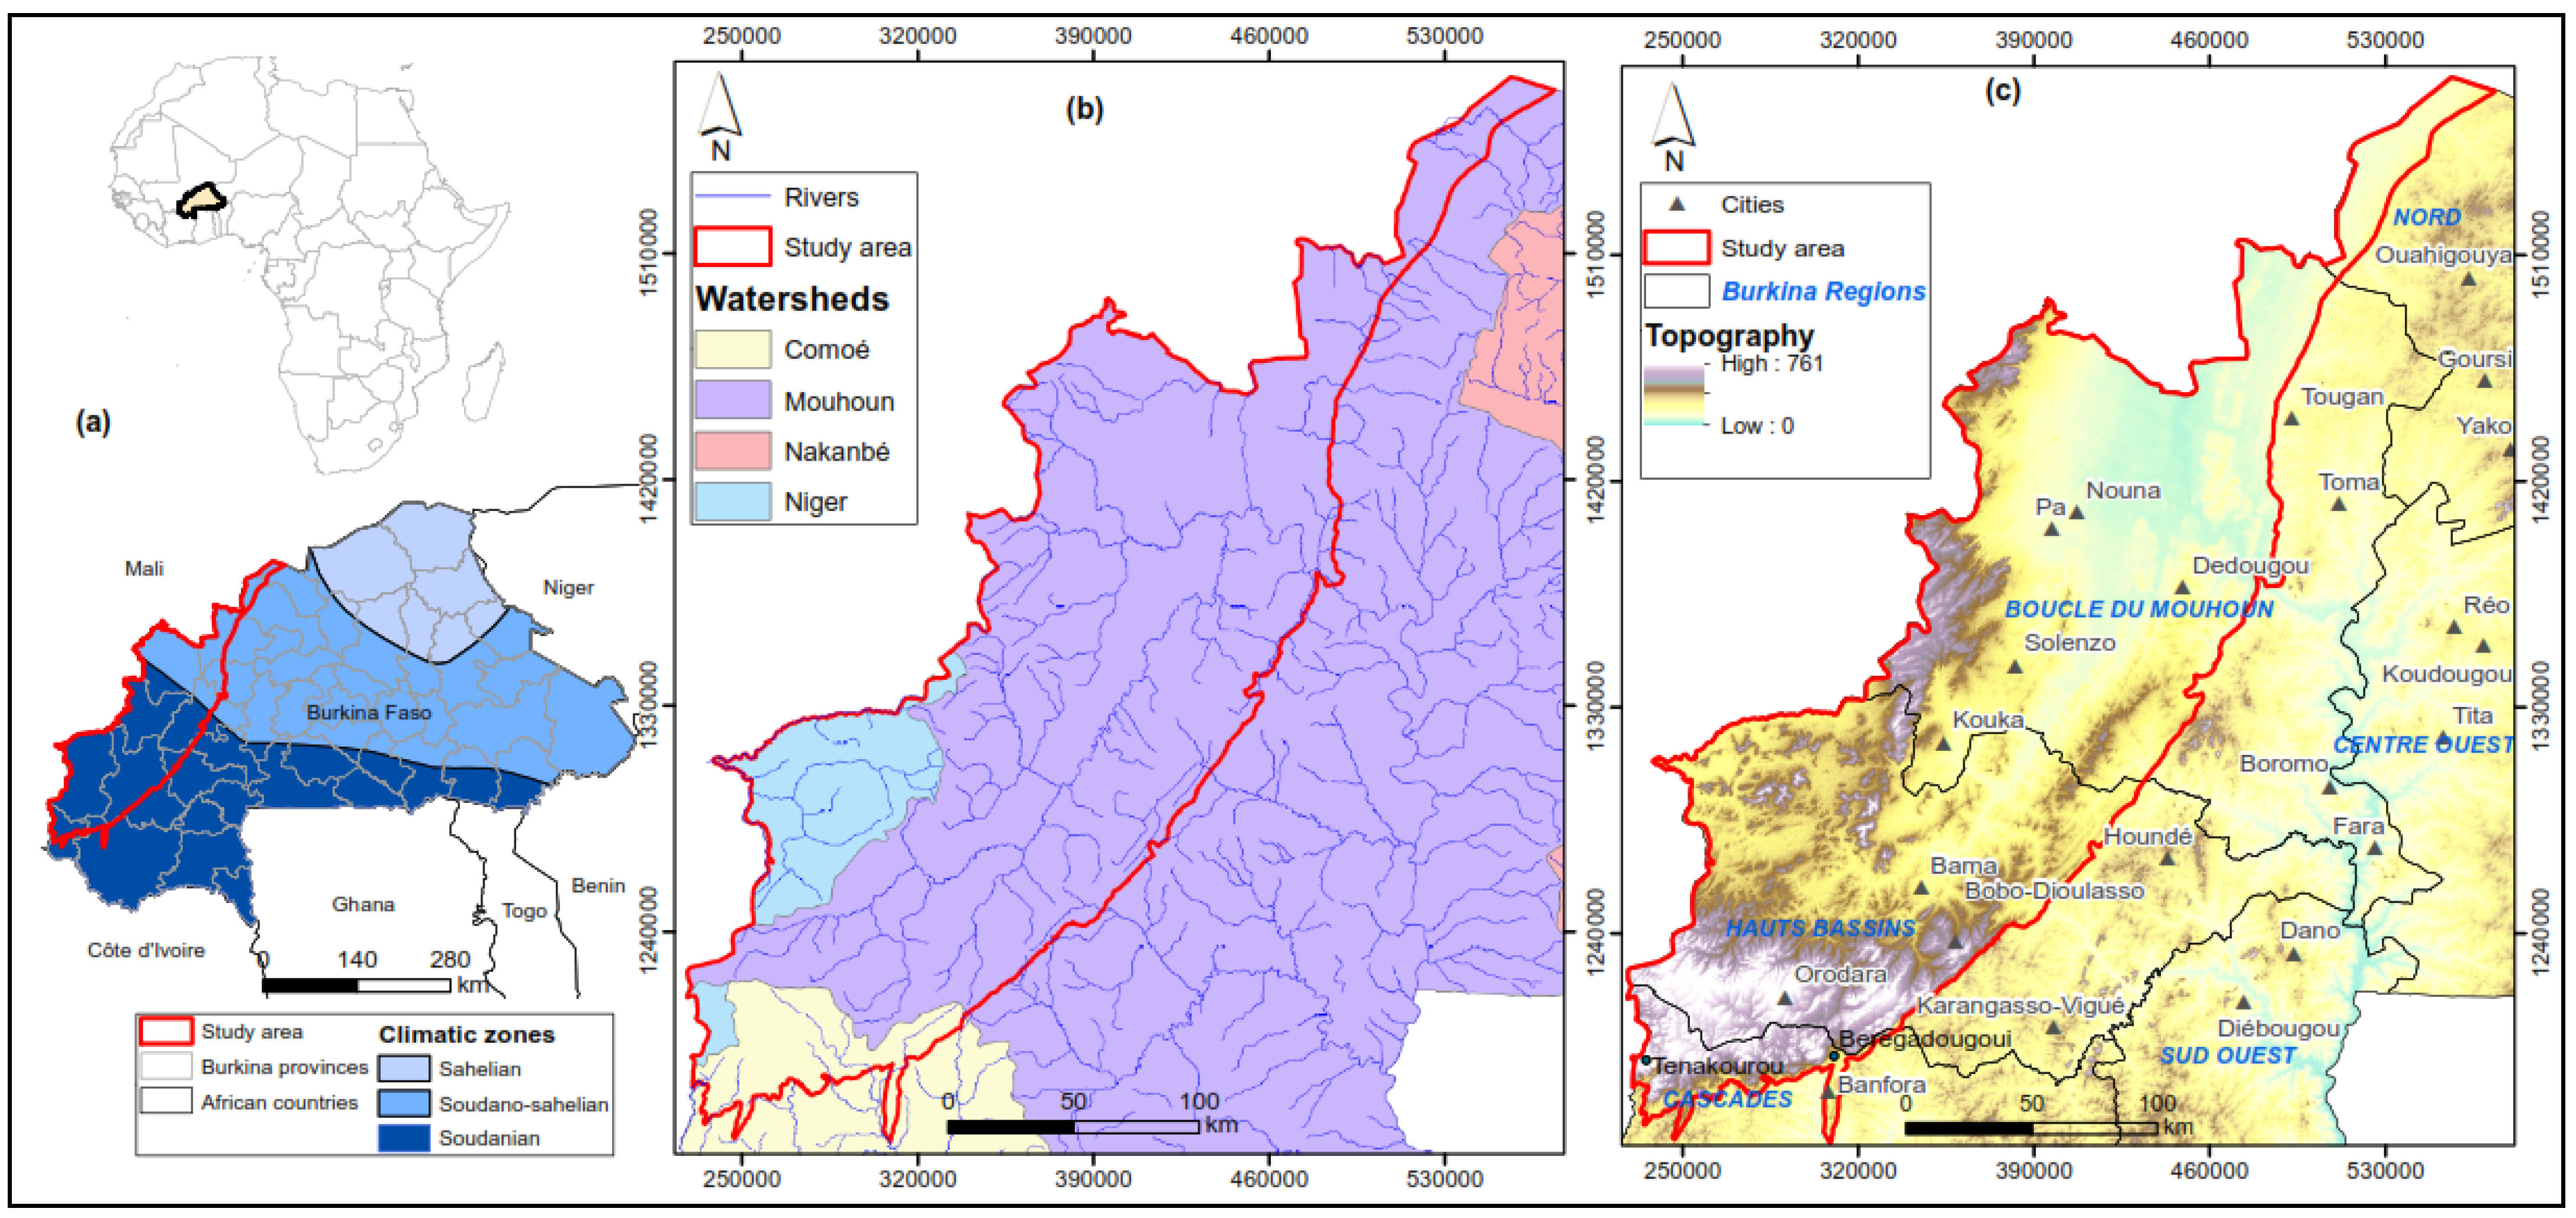
The study area is located in Burkina Faso between longitudes 6 and 2° W and latitudes 9 and 14° N (Figure 1a). Bordering Mali to the west, the area covers four regions of Burkina Faso, namely the North (Yatenga provinces), the Boucle du Mouhoun (Kossi, Banwa, Mouhoun, Sourou, Nayala, and Balés provinces), the Hauts-Bassins (Kénédougou, Tuy and Houet provinces) and the Cascades (Comoé and Léraba provinces).
It consists of a sedimentary domain forming a plateau averaging 500 m asl in altitude. The plateau is characterized by gently rolling hills. Lateritic cuirasses are abundant, covering almost half the plateau’s surface area. Isolated hills with altitudes sometimes more than 700 m asl also emerge from the plateau. The Bérégadougou hill, for example, rises to 717 m asl and the Ténakourou, at 747 m asl, is the highest peak in Burkina Faso (Figure 1c). At the edge of the basement, the sedimentary plateau forms a cliff of variable height, but barely exceeding 200 m asl.
It is mainly drained by the Mouhoun (ex. Volta noire) river, which is 750 km long, a perennial watercourse whose main tributaries are the Upper Mouhoun, Sourou, and Lower Mouhoun. Alongside the Mouhoun are the Comoé and Banifing rivers (part of the Niger Basin) [27]. The study area therefore comprises three watersheds (Figure 1b).
Burkina Faso has a Sudano-Sahelian climate, divided into three main zones (Figure 1a). In the north is the Sahelian zone, characterized by annual rainfall of less than 600 mm, high evapotranspiration, high temperatures (between 30 and 40 °C), and a short rainy season of 2 to 3 months. The Sudano-Sahelian zone is marked by rainfall of 600 to 900 mm over 4 to 5 months, with temperatures generally between 20 and 30 °C. In the southern Sudanian zone, the rainy season lasts from 5 to 6 months, with rainfall that can exceed 1100 mm per year. The thermal amplitudes are low, between 20 and 25 °C [5,6,28].
Figure 1. Southeastern part of the Taoudéni Basin: (a) location map and climatic zones (data from [29]); (b) hydrography and watersheds; (c) and the topography.
Water 16 01922 g001

2.2. Geology and Hydrogeology

The study area belongs to the Taoudéni Basin, a sedimentary basin. Located on the West African craton, this basin is the largest sedimentary syncline in northwest Africa. It was formed in the second half of the Proterozoic [30,31]. Its active period of subsidence continued until the middle of the Paleozoic when the Hercynian orogeny occurred and the basin was exposed. It is made up of 6000 m of Precambrian (Infracambrian) and Paleozoic sediments (Figure 2) [30].
It covers almost 1.5 million km2 in West and North Africa. It extends well into Mali, Mauritania, and the two Guineas, and it overflows slightly into Algeria, Burkina Faso, Senegal, and Sierra Leone.
The study area (Figure 3) corresponds to the south-eastern edge of this basin. It corresponds to the western sedimentary zone of Burkina Faso. It covers an area of 42,000 km2 and is estimated to be 2000 m thick. Locally, the Infracambrian formations are subdivided into nine different formations (Figure 2 and Figure 3a). These are (i) the lower sandstones (GI), (ii) the Kawara Sindou sandstones (GKS), (iii) the fine-grained sandstones with glauconite (GFG), (iv) the quartz granulate sandstones (GGQ), (v) the siltstones, argillites and carbonates of Guena-Souroukoundinga (SAC1), (vi) the pink fine-grained sandstones (GFR), (vii) the siltstones, argilites and carbonates of Samandeni-Kiebani (SAC2), (viii) the siltstones and quartzite of the Fo Pass (SQ), and (ix) the Fo-Badiangara sandstone (GFB). The Paleozoic formations correspond to the Tertiary Continental Terminal (CT). Doleritic and gabbro-doleritic intrusions, probably Permian in age, are also found here and are frequently encountered at SAC1 and SAC2 (Figure 3a) [25,32]. These formations are predominantly sandstone with, locally, carbonate cement.
The sedimentary series is mainly made up of potential reservoir rocks over more than 3/4 of its thickness [25,32]. Thus, from the basement to the base of SAC1, a sandstone-on-sandstone contact is systematically observed over a thickness of around 1000 m, except for a discontinuous argillite bed that, at the base of the glauconitic fine sandstones, locally captivates the Kawara-Sindou sandstones. These conclusions are based on surface outcrops and borehole data, the deepness of which does not exceed 300 m over the entire zone [25,29]. Consequently, the association of each of the geological formations with an aquifer is based more on petrographic than hydrogeological criteria.
The hydrodynamic parameters of the aquifer are mainly deduced from long-term pumping tests (72 h) [33], with some data from short-term tests. The average transmissivities range from 10 4 à 10 3 m 2 s , with individual values reaching 1 to 5 × 10 3 m 2 s , especially in the GGQ, SAC1 and SAC2 formations. The storage coefficient is poorly documented, but for the GGQ, SAC1 and GFG formations, it ranges from 3 × 10 5 and 3 × 10 3 , indicating free to semi-captive aquifers [1,2,29].
Figure 3. (a) Detailed geology of the southeastern margin of the Taoudéni Basin (data from [34]) and (b) sampling map. GFG: the fine-grained sandstones with glauconite, GGQ: the quartz granulate sandstones, SAC1: the siltstones, argillites and carbonates of Guena-Souroukoundinga, GFR: the pink fine-grained sandstones, SAC2: the siltstones, argilites and carbonates of Samandeni-Kiebani, SQ: the siltstones and quartzite of the Fo Pass, GFB: the Fo-Badiangara sandstone, CT: Continental Terminal, DOL: dolerite.
Water 16 01922 g003
From a hydrodynamic point of view, the basic hypothesis so far considered is that this series consists of a single water table hosted within a multi-layered aquifer system with locally impermeable layers of limited horizontal extension [1]. According to [1,29], the groundwater generally flows from southwest to northeast. There are also minor flow directions, notably northwestward and eastward toward Mali [29].

3. Material and Methods

3.1. Data Collection and Analysis

The data used in this study include 406 physico-chemical analyses, 147 stable isotope analyses, and 71 tritium analyses. These data come from several campaigns, including that conducted as part of the International Atomic Energy Agency’s (IAEA) RAF 7011 project from 2013 to 2016, the Water Supply and Sanitation Program (PAEA) from 2019 to 2020, and two sampling campaigns, during periods of high groundwater levels during the 2021 and 2022 rainy seasons. The purpose of the 2021 and 2022 field campaigns was to update the data collection from previous campaigns, considering the following elements:
  • Resampling of several points to verify potential geochemical and isotopic changes. Emphasis was placed on points located in the aquifer’s supposed recharge zone (corresponding to high piezometric heights) to verify hypotheses on recharge zones.
  • The need to add new points not sampled in previous work, to extend surveys to little-explored areas or aquifer levels. Particular attention was paid to the quartz granulate sandstones (GGQ) level, which appears to be the most productive.
  • The need to sample points whose lithological section is available in our borehole database.
The 2021 and 2022 field campaigns collected 73 water samples, with 44 of them analyzed for their isotopic composition (Figure 3b, Table 1). A planned third campaign to collect samples for carbon-13/14 analysis was unfortunately cancelled due to ongoing security concerns in the region (Burkina Faso). Therefore, we mainly focused on hydrogeochemical, stable isotopes and tritium samples.
To guarantee the representativeness of each sample taken from the aquifer, the wells were first purged until the electrical conductivity stabilized [35]. Field measurements, with reference to the protocol described by [36,37], included the electrical conductivity, temperature, and pH, using a handheld WTW 3210 pH meter (Germany, accuracy ±0.005) and a WTW 3210 conductivity meter (accuracy ±0.01 m). Hardness (hydrotimetric titer, TH) was assessed by volumetric titration using a 0.02 N EDTA solution, while alkalinity ( H C O 3 ) was determined in the field by volumetric titration using a 0.02 N hydrochloric acid (HCl) solution.
Samples were analyzed at the laboratory of Burkina Faso’s General Office of Water Resources (Direction Générale des Ressources en Eau), mainly focusing on the major elements. The analytical techniques used included volumetry (TH and calcic TH) for calcium ( C a 2 + ) and magnesium ( M g 2 + ), ion chromatography (IC Metrohm) for chloride ( C l ), sulfate ( S O 4 2 ) and nitrate ( N O 3 ), and atomic absorption spectrometry (SAA Perkin Elmer Pin AAcle 900T, USA) for sodium ( N a + ) and potassium ( K + ). Samples from the PAEA were analyzed by several commercial laboratories based in Ouagadougou.
For all the physico-chemical analyses, the accuracy of the data, expected to be between −5% and 5% in terms of the ionic balance [38], was verified for 347 of the samples collected, representing 86% of all the samples (Figure 3b, Table 1).
Isotope analyses were conducted at two laboratories:
  • Laboratoire d’Analyse Structurale et Isotopique (LASI) at Centre National de l’Energie des Sciences et des Techniques Nucléaires (CNESTEN), Morocco.
  • Laboratoire de Radio-Analyses et Environnement at École Nationale d’Ingénieurs de Sfax, Tunisia.
The stable isotope compositions of hydrogen (2H/1H) and oxygen (18O/16O) in water samples were determined using a Laser LGR spectrometer. The isotopic ratios are expressed relative to the Vienna Standard Mean Ocean Water (VSMOW) standard. The analytical uncertainties for δ18O ranged from 0.14 to 0.2‰, and for δ2H from 1.6 to 4.72‰. The tritium content was measured by liquid scintillation counting following electrolytic enrichment of the water samples. The results are reported in tritium units (TU) with an uncertainty of 0.03 TU.

3.2. Hydrodynamics and Mineralization

The hydrogeochemical approach aims to understand the origin of mineralization about the direction of water flow in the aquifers of the Taoudéni Basin. This approach began with a statistical analysis and mapping of physico-chemical parameters such as the temperature, pH, and electrical conductivity (EC) to assess the relationship between groundwater chemistry and hydrodynamics. These parameters were also used to assess the groundwater quality, based on World Health Organization (WHO) indicators applied in Burkina Faso [39].
Next, an in-depth study of the water mineralization was undertaken to understand the geochemical processes that can provide information on the origin of water. Firstly, we proposed explanatory hypotheses for the presence of these various elements, drawing particularly on the context in which the rocks were emplaced (petrology). Secondly, the study of the mineralization involved the use of several tools, such as the analysis of hydrochemical facies using the Piper diagram, binary diagrams between elements, and the study of saturation indices [5,10,16,17,40,41]. These methods make it possible to classify the types of water in the study area, to gain a better understanding of the interactions between groundwater and lithology, and to verify the hypotheses previously formulated.
The notion of the saturation index (SI) was introduced by [42,43]. It is one of the most common approaches to understanding the origin of mineralization and explaining the presence of certain minerals in the aquifer [17]. The saturation index is calculated by:
I S =   l o g ( P A I K )
where PAI is the solubility product expressed in terms of the ionic activity and K is the equilibrium constant for the mineral dissolution.
For an aqueous solution:
  • If IS = 0, the water is in equilibrium (saturated) with the mineral.
  • If IS < 0, the water is undersaturated with respect to the mineral, meaning that the water will dissolve the mineral.
  • If IS > 0, the water is supersaturated, meaning that the water will precipitate the mineral.
The use of DIAGRAMME software (v6.77) from the University of Avignon proved particularly useful in this approach; in particular, the Piper diagram and the calculation of the saturation indices were performed using the PHREEQC code incorporated into the software [44,45]. All these results will be used in an attempt to differentiate aquifers [5,23].

3.3. Resource Renewal

The question of the groundwater renewal time is addressed through an isotopic study using two types of isotopes: stable isotopes (2H and 18O) and radioactive isotopes (3H).
Stable water isotopes, such as deuterium (2H) and oxygen-18 (18O), have been used as tracers to analyze aquifer evaporation and recharge processes [46,47,48]. Tritium (3H), meanwhile, has been used as an indicator to estimate the relative age of groundwater, especially for relatively young waters (post- or pre-1952), making it possible to assess the residence times and the time elapsed since groundwater recharge.
Isotopic analysis was carried out using elementary statistical methods on stable isotopes and tritium. The groundwater isotopic concentrations were compared with those of the precipitation, thus acting as an input marker for the hydrological system. In addition, the groundwater samples were plotted on a binary deuterium/oxygen-18 diagram, compared to the global meteoric line, providing a global perspective on the hydrological processes [5,23,49]. In addition, the combination of these data with hydrogeochemical and hydrodynamic parameters has been used to deepen understanding of the groundwater flow and renewal.

4. Results

4.1. Hydrogeochemistry

4.1.1. Physico-Chemical Parameters

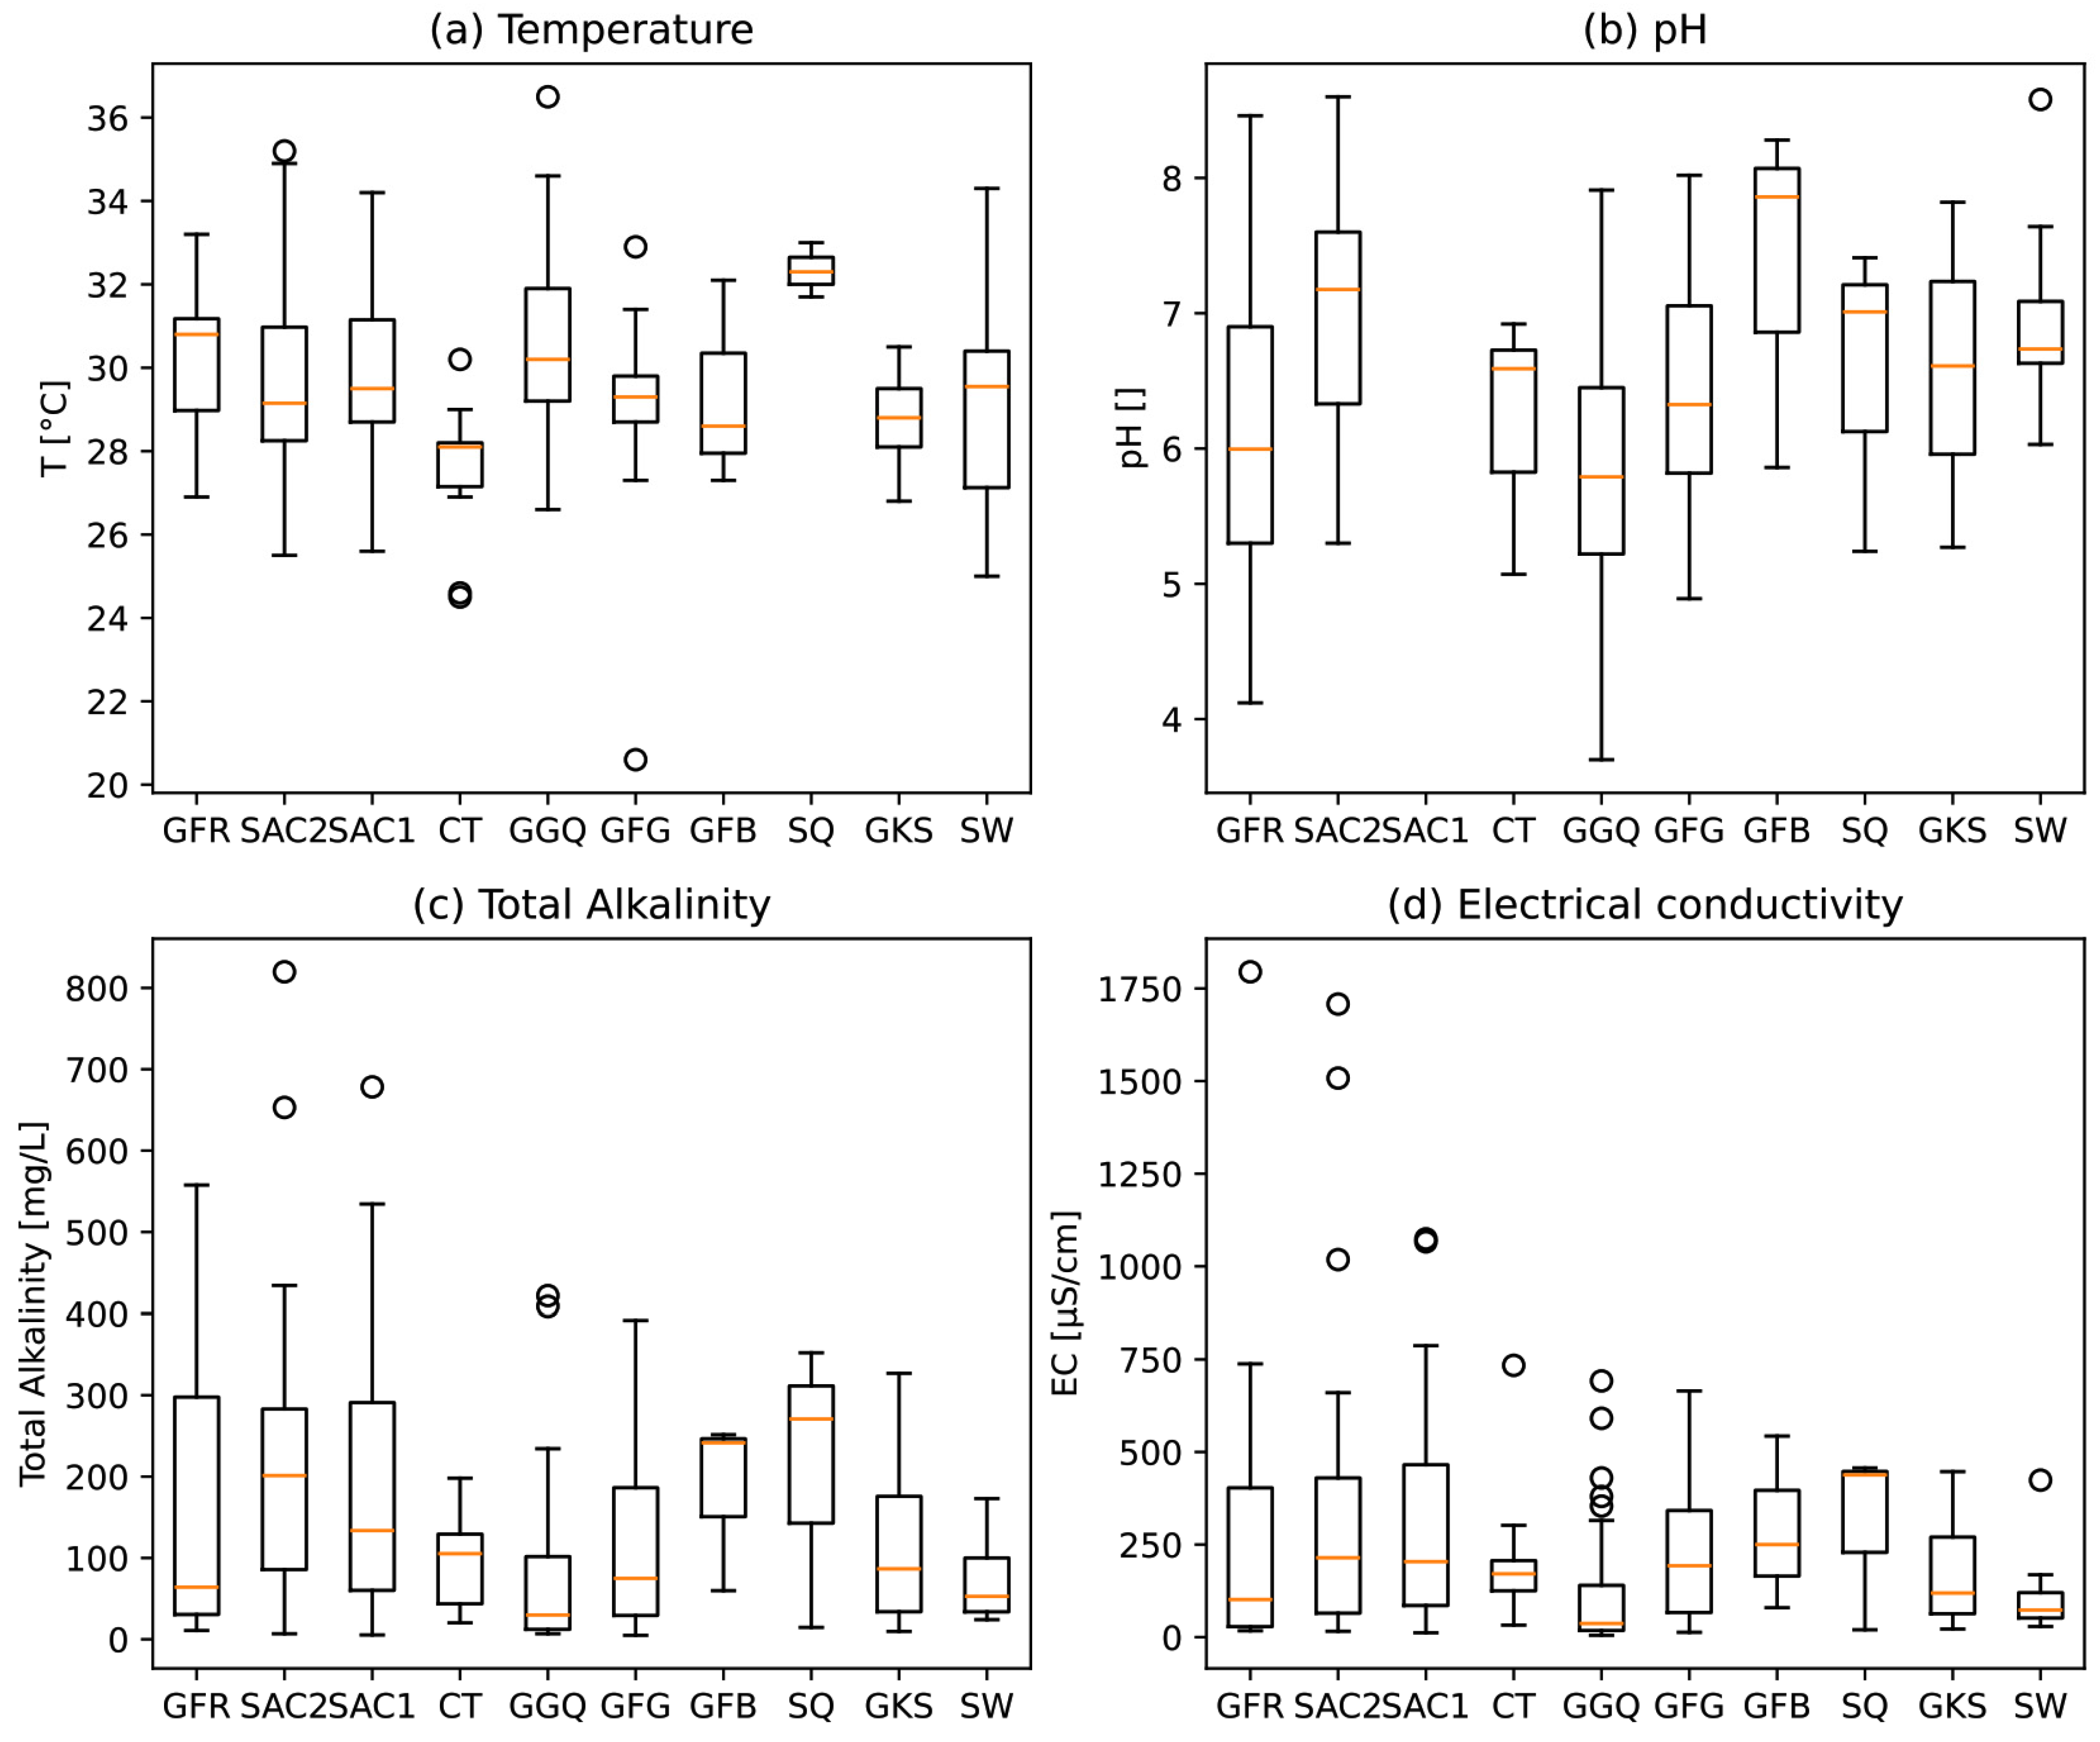
Figure 4 shows the various physico-chemical parameters measured in the field according to the different geological formations encountered.
The temperatures (Figure 4a) range between 28 and 33 °C. These values seem to follow the climatic regime of the area, as they are close to the average atmospheric values (30–31 °C) [1,23]. These values are close to those obtained by [23]. As for the pH (Figure 4b), except for a few extreme values in the study area, it lies within 5 and 8. It is therefore in line with drinking water standards, but with a slightly acidic trend (average 6.4). This acidic trend can be attributed to the dominant silicate nature of the aquifers. The typical pH values in natural waters range from 6 to 8.5 [35]. The total alkalinity (Figure 4c), ranging from around 10 to 800 mg/L, suggests an adequate capacity of the groundwater to react with acids, which is important for maintaining the water’s chemical balance and protecting against harmful pH variations [50,51].
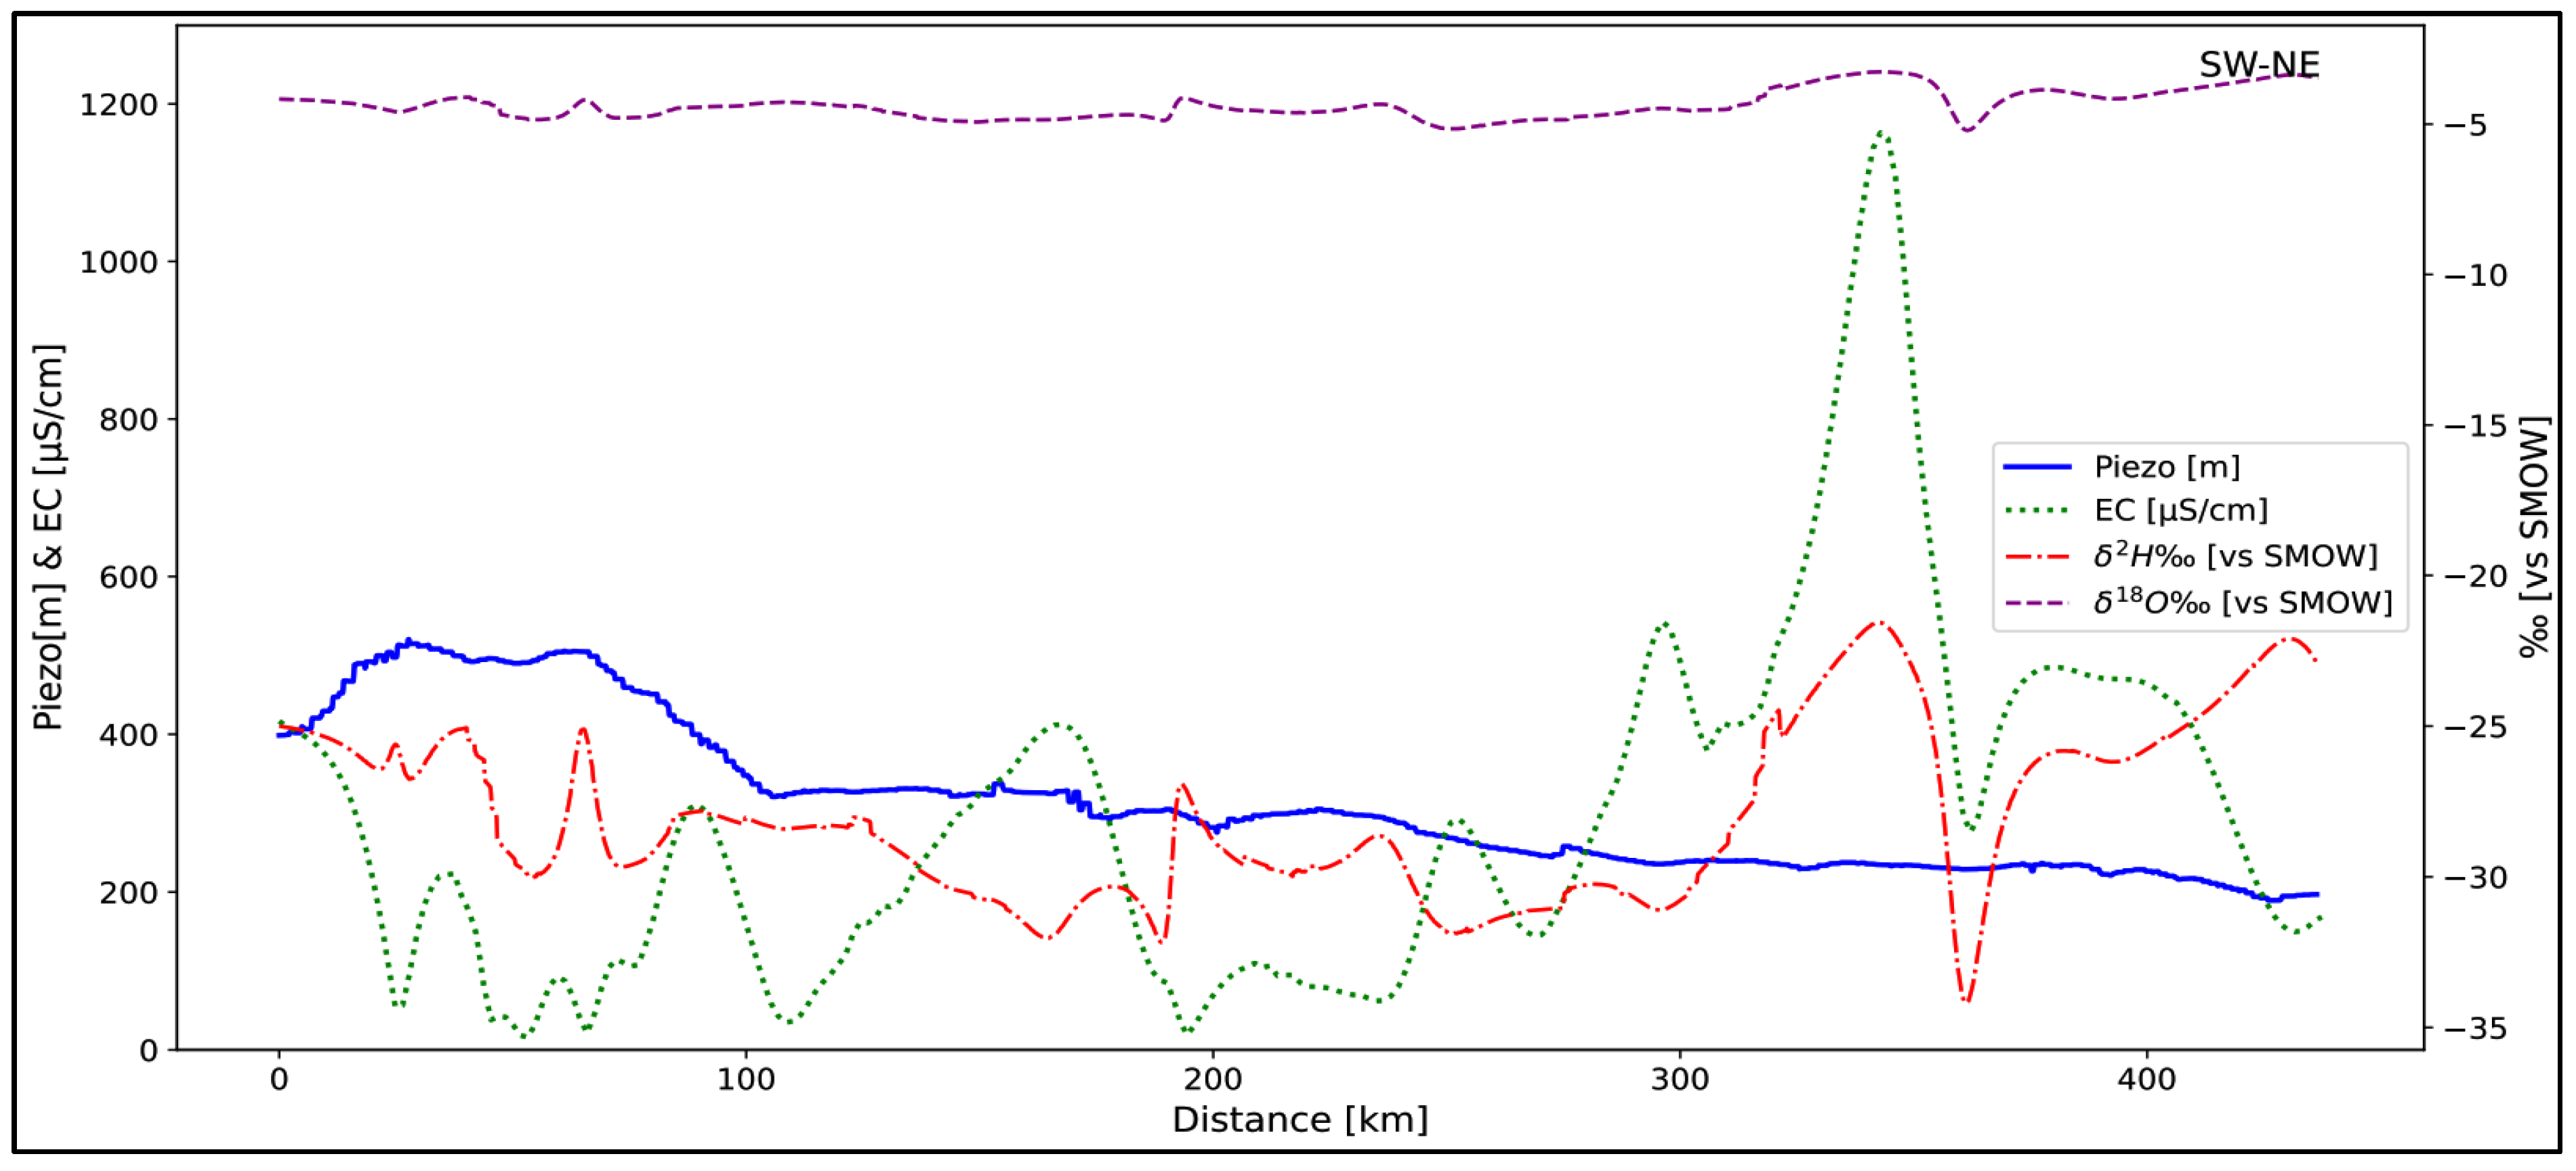
The electrical conductivity (Figure 4d) provides information on the degree of mineralization of the water. In the study area, it ranges from 5 to 1018 µS/cm, with an average of 283 µS/cm. However, nine samples showed outliers, detected by the Grubbs test up to 2000 µS/cm. The low average conductivity would indicate the generally low mineralization of the water. A few outliers were recorded for SAC1 (2000, 1074, and 1066 µS/cm), SAC2 (1708 and 1508 µS/cm), and GFR (1795 µS/cm), GGQ (1317 µS/cm) and GKS (1109, 1168 and 1439 µS/cm), likely attributed to the elevated nitrate, sulfate, and chloride levels observed in these samples [35]. These readings suggest localized pollution instances. The low values observed, typical of rainwater, can be justified by their location at piezometric crest zones, which correspond to areas where aquifers are recharged from surface water. The formations with the highest conductivity values are the most superficial. This could be explained by the anthropogenic influence on groundwater mineralization, probably linked to contamination. The deeper the water table, the more protected it would be from anthropogenic pollution [52,53,54]. This hypothesis is corroborated by the work of [55,56] carried out on sedimentary aquifers in Morocco, as well as by previous work in the study area. Spatial analysis of the electrical conductivity reveals a general upward trend in the direction of flow (Figure 5a,b and Figure 6), where the peaks observed on the profile are due to outliers linked to cases of localized pollution.

4.1.2. Major Elements

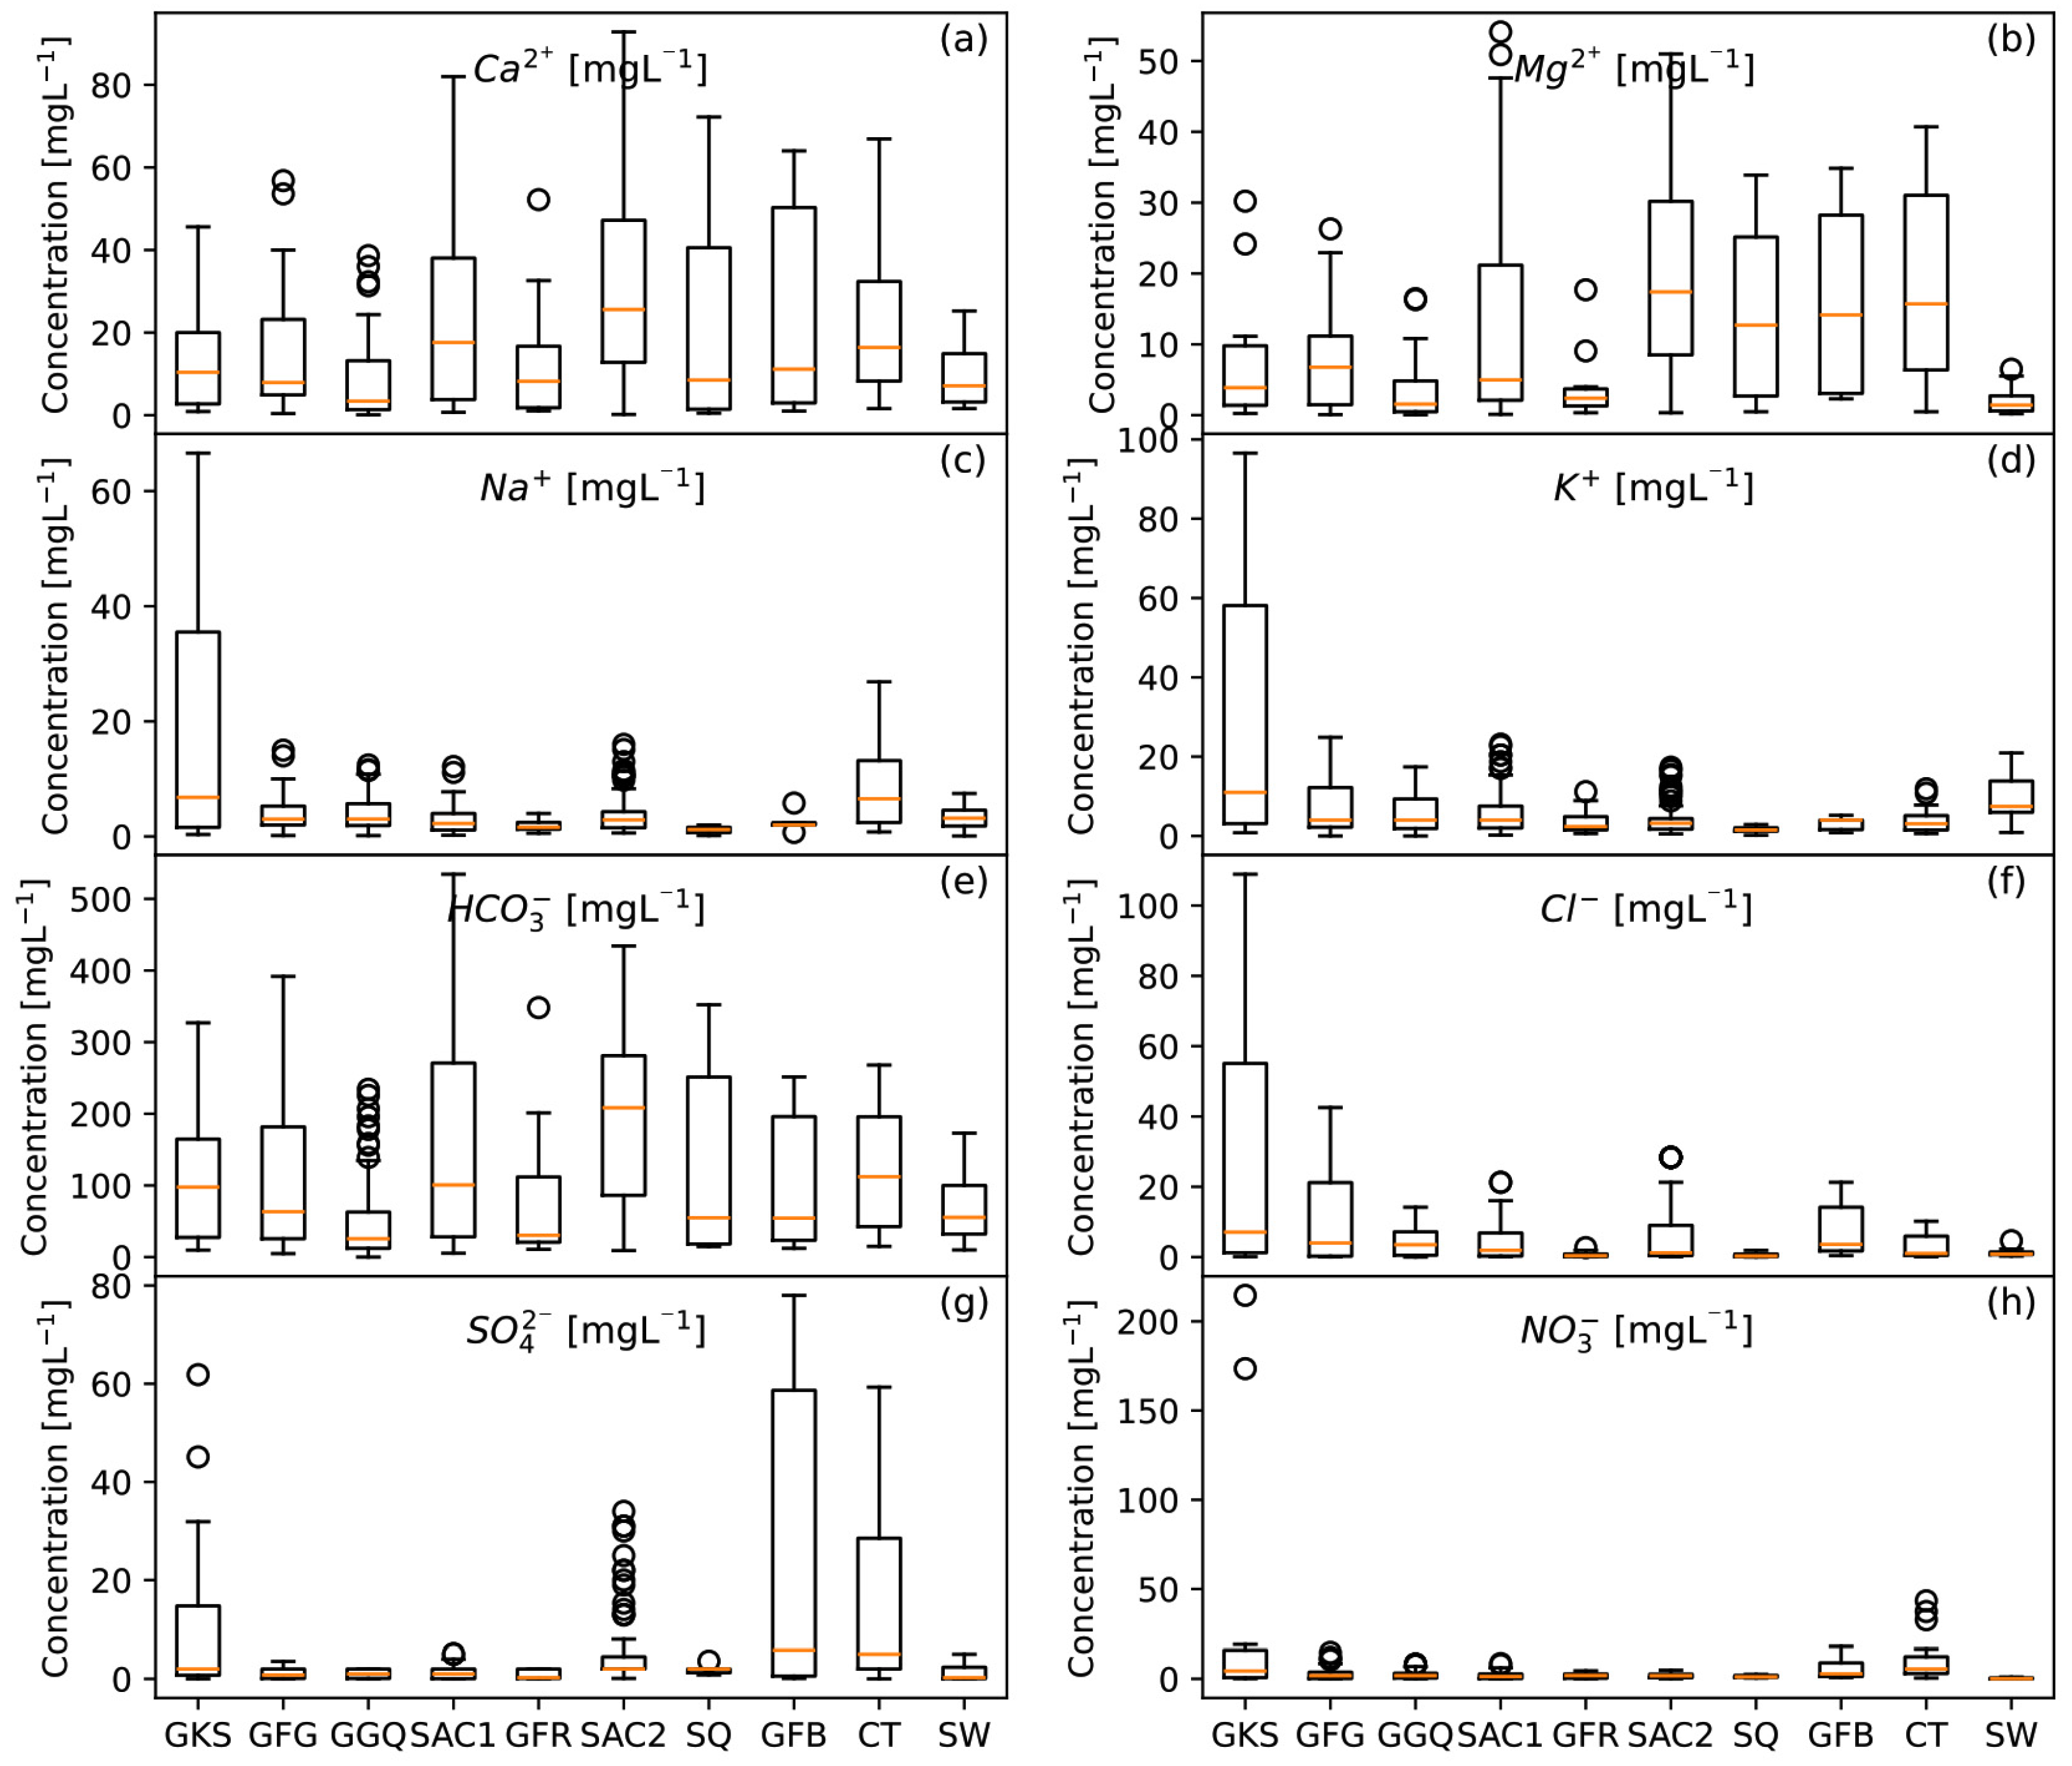
Descriptive statistics concerning the major ions (Figure 7, Table 2) reveal significant trends, based on which attempts can be made to explain their presence in the groundwater. The main findings can be summarized as follows.
  • Bicarbonates: The high concentration of bicarbonates (12 to 850 mg/L) observed in the study area likely originates from several sources. These include carbonate minerals in the soil and underlying formations (SAC1 and SAC2), as well as the contribution of CO2 from decomposing organic matter in the recharge zone, carried by infiltrating rainwater. This is attributed to the presence of carbonate minerals in the soil and geological formations (SAC1 and SAC2) [38].
  • Sulfates: Sulfates present concentrations ranging from 0.01 to 167 mg/L, with five samples exceeding potability standards (250 mg/L) [39], mainly from the SAC2 and GFR formations. Potential sources include natural processes such as evaporite dissolution and anthropogenic processes such as sewage infiltration, fertilizer use, and industrial wastewater [35,57]. Although the SAC1 and SAC2 formations originate from marine sedimentation [25,30] favorable to evaporitic dissolution, the low sulfate concentrations suggest a limited contribution to water mineralization.
  • Chlorides: Chlorides in groundwater can be of natural origin (precipitation, dissolution of evaporites) or anthropogenic (fertilizers, industrial wastewater). The observed concentrations (0.1 to 108.9 mg/L) show high values, mainly in the SAC1, SAC2, GKS, GFG, and CT formations, indicating a probable marine origin with a likely anthropogenic contribution, notably linked to fertilizer use.
  • Nitrates: The presence of nitrates in groundwater (0.01 to 48.8 mg/L) can be attributed to agricultural activities and wastewater discharges. Some 14 samples show nitrate levels over potability standards set at 50 mg/L [39]. The probable reasons also include the low static level of some sampling points and the proximity of faults, facilitating nitrate infiltration.
  • Calcium: Calcium is present in all the formations, with an average concentration of 23.96 mg/L, with a high concentration in the SAC1 and SAC2 geological formations. The abundance of calcium can mainly be attributed to the hydrolysis of silicates, the dissolution of carbonates, and, to a small degree, of evaporites.
  • Magnesium: The magnesium concentrations, due to silicate hydrolysis and dissolution of carbonate minerals, exceed the limit (≤50 mg/L) in some samples, notably in the SAC1 and SAC2 formations.
  • Sodium: Sodium is derived from silicate hydrolysis and evaporite dissolution, and to a lesser extent, from cation exchange [35,40,58]. In terms of the water quality, the water quality of the waterworks in the region meets drinking water standards (≤200 mg/L) [39], suggesting the predominant influence of sandstone formations rich in silicate minerals. In terms of the water quality for irrigation, the sodium levels encountered remain within the required standard [59] except for a single sample, as shown in the Wilcox diagram (Figure 8).
  • Potassium: Th potassium concentrations in the groundwater vary between 0.1 and 41 mg/L, generally meeting WHO standards (≤50 mg/L) [39], but 9 out of 347 samples exceed them up to 297.83 mg/L. In addition to silicate hydrolysis (a natural process), the widespread use of potassium fertilizers, notably NPK in agriculture, can also be identified as a likely source of contamination, underlining the need to monitor agricultural practices to ensure groundwater quality in the region.

4.1.3. Hydrochemical Facies

Analysis of the hydrochemical facies using the Piper diagram (Figure 9) helps to better understand the water mineralization.
Given the number of geological formations sampled, the sampled waters are grouped into three reservoirs according to their lithology (Table 3) for further hydrogeochemical study. This approach will also enable us to verify whether the waters constitute a single water table [1] or can be differentiated into several distinct aquifers.
In general, there are two dominant facies (Table 4), mainly the bicarbonate calcic magnesian facies ( H C O 3 C a   M g ), followed by the bicarbonate sodi-potassic facies ( H C O 3 N a   K ), with a tendency toward the chlorinated sulfated, calcic magnesian facies ( S O 4 C l C a M g ) on the one hand and the sodi-potassic on the other ( S O 4 C l K N a ). The bicarbonate calcic magnesian facies is not only typical of carbonate dissolution but also of silicate hydrolysis. It depends on the lithology of the rocks in place.
As with the dissolution of carbonates, the hydrolysis of a silicate, depending on its composition, may release one or more cations and HCO3 (from CO2 in soils) in constant proportions. This can be illustrated by the following reactions for albite, anorthite and micas [35]:
A l b i t e : 4 N a A l Si 3 O 8 + 4 C O 2 + 22 H 2 O 4 N a + + 8 H 4 SiO 4 + 2 A l 2 Si 2 O 5 O H 4 + 4 H C O 3 ,
A n o r t h i t e : 2 C a Al 2 S i 2 O 8 + 4 C O 2 + 6 H 2 O 2 C a 2 + + 2 A l 2 Si 2 O 5 O H 4 + 4 H C O 3
B i o t i t e : 2 K Mg 2 F e A l Si 3 O 10 O H 2 + 1 2 O 2 + 10 CO 2 + 16 H 2 O 2 K + + 4 M g 2 + + A l 2 Si 2 O 5 O H 4 + 2 F e O H 3 + 4 H 4 SiO 4 + 10 H C O 3
In a non-carbonate lithological context, the presence of sulfate and chloride, in significant quantities, could be an indication of pollution and therefore probably of recent recharge. It mainly concerns the GKS, GGQ, SAC1, SAC2 and GFG formations. These formations are located in the water table’s recharge zone.
There is also the calcic bicarbonate sub-facies, typical of meteoric waters, which corresponds to waters with low electrical conductivity and located in piezometric recharge zones.

4.2. Isotopic Composition

4.2.1. Isotopic Composition of Precipitation

The rainfall data used to interpret and construct the local meteoric line come from the IAEA’s GNIP (Global Network of Isotopes in Precipitation).
These are five stations (Barogo, Bobo, Houndé, Nasso and Ouagadougou) whose measurements cover the period from 1988 to 2019 (Table 5).
These data were processed to produce the local weather line shown below:
δ 2 H = 7.57 δ 18 O + 8.33
This line closely aligns with regional meteoric weather line (7), as established by [5], and the local weather lines suggested by [23] at Bobo station (8), [60] at Bamako station in Mali (9), and [61] at Barogo station (10), all in proximity to the global meteoric line (11) [62].
δ 2 H = 7.9 δ 18 O + 10.21
δ 2 H = 8.0 δ 18 O + 10.2
δ 2 H = 8.1 δ 18 O + 11.9
δ 2 H = 7.7 δ 18 O + 7.8
δ 2 H = 8.0 δ 18 O + 10

4.2.2. Isotopic Composition of Groundwater

Figure 10 shows the general statistics for the various isotopes analyzed and the deuterium excess (Figure 10c) calculated for the groundwater and surface water using the formula below:
d = δ 2 H 8 δ 18 O
The deuterium excess—a marker of evaporation, among other things—is below 10 on average for all the formations. The CT shows the lowest average excess deuterium value, with a few high values in GGQ, GFG and SAC1 and the dolerites. This can be justified a priori by the fact that these boreholes have low static level depths, which contribute to evaporation (less than 20 m on average). The static level depths at the CT are very high (over 30 m).
A study of the tritium content of the groundwater compared with that of the surface water enabled us to verify our hypotheses regarding the residence time and to propose a map of the recharge zones. The tritium levels in groundwater range from an average of 0.01 to 8.7 TU, with an average of 1.54 TU, covering the period from 2013 to 2022 (Figure 10d, Table S1 of Supplementary Materials).
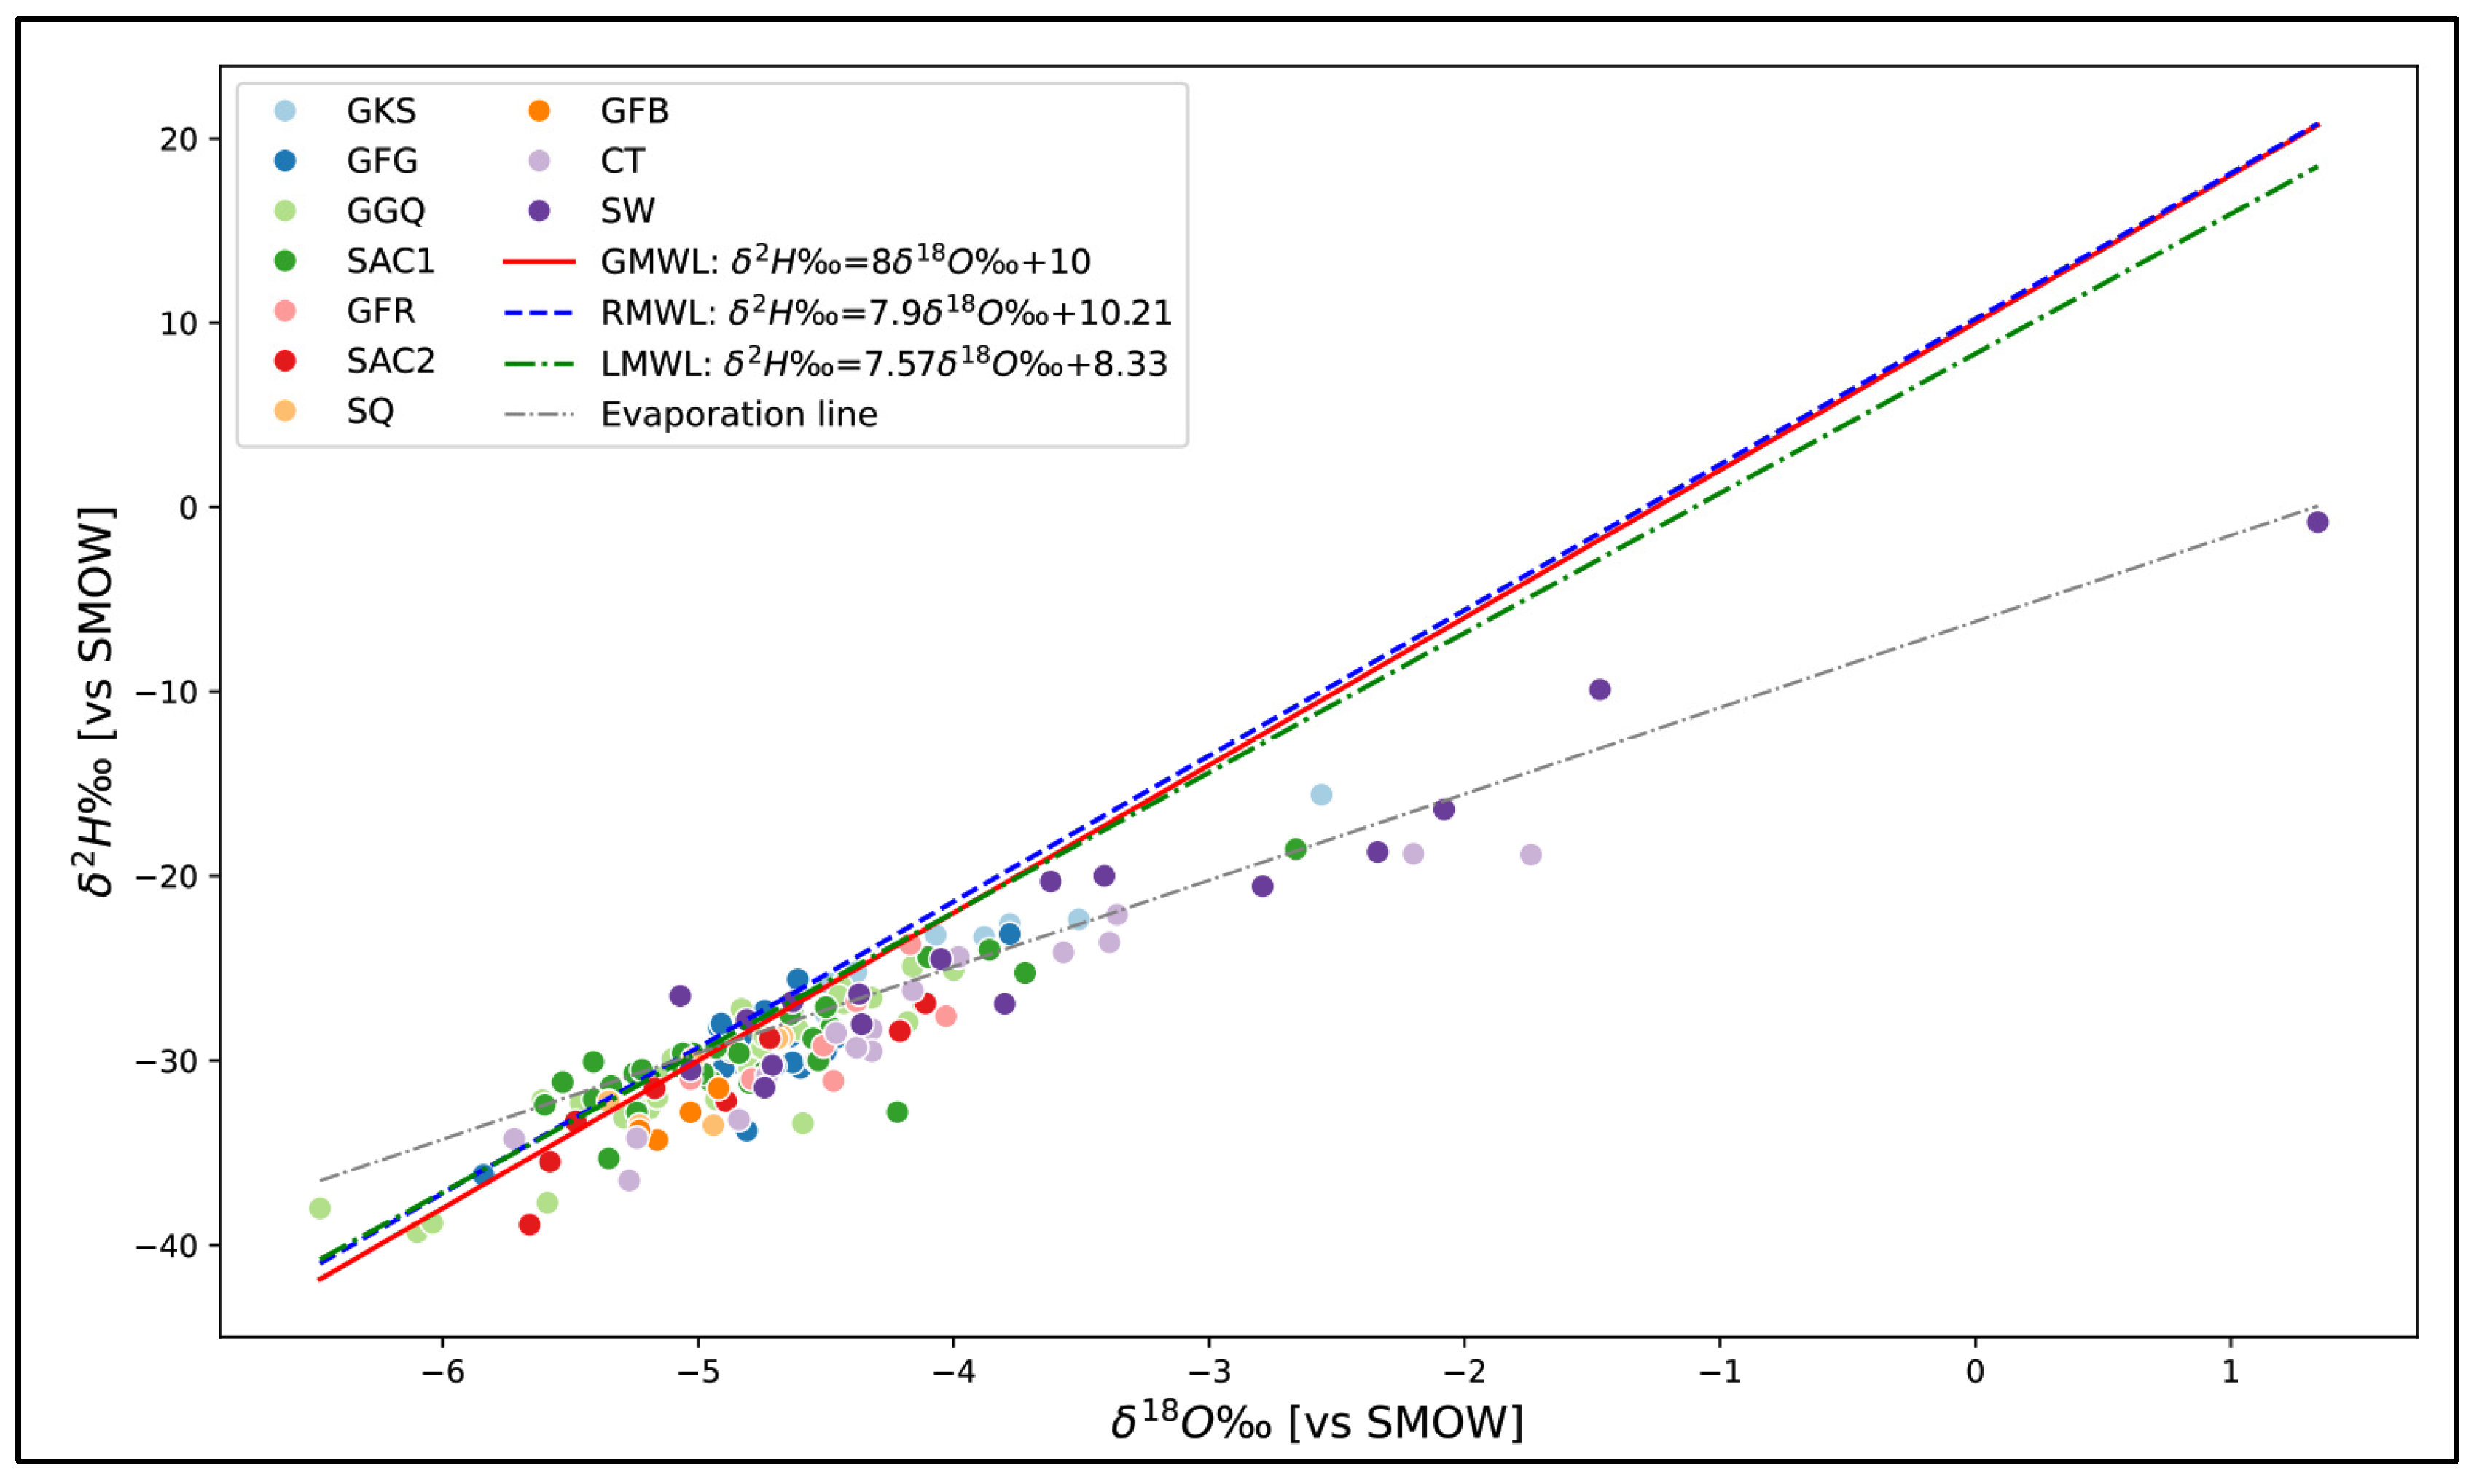
Figure 11 shows that the majority of the groundwater samples are above the meteoric line, indicating that this water would have infiltrated without evaporation. Such waters may represent either waters from a large current recharge without evaporation [5] or ancient waters from a paleorecharge under a wetter climate [46,63].

5. Discussion

5.1. Hydrodynamics

The general upward trend of the electrical conductivity in the direction of flow indicates that mineralization takes place as water passes through the various geological formations, and it also supports recharge at the level of the piezometric domes [23,64]. This can also be supported by the decreasing of the bicarbonate-calcium-magnesium facies according to the flow direction.
Indeed, as the meteoric waters infiltrate the piezometric domes, they dissolve in the soil, creating a weak acid (carbonic acid), charged with carbon dioxide (CO2) from the atmosphere. This acid attacks the limestone (CaCO3) present in the rocks, dissolving it in the following reaction [35,65]:
C a C O 3 + H 2 C O 3 C a 2 + + 2 H C O 3
This dissolution of limestone releases calcium ( C a 2 + ) and bicarbonate ( H C O 3 ) into the water, increasing its mineralization and providing its calcium bicarbonate facies. These meteoric waters thus impart the calcic bicarbonate facies that will evolve with the flow of water to the outlet toward the facies, reflecting the lithology of the formations encountered.
The profile of the isotopic contents along the flow direction obtained by piezometry reinforces this hypothesis (Figure 5 and Figure 6). Indeed, this profile shows that the water becomes poorer the further you move away from the piezometric dome. The isotopic enrichment observed between 300 and 400 km is thought to be linked to the presence of a large body of water (the Sourou dam), which is subject to evaporation and hence enrichment. Groundwater in the vicinity of the dam is naturally affected by this enrichment through infiltration into the water body.
For a thorough understanding of the hydrodynamics, a coupled approach to hydrogeochemistry and hydrogeology in the unsaturated zone is required. This would enable better characterization of the recharge mechanisms and verification of the conclusions regarding the renewal time. Horizon-by-horizon sampling during deep drilling would help to establish whether a single water table or several distinct water tables are present at the scale of the study area.

5.2. Groundwater Mineralization

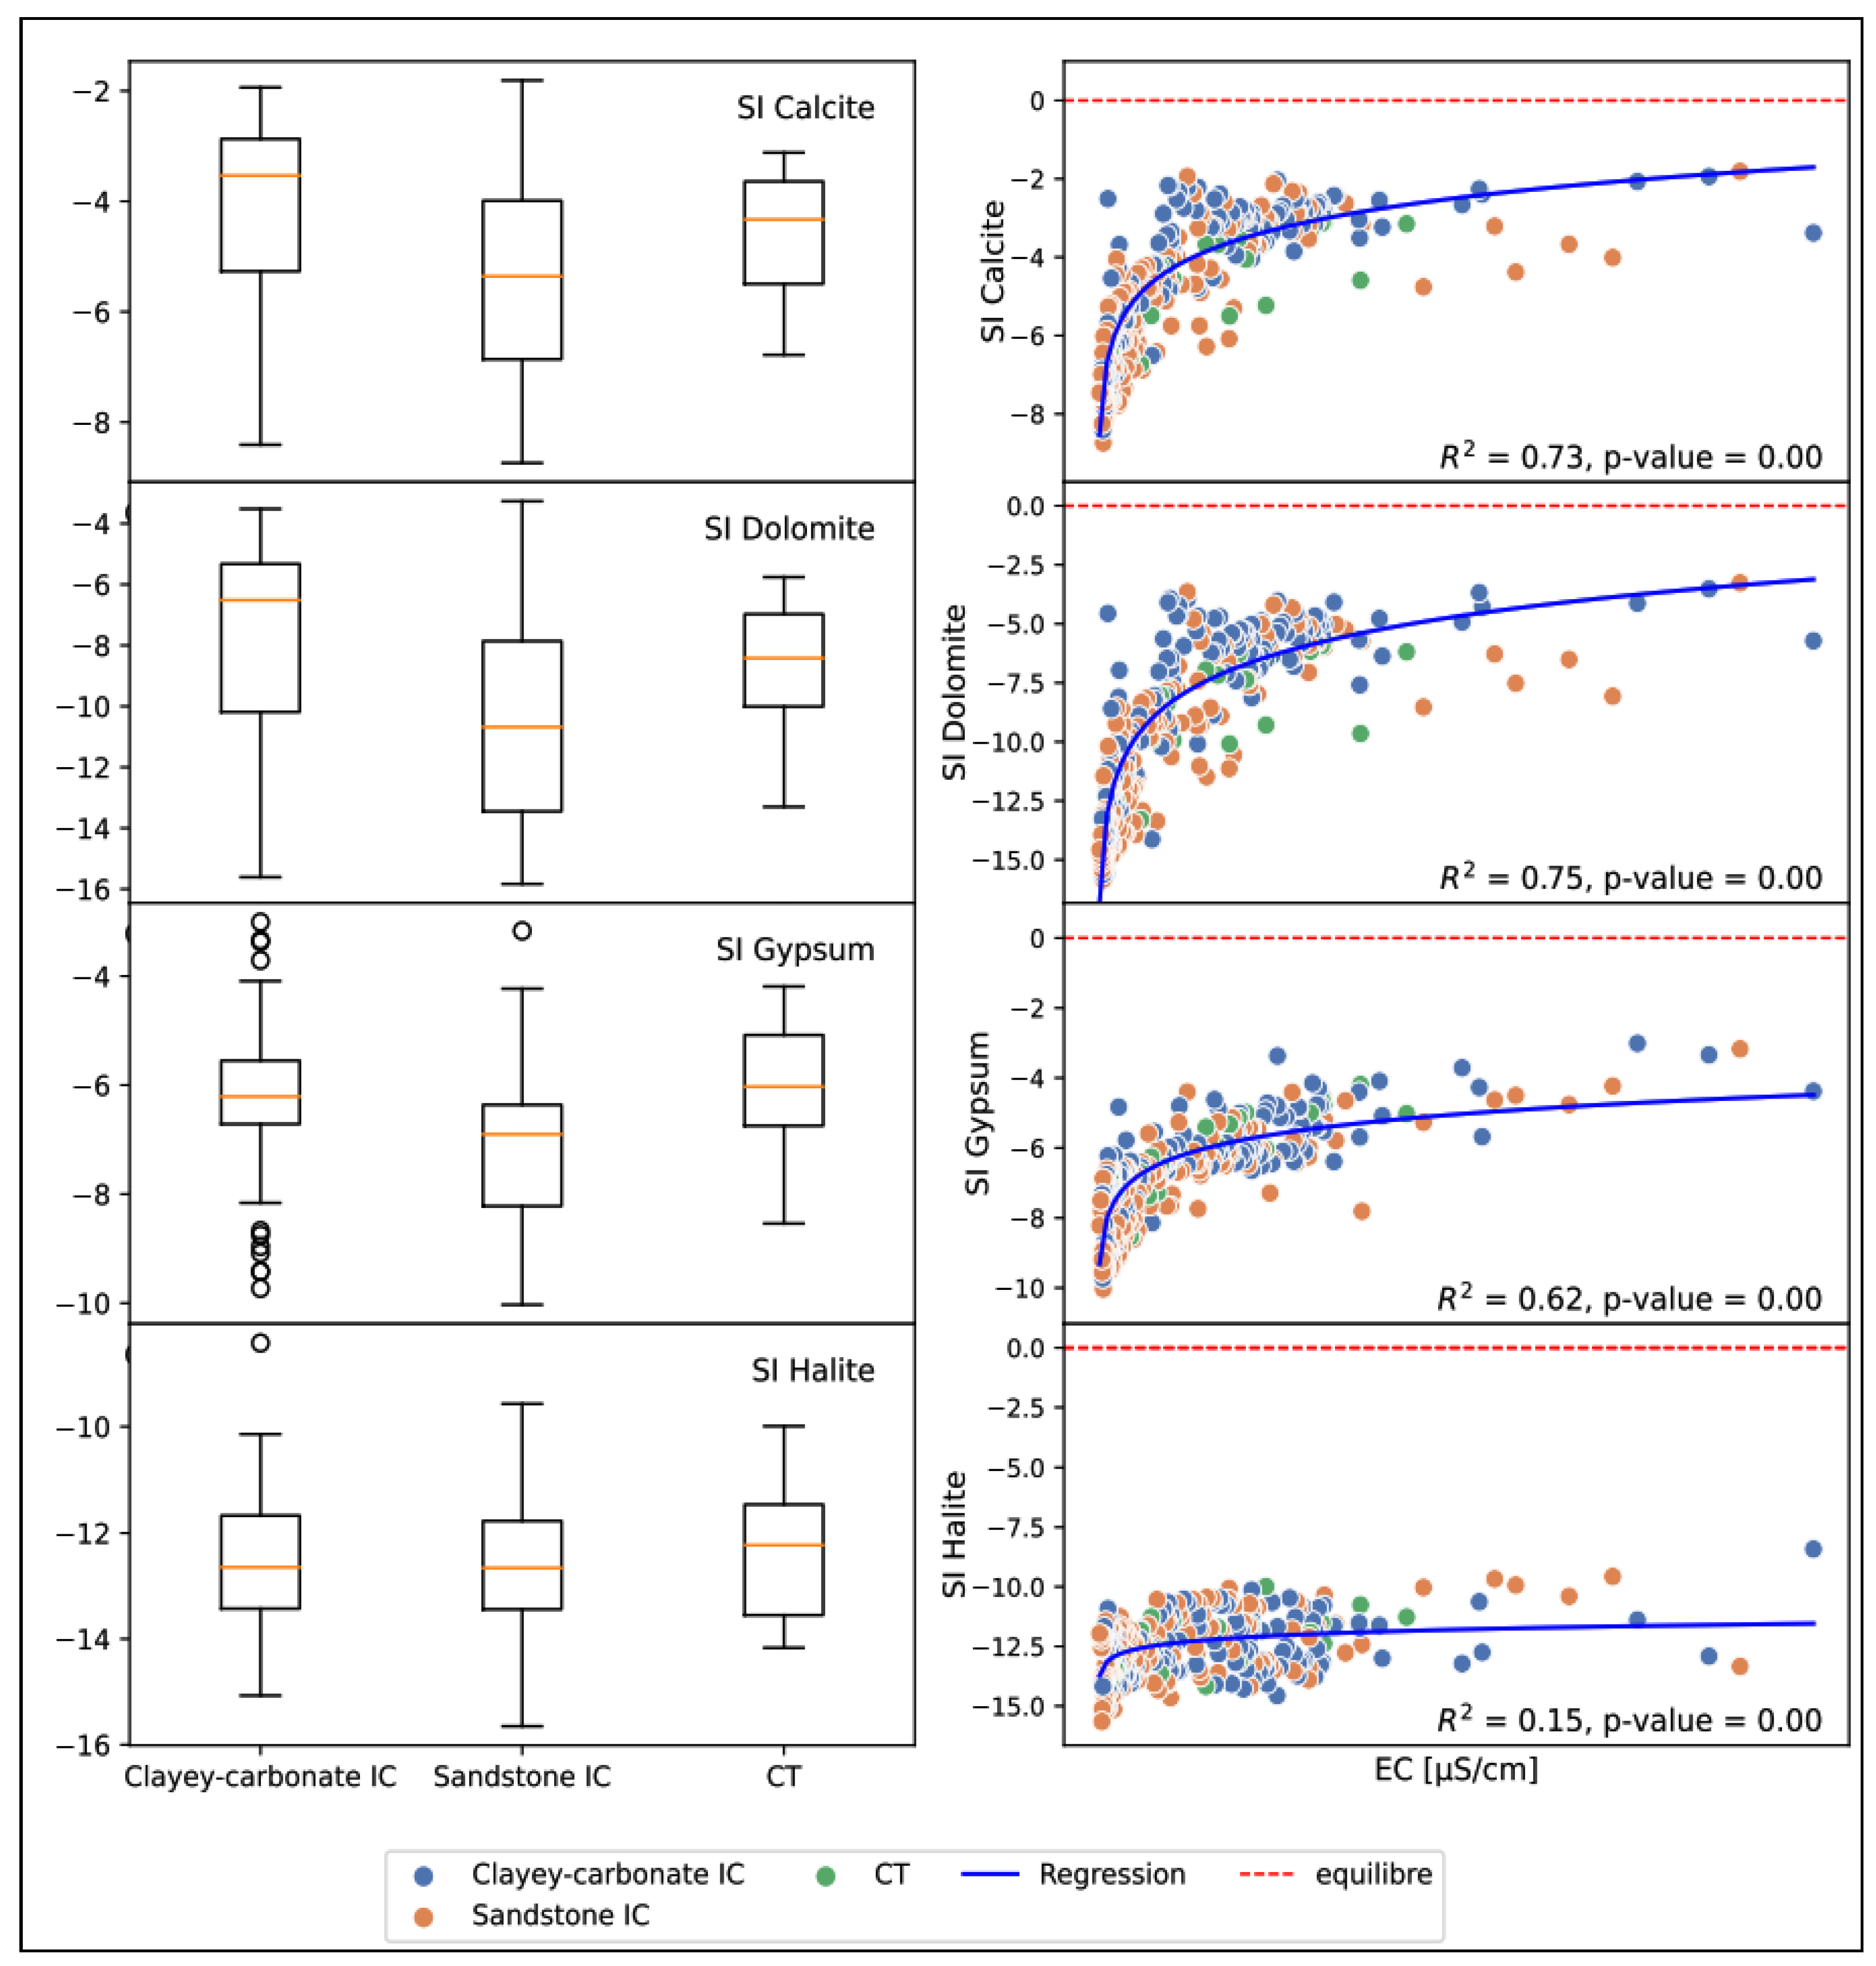
The binary diagrams between a few ions, including calcium, magnesium, sulfate, bicarbonate, sodium, and chlorine, for the three reservoirs categorized above (Figure 12, Figure 13 and Figure 14) combined with mineral saturation indices (Figure 15) help to clarify the processes responsible for groundwater mineralization:
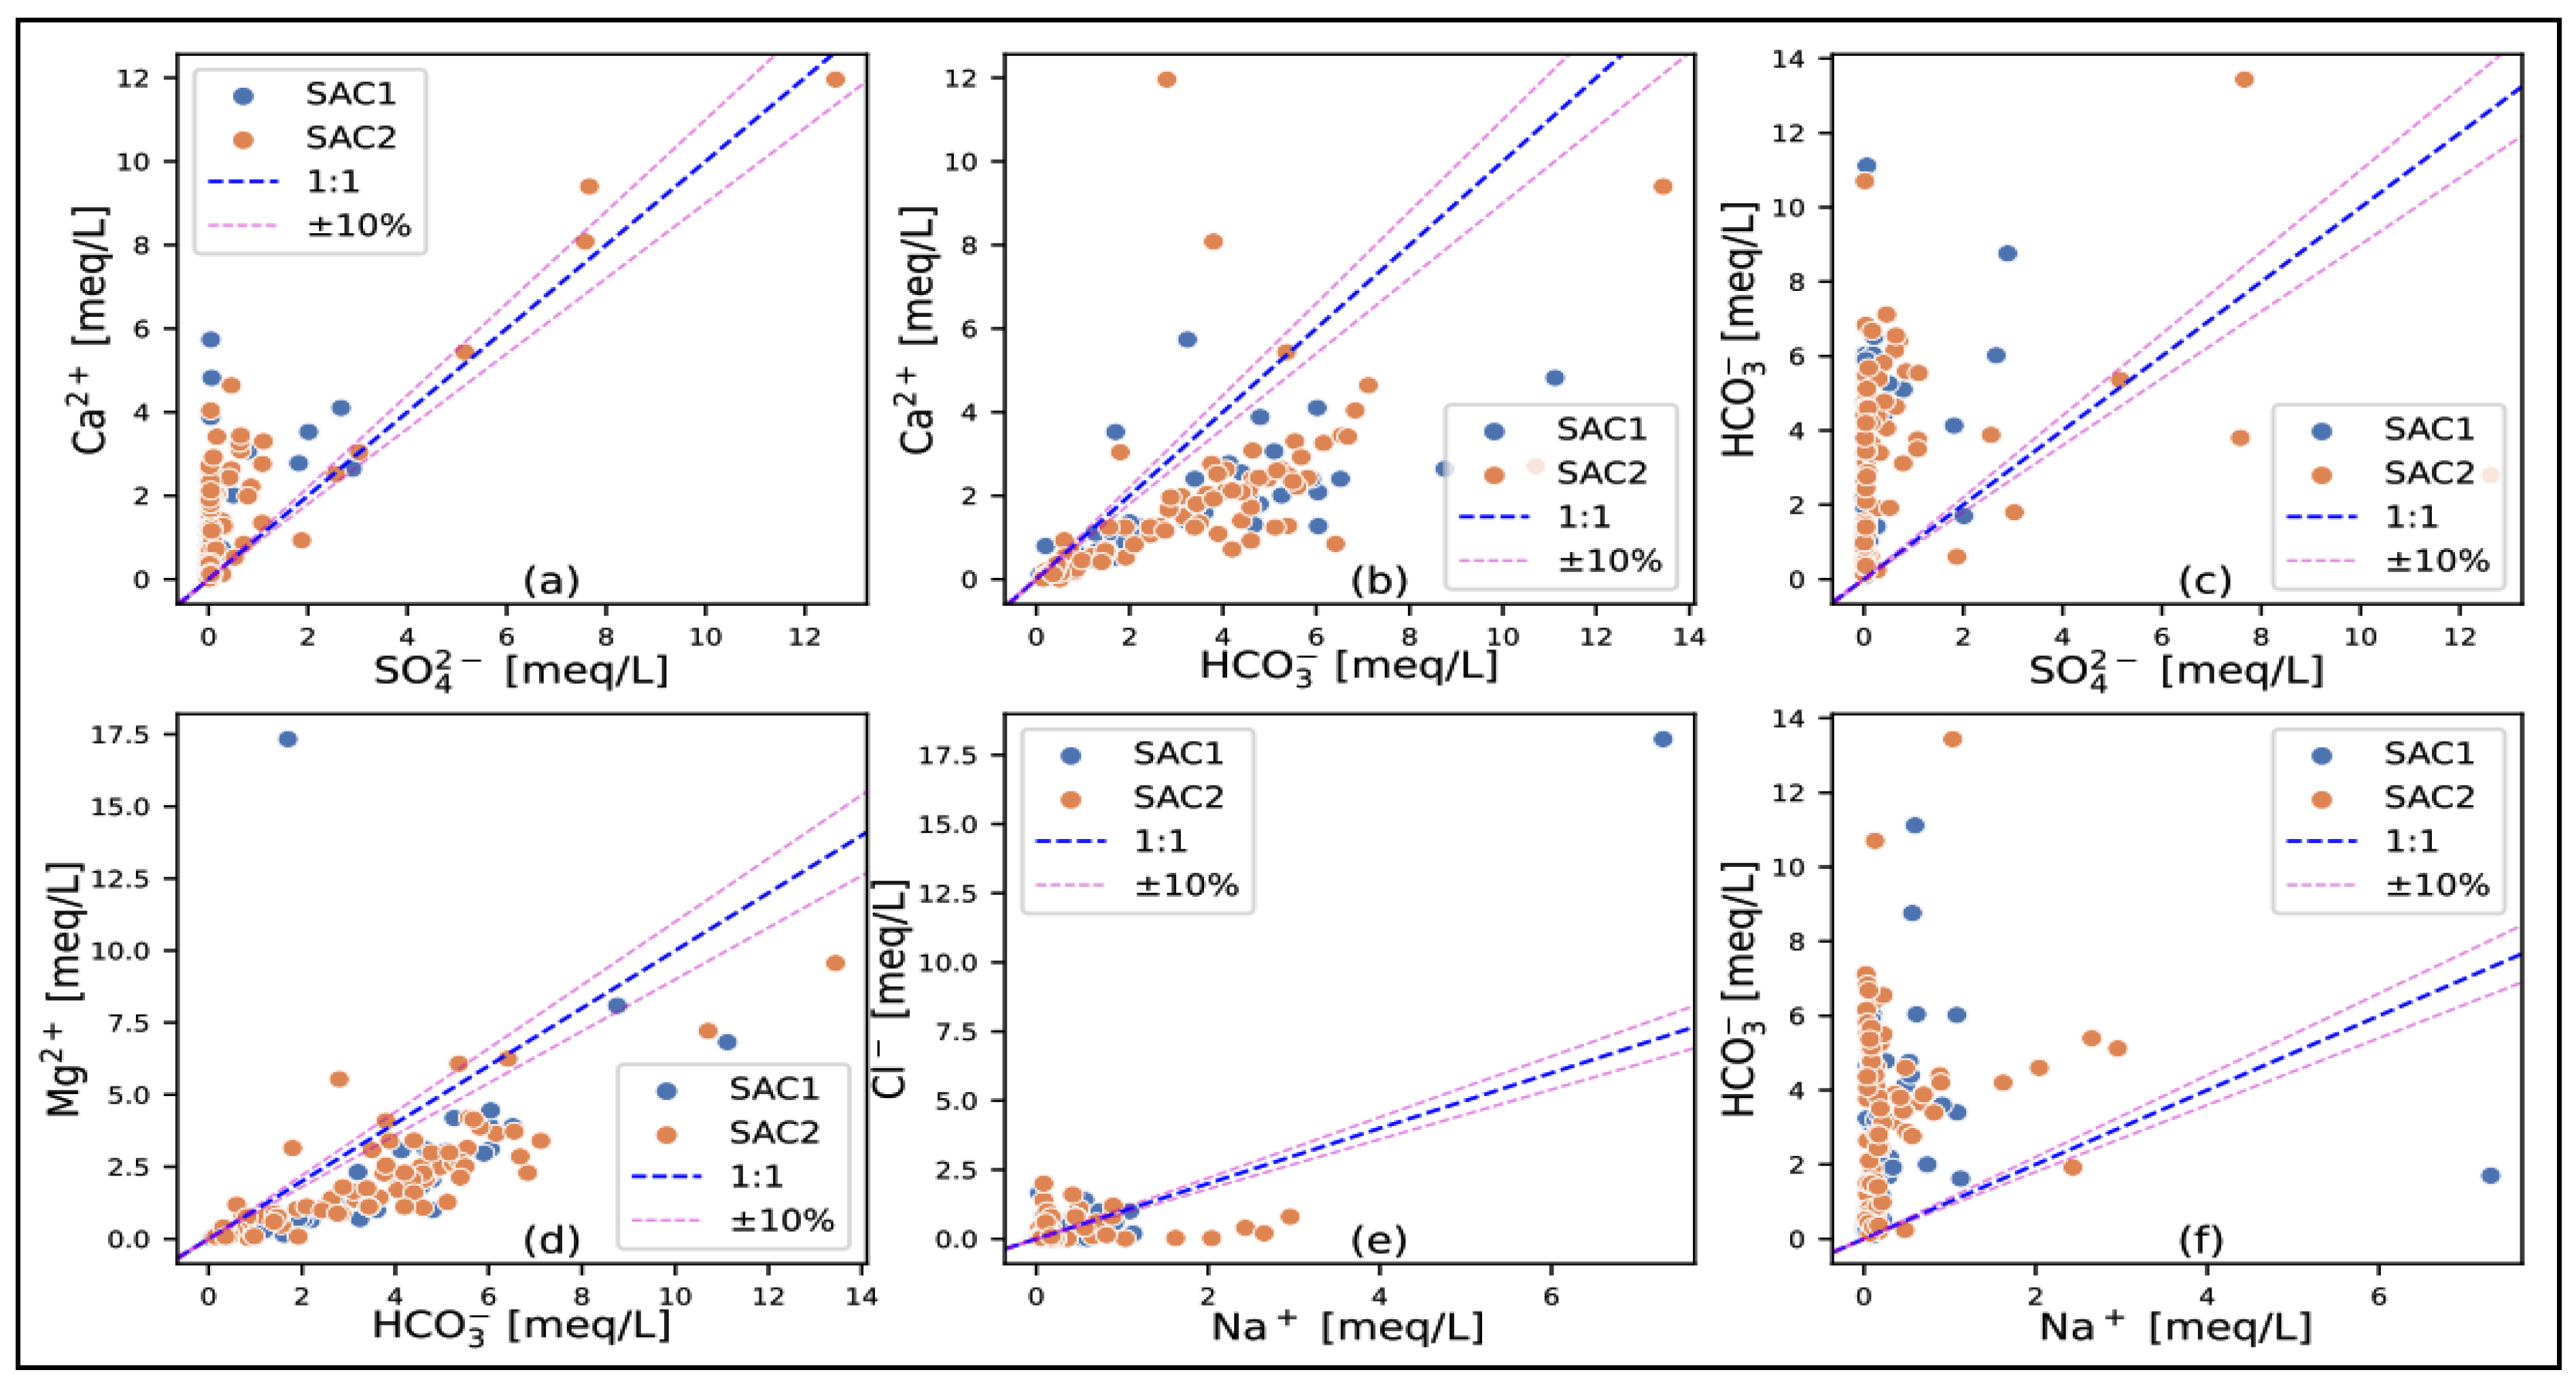
  • Evaporitic dissolution: In all three reservoirs, calcium and bicarbonate are generally more abundant than sulfate (Figure 12a,c, Figure 13a,c and Figure 14a,c). However, there are a few samples, mainly from the carbonate and sandstone-carbonate reservoirs of the CT, which are in the equilibrium zone. This indicates that the gypsum (or anhydrite) dissolution process is present but less significant. This may be supported by a general undersaturation to gypsum, with some high values observed in the formations mentioned above due to the presence of gypsum in the SAC1 and SAC2 formations. In terms of halite dissolution, sodium is more abundant than chlorine in the IC sandstone and CT sandstone-carbonate reservoirs, with a few points on the equilibrium line in the IC sandstone formations (Figure 12e and Figure 14e). For the carbonate formations (Figure 13e), we find roughly the same quantities on either side of the equilibrium line, with points also located on the line. The high halite undersaturation observed in all the formations indicates that the presence of halite is not due to the evaporitic dissolution of halite but rather to anthropogenic input, particularly in the shallows where water evaporation contributes to increasing sodium concentration.
  • Carbonate dissolution: The diagrams C a 2 + H C O 3 and M g 2 + H C O 3 show the contribution of carbonate dissolution (calcite, dolomite) to water mineralization. The sandstone IC (Figure 12b,d) shows little influence of carbonate dissolution on water mineralization, with calcium and magnesium coming more from other mechanisms (silicate hydrolysis, cation exchange) than from carbonate dissolution. Clay-carbonate IC (Figure 13b,d) and CT (Figure 14b,d) show a significant contribution of carbonate dissolution to water mineralization. These findings are confirmed by the saturation indices for dolomite and calcite; the waters in general show a slight undersaturation of these two indices. It should be noted, however, that the clay-carbonate IC and the CT have higher average contents than the sandstone IC.
  • Cation exchange: The diagram N a ± H C O 3 shows the same trend for all three reservoir types (Figure 12f, Figure 13f and Figure 14f). We note that the points are more toward the bicarbonate pole and only a few toward the sodium pole, marking here the cation exchange mechanism. This diagram shows that silicate hydrolysis remains the major process responsible for groundwater mineralization.
All the results presented so far point to the hypothesis that mineralization is essentially caused by the hydrolysis of silicates, followed by the dissolution of carbonates. To obtain better insight into the role of these two processes in the groundwater composition, we have used the binary diagram C a 2 + + M g 2 +   v s . H C O 3 + S O 4 2   (Figure 16). It shows the following:
  • In the sandstone aquifer (IC), most water samples plot close to and below the equilibrium line, tending toward the H C O 3 S O 4 2 pole side. This suggests silicate hydrolysis as the dominant process governing their chemistry. However, the presence of a few samples above the line indicates that carbonate dissolution can also play a secondary role in influencing the water composition of these specific samples.
  • In the case of the clay-carbonate IC, the number of samples on either side of the equilibrium line is roughly the same, indicating that silicate hydrolysis and carbonate dissolution are the two major processes controlling water mineralization.
  • For the CT, most water samples are located near and above the equilibrium line on the C a 2 + + M g 2 + . This indicates that dissolution of carbonate rocks is the main hydrochemical process in the system, followed by the hydrolysis of silicates.
  • In the CT formation, water samples primarily cluster near and above the equilibrium line. This distribution suggests that carbonate rock dissolution is the dominant hydrogeochemical process, with silicate hydrolysis playing a secondary role.
For all three reservoirs, and mainly for the clay-carbonate CI and the CT, there are a few samples with excess calcium and magnesium, which may be the result of other processes, such as cation exchange reactions.

5.3. Groundwater Renewal

A study of the ranges and isotopic contents formation by formation (Figure 10a,b), as well as the average values (Table 6) of the groundwater (−29.21‰ for deuterium and −4.66‰ for oxygen-18) compared with rainwater (−24.82‰ for deuterium and −4.30‰ for oxygen-18), informs us that the groundwater isotopic contents are therefore within the range of the rainfall contents and slightly more depleted than rainwater and surface water. Given the current climatic conditions, the hypothesis of current infiltration without evaporation must be rejected. Rather, it would be water infiltrated at a time when the climatic conditions were more favorable; in this case, a wetter and less hot climate than at present in the Sahel (around 10–12 k years BP according to [10] or 4–4.5 k years according to [23]). Surface water is naturally more enriched than rainwater due to evaporation, and it lines up along a straight line with a slope of 4.67 (Figure 11), which is the evaporation line close to that obtained by [5] for the Malian and Burkinabe parts of the Taoudéni Basin.
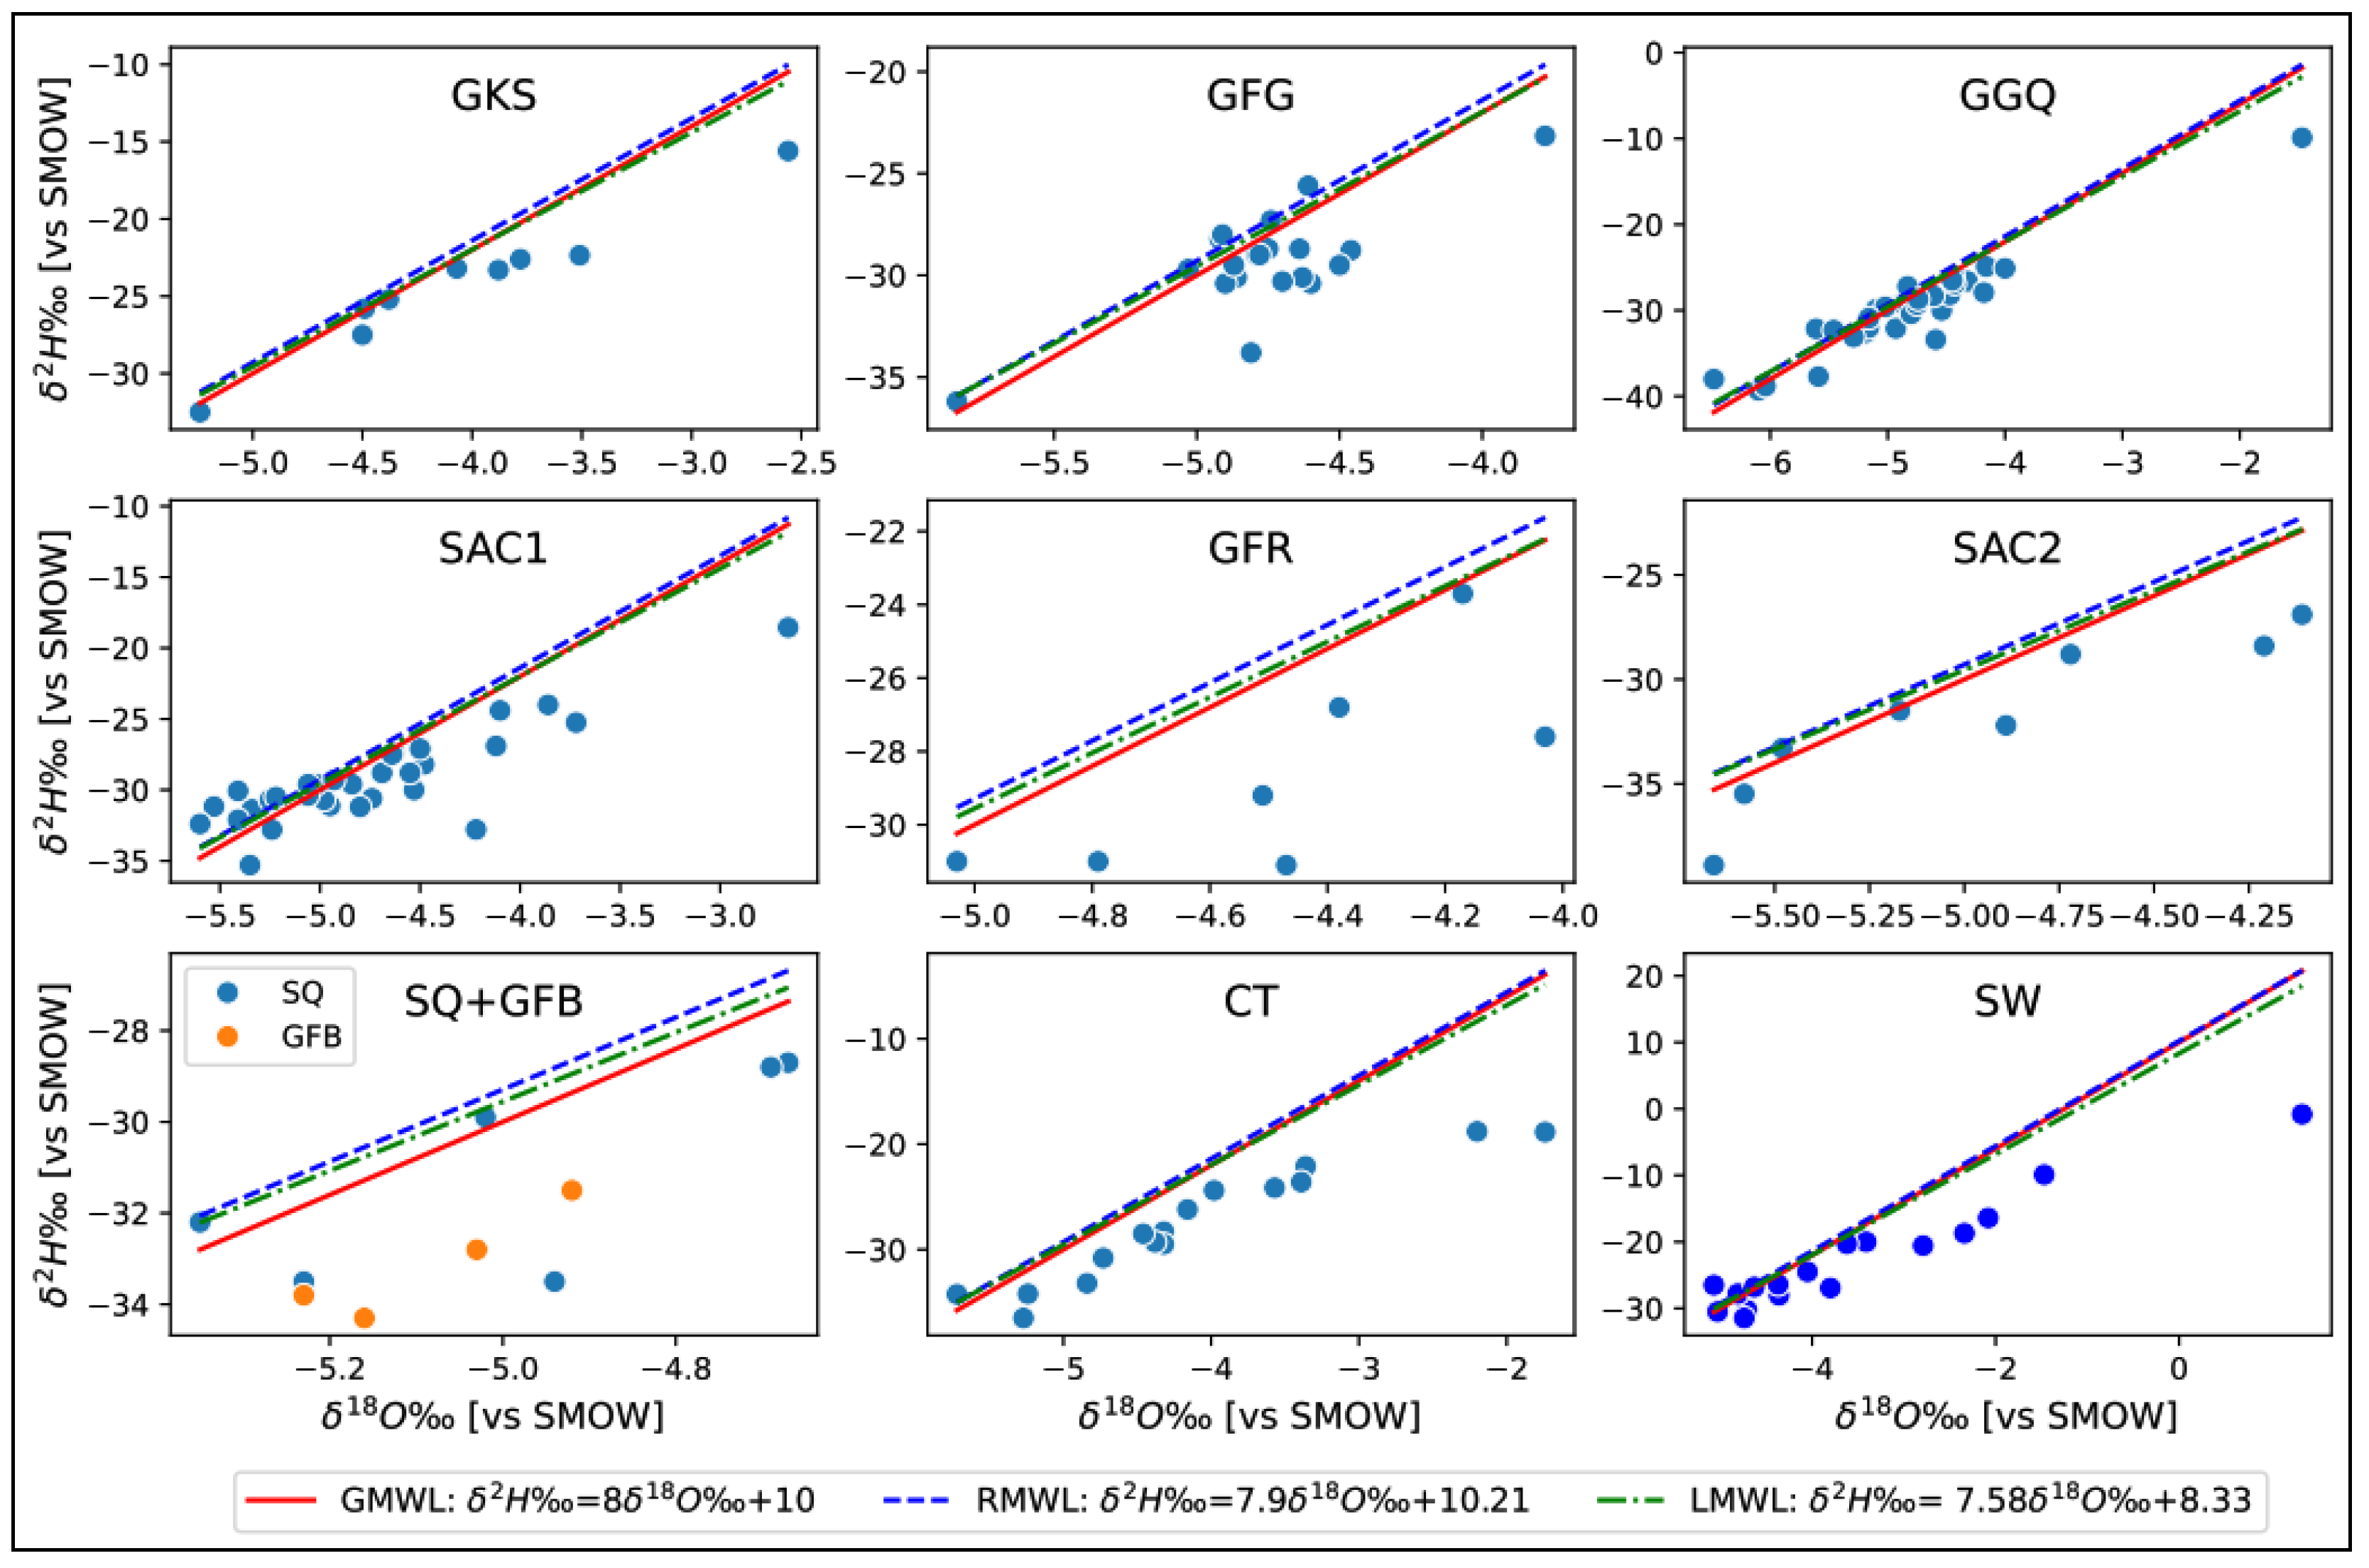
A study of the relationship between oxygen-18 and deuterium for each lithology sampled (Figure 17) provides a better understanding of the conceptual flow model in the study area. This shows that, for the deepest formations, there are a few points above the meteoric line (GKS, GFG, GGK and SAC1) and many points below the meteoric line that are a little closer to it. These points correspond, respectively, to current infiltrated water (with a deuterium excess of between 10 and 13) and water mixed with old water as confirmed by the profile of isotopic contents and electrical conductivity along the flow direction obtained by piezometry (Figure 5 and Figure 6).
In fact, these four formations are found in the water table’s recharge area. For the other, more recent formations, the points move further and further away from the meteoric line, indicating that these are waters originating from the paleorecharge. The mixing of present-day and ancient water could also be explained by the presence of faults in this zone, which would help to establish hydraulic continuity between the surface and the underground.
There are two main categories of water:
  • Water below the global meteoric line: This is deep water from a paleorecharge. They account for 80% of samples.
  • Water located above the meteoric line: This water is mainly located at the level of the piezometric dome and is mostly superficial. This is water from current recharges, representing 20% of samples.
Between the two types of water are those resulting from the mixing of old and new water.
Similar results have been obtained by [66] for the Karoo Basin in South Africa, by [67] for the Gafsa Basin in Tunisia and by [68] for the North American Sedimentary Basin. Previous work by [1] using carbon-14 and tritium dating found relatively very high ages for the waters of this basin.
Concerning tritium, current levels in the environment make it possible to distinguish between ancient and recent waters according to the following intervals [22]:
  • Contains less than 0.30 TU: These are ancient waters from deep aquifers.
  • Contents between 0.30 and 3 TU: These are waters resulting from a mixture of old and young waters.
  • Content over 3 TU: This refers to water from current recharge.
Indeed, work by the French nuclear safety authority (Autorité de Sûreté Nucléaire) indicates that the disappearance of tritium of thermonuclear origin began in the 2000s and that by 2007 only around 7%, or 40 kg, of the 560 kg of tritium released into the environment during nuclear testing in the 1950s and 1960s remained [26,69]. This justifies the above ranges, based on recent work by [22]:
So, for the study area, the results are as follows:
  • Old water accounts for 12% of the samples collected.
  • Mixed water accounts for 74% of the samples collected.
  • And recent waters account for 14% of the samples collected.
Comparing these results with those from stable isotopes, it appears that a significant proportion of waters previously identified as ancient by stable isotopes are now categorized as mixed waters when tritium is used. This disparity seems to stem from the decrease in the tritium content in the environment, making the detection of old water more delicate. Spatialization of these results yields a map of the relative age of the groundwater for the period 2013 to 2022 (Figure 18).
This map illustrates the conclusions drawn from the natural isotope data, showing that we are dealing with predominantly old water with a contribution from recent recharge. Recent recharge appears to be more associated with localized recharge mechanisms, indicating that diffuse recharge is less significant [70,71]. This justifies the overall low renewal rate obtained. These results differ from those obtained by [5] but are more in line with those of [1]. The difference with [5] stems from the latter’s failure to take into account the evolving nature of the tritium thresholds in the atmosphere. In fact, he used a threshold of 1 TU as the detection limit for ancient waters, in reference to [63], whereas this threshold has dropped significantly (0.3 TU) according to recent work by [22] based on North America’s data or 0.5 TU in Korea according to [72]. It is expected to be lower for the African region due to the hemispheric difference [69].
Other work carried out in a portion of the study area (the Kou Basin) indicates a decrease in the flow of springs [2]. This decline is linked to the large-scale extractions carried out by the national service in charge of water supply and sanitation, the “ONEA” (“Office National de l’Eau et Assainissement”), on the one hand, but also to low recharge in general. Although rainfall records show an upward trend, temperatures and evapotranspiration are also following the same trend, which does not necessarily contribute to a remarkable increase in recharge. Work on the diagnosis of Burkina’s water resources conducted by the World Bank in 2017 found a renewal rate of 2% for the study area [3].
These results raise questions about the management of this resource. If we continue to exploit this water, which renews itself very slowly, we are heading for the water table to dry up. Possible solutions should consider, among other things, the integrated management of water resources and the monitoring and surveillance of groundwater quantity and quality. Quality must also be considered due to recent recharge, even if it is minimal. This recharge implies anthropogenic inputs highlighted in this work, as evidenced by localized pollution in formations such as “SAC1”, “SAC2”, “GFR”, “GGQ”, and “GKS”. Therefore, it is vital to acknowledge growing concerns about human impacts on groundwater. The highlighted pollution incidents underscore the need for comprehensive groundwater management. Further investigations, including nitrogen-15 isotope analysis, mapping of vulnerability and susceptibility to pollution, and solute transport modeling, are crucial for understanding the contamination sources, aiding in identifying the contamination hotspots and establishing protection zones for sustainable groundwater use [7,73,74].
Furthermore, it has been observed that tritium’s effectiveness as a tracer for old groundwater decreases due to its natural atmospheric decay and the low level of thermonuclear tritium in current precipitation [26,69]. Considering tritium’s 12.3-year half-life, a significant portion of the rainwater samples collected in this study fall within the range of mixed or old groundwater. This is because some samples date back to 2010, with tritium levels below 5.37 TU (Table 6), indicating current tritium levels of less than 2.5 TU due to radioactive decay, which is not the case here. This presents a challenge for hydrologists using this technique to date old groundwater. The reduced sensitivity limits the detection and quantification of tritium in older groundwater. Despite these limitations, tritium remains useful for hydrogeological investigations, especially when combined with other dating techniques. For this study, further analysis of individual samples, considering lithology and comparing tritium with oxygen-18, could provide a more detailed understanding of the relative age of the groundwater [21,75]. Ongoing research into methods like noble gas isotopes and radiocarbon dating offers promising prospects [76,77,78].

5.4. Aquifer’s Discrimination

All the results obtained above pave the way for an initial attempt to distinguish the waters of the study area basin into several aquifers. Based solely on the lithology, hydrogeochemistry and isotopy, the waters of the Taoudéni Basin can be grouped into six aquifers, presented from the top to the bottom in Table 7:
This hydrogeochemical discrimination differs from that established by [79], which relied on geological and hydrogeological data from the Kou Basin, a portion of the study area (1823 km2 of 42,000 km2). According to this study, the formations cropping out in this area, including GKS, GFG, GGQ, and SAC1, reveal the presence of two distinct aquifers: the GKS aquifer and the GFG-GGQ-SAC1 aquifer. These results need to be supplemented by other tools, such as hydraulic test data, geophysical tools, and in particular, seismic methods, to verify this hypothesis and deepen our understanding of the hydrodynamics. In particular, the use of seismic methods will enable us to highlight and more precisely delineate the various aquifers present in the study area.

6. Conclusions

In this study, hydrogeochemical and isotopic tools were used to understand the groundwater flow patterns and mineralization processes in Burkina Faso’s Taoudéni Basin.
In terms of the mineralization mechanisms, the facies study was complemented by binary diagrams and saturation indices. Silicate hydrolysis, carbonate dissolution, and anthropogenic input were identified as major contributors, with silicate hydrolysis being predominant due to the presence of silicate minerals. Carbonate dissolution is significant in clay-carbonate reservoirs. The anthropogenic influence, marked by sulfated chloride facies, indicates current recharge, with minor roles for evaporitic dissolution and cation exchange.
Regarding the hydrodynamics, examination of the physico-chemical parameters, with a particular emphasis on the spatialization of the electrical conductivity, revealed a mineralization trend consistent with the defined flow direction. This conclusion is also supported by the spatial evolution of the hydrochemical facies and stable isotope content. In addition, the conclusions drawn from hydrochemical facies and binary diagrams enabled us to differentiate the waters into several distinct aquifers.
Concerning the groundwater renewal, stable isotope statistics suggested recharge at a time less prone to evaporation, probably during a wetter, cooler Sahel climate (over 4.5 kyr B.P.). Tritium content analysis confirmed the presence of ancient, mixed waters in the study area. The analysis of the deuterium–oxygen 18 relationship and the spatial mapping of stable isotopes in relation to piezometry have attempted to discriminate aquifers on the one hand and to validate the direction of flow on the other. In fact, depending on the direction of flow and from top to bottom according to the lithological scale, the water flows further and further below the meteoric line, which means that the age of the water increases with the depth and direction of the flow. This study also raises questions about the relevance of using tritium to detect old water, given its decay in the atmosphere.

Supplementary Materials

The following supporting information can be downloaded at https://www.mdpi.com/article/10.3390/w16131922/s1, Table S1: Isotopic content of groundwater in the study area.

Author Contributions

Conceptualization, M.K. and S.M.K.; methodology, S.M.K. and M.K.; validation, M.K.; formal analysis, S.M.K.; investigation, S.M.K. and M.O.; resources, M.K.; data curation, S.M.K., M.K. and M.B.K.; writing—original draft preparation, S.M.K.; writing—review and editing, S.M.K., M.B.K., M.K., R.Y. and A.K.; visualization, L.A.M., R.Y. and A.K.; supervision, M.K.; project administration, M.K.; funding acquisition, M.K. All authors have read and agreed to the published version of the manuscript.

Funding

This study received support from the World Bank through the African Center of Excellence Project-Impact (ACE-Impact) with grant number IDA 6388-BF/D443. The isotopic analyses were funded by the International Atomic Energy Agency (IAEA) in cooperation with Burkina Faso’s General Office of Water Resources (Direction Générale des Ressources en Eau) in the framework of the RAF 7019 IAEA project.

Data Availability Statement

The data presented in this study are available in article.

Acknowledgments

This study was conducted as part of the regional project RAF 7019 of the International Atomic Energy Agency focusing on “Adding groundwater dimension in the understanding and the management of shared water resources in the Sahel Region (Case of the Taoudéni Basin)”. It involved most of countries concerned by the Taoudéni Basin. In Burkina Faso, the project was led by the General Directorate of Water Resources (DGRE). We would like to thank Gerard Zongo, the focal point of project RAF 7019 at DGRE, and Cheick Ouattara, the head of the DGRE laboratory, for their technical support.

Conflicts of Interest

The authors declare no conflicts of interest.

References

  1. Dakoure, D. Etude Hydrogéologique et Géochimique de La Bordure Sud-Est Du Bassin de Taoudéni (Burkina Faso-Mali)-Essai de Modélisation. Ph.D. Dissertation, Université Paris VI-Pierre et Marie Curie, Paris, France, 2003. [Google Scholar]
  2. Tirogo, J.; Jost, A.; Biaou, A.; Valdes-Lao, D.; Koussoubé, Y.; Ribstein, P.; Tirogo, J.; Jost, A.; Biaou, A.; Valdes-Lao, D.; et al. Climate Variability and Groundwater Response: A Case Study in Burkina Faso (West Africa). Water 2016, 8, 171. [Google Scholar] [CrossRef]
  3. Gramont, H.M.D.; Savadogo, A.N.; Dakoure, D. Amélioration de la Connaissance et de la Gestion des Eaux au Burkina Faso. P162723. Annexe 1: Diagnostic sur les Eaux Souterraines; La Banque Mondiale: Washington, DC, USA, 2017. [Google Scholar]
  4. AIEA. Adding the Groundwater Dimension to the Understanding and Management of Shared Water Resources in the Sahel Region; Vienna International Centre: Vienna, Austria, 2018. [Google Scholar]
  5. Kouanda, B. Modélisation Intégrée Du Complexe Mouhoun Supérieur-Sourou Dans Le Contexte Des Changements Climatiques. Ph.D. Dissertation, Institut International d’Ingénierie de l’Eau et de l’Environnement (2iE), Ouagadougou, Burkina Faso, 2019. [Google Scholar]
  6. Tirogo, Y.J. Etude Du Fonctionnement Hydrodynamique de l’aquifère Sédimentaire Du Bassin de Kou Au Sud-Ouest Du Burkina Faso. Ph.D. Dissertation, Institut International d’Ingénierie de l’Eau et de l’Environnement (2iE)-Université Pierre et Marie Curie (UPMC), Paris, France, 2016. [Google Scholar]
  7. Khan, M.Y.A.; El Kashouty, M.; Gusti, W.; Kumar, A.; Subyani, A.M.; Alshehri, A. Geo-Temporal Signatures of Physicochemical and Heavy Metals Pollution in Groundwater of Khulais Region—Makkah Province, Saudi Arabia. Front. Environ. Sci. 2022, 9, 800517. [Google Scholar] [CrossRef]
  8. Bhat, M.A.; Zhong, J.; Dar, T.; Kumar, A.; Li, S.-L. Spatial Distribution of Stable Isotopes in Surface Water on the Upper Indus River Basin (UIRB): Implications for Moisture Source and Paleoelevation Reconstruction. Appl. Geochem. 2022, 136, 105137. [Google Scholar] [CrossRef]
  9. Krishan, G.; Rao, M.S.; Vashisht, R.; Chaudhary, A.; Singh, J.; Kumar, A. Isotopic Assessment of Groundwater Salinity: A Case Study of the Southwest (SW) Region of Punjab, India. Water 2022, 14, 133. [Google Scholar] [CrossRef]
  10. Sandao, I.; Babaye, M.S.A.; Ousmane, B.; Michelot, J.L. Apports Des Isotopes Naturels de l’eau à La Caractérisation Des Mécanismes de Recharge Des Aquifères Du Bassin de La Korama, Région de Zinder, Niger. Int. J. Biol. Chem. Sci. 2018, 12, 1931–1954. [Google Scholar] [CrossRef]
  11. Fang, C.; Sun, S.; Jia, S.; Li, Y. Groundwater Level Analysis Using Regional Kendall Test for Trend with Spatial Autocorrelation. Groundwater 2019, 57, 320–328. [Google Scholar] [CrossRef] [PubMed]
  12. Murhula, E.M.; Kutangila, S.M.; Bihenjira, E.M.; Muyisa, S.K. Hydrogéochimie et susceptibilité à la contamination des eaux souterraines dans le secteur de Panzi, ville de Bukavu, RD Congo (Hydrogeochemistry and susceptibility to groundwater contamination in the Panzi sector, Bukavu City, DR Congo). Geo-Eco-Trop 2019, 43, 197–209. [Google Scholar]
  13. Bäumle, R.; Himmelsbach, T.; Noell, U. Hydrogeology and Geochemistry of a Tectonically Controlled, Deep-Seated and Semi-Fossil Aquifer in the Zambezi Region (Namibia). Hydrogeol. J. 2019, 27, 885–914. [Google Scholar] [CrossRef]
  14. Mokhtar, K.; Boualem, B.; Layachi, G. Hydrochemical Characterization and Water Quality of the Continental Intercalare Aquifer in the Ghardaïa Region (Algerian Sahara). J. Ecol. Eng. 2021, 22, 152–162. [Google Scholar] [CrossRef]
  15. Rahal, O.; Gouaidia, L.; Fidelibus, M.D.; Marchina, C.; Natali, C.; Bianchini, G. Hydrogeological and Geochemical Characterization of Groundwater in the F’Kirina Plain (Eastern Algeria). Appl. Geochem. 2021, 130, 104983. [Google Scholar] [CrossRef]
  16. Kamal, S.; Sefiani, S.; Laftouhi, N.-E.; El Mandour, A.; Moustadraf, J.; Elgettafi, M.; Himi, M.; Casas, A. Hydrochemical and Isotopic Assessment for Characterizing Groundwater Quality and Recharge Processes under a Semi Arid Area: Case of the Haouz Plain Aquifer (Central Morocco). J. Afr. Earth Sci. 2021, 174, 104077. [Google Scholar] [CrossRef]
  17. Hakimi, Y.; Orban, P.; Deschamps, P.; Brouyere, S. Hydrochemical and Isotopic Characteristics of Groundwater in the Continental Intercalaire Aquifer System: Insights from Mzab Ridge and Surrounding Regions, North of the Algerian Sahara. J. Hydrol. Reg. Stud. 2021, 34, 100791. [Google Scholar] [CrossRef]
  18. Allen, S.T.; Sprenger, M.; Bowen, G.J.; Brooks, J.R. Spatial and Temporal Variations in Plant Source Water. In Stable Isotopes in Tree Rings: Inferring Physiological, Climatic and Environmental Responses; Springer International Publishing: Cham, Switzerland, 2022; pp. 501–535. [Google Scholar]
  19. Fantong, W.Y.; Chounna, G.; Nenkam, T.L.L.J.; Fouepe, A.T.; Fru, E.C.; Vassolo, S.; Montcoudiol, N.; Fodoue, Y.; Haman, J.B.D.; Carlier, C.; et al. Hydrogeochemistry of Low Agricultural Soil Yield in Sahelian and Sub-Tropical Watersheds, Northern Cameroon. J. Afr. Earth Sci. 2023, 199, 104823. [Google Scholar] [CrossRef]
  20. Javed, T.; Ahmad, N.; Ahmad, S.R. Coupling Hydrogeochemistry and Stable Isotopes (δ2H, δ18O and δ13C) to Identify Factors Affecting Arsenic Enrichment of Surface Water and Groundwater in Precambrian Sedimentary Rocks, Eastern Salt Range, Punjab, Pakistan. Environ. Geochem. Health 2023, 45, 6643–6673. [Google Scholar] [CrossRef] [PubMed]
  21. Zouari, K.; Trabelsi, R.; Araguás Araguás, L.L.; Hussaini, S.; Rabe, S.; Alassane, A. Use of Hydrochemical and Isotopic Tracers to Investigate the Groundwater Quality and Recharge Processes of the Shared Iullemeden Aquifer System in the Sahel Region (Western Africa). Hydrogeol. J. 2024, 32, 219–240. [Google Scholar] [CrossRef]
  22. Lindsey, B.D.; Jurgens, B.C.; Belitz, K. Tritium as an Indicator of Modern, Mixed, and Premodern Groundwater Age; US Geological Survey: Reston, VA, USA, 2019.
  23. Huneau, F.; Dakoure, D.; Celle-Jeanton, H.; Vitvar, T.; Ito, M.; Traore, S.; Compaore, N.F.; Jirakova, H.; Le Coustumer, P. Flow Pattern and Residence Time of Groundwater within the South-Eastern Taoudeni Sedimentary Basin (Burkina Faso, Mali). J. Hydrol. 2011, 409, 423–439. [Google Scholar] [CrossRef]
  24. Taupin, J.D. Gestion Intégrée et Durable des Systèmes Aquifères et des Bassins Partagés de la Région du Sahel. RAF/7/011. Bassin de Taoudéni; AIEA: Vienne, Austria, 2017. [Google Scholar]
  25. Ouedraogo, C. Synthèse Géologique de la Région Ouest du Burkina Faso; Programme de Valorisation des Ressources en Eau de l’Ouest (P/VREO); Ministère de l’Agriculture, de l’Hydraulique et des Ressources Halieutiques: Ouagadougou, Burkina Faso, 2006.
  26. du Bois, K.; Boyer, P.; Fiévet, B.; Garnier-Laplace, J.; Gurriaran, R.; Le Dizes-Maurel, S.; Maro, D.; Masson, M.; Pierrard, O.; Renaud, P. Inventaire Des Sources de Tritium et Synthèse Bibliographique. In Livre Blanc du Tritium: Groupes de Réflexion Menés de Mai 2008 à Avril 2010 Sous l’égide de l’ASN et Bilan Annuel des Rejets de Tritium Pour les Installations Nucléaire de Base de 2015 à 2019; Autorité de Sûreté Nucléaire: Montrouge, France, 2010; pp. 44–110. [Google Scholar]
  27. Gombert, P. Synthèse sur la Géologie et l’hydrogéologie de la Formation Sédimentaire des Grès Inferieurs; 1998; p. 29. [Google Scholar]
  28. Dipama, J.M. Le Mécanisme Général de La Genèse des Pluies et Leur Répartition au Burkina-Faso; Espace Scientifique: Rennes, France, 2005. [Google Scholar]
  29. Derouane, J. Modélisation Hydrogéologique du Bassin Sédimentaire; Programme de Valorisation des Ressources en Eau de l’Ouest (VREO); Direction Générale des Ressources en Eau. Inistère de l’Agriculture, de l’Hydraulique et des Ressources Halieutiques: Ouagadougou, Burkina Faso, 2008; p. 101.
  30. Trompette, R. Le Précambrien Supérieur et le Paléozoïque Inférieur de l’Adrar de Mauritanie (Bordure Occidentale du Bassin de Taoudeni, Afrique de l’Ouest), un Exemple de Sédimentation de Craton. Étude Stratigraphique et Sédimentologique—TOME 2 (Séries 2 et 3). Ph.D. Thesis, Université de Provence—Aix-Marseille I, Marseille, France, 1973. [Google Scholar]
  31. Bronner, G.; Roussel, J.; Trompette, R.; Clauer, N. Genesis and Geodynamic Evolution of the Taoudeni Cratonic Basin (Upper Precambrian and Paleozoic), Western Africa. Dyn. Plate Inter. 1980, 1, 81–90. [Google Scholar]
  32. Ouedraogo, C. Étude Géologique des Formations Sédimentaires du Bassin Précambrien Supérieur et Paléozoïque de Taoudéni en Haute-Volta. Ph.D. Thesis, Laboratoire de pétrologie de la surface, Université de Poitiers, Poitiers, France, 1983. [Google Scholar]
  33. Kruserman, G.; de Ridder, N. Analysis and Evaluation of Pumping Test Data, 2nd ed.; International Institute for Land Reclamation and Improvement (ILRI); Veenman drukers: Wageningen, The Netherlands, 1994. [Google Scholar]
  34. Castaing, C.; Metour, J.L.; Billa, M.; Donzeau, P.; Chevremont, P.; Egal, E.; Zida, B. Carte Géologique et Minière du Burkina à 1/1 000 000 du Burkina Faso; BRGM: Ouagadougou, Burkina Faso, 2003. [Google Scholar]
  35. Appelo, C.A.J.; Postma, D. Geochemistry, Groundwater and Pollution; CRC Press: Boca Raton, FL, USA, 2004. [Google Scholar]
  36. Sundaram, B.; Feitz, A.J.; de Caritat, P.; Plazinska, A.; Brodie, R.S.; Coram, J.; Ransley, T. Groundwater Sampling and Analysis—A Field Guide. Geosci. Aust. Rec. 2009, 27, 104. [Google Scholar]
  37. Mouhri, A.; Flipo, N.; Rejiba, F.; de Fouquet, C.; Bodet, L.; Kurtulus, B.; Tallec, G.; Durand, V.; Jost, A.; Ansart, P.; et al. Designing a Multi-Scale Sampling System of Stream—Aquifer Interfaces in a Sedimentary Basin. J. Hydrol. 2013, 504, 194–206. [Google Scholar] [CrossRef]
  38. Hiscock, K.M.; Bense, V.F. Hydrogeology: Principles and Practice; John Wiley & Sons: Hoboken, NJ, USA, 2014. [Google Scholar]
  39. WHO. Guidelines for Drinking-Water Quality: Fourth Edition Incorporating First Addendum, 4th ed.; 1st add.; World Health Organization: Geneva, Switzerland, 2017; ISBN 978-92-4-154995-0. [Google Scholar]
  40. Ndembo, L. Apport des Outils Hydrogéochimiques et Isotopiques à la Gestion de l’aquifère du Mont Amba. Ph.D. Thesis, Université de Kinshasa, Université de Avignon et Pays de Vaucluse, Vaucluse, France, 2009. [Google Scholar]
  41. Asmael, N. Hydrochemistry, Isotopes and Groundwater Modeling to Characterize Multi-Layered Aquifers Flow System in the Upper Part of Awaj River—Damascus Basin (Syria). Ph.D. Dissertation, Université Michel de Montaigne, Bordeaux, France, 2015. [Google Scholar]
  42. Plummer, L.N.; Jones, B.F.; Truesdell, A.H. WATEQF—A FORTRAN IV Version of WATEQ: A Computer Program for Calculating Chemical Equilibrium of Natural Waters; Department of the Interior, Geological Survey, Water Resources Division: Reston, VA, USA, 1976.
  43. Alley, W.M. Regional Ground-Water Quality; Van Nostrand Reinhold: New York, NY, USA, 1993; ISBN 978-0-442-00937-3. [Google Scholar]
  44. Parkhust, D.; Appelo, C. User’s Guide to PHREEQC (Version 2): A Computer Program for Speciation, Batch-Reaction, One-Dimensional Transport, and Inverse Geochemical Calculations; U.S. Geological Survey, Earth Science Information Center: Reston, VA, USA, 1999.
  45. Similer, R. Diagrammes. Manuel d’Utilisation 2014. Available online: https://terre-et-eau.univ-avignon.fr/equipements-de-terrain-et-de-laboratoire/logiciels/ (accessed on 14 May 2023).
  46. Clark, I.D.; Fritz, P. Environmental Isotopes in Hydrogeology; CRC Press: Boca Raton, FL, USA, 1997. [Google Scholar]
  47. Aggarwal, P.K.; Araguás-Araguás, L.J.; Groening, M.; Kulkarni, K.M.; Kurttas, T.; Newman, B.D.; Vitvar, T. Global Hydrological Isotope Data and Data Networks. In Isoscapes: Understanding Movement, Pattern, and Process on Earth through Isotope Mapping; Springer: Berlin/Heidelberg, Germany, 2010; pp. 33–50. [Google Scholar]
  48. Cook, P. Introduction to Isotopes and Environmental Tracers as Indicators of Groundwater Flow; The Groundwater Project: Guelph, ON, Canada, 2020; ISBN 978-1-77705-418-2. [Google Scholar]
  49. Hubert, P.; Olive, P.; Ravailleau, S. Estimation pratique de l’âge des eaux souterraines par le tritium. Rev. Sci. L’eau 1996, 9, 523–533. [Google Scholar] [CrossRef]
  50. Edmunds, W.M.; Smedley, P.L. Groundwater Geochemistry and Health: An Overview. Geol. Soc. Lond. Spec. Publ. 1996, 113, 91–105. [Google Scholar] [CrossRef]
  51. Naidu, S.; Gupta, G.; Singh, R.; Tahama, K.; Erram, V.C. Hydrogeochemical Processes Regulating the Groundwater Quality and Its Suitability for Drinking and Irrigation Purpose in Parts of Coastal Sindhudurg District, Maharashtra. J. Geol. Soc. India 2021, 97, 173–185. [Google Scholar] [CrossRef]
  52. Bieupoude, G. Pascal Mapping Groundwater Intrinsic Vulnerability Using a New Physically Based Modeling in Kou Basin Bobo-Dioulasso/Burkina Faso. Ph.D. Dissertation, Institut International d’Ingénierie de l’Eau et de l’Environnement (2iE), Ouagadougou, Burkina Faso, 2008. [Google Scholar]
  53. Samara, T.; Yoxas, G. Drastic Method to Map Groundwater Vulnerability to Pollution Using Nitrate Measurements in Agricultural Areas. Bull. Geol. Soc. Greece 2013, 47, 981–991. [Google Scholar] [CrossRef]
  54. Bambara, A.; Orban, P.; Therrien, R.; Hallot, E.; Brouyère, S. Modelling Exchanges between Surface Water Reservoirs and Groundwater in Basement Areas: Case of Kierma (Burkina Faso). In Proceedings of the 48ème Congrès Annuel de l’Association Internationale des Hydrogéologues, Bruxelles, Belgium, 6–10 September 2021. [Google Scholar]
  55. Hassoune, E.M.; Koulali, Y.; Hadarbach, D.; Bouzidi, A. Effets Des Rejets Liquides Domestiques et Industriels Sur La Qualité Des Eaux Souterraines Au Nord de La Ville de Settat (Maroc). Bull. L’institut Sci. Rabat 2006, 28, 61–71. [Google Scholar]
  56. Asslouj, J.; Kholtei, S.; Amrani-Paaza, N.; Hilali, A. Impact des activités anthropiques sur la qualité des eaux souterraines de la communauté Mzamza (Chaouia, Maroc). Rev. Sci. L’eau 2007, 20, 309–321. [Google Scholar] [CrossRef]
  57. Wang, H.; Zhang, Q. Research Advances in Identifying Sulfate Contamination Sources of Water Environment by Using Stable Isotopes. Int. J. Env. Res. Public Health 2019, 16, 1914. [Google Scholar] [CrossRef] [PubMed]
  58. Demlie, M.; Titus, R. Hydrogeological and Hydrogeochemical Characteristics of the Natal Group Sandstone, South Africa. S. Afr. J. Geol. 2015, 118, 33–44. [Google Scholar] [CrossRef]
  59. Fetter, C.W. Applied Hydrogeology, 4th ed.; Prentice-Hall, Inc.: Hoboken, NJ, USA, 2001; ISBN 0-13-088239-9. [Google Scholar]
  60. Gourcy, L.; Aranyossy, J.-F.; Olivry, J.-C.; Zuppi, G.M. Évolution Spatio-Temporelle Des Teneurs Isotopiques (δ2H–δ18O) Des Eaux de La Cuvette Lacustre Du Fleuve Niger (Mali). Comptes Rendus L’académie Sci. Ser. IIA-Earth Planet. Sci. 2000, 331, 701–707. [Google Scholar] [CrossRef]
  61. Mathieu, R.; Bariac, T.; Fouillac, C.; Guillot, B.; Mariotti, A. Variation En Isotopes Stables Dans Les Précipitations En 1988 et 1989 Au Burkina Faso; Apports de La Météorologie Régionale [Stable Isotopes Variations in Rainfall in 1988 and 189 in Burkina-Faso: Contributions of Regional Meteorology]. ORSTOM-METEO FRANCE Veill. Clim. Satellitaire 1993, 45, 47–64. [Google Scholar]
  62. Craig, H. Standard for Reporting Concentrations of Deuterium and Oxygen-18 in Natural Waters. Science 1961, 133, 1833–1834. [Google Scholar] [CrossRef]
  63. Fontes, J.-C. Les Isotopes Du Milieu Dans Les Eaux Naturelles. La Houille Blanche 1976, 205–221. [Google Scholar] [CrossRef]
  64. Kafando, M.B.; Koïta, M.; Le Coz, M.; Yonaba, O.R.; Fowe, T.; Zouré, C.O.; Faye, M.D.; Leye, B. Use of Multidisciplinary Approaches for Groundwater Recharge Mechanism Characterization in Basement Aquifers: Case of Sanon Experimental Catchment in Burkina Faso. Water 2021, 13, 3216. [Google Scholar] [CrossRef]
  65. Fetter, C.W.; Boving, T.; Kreamer, D. Contaminant Hydrogeology, 3rd ed.; Waveland Press: Long Grove, IL, USA, 2017; ISBN 978-1-4786-3650-2. [Google Scholar]
  66. Eymold, W.K.; Swana, K.; Moore, M.T.; Whyte, C.J.; Harkness, J.S.; Talma, S.; Murray, R.; Moortgat, J.B.; Miller, J.; Vengosh, A.; et al. Hydrocarbon-Rich Groundwater above Shale-Gas Formations: A Karoo Basin Case Study. Groundwater 2018, 56, 204–224. [Google Scholar] [CrossRef] [PubMed]
  67. Hamed, Y.; Ahmadi, R.; Demdoum, A.; Bouri, S.; Gargouri, I.; Dhia, H.B.; Al-Gamal, S.; Laouar, R.; Choura, A. Use of Geochemical, Isotopic, and Age Tracer Data to Develop Models of Groundwater Flow: A Case Study of Gafsa Mining Basin-Southern Tunisia. J. Afr. Earth 2014, 100, 418–436. [Google Scholar] [CrossRef]
  68. Goodman, W.; Phillips, S.; Dyk, D.V.; Grobler, N. Conceptual Isotope Hydrostratigraphic Models for North American Sedimentary Basins: Understanding Water Sources in Deep Subsurface Mines. In Proceedings of the International Mine Water Association 2019 Meeting, Perm, Russia, 15–19 July 2019. [Google Scholar]
  69. Guetat, P.; Douche, C.; Hubinois, J.C. Le Tritium et l’environnement: Sources, Mesures et Transferts. Radioprotection 2008, 43, 547–569. [Google Scholar] [CrossRef]
  70. Healy, R.W. Estimating Groundwater Recharge; Cambridge University Press: Cambridge, UK, 2010; ISBN 978-0-521-86396-4. [Google Scholar]
  71. Scanlon, B.R.; Healy, R.W.; Cook, P.G. Choosing Appropriate Techniques for Quantifying Groundwater Recharge. Hydrogeol. J. 2002, 10, 18–39. [Google Scholar] [CrossRef]
  72. Jung, Y.-Y.; Koh, D.-C.; Yoon, Y.-Y.; Kwon, H.-I.; Heo, J.; Ha, K.; Yun, S.-T. Using Stable Isotopes and Tritium to Delineate Groundwater Flow Systems and Their Relationship to Streams in the Geum River Basin, Korea. J. Hydrol. 2019, 573, 267–280. [Google Scholar] [CrossRef]
  73. Ouedraogo, I.; Girard, A.; Vanclooster, M.; Jonard, F. Modelling the Temporal Dynamics of Groundwater Pollution Risks at the African Scale. Water 2020, 12, 1406. [Google Scholar] [CrossRef]
  74. Carrey, R.; Ballesté, E.; Blanch, A.R.; Lucena, F.; Pons, P.; López, J.M.; Rull, M.; Solà, J.; Micola, N.; Fraile, J.; et al. Combining Multi-Isotopic and Molecular Source Tracking Methods to Identify Nitrate Pollution Sources in Surface and Groundwater. Water Res. 2021, 188, 116537. [Google Scholar] [CrossRef]
  75. Telloli, C.; Rizzo, A.; Salvi, S.; Pozzobon, A.; Marrocchino, E.; Vaccaro, C. Characterization of Groundwater Recharge through Tritium Measurements. In Proceedings of the Advances in Geosciences; Copernicus GmbH: Göttingen, Germany, 2022; Volume 57, pp. 21–36. [Google Scholar]
  76. Heine, F.; Einsiedl, F. Groundwater Dating with Dissolved Organic Radiocarbon: A Promising Approach in Carbonate Aquifers. Appl. Geochem. 2021, 125, 104827. [Google Scholar] [CrossRef]
  77. Ram, R.; Burg, A.; Zappala, J.C.; Yokochi, R.; Yechieli, Y.; Purtschert, R.; Jiang, W.; Lu, Z.T.; Mueller, P.; Bernier, R.; et al. Identifying Recharge Processes into a Vast “Fossil” Aquifer Based on Dynamic Groundwater 81Kr Age Evolution. J. Hydrol. 2020, 587, 124946. [Google Scholar] [CrossRef]
  78. Bäumle, R.; Purtschert, R.; Mueller, P.; Krekeler, T.; Zappala, J.C.; Matsumoto, T.; Gröger-Trampe, J.; Koeniger, P.; Vockenhuber, C.; Romeo, N.; et al. New Insights into the Flow Dynamics of a Deep Freshwater Aquifer in the Semi-Arid and Saline Cuvelai-Etosha Basin, Northern Namibia: Results of a Multi. J. Hydrol. 2024, 52, 101721. [Google Scholar] [CrossRef]
  79. Sogreah Ingénierie Etude ses Ressources en eau Souterraine de la Zone Sédimentaire de la Région de Bobo Dioulasso; Direction des Etudes et de la Planification; Ministère de l’Eau: Ouagadougou, Burkina Faso, 1994.
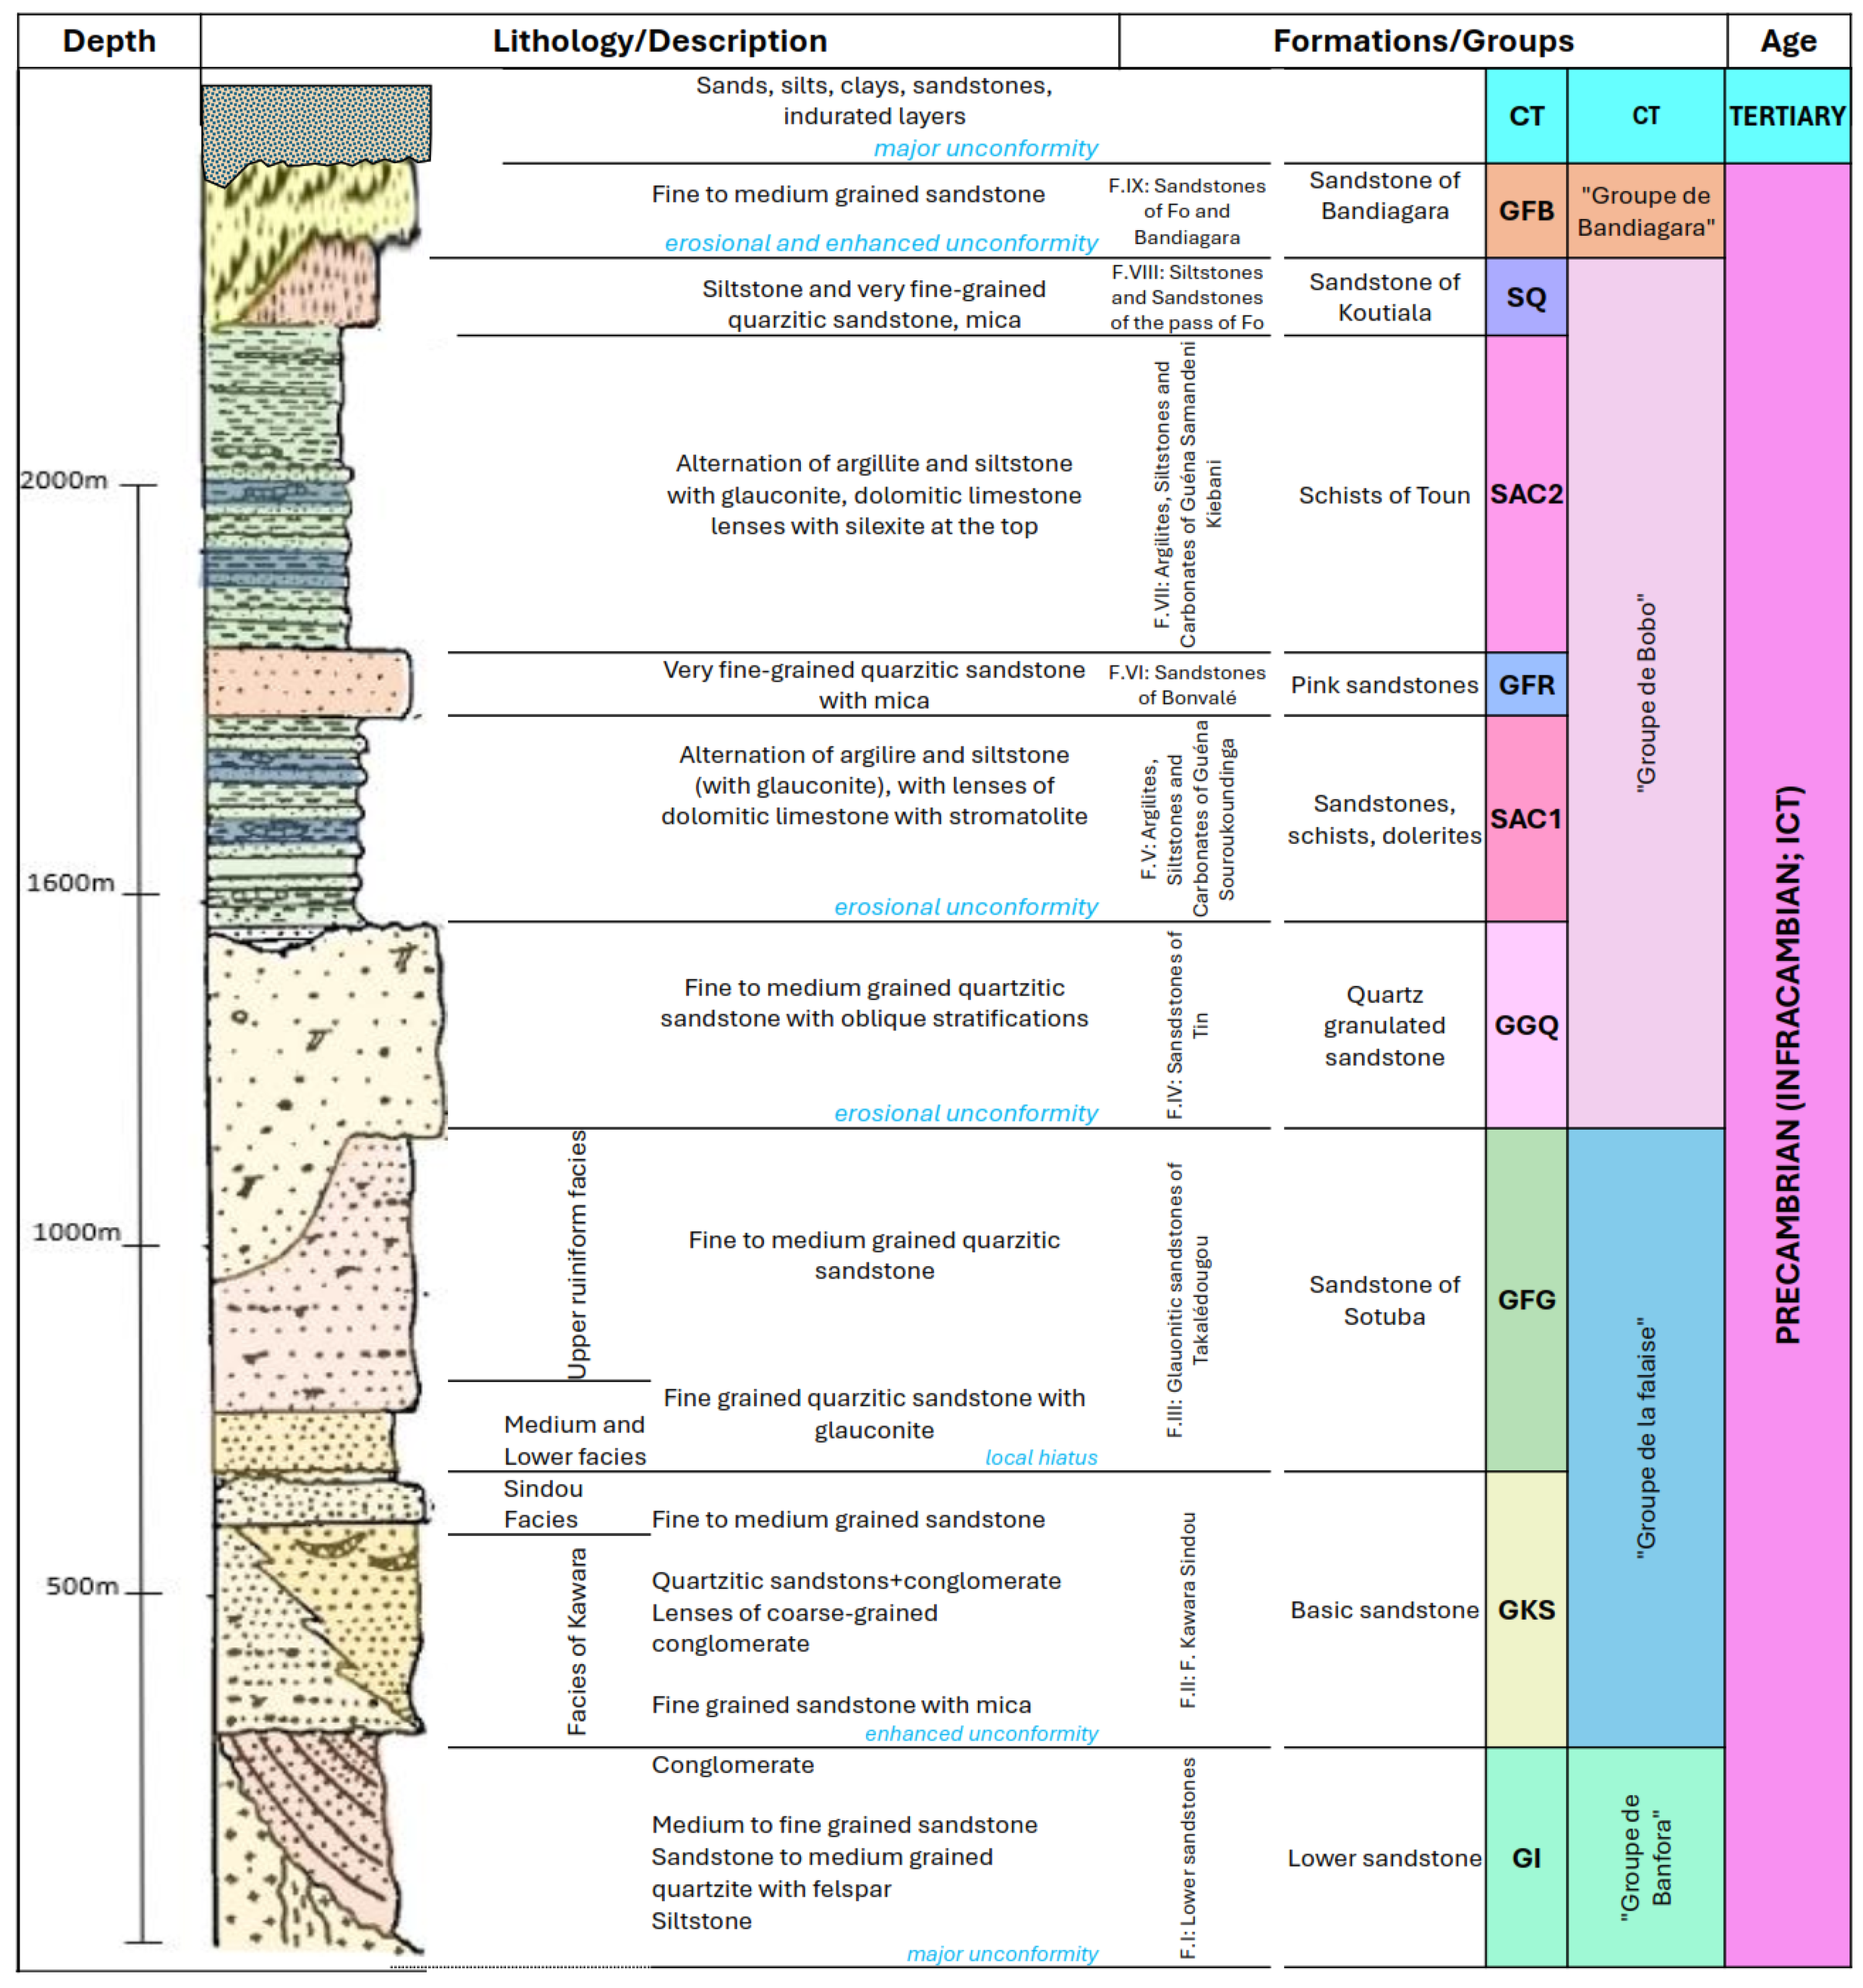
Figure 2. Stratigraphy of the southeastern margin of the Taoudéni Basin. GI: lower sandstones, GKS: the Kawara Sindou sandstones, GFG: the fine-grained sandstones with glauconite, GGQ: the quartz granulate sandstones, SAC1: the siltstones, argillites and carbonates of Guena-Souroukoundinga, GFR: the pink fine-grained sandstones, SAC2: the siltstones, argilites and carbonates of Samandeni-Kiebani, SQ: the siltstones and quartzite of the Fo Pass, GFB: the Fo-Badiangara sandstone, CT: Continental Terminal (adapted from [23,29]).
Water 16 01922 g002
Figure 4. Physico-chemical parameters by geological formation: (a) temperature, (b) pH, (c) total alkalinity, and (d) electrical conductivity.
Water 16 01922 g004
Figure 5. Spatial distribution map of (a) piezometric head map (data from [6,29]); (b) electrical conductivities; (c) 2H; and (d) 18O with geological limits.
Water 16 01922 g005
Figure 6. Profile of isotopic contents and electrical conductivity according to the flow direction (red arrow in Figure 5).
Water 16 01922 g006
Figure 7. Descriptive statistics on the major elements’ concentration by lithology sampled: (a) calcium, (b) magnesium, (c) sodium, (d) potassium, (e) bicarbonates, (f) chlorides, (g) sulfates, and (h) nitrates (outliers have been removed to improve the scale).
Water 16 01922 g007
Figure 8. Wilcox diagram: water quality for irrigation taking sodium into account.
Water 16 01922 g008
Figure 9. Piper diagram for water from geological formations: (a) sandstone IC, and (b) clayey-carbonate IC and (c) CT andsurface water.
Water 16 01922 g009
Figure 10. Groundwater stable isotopes and tritium statistics: (a) deuterium, (b) oxygen-18, (c) deuterium excess, and (d) tritium.
Water 16 01922 g010
Figure 11. Representation of the relationship between oxygen-18 and deuterium for groundwater and surface water.
Water 16 01922 g011
Figure 12. Binary diagrams of waters hosted in Infracambrian sandstone rocks (sandstones IC): (a)   C a 2 +   v s .   S O 4 2 , (b)   C a 2 +   v s .   H C O 3 , (c)   H C O 3   v s .   S O 4 2 , (d)   M g 2 +   v s .   H C O 3 , (e)   M g 2 +   v s .     N a + , (f)   H C O 3   v s .   N a + .
Water 16 01922 g012
Figure 13. Binary diagrams of water in clay-carbonate formations (clayey-carbonate IC): (a)   C a 2 +   v s .   S O 4 2 , (b)   C a 2 +   v s .   H C O 3 , (c)   H C O 3   v s .   S O 4 2 , (d)   M g 2 +   v s .   H C O 3 , (e)   M g 2 +   v s .     N a + , (f)   H C O 3   v s .   N a + .
Water 16 01922 g013
Figure 14. Binary diagrams of water in Continental Terminal formations (CT): (a)   C a 2 +   v s .   S O 4 2 , (b)   C a 2 +   v s .   H C O 3 , (c)   H C O 3   v s .   S O 4 2 , (d)   M g 2 +   v s .   H C O 3 , (e)   M g 2 +   v s .     N a + , (f)   H C O 3   v s .   N a + .
Water 16 01922 g014
Figure 15. Mineral saturation indices according to the different reservoirs presented in values in the boxplot (left) and in the point cloud (right).
Water 16 01922 g015
Figure 16. Binary diagram C a 2 + + M g 2 +   v s .   H C O 3 + S O 4 2 for the IC sandstone reservoir (a), IC clay-carbonate reservoir (b) and Continental Terminal reservoir (c).
Water 16 01922 g016
Figure 17. Representation of the relationship between oxygen-18 and deuterium for the groundwater of different lithologies and surface water.
Water 16 01922 g017
Figure 18. Spatialization of tritium content from 2013 to 2022 (relative age of groundwater).
Water 16 01922 g018
Table 1. Number of collected samples according to the geology and analyses carried out.
LithologyHydrogeochemistryStable IsotopesTritium
CT24126
GFB63922
SQ741
GFG47175
GFR1385
GGQ74119
GKS1521
SAC16561
SAC286157
Surface Water (SW)18177
Total34714972
Table 2. Descriptive statistics for the major elements in water.
Statistics N a + K + C a 2 + M g 2 + N O 3 H C O 3 S O 4 C l
No. of samples347.00347.00347.00347.00347.00347.00347.00347.00
Average7.429.9223.9614.9312.41133.2215.1010.95
Standard deviation13.6421.9229.6521.8156.87132.4555.9037.62
Min0.090.100.100.050.010.100.010.10
First quantile1.67523.891.6150.4425.560.30.42
Median3.204.0014.067.202.0086.602.002.29
Third quantile7.0310.823620.864.5209.844.1610.39
Max167.92297.83239.20210.60859.70819.80606.07640.63
Variation coeff. (%)183.89220.84123.74146.08458.4499.42370.14343.62
Table 3. Geological formations in reservoirs.
ReservoirsGeology
Sandstone ICGI, GKS, GFG, GGQ, GFR, SQ, GFB
Clayey-carbonate ICSAC1 and SAC2
CTCT+ Surface Water (SW)
Table 4. Distribution of hydrochemical facies by reservoir.
ReservoirsNumber of SamplesHCO3-Ca (%)HCO3-Ca-Mg (%)HCO3-Na-K (%)SO4-Cl-Na-K (%)SO4-Cl-Ca-Mg (%)
Sandstone IC15510.9749.6820.007.1012.26
Clayey-carbonate IC15014.6765.3310.002.677.33
CT248.3362.504.170.0025.00
SW185.5661.1127.785.560.00
Total34712.1057.9314.994.6110.37
Note: From bottom to top (from GKS to CT) and following the direction of flow, the predominance of bicarbonate-calcium-magnesium facies decreases (except for SAC2, where the facies is essentially dictated by petrography).
Table 5. Precipitation isotope data.
GNIP StationsFollow-Up Period
Barogo1988–1989
Bobo Dioulasso1997–2016
Houndé2004–2005
Nasso2004–2005
Ouagadougou2004–2019
Table 6. Stable isotope content range.
Statistics No. of SamplesAverage 1MinimumMaximum
Rainwater2H (‰ vs. SMOW)72−24.82−68.749.5
18O (‰ vs. SMOW)72.00−4.30−9.630.81
d (‰ vs. SMOW)
3H (T.U)
72.00
65.00
9.65
3.58
0.08
1.95
9.13
5.37
Surface water2H (‰ vs. SMOW)17.00−22.70−31.46−0.81
18O (‰ vs. SMOW)17.00−3.53−5.071.34
d (‰ vs. SMOW)17.005.51−11.5314.06
Groundwater2H (‰ vs. SMOW)133.00−29.21−39.30−9.90
18O (‰ vs. SMOW)133.00−4.66−6.48−1.47
d (‰ vs. SMOW)
3H (T.U)
133.00
71.00
8.11
0.01
−4.93
1.54
13.84
8.7
Note: 1 Average rainwater values are calculated by weighting the monthly rainfall over the measurement period.
Table 7. Discrimination of the Taoudéni Basin aquifers.
Proposed Aquifer’s (Water Table) NameLithology
CTCT
Upper sandstone ICGFB
SQ
SAC2SAC2
Middle sandstone ICGFR
SAC1SAC1
Lower sandstone ICGGQ
GFG
GKS
GI
Disclaimer/Publisher’s Note: The statements, opinions and data contained in all publications are solely those of the individual author(s) and contributor(s) and not of MDPI and/or the editor(s). MDPI and/or the editor(s) disclaim responsibility for any injury to people or property resulting from any ideas, methods, instructions or products referred to in the content.