Article

Observations of Tide- and Wave-Driven Groundwater Dynamics in Meso-Tidal Sandy Beach

1
Univ. Bordeaux, CNRS, Bordeaux INP, EPOC, UMR 5805, F-33600 Pessac, France
2
Univertsité de Toulon, Aix Marseille Univ., CNRS, IRD, Mediterranean Institute of Oceanography (MIO), F-83130 La Garde, France
3
Université de Pau et des Pays de l’Adour, E2S UPPA, SIAME, F-64600 Anglet, France
*
Author to whom correspondence should be addressed.
Water 2024, 16(13), 1924; https://doi.org/10.3390/w16131924
Submission received: 4 June 2024 / Revised: 3 July 2024 / Accepted: 4 July 2024 / Published: 5 July 2024
(This article belongs to the Section Oceans and Coastal Zones)

Abstract

:
This study focuses on the non-hydrostatic groundwater dynamics of a meso-tidal sandy beach under the influence of tides and waves. A field campaign was conducted at Lacanau Beach, France, during four consecutive tide cycles in March 2022. Groundwater dynamics was monitored based on a network of buried pressure sensors. The data analysis revealed the combined influences of waves and tides on the groundwater circulation. Tidal-scale groundwater flows are predominantly seaward, primarily controlled by the head gradient resulting from a high coastal aquifer. A circulation cell develops under the swash zone and moves across the beachface following the tidal oscillations. On a daily scale per alongshore and vertical units, the observed flow is 2.5 m 3 . m 2 . day 1 , i.e., 912.5 m 3 . m 2 . year 1 . Extrapolating the present dataset, it may be expected that combined events, such as drought-induced aquifer depletion with high tides, could lead to beach-scale gradient reversal, potentially causing salinisation of the continental aquifer.

1. Introduction

Over the past few decades, beach groundwater dynamics has received special attention because of its implications in many fields, coupling physical, biological, and chemical issues, e.g., [1,2,3,4,5,6,7,8,9,10,11]. At large scale, the submarine groundwater discharge (SGD) plays a key role in the exchanges between coastal aquifers and the open ocean. Quantifying the groundwater fluxes across beaches or coastal barriers remains a challenge for accurately predicting transports of salinity, contaminants, and nutrients between open sea, lagoons, and aquifers and the related biogeochemical cycles, e.g., [3,4,5,7]. SGD is also an important component of the hydrological cycle of coastal environments. In terms of volume, the total flux of SGD to the Atlantic Ocean is of the same order as the flux from rivers [12]. At a small time and space scale, beach groundwater dynamics has been expected to affect the morphodynamics of sedimentary beaches [13]. In particular, the effect of infiltration and exfiltration flows on the sandbed stability has been widely studied by field or laboratory experiments and numerical models, e.g., [6,8,9,11]. For operational purposes, based on the principle that a high watertable should lead to increased erosion (conceptual model of [14]), devices called beach drainage system have been installed on several beaches, e.g., [15,16,17], although with a limited success.
Our knowledge of beach groundwater dynamics comes up against metrological challenges. The current state of technology does not allow direct measurement of flow velocities within the porous soil. Most estimates of groundwater circulation are therefore based on reconstruction from indirect measurements [13]. Different methods are used, such as pressure sensors, seepage meters, piezometers, and hydrograph separation techniques (see [3,13] for details on different methods). These methods often cover various temporal and spatial scales at different sampling frequencies, which makes comparisons difficult. The variety of time and space scales is also an obstacle for reaching a unified view between observations and models. Note also that most observation techniques remain intrusive.
Despite metrological difficulties, a series of recurring processes have been identified. At large space and time scales, beach groundwater circulation is predominantly governed by the interaction of cross-barrier gradients, driven by the difference between the coastal aquifer elevation and the mean sea water level. The former is controlled by large-scale groundwater hydrological processes, while the latter is driven by the sea level fluctuations associated with tides, wave setup, and coastal-scale processes. The most basic approach is to consider a hydrostatic distribution of pressure within the beach, i.e., linearly increasing with depth. The hydrostatic assumption, which facilitates the interpretation and the modeling of large-scale exchanges between coastal aquifers and the open ocean, implies neglecting the vertical acceleration of the fluid. A more complete view of the beach groundwater circulation requires to account for non-hydrostatic effects, i.e., to monitor the departures of the pressure field to the hydrostatic equilibrium, which give rise to vertical acceleration. The tidal forcing across the intertidal zone is able to produce variations of watertable, leading to oscillating hydraulic gradients [3]. Under an active swash zone, time-averaged groundwater flow is generally seaward and locally controlled by wave action at the beach face. More detailed approaches, including non-hydrostatic pressure fields, have revealed that tidal action on the beach generates a tide-averaged circulation cell, with water infiltrating the watertable in the upper intertidal zone and exfiltrating in the lower intertidal zone [3,7]. At the swash scale, a wave-driven circulation has been consistently observed, e.g., [1,8,9] together with the influence of individual swash events, e.g., [2,6,8,9,10,11].
The present study focuses on non-hydrostatic beach groundwater dynamics, aiming to provide further insight on both wave- and tide-driven beach groundwater dynamics at the full tidal scale.

2. Materials and Methods

2.1. Study Site

2.1.1. Site Description

The study site is the Lacanau beach, situated on the southern French Atlantic coast (Figure 1A). Lacanau beach is a double-barred open sandy beach with a 1 km long riprap seawall and two groins, facing the Atlantic swells, in a meso-to-macrotidal environment [18]. Most of the time, the inner intertidal bar shows a transverse bar and rip morphology, with a wavelength of 400 m [18], and the outer subtidal bar is modally crescentic with an average wavelength of 800 to 1000 m [19]. While the lower part of the beach exhibits a gentle slope, less than 0.03, the upper part exhibits a steeper slope of nearly 0.06.

2.1.2. Wave Climate

The wave climate was observed at a wave buoy (CANDHIS network) deployed in 50 m water depth at about 60 km southwest of the field site (Figure 1A, Cap Ferret buoy). The wave climate is energetic and seasonally modulated with a monthly averaged significant wave height ( H m 0 ) and a peak wave period ( T p ) that ranges from 1.1 m and 8.5 s in July, with a dominant west–northwest direction, to 2.4 m and 13 s in January, with a dominant west direction [20].

2.1.3. Coastal Aquifer

Data about continental groundwater input are scarce at the study site. The only available in situ measurements have been performed with a piezometer close to our study area (in orange on Figure 1B), from December 2020 to December 2021 [21]. The cumulative annual rainfall for Lacanau in 2021 is 819.6 mm [22], with 55 days where it rained more than 5 mm. The monthly average rainfall for Lacanau for the winter season (November to March) is 96 mm over the 2016–2023 period. A significant seasonal pattern in the water table elevation is observed, with an average height of 3.6 m (according to the French National Datum NGF) during winter periods and an average height of 3.1 m during the summer, which represents an absolute seasonal variation of about 0.5 m. Small modulations (about 0.1 m) are also observed to follow the spring-neap tidal cycles. In addition, data also show a short-term modulation with extreme dry events leading to a minimum observed value of 2.3 m (between the 28 of July and the 11 of August 2021, with last rainfall observed the 12 of July). According to [21], there is no straightforward connection between rainfall and watertable level. Events of watertable rising can be observed following rainfall, with a response time of weeks, but the response is not systematic. Further study is required to decipher the watertable dynamics at watershed and coastal local scales.

2.1.4. Granulometry

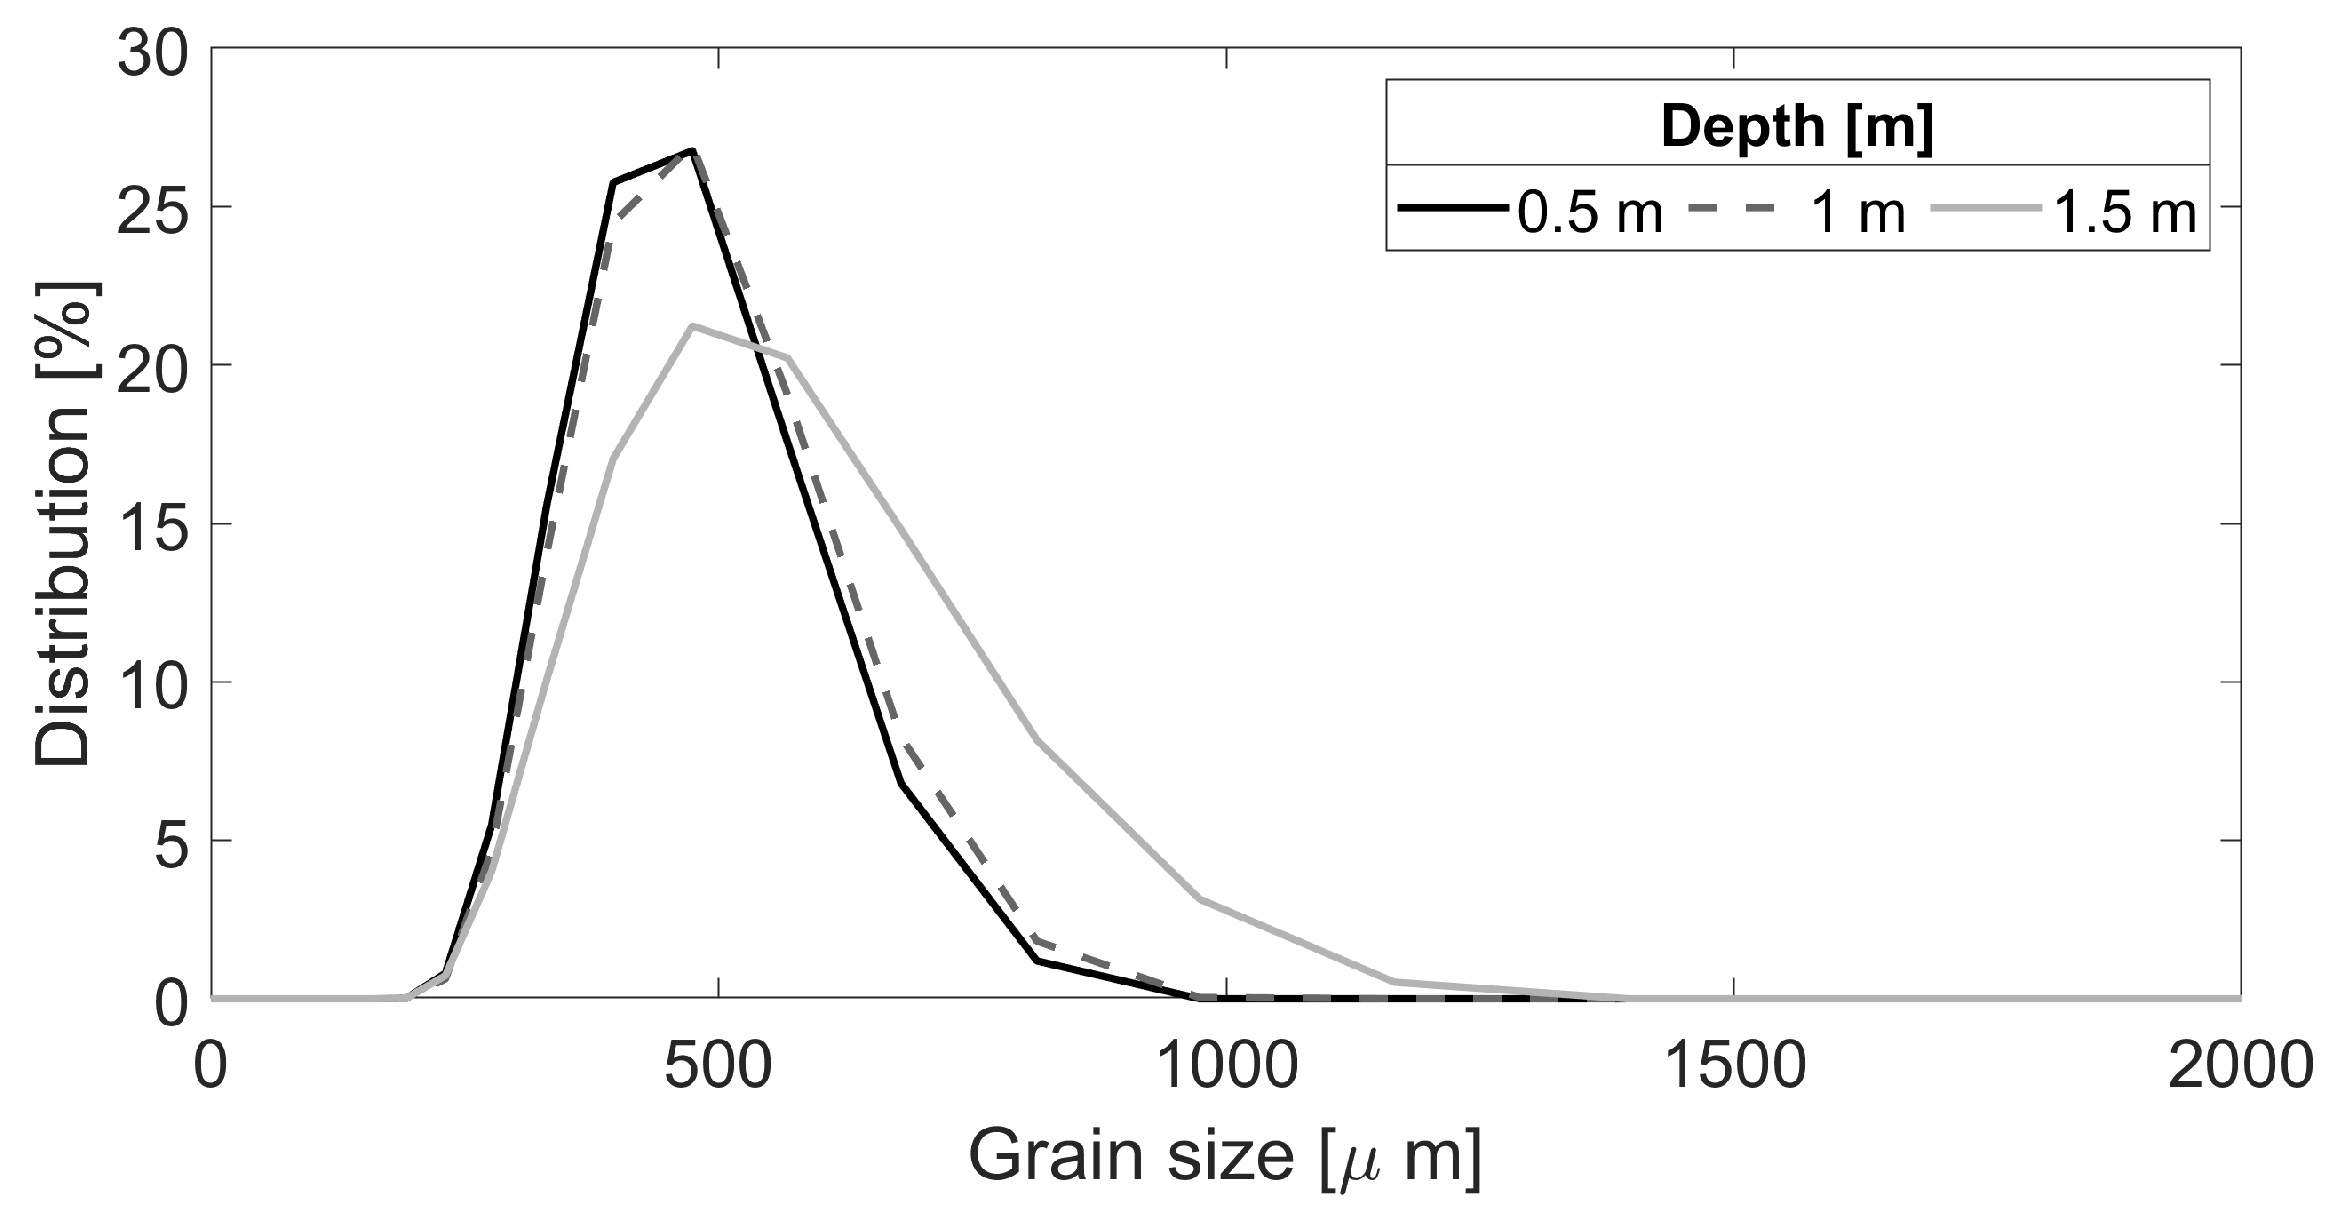
The sand samples taken during our campaign show a similar size distribution at 0.5 and 1 m depth, with a unimodal probability shape around a peak value at 4.7 mm (Figure 2). Deeper in the soil (1.5 m), the distribution is slightly flattened, with an increased contribution of 0.6–1.2 mm grains. Overall, considering the moderate variations of sand properties, it will be assumed for the sake of simplicity in the data interpretation that the hydraulic conductivity is constant and uniform throughout the studied beach profiles.

2.2. Instrumentation and Methods

Offshore wave data, H m 0 and T p , are two-hourly measurements provided Cap Ferret wave buoy presented previously. Still water level (SWL) data presented below are derived from minute predictions made by SHOM (Service Hydrographique et Océanographique de la Marine). Atmospheric pressure and rainfall data were retrieved from the Lacanau-Ocean station (StatIC station: 45.00° N and 1.19° O). Before the campaign, the last rainfalls recorded were on 15 March, with 1 mm.h−1 during twelve hours, and on 16 March, with 0.2 mm.h−1 during five hours. No rainfall has been observed during the study period (from 21 March till 23 March) [22].
The groundwater dynamics were monitored using a network of autonomous pressure sensors deployed from 21 March till 23 March during four consecutive tidal cycles, named hereinafter Tide 1 to 4. Figure 3 shows the deployment scheme, which was located upstream of the longshore drift. Six pressure sensors (RBR solo™) were fixed by pairs on three poles sunk into the sand in the intertidal zone, between the mean water level (0.34 m) and the high water level (2.43 m). The sensors were named according to their cross-shore (1 being the most onshore) and vertical position (t: top, b: bottom), as shown in Figure 3. Two topographic surveys were carried out with a PPK GNSS (vertical accuracy of approximately 3 cm) at the beginning and end of the campaign (the initial profile is shown in Figure 3), covering 170 and 300 m in the cross-shore and longshore distance, respectively. The beach level was measured at each pole position at low tide, and little erosion was observed (less than 8 cm on average).
As recommended by [23], the six pressure sensors were protected by a fine net to prevent damage or sediment infiltration in the sensor membrane. All sensors were time-synchronized and set to a 2 Hz sampling rate. Pressure measurements were corrected from atmospheric pressure, and sensor drift was controlled and corrected if necessary using atmospheric pressure measurements before and after the experiment.
For each sensor, the instantaneous piezometric head h was calculated as:
h = P ρ g + Z c
where P is the measured relative pressure, g the gravity acceleration, ρ the water density, and Z c the sensor elevation. Note that ρ is assumed to be uniform and constant.
Vertical ( h / z ) and horizontal ( h / x ) instantaneous piezometric gradients have been computed from the instantaneous piezometric heads. To focus on tidal dynamics and discard any short-term wave-driven process, a moving average on twenty minutes was applied to the head gradients.
Note that P contains here both hydrostatic P h and non-hydrostatic P n h components of groundwater pressure. P h being equal to ρ g (to within a constant), the vertical head gradient h / z is directly representative of the non-hydrostatic part of the pressure field. Provided that water flows in the direction of decreasing fluid potential as stated by Darcy’s law [13], any deviation from the hydrostaticity within the soil is expected to induce groundwater flows. Hence, horizontal and vertical velocities (U and V, respectively) were calculated as follows:
U = K h x
V = K h z
where K is the hydraulic conductivity, and x and z the position coordinates in the horizontal (cross-shore) and vertical directions, respectively. The array of six sensors has been used to approximate Equations (2) and (3) at first order, allowing for the computation of U and V at the red dot positions (Figure 3). The hydraulic conductivity has been estimated at 0.11 cm.s−1 using the [24] method on sand samples from Lacanau beach.
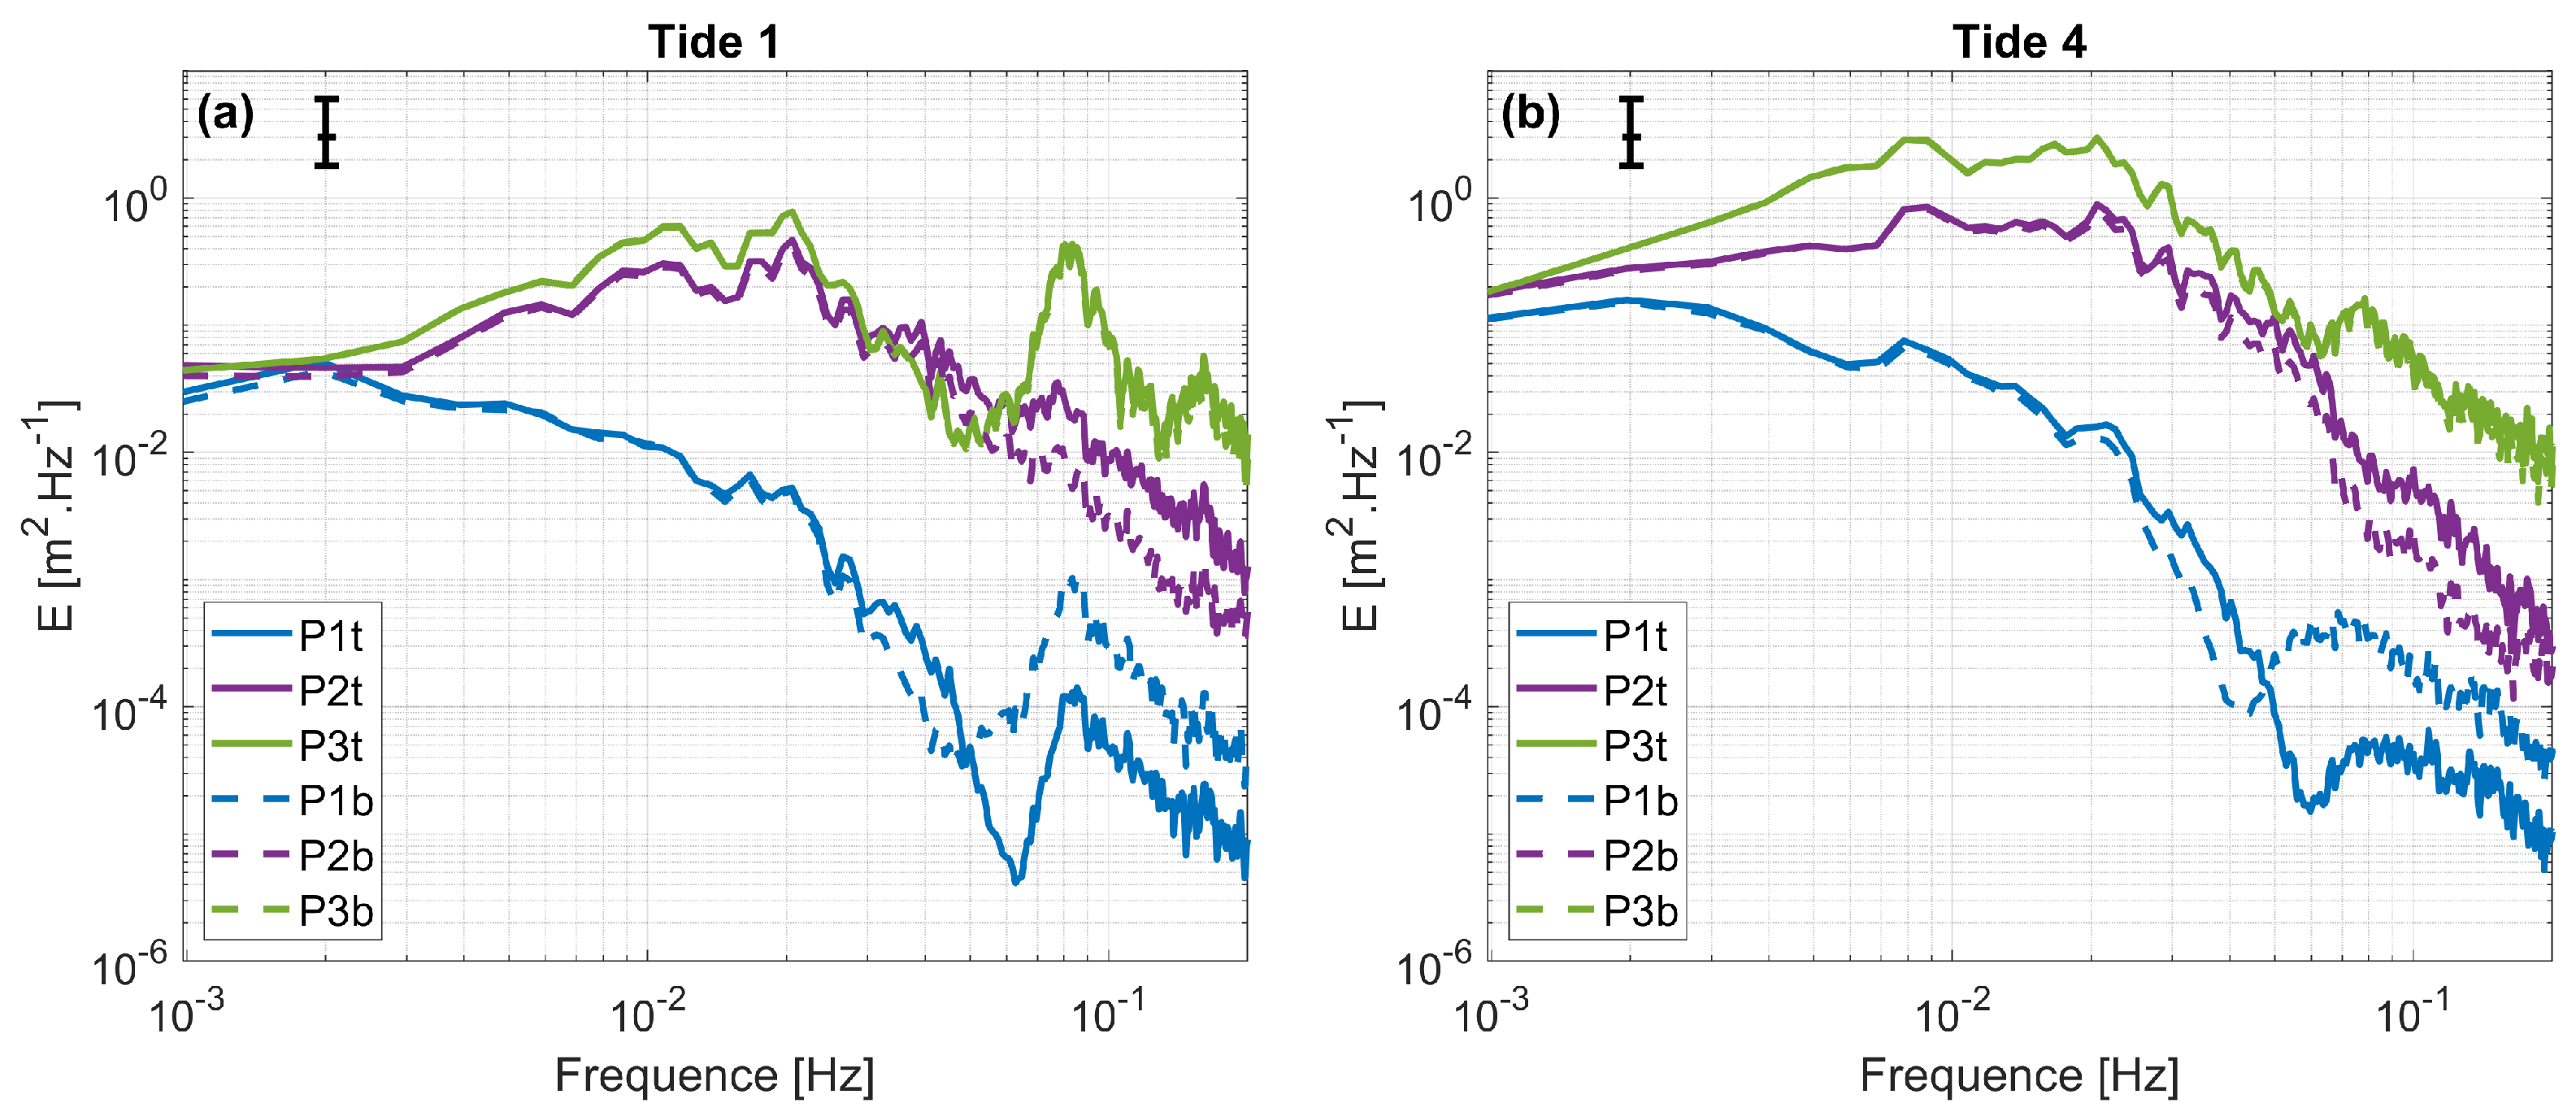
At the high Tides 1 and 4, the spectral density of variance (E) for top and bottom sensor heads were calculated using a fast Fourier transform (FFT) approach over 17 min with 20 hanning windows and an overlap of 50% (degree of freedom of 22). During the fourth high tide period, video images of the monitored profiles were taken at a 2 Hz framerate by a camera installed on the seawall (in green on Figure 1B).

3. Results

3.1. Measurements Overview

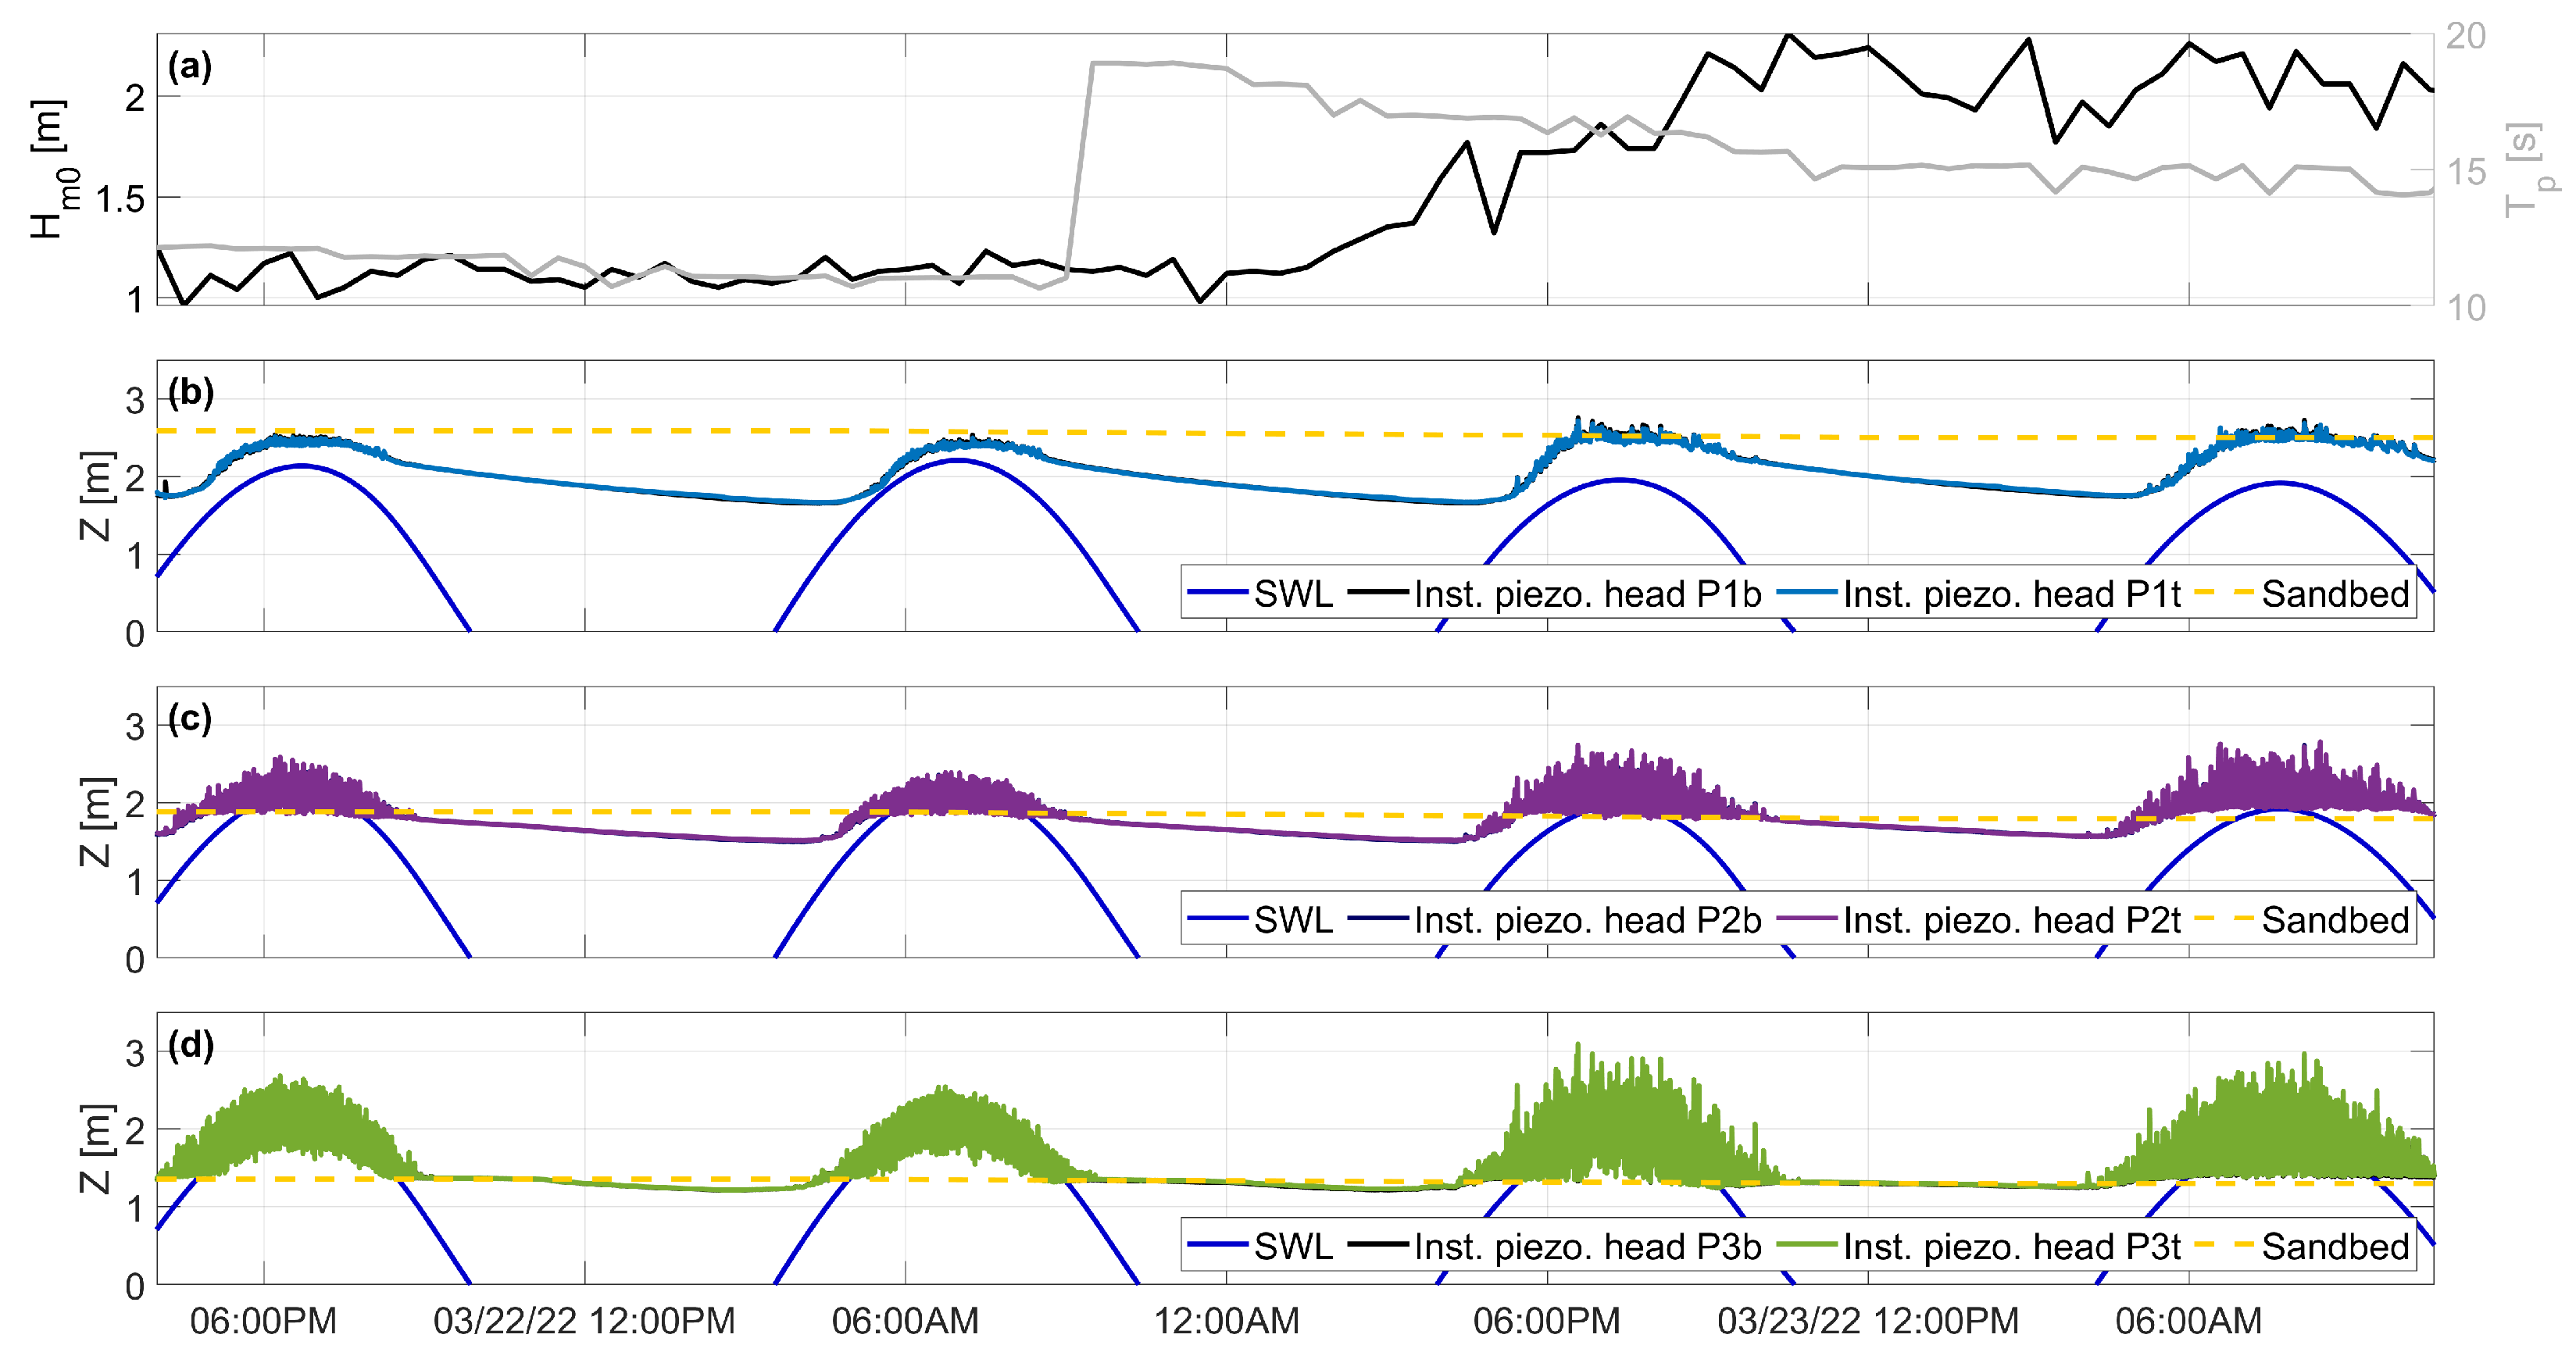
Figure 4a shows an overview of the offshore wave conditions during the field experiment. During Tides 1 and 2, stationary conditions were observed, with mean offshore significant wave heights ( H m 0 ) and peak periods ( T p ) around 1.2 m and 11.5 s, respectively. During Tide 3, H m 0 and T p were around 1.75 m and 16 s, respectively. During Tide 4, H m 0 was at 2 m on average and T p gradually decreased to an average of 15 s.
Figure 4b–d show measured sandbed and instantaneous piezometric heads at each pair of sensor locations. From Tide 1 to 4, the instantaneous piezometric heads of each pair of sensors were decreasing during ebb and low tide and increasing before the high tide. The sensor pair locations can be dry, partly or totally immersed depending on the cross-shore position and the combination of mean water level fluctuations, which are due to tidal-induced SWL oscillation and wave setup, and instantaneous swash events. The heads given by the bottom and top sensors appear nearly superimposed at the present plot scale, indicating a dominant hydrostatic equilibrium, but the head difference, even small, is responsible for vertical pressure gradients and related in/exfiltration velocities. During high Tides 1 and 2, instantaneous piezometric heads of P1tb were always below the sandbed level (in red in Figure 4d), indicating that the water table remains below the sand surface. The instantaneous piezometric heads reached the sand bed at P2tb, with individual swash events largely overcoming the P2tb location. At the lowest point on the beach, P3tb, the sandbed is fully submerged even during strong backwash events. During high Tides 3 and 4, the wave setup forced by the energetic swell is able to compensate and overcome the decrease of tidal range, leading to higher instantaneous piezometric heads at high tide for each sensor pair. The increase of wave energy for high Tides 3 and 4 is also observed in the magnitude of head fluctuations (Figure 4b–d).
Figure 5 shows the energy spectrum for top and bottom sensor heads at high Tides 1 (a) and 4 (b). Both top and bottom sensors show nearly identical spectra for the two tides. During Tide 1, the P3tb signal is a mix between short ( F > 0.05 Hz) and long infragravity ( F < 0.05 Hz) wave components. At P2tb, the short wave energy peak observed at P3tb is clearly damped, owing to the fact that, upper on the beach face, most swash motions are driven by infragravity waves. During Tide 4, the increase in wave energy shifts the beach to a dissipative state, which is clearly visible on the P3tb wave spectrum, clearly dominated by long waves. P2tb spectrum shape is similar to that observed during Tide 1, with an overall attenuation. The sensor pair P1tb, which is both upper on the beach and deeper in the soil, reveals unexpected spectrum. An overall strong attenuation is also visible for P1tb, but also a stronger attenuation is observable during both tides on a frequency band between 0.04 Hz and 0.06 Hz, leading to a spectral hole in the bulk energy dissipation slope. No straightforward explanation has been obtained about this behavior from the present dataset; such observation may be related to particular processes occurring under the swash zone.

3.2. Tidal Dynamics

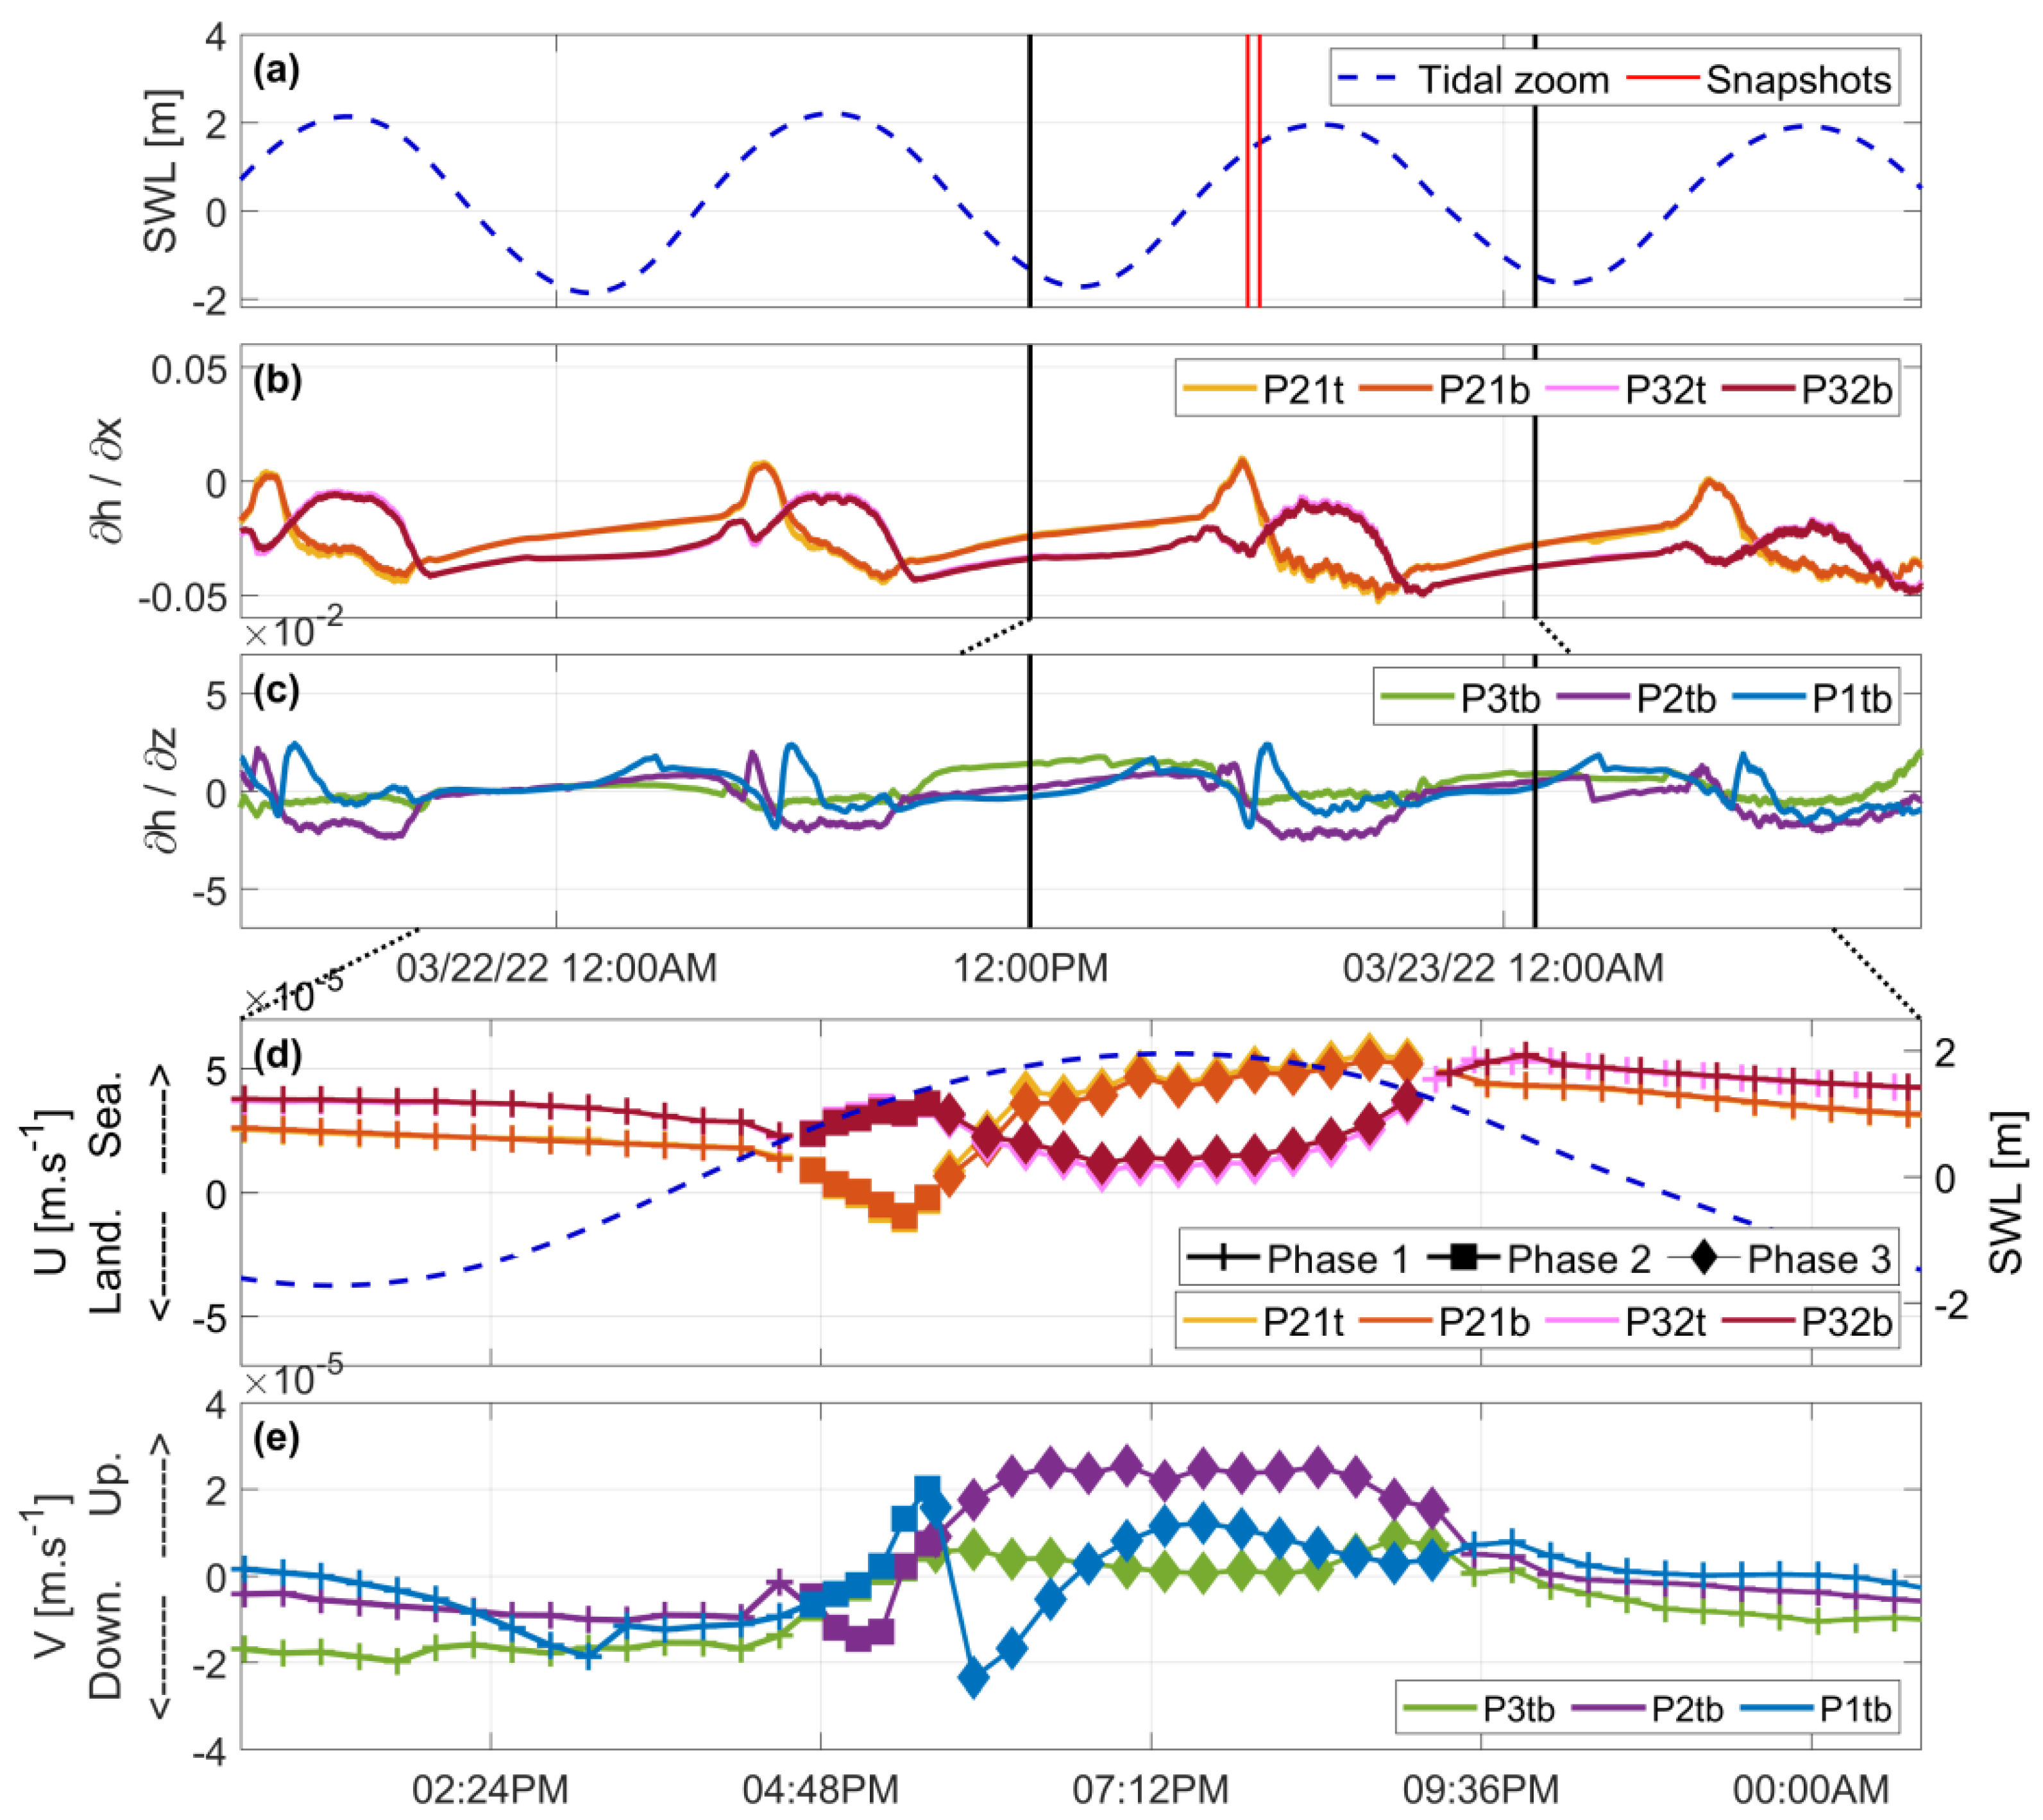
Figure 6b,c shows the evolution of the vertical ( h / z ) and horizontal ( h / x ) piezometric gradients, respectively, during Tide 1 to 4. The piezometric vertical gradients show similar temporal patterns for the four observed tides. The main observation is that horizontal velocities were found to be mainly directed seaward. Despite an increase of the incoming significant wave height by a factor 2 between Tide 1 and 4, and an increase of the associated wave period by a factor of 1.5 (Figure 4), the varying swell conditions did not have a significant impact on the amplitude variation of low-pass filtered vertical and horizontal pizometric gradients, i.e., the mean water fluctuations appear to be the main driver of the groundwater circulation.
The following analysis of the detailed 2D behavior is based on the timeseries displayed in Figure 6 combined with a sequence of representative video snapshots depicted in Figure 7. Focusing on Tide 3, representative of the dominant observations performed on other tides, Figure 6d,e show the evolution of horizontal velocities (U) calculated at the four horizontal locations, P32b, P32t, P21b, and P21t, and vertical velocities (V) at the three vertical locations, P3tb, P2tb, and P1tb. Three successive phases are identified.
Phase 1
Phase 1 took place at falling tide (symbolized by + symbols on Figure 6d,e), from before mid-ebb tide to mid-flood tide. During this phase, the horizontal velocity components U were rather stable around 3.6 × 10 5   m . s 1 and 2.2 × 10 5   m . s 1 for P32 and P21, respectively, both at bottom and top locations. P32 flow was larger than P21 flow by a factor of nearly 1.7. A weak deceleration around 0.9 × 10 5 m . s 2 was observed over the five-hour duration of Phase 1. U values reached at the end of Phase 1 are of 2.3 × 10 5   m . s 1 and 1.4 × 10 5   m . s 1 (bottom- and top-average), for P32 and P21, respectively. All vertical velocity components V were negative during this phase, with a mean value of 1.28 × 10 5   m . s 1 (time- and location-averaged), meaning that there was a downward vertical flow. At the end of Phase 1, a value of 1.4 × 10 6   m . s 1 of P2tb was reached, meaning that there was hardly any vertical flow.
Phase 2
Phase 2 started during the mid-rising tide and is symbolized by squares on Figure 6d,e. At the beginning of this phase, SWL reached the cross-shore location of the poles. Snapshot images of the installed camera at 5:31 p.m. show that the saturated sand level was between P2tb and P1tb (Figure 7A). During Phase 2, the horizontal velocity component U at P32 (offshore) and P21 (onshore) had different behaviors. For almost an hour, U at P32 increased and reached 3.6 × 10 5   m . s 1 (average of top and bottom values). At P21, a large deceleration of U was observed ( 7.2 × 10 5 m . s 2 ) at 4:51 a.m. during 32 min, resulting in a shift of the horizontal current orientation from seaward to landward. This landward flow is the only one observed during the tidal cycle; it reached 1 . 0 5  m.s−1 (average of top and bottom values). At 5:04 p.m., the negative vertical velocity component V at P2tb increased in amplitude (i.e infiltration), reaching a value around 1.5 × 10 5   m . s 1 . At 5:09 p.m., V of P1tb switched to positive values and started to increase, eventually reaching the maximum exfiltration flow value of 2.0 × 10 5   m . s 1 at 5:34 p.m.
Phase 3
Phase 3 took place around high tide and is symbolized by diamonds on Figure 6d,e. The saturated sand level was higher on the beach than P1tb location, as shown by snapshot images of the installed camera (Figure 7B). P1tb was regularly covered and uncovered by the runup. At 5:38 p.m., for 2 h and 15 min, U at P32 decreased from 3.6 × 10 5   m . s 1 to 1.2 × 10 5   m . s 1 and then increased back at 8:12 p.m., for 1 h and 45 min. At 5:22 p.m., for almost 4 h, U at P21 increased from 1.0 × 10 5   m . s 1 to 5.3 × 10 5   m . s 1 . The horizontal flow at P21 switched rapidly at the beginning of Phase 3 and was redirected seaward. At 6:11 p.m., during two hours and half, V of P2tb reached a platter around 2.5 × 10 5   m . s 1 . At 5:54 p.m., V of P1tb switched abruptly and reached a maximum infiltration value of 2.3 × 10 5   m . s 1 as observed for P2tb in Phase 2. At 7:01 p.m., for just over an hour, V of P1tb reached a platter around 1.1 × 10 5   m . s 1 . Before mid-ebb tide, a new cycle restarted with Phase 1.

4. Discussion

Most knowledge on beach groundwater dynamics has been gained from studies of tidal-scale dynamics of the watertable, i.e., neglecting the non-hydrostatic circulation within the aquifer, or at the contrary, at a small space- and time-scale to describe a single or a few swash events. The aim of the present study is to present field observations of both watertable dynamics and groundwater circulation, i.e., including non-hydrostatic effects, driven by combined wave and tide forcing, over several consecutive tidal cycles in a meso/macro-tidal sandy beach.
The measured wave-averaged groundwater velocities are in line with previous experiments, either in field measurement on micro-tidal beaches [8], i.e., o ( 10 5   m . s 1 ) , or during full-scale laboratory data [25], which is two orders of magnitude lower than the values observed at swash scales, i.e., o ( 10 3   m . s 1 ) [26]. More generally, the collected data validate and extend the observations previously made on the beach groundwater dynamics. A synthesizing conceptual diagram is proposed in Figure 8. At low tide (Figure 8a), the groundwater flow is mainly oriented seaward. Below the surf zone, the discharge magnitude is driven by the wave-averaged slope of the water surface, i.e., the wave setup structure, leading generally to very low velocity (Figure 8a). Upper on the beachface but below the exit point, a decoupling between the watertable and the mean water level can be observed [23], corresponding to Phase 1 in the present experiments. The seabed is not exposed, or very intermittently, to wave action. The (saturated) beach slope is therefore the controlling gradient for groundwater velocity. The beach face being generally much steeper than the mean water profile in the surface zone, the decoupling area generally presents a higher slope, leading to stronger seaward velocity. Above the exit point, the landward boundary condition of the coastal aquifer becomes the main controller of the beach discharge. Following this scheme, flow divergences are expected to drive vertical motions in particular near the transitions between the main areas. Such divergences may explain part of the vertical velocity fluctuations observed around low tide in Figure 6, but proper documentation is still lacking to provide conclusive comments. At rising and high tide (Figure 8b), the dynamics depends on the location with respect to the runup extension, the mean water level, and the watertable elevation. Below the swash zone, the watertable displays a hump shape leading to a local flow reversal [8,9]. The extension of the reversal zone depends on the extension of the swash zone, the overall watertable slope, and the soil properties. Under the upper part of the swash zone, i.e., near the top of the watertable hump, the reversed horizontal flow is associated with slight upward flow. Lower in the swash zone, infiltration dominates and a circulation cell develops [2,9,10,11,25], as observed in the present Phases 2 and 3.
The present analysis is based on several assumptions. First, the sand is considered to be homogeneous over the first few meters below the surface of the beach. This assumption appears rather reasonable, according to the recovered granulometric samples and owing to the fact that strong and regular sedimentary rearrangement is expected due to the high wave exposure of the French Atlantic coast. A study carried out on a nearby beach (Truc Vert beach, France) showed a homogeneous granulometric distribution in the first 50 cm of sediment (Figure 5.2 on [27]). Consequently, homogeneous hydraulic conductivity was assumed over the considered area [28]. However, further studies involving granulometric profiling should be engaged to better understand the potential effects of variable hydraulic conductivity on the groundwater circulation structure. Second, the estimation of groundwater dynamics using pressure transducers assumes that pressure sensors are surrounded by a 100 % saturated sand. While widely used in the literature, the measurements may be affected by uncontrolled local effects around the membrane. Additionally, note that no water density data were collected during the campaign, making it impossible to take into account potential buoyancy effects. Part of the slight variations in vertical velocity observed may be due to salinity (horizontal gradients being too large to be affected). While this issue should deserve further attention in future campaigns, [29] study showed that salinity variations in the intertidal zone of beaches, due to salt accumulation as a result of evaporation, are not significant, which enforces the validity of the main conclusions of our study. Finally, the present analysis of the coastal aquifer was carried out assuming fixed onshore boundary conditions. This assumption was made knowing that the rainfall around the date of the measurement campaign was small and therefore the inputs derived from them could be neglected (i.e., Section 2.2). The presence of a riprap behind the monitored profile was not taken into account in the data interpretation. The discrimination of a potential riprap effect on the coastal aquifer and beach groundwater would require an extensive measurement campaign including along-shore variability. Such extension would also allow to account for the full 3D beach morphology, as [30] have shown that tidally induced groundwater changes are superimposed on a three-dimensional watertable surface that is tied to the beach morphology and the groundwater recharge from the backshore zone.
In a larger-scale perspective, the estimation of groundwater discharge is a major topic for the quantification of exchanges between ocean and coastal aquifers and the related biogeochemical cycles. During this experiment, a well-developed net horizontal flow is observed. On a daily scale per alongshore and vertical units, the observed flow is 2.5 m 3 . m 2 . day 1 , i.e., 912.5 m 3 . m 2 . year 1 . This annual horizontal flow is significantly higher than comparable published values, such as those in [31], which was conducted under similar conditions (sandy beach, a few meters depth and distance), who measured a flow of 268–454 m . year 1 using piezometers and seepage meters. Note that inter-site comparison is difficult, as different methodologies are used and local effects such as swash zone circulation can have a significant impact on the discharge estimation. Our measurements demonstrate indirectly the importance of the elevation of the continental water table in controlling the seaward discharge, in particular at low tide. According to available data on coastal aquifers on our site, the present observations can be considered representative of the dominant functioning. However, one notes that during summer 2021, a drought-resulting extreme event has been identified with a minimum observed level of 2.3 m, i.e., about 1 m lower than standard conditions. In the context of global change-induced sea level rise combined with a possible increase in drought periods, the combination of low coastal aquifer with high tides may lead to beach-scale reversal of the discharge, inducing deleterious salinization events of continental aquifer.

5. Conclusions

The present paper reports on a series of field observations performed on the beach groundwater circulation in the Lacanau beach, France. Assuming a homogeneous hydraulic conductivity of the soil and neglecting salinity-induced buoyancy effects, the observed velocities were consistent with existing data dedicated to tidal-driven dynamics but remained lower than the values observed at the swash scale. At low tide, an offshore-directed flow as well as a decoupling between the water table level and the still water level were observed. At high tide, the establishment of a circulation cell below the swash zone was noted. An offshore discharge of about 912.5 m 3 . m 2 . year 1 was estimated from the present measurement. In a larger perspective, the observations made during this study can help quantify the possible exchanges between the ocean and coastal aquifer in connection with the nearshore biogeochemical cycle. In particular, it can be expected that extreme drought events could lead to the reversal of the groundwater flux at the beach scale, potentially inducing salinization of the continental aquifer. Further instrumental deployments, including pressure head and salinity, should be planned to perform a long-term survey of the beach groundwater system in response to both global change and human-induced pressure.

Author Contributions

Conceptualization, E.W., D.S. and N.S.; methodology, E.W. and D.S.; formal analysis, E.W., D.S. and N.S.; investigation, E.W. and D.S.; resources, E.W., D.S. and N.S.; data curation, E.W.; writing—original draft preparation, E.W.; writing—review and editing, E.W., D.S. and N.S.; visualization, E.W.; supervision, D.S. and N.S.; project administration, N.S.; funding acquisition, N.S. All authors have read and agreed to the published version of the manuscript.

Funding

This research was funded by the region Nouvelle Aquitaine, the Lacanau city, the CCGL (Communauté des Communes des Grands Lacs) and NGE fondations.

Data Availability Statement

Data presented in this study are available on request from the corresponding author.

Acknowledgments

The authors would like to thank the BRGM and the MIO for supplying pressure sensors. Finally, the authors would like to thank the people who helped with the field work: V. Marieu, C. Labarthe, C. Cabezas-Rabadan A. Robinet and G. Detandt.

Conflicts of Interest

The authors declare no conflicts of interest. The funders had no role in the design of the study; in the collection, analyses, or interpretation of data; in the writing of the manuscript; or in the decision to publish the results.

References

  1. Nielsen, P. Tidal dynamics of the water table in beaches. Water Resour. Res. 1990, 26, 2127–2134. [Google Scholar] [CrossRef]
  2. Li, L.; Barry, D. Wave-induced beach groundwater flow. Adv. Water Resour. 2000, 23, 325–337. [Google Scholar] [CrossRef]
  3. Burnett, W.; Aggarwal, P.; Aureli, A.; Bokuniewicz, H.; Cable, J.; Charette, M.; Kontar, E.; Krupa, S.; Kulkarni, K.; Loveless, A.; et al. Quantifying submarine groundwater discharge in the coastal zone via multiple methods. Sci. Total Environ. 2006, 367, 498–543. [Google Scholar] [CrossRef] [PubMed]
  4. Robinson, C.; Gibbes, B.; Li, L. Driving mechanisms for groundwater flow and salt transport in a subterranean estuary. Geophys. Res. Lett. 2006, 33, 2005GL025247. [Google Scholar] [CrossRef]
  5. Charbonnier, C.; Anschutz, P.; Poirier, D.; Bujan, S.; Lecroart, P. Aerobic respiration in a high-energy sandy beach. Mar. Chem. 2013, 155, 10–21. [Google Scholar] [CrossRef]
  6. Sous, D.; Lambert, A.; Rey, V.; Michallet, H. Swash–groundwater dynamics in a sandy beach laboratory experiment. Coast. Eng. 2013, 80, 122–136. [Google Scholar] [CrossRef]
  7. Heiss, J.W.; Puleo, J.A.; Ullman, W.J.; Michael, H.A. Coupled surface-subsurface hydrologic measurements reveal infiltration, recharge, and discharge dynamics across the swash zone of a sandy beach. Water Resour. Res. 2015, 51, 8834–8853. [Google Scholar] [CrossRef]
  8. Sous, D.; Petitjean, L.; Bouchette, F.; Rey, V.; Meulé, S.; Sabatier, F.; Martins, K. Field evidence of swash groundwater circulation in the microtidal rousty beach, France. Adv. Water Resour. 2016, 97, 144–155. [Google Scholar] [CrossRef]
  9. Turner, I.L.; Rau, G.C.; Austin, M.J.; Andersen, M.S. Groundwater fluxes and flow paths within coastal barriers: Observations from a large-scale laboratory experiment (BARDEX II). Coast. Eng. 2016, 113, 104–116. [Google Scholar] [CrossRef]
  10. Geng, X.; Heiss, J.W.; Michael, H.A.; Boufadel, M.C. Subsurface Flow and Moisture Dynamics in Response to Swash Motions: Effects of Beach Hydraulic Conductivity and Capillarity. Water Resour. Res. 2017, 53, 10317–10335. [Google Scholar] [CrossRef]
  11. Perera, E.; Zhu, F.; Dodd, N.; Briganti, R.; Blenkinsopp, C.; Turner, I.L. Surface-groundwater flow numerical model for barrier beach with exfiltration incorporated bottom boundary layer model. Coast. Eng. 2019, 146, 47–64. [Google Scholar] [CrossRef]
  12. Moore, W.S. The Effect of Submarine Groundwater Discharge on the Ocean. Annu. Rev. Mar. Sci. 2010, 2, 59–88. [Google Scholar] [CrossRef] [PubMed]
  13. Horn, D.P. Beach groundwater dynamics. Geomorphology 2002, 48, 121–146. [Google Scholar] [CrossRef]
  14. Grant, U. Effects of groundwater table on beach erosion. Bull. Geol. Soc. Am. 1946, 57, 1252, (Abstract). [Google Scholar]
  15. Contestabile, P.; Aristodemo, F.; Vicinanza, D.; Ciavola, P. Laboratory study on a beach drainage system. Coast. Eng. 2012, 66, 50–64. [Google Scholar] [CrossRef]
  16. Fischione, P.; Pasquali, D.; Celli, D.; Di Nucci, C.; Di Risio, M. Beach Drainage System: A Comprehensive Review of a Controversial Soft-Engineering Method. J. Mar. Sci. Eng. 2022, 10, 145. [Google Scholar] [CrossRef]
  17. West, N. Beach Use and Behaviors. In Encyclopedia of Coastal Science; Finkl, C.W., Makowski, C., Eds.; Series Title: Encyclopedia of Earth Sciences Series; Springer International Publishing: Cham, Switzerland, 2019; pp. 307–311. [Google Scholar] [CrossRef]
  18. Lafon, V.; Froidefond, J.M.; Lahet, F.; Castaing, P. SPOT shallow water bathymetry of a moderately turbid tidal inlet based on field measurements. Remote Sens. Environ. 2002, 81, 136–148. [Google Scholar] [CrossRef]
  19. Lerma, A.N.; Billy, J.; Bulteau, T.; Mallet, C. Multi-Decadal Seawall-Induced Topo-Bathymetric Perturbations along a Highly Energetic Coast. J. Mar. Sci. Eng. 2022, 10, 503. [Google Scholar] [CrossRef]
  20. Castelle, B.; Bujan, S.; Ferreira, S.; Dodet, G. Foredune morphological changes and beach recovery from the extreme 2013/2014 winter at a high-energy sandy coast. Mar. Geol. 2017, 385, 41–55. [Google Scholar] [CrossRef]
  21. Anteagroup. Equipement et Suivi Géotechnique des Bâtiments de 1er Rang—Période 2020–2021; Anteagroup: White Plains, NY, USA, 2021. [Google Scholar]
  22. StatIC. Station Météorologique de Lacanau-Océan; InfoClimat. 2022. Available online: https://www.infoclimat.fr/observations-meteo/temps-reel/lacanau-ocean/000DZ.html (accessed on 1 July 2024).
  23. Turner, I.; Nielsen, P. Rapid water table fluctuations within the beach face: Implications for swash zone sediment mobility? Coast. Eng. 1997, 32, 45–59. [Google Scholar] [CrossRef]
  24. Krumbein, W.; Monk, G. Permeability as a Function of the Size Parameters of Unconsolidated Sand. Trans. AIME 1943, 151, 153–163. [Google Scholar] [CrossRef]
  25. Clément, J.B.; Sous, D.; Bouchette, F.; Golay, F.; Ersoy, M. A Richards’ equation-based model for wave-resolving simulation of variably-saturated beach groundwater flow dynamics. J. Hydrol. 2023, 619, 129344. [Google Scholar] [CrossRef]
  26. Turner, I.L.; Masselink, G. Swash infiltration-exfiltration and sediment transport. J. Geophys. Res. Ocean. 1998, 103, 30813–30824. [Google Scholar] [CrossRef]
  27. Labarthe, C. Relations Entre Granularité des Sédiments, Pente des PLAGES et Déferlement des Vagues. Ph.D. Thesis, Université de Bordeaux, Pessac, France, 2023. [Google Scholar]
  28. Geng, X.; Heiss, J.W.; Michael, H.A.; Boufadel, M.C.; Lee, K. Groundwater Flow and Moisture Dynamics in the Swash Zone: Effects of Heterogeneous Hydraulic Conductivity and Capillarity. Water Resour. Res. 2020, 56, e2020WR028401. [Google Scholar] [CrossRef]
  29. Geng, X.; Boufadel, M.C.; Jackson, N.L. Evidence of salt accumulation in beach intertidal zone due to evaporation. Sci. Rep. 2016, 6, 31486. [Google Scholar] [CrossRef] [PubMed]
  30. Lanyon, J.; Eliot, I.; Clarke, D. Observations of shelf waves and bay seiches from tidal and beach groundwater-level records. Mar. Geol. 1982, 49, 23–42. [Google Scholar] [CrossRef]
  31. Lewis, J.B. Measurements of groundwater seepage flux onto a coral reef: Spatial and temporal variations. Limnol. Oceanogr. 1987, 32, 1165–1169. [Google Scholar] [CrossRef]
Figure 1. (A) Location of the study site in the south west of France. (B) Aerial photograph of the sea front of Lacanau Ocean taken from the north, with the location of the continental piezometer (orange), the video camera (green), and the monitored profile (blue) (Ph. V. Marieu).
Water 16 01924 g001
Figure 2. Grain size distribution for three sample depths.
Water 16 01924 g002
Figure 3. Description of the experimental setup, the solid black line representing the beach cross-shore profile during the experiment, the blue lines the high and mean water levels, and the colored circles the onshore (blue), middle (purple), and offshore (green) pairs of sensors. The positions where the velocity is computed using sensor pressure gradients are represented by red dots.
Water 16 01924 g003
Figure 4. (a) Significant wave height (black) and peak period (gray) as provided by the offshore buoy. Bottom (black) and top (colored) piezometric heads and measured sandbed height (yellow) at P1tb (b), P2tb (c), and P3tb (d) locations.
Water 16 01924 g004
Figure 5. Energy spectrum for top and bottom sensor heads at high Tide one (a) and four (b). Back line represents the 95% confidence interval for all spectra.
Water 16 01924 g005
Figure 6. (a) Sea water level, selected tide (black lines), and time snapshots (dashed red lines). (b) Horizontal piezometric gradients ( h / x ) during the entire campaign for the four horizontal locations with the most onshore (top: yellow and bottom: orange) and the most offshore pairs (top: red and bottom: pink). (c) Vertical piezometric gradients ( h / z ) during the entire campaign for P3tb (green), P2tb (purple), and P1tb (blue). (d) Horizontal velocities (U) for the four horizontal locations with the most onshore (top: yellow and bottom: orange) and the most offshore (top: red and bottom: pink). (e) Vertical velocities (V) for P3tb (green), P2tb (purple), and P1tb (blue).
Water 16 01924 g006
Figure 7. Snapshots of installed camera at 5:31 p.m. (A) and 5:49 p.m. (B).
Water 16 01924 g007
Figure 8. Conceptual diagram of water table dynamics at low (a) and high tides (b) and tidal signal (c) with SWL: Still water level, IWL: Instantaneous water level, CF: Capillary fringe, BF: Beachface, EP: Exit point and DA: Decoupling area.
Water 16 01924 g008
Disclaimer/Publisher’s Note: The statements, opinions and data contained in all publications are solely those of the individual author(s) and contributor(s) and not of MDPI and/or the editor(s). MDPI and/or the editor(s) disclaim responsibility for any injury to people or property resulting from any ideas, methods, instructions or products referred to in the content.