Article

Mesocosm Experiment to Evaluate Relations between Chlorophyll-a Concentration and Water Surface Reflectance in an Anthropogenic Reservoir

by
Łukasz Pierzchała
Department of Water Protection, Central Mining Institute, 40-166 Katowice, Poland
Water 2024, 16(13), 1926; https://doi.org/10.3390/w16131926 (registering DOI)
Submission received: 20 May 2024 / Revised: 28 June 2024 / Accepted: 1 July 2024 / Published: 5 July 2024
(This article belongs to the Special Issue Water Pollution Monitoring, Control, and Remediation)

Abstract

:
This paper presents the results of a mesocosm experiment for the evaluation of remote sensing chlorophyll-a (chl-a) concentration estimations in an anthropogenic water reservoir. The chl-a presence in the water causes changes in the water surface reflectance spectrum, especially in the green and red part, but many factors could affect the remote measurements of chl-a content. The in situ mesocosm method of the experiment was used for investigating the spectral reflectance of the inland water surface in a wide range of chl-a concentrations. Eight specially designed measurement boxes were placed into the water. In half of the boxes, the devices to support the development of the submerged water plant were installed. During the experiment, simultaneously, spectral data from the water surface were gathered and physical–chemical analyses of water were carried out. The obtained results confirm the usefulness of the mesocosm experiment for the remote sensing chl-a concentration algorithms being developed. The concentration of dissolved organic carbon was identified as a key factor that interfered with remote chl-a estimations in the analyzed reservoir.

1. Introduction

Chlorophyll-a concentration is a key parameter indicating an undesirable disturbance in inland waters caused by eutrophication processes. Nutrient enrichment affected the development of microscopic plants in water columns (phytoplankton). Chlorophyll-a (chl-a) concentration as an indicator of phytoplankton biomass is a widely used method for estimations of eutrophication in water ecosystems. Using remote sensing for measuring the eutrophication of inland water is very useful for water management which allows one to make the right and quick decisions to limit the negative impact of water reservoir eutrophication, especially with recreational use. Automated systems for phytoplankton monitoring are part of the technical arsenal needed to achieve the Water Framework Directive goals [1]. The ability to use remote sensing for monitoring water quality has been studied since the 1970s [2,3,4]. Based on CHRIS mode 2 and MERIS satellite images and field data, the development of algorithms for chlorophyll concentration monitoring was conducted. These algorithms allow the determination of ecological states of water ecosystems and are used to monitor the ecological quality ratio (EQR) in Spain’s inland water [5]. The application method for monitoring water quality using Landsat imagery on lakes in Oklahoma shows a significant correlation between band combinations and turbidity, but chlorophyll is not significantly correlated with any bands or band combinations during summer [6]. High correlation coefficients (0.944) for chlorophyll using the Landsat 3 band values were generated by Allan et al. 2011 [7] for a lake in New Zealand. These and other studies [8,9,10,11,12] have shown that relationships between remotely sensed surface reflectance and water parameters in inland waters are often unique to a particular geographic region and have less applicability in another area. Phytoplankton is made up of organisms belonging to a number of systematic groups of species, with variable size, shape, and environmental requirements in relation to light, temperature, and water mobility. The gradient of altitude and temperature gradient of nutrients and anthropogenic activity has the greatest impact on phytoplankton variability [13]. Radiance or reflectance signals leaving the water ecosystem surface contain phytoplankton pigment information that can be related to community structure and size classes [14,15]. Most of the remote methods of monitoring have relied on the surface water spectrum to retrieve chlorophyll concentrations in phytoplankton.
Therefore, spectral-based methods for chlorophyll-a estimation have been mostly developed for natural water ecosystems [16,17,18,19]. Due to a disturbance in bio-physical–chemical interactions and specific morphological conditions (e.g., shallow depth, limited share of banks and bottoms suitable for vegetation development), anthropogenic reservoirs are more subjected to eutrophication [20,21]. In the case of anthropogenic reservoirs, the diversity of phytoplankton species composition depends on the availability of genetic information and the age of the reservoir, as well as the type and intensity of anthropogenic pressure. These reservoirs are most often characterized by a lower diversity of species composition and greater susceptibility to the dominance of a single species. It often causes human risk and a loss of biodiversity. In addition, the negative effects of nutrient enrichment like harmful algal blooms could be enhanced by climate change [22]. To decrease health risks and increase the effectiveness of rehabilitation work, the continuous monitoring of anthropogenic water ecosystems has to be implemented. Due to the complex correlation between water quality parameters and water optical properties, remote sensing for inland water quality monitoring is still a grand challenge [23]. An insufficient number of replicates and the uniqueness of every single reservoir mostly represent limitations for developing and implementing inland water remote sensing monitoring methods. The duration of the experiment is another important factor affecting the inconvenience of applying this method. Mesocosm approaches could solve most of these limitations in developing algorithms for remote in situ chlorophyll-a concentration estimations in the anthropogenic reservoir. It is an intermediate option between laboratories and in situ studies and gives the ability to control environmental variables jointly with the replicability [24,25]. In these experiments, reflection measurements are taken directly from above the water surface using handheld spectrometers [26]. The significant negative relations between periphyton growth on a mesocosm wall and phytoplankton abundance observed by Chen et al. (1997) [27] gives opportunities to observe water ecosystems in a wider range of chl-a concentrations in a water column. Due to this process, a shorter time is needed to analyze the optical properties of a water surface with a wide range of environmental factors.
The study’s objectives are to verify if a mesocosm experiment could support developing algorithms for remote chlorophyll-a concentration estimations in a selected anthropogenic water ecosystem and help to identify the water physio-chemical parameters that determine water surface spectral reflectance and affect remote chlorophyll-a concentration retrieval.

2. Materials and Methods

2.1. Study Area

The research was carried out in a pond located in the central part of the Silesian Voivodship (Bytom city). A reservoir appeared as a result of open mining activity in the 20th century. Currently, it is located in the southeastern part of 43 ha urban green spaces (Franciszek Kachl Park). The direct catchment (approx. 6.5 ha) covers mostly low vegetation, with a small share of impervious elements (pedestrian and bicycle paths). The pond reserves also rainwater from the sewage system that dewaters about 5 ha of the urban area. The maximum depth of the reservoir does not exceed 2 m, and the average depth is about 1.1 m. The area of the water reservoir is 1.23 ha. It was revitalized between 2012 and 2015. The contaminated sediments were removed and the bottom was covered with an isolating layer to decrease water infiltration. The reservoir is a place of rest and recreation for residents, it is also an element increasing the biodiversity of urban spaces. The function of the pond is limited by water quality. Low water transparency (<1 m) during the growing season is caused by the high biomass of phytoplankton in the water column. High water turbidity causes the absence of submerged vegetation. The mean physio-chemical parameters of reservoir waters calculated, based on data gathered during one vegetation season, are presented in Table 1. The method of physio-chemical water parameter determination is indicated in Section 2.2.

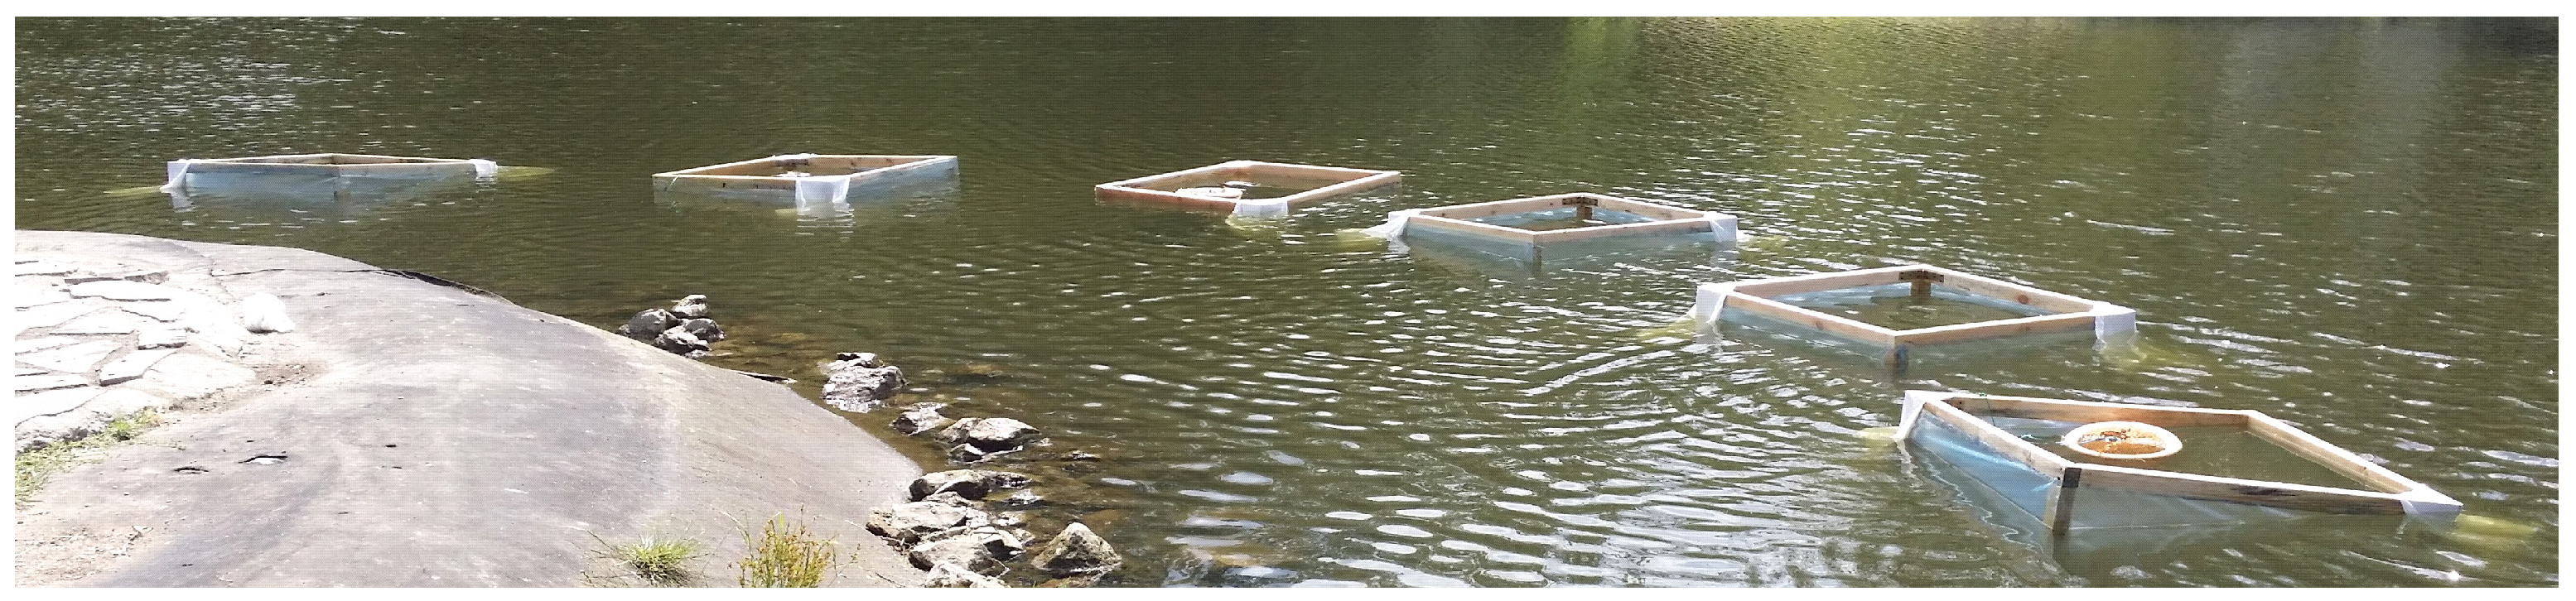
2.2. Description of the Experiment

An in situ mesocosm approach was used. The study point was located within the littoral zone at a distance of over 60 m from the reservoir’s inlet and outlet. Six boxes made of wooden construction and sides of the boxes covered with impermeable material (greenhouse foil) were placed in the pond to limit the water exchange (Figure 1 and Figure 2) during the experiment. The size of the boxes was the following: length: 1 m; width: 1 m; and height: 1 m.
In half of the boxes, the device for supporting submerged water plant development was placed. Myriophyllum spicatum was used as a supporting species. The device was made of plastic mesh with a circular buoy inside (with a diameter of 20 cm), anchored to the bottom by a link and weight. The mesh with vegetation inside was kept near the water surface (Figure 2). No additional experimental treatments on the boxes were carried out. The significant improvement in water quality in boxes without devices for supporting submerged plants is a well-known process resulting from periphyton growth on a mesocosm wall (Chen et al. 1997) [27]. At all monitoring points, the bottom was covered by dark gravel and stones without submerged vegetation.
The spectral reflectance from each box and the reservoir was collected seven times. Measurement intervals were maintained approximately on a weekly basis. The measurement device utilized to collect radiance from the water surface was the UV/NIR spectrometer connected with optic fiber and an optical tube with a lens. The UV/NIR spectrometer with diffraction grating in a Czerny–Turner configuration was manufactured by OPTEL Opole. The aperture, chosen in this way, allows aberration reduction while maintaining high incident light energy on the grating. The monochromators are equipped with slits that are infinitely adjustable in width from 0 to 3 mm, with the best specular resolution of 0.01 mm. During the experiment, the spectral resolution of the measuring device was 1.8 nm. The correct operation of the measuring device was demonstrated by its calibration against reference light sources (standard broadband illuminators). The optical tube placement on the box, angle view, and field of view was established to reduce the influence of the mesocosm walls on the collected reflection spectrum (Figure 3). Each time, the measurements were made around noon in windless weather.
Before the reflectance curves were collected from each box, sunlight spectral reflectance was measured to ensure stable measurement conditions. The reflectance standard—a white panel was used in this case (Figure 4).
Water from the surface layer was collected in a dark glass bottle immediately after spectral measurements from each study site (n = 49). The samples were protected from extensive heat and transported to a laboratory. The chl-a concentration was measured using spectrophotometry according to the procedure of PN-ISO 10260:2002 [28]. The water samples were filtered on glass fiber with a pore diameter of 1.0 µm and then extracted using the ethanol method. The additional physicochemical water parameters that could have had significance on surface water spectral reflectance [29] were also determined according to standard laboratory methods:
  • Total phosphorus—by optical emission spectrometry according to the standard PN ISO 11885:2009 [30];
  • Total nitrogen—by high-temperature combustion with IR detection according to the standard PN-EN 12260:2004 [31];
  • Chemical oxygen demand—spectrophotometric method according to the standard PN-ISO 15705:2005 [32];
  • Conductivity—conductometric method according to the standard PN-EN 27888-1999 [33];
  • pH—potentiometric method according to the standard PN-EN ISO 10523:2021 [34];
  • Oxygen—electrochemical method according to the standard PN-EN ISO 5814:2013-04 [35];
  • Secchi depth—measuring the optical properties of the water column using a disc in accordance with the standard EN ISO/IEC 17025 [36];
  • Turbidity (NTU)—using nephelometers according to standards (PN-EN ISO 7027-1:2016-09) [37];
  • Total organic carbon (TOC) and dissolved organic carbon (DOC)—by oxidation according to PN-EN 1484:1999 [38];
  • Particulate organic matter (POM) by filtration using a cellulose filter and combustion at 600 °C (PN-EN 872:2007 and PN-C-04559-02:1972) [39,40].
Only water quality parameters that were implemented in the current practice of the Central Mining Institute accredited laboratory were used in the research.

2.3. Methodology of Data Analyzing
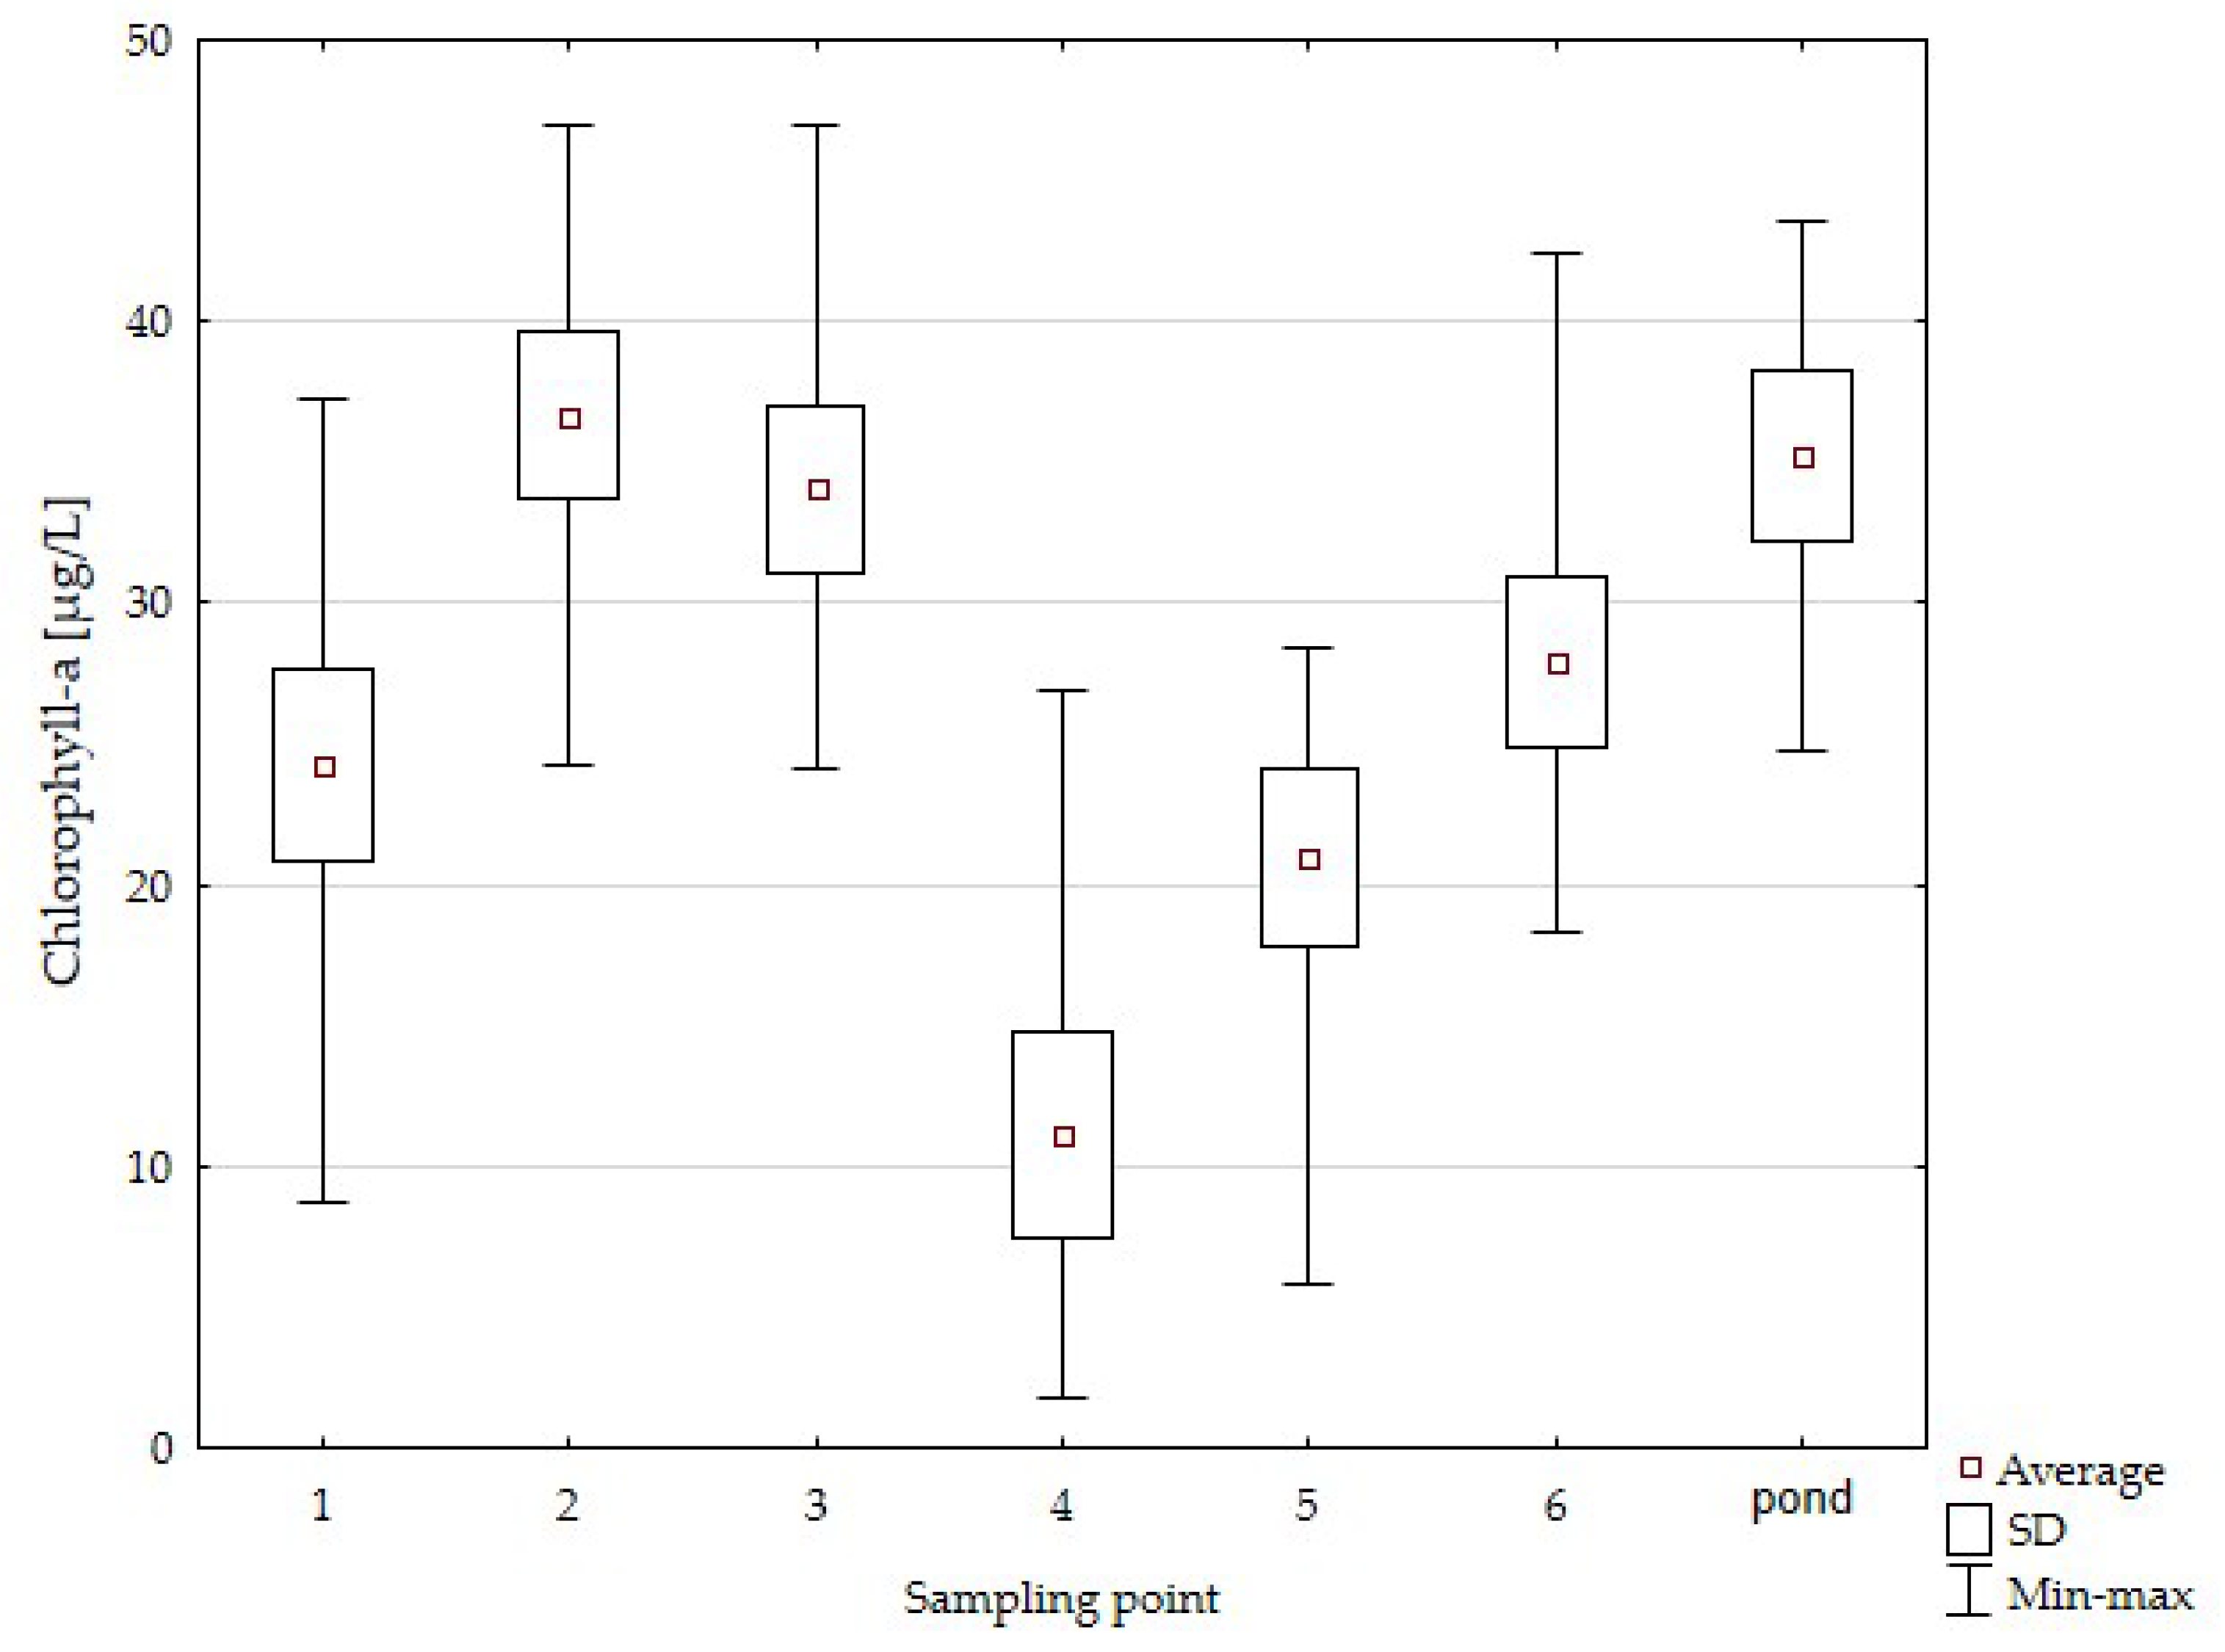
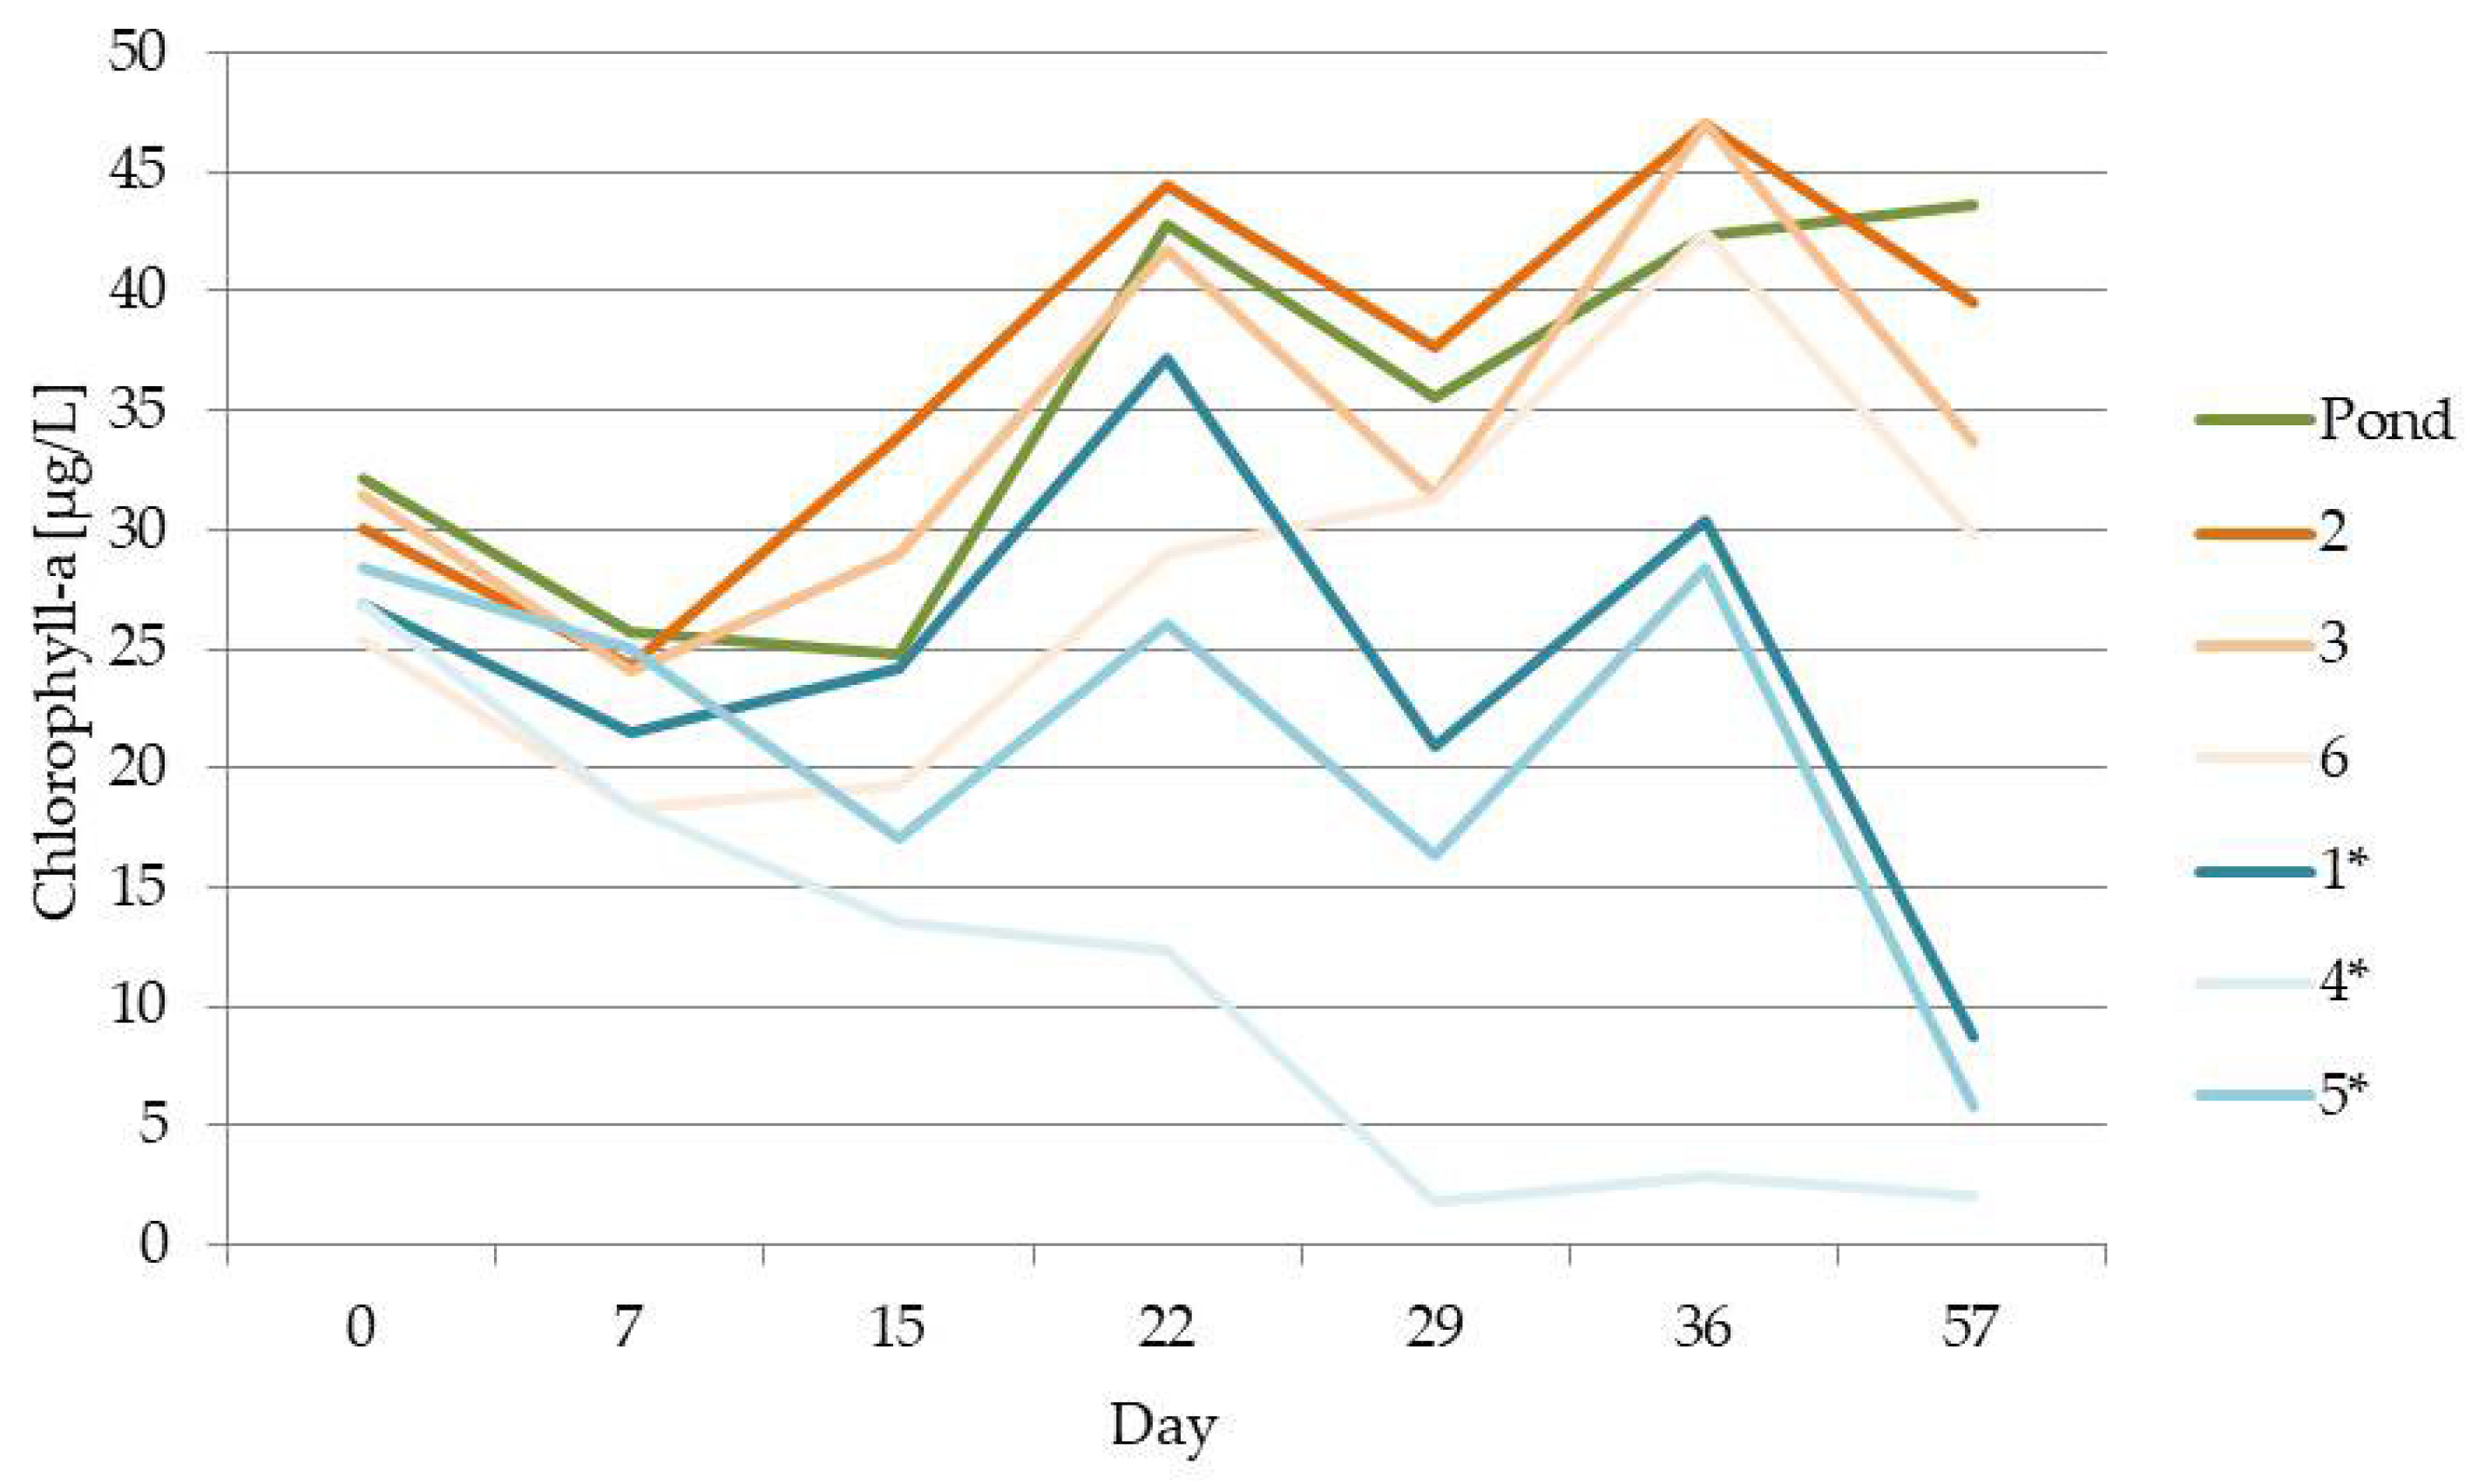
One of the most common approaches to the remote sensing of chlorophyll-a concentration is the collection of the spectral reflectance value within wavelengths where a reflection of the chl-a occurs. The ratios of the two reflectance values were calculated for the known concentration of chl-a. The correlation between the ratios, chl-a concentration, and other physical–chemical parameters is determined [41,42].
Two ranges of wavelength were selected as characteristics for chlorophyll-a concentration changes. One was in the blue and green part of the reflectance spectrum and included the reflectance ratio at 450 and 531 nm (R450/531). The second included the reflectance ratio in the red part of the optical spectrum at 695 and 674 nm (R695/674). The normal distribution of data was confirmed by the Shapiro–Wilk test. The Pearson correlation between the ratios, chlorophyll-a concentration, and other physical–chemical parameters was determined.
Firstly, the analysis was conducted for each box separately. In the next step, all measurement data were treated as one measurement series and the correlation was tested for different concentration ranges.

3. Results

Applied experimental treatments cause significant changes in phytoplankton density in the water (Figure 5 and Figure 6). Especially in 4 and 5 (boxes without submerged vegetation), lower chl-a concentrations were observed. A wider range of chlorophyll was observed in box 5. On the 57th day of the experiment, chl-a concentration in boxes where devices for the support growth of submerged vegetation were introduced (boxes 2, 3, and 6) was maintained between 29.8 µg/L and 39.5 µg/L, while in the boxes without additional maintenance, the concentration was between 2 µg/L and 8.7 µg/L (boxes 1, 4, and 5). At this phase of the experiment, the concentration of chl-a in the pond reached its highest value (43.6 µg/L).
The analysis of the reflectance curves in box 1 where chlorophyll ranged from 8.7 to 37.2 mg/m3 is presented in Figure 5. The higher the content of chlorophyll-a in the water, the higher relative intensity in green observed. In lower chl-a concentrations, higher differences in the red range of the VIS spectrum are observed (Figure 7).
For each box, Pearson correlations were calculated, taking into account the spectral indexes and analyzed physical–chemical parameters (Table 2). Very strong negative and significant correlations were found between chl-a and the R 450/531 index in box 2 where the variability in chl-a ranged between 24.3 and 47 µg/L (−0.90) and in box 6, with chl-a concentrations from 18.3 to 42.4 µg/L (−0.84). Strong negative and significant correlations between these factors were also found in the pond (−0.79; 24.8 > chl-a < 43.6) in box 3 (−0.76; 24.3 > chl-a < 47). An almost perfect linear relationship between the R706/674 index and chl-a shows data from box 4, where chlorophyll-a concentration is maintained between 1.8 and 26.9 µg/L (Table 2). In the next step, the measurement data from each box were grouped into five subseries based on different chlorophyll-a concentration ranges (1–5). A strong negative and significant correlation between R450/531 and chl-a concentration was found for data range 2 and range 4. For R706/674, strong positive correlations and significant dependencies were accounted for also for data range 1 (0.63; 1.8 > chl-a < 21.5) and data range 3 (0.81; 1.8 > chl-a < 26.9). These strong dependencies did not show a correlation analysis of the full range of data (range 5; 1.8 >chl-a < 47) (Table 3).
In the case where the concentration of chlorophyll-a exceeds 24 µg/L, the R706/674 index shows a very strong negative and significant correlation with TOC (−0.91 in the pond and 0.89 in box 2). Such a correlation is not observed in lower concentrations of chlorophyll-a in box 4 (−0.48) and data range 1 (−0.34). The correlation between physical–chemical parameters accounted for the full range of data (range 5) shows that TOC is negatively correlated with the NTU and has no correlation with other parameters (POM and chl-a). TOC shows a negative correlation with the R450/531 index when higher concentrations of chlorophyll–a are observed (−0.71 in range 4 and –0.64 in range 5). A significant correlation between TOC and the R450/531 index is not observed when the concentration of chlorophyll-a is below 27 µg/L (box 4, range 1, range 3). A strong negative correlation between DOC and R706/674 index was found when ch-a concentration was maintained at relatively low levels (box 4, range 1, and range 3). Correlations between the NTU, POM, TOC, DOC, and chlorophyll-a were also considered. Chlorophyll-a in analyzed waters has a strong positive correlation with particulate organic matter (POM) and a strong negative correlation with DOC (−0.91) (Table 4).

4. Discussion

The mesocosm type of experiment allows us to gather a wider range of chl-a variability compared to standard in situ water ecosystem observations. The variable regarding the range of chlorophyll in the reservoir without treatments during the experiment was between 24.8 and 43.6 µg/L, while chl-a in boxes placed in the same reservoir ranged between 1.8 and 47 µg/L. The occurrence of artificial conditions inside boxes termed by Carpenter (1996) [43] “wall effects”, which set limitations on the experiment’s focus on understanding ecological processes in water ecosystems, gives opportunities for the case of experiments aimed at developing methods for the remote estimation of chl-a. The relative importance of periphyton in a mesocosm increases with a decreasing volume-to-surface ratio [44]. This gives the possibility to reduce the time needed for the spontaneous reduction in phytoplankton concentration in the water depth and limit the time of the experiment. In this case, however, the risk of the mesocosm wall’s influence on the analyzed spectrum is increased. The negative relationship between periphyton growth on the mesocosm wall and phytoplankton abundance enables the study of spectral properties of the water surface at low chl-a values in the water column and the search for the relationship in a wider range of environmental factors.
The whole range of observed chl-a variability did not show relationships with selected spectral indexes (R706/674 and R450/531). This means that the wide range of chl-a concentration changes in water did not cause direct changes in water surface spectral characteristics in the range where protein structures were shown to be spectrally active. The correct estimation of chl-a in low concentrations is crucial for developing the effective remote monitoring of anthropogenic water ecosystems. The data gathered by automated remote sensing technologies can be used for planning and verifying the effectiveness of measures to improve the water quality in the reservoir, assessing the risk of cyanobacterial blooms within bathing areas (a health risk for those in direct contact with the water), and supporting the planning and conducting of surface water treatment for municipal needs [45]. The lack of this relationship could be a result of the presence of water and other substances that influence water surface reflectance curves.
In observed waters, the chl-a shows the strongest significant correlation with POM (0.78) (Table 4). Particulate organic matter (POM) normally consists of phyto- and zooplankton cells, bacteria, and detritus [46,47]. Phototrophic microorganisms are primary producers that convert carbon dioxide (CO2) and inorganic nutrients into organic matter using sunlight. Increasing chlorophyll-a concentration indicates a level of phytoplankton biomass. A high level of algae production in the water column stimulates zooplankton and bacteria to grow. The dead biomass of such water organisms forms detritus. Phototrophic microorganisms interact with heterotrophic bacteria and other microorganisms through the microbial loop. Microbes (such as bacteria, archaea, fungi, and protozoa) first access organic nutrients, transforming them into inorganic forms, which are then taken up by phytoplankton, contributing to the recycling of nutrients and the formation of new POM [48].
Light is scattered by suspended particulate material (POM) in the water, causing increased turbidity (NTU). Positive correlations between chl-a and POM and between POM and the NTU confirm the above relationships in analyzed water ecosystems. Among the well known spectral characteristics of chl-a, water could contain other substances that absorb VIS radiation. In particular, phycobilin pigments could be strong absorbers of light from the mid-regions of the spectrum (λ∼460–650 nm) [49]. In some reservoirs, a significant component of particulate organic matter is a protein associated with bacterial activity [50]. These proteins have strong absorption in UV and blue regions (UV absorbers) [51,52]. In Baltic Sea water where POM ranged between 0.329 and 11.3 mg/L, best fit equations between the blue spectral absorption 440 nm and POM concentration were found [53]. In this study, the POM shows a strong correlation with both spectral indexes (R450/531 and R706/674) but only in the range of POM concentration between 4 and 8.4 mg/L (respectively, 0.86 and 0.89) and between 1 and 8.4 mg/L (respectively, 0.59 and 0.79). In the higher POM range, a strong relationship with spectral analyses was not indicated. The results suggest that POM variability is mostly shaped by phytoplankton abundance in the water column, but a significant part of POM consists of another form of organic matter that could interfere with the remote sensing of chl_a in analyzed anthropogenic water. In the case of the analyzed anthropogenic reservoir, POM shows a moderate positive correlation with the R706/674 index, and this means that it could, in a moderate way, interfere with the remote estimation of chl-a concentration.
In the whole range of chl-a concentration, total organic carbon (TOC) reveals a moderate negative correlation both with the R450/531 and R706/674 index. In the same chl-a range, dissolved organic carbon (DOC) shows a strong negative correlation with the R706/674 index. Dissolved organic carbon (DOC) very often contains chemical substances (like humic acids) that heavily influence the spectral water properties and therefore the results of chl-a estimation in estuaries and inland waters [54,55,56]. These substances have the highest absorbance in the ultraviolet and blue range of the electromagnetic spectrum, and the absorption declines with increasing wavelengths [57]. In our case under review, DOC shows a stronger correlation with the red range of the electromagnetic spectrum. The strong correlation between DOC and the R706/674 index was found when the ch-a concentration was maintained at low levels (box 4, range 1, and range 3) (Table 3).
While the variability in chl-a was maintained between 24.1 µg/L and 47 µg/L (range 2) and DOC concentration did not exceed 6.76 mg/L, a stronger correlation between chl-a and the R450/531 index was found. The abovementioned relationship confirms that DOC is the most important factor disturbing the remote estimation of chl-a in analyzed water. Additional research is needed to determine key factors that define the spectral properties of waters in analyzed anthropogenic reservoirs and allow the development of algorithms for higher-accuracy estimations of chl-a.
The research on bio-optical complex water showed that colored dissolved organic matter (CDOM) is independent of the chl-a water quality parameter, which leads to degrading the performance of chl-a remote retrieval [44]. The significant absorption of CDOM in red and near-infrared parts was observed in some lakes in boreal and arctic regions. This means that light backscattered from phytoplankton, the most useful spectral feature for retrieving phytoplankton biomass in optically complex waters (near at 710 nm), could be absorbed by CDOM [58]. The variability in CDOM in anthropogenic reservoirs needs to be analyzed in future research to identify the physio-chemical parameters that determine their water spectral reflectance properties. Many species of phytoplankton, especially cyanobacteria, can directly use organic nutrients, though some forms are energy-intensive to process because they require specific enzymes. The supply of organic matter to the reservoir, in addition to internal processes (primary production and the release from bottom sediments), may have external sources, some of which are influenced by anthropogenic activities (discharges of rainwater and water from sewage treatment plants, leachate from agricultural land, etc.). Human inputs from runoff or groundwater often mix with natural organic sources, creating a chemically diverse nutrient mixture. These processes may significantly affect aquatic ecosystems and their phytoplankton community structures, in particular water ecosystems under anthropogenic pressures [59,60]. For example, phycocyanin, a pigment produced by cyanobacteria but not by many other phytoplankton, causes changes in water surface spectral properties. Due to the complex correlation between water quality parameters and complex surface water optical properties, to enhance remote sensing algorithms, developing multimodal deep learning models for chl-a retrieval in anthropogenic inland water ecosystems should be applied [23]. Comprehensive studies of phytoplankton species composition and identification of all spectrally active substances must also be carried out.

5. Conclusions

In the case of anthropogenic inland waters, developing evaluation algorithms for chl-a retrieval might be a complex process. Performing a mesocosm experiment is an effective approach to evaluating relations between the water quality parameters and corresponding remote sensing reflectance. The obtained results allow for the identification of the most important factor influencing remote sensing. The result shows that the remote estimation of chl-a concentration in anthropogenic water reservoirs is possible, but interfering water compounds have to be taken into account. In situ mesocosm experiments provide valuable data in a wider range of chl-a concentrations, reducing the length of the experiment and ensuring replicability.

Funding

This work was supported by the Ministry of Science and Higher Education, the Republic of Poland (the Statutory Activity of the Central Mining Institute in Katowice, Poland. Work no. 11155039-342).

Data Availability Statement

The datasets analysed during the current study are available from the corresponding author on reasonable request.

Acknowledgments

The author would like to thank the Municipal Road and Bridge Management for the City of Bytom for making the water reservoir available for field research.

Conflicts of Interest

The authors declare that they have no known competing financial interests or personal relationships that could have appeared to influence the work reported in this paper.

References

  1. Adjovu, G.E.; Stephen, H.; James, D.; Ahmad, S. Overview of the Application of Remote Sensing in Effective Monitoring of Water Quality Parameters. Remote Sens. 2023, 15, 1938. [Google Scholar] [CrossRef]
  2. Blackwell, R.J.; Boland, D.H.P. Trophic classification of selected Colorado lakes. In Trophic State of Lakes and Reservoirs; National Aeronautics and Space Administration; U.S. Environmental Protection Agency: Washington, DC, USA, 1979. [Google Scholar]
  3. Caselles, V.; López, M.J.; Soria, J.M. Estudio del estado trófico del lago de la Albufera (Valencia)a partir de imágenes Landsat-5 (TM). In Comunicaciones de la I Reunión Científica del Grupo de Trabajo de Teledetección; Clotet, N., Sole, L., Eds.; Industrias Gráficas Miba: Barcelona, Spain, 1987. [Google Scholar]
  4. Gómez, J.A.D.; Alonso, C.A.; García, A.A. Remote sensing as a tool for monitoring water quality parameters for Mediterranean Lakes 6. Environ. Monit. Assess. 2011, 181, 317–334. [Google Scholar] [CrossRef]
  5. Ortiz, J.L.; Peña, R. Aplicación de imágenes multiespectrales en cartografía de embalses. In Coloquio Hispano-Francésso Bretelle Detección y Aplicación Integrada del Territorio; MOPU, Ed.; MOPU: Madrid, Spain, 1988. [Google Scholar]
  6. Barrett, D.C.; Frazier, A.E. Automated method for monitoring water quality using Landsat imagery. Water 2016, 8, 257. [Google Scholar] [CrossRef]
  7. Allan, M.G.; Hamilton, D.P.; Hicks, B.J.; Brabyn, L. Landsat remote sensing of chlorophyll a concentrations in central North Island lakes of New Zealand. Int. J. Remote Sens. 2011, 32, 2037–2055. [Google Scholar] [CrossRef]
  8. Kneubühler, M.; Frank, T.; Kellenberger, T.; Pasche, N.; Schmid, M.; Lacoste, H.; Ouwehand, L. Mapping chlorophyll-a in Lake Kivu with remote sensing methods. In Proceedings of the Envisat Symposium 2007, Montreux, Switzerland, 23–27 April 2007. ESA SP-636. [Google Scholar]
  9. Song, Y.; Song, X.D.; Jiang, H.; Guo, Z.B.; Guo, Q.H. Quantitative remote sensing retrieval for algae in inland waters. Spectrosc. Spectr. Anal. 2010, 30, 1075–1079. [Google Scholar]
  10. Tebbs, E.J.; Remedios, J.J.; Harper, D.M. Remote sensing of chlorophyll-a as a measure of cyanobacterial biomass in Lake Bogoria, a hypertrophic, saline–alkaline, flamingo lake, using Landsat ETM+. Remote Sens. Environ. 2013, 135, 92–106. [Google Scholar] [CrossRef]
  11. Kutser, T.; Paavel, B.; Verpoorter, C.; Kauer, T.; Vahtmäe, E. Remote sensing of water quality in optically complex lakes. Int. Arch. Photogramm. Remote Sens. Spat. Inf. Sci. 2012, 39, 165–169. [Google Scholar] [CrossRef]
  12. Abbas, M.; Alameddine, I. Predicting water quaily variability in a Mediterranean hypereutrophic monomictic reservoir using Sentinel 2 MSI: The importance of considering model functional form. Environ. Monit. Assess. 2023, 195, 923. [Google Scholar] [CrossRef] [PubMed]
  13. Sodré, E.D.O.; Langlais-Bourassa, A.; Pollard, A.I.; Beisner, B.E. Functional and taxonomic biogeography of phytoplankton and zooplankton communities in relation to environmental variation across the contiguous USA. J. Plankton Res. 2020, 42, 141–157. [Google Scholar] [CrossRef] [PubMed]
  14. Bracher, A.; Bouman, H.A.; Brewin, R.J.W.; Bricaud, A.; Brotas, V.; Ciotti, A.M. Obtaining phytoplankton diversity from ocean color: A scientific roadmap for future development. Front. Mar. Sci. 2017, 4, 55. [Google Scholar] [CrossRef]
  15. Mouw, C.B.; Hardman-Montford, N.; Alvain, S.; Bracher, A.; Brewin, R.J.W.; Bricaud, A.; Ciotti, A.M.; Devred, E.; Fujiwara, A.; Hirata, T.; et al. A consumer’s guide to satellite remote sensing of multiple phytoplankton groups in the global ocean. Front. Mar. Sci. 2017, 4, 41. [Google Scholar] [CrossRef]
  16. Gitelson, A.; Mayo, M.; Yacobi, Y.Z. Signature analysis of reflectance spectra and its application for remote observations of the phytoplankton distribution in Lake Kinneret. In Proceedings of the Mesures Physiques et Signatures en Teledetection, ISPRS 6th International Symposium, Val d’Isere, France, 17–21 January 1994; pp. 277–283. [Google Scholar]
  17. Arenz, J.R.R.F.; Lewis, J.R.W.M.; Saunders, J.F., III. Determination of chlorophyll and dissolved organic carbon from reflectance data for Colorado reservoirs. Int. J. Remote Sens. 1996, 17, 1547–1565. [Google Scholar] [CrossRef]
  18. Gitelson, A.; Yacobi, Y.Z.; Karnieli, A.; Kress, N. Reflectance spectra of polluted marine waters in Haifa Bay, southeastern Mediterranean: Features and application for remote estimation of chlorophyll concentrations. Isr. J. Earth Sci. 1996, 45, 127–136. [Google Scholar]
  19. Cândido, A.K.A.A.; Filho, A.C.P.; Haupenthal, M.R.; da Silva, N.M.; de Sousa Correa, J.; Ribeiro, M.L. Water quality and chlorophyll measurement through vegetation indices generated from orbital and suborbital images. Water Air Soil Pollut. 2016, 227, 224. [Google Scholar] [CrossRef]
  20. Moss, B. Shallow Lakes Biomanipulation and Eutrophication. Scope Newsl. 1998, 29, 2–45. [Google Scholar]
  21. Pierzchała, Ł.; Sierka, E. Do submerged plants improve the water quality in mining subsidence reservoirs? Appl. Ecol. Environ. Res. 2020, 18, 5661–5672. [Google Scholar] [CrossRef]
  22. Rodgers, E.M. Adding climate change to the mix: Responses of aquatic ectotherms to the combined effects of eutrophication and warming. Biol. Lett. 2021, 17, 20210442. [Google Scholar] [CrossRef]
  23. Guo, H.; Zhu, X.; Huang, J.J.; Zhang, Z.; Tian, S.; Chen, Y. An enhanced deep learning approach to assessing inland lake water quality and its response to climate and anthropogenic factors. J. Hydrol. 2023, 620, 129466. [Google Scholar] [CrossRef]
  24. Vallino, J. Improving marine ecosystem models: Use of data assimilation and mesocosm experiments. J. Mar. Res. 2000, 58, 117–164. [Google Scholar] [CrossRef]
  25. Raygosa-Barahona, R.R.; Putzeys, S.; Herrera, J.; Pech, D. Low Cost Mesocosms Design for Studies of Tropical Marine Environments. Biogeosci. Discuss. 2019, 2019, 1–15. [Google Scholar]
  26. Peperzak, L.; Timmermans, K.R.; Wernand, M.R.; Oosterhuis, S.; Van der Woerd, H.J. A mesocosm tool to optically study phytoplankton dynamics. Limnol. Oceanogr. Methods 2011, 9, 232–244. [Google Scholar] [CrossRef]
  27. Chen, C.C.; Petersen, J.E.; Kemp, W.M. Spatial and temporal scaling of periphyton growth on walls of estuarine mesocosms. Mar. Ecol. Prog. Ser. 1997, 155, 1–15. [Google Scholar] [CrossRef]
  28. PN-ISO 10260:2002; Measurement of Biochemical Parameters—Spectrometric Determination of the Chlorophyll-a Concentration. Polish Committee for Standardization: Warsaw, Poland, 2002.
  29. Zhang, Y.; Qin, B.; Zhang, L.; Zhu, G.; Chen, W. Spectral absorption and fluorescence of chromophoric dissolved organic matter in shallow lakes in the middle and lower reaches of the Yangtze River. J. Freshw. Ecol. 2005, 20, 451–459. [Google Scholar] [CrossRef]
  30. ISO 11885:2007; Water Quality—Determination of Selected Elements by Inductively Coupled Plasma Optical Emission Spectrometry. International Organization for Standardization: Geneva, Switzerland, 2007.
  31. EN 12260:2004; Water Quality—Determination of Nitrogen—Determination of Bound Nitrogen (TNb), Following Oxidation to Nitrogen Oxides. Association Francaise de Normalisation: La Plaine Saint-Denis, France, 2004.
  32. PN-ISO 15705:2005; Water Quality—Specifies a Method for the Determination of the Chemical Oxygen Demand (ST-COD) Using the Sealed Tube Method. Polish Committee for Standardization: Warsaw, Poland, 2005.
  33. PN-EN 27888-1999; Water Quality—Determination of Electrical Conductivity. Polish Committee for Standardization: Warsaw, Poland, 1999.
  34. PN-EN ISO 10523:2021; Water Quality—Determination of pH. International Organization for Standardization: Geneva, Switzerland, 2021.
  35. PN-EN ISO 5814:2013-04; Water Quality—Determination of Dissolved Oxygen—Electrochemical Probe Method. International Organization for Standardization: Geneva, Switzerland, 2013.
  36. EN ISO/IEC 17025:2017; General Requirements for the Competence of Testing and Calibration Laboratories. British Standards Institution: London, UK, 2017.
  37. ISO 7027-1:2016; Waterquality—Determination of Turbidity—Part 1: Quantitative Methods. International Organization for Standardization: Geneva, Switzerland, 2016.
  38. PN-EN 1484:1999; Water Analysis—Guidelines for the Determination of Total Organic Carbon (TOC) and Dissolved Organic Carbon (DOC). Polish Committee for Standardization: Warsaw, Poland, 1999.
  39. PN-EN 872:2007; Water Quality—Determination of Suspended Solids—Method by Filtration through Glass Fibre Filters. Polish Committee for Standardization: Warsaw, Poland, 2007.
  40. PN-C-04559-02:1972; Testing of the Suspended Solids Content—Determination of Total Suspended Solids, Mineral Suspended Solids and Volatile Suspended Solids by Mass. Polish Committee for Standardization: Warsaw, Poland, 1972.
  41. Schalles, J.F.; Gitelson, A.A.; Yacobi, Y.Z.; Kroenke, A.E. Estimation of chlorophyll a from time series measurements of high spectral resolution reflectance in an eutrophic lake. J. Phycol. 1998, 34, 383–390. [Google Scholar] [CrossRef]
  42. Osińska-Skotak, K. Możliwość teledetekcyjnego monitorowania zawartości chlorofilu-a w wodach śródlądowych. Teledetekcja Srodowiska 2009, 42, 59–68. [Google Scholar]
  43. Carpenter, S.R. Microcosm experiments have limited relevance for community and ecosystem ecology. Ecology 1996, 77, 677–680. [Google Scholar] [CrossRef]
  44. Chen, J.; Zhu, W.; Tian, Y.Q.; Yu, Q.; Zheng, Y.; Huang, L. Remote estimation of colored dissolved organic matter and chlorophyll-a in Lake Huron using Sentinel-2 measurements. J. Appl. Remote Sens. 2017, 11, 036007. [Google Scholar] [CrossRef]
  45. Pierzchała, Ł. Assessment of the possibility of using remote sensing methods for measuring eutrophication of inland water reservoirs. Ecol. Eng. Environ. Technol. 2020, 21, 27–32. [Google Scholar]
  46. Dzierzbicka-Glowacka, L.; Kulinski, K.; Maciejewska, A.; Jakucki, J.; Pempkowiak, J. Particulate organic carbon in the southern Baltic Sea: Numerical simulations and experimental data. Oceanologia 2010, 52, 621–648. [Google Scholar] [CrossRef]
  47. Winogradow, A.; Mackiewicz, A.; Pempkowiak, J. Seasonal changes in particulate organic matter (POM) concentrations and properties measured from deep areas of the Baltic Sea. Oceanologia 2019, 61, 505–521. [Google Scholar] [CrossRef]
  48. Scheffer, M. Ecology of Shallow Lakes; Chapman & Hall: London, UK, 1998; p. 64. [Google Scholar]
  49. Ficek, D.; Kaczmarek, S.; Ston-Egiert, J.; Wozniak, B.; Majchrowski, R.; Dera, J. Spectra of light absorption by phytoplankton pigments in the Baltic; conclusions to be drawn from a Gaussian analysis of empirical data. Oceanologia 2004, 46, 533–555. [Google Scholar]
  50. Agatova, A.I.; Lapina, N.M.; Torgunova, N.I.; Sapozhnikov, V.V.; Milovskaya, L.V. Organic matter and its rate of transformation in spawning and feeding lakes of Kamchatka. Water Resour. 2004, 31, 691–701. [Google Scholar] [CrossRef]
  51. Wozniak, B.; Wozniak, S.B.; Tyszka, K.; Ostrowska, M.; Majchrowski, R.; Ficek, D.; Dera, J. Modelling the light absorption properties of particulate matter forming organic particles suspended in seawater. Part 2. Modelling results. Oceanologia 2005, 47, 621–662. [Google Scholar]
  52. Madonia, A.; Caruso, G.; Piazzolla, D.; Bonamano, S.; Piermattei, V.; Zappalà, G.; Marcelli, M. Chromophoric Dissolved Organic Matter as a Tracer of Fecal Contamination for Bathing Water Quality Monitoring in the Northern Tyrrhenian Sea (Latium, Italy). J. Mar. Sci. Eng. 2020, 8, 430. [Google Scholar] [CrossRef]
  53. Woźniak, S.B.; Meler, J.; Lednicka, B.; Zdun, A.; Stoń-Egiert, J. Inherent optical properties of suspended particulate matter in the southern Baltic Sea. Oceanologia 2011, 53, 691–729. [Google Scholar]
  54. Sun, D.; Hu, C.; Qiu, Z.; Cannizzaro, J.P.; Barnes, B.B. Influence of a red band-based water classification approach on chlorophyll algorithms for optically complex estuaries. Remote Sens. Environ. 2014, 155, 289–302. [Google Scholar] [CrossRef]
  55. Zhu, W.; Yu, Q.; Tian, Y.Q.; Becker, B.L.; Zheng, T.; Carrick, H.J. An assessment of remote sensing algorithms for colored dissolved organic matter in complex freshwater environments. Remote Sens. Environ. 2014, 140, 766–778. [Google Scholar] [CrossRef]
  56. Brezonik, P.L.; Olmanson, L.G.; Finlay, J.C.; Bauer, M.E. Factors affecting the measurement of CDOM by remote sensing of optically complex inland waters. Remote Sens. Environ. 2015, 157, 199–215. [Google Scholar] [CrossRef]
  57. Zhang, Y.L.; Qin, B.Q.; Ma, R.H.; Zhu, G.W.; Zhang, L.; Chen, W.M. Chromophoric dissolved organic matter absorption characteristics with relation to fluorescence in typical macrophyte, algae lake zones of Lake Taihu. Huan Jing Ke Xue = Huanjing Kexue 2005, 26, 142–147. [Google Scholar]
  58. Kutser, T.; Paavel, B.; Verpoorter, C.; Ligi, M.; Soomets, T.; Toming, K.; Casal, G. Remote sensing of black lakes and using 810 nm reflectance peak for retrieving water quality parameters of optically complex waters. Remote Sens. 2016, 8, 497. [Google Scholar] [CrossRef]
  59. Mackay, E.B.; Feuchtmayr, H.; De Ville, M.M.; Thackeray, S.J.; Callaghan, N.; Marshall, M.; Maberly, S.C. Dissolved organic nutrient uptake by riverine phytoplankton varies along a gradient of nutrient enrichment. Sci. Total Environ. 2020, 722, 137837. [Google Scholar] [CrossRef] [PubMed]
  60. Reinl, K.L.; Harris, T.D.; Elfferich, I.; Coker, A.; Zhan, Q.; Domis, L.N.D.S.; Sweetman, J.N. The role of organic nutrients in structuring freshwater phytoplankton communities in a rapidly changing world. Water Res. 2022, 219, 118573. [Google Scholar] [CrossRef] [PubMed]
Figure 1. Location of study sites: 2, 3, 6—boxes with device for supporting submerged water plant development, 1, 4, 5—boxes without treatment (filled by water), 7—open water monitoring site.
Water 16 01926 g001
Figure 2. Boxes placed in the pond (mesocosm experiment).
Water 16 01926 g002
Figure 3. The optical tube angle of view was 24 degrees. During measurement, the distance between the optical tube and the surface water was 20 cm. Data from 400 to 700 nm were registered (1—optical tube, 2—wall of the mescosm, 3—measuring tripod, 4—monochromator with detector, 5—controller, 6—computer).
Water 16 01926 g003
Figure 4. Sunlight reflectance spectrum measurement.
Water 16 01926 g004
Figure 5. Statistic of the chl-a concentration in each box and pond.
Water 16 01926 g005
Figure 6. Chlorophyll-a concentration changes in the pond and each box (*—mesocosm without additional manipulation).
Water 16 01926 g006
Figure 7. Reflectance curves for cuboid 1.
Water 16 01926 g007
Table 1. Physio-chemical parameters of reservoir waters.
ParameaterMean ValueStandard Deviation
Chlorophill a [µg/L]35.278.02
Secchi disk [m]0.760.09
Chemical oxygen demand [mg/L]282.53
Total organic carbon, TOC [mg/L]7.440.90
Dissolved organic carbon, DOC [mg/L]3.821.34
Total phosphors [mg/L]0.0260.004
Total nitrogen [mg/L]0.790.29
Conductivity [μS/cm]596.509.65
pH8.340.19
Oxygen [mg/L]8.572.26
Table 2. Pearson correlations between spectral indexes (R706/674 and R450/531) and water physical–chemical parameters for each box.
Name of DataIndexRange of Chl-a Concentration [µg/L]Correlation
Chl-aRange of Turbity [NTU]Turbidity [NTU]Range of POM [mg/L]POM [mg/L]Range of TOC [mg/L]TOC [mg/L]Range of DOC [mg/L]DOC [mg/L]
Pond,
n = 6
R706/67424.8–43.6−0.597.5–370.717–13−0.346.1–8.8−0.91<0.5–5.07−0.18
R450/531−0.797.5–370.467–13−0.476.1–8.8−0.680.02
Box 1,
n = 6
R706/6748.7–37.20.232.3–310.732.8–9.40.536.7–8.6−0.711.83–8.28−0.66
R450/531−0.012.3–310.442.8–9.40.356.7–8.6−0.44−0.42
Box 2,
n = 6
R706/67424.3–47−0.526.5–360.766.8–160.136.3–9−0.89<0.5–6.56−0.41
R450/531−0.906.5–360.316.8–16−0.486.3–9−0.630.13
Box 3,
n = 6
R706/67424.1–47−0.495.7–330.756.6–160.567.4–9.6−0.81<0.5–6.76−0.77
R450/531−0.765.7–330.436.6–160.217.4–9.6−0.80−0.37
Box 4,
n = 6
R706/6741.8–26.90.970.72–230.884–8.40.896.7–7.8−0.483.84–11.24−0.96
R450/5310.660.72–230.554–8.40.866.7–7.8−0.08−0.85
Box 5,
n = 6
R706/6745.8–28.40.432–270.784–7.80.616.4–8.4−0.863.84–12.86−0.73
R450/5310.302–270.474–7.80.596.4–8.4−0.55−0.61
Box 6,
n = 6
R706/67418.3–42.4−0.685–260.835.8–9−0.706.5–8.2−0.853.14–6.13−0.07
R450/531−0.845–260.625.8–9−0.836.5–8.2−0.570.39
The bold correlations were considered significant at a probability level of p < 0.05.
Table 3. Pearson correlations between spectral indexes (R706/674 and R450/531) and water physical–chemical parameters for distinguished measurement subseries.
Name of DataIndexRange of Chl-a Concentration [µg/L]Correlation
Chl-aRange of Turbidity [NTU]Turbidity [NTU]Range of POM [mg/L]POM [mg/L]Range of TOC [mg/L]TOC [mg/L]Range DOC [mg/L]DOC [mg/L]
Range 1 (from all, n = 14)R706/6741.8–21.50.630.72–250.901–8.40.797–8.6−0.343.84–12.36−0.90
R450/5310.400.72–250.561–8.40.597–8.6−0.34−0.63
Range 2 (from all, n = 30)R706/67424.1–47−0.364.8–370.705.4–160.156.1–9.6−0.67<0.5–6.76−0.43
R450/531−0.794.8–370.385.4–16−0.336.1–9.6−0.640.03
Range 3 (from all, n =24)R706/6741.8–26.90.810.72–270.881–90.846.5–8.6−0.672.66–12.36−0.85
R450/5310.420.72–270.511–90.616.5–8.6−0.34−0.57
Range 4 (from all, n = 25)R706/67428.4–47−0.174.8–370.725.4–160.396.1–9.6−0.62<0.5–6.760.22
R450/531−0.704.8–370.355.4–16−0.146.1–9.6−0.710.31
Range 5 (all,
n = 44)
R706/6741.8 −470.231–160.7919–35−0.406.1–9.6−0.60<0.5–12.36−0.64
R450/531−0.471–160.3319–35−0.036.1–9.6−0.580.01
The bold correlations were considered significant at a probability level of p < 0.05.
Table 4. Pearson correlations between water physical–chemical parameters for full range of data (n = 44).
VariablesR706/674R450/531Chl-aNTUPOMTOCDOC
R706/67410.540.230.790.45−0.60−0.64
R450/5310.541−0.470.33−0.23−0.580.01
Chl-a0.23−0.4710.280.790.19−0.76
NTU0.790.330.2810.52−0.51−0.69
POM0.45−0.230.790.5210.09−0.91
TOC−0.6−0.580.19−0.510.0910.24
DOC−0.640.01−0.76−0.6−0.910.241
The bold correlations were considered significant at a probability level of p < 0.05.
Disclaimer/Publisher’s Note: The statements, opinions and data contained in all publications are solely those of the individual author(s) and contributor(s) and not of MDPI and/or the editor(s). MDPI and/or the editor(s) disclaim responsibility for any injury to people or property resulting from any ideas, methods, instructions or products referred to in the content.

