Article

Benchmarking Physical Model Experiments with Numerical Simulations for the Wangjiashan Landslide-Induced Surge Waves in the Baihetan Reservoir Area

1
PowerChina Huadong Engineering Corporation Limited, Hangzhou 311122, China
2
Key Laboratory of Ministry of Education for Geomechanics and Embankment Engineering, Hohai University, Nanjing 210098, China
3
Research Institute of Geotechnical Engineering, Hohai University, Nanjing 210098, China
*
Authors to whom correspondence should be addressed.
Water 2024, 16(13), 1930; https://doi.org/10.3390/w16131930 (registering DOI)
Submission received: 8 June 2024 / Revised: 5 July 2024 / Accepted: 5 July 2024 / Published: 7 July 2024

Abstract

:
The Baihetan Hydropower Station reservoir area began impoundment in 2021, triggering the reactivation of ancient landslides and the formation of new ones. This not only caused direct landslide disasters but also significantly increased the likelihood of secondary surge wave disasters. This study takes the Wangjiashan (WJS) landslide in the Baihetan reservoir area as an example and conducts large-scale three-dimensional physical model experiments. Based on the results of the physical model experiments, numerical simulation is used as a comparative verification tool. The results show that the numerical simulation method effectively reproduces the formation and propagation process of the WJS landslide-induced surge waves observed in the physical experiments. At the impoundment water level of 825 m, the surge waves generated by the WJS landslide pose potential threats to the Xiangbiling (XBL) residential area. In this study, the numerical simulation based on computational fluid dynamics confirmed the actual propagation forms of the surge waves, aligning well with the results of the physical experiments at a microscopic scale. However, at a macroscopic scale, there is some discrepancy between the numerical simulation results and the physical experiment outcomes, with a maximum error of 25%, primarily stemming from the three-dimensional numerical source model. This study emphasizes the critical role of physical model experiments in understanding and mitigating surge wave disasters in China. Furthermore, physical experiments remain crucial for accurate disaster prediction and mitigation strategies. The theories and methods used in this study will provide important references for future research related to landslide disasters in reservoir areas.

1. Introduction

The reservoir-induced landslide surge waves disaster is a secondary hazard triggered by the unstable sliding of landslides into reservoir channels [1]. The sliding landslide mass releases tremendous energy upon entering the reservoir, generating surge waves that propagate towards the opposite bank of the river channel as well as upstream and downstream. As a secondary hazard of landslides, landslide-induced surge waves may pose a far more severe threat than the landslides themselves, usually when reservoir water levels change, rainfalls, or earthquakes [2,3,4,5], often resulting in casualties and property damage, even leading to catastrophic consequences such as floods and dam breaches [6,7,8].
Since the mid-20th century, the hazards caused by landslide-induced surge waves have become widespread in reservoir areas. After the landslide, rapid impact on water bodies can trigger severe secondary hazards, particularly affecting residential areas near reservoirs, rivers, and coastlines [9,10,11]. On 9 October 1963, in the northern region of Italy, the left bank valley area of the Vajont Dam experienced instability, resulting in the sudden movement of nearly 2.7 million cubic meters of rock and debris into the Vajont Reservoir. This event generated massive waves that engulfed five surrounding towns, leading to approximately 2000 deaths [12,13,14]. On 12 June 1985, in the northern bank area of Xintan Ancient Town, located in the Xiling Gorge section of the Yangtze River in Hubei Province, China, a mountain slope suddenly became unstable, causing around 300,000 cubic meters of soil and rock to slide into the Yangtze River. The resulting landslide generated waves that exceeded 54 m in height, resulting in 12 fatalities [15]. On 20 July 2009, the Huangtian landslide triggered by rainfall at the Xiaowan Reservoir in Southwest China caused the deaths of approximately 14 people [16,17]. On 24 June 2015, the Hongyanzi landslide in the Three Gorges Reservoir area generated a landslide-induced surge wave over 5 m high, resulting in the deaths of two people [18]. Moreover, on the evening of 22 December 2018, a lateral collapse occurred on the southwestern side of the Anak Krakatau volcano (AK) in Indonesia, triggering a tsunami along the nearby coastline. This event resulted in at least 437 deaths [19].
Research on landslide-induced surge waves has long been an important and significant topic [20,21,22]. Currently, the primary methods employed for investigating landslide waves both domestically and internationally include field surveys, theoretical calculations, physical model experiments, and numerical analysis [23]. Some research utilized theoretical calculations to derive empirical relationships from experimental or field data, thereby generating semi-empirical landslide wave prediction equations [24,25,26,27]. However, due to various assumptions and simplifications, the current methods often have limitations, leading to the generally low predictive accuracy of empirical formulas. As stated by Sabeti and Heidarzadeh [27] and V. Heller and Ruffini [11], wave parameters predicted by empirical equations can vary by a few orders of magnitudes even when derived under similar conditions. Table 1 summarizes the advantages and limitations of typical research methods for landslide-induced surge waves.
The physical model experiment method involves scaling actual engineering dimensions using a certain ratio to achieve geometric similarity, flow motion similarity, and dynamic similarity, adhering to the principles of Froude similarity and gravity similarity. Through corresponding model experiments, necessary research data are obtained to analyze and evaluate actual engineering situations. This method represents the most direct and effective approach for studying landslide waves, facilitating the determination of their mechanisms and influencing factors, as well as the establishment of empirical equations. Physical model experiments have significant advantages in the study of landslide-induced surge waves, enabling high-precision reproduction of actual phenomena, validation of numerical models, revelation of complex mechanisms, and economical and efficient research under safe and controllable conditions. These advantages make them an important tool for understanding and preventing secondary disasters caused by landslide-induced surge waves [28,29,30,31]. Bolin Huang et al. [15] conducted 25 sets of orthogonal experiments on landslide waves in shallow water with Froude numbers ranging from 0.6 to 2.0. By employing the Boussinesq model, they analyzed the longitudinal propagation and the cross-slope climbing characteristics of the waves. Utilizing dimensionless analysis methods, functional relationships were derived between parameters such as the initial wave amplitude and wavelength in shallow water landslide wave models. Han et al. [32] conducted physical modeling using rigid blocks in a three-dimensional water tank, revealing that the types of waves depend primarily on the relative sliding thickness and Froude number at the time of impact. Physical model experiments play an important role in project design. However, due to the significant time and cost required, such experiments are only used for major engineering projects. Table 2 shows the prototype-specific physical model tests of landslide-induced impulse waves conducted for specific engineering or research applications. Zhang et al. [33] proposed a large-scale three-dimensional physical modeling experiment based on the prototype of high-level landslide engineering near dams. The study investigated the relationships between river channel characteristics, landslide volume, landslide surge front velocity, surge waveform, and the peak surge along the river channel. Di Risio et al. [34], through large-scale physical model experiments, analyzed the rise velocity along the coastline in detail, with a particular focus on the impact of each wave within the tsunami package and the evolution of the first set of tsunami envelopes. Based on the Gongjiafang landslide induced by the impoundment of the Three Gorges Reservoir in China, Bolin Huang et al. [35] constructed a large-scale physical model with a scale of 1:200 to reproduce the specific data of collisions and superpositions during the propagation of landslide-induced surge waves, as well as the energy changes between the landslide-induced surge waves and the reflected waves. Yang Wang et al. [36] used the Baishui River landslide as the research subject; a large three-dimensional physical model with a scale of 1:200 was constructed, covering the range from 0.5 km upstream to 3.5 km downstream of the Yangtze River. The study systematically investigated the effects of the dimensionless front area, dimensionless top area, dimensionless two-dimensional volume, and dimensionless three-dimensional volume on wave crest amplitude and wave amplitude ratio.
Numerical simulation involves simulating and analyzing landslide wave problems using numerical models, offering advantages such as efficiency, low cost, and strong repeatability. The advancement of numerical methods has provided an important approach for simulating landslide waves. Yeylaghi et al. [41] utilized the incompressible Smoothed Particle Hydrodynamics (ISPH) method to simulate the waves generated by granular landslides. The motion of sliding masses was modeled as a non-Newtonian flow. Hu et al. [42] successfully simulated the evolution process of landslide waves using the viscoelastic-plastic model and RNG turbulence model in the FLOW3D V11.2. Parameters such as landslide displacement, maximum landslide velocity, maximum wave height on the opposite bank, and maximum wave height generated by landslide sliding were measured. On the other hand, Mao et al. [43] proposed a novel Computational Fluid Dynamics-Discrete Element Method (CFD-DEM) approach, which accurately captures the motion interface between fluid and landslide. Ma et al. [44] introduced a hybrid model combining Smoothed Particle Hydrodynamics (SPHs) and Shallow Water Equations (SWEs) to simulate the waves generated by landslides into valley reservoirs. They validated the proposed model using the Dayantang landslide case study. In addition, Ma et al. [45] first implemented DEM-SPH coupling to study landslide-generated waves within the PFC3D framework. By comparing and analyzing the results with published physical model experiments, the accuracy of this method was evaluated. It can be seen that in recent years, numerical simulation has made great progress in the study of the propagation of landslide surge, but due to the complexity of determining the boundary conditions and calculating the initial conditions of the landslide surge in the reservoir area, the study of the landslide surge in the reservoir area using the numerical simulation method is mainly confined to a simple qualitative evaluation at present. Shizhuang Chen et al. [46] replicated the actual impulse wave disaster near the dam area of the Lianghekou Reservoir by coupling the elasto-viscoplastic model and the RNG turbulence model in FLOW-3D, verifying the reliability of the numerical method. On this basis, a three-dimensional model was established to calculate the potential impulse waves generated by the Mogu Rock landslide and to assess the risk to the dam.
This study focuses on the WJS landslide in the Baihetan Hydropower Station reservoir area of the Jinsha River. Based on the engineering geological data of the WJS landslide and its upstream and downstream river channels, a large-scale three-dimensional physical model was established to assess the potential threat to the XBL residential area using this physical model. Additionally, a three-dimensional numerical model of landslide-induced surge waves was developed, and computational fluid dynamics methods were employed to compare the numerical simulation results with the physical model experiment results. By combining the results of physical model experiments and numerical calculations, this study deepened the understanding of the dynamic mechanisms of the WJS landslide and the generation and propagation patterns of landslide-induced surge waves. The research provides innovative insights into the prevention and control of secondary disasters induced by landslides.

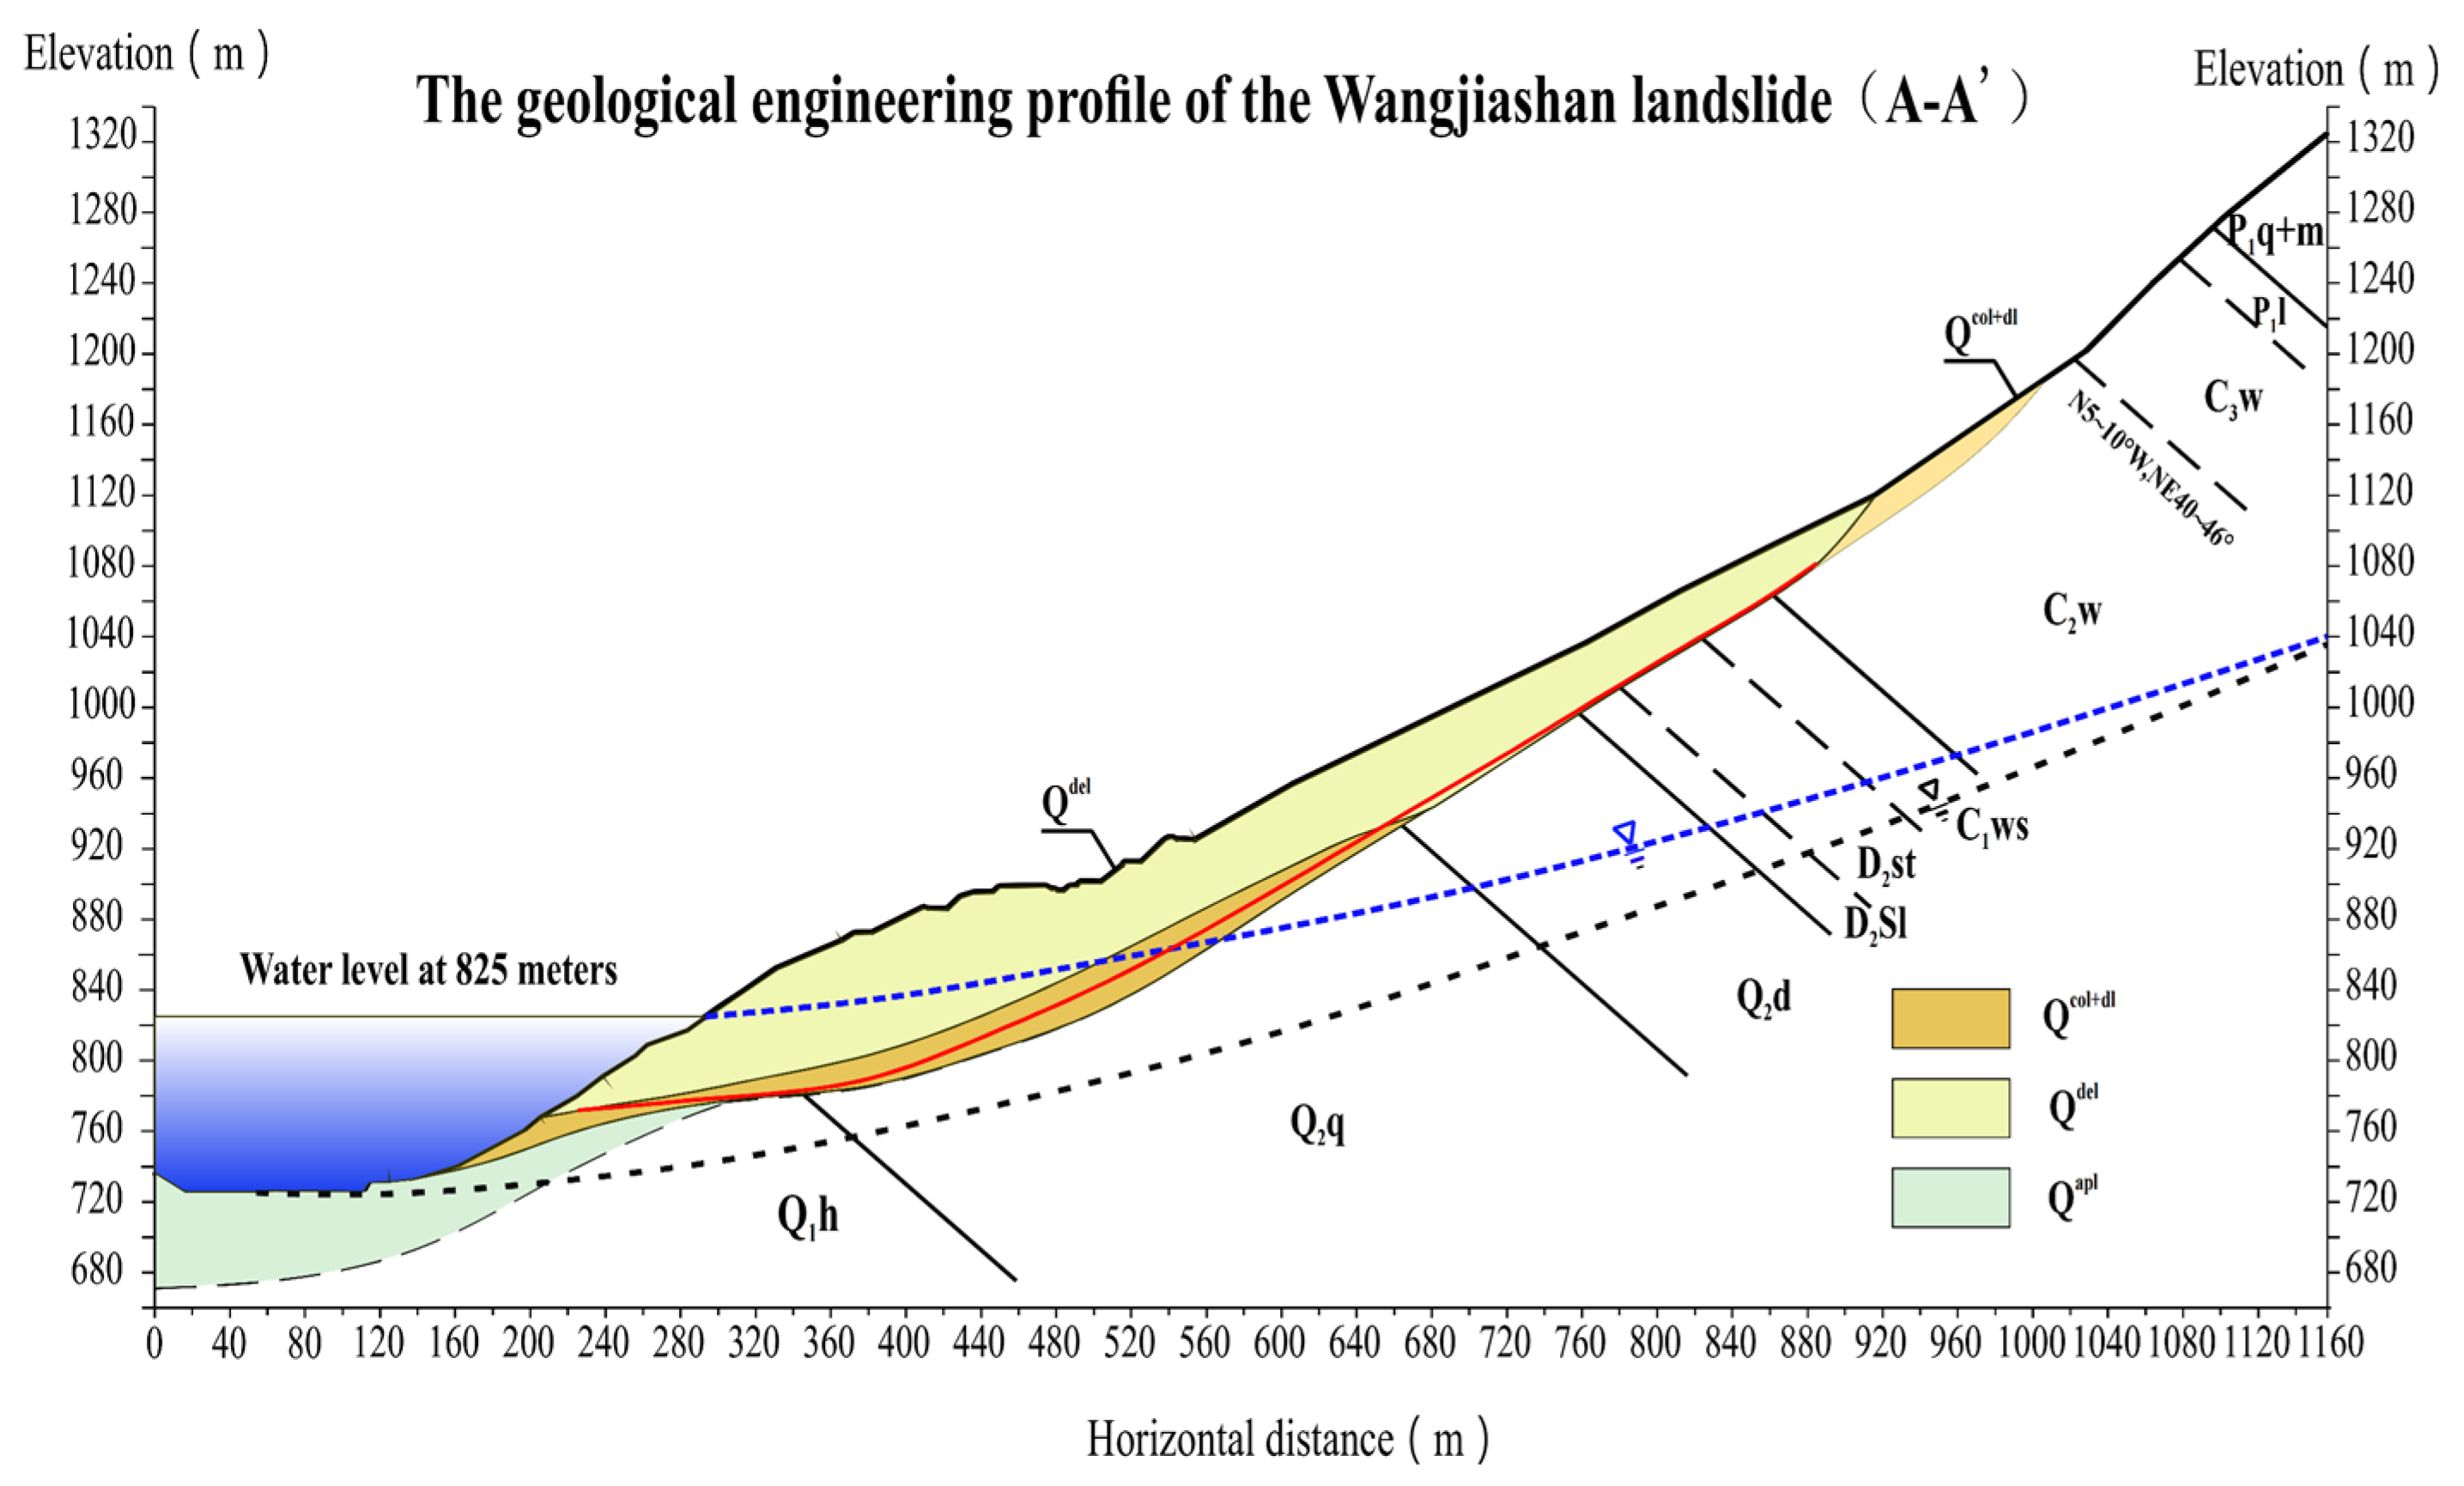
2. Overview of the WJS Landslide

The WJS landslide is located at the confluence of the Jinsha River and Xiaojing River upstream of the Baihetan Reservoir area [47,48], 92.4 km away from the dam site. It is situated diagonally opposite the residential area of XBL on the left bank of the Xiaojing River, with a straight-line distance of 1.3 km (Figure 1). The elevation difference between the front and rear edges of the landslide is approximately 450 m. The landslide has a length along the slope of 800 m and a width ranging from 90 to 500 m, with an area of approximately 23.5 × 10 4     m 2 . The thickness of the landslide deposit ranges from 14.0 to 87.6 m. The landslide body exhibits smaller thicknesses at the front and rear edges and greater thickness in the middle portion, with an average thickness of about 26 m. The composition mainly consists of debris-mixed soil, silt, gravel, and gravel-contained clay. The underlying bedrock includes Ordovician, Devonian, and Carboniferous limestones, dolomites, quartz sandstones interbedded with sandstones and mudstones, and shales. The strike of the rock layers is N5–10°W, dipping northeastward at an angle of 40–46°, with an inward reverse slope. The rock mass is influenced by structural factors, exhibiting developed joints. The rock mass is moderately to highly fractured, predominantly showing strong weathering. The overall volume is approximately 611 × 10 4   m 3 , indicating a large-scale soil landslide (Figure 2).

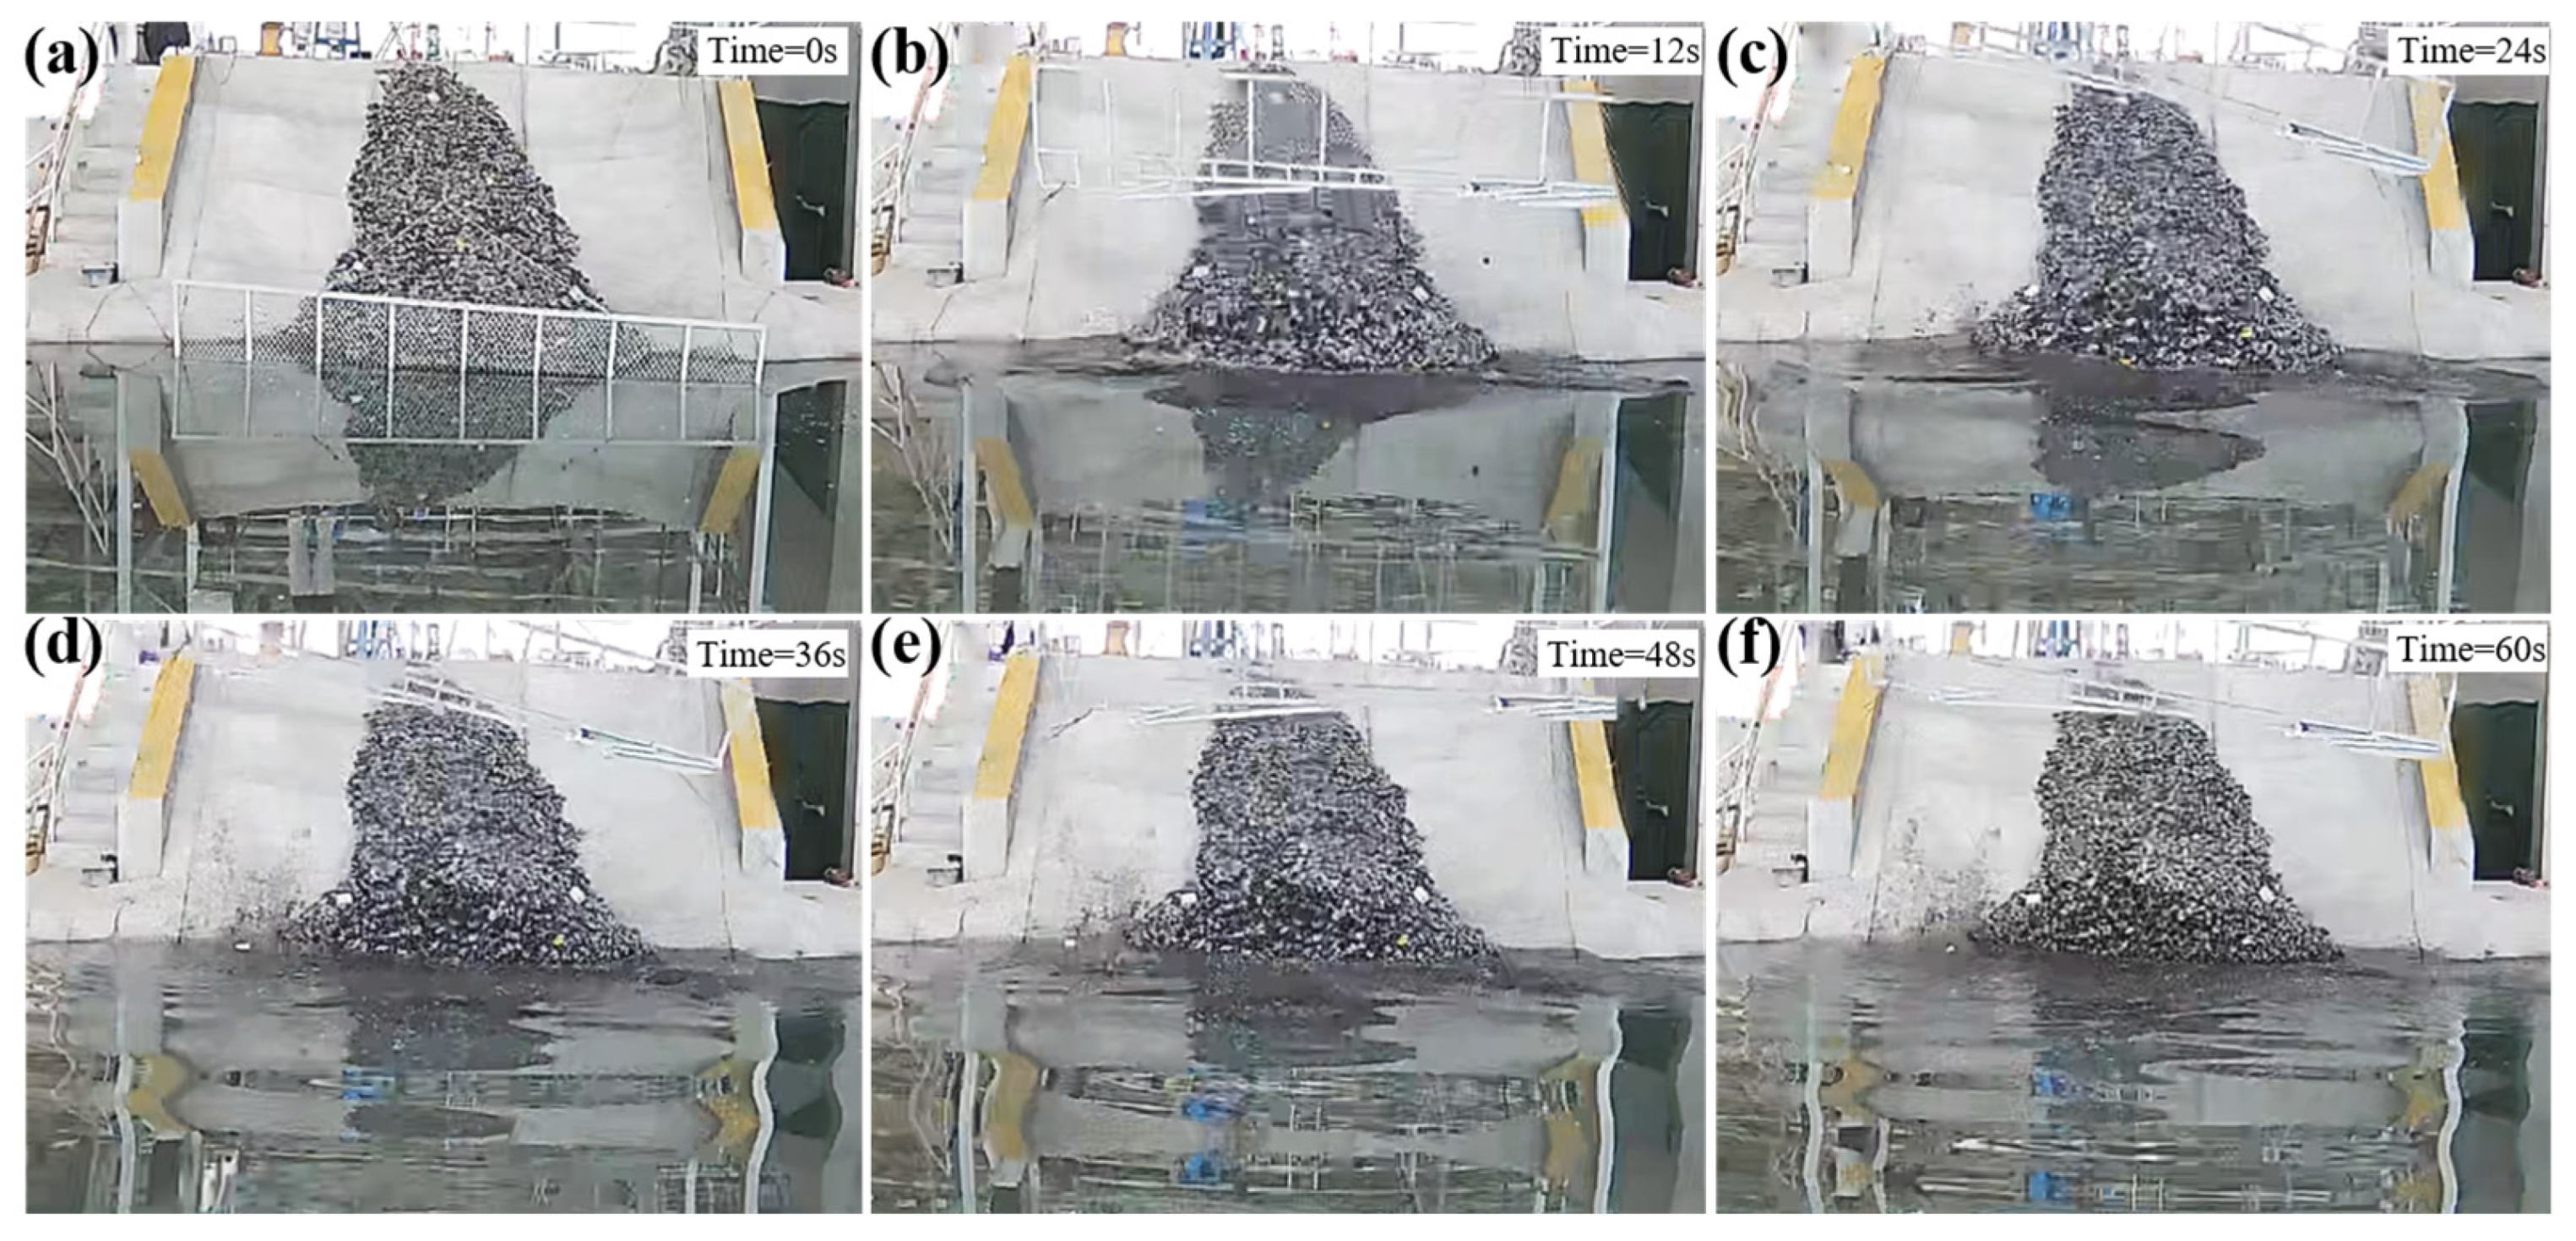
3. Physical Model Experiment of WJS Landslide-Induced Surge Waves

3.1. Establishment of the Physical Model

A large-scale physical model of the WJS landslide was constructed according to the Froude similarity criterion (Figure 3). The model strictly adhered to the conditions of geometric similarity, flow motion similarity, and dynamic similarity, with a geometric scale ratio of 1:150. Based on this similarity criterion, the density similarity ratio and gravity acceleration similarity ratio between the prototype and the model are both 1, while the time similarity ratio and velocity similarity ratio are both 150 . The model is 62 m long and simulates a range from approximately 2 km upstream to 5 km downstream of the WJS landslide, corresponding to a total length of approximately 9 km in reality. It has a width of 38 m, corresponding to an actual river channel width of 5.7 km, and a height of 3 m, simulating terrain elevations ranging from 650 m to 1150 m.
The three-dimensional physical model of WJS was established strictly according to the actual terrain of the engineering area, using materials such as cement, yellow sand, red bricks, and steel bars. The sectional panel method was used to control the shape of the model, with key areas assisted by contour lines. The sectional spacing was set to approximately 60 cm, and the complex terrain areas were densely processed with sectional panels, which were plastered with cement mortar. The sliding bed model was three-dimensionally constructed based on the cross-sectional profile of the landslide. It forms a shallow concave sliding groove. The terrain within the sliding bed alternates between steep and gentle slopes: the upper and lower elevation positions have steeper slopes, while the slope of middle elevation terrain is more gradual. The inclination angles of the landslide sliding surface are consistent with the actual landslide surface. Control devices for the landslide gates were installed at the landslide shear outlet, middle elevation, and upper elevation positions. Positioned at the front end of the landslide, the landslide gates serve to block the movement of the landslide. Once the gates are rapidly raised, the landslide begins sliding downwards toward the water.
In physical experiments of landslide-induced surge waves, landslide materials are generally simplified into three states: rigid body, granular body, and deformable body [49]. Based on the research by Valentin Heller and Hager [30] and the requirements of practical engineering, similar to common landslide-induced surge wave model experiments, this study adopted model similarity in landslide velocity rather than in landslide rheology. After the WJS landslide failure, the deformation movement was mainly of gravel-mixed soil, with a low likelihood of the slide mass completely disintegrating into debris [37,39,50]. Therefore, this experiment used granular materials to simulate the landslide mass, with similar granular materials being black pebbles. Four particle size ranges of block stones, ranging from 0 to 0.5 cm, 0.5 to 2 cm, 2 to 6 cm, and 6 to 20 cm, were mixed in proportions of 1:1.5:1.25:1, resulting in an average particle size of approximately 0.05 m and a density of approximately 2260 kg/ m 3 for the landslide material. According to the model scale, the volume of landslide accumulation in the physical model experiment was 1.81 m 3 , corresponding to an actual volume of 611 × 10 4   m 3 .

3.2. Experimental Monitoring System and Equipment

Experimental measurement instruments include a high-definition camera, wave height gauge, and run-up meter. High-definition cameras with 400 MP resolution were employed to record the entire process from the initiation of the landslide entering and wave generation. Ten high-definition cameras provided a comprehensive coverage of the entire flow field area. To study the generation and propagation characteristics of landslide waves, a series of wave gauges and climbing gauges (numbered 1 # 17 # ) were deployed in the reservoir channel. In the area where the waves were generated, wave gauges numbered 1 # and 2 # and climbing gauge 3# were positioned to monitor the characteristics of the wave generation as soon as the landslide material touched the water surface. Wave gauges numbered 4 # 11 # were placed in the propagation area of the waves to monitor the wave characteristics as they propagated upstream and downstream along the river channel. Climbing gauges numbered 12 # 17 # were installed in the XBL residential area to monitor the characteristics of water flow ascent in XBL. The experiment utilized wave gauges equipped with SAD2000 sensors to collect data at a frequency of 50 Hz with an accuracy of 0.1 mm.

3.3. Analysis of Experimental Scale Effects

The present experiment neglects both the scale effects caused by surface tension in the impact area of the slider and the fluid viscosity on the experimental results. Valentin Heller and Hager [30] conducted a detailed study on the scale effects of waves generated by underwater landslides, suggesting that Reynolds number ( R = g 1 / 2 h 3 / 2 / v w ) and Weber number ( w = ρ w g h 2 / σ w ) can be used to separately assess the effects of fluid viscosity and liquid surface tension on wave motion. Here, v w and σ w represent the kinematic viscosity and surface tension coefficients of the fluid, respectively. The experimental environment remained at room temperature (25 °C) and under standard atmospheric pressure, with the kinematic viscosity and surface tension of water making up 8.937 × 10 7   m 2 / s and 7.28 × 10 2   N / m , respectively. The average still water depth during the experiment was 0.66 m. Based on the defined criteria of Reynolds number ( R 3 × 10 5 ) and Weber number ( W 5000 ), the scale effects induced by surface tension and fluid viscosity can be neglected for the region of sliding impact on the water body.

3.4. Experimental Analysis

In order to investigate the potential threat of the WJS landslide to the XBL residential area, physical model experiments of landslide waves were conducted under the following conditions: prototype’s water level was maintained at 825 m; in addition, the accumulation volume of a landslide was set at 1.81 m 3 .
By extracting video footage from a high-speed camera, foundational data were provided for the analysis of the movement characteristics of granular landslide-induced surge waves, and the entire experimental process was analyzed. As shown in Figure 4, the landslide took 60 s from the initial slide to fully entering the water. In the 0–12 s (Figure 4a,b) after the front end of the slide mass lost the constraint of the landslide gate device, the landslide began to impact the water body and generate surge waves, accompanied by a large number of bubbles and splashes. In the 12–24 s period (Figure 4c), under the action of its own weight, the slide mass accelerated downhill, displacing a large volume of water ahead. The water curled up under the influence of the slide mass, forming a concave cavity and generating semi-circular arc-shaped surge waves. In the 24–36 s period (Figure 4d), the slide mass collided with the bottom, slowly accumulating due to friction. The semi-circular arc-shaped surge waves continued to propagate forward, forming the first wave. In the 36–48 s period, as the accumulated volume at the bottom of the slide mass gradually increased, the motion of the slide mass became relatively stable. Due to the obstruction of the accumulated slide mass at the front and the resistance of the water body, the upper part of the slide mass accumulated near the rear edge, with the accumulation shape being thick in the middle and thin on both sides. In the 48–60 s period (Figure 4e,f), the mechanical energy of the slide mass was almost completely converted into wave energy, with only a few granular particles at the edges of the slide mass remaining unstable. The generated waves propagated around the reservoir channel, with propagation characteristics similar to three-dimensional unrestricted propagation.
Observing the surge wave climb in the XBL residential area through the physical model experiment, it was found that the XBL residential area was partially submerged under the impact of the surge waves. The XBL residential area is surrounded by water on three sides, and the surge waves propagate from the tip of XBL, the left bank of the Jinsha River, and the junction of XBL and the narrow bank slope of the reservoir channel. The surge waves generated by the WJS landslide reached a maximum height of 3.74 m in the XBL residential area, posing a serious threat to the lives and property of the residents of XBL.

4. Numerical Simulation of Landslide-Induced Surge Waves Based on Fluid Dynamics

This study employs a three-dimensional numerical simulation method based on fluid dynamics to investigate the landslide-induced surge waves of WJS. The calculations utilize the FLOW-3D software, coupling the granular flow model and the RNG turbulence model [51] in FLOW-3D. The landslide mass is modeled as a granular flow, while the motion of the water is described using the RNG turbulence model. The primary method used for tracking free surfaces is the Volume of Fluid (VOF) method. The waves generated by the impact of the landslide mass on the water are simulated within the framework of incompressible viscous fluid flow. The governing equations for fluid motion in the FLOW-3D software primarily consist of two equations: the Navier–Stokes equations for incompressible viscous fluid motion and the continuity equation.
To ensure the reliability of the computational results, the model parameters were strictly consistent with relevant geological reports. Under conditions of 20 °C, the density of water was set at 998.2 kg/ m 3 and the dynamic viscosity was set at 0.001 kg/m/s. According to relevant engineering reports, the particle diameter of the landslide material was specified as d = 0.05 m, with an average internal friction angle of Φ = 36°. Based on engineering reality, the density of the granular material was set at 2260 kg/ m 2 , the global ventilation coefficient was set at 0.02, the coefficient of restitution for particle collisions was set at 0.7, the Poisson’s ratio was 0.36, the friction coefficient of the channel bank slope was 0.60, and the roughness coefficient of the river channel was set to the roughness value of mountainous rivers, which is 0.04 [52]. Assuming a water level of 825 m, numerical simulation calculations were conducted, with the positions of wave height and elevation monitoring points in the numerical model corresponding to those in the physical model experiment.

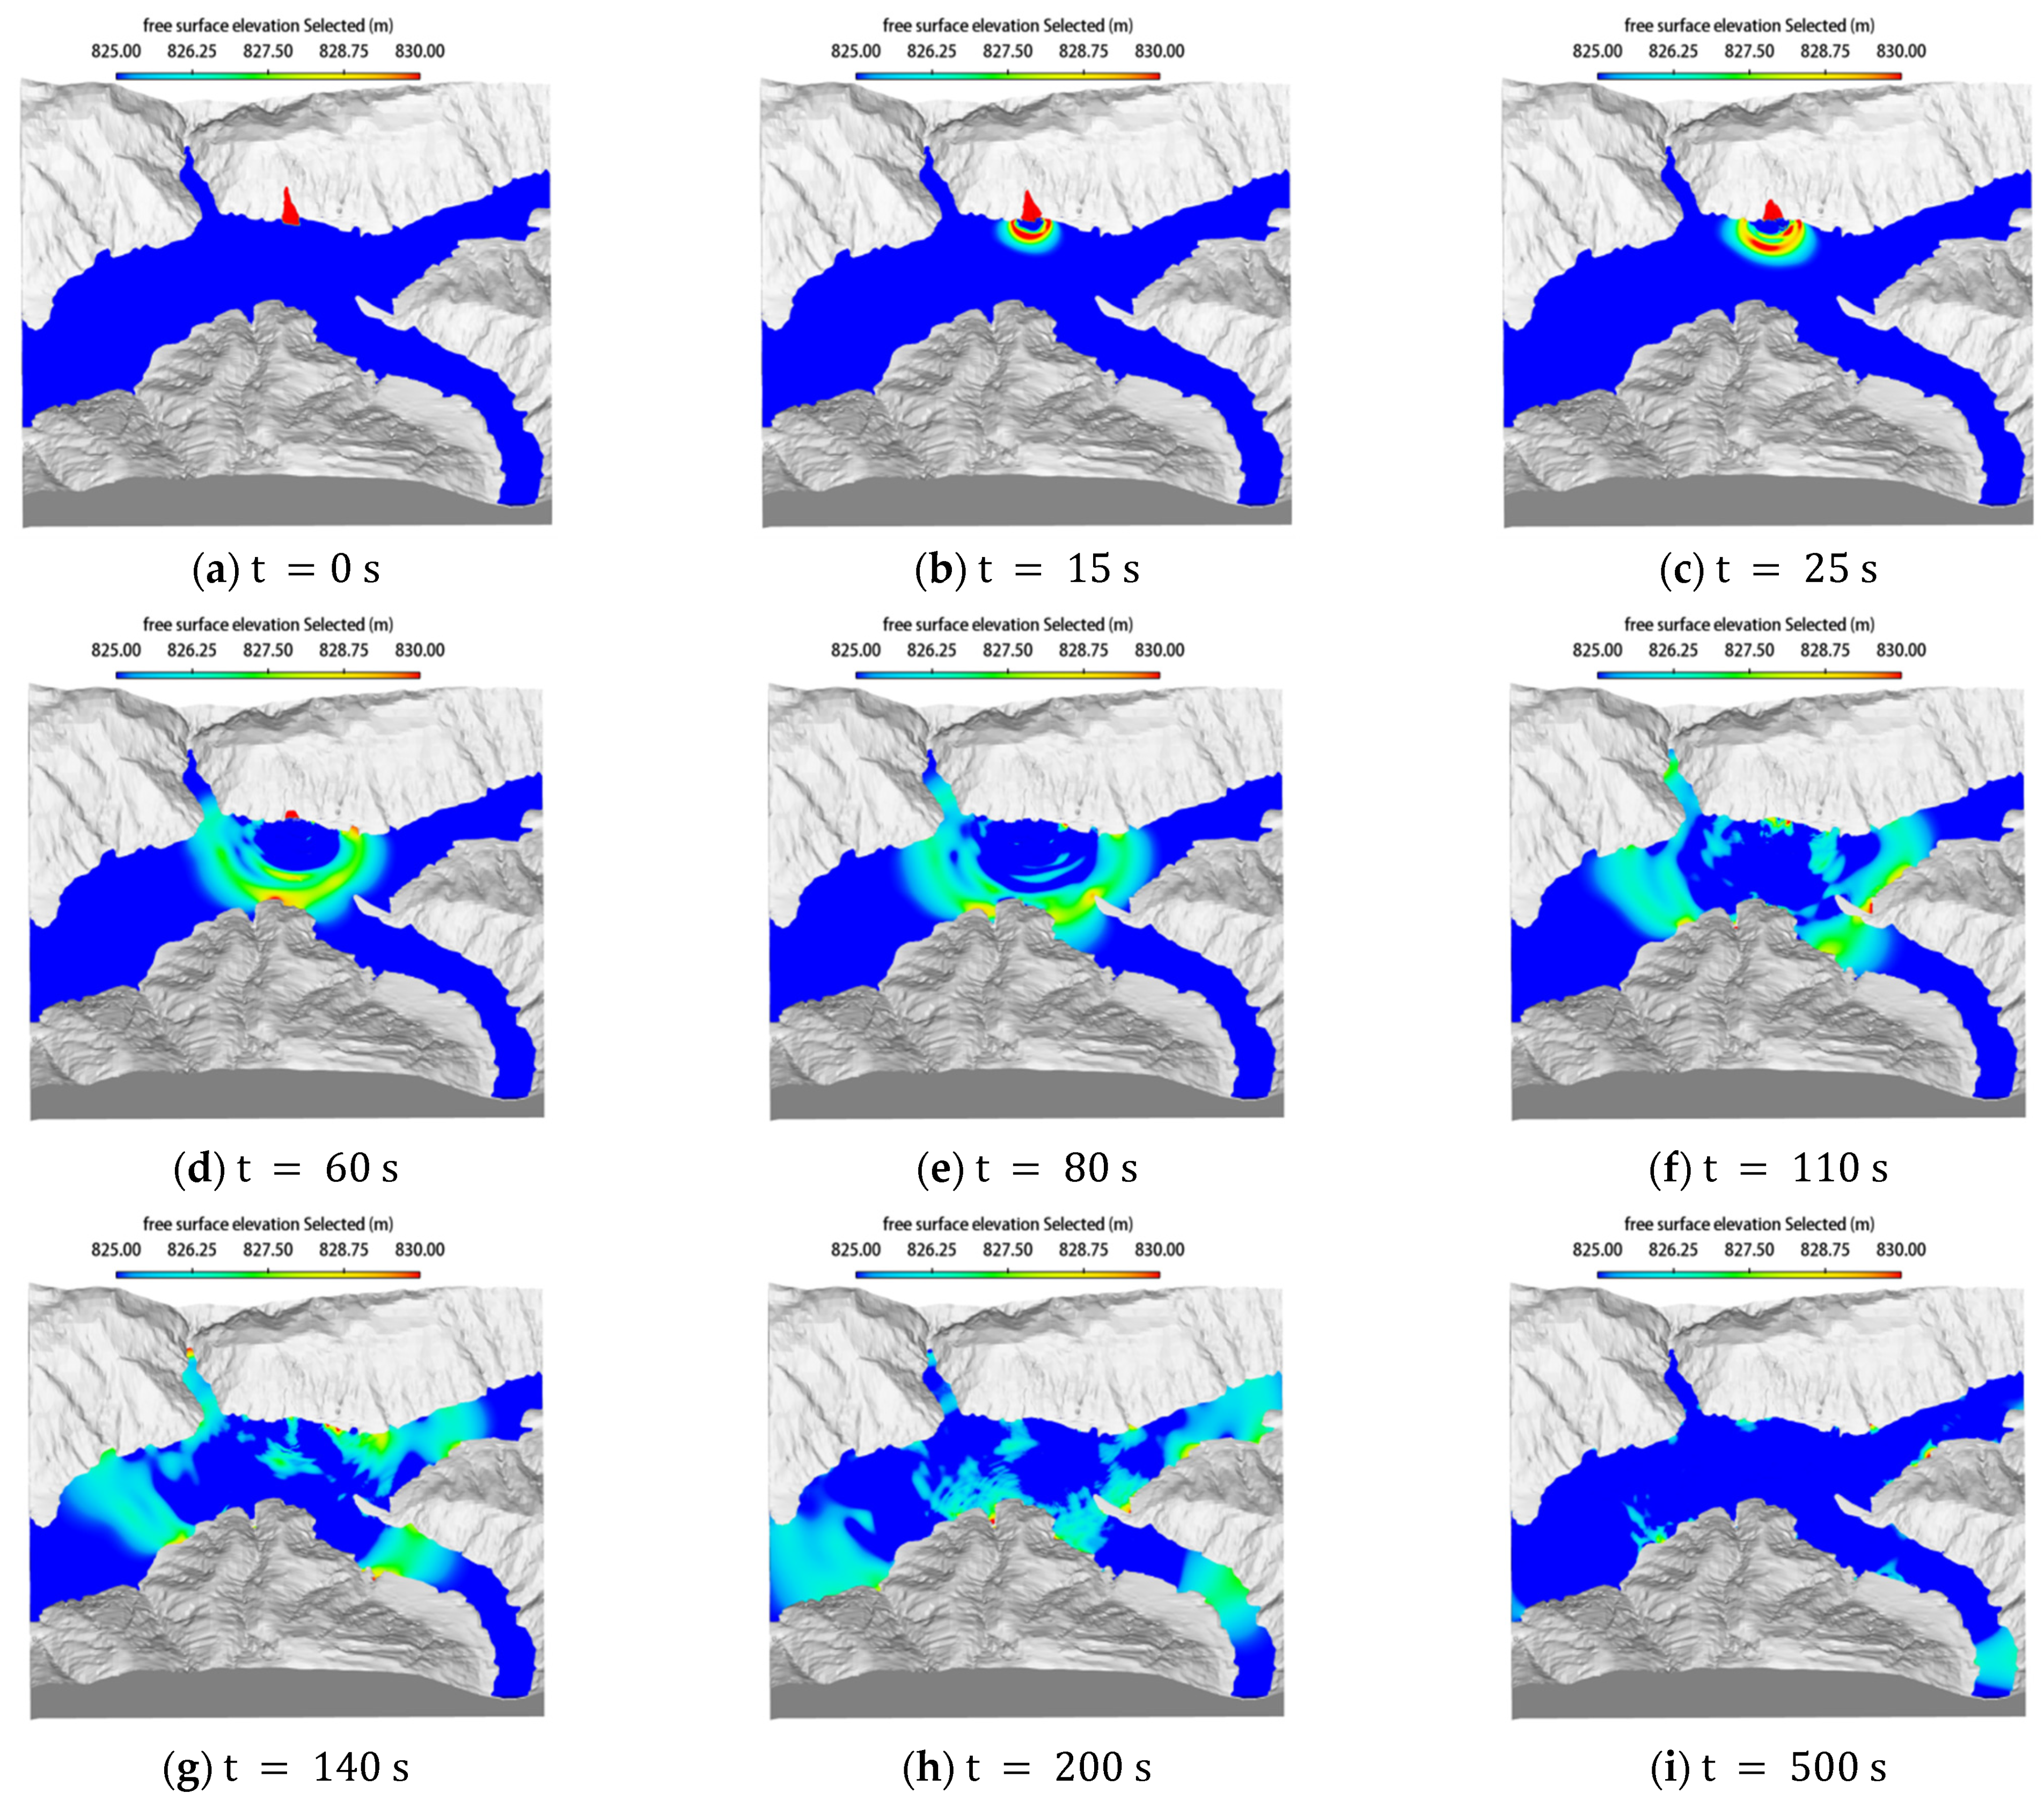
Numerical Simulation Elucidates the Formation and Propagation of Landslide-Induced Surge Waves

The entire process starts from the generation of waves until the river surface returns to calm. To analyze such a process, the simulation model’s calculation time is set to 500 s. Throughout the development and propagation of the waves, crest and trough formations are observed. To facilitate the observation of wave crests, the minimum value of the contour is set to the experimental water level (825 m). During the rendering of the results, the color of the free surface is adjusted to change with the variation in the liquid surface height. After rendering, an animation depicting the complete process of the landslide-induced surge waves is obtained, and specific moments of the wave are selected for illustration, as shown in Figure 5.
According to the process of the propagation of the waves, at t = 0 s, the landslide has not yet started moving, and the free surface height of the river is 825 m, with the water surface in a calm state (Figure 5a). At t = 15 s, the height of the generated waves has already exceeded 5 m (Figure 5b). At t = 25 s, after the landslide enters the water, a large amount of water is displaced, forming a downward concave cavity at the point where the landslide enters the water (Figure 5c). Under the pressure of the surrounding water, there is a tendency for water to flow into the cavity from all sides. As the landslide slides downwards, there is also a tendency to push the water forward, forming a large semicircular wave in front of the landslide’s entry point. Such a wave has the maximum wave height at the center and smaller wave heights at the edges. After developing through the generation zone, the wave climbs towards the opposite bank. At t = 45 s, the landslide has completely entered the river channel, and the first wave begins to impact the opposite bank and the XBL (Figure 5d). At t = 60 s, the first wave begins to impact the XBL (Figure 5e), followed by the second and third waves (Figure 5f). After t = 140 s, the waves continue to propagate along the upstream and downstream channels and flow into the valleys (Figure 5g,h). After t = 500 s, the river surface gradually returns to a calm state (Figure 5i).

5. Benchmarking Physical Model Experiments Using Numerical Simulations

The process of landslide-induced surge waves can be divided into five stages: landslide motion stage, interaction with water and air stage, wave generation stage, wave propagation stage, and the stage of wave impact on nearby buildings and the environment [53]. Focusing on the three typical stages of landslide wave generation, propagation, and wave run-up under the condition of a reservoir water level of 825 m, a comparative study between physical experiments and numerical simulation results was conducted from macroscopic and microscopic perspectives to validate the numerical simulation method. The surge wave characteristic results from the physical model experiment and the numerical simulation at 17 measurement points are shown in Table 3.

5.1. Comparison and Analysis of Wave Generation Zones

The surge wave generation area refers to the region near the source of the surge waves. In this area, wave characteristics are significant and energy is concentrated, greatly impacting the surrounding environment. As the landslide body begins to slide, it displaces a large volume of water ahead of it. The water curls under the influence of the sliding body, forming a cavity and generating a semicircular surge wave that propagates forward. The wave height is highest in the middle and lower at the edges. After developing in the generation area, the waves climb up the opposite shore. The WJS landslide is a submerged slope with a lower impact speed, characterized by a low Froude number (Fr). It is less likely to form solitary waves and tidal bore types of surge waves. The main observed forms of landslide-induced surge waves in the generation area were nonlinear oscillation waves.
The wave generation zone was compared and analyzed by recording the water level fluctuations at measurement points 1 # , 2 # wave gauges, and 3 # tide gauge during both physical experiments and numerical simulations of landslide-generated waves. From the water level fluctuations at individual measurement points that are shown in Figure 6, one can see that both the physical experiments and numerical simulations exhibit a prominent initial wave. As the first wave propagates along the reservoir channel, the wave surface appears to be smooth, with the wave peaks wider and higher than the troughs. Visually, the waves exhibit a tendency of rearward propagation. With the increase in propagation distance, wave amplitude decreases while the overall wave morphology remains largely unchanged. Following the first wave, wave superposition becomes evident. The waves after 1 # 3 # exhibit a wave packet structure, characterized by alternating large and small amplitude waves. The wavelength and amplitude of the second wave are noticeably smaller than those of the first wave. Compared to measurement points 1 # and 2 # , the wave attenuation rate at 3 # is higher, attributed to the reflection of waves generated by the impact at 3 # on the opposite bank, resulting in energy dissipation through wave superposition and collision.
By comparing the wave height fluctuation curves from measurement points 1 # 3 # between physical experiments and numerical simulations in the wave generation zone, it can be observed that the waveforms are generally similar. Particularly, there is a high degree of agreement in the peak wave height, with errors less than ±10%. As the distance from the disturbance point increases, the arrival time of the initial wave is also correspondingly delayed. This indicates a temporal and spatial consistency of wave motion. However, for measurement point 3 # , there is some discrepancy after time node t = 80 s, which may be attributed to size effects. Although the similarity in waveforms persists, the degree of agreement in wave height between numerical and physical simulations decreases.

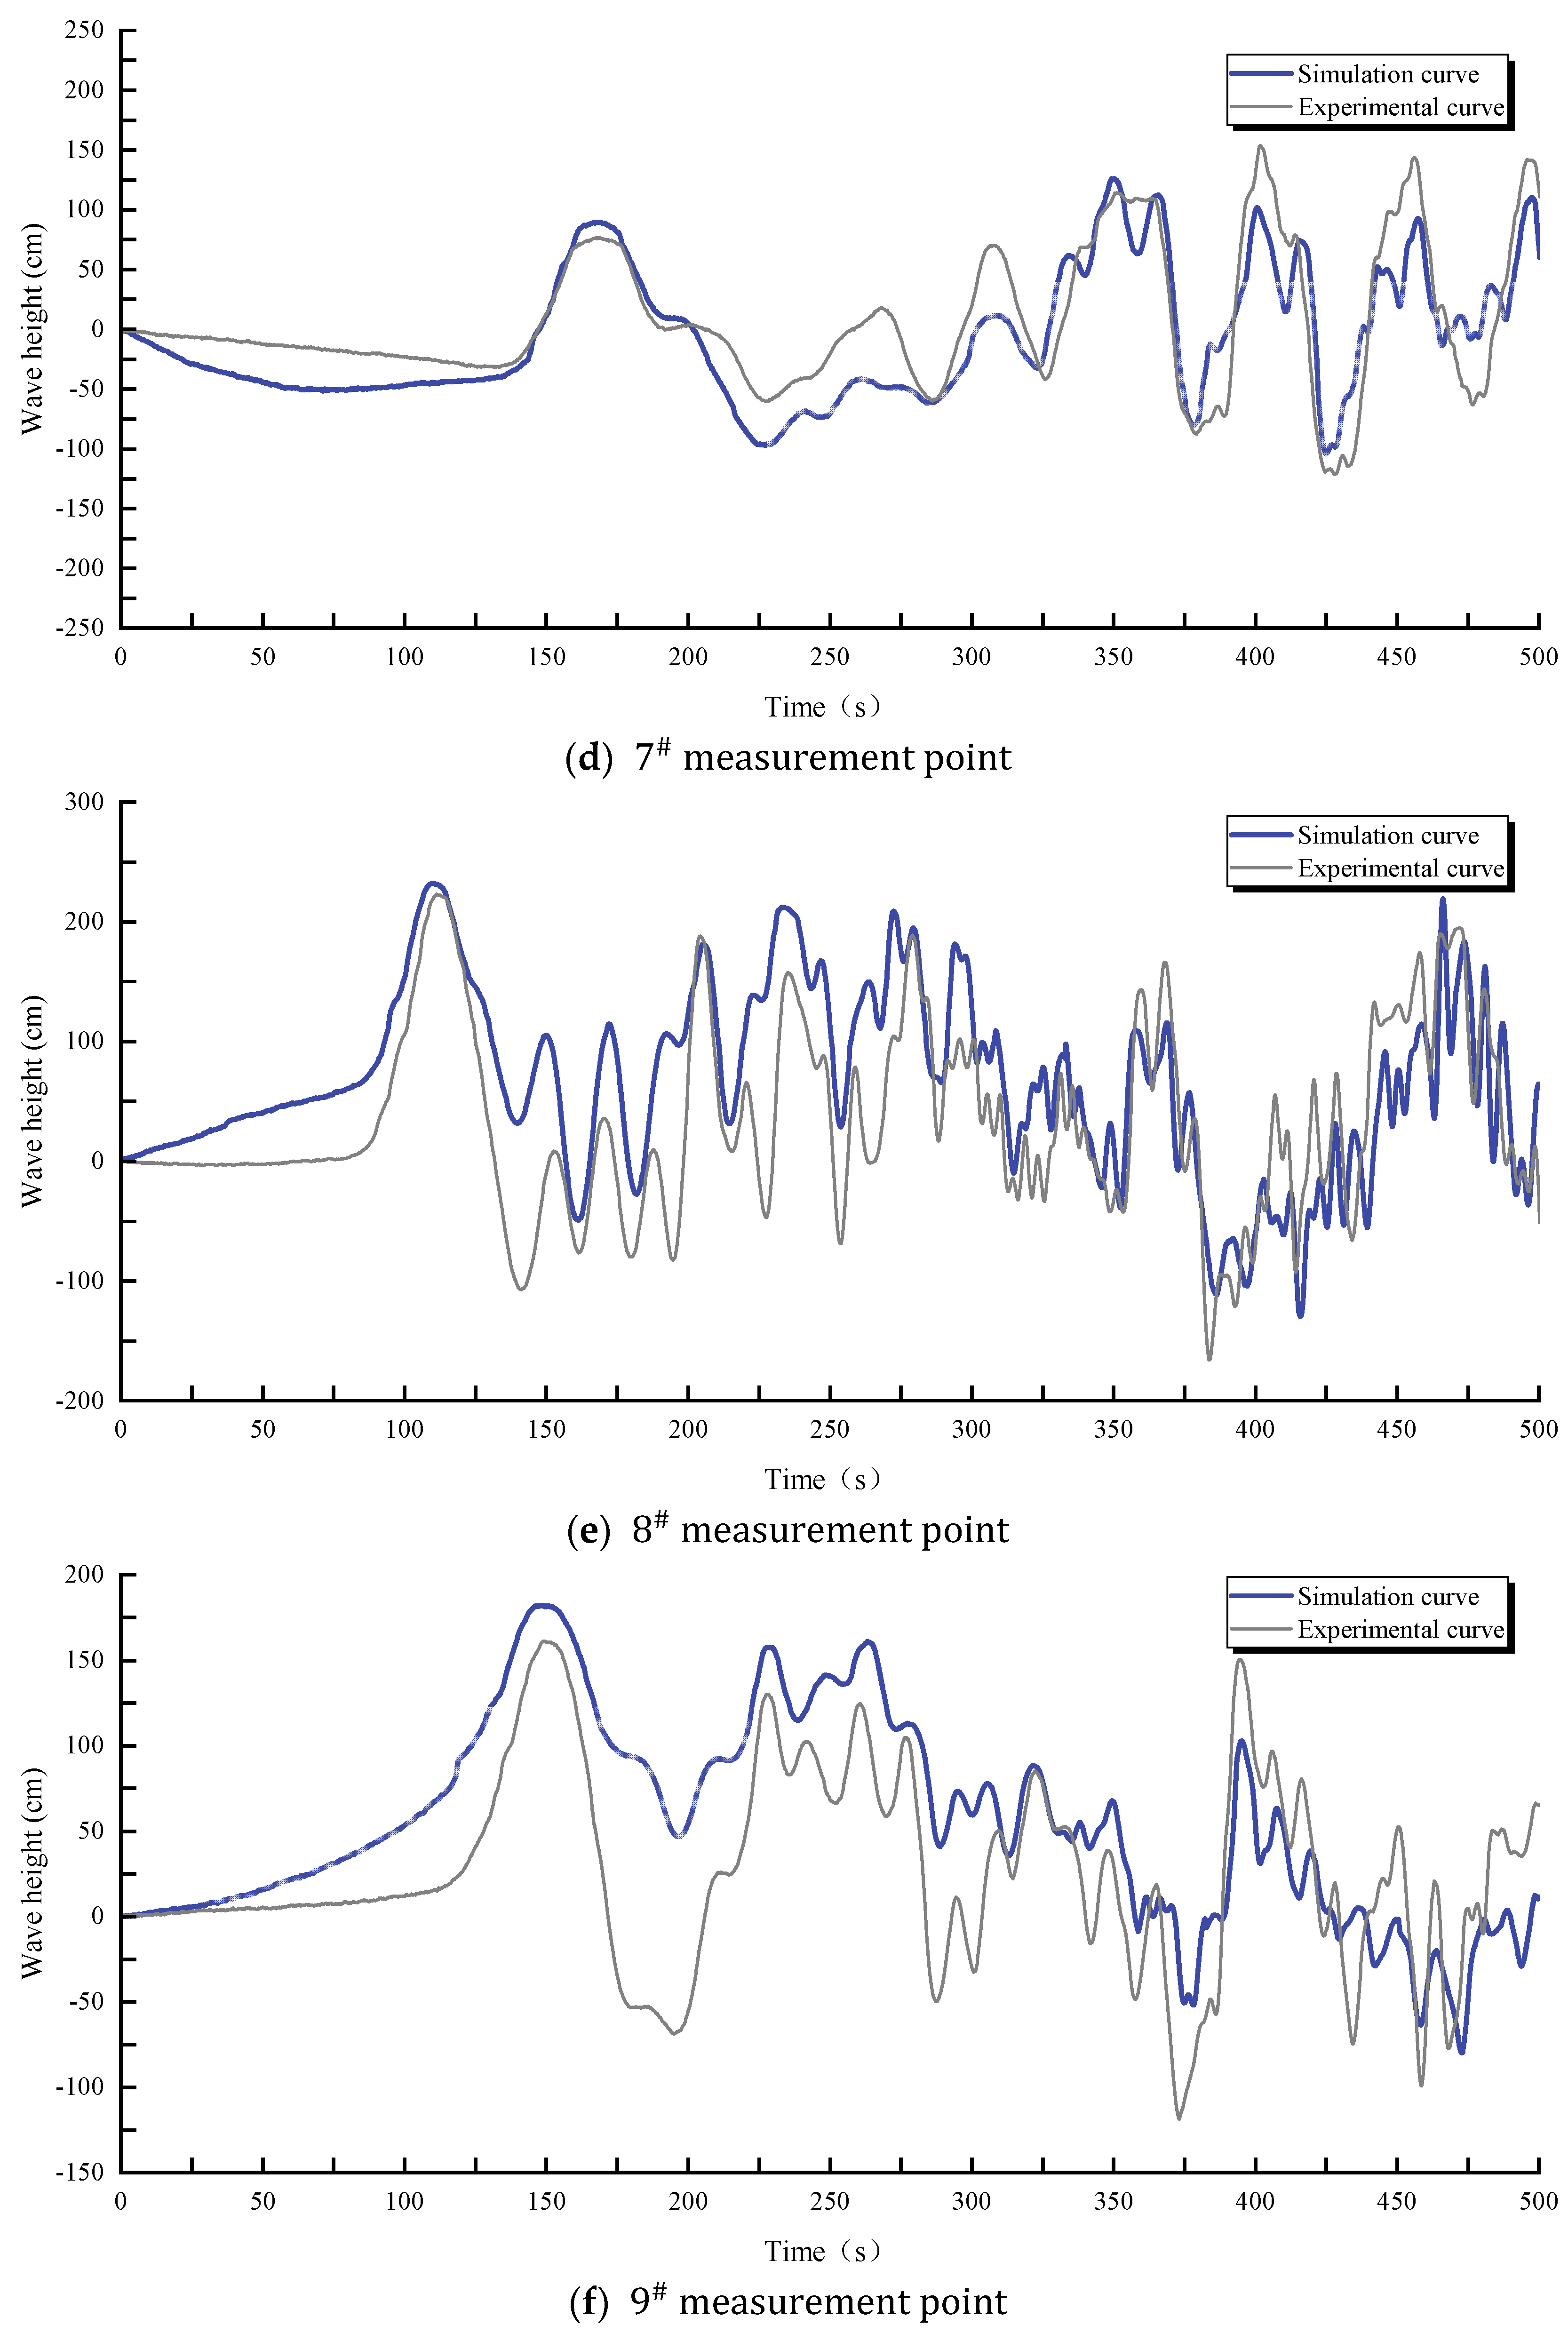
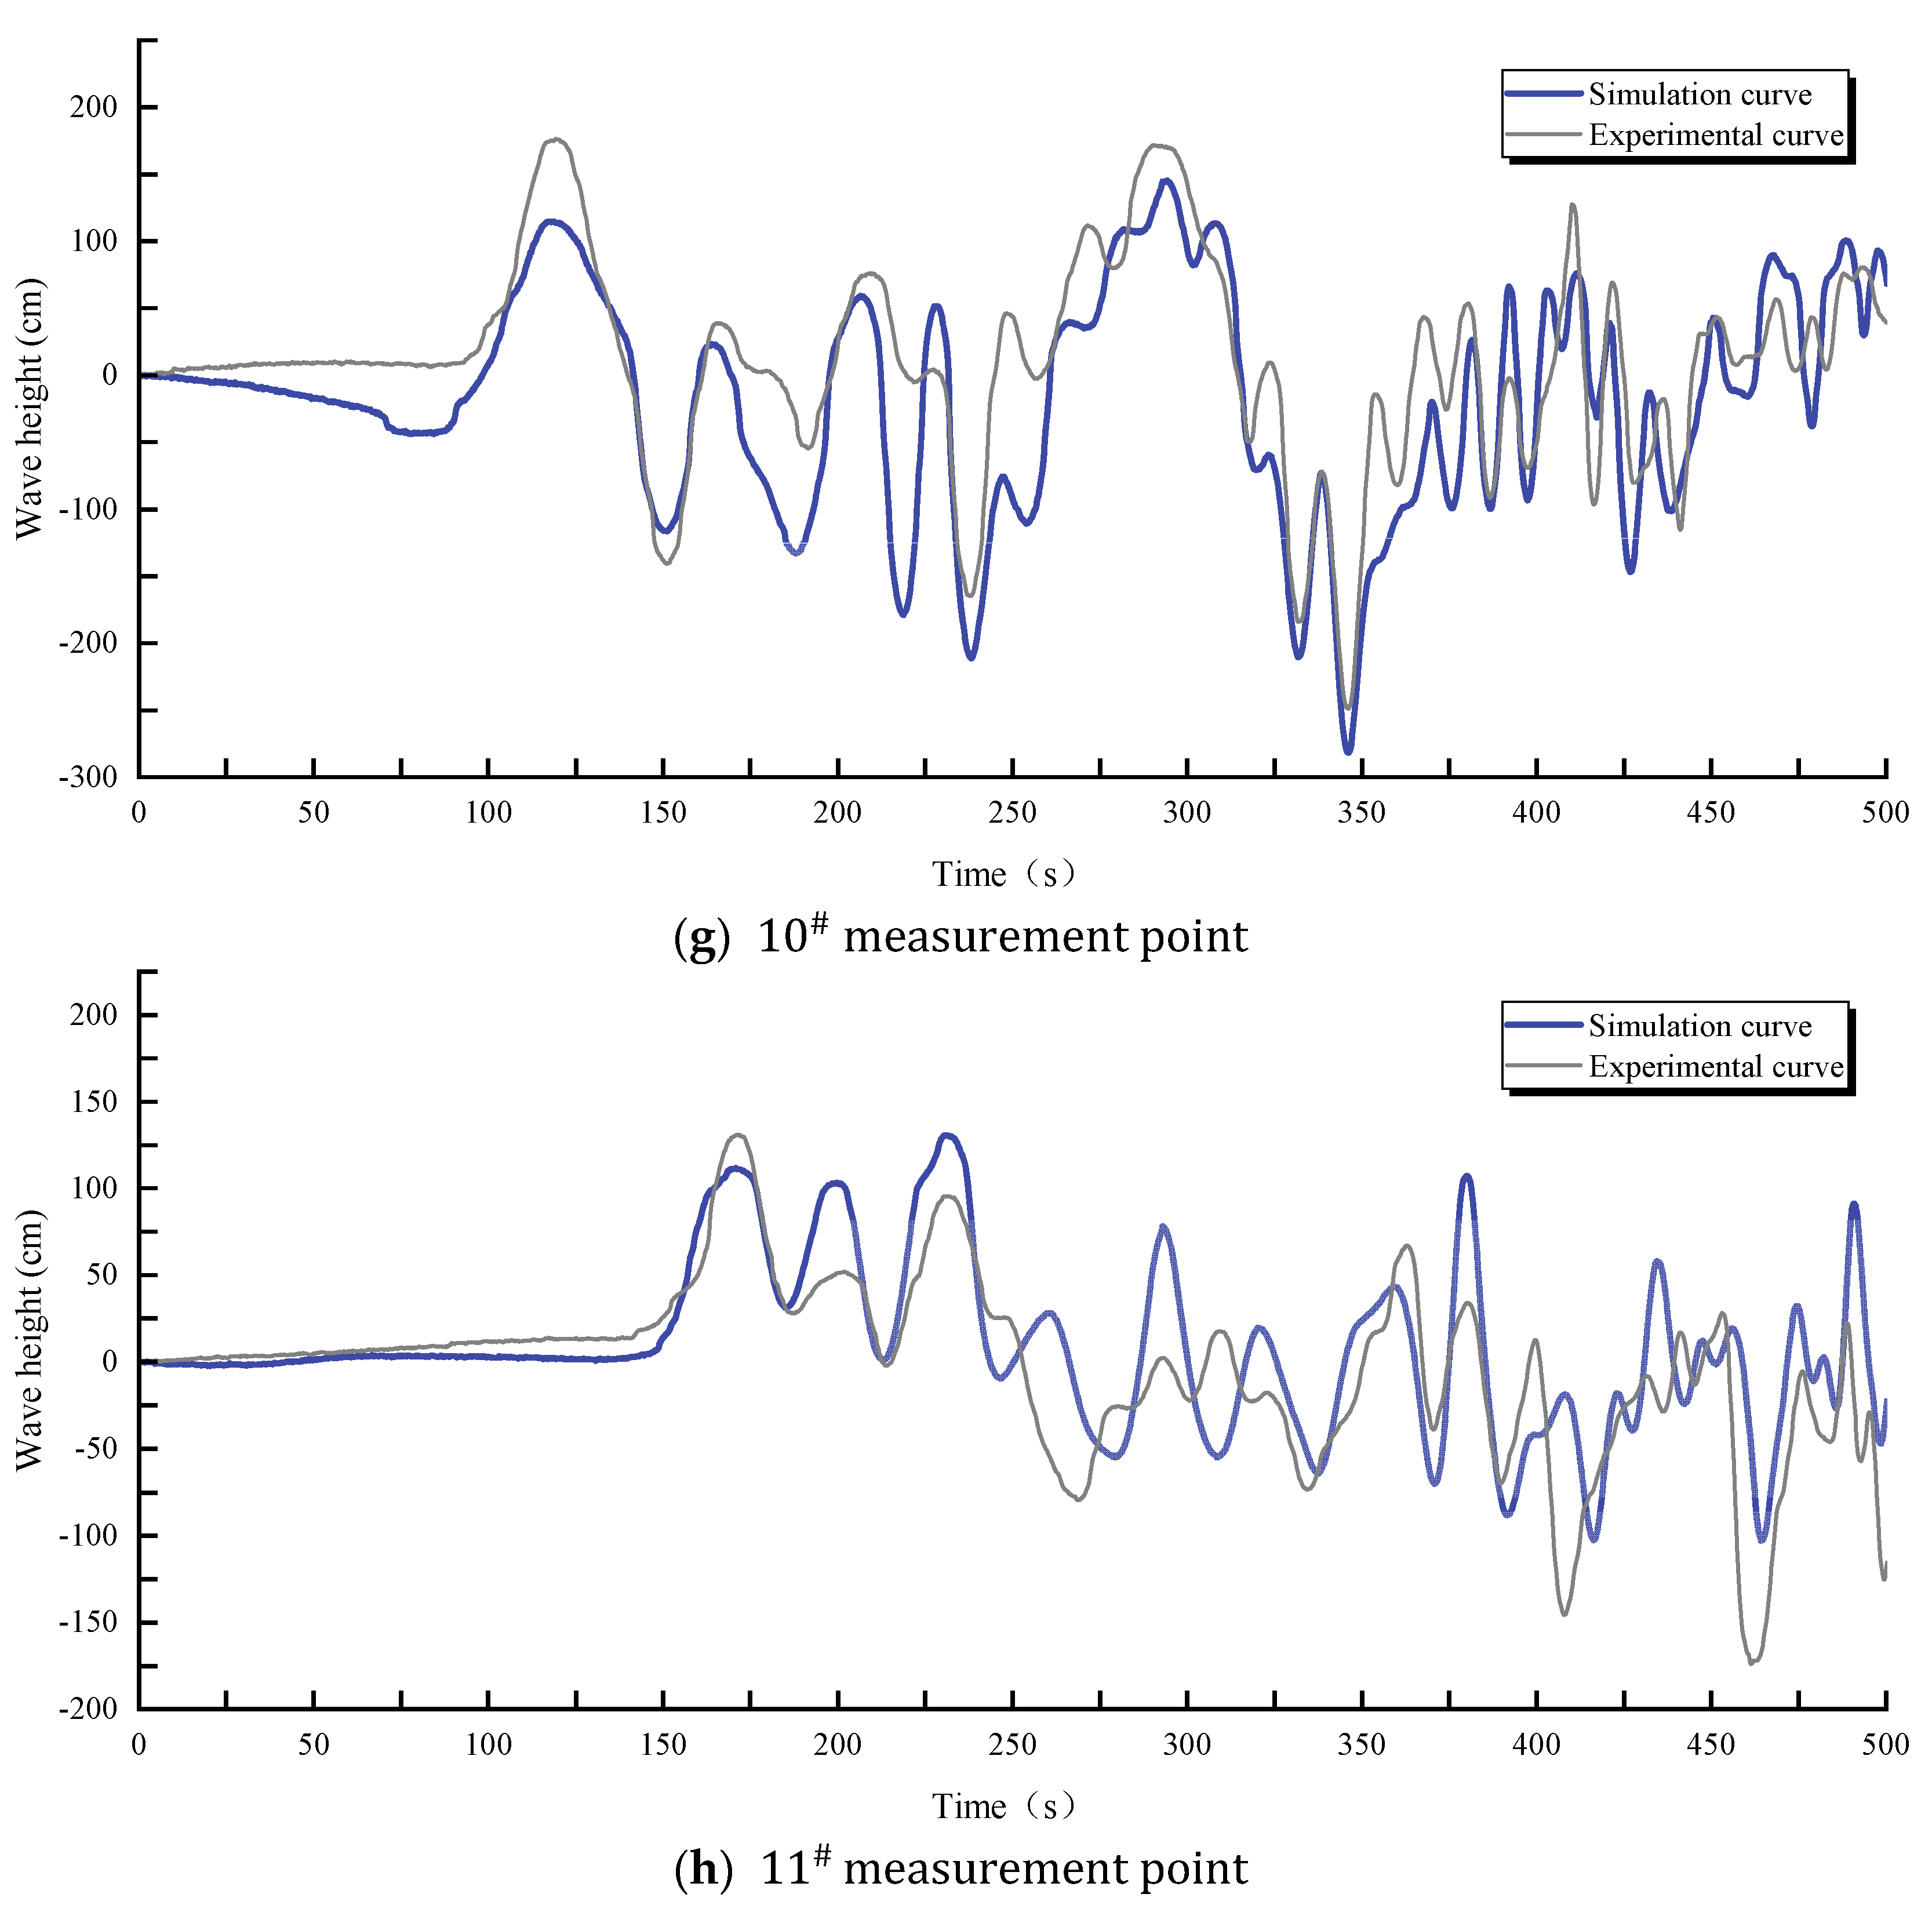
5.2. Comparison and Analysis of Wave Propagation Areas

The 4 # and 5 # wave height measurement points are distributed along the valley, while the 6 # and 7 # wave height measurement points are distributed along the Xiaojiang River. The 8 # and 9 # wave height measurement points are distributed along the upstream of the Jinsha River, and the 10 # and 11 # wave height measurement points are distributed along the downstream of the Jinsha River. The 4 # 11 # measurement points can essentially represent the entire process of wave action in the reservoir channel. From the individual wave height fluctuation curves in Figure 7, it can be observed that there is a high degree of agreement between the wave height fluctuation curves of the physical experiment and numerical simulation, except for the 9 # and 10 # measurement points, for which the first wave heights at each measurement point are generally consistent. The first wave height measured in the physical experiment at the 10 # measurement point is relatively higher, attributed to potential terrain discrepancies at the confluence downstream of the Jinsha River and the Xiaojiang River in the physical experiment model of the reservoir channel. The waveform curve correlation between the physical model experiment at measuring point 9 # and the numerical simulation decreased. The complex terrain in the experimental environment may affect waveform propagation, whereas the numerical simulation simplified the terrain, assuming ideal water flow conditions, leading to inconsistent results. Additionally, the reflection and absorption characteristics of the grid boundaries in the numerical simulation can also affect the waveform propagation results.
Through the comparison of wave height fluctuation curves between the physical experiment and the numerical simulation at the 4 # 11 # measurement points, it can be observed that the wave propagation pattern in the propagation area is similar to that in the generation area. Over time, waves overlap and collide with each other, transforming from simple waveforms to wave groups, and eventually becoming irregular waveforms with high frequency and low amplitude. The surge wave forms in the propagation area are nonlinear oscillation waves and nonlinear transition waves. Due to dispersion effects, the dispersed leading waves can enhance the subsequent trailing waves in a short period. Even after traveling a considerable distance, the surge wave height can still maintain a certain propagation level. With increasing distance from the disturbance point, the arrival time of the first wave is delayed correspondingly. Furthermore, wave amplitude decreases, reflecting the consistency of wave spatiotemporal movement. By comparing the 4 # and 5 # measurement points, the 6 # and 7 # measurement points, the 8 # and 9 # measurement points, and the 10 # and 11 # measurement points, it is evident that the waveform of the next measurement point generally follows the waveform characteristics of the previous measurement point, indicating the continuity of spatial wave movement.

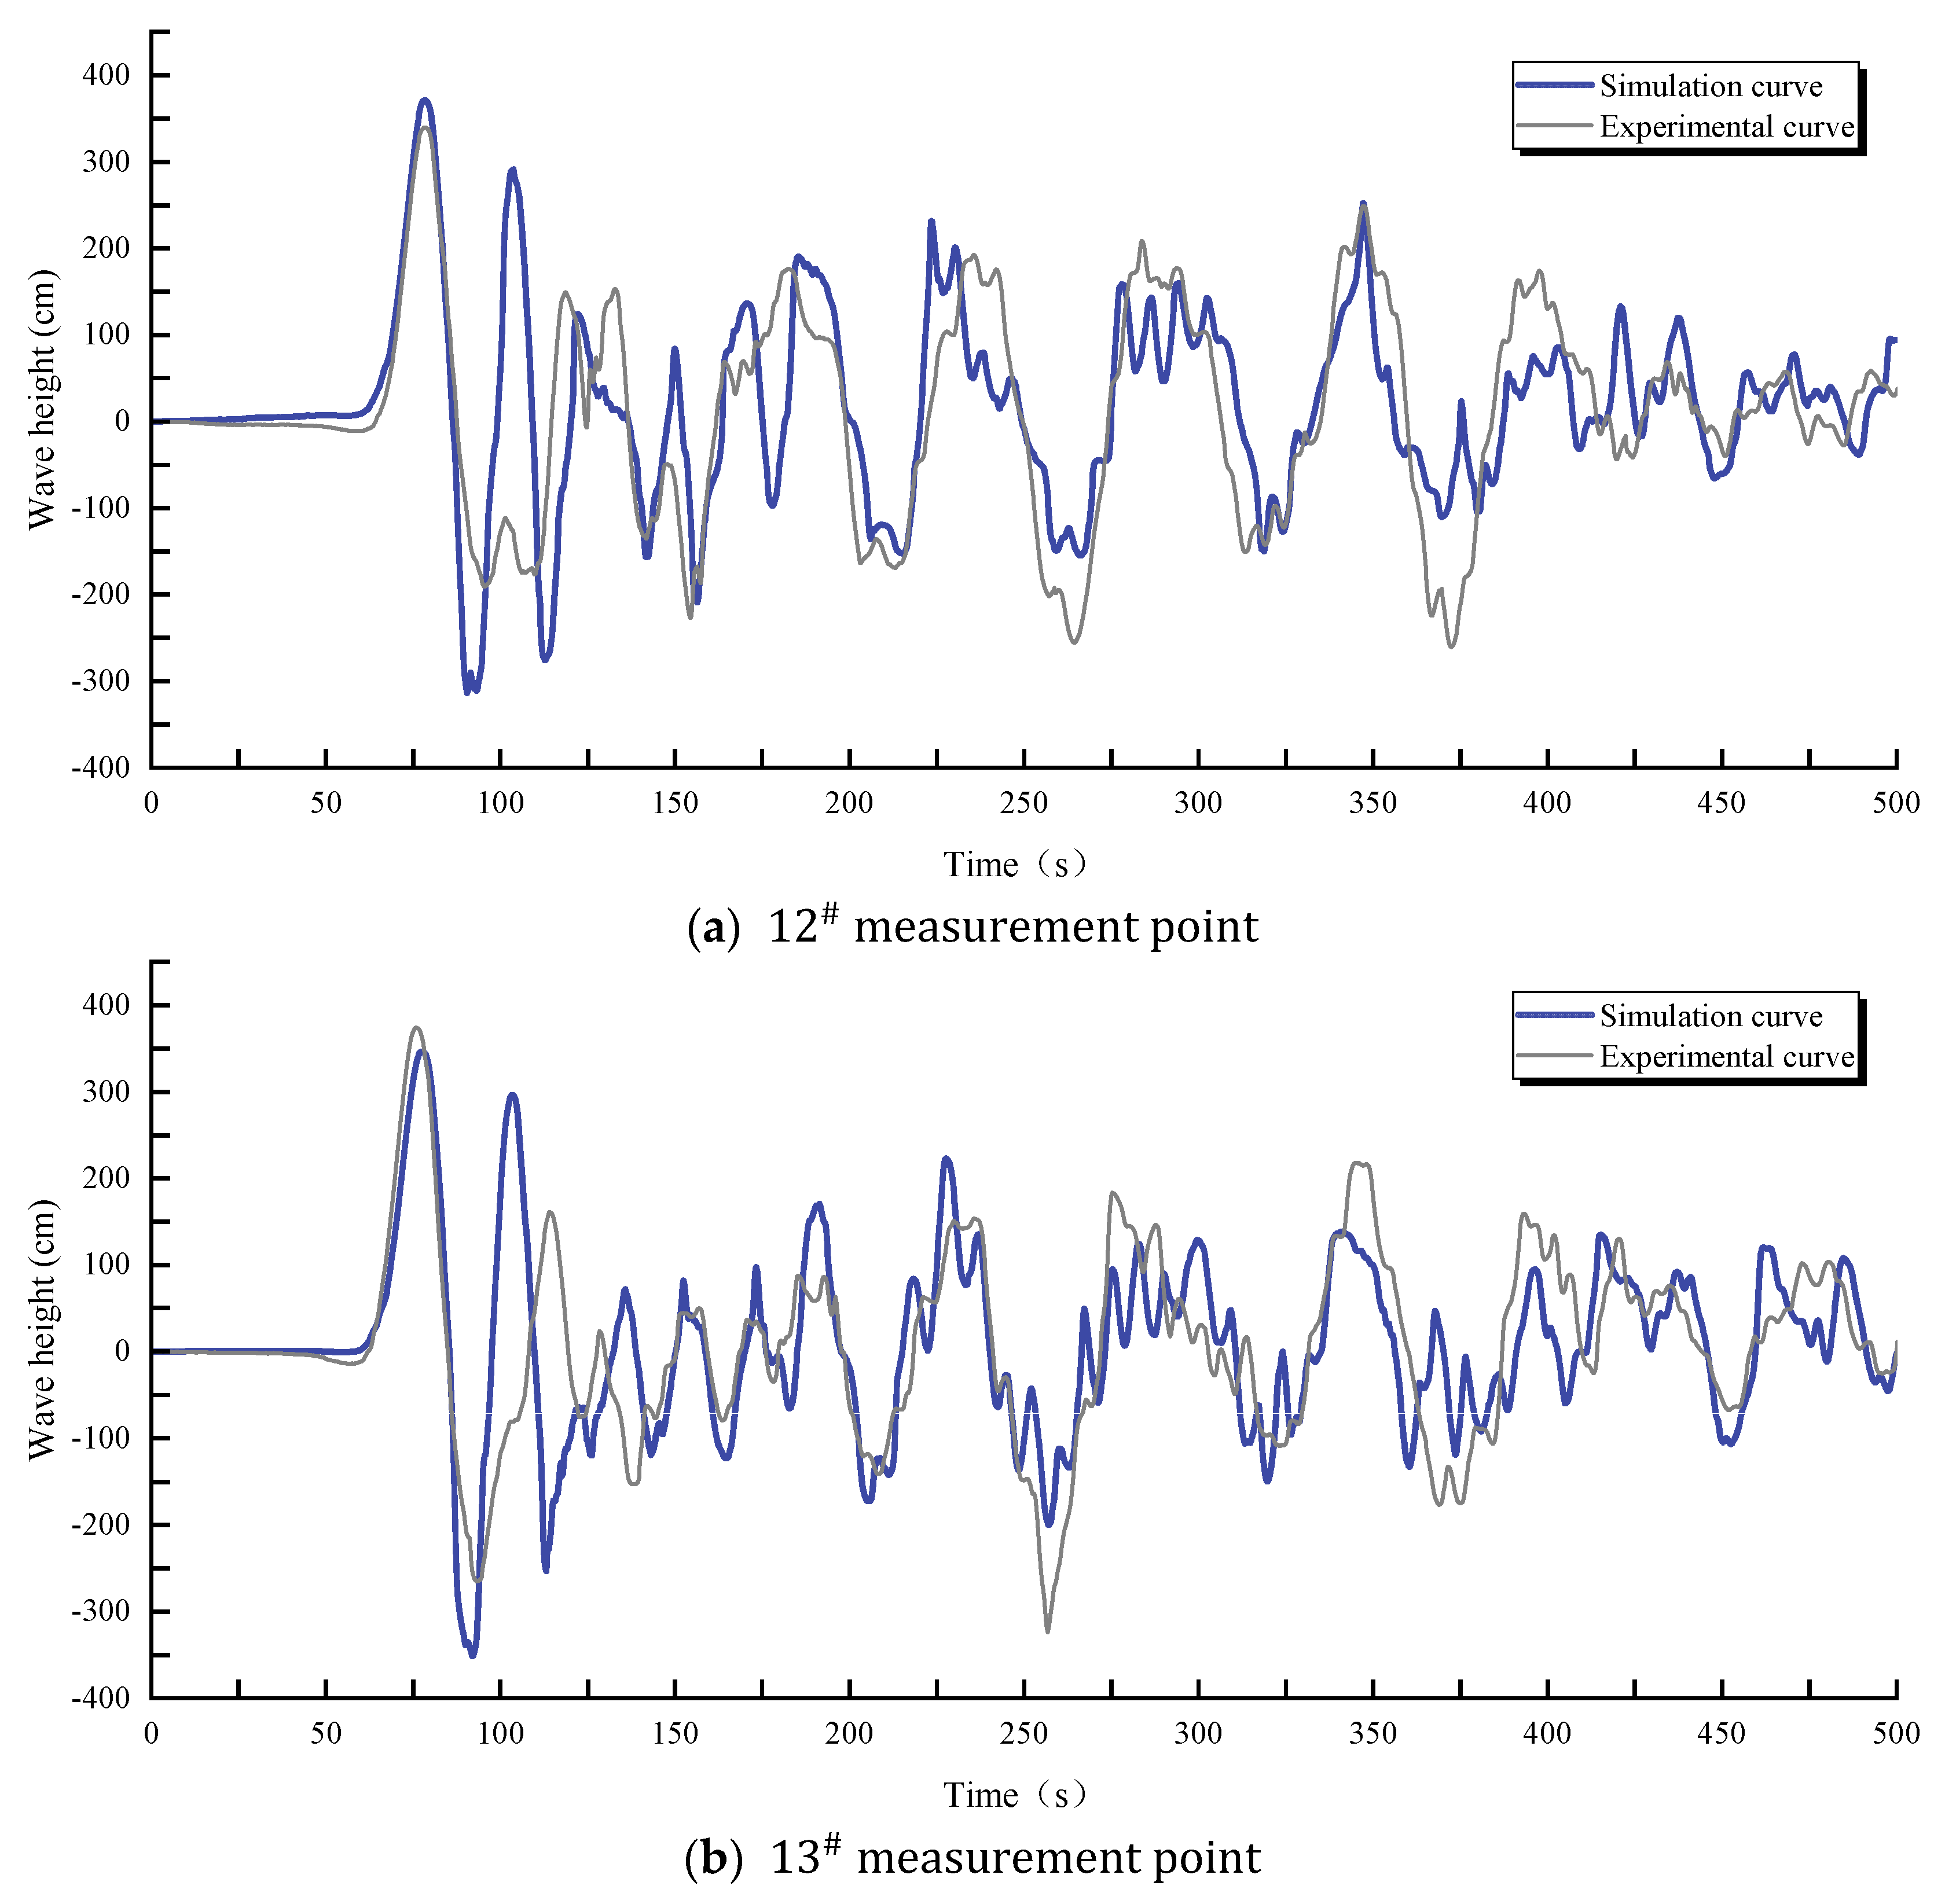
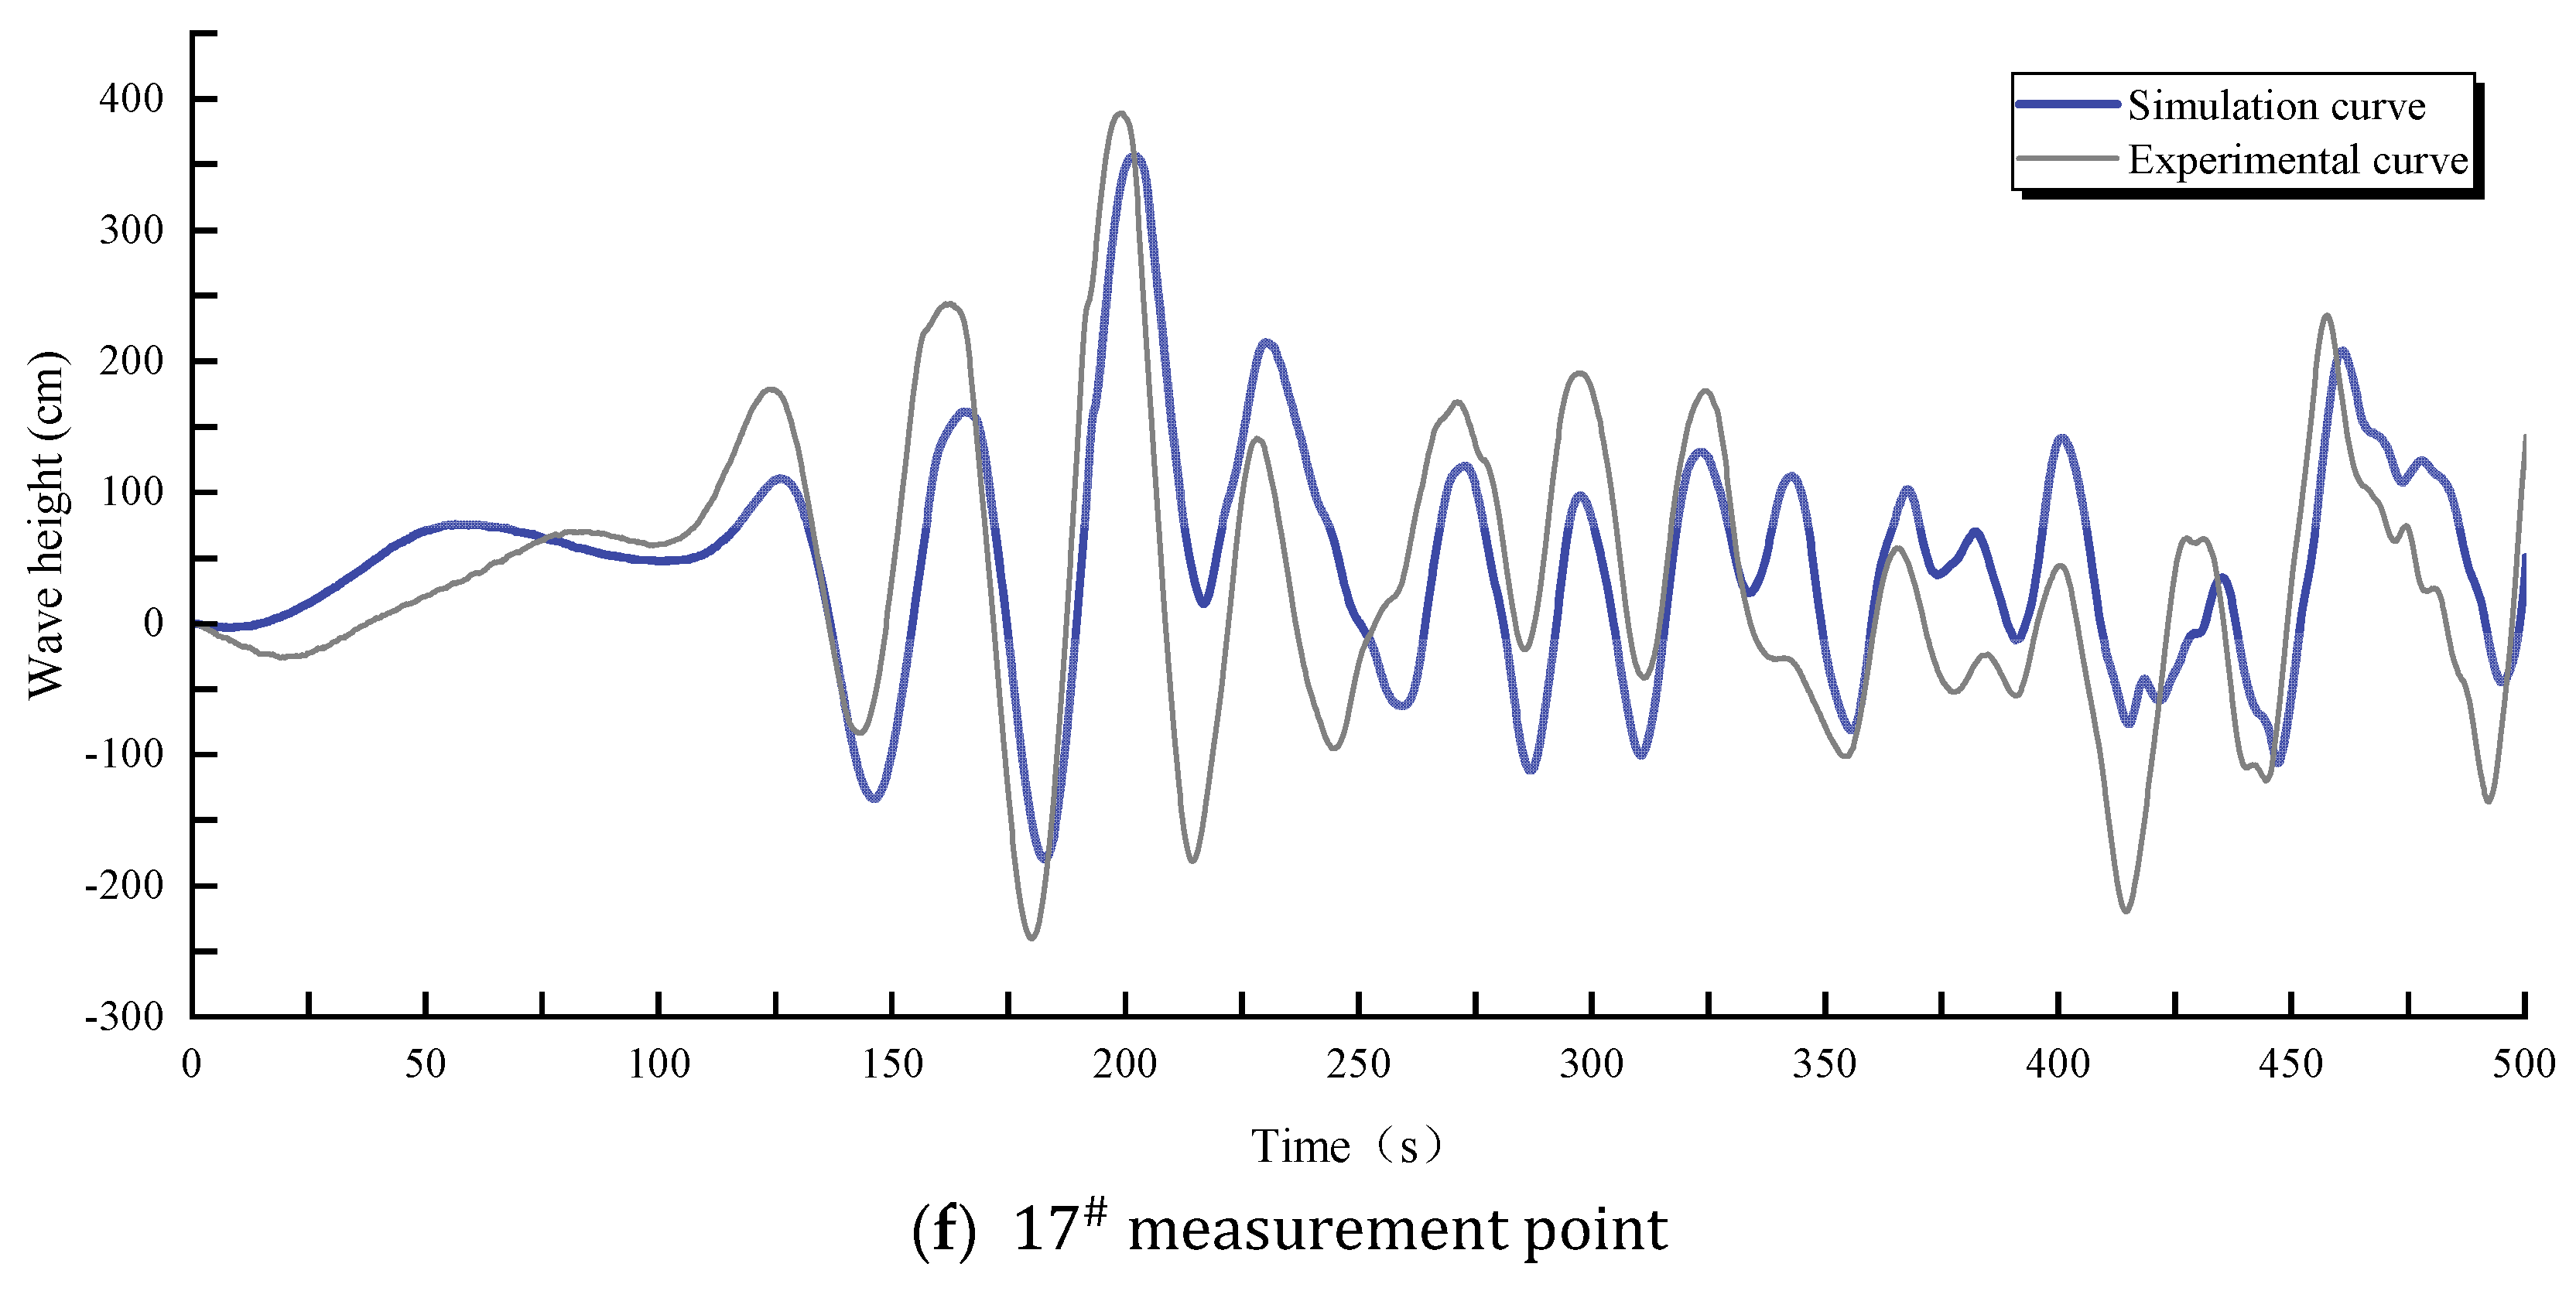
5.3. Comparison and Analysis of Wave Run-Up in the Residential Area

The wave run-up in the residential area was analyzed through a comparison of physical experiments and numerical simulations. Monitoring points 12 # 17 # were strategically placed around the periphery of the XBL residential area. Points 12 # 17 # were positioned at the tip of XBL, directly opposite to the WJS landslide, while points 15 # and 16 # were situated on the wings of XBL. Point 17 # was located at the narrow slope intersection between XBL and the reservoir’s river channel. These monitoring points comprehensively covered all potential hazardous locations where waves could impact the XBL residential area. The water level fluctuations recorded at these points captured the entire process of wave impact from the landslide in both physical experiments and numerical simulations.
Analysis of water level fluctuations at individual monitoring points depicted a close correlation between the physical experiments and the numerical simulations, except for point 17 # , for which the initial wave height at each point corresponded to the maximum run-up height, demonstrating a high degree of consistency across all monitoring points. At point 17 # , situated at the narrow slope intersection between XBL and the reservoir’s river channel, the reflection and superposition of waves led to increased wave energy, resulting in further elevation of the run-up height.
Comparing the run-up wave fluctuations between points 12 # and 17 # in the physical experiments and numerical simulations revealed a close similarity in waveforms, particularly in the maximum run-up wave height (Figure 8). Over time, waves interacted and collided, leading to a decrease in wave amplitude and an increase in frequency. Despite the irregularity and formation of wave groups compared to the initial waves, the longitudinal wave heights consistently maintained coherence between the physical experiments and numerical simulations, highlighting the temporal and spatial consistency of wave motion.

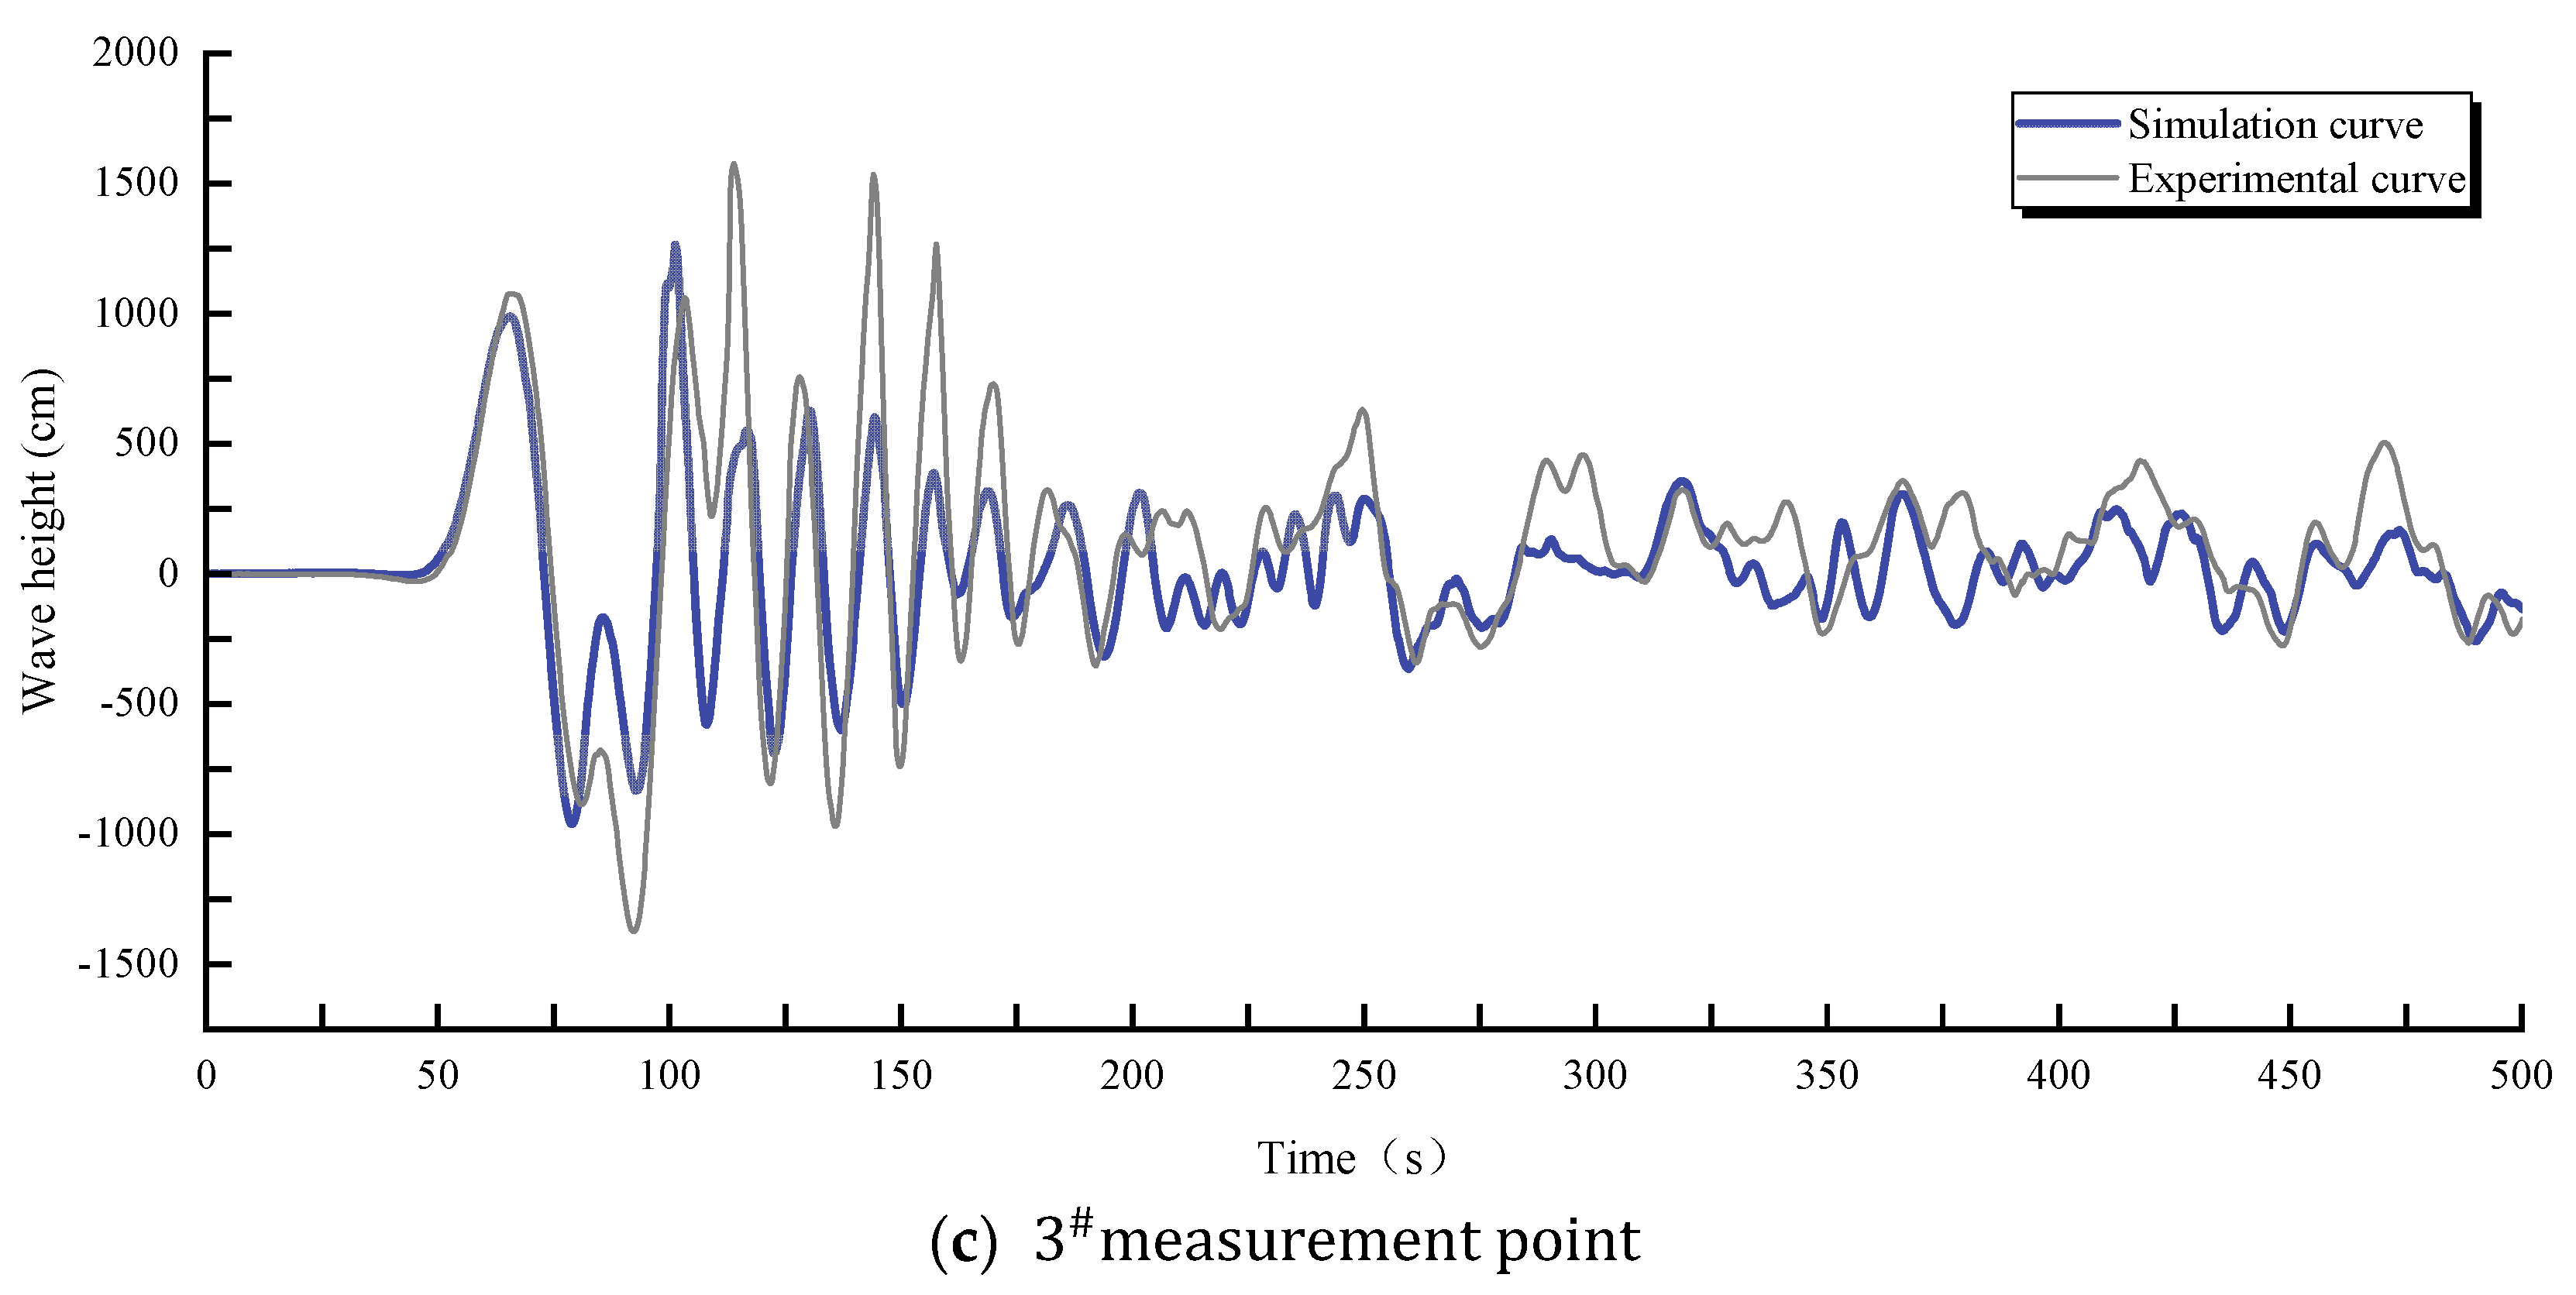
5.4. Comparison and Analysis of Wave Height and Run-Up Values

The water level fluctuation curves at monitoring points 1 # 17 # reflect the microscale propagation characteristics of the waves. Next, quantitative comparison and analysis of the maximum wave height and maximum run-up values obtained from physical experiments and numerical simulations are conducted from a macroscopic perspective. As shown in Figure 9 and Figure 10, the maximum wave height and run-up values from physical experiments and numerical simulations at each monitoring point are very close. The maximum error at the 10 # wave height monitoring point is approximately 18%, with errors within 15% for the other wave height monitoring points. The maximum error in run-up values is observed at monitoring point 3 # across from the wave generation area, with an error of about 25%, while errors for other run-up monitoring points are within 15%. Due to energy loss resulting from wave superposition and collision during propagation, the errors in maximum wave height and run-up values decrease with increasing distance from the disturbance point. Overall, the numerical simulations tend to yield slightly higher values compared to the results of physical experiments, which may be attributed to the idealized flow conditions and simplification of other complex factors in the numerical simulation process, neglecting their impact on the actual flow field.
Through quantitative comparison and analysis of maximum wave height and run-up values at each monitoring point from a macroscopic perspective, it is demonstrated that the numerical simulation results closely match the values obtained from physical experiments within an acceptable error range. This validates the effectiveness and accuracy of the coupled numerical simulation method.

6. Discussion

The study of landslide-induced surge waves is of great significance for geological disaster warning and prevention. By using physical experiments and numerical simulation methods for benchmark testing, the accuracy of the models is improved, and the validity and accuracy of the results are verified. This approach allows for a better understanding and prediction of landslide-induced surge wave phenomena, thereby reducing disaster losses. Meanwhile, the following issues warrant further discussion and consideration:
(1)
Method Comparison. This study used physical model experiments and numerical simulations to investigate the dynamic characteristics of landslide-induced surge waves through benchmark testing. Each method has its unique advantages and limitations, contributing to the overall understanding of the phenomenon. Physical model experiments are characterized by high precision and direct observation. They can accurately reproduce the complex interactions between landslide materials and water, capturing detailed phenomena such as splash formation and wave breaking. Researchers can directly observe physical processes and collect empirical data, providing a solid foundation for validating numerical models. However, physical model experiments have scale effects, and some physical phenomena (surface tension and viscosity effects) may not be perfectly replicated. High time and cost constraints limit the number of testable scenarios. Numerical simulation methods offer high flexibility, efficiency, and detailed analysis capabilities. However, numerical simulations rely on various assumptions and simplifications (grid resolution and boundary conditions), which may introduce errors. High-resolution simulations require substantial computational resources, which can be a limiting factor.
(2)
Complexity of Geological Conditions. The geological conditions at the WJS landslide site are particularly complex, posing challenges for both physical and numerical modeling. The WJS landslide is composed of a mixture of mud, silt, gravel, and clay, with a fractured bedrock base. This heterogeneity affects the landslide behavior and the generation of surge waves. The steep and variable terrain of the reservoir area, including sharp elevation changes and irregular channel shapes, significantly impacts wave propagation and interaction with the shoreline. Fluctuations in the Baihetan Reservoir water level further increase the complexity of modeling, as the interaction between the landslide and the water body varies at different reservoir stages. Compared to other geological sites, the WJS landslide area presents unique challenges due to its material heterogeneity, complex terrain, and dynamic hydrological conditions. These factors necessitate the use of physical models to capture fine-scale interactions and numerical simulations to explore broader conditions and scenarios.
(3)
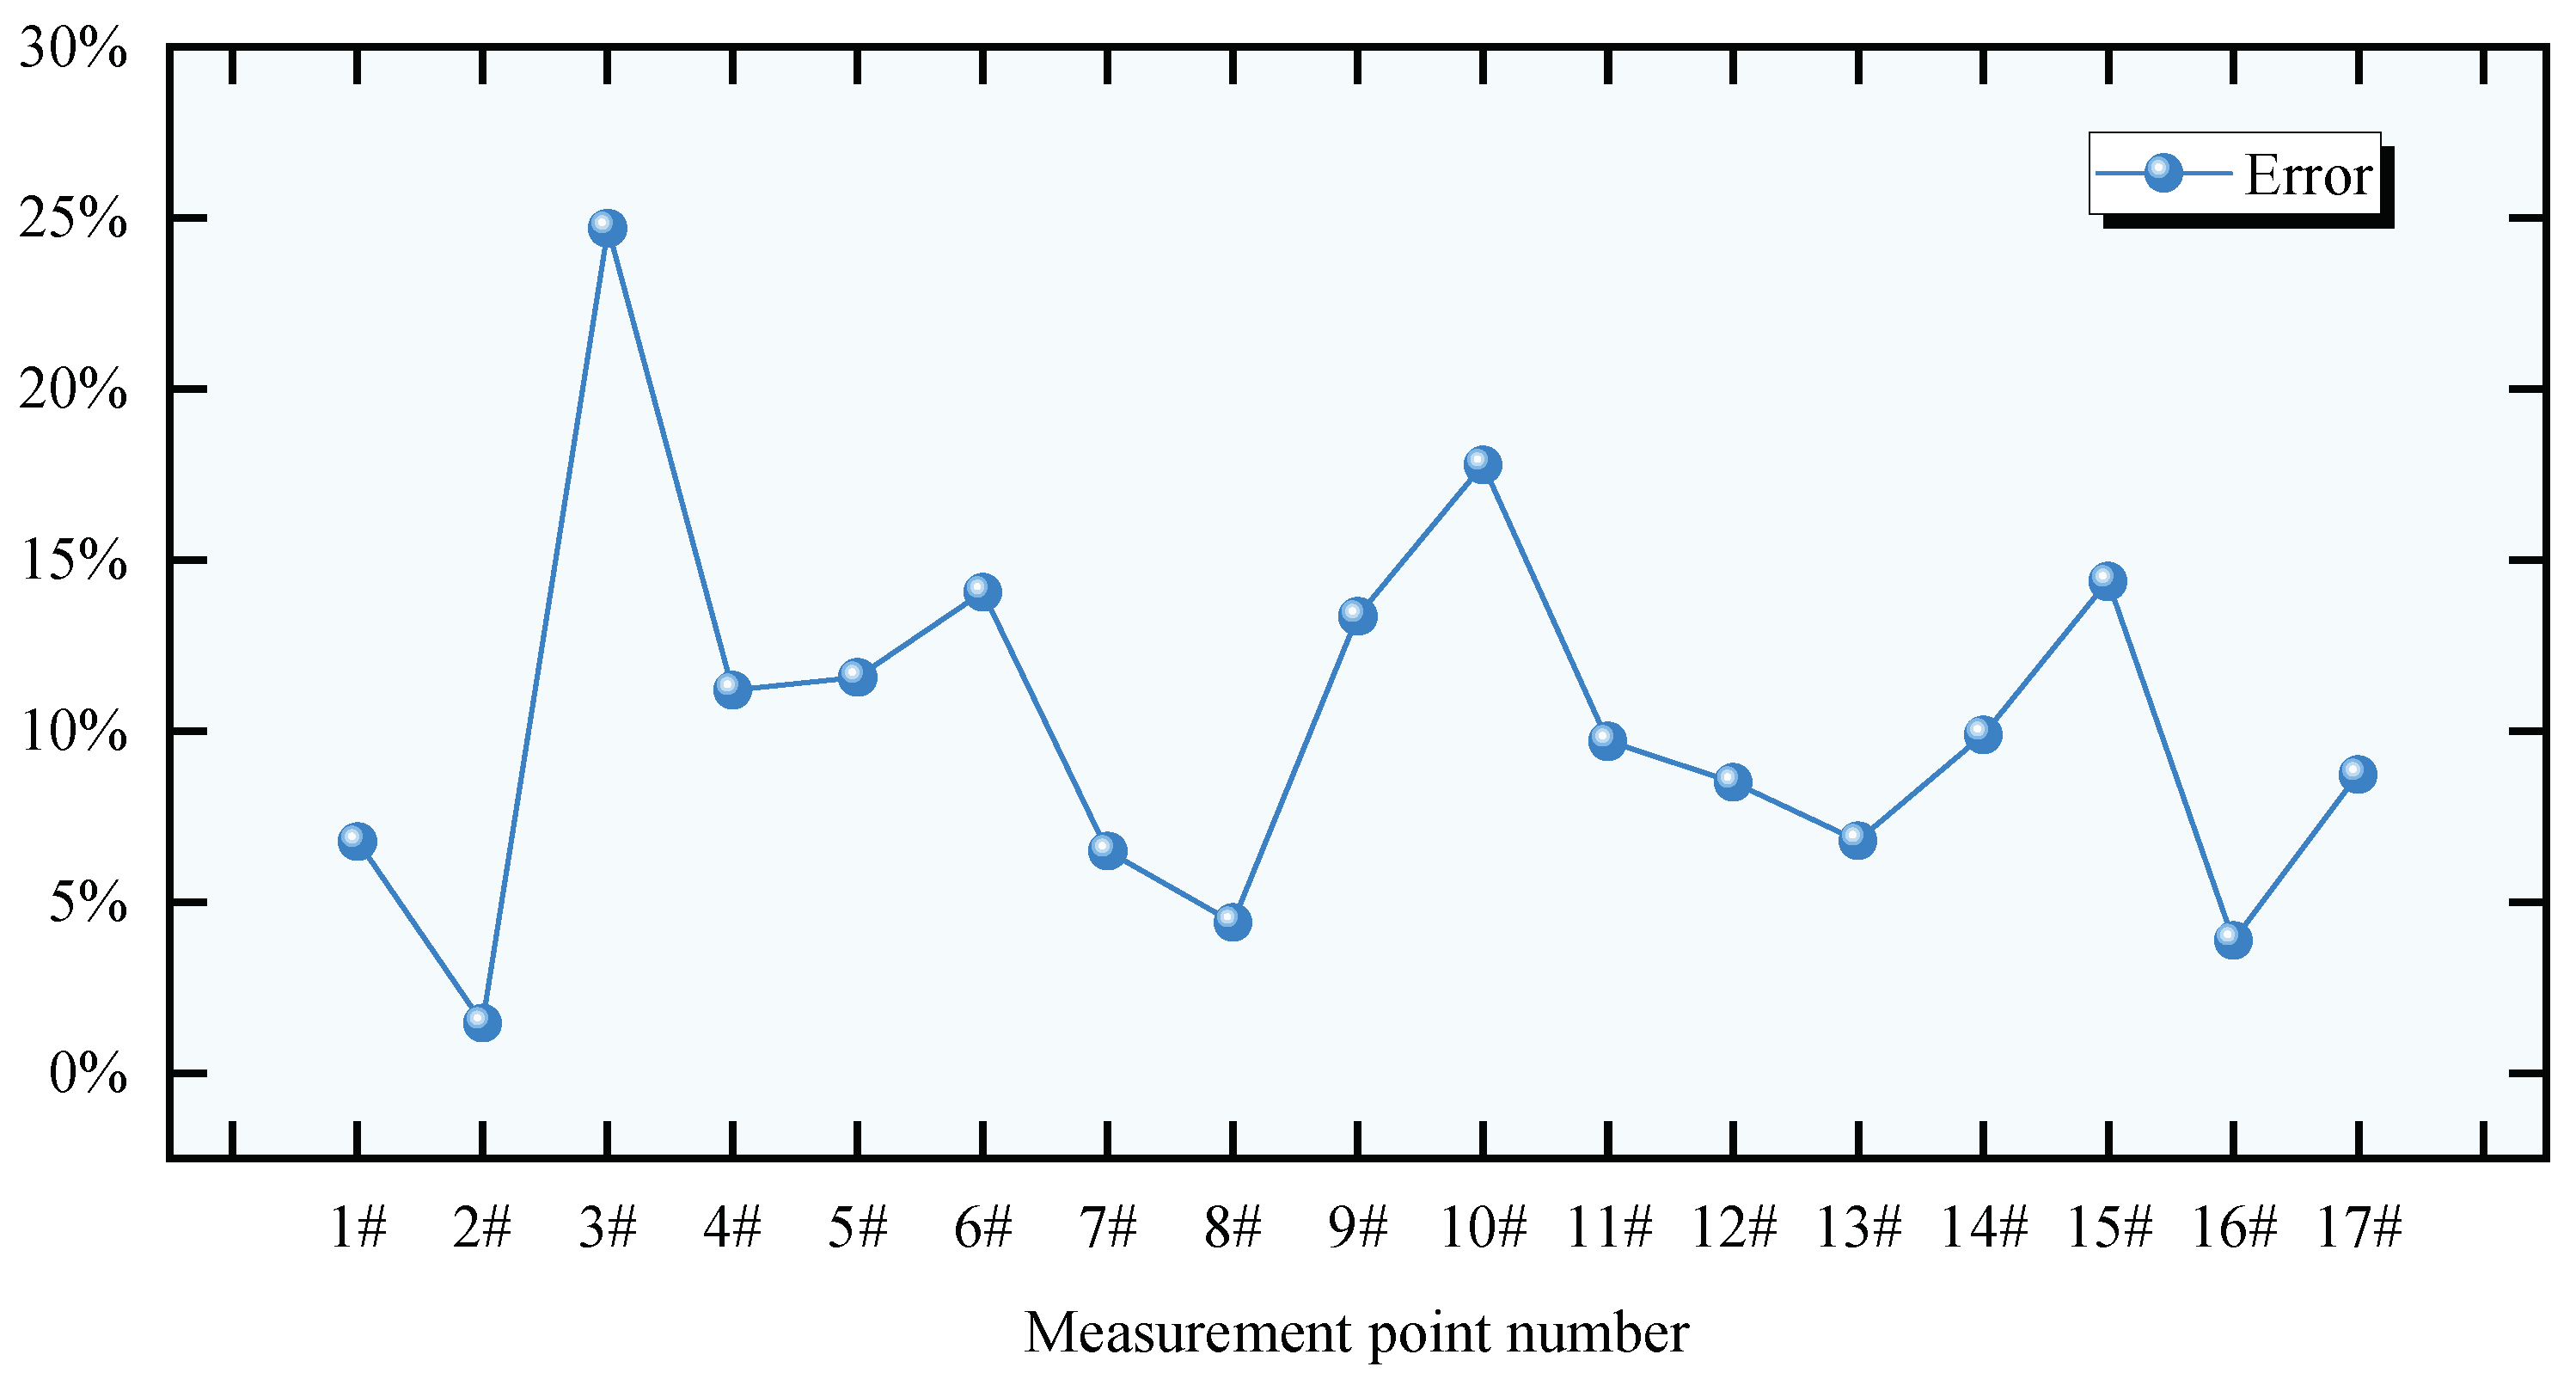
Error Issues. In the surge wave generation area, the initial wave height error between numerical simulations and physical experiments is relatively small (about 10%). However, at greater distances (measuring point 3 # ), the error increases due to scale effects and model simplifications. Major influencing factors include grid resolution and boundary condition handling in numerical simulations, which can lead to inaccuracies in wave height prediction. In the wave propagation area, the results of numerical simulations generally match well with physical experiments at most measurement points. However, in areas with complex terrain (measuring points 9 # and 10 # ), the error increases due to terrain differences and simplified terrain handling in numerical simulations. The complexity of the terrain and the handling of reflected waves are major influencing factors. The idealized treatment of terrain in numerical simulations may overlook some key wave propagation characteristics. In the wave climbing area, especially at narrow slope intersections (measuring point 17 # ), reflection and wave superposition lead to an increase in wave energy, thereby increasing the error in wave climbing height. The main influencing factors are wave reflection and superposition effects, which are difficult to fully replicate in numerical simulations, leading to differences between simulation results and actual experimental results. Both physical and numerical simulations produce errors, mainly due to scale effects and the fine reproduction of features related to moving objects. Numerical simulation errors primarily stem from the surge wave source model. Therefore, to improve prediction accuracy, future research should focus on improving grid resolution and boundary condition settings in numerical simulations, enhancing the handling of complex terrain and reflected waves, and calibrating and validating numerical models with more physical experiment data to reduce errors and uncertainties.
(4)
Future Research Prospects. The insights from this study can be used to develop more accurate predictive models, enhancing disaster preparedness and mitigation strategies. Future research should focus on improving model accuracy, expanding scenario testing, and integrating multidisciplinary approaches. By refining numerical models to better account for the complex geological conditions and interactions observed in physical experiments, researchers can leverage the flexibility of numerical simulations to explore a wider range of landslide scenarios and hydrological conditions. Combining expertise in geomechanics, hydrodynamics, and computational fields will enable the development of more comprehensive models for landslide dynamics and associated disasters.

7. Conclusions

This paper conducted benchmark testing research on the WJS landslide in the Baihetan Hydropower Station reservoir area using physical model experiments and three-dimensional numerical simulations. The following conclusions were drawn:
Comparing the results of physical experiments and numerical simulations, the residential area experiences two significant waves, occurring at time nodes t = 80 s and t = 110 s at measurement point 13 # . The maximum wave run-up height is approximately 3.74 m and the highest water level of the waves reaches 828.75 m, exceeding the elevation of 827.5 m in the residential area. This indicates a threat posed by the potential WJS landslide. Urgent measures should be taken to address the issue of landslide-generated surge disasters, including strengthening emergency monitoring and warning systems and optimizing the rational scheduling of reservoir water.
From a microscopic perspective, the wave fluctuations at various measurement points in the physical experiment and numerical simulation match well in the surge wave generation area, propagation area, and XBL residential area. The numerical simulation method reproduces interactions such as collision, superposition, and reflection of the surge waves triggered by the landslide entering the water, revealing the movement mechanism of the WJS landslide and the generation and propagation laws of the surge waves.
From a macroscopic point of view, numerical simulation has some limitations. This may be due to the complex geological conditions during the construction of the experimental model and the discretization error caused by grid division. In addition, the numerical simulation method based on hydrodynamics still has limitations in studying the fluid–solid interaction and the microdamage mechanism of the slide; in particular, when analyzing the surge region, the correlation between wave height and climb height is low and the accuracy is insufficient.
By combining physical models and numerical simulation methods, benchmark testing was conducted from both microscopic and macroscopic perspectives. This approach provided scientific evidence for the accuracy and validity of the research results, promoted the application of fluid dynamics numerical simulation methods, and strongly supported the prediction and prevention of landslide-induced surge wave disasters in China.

Author Contributions

Conceptualization, W.X., A.S. and J.L.; methodology, A.S., W.X., J.L., L.T., C.L. and P.M.; software, J.L.; formal analysis W.X., J.L. and C.L.; investigation, W.X. and A.S.; writing original draft preparation, W.X., A.S. and J.L.; writing review and editing, A.S. and W.X. All authors have read and agreed to the published version of the manuscript.

Funding

This work was supported by the Natural Science Foundation of China (Grant No. 51939004) and the Key Science and Technology Plan Project of PowerChina Huadong Engineering Corporation Limited (Grant No. KY2021-ZD-03).

Data Availability Statement

The data that support the findings of this study are available from the corresponding author upon reasonable request.

Acknowledgments

PowerChina Huadong Engineering Corporation Limited is gratefully acknowledged for providing the study site and geological data.

Conflicts of Interest

Author Anchi Shi was employed by the company PowerChina Huadong Engineering Corporation Limited. The remaining authors declare that the research was conducted in the absence of any commercial or financial relationships that could be construed as a potential conflict of interest.

References

  1. Chen, S.; Xu, W.; Shi, A.; Yan, L.; Xu, X.; Wang, H.; Wang, H. Review of hazard chain of landslide surge for high dams and large reservoirs. Adv. Sci. Technol. Water Resour. 2023, 43, 83–93. [Google Scholar]
  2. Jiang, Z.H.; Wang, H.L.; Xie, W.C. Deformation mechanism of deposit landslide induced by fluctuations of reservoir water level based on physical model tests. Environ. Earth Sci. 2021, 80, 13. [Google Scholar] [CrossRef]
  3. Wang, H.L.; Jiang, Z.H.; Xu, W.Y.; Wang, R.B.; Xie, W.C. Physical model test on deformation and failure mechanism of deposit landslide under gradient rainfall. Bull. Eng. Geol. Environ. 2022, 81, 14. [Google Scholar] [CrossRef]
  4. Xu, W.; Zhou, W.; Zhao, X.; Chen, H.; Yang, L.; Sun, M.; Cheng, Z. The Mechanism of Deformation and Destruction of Huang Deng’s Pouring Ladle and Its Safety Evaluation; Hohai University Press: Nanjing, China, 2023. [Google Scholar]
  5. Xu, W.; Li, Y.; Chen, H.; Yang, L.; Wang, Z. Mechanism of Deformation and Failure and Stability Analysis of Dahua Hydromechanical Landslide; Hohai University Press: Nanjing, China, 2023. [Google Scholar]
  6. Tappin, D.R.; Watts, P.; Grilli, S.T. The Papua New Guinea tsunami of 17 July 1998: Anatomy of a catastrophic event. Nat. Hazards Earth Syst. Sci. 2008, 8, 243–266. [Google Scholar] [CrossRef]
  7. Harbitz, C.B.; Glimsdal, S.; Lovholt, F.; Kveldsvik, V.; Pedersen, G.K.; Jensen, A. Rockslide tsunamis in complex fjords: From an unstable rock slope at Akerneset to tsunami risk in western Norway. Coast. Eng. 2014, 88, 101–122. [Google Scholar] [CrossRef]
  8. Froude, M.J.; Petley, D.N. Global fatal landslide occurrence from 2004 to 2016. Nat. Hazards Earth Syst. Sci. 2018, 18, 2161–2181. [Google Scholar] [CrossRef]
  9. Cabrera, M.A.; Pinzon, G.; Take, W.A.; Mulligan, R.P. Wave Generation Across a Continuum of Landslide Conditions From the Collapse of Partially Submerged to Fully Submerged Granular Columns. J. Geophys. Res.-Ocean. 2020, 125, 16. [Google Scholar] [CrossRef]
  10. Hunt, J.; Tappin, D.; Watt, S.; Susilohadi, S.; Novellino, A.; Ebmeier, S.; Cassidy, M.; Engwell, S.; Grilli, S.; Hanif, M. Submarine landslide megablocks show half of Anak Krakatau island failed on December 22nd, 2018. Nat. Commun. 2021, 12, 2827. [Google Scholar] [CrossRef] [PubMed]
  11. Heller, V.; Ruffini, G. A critical review about generic subaerial landslide-tsunami experiments and options for a needed step change. Earth-Sci. Rev. 2023, 242, 28. [Google Scholar] [CrossRef]
  12. Panizzo, A.; De Girolamo, P.; Di Risio, M.; Maistri, A.; Petaccia, A. Great landslide events in Italian artificial reservoirs. Nat. Hazards Earth Syst. Sci. 2005, 5, 733–740. [Google Scholar] [CrossRef]
  13. Boon, C.W.; Houlsby, G.T.; Utili, S. New insights into the 1963 Vajont slide using 2D and 3D distinct-element method analyses. Geotechnique 2014, 64, 800–816. [Google Scholar] [CrossRef]
  14. Wolter, A.; Stead, D.; Ward, B.C.; Clague, J.J.; Ghirotti, M. Engineering geomorphological characterisation of the Vajont Slide, Italy, and a new interpretation of the chronology and evolution of the landslide. Landslides 2016, 13, 1067–1081. [Google Scholar] [CrossRef]
  15. Huang, B.; Wang, S.C.; Zhao, Y.B. Impulse waves in reservoirs generated by landslides into shallow water. Coast. Eng. 2017, 123, 52–61. [Google Scholar] [CrossRef]
  16. Huang, C.; Hu, C.; An, Y.; Shi, C.Q.; Feng, C.; Wang, H.N.; Liu, Q.Q.; Wang, X.L. Numerical Simulation of the Large-Scale Huangtian (China) Landslide-Generated Impulse Waves by a GPU-Accelerated Three-Dimensional Soil-Water Coupled SPH Model. Water Resour. Res. 2023, 59, 21. [Google Scholar] [CrossRef]
  17. Xu, W.J.; Wang, Y.J.; Dong, X.Y. Influence of reservoir water level variations on slope stability and evaluation of landslide tsunami. Bull. Eng. Geol. Environ. 2021, 80, 4891–4907. [Google Scholar] [CrossRef]
  18. Xiao, L.L.; Wang, J.J.; Ward, S.; Chen, L.X. Numerical modeling of the June 24, 2015, Hongyanzi landslide generated impulse waves in Three Gorges Reservoir, China. Landslides 2018, 15, 2385–2398. [Google Scholar] [CrossRef]
  19. Grilli, S.T.; Tappin, D.R.; Carey, S.; Watt, S.F.L.; Ward, S.N.; Grilli, A.R.; Engwell, S.L.; Zhang, C.; Kirby, J.T.; Schambach, L.; et al. Modelling of the tsunami from the December 22, 2018 lateral collapse of Anak Krakatau volcano in the Sunda Straits, Indonesia. Sci. Rep. 2019, 9, 11946. [Google Scholar] [CrossRef] [PubMed]
  20. Panizzo, A.; De Girolamo, P.; Petaccia, A. Forecasting impulse waves generated by subaerial landslides. J. Geophys. Res.-Ocean. 2005, 110, 23. [Google Scholar] [CrossRef]
  21. Tang, H.M.; Wasowski, J.; Juang, C.H. Geohazards in the three Gorges Reservoir Area, China Lessons learned from decades of research. Eng. Geol. 2019, 261, 16. [Google Scholar] [CrossRef]
  22. Sassa, S. Landslides and Tsunamis: Multi-Geohazards. Landslides 2023, 20, 1335–1341. [Google Scholar] [CrossRef]
  23. Hager, W.H.; Evers, F.M. Impulse Waves in Reservoirs: Research up to 1990. J. Hydraul. Eng.-ASCE 2020, 146, 13. [Google Scholar] [CrossRef]
  24. Fritz, H.M.; Hager, W.H.; Minor, H.-E. Landslide generated impulse waves. Exp. Fluids 2003, 35, 505–519. [Google Scholar] [CrossRef]
  25. McFall, B.C.; Fritz, H.M. Physical modelling of tsunamis generated by three-dimensional deformable granular landslides on planar and conical island slopes. Proc. R Soc. A-Math. Phys. Eng. Sci. 2016, 472, 20160052. [Google Scholar] [CrossRef] [PubMed]
  26. Evers, F.M.; Boes, R.M. Impulse wave runup on steep to vertical slopes. J. Mar. Sci. Eng. 2019, 7, 8. [Google Scholar] [CrossRef]
  27. Sabeti, R.; Heidarzadeh, M. Numerical simulations of water waves generated by subaerial granular and solid-block landslides: Validation, comparison, and predictive equations. Ocean. Eng. 2022, 266, 15. [Google Scholar] [CrossRef]
  28. Zitti, G.; Ancey, C.; Postacchini, M.; Brocchini, M. Impulse waves generated by snow avalanches: Momentum and energy transfer to a water body. J. Geophys. Res.-Earth 2016, 121, 2399–2423. [Google Scholar] [CrossRef]
  29. Heller, V. Landslide Generated Impulse Waves: Prediction of Near Field Characteristics. Ph.D. Thesis, University of Nottingham, Nottingham, UK, 2007. [Google Scholar]
  30. Heller, V.; Hager, W.H. Impulse Product Parameter in Landslide Generated Impulse Waves. J. Waterw. Port Coast. Ocean Eng. 2010, 136, 145–155. [Google Scholar] [CrossRef]
  31. Xue, H.; Ma, Q.; Diao, M.; Jiang, L. Propagation characteristics of subaerial landslide-generated impulse waves. Environ. Fluid Mech. 2019, 19, 203–230. [Google Scholar] [CrossRef]
  32. Han, L.; Wang, P.; Yu, T. Wave types and energy conversion of impulse waves generated by landslides into mountain reservoirs. Sci. Rep. 2022, 12, 4035. [Google Scholar] [CrossRef]
  33. Zhang, Y.Y.; Huang, Q.F.; Chen, S.Z.; Chi, F.D.; Wang, H.C.; Xu, W.Y. Spatial and Temporal Distribution Characteristics of Landslide Surge Based on Large-Scale Physical Modeling Experiment. Appl. Sci. 2024, 14, 2104. [Google Scholar] [CrossRef]
  34. Di Risio, M.; De Girolamo, P.; Bellotti, G.; Panizzo, A.; Aristodemo, F.; Molfetta, M.G.; Petrillo, A.F. Landslide-generated tsunamis runup at the coast of a conical island: New physical model experiments. J. Geophys. Res.-Ocean. 2009, 114, 1–16. [Google Scholar] [CrossRef]
  35. Huang, B.; Yin, Y.; Wang, S.; Chen, X.; Liu, G.; Jiang, Z.; Liu, J. A physical similarity model of an impulsive wave generated by Gongjiafang landslide in Three Gorges Reservoir, China. Landslides 2014, 11, 513–525. [Google Scholar] [CrossRef]
  36. Wang, Y.; Liu, J.; Yin, K.; Yu, L.; Zhou, H.; Huo, Z. Comparison between the first and second wave crest amplitude generated by landslides. Ocean. Eng. 2019, 171, 71–77. [Google Scholar] [CrossRef]
  37. Yavari-Ramshe, S.; Ataie-Ashtiani, B. On the effects of landslide deformability and initial submergence on landslide-generated waves. Landslides 2019, 16, 37–53. [Google Scholar] [CrossRef]
  38. Risio, M.D.; Sammarco, P. Analytical Modeling of Landslide-Generated Waves. J. Waterw. Port Coast. Ocean Eng. 2008, 134, 53–60. [Google Scholar] [CrossRef]
  39. Bolin, H.; Yueping, Y.; Renjiang, L.; Peng, Z.; Zhen, Q.; Yang, L.; Shulou, C.; Qiuwang, L.; Kaikai, X. Three-dimensional experimental investigation on hazard reduction of landslide-generated impulse waves in the Baihetan Reservoir, China. Landslides 2023, 20, 2017–2028. [Google Scholar] [CrossRef]
  40. Chen, H.Y.; Cui, P.; Chen, X.Q.; Zhu, X.H.; Zhou, G.G.D. Laboratory experiments of water pressure loads acting on a downstream dam caused by ice avalanches. Landslides 2015, 12, 1131–1138. [Google Scholar] [CrossRef]
  41. Yeylaghi, S.; Moa, B.; Buckham, B.; Oshkai, P.; Vasquez, J.; Crawford, C. ISPH modelling of landslide generated waves for rigid and deformable slides in Newtonian and non-Newtonian reservoir fluids. Adv. Water Resour. 2017, 107, 212–232. [Google Scholar] [CrossRef]
  42. Hu, Y.-x.; Yu, Z.-y.; Zhou, J.-w. Numerical simulation of landslide-generated waves during the 11 October 2018 Baige landslide at the Jinsha River. Landslides 2020, 17, 2317–2328. [Google Scholar] [CrossRef]
  43. Mao, J.; Zhao, L.; Di, Y.; Liu, X.; Xu, W. A resolved CFD–DEM approach for the simulation of landslides and impulse waves. Comput. Methods Appl. Mech. Eng. 2020, 359, 112750. [Google Scholar] [CrossRef]
  44. Ma, H.; Wang, H.; Xu, W.; Shi, A.; Xie, W.-C. Prediction of impulse waves generated by the Wangjiashan landslide using a hybrid SPH-SWEs model. Nat. Hazards 2023, 120, 3799–3826. [Google Scholar] [CrossRef]
  45. Ma, H.; Wang, H.; Xu, W.; Zhan, Z.; Wu, S.; Xie, W.-C. Numerical modeling of landslide-generated impulse waves in mountain reservoirs using a coupled DEM-SPH method. Landslides 2024. [Google Scholar] [CrossRef]
  46. Chen, S.; Xu, W.; Zhang, G.; Wang, R.; Yan, L.; Zhang, H.; Wang, H. Numerical simulation of potential impulse waves generated by the Mogu rock landslide at varying water levels in the Lianghekou Reservoir, China. Landslides 2024. [Google Scholar] [CrossRef]
  47. He, M.; Li, H.; Xu, J.; Wang, H.; Xu, W.; Chen, S. Estimation of unloading relaxation depth of Baihetan Arch Dam foundation using long-short term memory network. Water Sci. Eng. 2021, 14, 149–158. [Google Scholar] [CrossRef]
  48. Shi, A.; Lyu, C.; Fan, X.; Hu, M.; Wang, H.; Xu, W. Prediction of Dam Foundation Displacement due to Excavation Unloading Based on Digital Twin: Case Study of Baihetan Hydropower Project. J. Eng. Mech. 2024, 150, 05024001. [Google Scholar] [CrossRef]
  49. Evers, F.M.; Hager, W.H. Spatial impulse waves: Wave height decay experiments at laboratory scale. Landslides 2016, 13, 1395–1403. [Google Scholar] [CrossRef]
  50. Ataie-Ashtiani, B.; Nik-Khah, A. Impulsive waves caused by subaerial landslides. Environ. Fluid Mech. 2008, 8, 263–280. [Google Scholar] [CrossRef]
  51. Chen, S.; Shi, A.; Xu, W.; Yan, L.; Wang, H.; Tian, L.; Xie, W.-C. Numerical investigation of landslide-induced waves: A case study of Wangjiashan landslide in Baihetan Reservoir, China. Bull. Eng. Geol. Environ. 2023, 82, 110. [Google Scholar] [CrossRef]
  52. Long, X.-Y.; Hu, Y.-X.; Gan, B.-R.; Zhou, J.-W. Numerical Simulation of the Mass Movement Process of the 2018 Sedongpu Glacial Debris Flow by Using the Fluid-Solid Coupling Method. J. Earth Sci. 2024, 35, 583–596. [Google Scholar] [CrossRef]
  53. Xiao, L.; Wang, J.; Li, Z.; Chen, H. Research on dynamic models of landslide tsunami generation considering slide/water interactions. Rock Mech. Eng. J. 2022, 41, 2404–2416. [Google Scholar] [CrossRef]
Figure 1. Geographical location of the Wangjiashan Landslide.
Water 16 01930 g001
Figure 2. Cross-section A-A’ of the WJS landslide.
Water 16 01930 g002
Figure 3. Schematic diagram of measurement devices in the physical experimental model.
Water 16 01930 g003
Figure 4. The entire process of the WJS landslide entering the water. (af) Images of landslide slides at different moments.
Water 16 01930 g004
Figure 5. The complete process of WJS landslide-generated waves under numerical simulation.
Water 16 01930 g005
Figure 6. Comparison of wave height measurement points for surf generation areas 1 # and 2 # , and tide level measurement point 3 # .
Water 16 01930 g006aWater 16 01930 g006b
Figure 7. Comparison of wave heights at measurement points 4 # 11 # in the wave propagation area.
Water 16 01930 g007aWater 16 01930 g007bWater 16 01930 g007c
Figure 8. Comparison of wave heights at measurement points 12 # 17 # in the XBL residential area.
Water 16 01930 g008aWater 16 01930 g008bWater 16 01930 g008c
Figure 9. Comparison of maximum wave heights and maximum climb higher between physical experiments and numerical simulations at measurement points 1 # 17 # .
Water 16 01930 g009
Figure 10. Errors between physical experiments and numerical simulations at measurement points 1 # 17 # .
Water 16 01930 g010
Table 1. Advantages and limitations of typical research methods for landslide-induced surge waves.
ClassificationResearch MethodsAdvantagesLimitations
Empirical formulasFritz MethodAccurate and stableOperation is complex
E. Noda MethodEfficient and flexibleOverly sensitive
Pan Jiazheng MethodPractical and universalResults are rough
Slingerland and voight MethodConsiders multiple factors, reliable outcomesComplex calculations, requires extensive data
Water Research Institute MethodComprehensive and integratedTime-consuming and labor-intensive
Physical model experimentsTwo-dimensional physical model experimentSimple and intuitiveHighly limited
Three-dimensional physical model experimentRealistic reproductionHigh experimental costs, long duration
Numerical simulationsCFDPrecise simulationComputationally intensive
SPHStrong adaptabilityLacks precision
CFD-DEM, SPH-DEMCoupled analysisLong computation time; low efficiency
Table 2. Typical large-scale three-dimensional physical model experiments of landslide-induced surge waves.
Landslide NameScale RatioModel GeometryLandslide Model
Gongjiafang landslide [35]1:20024 m × 8 m × 1.3 mGranular mass
Baishuihe landslide [37]1:20020 m × 8 m × 1.3 mRigid block
Stromboli landslide [38]1:100050 m × 30 m × 3 mRigid block
Jiangnan tuokou landslide1:7058 m × 8 m × 1.6 mBlocks combined
Wangjiashan landslide [39]1:15030 m × 27 m × 1.5 mRigid block
Midui ice avalanches [40]1:2503.9 m × 2.2 mRigid block
Table 3. Results of the physical model experiment and numerical simulation.
Measurement Point NumberArrival Time of the First Wave (s)Height of the First Wave (cm)Maximum Wave Height (cm)Maximum Run-Up Height (cm)
ABABABAB
H126.227.442.843.1380.3354.6__
H234.233.852.953.4309.2304.7__
H345.544.565.666.8__1264.31576.6
H442.143.870.370.8158.1140.4__
H574.775.4192.9151.5192.9170.6__
H692.888.993.280.193.280.1__
H7138.8142.576.688.9141.9151.1__
H888.288.4222.4232.2222.4232.2__
H9101.1109.3160.4181.8160.4181.8__
H1096.391.7176.6114.6176.6145.2__
H11140.8147.9130.6111.2145.4131.3__
H1260.157.5339.8370.6__339.8370.6
H1357.859.8373.7348.3__373.7348.3
H1458.257.3322.4354.3__322.4354.3
H1561.458.1288.7330.2__288.7330.2
H1659.258.8260.2270.3__260.2270.3
H1764.163.2177.1126.1__390.6356.5
Note: A refers to the physical model experiment, and B refers to the numerical simulation.
Disclaimer/Publisher’s Note: The statements, opinions and data contained in all publications are solely those of the individual author(s) and contributor(s) and not of MDPI and/or the editor(s). MDPI and/or the editor(s) disclaim responsibility for any injury to people or property resulting from any ideas, methods, instructions or products referred to in the content.

