Article

Sampling and Analysis of Microplastics in the Coastal Environments of Sri Lanka: Estuaries of the Kelani River to Mahaoya

1
Department of Chemistry, University of Kelaniya, Dalugama, Kelaniya 11600, Sri Lanka
2
National Aquatic Resources Research and Development Agency (NARA), Colombo 01500, Sri Lanka
3
Centre for Environment, Fisheries and Aquaculture Science (Cefas), Suffolk NR33 0HT, UK
*
Author to whom correspondence should be addressed.
Water 2024, 16(13), 1932; https://doi.org/10.3390/w16131932 (registering DOI)
Submission received: 18 May 2024 / Revised: 29 June 2024 / Accepted: 4 July 2024 / Published: 8 July 2024
(This article belongs to the Section Oceans and Coastal Zones)

Abstract

:
Microplastic pollution (MP) in marine environments around the globe is severe and insufficient precautions have yet to be taken for its prevention. The focus of this study was on quantifying MPs from beach sediment and seawater samples and identifying their distributions and types along the western coast of Sri Lanka from the Kelani River estuary to the Mahaoya estuary. Nine sites along this 42 km stretch were selected, and random sampling was employed to collect a minimum of eight sediment samples from each site between October and December 2021. Water samples were also collected, parallel to the sediments, from the ocean surface. FTIR analysis revealed that most of the MPs found were polyethylene (PE), polypropylene (PP), polystyrene (PS), polyethylene terephthalate (PET), and phenol formaldehyde resin. The mean abundance of MPs varied from 2.0 ± 0.6 items/L to 161.0 ± 15.7 items/L in water samples and from 3.0 ± 0.3 items/m2 to 656.0 ± 34.5 items/m2 in sediment samples. The MPs found were identified in different shapes as fragments (80.2%), pellets (14.9%), fibers (2.7%), and foams (2.5%). Analysis revealed that the beach sediments were contaminated with PS, phenol formaldehyde resin, PET, PP, and PE, while the surface seawater was dominated by phenol formaldehyde resin, PS, PP, and PE.

1. Introduction

Plastics are synthetic organic polymers with features such as durability and low prices, making them perfect for many applications. Unfortunately, however, the same characteristics that make plastics the perfect materials also cause them to become sources of serious pollution [1], and plastic waste in the maritime environment is a major concern worldwide [2]. Plastics are the most common waste material found in the marine environment, accounting for 70% of marine debris [3]. Particles of plastic can be categorized as nanoplastics (1 nm–1 mm) [4], microplastic (≤5 mm) [5], mesoplastic (5–20 mm), macroplastic (>20 mm), and megaplastic (>100 mm) based on size [6,7]. This plastic litter can severely impact marine health, with macroplastics causing marine creatures’ entanglement and meso- and MPs being ingested by marine creatures [8]. MPs are synthetic materials with a high polymer content that are insoluble in water and either non-degradable or observed to slowly decompose in nature [9]. Recently, MPs have emerged as a threat to the global environment due to their mismanagement [10]. MP particles are usually categorized into different forms based on their observed morphology [11], and MPs are classified into primary and secondary categories based on their origin [12]. Primary MPs are intentionally generated by the cosmetics and personal care product industries for products including cleansers, facial and body scrubs, body washes, personal hygiene products, and textiles, whereas secondary MPs result from the degradation of plastic debris in the environment caused by ocean waves, biofilm growth, the sun’s radiation, mechanical cleavage, and thermal deterioration [13]. Examples of secondary MPs are eroded tire particles, synthetic fibers from clothing shed during laundry, plastic litter, marine protection coatings (a protective layer primarily used in the marine environment to prevent damage to ships, cargo vessels, and oil tankers from seawater), such as anti-fouling and anti-corrosion paints, and city dust [14].
Presently, just 9% of the overall quantity of plastic debris produced is recovered or reused; of the remaining, 22% is discarded as garbage, which is defined as mismanaged plastic litter; 50% is disposed of in landfills; and 19% is burned in incinerators [15]. The latter is typically discharged into aquatic or terrestrial habitats. Estimates indicate that 22% of the entire quantity of created plastic litter mentioned previously, or around 10% of the plastic trash that is illegally disposed of, ends up in marine ecosystems, in which it will eventually collect [16]. Scientists have already issued an alert that by 2050, there will be a greater amount of plastic than fish in aquatic bodies if the current rate of rapid growth in the disposal of plastic waste continues [17]. MPs are so microscopic that they can easily spread, meaning they are found in many different habitats [18]. Moreover, they infiltrate organisms via a variety of routes, endangering a range of species and having a substantial impact on the general well-being of ecosystems [18]. Plankton and other aquatic animals are among the many species that can consume microplastics when these plastics find their way into aquatic environments [19]. MPs can be released into ecosystems through various means, including road runoff, industrial and agricultural wastewater, litter, sewage treatment facilities, and atmospheric breakdown [20]. Since MPs are now abundantly found in environments where they may cause harm, including the soil, waterways, the air, biota, and human bodies, they present a serious problem. Even in places that are protected or regarded as pristine, plastic contamination is evident in almost all aquatic and marine habitats in those locations [20,21,22,23]. This serves as a warning regarding these pollutants’ potential hazards and impacts on aquatic life, as well as their dispersion and transport capability, particularly for smaller-sized contaminants [24,25]. Microplastics are also abundant in the ocean and can be found from the top to the seafloor. Indeed, some estimates place the number of plastic particles in our oceans at five trillion or higher, with microplastics making up a large component of this total [19,26]. Hydrodynamics come into play, which impact the pattern of microplastic dispersion and accumulation in riverine and/or marine environments. When surface longshore currents are present, floating plastics exhibit an enhanced transportation ability [27]. Furthermore, deep oceanic currents may drive less dense, and thus less buoyant, plastic at lower water depths. As a result of these variables, MP movement and accumulation in the marine environment adopt highly specific and fluctuating patterns, making it challenging to forecast plastics’ removal and aggregation dynamics [28].
The MP particles in our seas and oceans have been reported to be particularly prevalent in several sites, ranging from coastal regions to distant offshore regions. These MPs can originate from plastic litter disposed of on land or at sea, dissemination during the transport of materials and preproduction pellets, wastewater treatment plants, and fishing activity [29]. Floatation of plastics is sometimes observed; for example, the lower densities of PE and PP cause them to float on the water’s surface [30]. In contrast, PVC and PET tend to sink because they have densities higher than that of water. The oceans across the world are home to widely distributed MPs [31]. Due to their light weight and low density (density: 1.02–1.03 g cm−3), most plastics originally float in seawater [5]. However, plastics can then undergo density modifications in seawater as a result of processes triggered by UV rays, leaking of chemicals, microbial fouling, and integration into oceanic debris. Even though their original properties kept MPs floating, these processes cause MPs to sink to the bottom of the water column [32,33]. The reported levels of MPs in water samples have ranged from less than one particle to several hundred particles per cubic meter [31]. However, there is a need for scientific regulations and guidelines regarding MP sampling and quantification because measurements can be inconsistent with regard to extraction protocols, devices, mesh sizes, and depth layers [31]. Nonetheless, it has been found that films, pellets, and fibers are usually the most prevalent MP forms [5]. Moreover, MP levels may be impacted by the amounts of macroplastics found on beaches [31] since a significant fraction of the litter on the seabed is frequently plastic, and the considerable levels of plastic litter seen on beaches and the seabed are often comparable; both feed the debris entering the water column, and MP beach sediments originate from that water column debris [15]. Meanwhile, open oceans favor the density-based segregation of different microplastic polymer types [34]. Denser polymers, such as polyesters, polyvinyl chloride, and acrylics, accumulate high up but with deep water columns, while lightweight polymers, such as polypropylene, polystyrene, and polyethylene, predominate in surface seawater samples and are less prevalent as one enters the deep water column. The most prevalent and resistant manmade plastics endure for much longer at the ocean’s surface than in its deep water [34].
Since Sri Lanka is a tropical island, it has a diverse range of ecosystems along its shoreline. In addition, the island is surrounded by offshore coastal areas in the eastern, southern, western, and northwestern regions. Studies have shown that excessive concentrations of MPs have been found in beach sediments, water in marine protected areas [35], marine beaches [36], and marine biota [37] all along the coastline of Sri Lanka. Studies performed to evaluate the amounts of microplastics in Sri Lankan waters indicate that the West Coast waters are more MP-polluted than those of the East Coast [38]. Additionally, recent studies were carried out to evaluate the potential toxic elements (PTEs) associated with the concentrations of plastic nurdles, pyrolytic debris, and coastal contamination. Furthermore, prevention strategies have been taken in response to the biggest coastal accident ever to have occurred in Sri Lankan waters, involving the presence of chemicals, cosmetics, and plastics in cargo containers on board the MV X-Press Pearl [39,40]. However, most data in the local context have been insufficiently analyzed and reported. Furthermore, the effects of plastic pollution on Sri Lanka’s western coastline region have not received adequate attention.
There is an urgent need for baseline data on MPs in Sri Lanka, particularly in the aftermath of the X-Press Pearl environmental emergency. A fire onboard resulted in the vessel capsizing and losing all cargo off the west coast of Sri Lanka [41]. On 21 May 2021, there were fires and explosions, which were suspected to be caused by a nitric acid leakage. Ten days later, the wreckage sank onto the seafloor. This tragedy is regarded as the worst accident in Sri Lankan maritime history, involving a single cargo container carrying chemicals and plastics [42]. It has had serious adverse effects on the fragile coastal environment, the local population, and the economy of Sri Lanka through the spilling of more than 1750 tons of plastic pellets—the largest-ever amount of plastic pellets to be spilled, containing a variety of hazardous materials from the X-Press Pearl cargo.
Establishing baseline data is key to evaluating the extent of MP contamination, assessing potential risks to both marine life and human health, and developing effective policies for mitigation. Furthermore, without baseline data, it is not possible to determine the full impact of environmental disasters, as no knowledge of existing nurdle contamination is available, or to quantify the success of mitigation strategies. To address the data gap, as part of ongoing research, this work adopts suitable methods to collect and separate MPs from beach sediment and surface seawater samples and to identify their distribution, types, and abundance along the western coast of Sri Lanka from the estuary of the Kelani River to the estuary of Mahaoya. The main estuary points, Kelaniya and Mahaoya, are situated on the west coast of Sri Lanka, which has an important ecological system. Here, the distribution, types, and abundance of MPs along the western coast from the estuary of the Kelani River to the estuary of Mahaoya in Sri Lanka were investigated over nine sites along a stretch of 42 km (Hendala, Wattala, Uswetakeiyawa, Sarakkuwa, Bopitya, Dungalpitiya, Morawala, Browns beach, and the estuary of Mahaoya). The coastal area contains a variety of biological and physical resources. Estuaries serve as a nursery ecologically and commercially. As of right now, no research has looked into the presence of MPs in the coastal area along the estuary of the Kelani River to the estuary of Mahaoya.

2. Materials and Methods

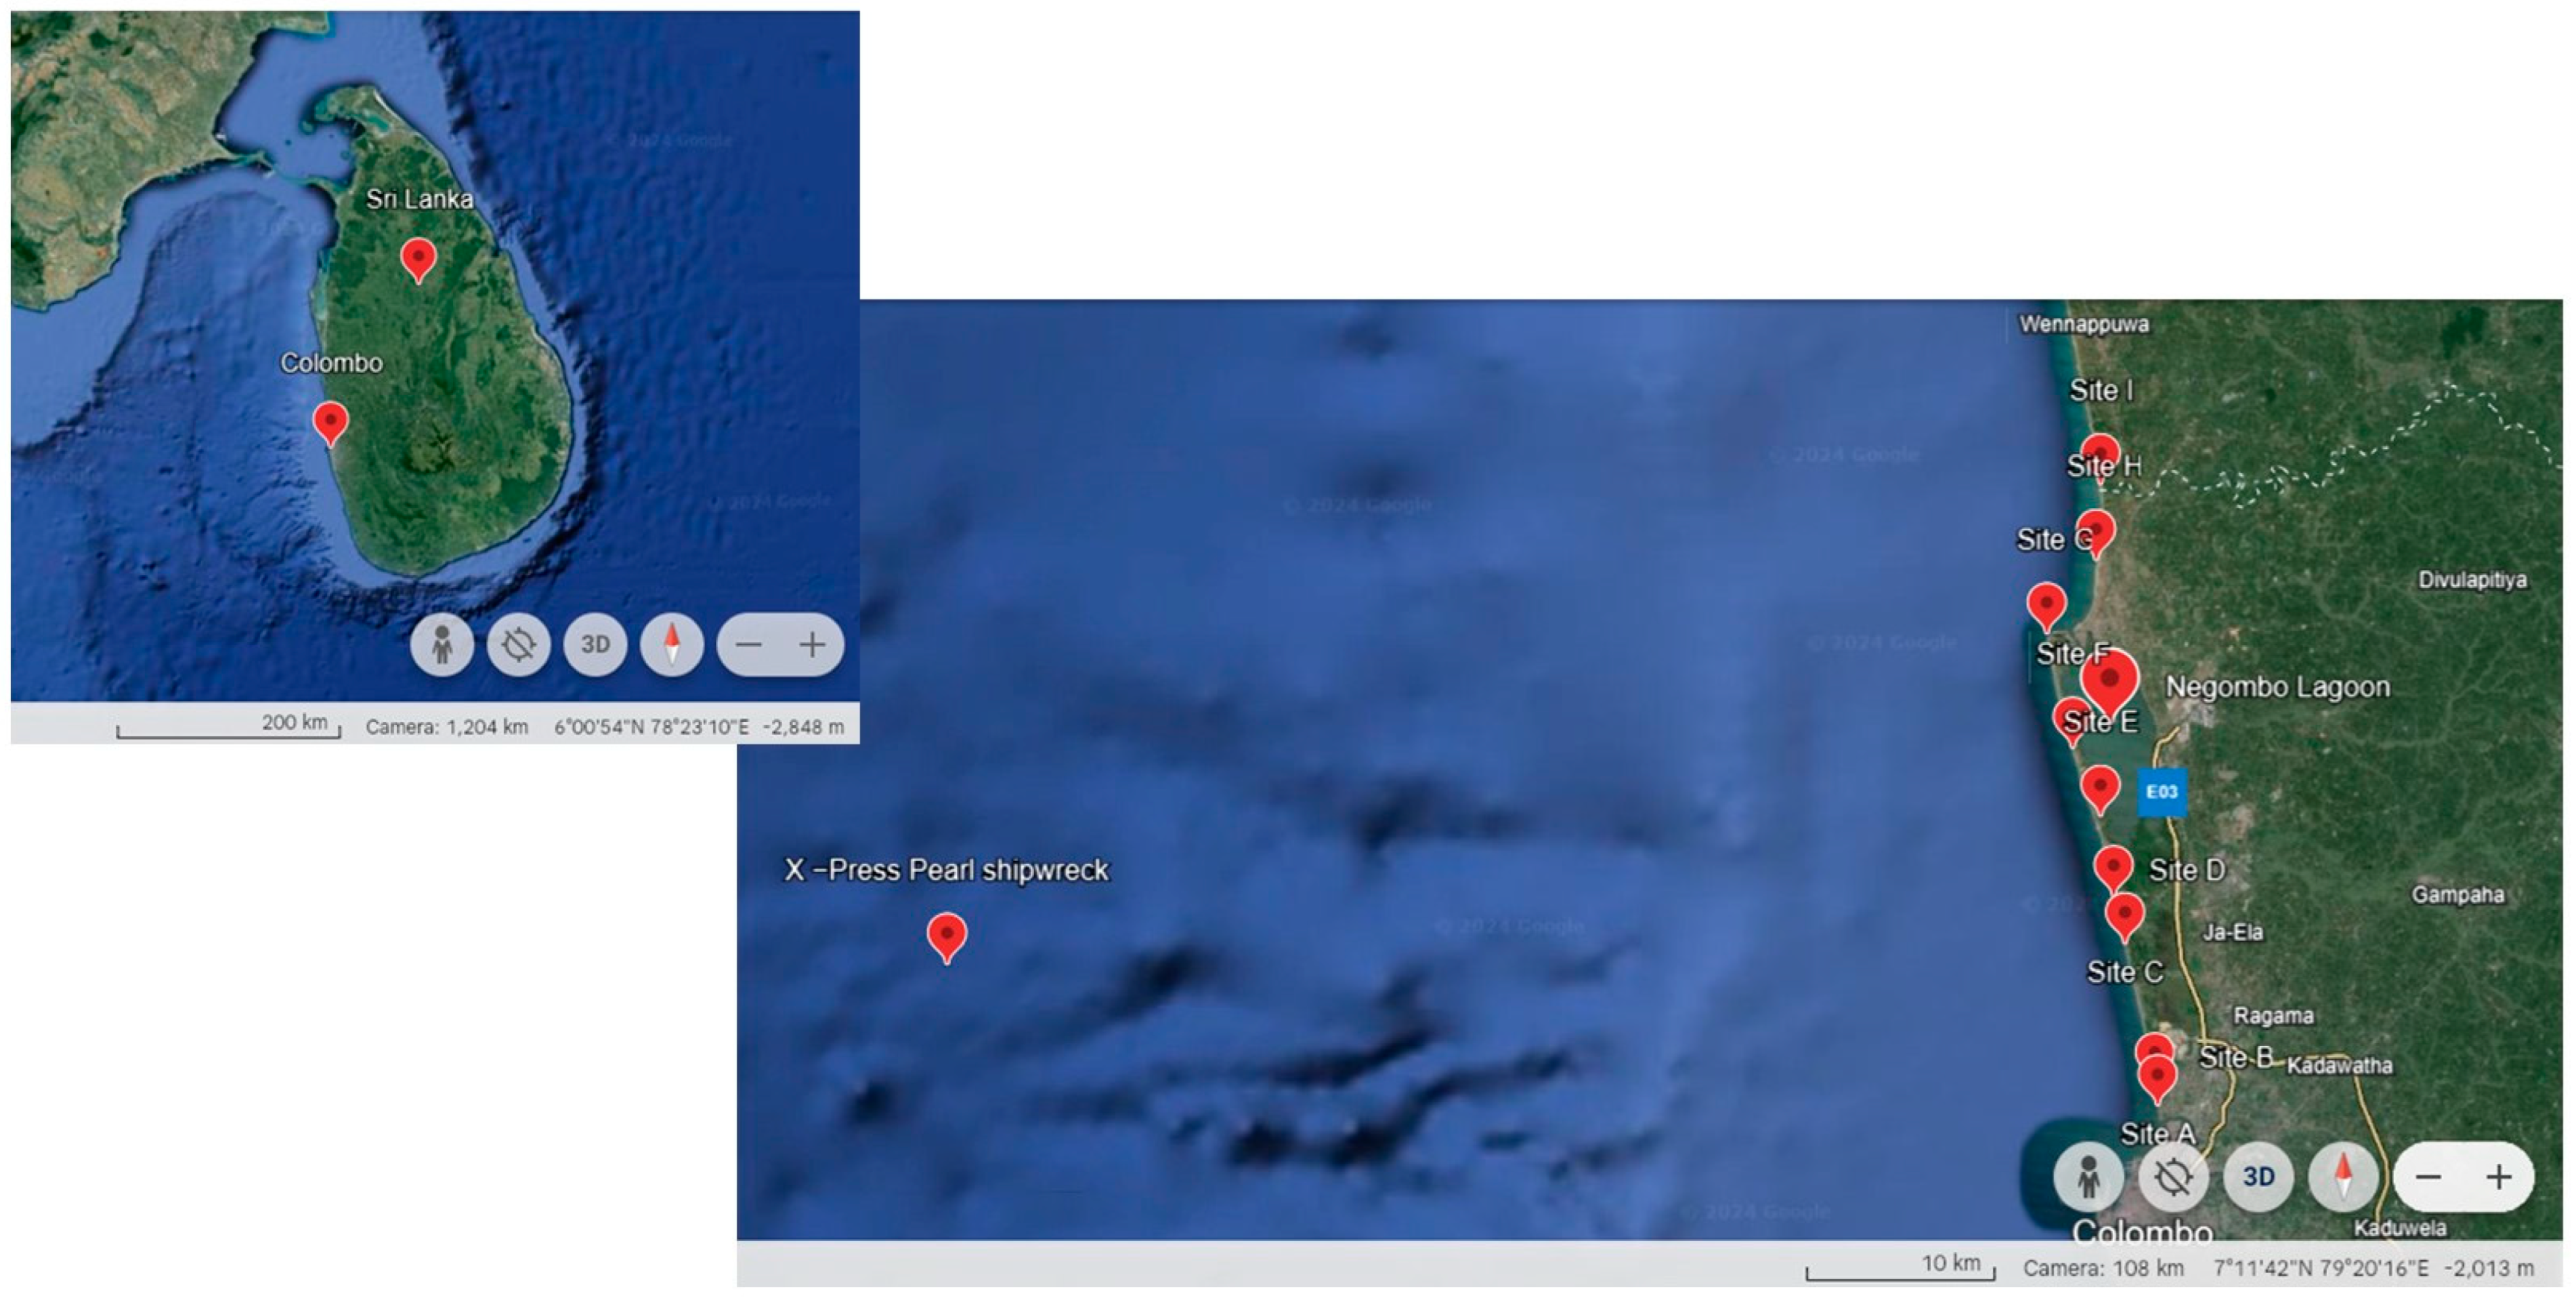
2.1. Study Area and Sample Collection

Nine sampling sites (A–I, Figure 1) were randomly selected for this study along a stretch of 42 km of the western coast from the estuary of the Kelani River to the estuary of Mahaoya in Sri Lanka with approximately 6 km between each sampling site. The Hendala and Wattala sites are located near potential MP inputs near the estuary of the Kelani River. Sampling sites were expanded from Colombo to the Negombo beach area. Colombo is the capital of Sri Lanka, which is densely populated. Ten samples (10) each of surface seawater (1 L) and sediments (1 kg) were collected concurrently from each site (A-I) within a 100 m stretch in the intertidal zone (the line between high tide and low tide) along the beach during October (Sites A–E) and December (Sites F–I). When collecting sediment samples, a quadrat (0.2 m × 0.2 m) was placed on the surface and the sediment under the quadrat at a depth of 3 cm was collected. A stainless container/bucket was employed to sample surface seawater. The collected surface water and sediments were placed in sample collection glass bottles. The samples collected were labeled with a sample ID, GPS location, and date of collection.

2.2. Microplastic Analysis: An Optimized NOAA Method

The MP analysis was carried out employing optimized NOAA standardized protocols [43] and comprised five major steps for water and sediment samples separately: filtration and sieving, wet peroxide oxidation, density fractionation, and MP quantification.

2.2.1. Isolation of MPs

Each water sample was poured through a stacked mesh sieve of 5.6 mm (No. 3.5, top) followed by 0.3 mm (No. 50, bottom) [43]. A 0.05 mol L−1 Fe (II) solution (Sigma-Aldrich, Saint Louis, MO, USA) was added dropwise to the solids obtained from the 0.3 mm sieve. Afterward, 5 mL of 30% H2O2 ) (Central Drug House (P) Ltd. Corp, Daryaganj, New Delhi, India)was added to each mixture and left at ambient temperature for 5 minutes. The mixtures were then heated to 50 °C on a hotplate while stirring for 5 minutes. Next, a 20 mL portion of 5.00 mol L−1 NaCl (Sigma-Aldrich, Saint Louis, MO, USA) (specific density = 1.20 g mL−1) was added. The resulting solids were left to settle overnight in a density-separating funnel. Floating solids were collected on a clean filter paper (Whatman No: 42, pore size 11 µm) using a vacuum filtration apparatus (Glass Filter Holder Assembly with stainless steel screen) and subsequently dried in a desiccator.
Each wet sediment sample was air dried, and 400 g of each sample was taken. A modified NOAA method (Section 3.5) [43] was applied, where 250 mL of aqueous NaBr solution (Loba Chemie Pvt. Ltd., Mumbai, Maharashtra, India) (specific density = 1.40 g mL−1) was added to each sample. After leaving for 20 min to settle, all suspended particles were transferred onto a 0.3 mm sieve. Any visible material > 5 mm (organic matter and polymers) was removed. Collected solids on a 0.3 mm sieve were transferred onto a filter paper (Whatman No: 42, pore size 11 µm) using the vacuum filtering apparatus. In the wet peroxide oxidation step, an aqueous 0.05 mol L−1 Fe (II) solution (Sigma-Aldrich, Saint Louis, MO, USA) was added dropwise to the solids collected from a 0.3 mm sized fraction followed by the addition of 20 mL of 30% H2O2(Central Drug House (P) Ltd. Corp, Daryaganj, New Delhi, India). The mixture was left to stand for 5 min at ambient temperature and then heated to 50 °C on a hotplate for 30 min with stirring. Solids that were collected on the filter paper were transferred to a separating funnel followed by the addition of 20 mL of saturated NaBr solution (Loba Chemie Pvt. Ltd., Mumbai, Maharashtra, India) (specific density 1.40 g mL−1). Solids were allowed to settle overnight in the separating funnel. The MPs that were visually inspected in the settled solids were extracted using forceps. Floating solids were collected on filter paper (Whatman No: 42, 11 µm).

2.2.2. Identification and Characterization of MPs

Microplastic particles were detected under a stereomicroscope (Euromex StereoBlue SB.1902-P, Euromex Microscope bv, Arnhem, The Netherlands) with magnification from 10× to 20× directly on the entire filter surface [44]. The extracted MPs were categorized into five groups: fragments, fibers, pellets, foams, and films. A minimum 10% subset of MPs was identified with Attenuated Total Reflection Fourier Transform Infrared (ATR-FTIR) spectroscopy (ALPHA Bruker, Billerica, MA, USA), which was used for the identification of MPs in the range of 500–4000 cm−1 with 32 scans and a resolution of 4 cm−1. A 60% matching score to the polymer databases (ATR-FTIR-library complete, vol. 1–4; Bruker Optics ATR-Polymer Library; IR-Spectra of Polymers, Diamond-ATR, Geranium-AT and IR-Spectra of additives, Diamond-ATR) was used to confirm the identity of the compound.

2.3. Validation of Methodology and Contamination Assessment

To evaluate the recovery efficiency of the suggested protocol, PVC fragments were introduced as an internal reference to a known quantity of natural soil samples prior to the initial extraction phase. The method’s validation was achieved through density separation of sediment samples with NaBr (Loba Chemie Pvt. Ltd., Mumbai, Maharashtra, India) followed by H2O2 (Central Drug House (P) Ltd. Corp, Daryaganj, New Delhi, India) treatment with PVC fragments as the spiked MPs. In the method validation for KOH (Sigma-Aldrich, Saint Louis, MO, USA) and methanol (Sigma-Aldrich, Saint Louis, MO, USA) treatment, sediment samples were spiked with PVC fragments as an alternative digestion method. Then, the KOH and methanol treatment vs. H2O2 treatment with sediment samples from Site A was performed.
In order to minimize the field exposure throughout the sampling period, the standardized protocols were improved to ensure the consistency of sampling for the collection of sediment samples [45]. As field blanks, empty glass containers that had been pre-cleaned were kept open for the duration of the sediment sample transfer. The environmental contamination in the field was assessed with glass jars left near the collection point. This was used as a control sample. Blanks were conducted in each stage during the process. In addition, blanks were also used throughout each step of the process to assess for any possible contamination. Throughout the process, cotton lab coats were worn. No MP was detected in the environmental blanks. Precautions were implemented throughout the sampling process to minimize atmospheric exposure by opening containers only for the minimal time required during sample transfer.

2.4. Determination of Pellet Pollution Index (PPI)

Pellets were separated using the density separation technique from the beach sediment. When counting the number of plastic pellets separated from beach sediment samples, the PPI (pellet pollution index) for each sampling point was calculated using Equation (1) [42]. Then, in order to efficiently categorize the findings in a range of 0.0 to 3.0 according to the extent of contamination, the proportion was multiplied by a correction coefficient p (p = 0.02) for contamination as follows: very low (0.0 < PPI ≤ 0.5); low (0.5 < PPI ≤ 1.0); moderate (1.0 < PPI ≤ 2.0); high (2.0 < PPI ≤ 3.0); and very high (PPI > 3.0) [46].
PPI = n a × p
where n is the number of pellets examined, a is the sediment sample area (m2), and p = 0.02 is the correlation coefficient [46].

2.5. Data Analysis

Percentages of the detected MPs in the samples were analyzed by the shape, polymer type, and color; the MP abundance levels in items L−1 and items m−2 were calculated. A Kruskal–Wallis test was employed to examine the statistical significance between sampling locations in sediment and water. The Kruskal–Wallis test is used to analyze non-parametric data with multiple independent groups. Spearman correlation analysis is a non-parametric measure of statistical dependence between two variables. Spearman correlation analysis was employed in this study to examine the relationship between the levels of abundance in surface waters and sediments. IBM-SPSS (IBM Corp. Released 2023. IBM SPSS Statistics for Windows, Version 29.0. Armonk, NY: IBM Corp), MS Excel, and Originpro 8.0 were utilized to generate each statistical analysis and graphic representation. Map diagrams were designed by Esri using their ArcGIS® Pro 3.3.0 software program (Esri Inc., 2024. ArcGIS Pro 3.3.0 Environmental Systems Research Institute, Redlands, CA, USA. Basemap data copyright Esri.) and Google Earth [version 10.43.0.2; Google, Inc., Mountain View, CA, USA, 2024]. ArcGIS® and ArcMap™ are the intellectual property of Esri and were used here under license. Copyright © Esri. All rights reserved. For more information about Esri® software, please visit www.esri.com [accessed on 29 June 2024].

3. Results

A total of 85 sediment samples and 81 water samples yielded 403 MPs and 391 MPs, respectively. Pellets were recovered from 14.9% of sediment samples but were not present in the water samples, which predominantly contained fibers. PE was the most common polymer, accounting for over 60% of the analyzed items.

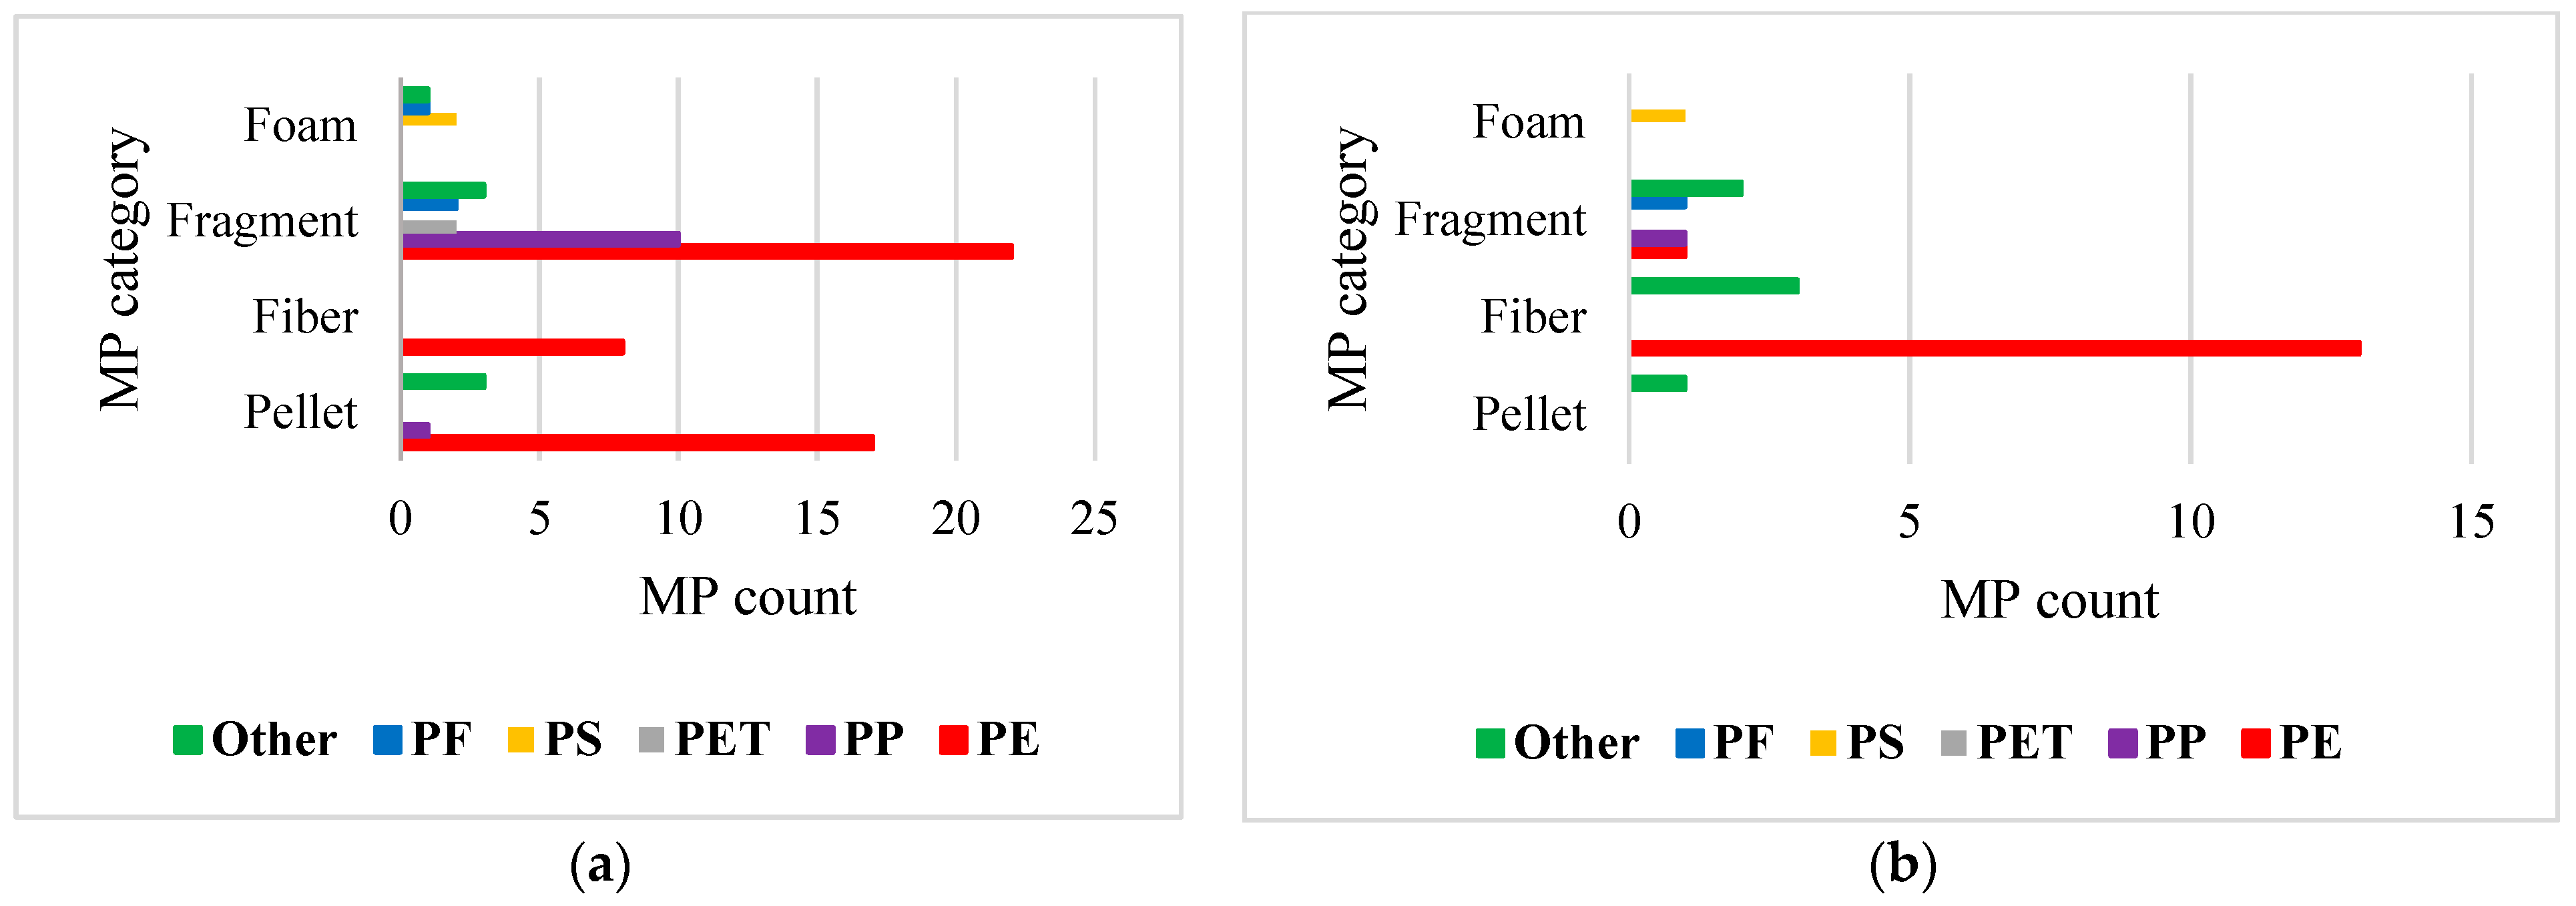
3.1. Morphology of MPs

The recovered MPs were classified into five categories based on their shape (Figure 2): fibers, fragments, pellets, foam, and films.
All pellets were recovered from sediment, with no pellets present in the water samples. Conversely, almost all fibers were present in the water (63.4% of items in water). The most common form of plastic in sediment was fragments (80.1%) followed by pellets (14.9%), fiber (2.7%), foam (2%), and film (0.2%) (Figure 3). In surface waters, fragments (35.5%) were followed by foam (0.8%) and film (0.3%) (Figure 3).
Microplastics extracted from sediment samples appeared in different colors (Figure 4): blue (75.9%), followed by white (19.8%), red (1.6%), yellow (1.3%), green (1.1%), and black (0.3%). In surface waters, the blue (94.5%) color was dominant, followed by white (2.4%), green (1.3%), red (0.8%), and yellow (0.5%). Whilst blue was the dominant color in our samples, but there was some variation in color between the different plastic forms. The dominant color of MP fibers was blue (94.5%), followed by white (2.4%), green (1.3%), red (0.8%), and yellow (0.5%) in the surface waters. The prominent colors of MP fragments were blue, green, red, and white. All MP foams were white in appearance. Films were the least abundant type of MP and appeared in a white color.

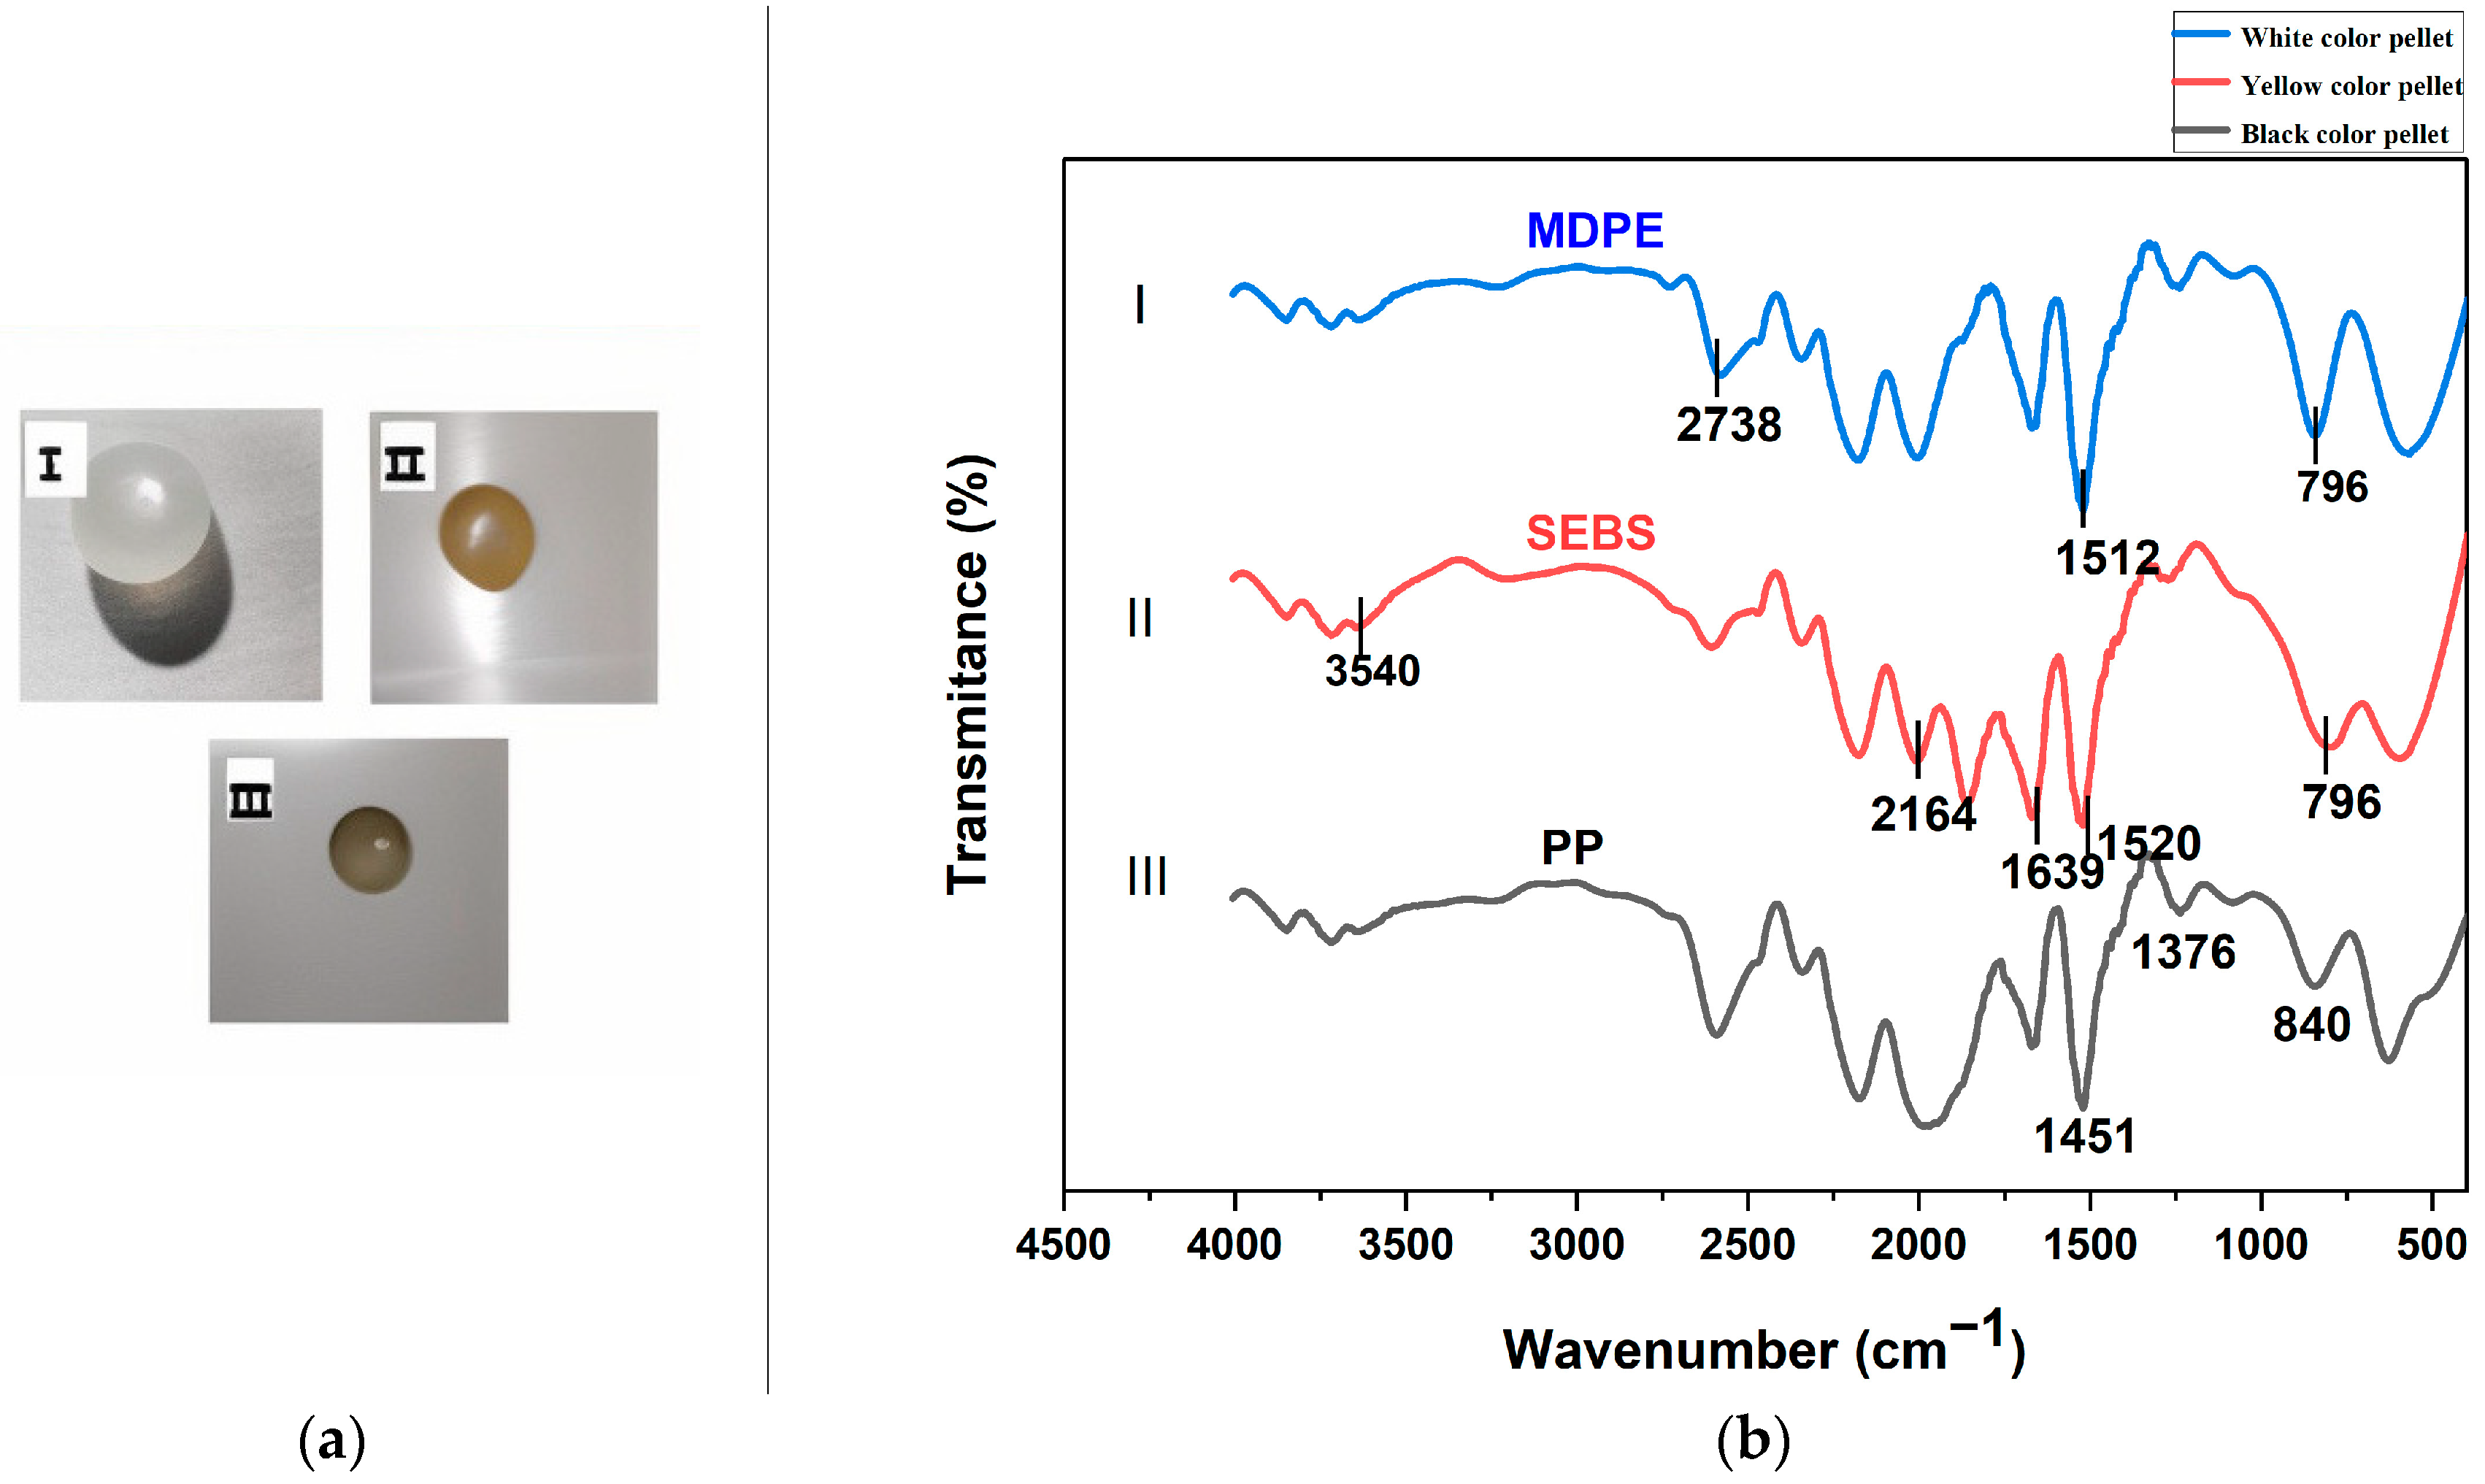
3.2. Polymer Characterization of MPs

Overall, 88 MPs in sediments (21.8% of recovered items) and 23 MPs in water (5.8%) were identified. In sediment, the most abundant polymers were PE (65.3%) and PP (15.3%), followed by phenol formaldehyde resin (4.2%). Polyethylene terephthalate (PET) and PS could also be found in considerable amounts in sediment samples (2.8%) (Figure 5a). Meanwhile, in water samples, PE (60.9%) dominated, followed by PP, PS, and phenol formaldehyde resin (4.2%) (Figure 5b). Less common polymers were also identified, which combined made up 9.7% of the items identified in sediment and 26.1% of the items identified in water, included HPS (high-impact polystyrene), SEBS (styrene ethylene butylene styrene block copolymer), NR (natural rubber), SAN (styrene acrylonitrile), and FEPM (tetrafluoroethylene propylene rubber). Polymer types varied between the different plastic forms, with pellets identified as PP, fibers as predominantly PE, fragments as PE, PP, phenol formaldehyde resin, and PET, and foams as PS and phenol formaldehyde resin.

3.3. Spatial Distribution of MPs in Sampling Sites

The MP abundance in sediment was significantly different between stations (H = 0.433, df = 8; p < 0.05; test statistic = 8.000) (Figure 6a), ranging from 2.5 ± 0.3 (Site F, Dungalpitiya) to 656.3 ± 34.5 items m−2 (Site I, Mahaoya Estuary) (Figure 7a). The MP abundance exceeded 10.0 items m−2 at all the remaining sampling sites (A, B, C, D, E, G, and H).
The MP abundance in water also differed significantly between stations (H = 0.433, df = 8; p < 0.05; test statistic = 8.000) (Figure 6b), ranging from 0 ± 0 (Site G) to 161.0 ± 15.7 items L−1 (Site A, Hendala) (Figure 7b). The MP abundance levels at stations A, I, B, and C were significantly higher (121.0 ± 21.7, 63.0 ± 8.3, and 23.0 ± 1.9 items L−1, respectively) than those at all other sampling points. Stations D and F, with MP abundances of 12.0 ± 1.2 and 7.0 ± 0.8 items L−1, respectively, were statistically higher in MPs than sites E, H, and G, which contained 2.0 ± 0.6 items L−1 or less.
The MP abundance levels in beach sediments and surface sea waters were shown to be positively correlated (rs = 0.385, p < 0.01).
The MP pellet distribution ranged from 80.0% (site D) to 17.0% (site H). Meanwhile, there were three sites where more than 30.0% of MPs identified were fibers (sites B, E, and F). At the same time, the foam fraction ranged from 50.0% (site G) to 4.5% (site D) and films made up only 2.8%. The total distribution of MPs was around 33.0%. More than 50.0% of those MPs were fibers, which were found in water samples at several sampling sites. Five sites had more than 30.0% of the MP fragments (sites D, E, F, H, and I). The MP foam distribution was 1.0%–8.0% (8.3% at site D, 0.8% at site I) (Figure 8), while no MPs were identified at site G.

3.4. Pellet Distribution

Sediment samples from site C (Figure 9a) consisted of pellets in various colors in addition to different secondary plastic debris. Plastic pellets were primarily discovered in white, while some appeared brown and black (Figure 9a). They were identified as medium-density polyethylene (MDPE), styrene ethylene butylene styrene (SEBS), and PP by the FTIR-ATR analysis (Figure 9b) [47]. Distinctive peaks corresponding to asymmetric and symmetric C-H stretching at 2927 and 2852 cm⁻¹, C-H2 bending deformation at 1463 cm⁻¹, and C-H2 rocking deformation at 720 cm⁻¹ were observed in the FTIR-ATR spectra of the white pellets (Figure 9b). These peaks confirmed the material type as MDPE. The characteristic peak at 699 cm−1 assigned to the monosubstituted aromatic band is the most important indicator for distinguishing the SEBS copolymer. This confirmed that the brown-colored plastic pellet isolated was SEBS. Moreover, the characteristic peaks of CH2 deformation, symmetric CH3 deformation, and the isotactic polypropylene band (methylene–(CH2)–rocking band vibration) at 1456, 1376, 1166, and 970 cm−1 (Figure 9b) [48] confirmed the black-colored pellets as PP [49]. However, note that chemical changes that occurred in the MPs as a result of radiation, water, oxygen, temperature, and organisms may have misled the identification and obscured the exact polymer type, which reflects how the environmental conditions to which samples are exposed may affect the analysis [50].

3.5. Plastic Pellet Pollution Index

Along the coastal beaches from the nine sampling sites, 60 pellets were found in total with an average of 6.7 ± 0.7 pellets per m2. The resultant PPIs at site I (estuary of Mahaoya), Site D (Bopitiya), and Site C (Uswetakeiyawa beach) showed a range of 18 pellets per m2, 9 pellets per m2, and 3 pellets per m2, respectively, according to the scale developed by [46]. Site G (Morawala Beach) showed the lowest abundance, with 1 pellet per m2 and a very low degree of pollution. According to this classification, 33.3% of the total sampled sites show very high MP contamination, while 11.1% of the sites fell under the very low PPI category.

4. Discussion

The current research findings outline the occurrence of MP litter on the western coastline of Sri Lanka. Findings from this project show notable contamination with MPs in coastal areas along the estuary of the Kelani River to the estuary of the Mahaoya. More than 50.0% of MPs recovered in surface waters are fibers, with several sampling sites having an abundance of blue items (94.5%). There is also a notable abundance (65.3%) of PE over other polymers. Its numerous applications in the fishing industry and other fields such as packaging, construction, consumer goods, and industrial applications are likely responsible for its high abundance, with many communities relying on coastal habitats for food and income. Similar research on MPs in surface seawater samples along the coastal stretch of Tamil Nadu, South India in the Bay of Bengal noted the abundance of a diverse array of plastic shapes [51]. Fragments were also found in the seawater column and beach sediment. Many of the fibrous MPs recovered by [51] were found in colors also used in the production of fishing nets in the region. Domestic wastewater and microfibers transported through the air were also noted as potential sources of the filaments recovered from the Bay of Bengal [51].
Local and foreign tourists are attracted the segment of the coastline from the Kelani River estuary to Negombo, which is a straight coastline. Due to a densely populated area and mainly recreational activities surrounding the Kelani River estuary, there has been a relatively high accumulation of MP debris. More than 2 km of the coastline region is occupied by the Uswetakeiyawa and Browns beach locations, and these beaches act as popular family-friendly attractions offering swimming, diving, and water sports activities. Based on the findings of the present study, the Mahaoya estuary point, near Kochchikade, has the highest total MP abundance and thus serves as the next important landmark.
In a recent study, the most prevalent form of MP fragment identified here was determined to be the primary contributor to MP pollution in the southern coastal regions of Sri Lanka [35]. Furthermore, another study on coastal beaches and waters in southern Sri Lanka revealed that secondary MP fragments derived from larger debris dominated most sites [36]. Another study focused on the spatial distribution of plastics in 12 coastal regions in the surface seawater in the southern part of Sri Lanka, where filaments were identified as the majority of MPs, followed by films [52]. According to the findings of a study on MPs occurring in bottom sediments in the Arabian Sea and the Andaman Sea, the MPs were predominantly fragments and pellets [53]. In summary, the diverse studies conducted on MP pollution in different coastal regions highlight a complex distribution of MPs, with fragments consistently identified as the primary contributor across various environmental compartments. These findings underscore the pervasive nature of MP pollution in marine environments and emphasize the need for integrated management strategies to mitigate its impact on coastal ecosystems.
According to our study, MPs are accumulating in sediment rather than water. This will impact the longer-term retention of plastics as well as bioavailability, with items likely to remain locally in the sediment rather than being transported elsewhere by currents. Tidal waves near the shore are the primary cause of MP migration from beach sediments into the water column, but they also bring items to the beach, where they are deposited. Suspended particles in the water can be transported laterally by currents, with dispersion impacted by the wind direction, climatic conditions, and anthropogenic activities. Thus, particles in the water may be transported elsewhere, accounting for the low concentrations reported in the present study.
The sampling locations in the Gampaha district in the Western Province (sites A and C) showed a correlation between the increase in human population and the level of plastic contamination. Accordingly, in the west coast region of Sri Lanka, improper housing, fisheries, and commercial and recreational activities could lead to plastic pollution through anthropogenic sources. Morawala beach is among the foremost leading fish harbor sites in the western coastal region, whereas Browns beach is a famous tourist attraction site in the Negombo coastal zone. Recreational activities like commercial fishing and tourism make substantial contributions to plastic pollution at these sites. MPs have accumulated throughout the western coastal strip, especially in the Negombo region, because of the vast development of infrastructural facilities for tourism, which has led to their accumulation in the western coastal belt. Since the western coastal zone is commercially valuable, to have a sustainable coastline area, we need to implement mitigation measures for plastic pollution.
Compared to previous studies conducted in other coastal regions (Table 1), the observed level of MP abundance was higher. A recent study surveyed the abundance of marine litter at 22 beaches along the coastline of Sri Lanka. The findings revealed a mean abundance of 4.1 large (>25 mm) and 158 small (5–25 mm) MPs m−2 of beach [37]. MP contamination was detected in 70% of the offshore surface waters and sediment in a study investigating MP contamination in coastal beaches and waters in southern Sri Lanka [36]. Furthermore, an investigation of MPs in surface water conducted in the southern coastal region of Sri Lanka revealed that the majority of MPs were particles smaller than 1 mm in size. The total mean MP abundance was found to be 17.5 ± 3.4 items/m3 [52]. In a recent study, the mean MP abundance levels in surface water and surface sediments were reported to be 11.9 ± 2.0 items/m3 and 42.2 ± 5.9 items/kg, respectively, in the coral reef ecosystems in the eastern coastal region of Sri Lanka [54].
When comparing our sediment results with previous studies, similar research on MPs in surface seawater and sediment samples along the coastal stretch of Tamil Nadu, South India, carried out in the Bay of Bengal, noted that the abundance of MP particles was in the range of 60–820 items/m3 and 60–1620 items/kg, respectively [51]. A study conducted on MPs in beach sediments along the Tanzanian coastline in East Africa revealed the highest abundance of MPs (2972 ± 238 particles/kg dry sediment) [55]. Fibers and fragments were identified at all sampling sites, with polypropylene and polyethylene being the predominant polymers detected. Studies conducted in the surface waters of the Chukchi Sea, the Bering Sea, and the Northwest Pacific reported MP abundances ranging from 0.018 items/m3 to 0.31 items/m3, with an overall abundance of 0.13 ± 0.11 items/m3 [56]. In the mid-west Pacific Ocean, MP levels ranged from 6028 to 95,335 pieces/km2, with a mean level of 34,039 ± 25,101 pieces/km2 [25]. Similarly, the northwestern Pacific Ocean showed MP abundances ranging from 6.4 × 10² items km−2 to 4.2 × 10⁴ items km−2, with a mean abundance of 1.0 × 10⁴ items km−2 [57]. In the South China Sea and East Indian Ocean, MP contamination levels were reported at 4.2 ± 2.5 items/100 m3 and 0.4 ± 0.6 items/100 m3 [58], respectively, which were higher levels than those in the current study. Yet, our reported concentrations are higher than others reported in neighboring areas in the Indian Ocean. Compared to other regions worldwide, the MP abundance in water along the western coastal area of Sri Lanka is high (Table 1).
In the current study, PE was identified as the dominant polymer type, followed by PP and PS. PE is commonly found in water bottles, food containers, bags, pipes, flexible films, ropes, and fishing nets. PP is a flexible thermoplastic polymer that is utilized in a wide range of products, mainly in flexible packaging, disposable cups, piping, clothing, ropes, and carpets. Moreover, PS is a synthetic polymer found in protective packaging, food containers, bottles, insulators, Styrofoam, and, fishing-related applications. Similarly, PP, PE, and PS polymers are often used as packaging materials for items such as bags, bottles, beverage container caps, and drinking straws, often being discarded after a brief lifetime. Further, fishing ropes can be made from various polymers including natural fibers and synthetic fibers (such as nylon, PP, or polyester). The composition of fibers was reported as a synthetic polymer made of PP. Recently, in order to take strategies to mitigate the usage of PE and plastics, the Sri Lankan Ministry of Environment implemented a ban on disposable plastics and polythene items effective as of 31 March 2021. Furthermore, a prohibition on the production and distribution of polythene disposable lunch sheets was enacted on 1 August 2021.
Similar to the current study, it was previously found that the southern coastal beaches and waters of Sri Lanka demonstrate a predominance of MPs identified as PE and PP, alongside some PS foam [36]. In this study, PS was found as a major component in fishery applications and recreational sites. PE emerged as the prevalent polymer type, as confirmed by another study conducted in marine protected regions of southern Sri Lanka [35]. Another study conducted in the Eastern Indian Ocean during the monsoon transition period demonstrated a predominance of MPs, primarily composed of PP at 51.11% and PE at 20.07% [59].
The current study observed the colors of MPs extracted from sediment samples as blue, white, red, yellow, green, white, black, and transparent. Among these, the blue color dominated. In this coastal region, there was a notable accumulation of blue-colored MPs attributed to fisheries and tourism [52]. The presence of colored MP debris in seawater correlates with colored plastic materials (textiles and packaging items). Blue-colored MPs predominantly originate from fishing applications used in the western coastal region. Color classification of MPs was performed, with colored MPs accounting for 47% of the total, followed by white, transparent, and black in the surface waters off the coast of Colombo, Sri Lanka [60]. The outcomes of the current study are consistent with previous findings.
Fibers, films, pellets, and foams can be defined as plastic pollutants, with synthetic MPs originating from fishing-related operations such as restoring broken nets and discarding old nets [61]. Furthermore, monofilament ropes used in fishing activities can lead to pollution in the form of films. Moreover, it is highly possible that the fragments originated from activities both on land and in the ocean.
The fiber abundance was higher in densely populated areas due to fishing and recreational activities, for instance, leading to microfibers released from fishing nets. Synthetic fiber ropes, such as those made from polyester, nylon, or PP, can release fibers into the environment. However, the presence of PP fibers emphasizes the significance of exploring other inputs, such as construction materials, medical applications, thermal wear, and sanitary goods [62]. Fragments can originate from various sources and can enter coastal areas via household and industrial effluent. The predominant plastics identified in the surface seawaters of the investigated areas were PE and PP. Their high abundance is attributed to their extensive uses in the fishing industry and others. The blue PP fiber in seawater suggested a potential association with the fishing nets, creating pollution in the form of MPs. Copolymers, resulting from the combination of two or more types of monomers, were also found to be in sediments and seawater, suggesting a potential trend of a growing environmental prevalence of these compounds. This observation can be a sign of new practices being used in the production of different kinds of plastic items. In light of changing plastic consumption patterns, it is important to recognize and address the existence of these copolymers for responsible use and environmental protection [63]. Our findings showed that the detected MPs in coastal regions primarily originated from the raw materials used in the production of fishing nets, ropes, and trawls utilized in marine fisheries. Approximately 35% of MPs in the water originate from synthetic fabrics, which are the primary source of plastics in the ocean. Moreover, 60% of the fabric content of our clothing is made mostly from plastic, such as polyester, nylon, acrylic, and other synthetic fibers.
Monsoonal conditions and anthropogenic sources affect the distribution of MPs both indirectly and directly. The area up to the mouth of the Kelani River is heavily populated with a dense network of roads and buildings that play a major role in MP debris accumulation in these coastal regions. As was previously mentioned, climatic factors influence the spatial distribution of MPs. The level of abundance of MPs is notably elevated in December, with October also exhibiting relatively high levels, attributed to climatic factors. Southwestern parts of Sri Lanka experience the best weather conditions from October to December. The period between mid-October and December generally offers the most favorable, pleasant weather conditions. Moreover, December is considered the peak season, attracting visitors to the western coastal region of Sri Lanka. Therefore, during December, a significant rise in tourism and other fishery activities leads to a rising accumulation of plastic debris in these areas.
Similar to the current study, previously, MPs exhibited a notably higher concentration (±SE) of total plastics (0.30–100 mm) in surface seawaters collected at Wellawatta (229.40 ± 46.39 items/m3), along the western coastline near Colombo, including the regions of Uswetakeiyawa, Kerawalapitiya, Dikowita, Modera, Kollupitiya, Bambalapitiya, and Wellawatta, during the months of August, October, and November 2017 [61]. Furthermore, a recent study on the abundance of pelagic MPs in surface water of the Eastern Indian Ocean during the monsoon transition period conducted in 2020 revealed that the MP density ranged from 0.01 items/m2 to 4.53 items/m2, with a mean concentration of 0.34 ± 0.80 item/m2 [59]. These studies outlined MPs as a major threat to plastic pollution along the west coastal belt. Accordingly, it is worth implementing reduction strategies to address this problem in the coastal belt of western Sri Lanka.
The existence of several types of MPs indicated that the beach and surface seawater were contaminated with waste comprising diverse plastics, disposed of following anthropogenic activities, mainly fishing and human recreational activities. In daily human activities, the majority of the detected MPs were found to be utilized as fishing nets and packaging materials such as food containers. Thus, the MPs extracted from the sediment and surface seawater samples likely represent secondary MPs originating from sources of anthropogenic plastic. Resulting in a range of adverse social and economic effects, plastic pollution poses a significant global threat to marine and coastal ecosystems. The impact includes higher costs for maintaining and replacing damaged fishing equipment and boats, costs associated with environmental cleanup efforts, a reduction in the scenic value of the coast that affects tourism, and a decrease in the fish harvest. In addition to being crucial for the environment, addressing plastic pollution is essential to maintain maritime communities’ economic well-being and protect aquatic ecosystems [64].
One important sustainable technique for reaching the zero waste target is promoting sustainable goods and containers with customer responsibility. Understanding the quantity of plastic entering the world’s oceans, seas, and coastal zones follows on from scientific investigation. A world free of plastic can be achieved by implementing effective site-specific management strategies, which are made possible by extensive research on plastic manufacture, waste disposal, and the effects of plastic contamination. We propose that plastic accumulation along Sri Lanka’s western coastline can be effectively mitigated by employing site-specific control techniques, thereby creating cleaner, zero-plastic ecosystems. The findings of this research could be used as baseline or reference information for upcoming investigations and the development of coastal and marine plastic reduction programs. Significant amounts of plastic were detected across various marine environments in Sri Lanka, highlighting the urgent problem of severe MP contamination along the country’s coastline and beaches. A prompt response and careful investigation are required in this case. The May 2021 X-Press Pearl incident is regarded as the worst maritime accident in Sri Lankan history, and following on from that, the current work unveils valuable information about the distribution and composition of MPs within a key coastal area, providing insights into the severity of plastic pollution. The results highlight the critical need for efficient strategies to mitigate and control plastic pollution to protect the marine ecosystems and coastal areas of Sri Lanka. This research provides essential data that should offer support when stakeholders are making decisions and taking actions targeted at addressing the challenges posed by MP contamination in the region.

5. Conclusions

This research aimed to measure the prevalence of MPs in beach sediment and seawater samples collected along the western coast of Sri Lanka from the estuary of the Kelani River to the estuary of Mahaoya, covering nine sites along a stretch of 42 km during October 2021 and December 2021. The visual sorting of suspected MPs identified the different shapes as fragments, pellets, fibers, foams, and films. Most MPs were identified as synthetic polymers of PE, PP, PS, and PET and some less common types of copolymers of SEBS (styrene ethylene butylene styrene block copolymer), and SAN (styrene acrylonitrile). Non-plastic materials were also found in the samples, such as cellulose (cotton), sulfur, PA (polyamide), and Ambicat LE 4472, a crosslinking catalyst. The FTIR analysis revealed that the beach sediments were mainly contaminated with PE (65.3%) and PP (15.3%) while surface seawater contamination was dominated by PE (60.9%) and PP (4. 3%). The May 2021 X-Press Pearl incident may have been the cause of an unusual abundance of pellets found in the coastal areas. Sarakkuwa beach showed this unusual abundance, which was found to be a victim beach area after the spill.
Wet peroxide oxidation (WPO), which was applied in this study, is an efficient method according to the NOAA guidelines [43]; however, some samples were found to be deteriorated by H2O2. Therefore, an alternative digestion method was introduced by using KOH and methanol, though it was not as efficient as WPO. As there was no other efficient method available for digestion, it is recommended that the WPO method be followed in future studies. Overall, the highest MP abundance occurred at site I (in the estuary of Mahaoya), while the lowest MP abundance levels were detected at sites F and G (in Dungalpitiya and Morawala beach). The MPs at all the remaining sampling sites (A, B, C, D, E, and H) showed notable abundance.
As was previously discussed, the spatial distribution of plastic waste is caused by anthropogenic sources and climatic factors, mainly monsoonal actions. Therefore, it is crucial to have a systematic, long-term monitoring methodology of plastic pollution, which will reveal changes in the distribution patterns of plastic litter. In addition to environmental and climatic factors, anthropogenic sources are the primary cause of the accumulation of plastic debris along the western coastal area of Sri Lanka. To safeguard this ecosystem, certain regulatory measures have been implemented. The findings of this study provide evidence that beach sediments and the surface seawater serve as appropriate platforms for the surveillance of microliters including MPs. This will make it possible to conduct assessments in the future for both regional and national remediation measures, enabling regional mitigation strategies to be established. To assess the ecological impacts of MPs on ecosystems and explore the effects of MPs on marine life, understanding the fundamental mechanisms and processes, such as how monsoon currents influence the MP distribution, is essential as it provides valuable data that are necessary for developing appropriate interventions.

Author Contributions

Conceptualization, D.S.M.D.S., R.C.L.D.S. and A.A.D.A.; methodology, P.G.Y.W.W., A.B. and A.R.M.; formal analysis, P.G.Y.W.W., A.B. and A.R.M.; investigation, P.G.Y.W.W.; resources, D.S.M.D.S., A.A.D.A., A.B., D.B.S. and C.R.; data curation, P.G.Y.W.W. and A.B.; writing—original draft preparation, P.G.Y.W.W.; writing—review and editing, D.S.M.D.S., R.C.L.D.S., A.A.D.A., A.B., A.R.M., D.B.S. and C.R.; visualization, P.G.Y.W.W.; supervision, D.S.M.D.S., R.C.L.D.S. and A.A.D.A.; project administration, D.S.M.D.S., R.C.L.D.S., A.A.D.A., D.B.S. and C.R.; funding acquisition, D.S.M.D.S. All authors have read and agreed to the published version of the manuscript.

Funding

This research was funded by a University of Kelaniya research grant (Grant No. RP/03/02/06/02/2021) and Centre for Environment, Fisheries and Aquaculture Science (Cefas), under the Ocean Country Partnership Programme (OCPP) of the Blue Planet Fund, UK.

Data Availability Statement

The data supporting this study’s findings are available from the corresponding author upon reasonable request.

Acknowledgments

We acknowledge the National Aquatic Resources Research and Development Agency (NARA), Sri Lanka for providing laboratory facilities.

Conflicts of Interest

The authors declare no conflicts of interest.

References

  1. Dekiff, J.H.; Remy, D.; Klasmeier, J.; Fries, E. Occurrence and spatial distribution of microplastics in sediments from Norderney. Environ. Pollut. 2014, 186, 248–256. [Google Scholar] [CrossRef]
  2. IUCN. IUCN Website IUCN Issues Briefs. Available online: www.iucn.org/issues-briefs (accessed on 16 January 2024).
  3. Yang, L.; Zhang, Y.; Kang, S.; Wang, Z.; Wu, C. Microplastics in soil: A review on methods, occurrence, sources, and potential risk. Sci. Total Environ. 2021, 780, 146546. [Google Scholar] [CrossRef] [PubMed]
  4. Mariano, S.; Tacconi, S.; Fidaleo, M.; Rossi, M.; Dini, L. Micro and Nanoplastics Identification: Classic Methods and Innovative Detection Techniques. Front. Toxicol. 2021, 3, 636640. [Google Scholar] [CrossRef] [PubMed]
  5. Andrady, A.L. Microplastics in the marine environment. Mar. Pollut. Bull. 2011, 62, 1596–1605. [Google Scholar] [CrossRef] [PubMed]
  6. Barnes, D.K.A.; Galgani, F.; Thompson, R.C.; Barlaz, M. Accumulation and fragmentation of plastic debris in global environments. Philos. Trans. R. Soc. Lond. B Biol. Sci. 2009, 364, 1985–1998. [Google Scholar] [CrossRef] [PubMed]
  7. Claessens, M.; Van Cauwenberghe, L.; Vandegehuchte, M.B.; Janssen, C.R. New techniques for the detection of microplastics in sediments and field collected organisms. Mar. Pollut. Bull. 2013, 70, 227–233. [Google Scholar] [CrossRef]
  8. Campanale, C.; Massarelli, C.; Bagnuolo, G.; Savino, I.; Uricchio, V.F. The Problem of Microplastics and Regulatory Strategies in Italy. In Handbook of Environmental Chemistry; Springer: Berlin/Heidelberg, Germany, 2022; pp. 255–276. [Google Scholar] [CrossRef]
  9. Ziani, K.; Ioniță-Mîndrican, C.-B.; Mititelu, M.; Neacșu, S.M.; Negrei, C.; Moroșan, E.; Drăgănescu, D.; Preda, O.-T. Microplastics: A Real Global Threat for Environment and Food Safety: A State of the Art Review. Nutrients 2023, 15, 617. [Google Scholar] [CrossRef]
  10. Park, H.; Park, B. Review of Microplastic Distribution, Toxicity, Analysis Methods, and Removal Technologies. Water 2021, 13, 2736. [Google Scholar] [CrossRef]
  11. Crawford, C.B.; Quinn, B. Microplastic Identification Techniques. In Microplastic pollutants; Elsevier: Amsterdam, The Netherlands, 2017; pp. 219–267. [Google Scholar] [CrossRef]
  12. Ateia, M.; Ersan, G.; Alalm, M.G.; Boffito, D.C.; Karanfil, T. Emerging investigator series: Microplastic sources, fate, toxicity, detection, and interactions with micropollutants in aquatic ecosystems—A review of reviews. Environ. Sci. Process. Impacts 2022, 24, 172–195. [Google Scholar] [CrossRef]
  13. Ali, N.; Liu, W.; Zeb, A.; Shi, R.; Lian, Y.; Wang, Q.; Wang, J.; Li, J.; Zheng, Z.; Liu, J.; et al. Environmental fate, aging, toxicity and potential remediation strategies of microplastics in soil environment: Current progress and future perspectives. Sci. Total Environ. 2024, 906, 167785. [Google Scholar] [CrossRef]
  14. Cutroneo, L.; Reboa, A.; Besio, G.; Borgogno, F.; Canesi, L.; Canuto, S.; Dara, M.; Enrile, F.; Forioso, I.; Greco, G.; et al. Correction to: Microplastics in seawater: Sampling strategies, laboratory methodologies, and identification techniques applied to port environment. Environ. Sci. Pollut. Res. 2020, 27, 8938–8952. [Google Scholar] [CrossRef] [PubMed]
  15. Babaremu, K.; Okoya, S.; Hughes, E.; Tijani, B.; Teidi, D.; Akpan, A.; Igwe, J.; Karera, S.; Oyinlola, M.; Akinlabi, E. Sustainable plastic waste management in a circular economy. Heliyon 2022, 8, e09984. [Google Scholar] [CrossRef] [PubMed]
  16. Watt, E.; Picard, M.; Maldonado, B.; Abdelwahab, M.A.; Mielewski, D.F.; Drzal, L.T.; Misra, M.; Mohanty, A.K. Ocean plastics: Environmental implications and potential routes for mitigation—A perspective. RSC Adv. 2021, 11, 21447–21462. [Google Scholar] [CrossRef] [PubMed]
  17. Anik, A.H.; Hossain, S.; Alam, M.; Sultan, M.B.; Hasnine, T.; Rahman, M. Microplastics pollution: A comprehensive review on the sources, fates, effects, and potential remediation. Environ. Nanotechnol. Monit. Manag. 2021, 16, 100530. [Google Scholar] [CrossRef]
  18. Parsai, T.; Figueiredo, N.; Dalvi, V.; Martins, M.; Malik, A.; Kumar, A. Implication of microplastic toxicity on functioning of microalgae in aquatic system. Environ. Pollut. 2022, 308, 119626. [Google Scholar] [CrossRef] [PubMed]
  19. Ghosh, S.; Sinha, J.K.; Ghosh, S.; Vashisth, K.; Han, S.; Bhaskar, R. Microplastics as an Emerging Threat to the Global Environment and Human Health. Sustainability 2023, 15, 10821. [Google Scholar] [CrossRef]
  20. Caruso, G.; Bergami, E.; Singh, N.; Corsi, I. Plastic occurrence, sources, and impacts in Antarctic environment and biota. Water Biol. Secur. 2022, 1, 100034. [Google Scholar] [CrossRef]
  21. Cózar, A.; Echevarría, F.; González-Gordillo, J.I.; Irigoien, X.; Úbeda, B.; Hernández-León, S.; Palma, Á.T.; Navarro, S.; García-De-Lomas, J.; Ruiz, A.; et al. Plastic debris in the open ocean. Proc. Natl. Acad. Sci. USA 2014, 111, 10239–10244. [Google Scholar] [CrossRef] [PubMed]
  22. Saley, A.; Smart, A.; Bezerra, M.; Burnham, T.; Capece, L.; Lima, L.; Carsh, A.; Williams, S.; Morgan, S. Microplastic accumulation and biomagnification in a coastal marine reserve situated in a sparsely populated area. Mar. Pollut. Bull. 2019, 146, 54–59. [Google Scholar] [CrossRef]
  23. Isobe, A.; Uchiyama-Matsumoto, K.; Uchida, K.; Tokai, T. Microplastics in the Southern Ocean. Mar. Pollut. Bull. 2017, 114, 623–626. [Google Scholar] [CrossRef]
  24. Yu, H.; Zhang, Y.; Tan, W.; Zhang, Z. Microplastics as an Emerging Environmental Pollutant in Agricultural Soils: Effects on Ecosystems and Human Health. Front. Environ. Sci. 2022, 10, 855292. [Google Scholar] [CrossRef]
  25. Wang, S.; Chen, H.; Zhou, X.; Tian, Y.; Lin, C.; Wang, W.; Zhou, K.; Zhang, Y.; Lin, H. Microplastic abundance, distribution and composition in the mid-west Pacific Ocean. Environ. Pollut. 2020, 264, 114125. [Google Scholar] [CrossRef] [PubMed]
  26. Eriksen, M.; Lebreton, L.C.M.; Carson, H.S.; Thiel, M.; Moore, C.J.; Borerro, J.C.; Galgani, F.; Ryan, P.G.; Reisser, J. Plastic Pollution in the World’s Oceans: More than 5 Trillion Plastic Pieces Weighing over 250,000 Tons Afloat at Sea. PLoS ONE 2014, 9, e111913. [Google Scholar] [CrossRef] [PubMed]
  27. Adamopoulou, A.; Zeri, C.; Garaventa, F.; Gambardella, C.; Ioakeimidis, C.; Pitta, E. Distribution Patterns of Floating Microplastics in Open and Coastal Waters of the Eastern Mediterranean Sea (Ionian, Aegean, and Levantine Seas). Front. Mar. Sci. 2021, 8, 699000. [Google Scholar] [CrossRef]
  28. de Almeida, M.P.; Gaylarde, C.; Pompermayer, F.C.; Lima, L.d.S.; Delgado, J.d.F.; Scott, D.; Neves, C.V.; Vieira, K.S.; Neto, J.A.B.; Fonseca, E.M. The Complex Dynamics of Microplastic Migration through Different Aquatic Environments: Subsidies for a Better Understanding of Its Environmental Dispersion. Microplastics 2023, 2, 62–77. [Google Scholar] [CrossRef]
  29. Wang, Y.; Fu, Z.; Guan, D.; Zhao, J.; Zhang, Q.; Liu, Q.; Xie, J.; Sun, Y.; Guo, L. Occurrence Characteristics and Ecotoxic Effects of Microplastics in Environmental Media: A Mini Review. Appl. Biochem. Biotechnol. 2023, 1–24. [Google Scholar] [CrossRef]
  30. Prata, J.C.; da Costa, J.P.; Duarte, A.C.; Rocha-Santos, T. Methods for sampling and detection of microplastics in water and sediment: A critical review. TrAC Trends Anal. Chem. 2019, 110, 150–159. [Google Scholar] [CrossRef]
  31. Lise, I.; Bråte; Allan, I.J.; Thomas, K.V. Report made for the Norwegian Environment Agency: Microplastics in Marine Environments; Occurrence, Distribution and Effects. Available online: https://www.researchgate.net/publication/273089847 (accessed on 15 January 2023).
  32. Long, M.; Moriceau, B.; Gallinari, M.; Lambert, C.; Huvet, A.; Raffray, J.; Soudant, P. Interactions between microplastics and phytoplankton aggregates: Impact on their respective fates. Mar. Chem. 2015, 175, 39–46. [Google Scholar] [CrossRef]
  33. Prata, J.C.; da Costa, J.P.; Lopes, I.; Duarte, A.C.; Rocha-Santos, T. Environmental exposure to microplastics: An overview on possible human health effects. Sci. Total Environ. 2020, 702, 134455. [Google Scholar] [CrossRef]
  34. Erni-Cassola, G.; Zadjelovic, V.; Gibson, M.I.; Christie-Oleza, J.A. Distribution of plastic polymer types in the marine environment; A meta-analysis. J. Hazard. Mater. 2019, 369, 691–698. [Google Scholar] [CrossRef]
  35. Dharmadasa, W.S.; Andrady, A.; Kumara, P.T.P.; Maes, T.; Gangabadage, C. Microplastic pollution in Marine Protected Areas of Southern Sri Lanka. Mar. Pollut. Bull. 2021, 168, 112462. [Google Scholar] [CrossRef] [PubMed]
  36. Koongolla, J.B.; Andrady, A.; Kumara, P.T.P.; Gangabadage, C. Evidence of microplastics pollution in coastal beaches and waters in southern Sri Lanka. Mar. Pollut. Bull. 2018, 137, 277–284. [Google Scholar] [CrossRef]
  37. Jang, Y.C.; Ranatunga, R.; Mok, J.Y.; Kim, K.S.; Hong, S.Y.; Choi, Y.R.; Gunasekara, A. Composition and abundance of marine debris stranded on the beaches of Sri Lanka: Results from the first island-wide survey. Mar. Pollut. Bull. 2018, 128, 126–131. [Google Scholar] [CrossRef] [PubMed]
  38. Weerakoon, W.R.W.M.A.P.; Grøsvik, B.E.; Dalpadado, P.; Wimalasiri, H.B.U.G.M.; Rathnasuriya, M.I.G.; Harischandra, K.A.D.A.T.; Shirantha, R.R.A.R.; Madhushankha, H.M.T.C.; Sampath, W.A.D.; Jayasinghe, R.P.P.K.; et al. Enumeration of microplastics in Sri Lankan waters: Preliminary findings from the R/V Dr. Fridtjof Nansen ecosystem survey, 2018. In Scientific Sessions 2019; National Aquatic Resources Research and Development Agency (NARA): Colombo, Sri Lanka, 2019. [Google Scholar]
  39. Sewwandi, M.; Hettithanthri, O.; Egodage, S.; Amarathunga, A.; Vithanage, M. Unprecedented marine microplastic contamination from the X-Press Pearl container vessel disaster. Sci. Total Environ. 2022, 828, 154374. [Google Scholar] [CrossRef]
  40. Sewwandi, M.; Amarathunga, A.; Wijesekara, H.; Mahatantila, K.; Vithanage, M. Contamination and distribution of buried microplastics in Sarakkuwa beach ensuing the MV X-Press Pearl maritime disaster in Sri Lankan sea. Mar. Pollut. Bull. 2022, 184, 114074. [Google Scholar] [CrossRef] [PubMed]
  41. de Vos, A.; Aluwihare, L.; Youngs, S.; DiBenedetto, M.H.; Ward, C.P.; Michel, A.P.M.; Colson, B.C.; Mazzotta, M.G.; Walsh, A.N.; Nelson, R.K.; et al. The M/V X-Press Pearl Nurdle Spill: Contamination of Burnt Plastic and Unburnt Nurdles along Sri Lanka’s Beaches. ACS Environ. Au 2022, 2, 128–135. [Google Scholar] [CrossRef] [PubMed]
  42. Partow, H. X-Press Pearl Maritime Disaster Sri Lanka Report of the UN Environmental Advisory Mission; UN: New York, NY, USA, 2021. [Google Scholar]
  43. Laboratory Methods for the Analysis of Microplastics in the Marine Environment: Recommendations for Quantifying Synthetic Particles in Waters and Sediments; NOAA Marine Debris Division: Silver Spring, MD, USA, 2015.
  44. Renner, G.; Nellessen, A.; Schwiers, A.; Wenzel, M.; Schmidt, T.C.; Schram, J. Data preprocessing & evaluation used in the microplastics identification process: A critical review & practical guide. TrAC Trends Anal. Chem. 2019, 111, 229–238. [Google Scholar] [CrossRef]
  45. Bakir, A.; Doran, D.; Silburn, B.; Russell, J.; Archer-Rand, S.; Barry, J.; Maes, T.; Limpenny, C.; Mason, C.; Barber, J.; et al. A spatial and temporal assessment of microplastics in seafloor sediments: A case study for the UK. Front. Mar. Sci. 2023, 9, 1093815. [Google Scholar] [CrossRef]
  46. Fernandino, G.; Elliff, C.I.; Silva, I.R.; Bittencourt, A.C. How many pellets are too many? The pellet pollution index as a tool to assess beach pollution by plastic resin pellets in Salvador, Bahia, Brazil. J. Integr. Coast. Zone Manag. 2015, 15, 325–332. [Google Scholar] [CrossRef]
  47. Bolduc, S.; Jung, K.; Venkata, P.; Ashokcline, M.; Jayasinghe, R.; Baillie, C.; Lessard, L. Banana fiber/low-density polyethylene recycled composites for third world eco-friendly construction applications—Waste for life project Sri Lanka. J. Reinf. Plast. Compos. 2018, 37, 1322–1331. [Google Scholar] [CrossRef]
  48. Jordi Labs LLC. Case Study FTIR for Identification of Contamination; Final Report; Jordi Labs LLC: Mansfield, MA, USA, 2014. [Google Scholar]
  49. Naranjo, A.; Osswald, T.; Roldán-Alzate, A.; Diego, J.; María, S.; Noriega, D.P. Plastics Testing and Characterization; Carl Hanser Verlag: Munich, Germany, 2008. [Google Scholar]
  50. Atas, D.D.; Makkonen-CraigSampling, S. Microplastics in Beach Sediments and Analysis Using FTIR Spectroscopy Title: Sampling Microplastics in Beach Sediments and Analysis Using FTIR Spectroscopy. Mater’s Thesis, Arcada University of Applied Sciences, Helsinki, Finland, 2019. [Google Scholar]
  51. Sunitha, T.; Monisha, V.; Sivanesan, S.; Vasanthy, M.; Prabhakaran, M.; Omine, K.; Sivasankar, V.; Darchen, A. Micro-plastic pollution along the Bay of Bengal coastal stretch of Tamil Nadu, South India. Sci. Total Environ. 2021, 756, 144073. [Google Scholar] [CrossRef] [PubMed]
  52. Athapaththu, A.; Thushari, G.; Dias, P.; Abeygunawardena, A.; Egodauyana, K.; Liyanage, N.; Pitawala, H.; Senevirathna, J. Plastics in surface water of southern coastal belt of Sri Lanka (Northern Indian Ocean): Distribution and characterization by FTIR. Mar. Pollut. Bull. 2020, 161, 111750. [Google Scholar] [CrossRef]
  53. Goswami, P.; Vinithkumar, N.V.; Dharani, G. Microplastics particles in seafloor sediments along the Arabian Sea and the Andaman Sea continental shelves: First insight on the occurrence, identification, and characterization. Mar. Pollut. Bull. 2021, 167, 112311. [Google Scholar] [CrossRef] [PubMed]
  54. Hansani, K.; Thilakarathne, E.; Koongolla, J.B.; Gunathilaka, W.; Perera, B.; Weerasingha, W.; Egodauyana, K. Contamination of microplastics in tropical coral reef ecosystems of Sri Lanka. Mar. Pollut. Bull. 2023, 194, 115299. [Google Scholar] [CrossRef]
  55. Mayoma, B.S.; Sørensen, C.; Shashoua, Y.; Khan, F.R. Microplastics in beach sediments and cockles (Anadara antiquata) along the Tanzanian coastline. Bull. Environ. Contam. Toxicol. 2020, 105, 513–521. [Google Scholar] [CrossRef]
  56. Mu, J.; Zhang, S.; Qu, L.; Jin, F.; Fang, C.; Ma, X.; Zhang, W.; Wang, J. Microplastics abundance and characteristics in surface waters from the Northwest Pacific, the Bering Sea, and the Chukchi Sea. Mar. Pollut. Bull. 2019, 143, 58–65. [Google Scholar] [CrossRef] [PubMed]
  57. Pan, Z.; Guo, H.; Chen, H.; Wang, S.; Sun, X.; Zou, Q.; Zhang, Y.; Lin, H.; Cai, S.; Huang, J. Microplastics in the Northwestern Pacific: Abundance, distribution, and characteristics. Sci. Total Environ. 2019, 650, 1913–1922. [Google Scholar] [CrossRef] [PubMed]
  58. Wang, X.; Li, C.; Liu, K.; Zhu, L.; Song, Z.; Li, D. Atmospheric microplastic over the South China Sea and East Indian Ocean: Abundance, distribution and source. J. Hazard. Mater. 2020, 389, 121846. [Google Scholar] [CrossRef] [PubMed]
  59. Li, C.; Wang, X.; Liu, K.; Zhu, L.; Wei, N.; Zong, C.; Li, D. Pelagic microplastics in surface water of the Eastern Indian Ocean during monsoon transition period: Abundance, distribution, and characteristics. Sci. Total Environ. 2021, 755, 142629. [Google Scholar] [CrossRef]
  60. Athawuda, A.M.G.A.D.; Jayasiri, H.B.; Thushari, G.G.N.; Guruge, K.P.G.K.P. Quantification and morphological characterization of plastic litter (0.30–100 mm) in surface waters of off Colombo, west coast of Sri Lanka. Environ. Monit. Assess. 2020, 192, 1–17. [Google Scholar] [CrossRef]
  61. Li, J.; Green, C.; Reynolds, A.; Shi, H.; Rotchell, J.M. Microplastics in mussels sampled from coastal waters and supermarkets in the United Kingdom. Environ. Pollut. 2018, 241, 35–44. [Google Scholar] [CrossRef] [PubMed]
  62. Taherdoost. Sampling Methods in Research Methodology; How to Choose a Sampling Technique for Research. 2016. Available online: https://ssrn.com/abstract=3205035 (accessed on 15 January 2023).
  63. Park, J.; Hong, S.; Shim, W.J.; Khim, J.S.; Park, J. Distribution, compositional characteristics, and historical pollution records of microplastics in tidal flats of South Korea. Mar. Pollut. Bull. 2023, 189, 114741. [Google Scholar] [CrossRef] [PubMed]
  64. Cocca, M.; Di Pace, E.; Errico, M.E.; Gentile, G.; Montarsolo, A.; Mossotti, R. Springer Water Proceedings of the International Conference on Microplastic Pollution in the Mediterranean Sea. Available online: http://www.springer.com/series/13419 (accessed on 20 February 2023).
Figure 1. Sampling sites from Colombo to Negombo beach area: (A) Hendala; (B) Wattala; (C) Uswetakeiyawa; (D) Sarakkuwa; (E) Bopitya; (F) Dungalpitiya; (G) Morawala beach; (H) Browns beach; (I) estuary of Mahaoya. Google, Inc. 3D view of the western coastal area, Sri Lanka. Generated by Data SIO, NOAA, U.S. Navy, NGA, GEBCO Landsat/Copernicus Maxar Technologies [generated 29 June 2024], using Google Earth [version 10.43.0.2].
Water 16 01932 g001
Figure 2. Microplastics recovered from sediments and water samples.
Water 16 01932 g002
Figure 3. Percentage variation in MP categories identified in the sediment and water samples.
Water 16 01932 g003
Figure 4. Chart showing the color variation in MPs identified in sediment and water samples.
Water 16 01932 g004
Figure 5. Chemical composition of MPs extracted from (a) sediment samples and (b) water samples.
Water 16 01932 g005
Figure 6. The abundance of MPs along the west coast of Sri Lanka in (a) sediment and (b) water, where the circle size illustrates MPs’ abundance at each site. Esri. 2024. ArcGIS Pro 3.3. Environmental Systems Research Institute, Redlands, CA. Basemap data copyright Esri.
Water 16 01932 g006
Figure 7. (a) Sampling point at Site I. (b) Sampling point at Site A.
Water 16 01932 g007
Figure 8. Sitewise proportions of MP categories identified in the sediment and water samples.
Water 16 01932 g008
Figure 9. (a) Differently colored pellets from beach sediments. (b) FTIR spectrum of differently colored pellets from Site C.
Water 16 01932 g009
Table 1. Comparative study on the presence of MPs in seawater and sediment samples from different regions.
Study AreaMatrixAbundance (Values Refer to the Same Units)Abundance (Original Values)Reference
western coastline of Sri Lanka; estuaries of the Kelani River to MahaoyaWater-2.0 ± 0.6 items/L to 161.0 ± 15.7 items/LPresent study
Sediment-3.0 ± 0.3 items/m2 to 656.0 ± 34.5 items/m2
22 beaches along the coastline of Sri LankaSediment-4.1 large (>25 mm) and 158 small (5–25 mm) MPs/m2[37]
southern coastal region of Sri LankaWater0.0175 ± 0.0034 items/L17.5 ± 3.4 items/m3[52]
coral reef ecosystems in the eastern coastal region of Sri LankaWater0.0119 ± 0.002 items/L11.9 ± 2.0 items/m3[54]
SedimentNA42.2 ± 5.9 items/kg
Bay of Bengal coastal stretch of Tamil Nadu, South IndiaWater0.06–0.82 items/L60–820 items/m3[51]
SedimentNA60–1620 items/kg
Tanzanian coastline in East AfricaSedimentNA2972 ± 238 particles/kg dry sediment[55]
Chukchi Sea, the Bering Sea, and the Northwest PacificWater1.3 × 10−4 ± 0.00011 items/L0.13 ± 0.11 items/m3[56]
Mid-west Pacific OceanSediment0.03 ± 0.03 items/m234,039 ± 25,101 pieces/km2[25]
Northwestern Pacific OceanSediment0.01 items/m21.0 × 104 items/km2[57]
South China SeaWater0.42 × 10−4 ± 0.000025 items/L4.2 ± 2.5 items/100 m3[58]
East Indian OceanWater4.0 × 10−6 ± 0.000006 items/L0.4 ± 0.6 items/100 m3
Disclaimer/Publisher’s Note: The statements, opinions and data contained in all publications are solely those of the individual author(s) and contributor(s) and not of MDPI and/or the editor(s). MDPI and/or the editor(s) disclaim responsibility for any injury to people or property resulting from any ideas, methods, instructions or products referred to in the content.

