Abstract
This study investigates the processes leading to karst development in the southeastern part of Riyadh city extending up to Al Kharj. Numerous solution features such as sinkholes, collapsed dolines, and solution caverns are common in the area. The role of water in the development of the karst features was investigated using an integrated geological and hydrochemical approach. Geological investigations included the petrographic analysis of rock samples collected from zones of intense karstification with special emphasis on mineral dissolution. The study showed that the Sulaiy Formation is commonly fractured, brecciated, foliated, and contains numerous cavities, vugs, and openings. These features have formed by mineral dissolution by circulating groundwater, which has removed anhydrite beds from the underlying Arab–Hith sequence. Karstification likely started from the tectonically weak zones when there was more groundwater recharge. Studies show that during the early to mid-Holocene period, the climate in the Arabian Peninsula was humid, promoting groundwater recharge and subsequent mineral dissolution, though the process of karstification must have started much earlier. Hydrochemical findings reveal that mineral dissolution (halite and calcium sulfate) is the main process affecting groundwater chemistry. The Piper plot revealed two main hydrochemical facies: the (Ca2+ + Mg2+)–(Cl+ SO42−) Type (Type A) and the (Na+ + K+)–(SO42− + Cl) Type (Type B). Most of the samples belong to Type B, typical of groundwater facies affected by dissolution of halite and anhydrite mineral. The absence of the (Ca2+ + Mg2+)–(CO32− + HCO3−) type of groundwater facies indicates a lack of recent groundwater recharge and the removal of carbonate minerals from the system through precipitation, as evidenced by the saturation indices. Plots of the major ionic pairs (cations vs. anions) in groundwater indicate strong halite and gypsum/anhydrite dissolution. Of the three carbonate minerals, calcite has the highest average saturation index followed by aragonite and dolomite. This suggests significant past rock–water interaction leading to carbonate dissolution. Presently, any additional calcium or carbonate ions introduced into the water lead to calcite precipitation. The study indicates that the process of karst development may not be active today. Currently, groundwater chemistry is mainly influenced by rock–water interaction leading to gypsum/anhydrite dissolution, which has resulted in a high concentration of Na+, Ca2+, Cl− and SO42− ions in groundwater. The dissolution of gypsum and halite from the Hith Formation weakens the structural integrity of the overlying Sulaiy Formation, creating large underground cavities. These cavities increase the risk of roof collapse, leading to cover-collapse sinkholes as the roof becomes too thin to support the weight above.
1. Introduction
Karstic terrains, which cover approximately 7 to 12% of the Earth’s surface, play a crucial role as a primary source of water supply for a quarter of the global population [1]. These terrains, characterized by unique features such as sinkholes, collapsed dolines, and solution caverns, are predominantly formed on carbonate rocks, although karstification can also occur in other lithologies like gypsum, anhydrite, and halite. Tropical regions, with their higher humidity and increased levels of CO2 in soils, often exhibit prevalent karst features [2].
Cooler climates increase the solubility of CO2 in water and the CO2 remains dissolved in percolating water for longer periods, which contributes to the formation of karst features [3]. Conversely, arid regions, exemplified by Saudi Arabia, present challenges to the karstification process. With sparse vegetation and thin soil cover, the ongoing karstification in such arid environments is remarkably slow [4]. In these regions, the absence of an ample soil cover and the presence of fissures and fractures in rocks facilitate rapid infiltration, reducing evapotranspiration rates. Consequently, the high infiltration rates result in insufficient CO2 near the surface to dissolve carbonate rocks, intensifying the karstification process in the subsurface [5].
The physico-chemical characteristics of groundwater in karstic systems are influenced by various factors, including lithology, hydrochemical processes, and the residence time of water [6]. In Central Saudi Arabia, the observed karst features are attributed to paleo-karstification, formed under humid climatic conditions in the geological past. Modern water chemistry, though reflective of current conditions, can reveal markers such as stable isotopes and trace elements that provide indirect evidence of past climatic and geological processes. Sinkholes, collapsed dolines, solution caverns, disrupted drainage, and open fractures are the prominent landforms [7]. Despite the high evapotranspiration rates in arid regions, the karstification process is more intense in the subsurface due to the high infiltration rates facilitated by the absence of soil cover and the presence of rock fissures and fractures [5].
Karstic features in central Saudi Arabia are notable for their distinctive morphology and potential as aquifers, as cited in Global Karst Datasets [8]. These features are believed to result from paleo-karstification under past humid climates, rather than the current arid conditions. Ref. [7] highlighted that karst phenomena in eastern Saudi Arabia include sinkholes, collapsed dolines, and solution caverns formed in formations like anhydrite and gypsum. The Upper Jurassic–Cretaceous Arab, Hith, Sulaiy, and Aruma Formations and the Cenozoic Ummer Radhuma, Rus, Dammam, and Dam Formations are the primary carbonate-bearing formations in the Arabian platform [9]. Ref. [10] detailed the Sulaiy Formation’s extensive fracturing and cavities due to anhydrite dissolution from the underlying Hith Formation, emphasizing its karst-like water circulation. Ref. [11] noted increased sinkhole activity causing significant damage, linked to both natural processes and human impacts such as groundwater over-exploitation. The rapid development in karst areas, especially in eastern regions like Ar Riyadh, has exacerbated subsidence risks. Studies also highlight the dissolution of Late Jurassic Hith anhydrite, leading to slumping and collapse of overlying formations, especially the lower Cretaceous Sulaiy Formation in eastern and south-eastern Riyadh [12].
This study focuses on understanding karst development in the southeastern part of Riyadh. Using a combined geological and hydrochemical approach, we analyze groundwater’s impact on karstification. The geological investigations involve petrographic analysis of rock samples from intensely karstified zones. The hydrochemical assessment included the establishment of ionic relationships between the main ionic constituents present in groundwater to understand the factors influencing modern groundwater chemistry.
2. Study Area
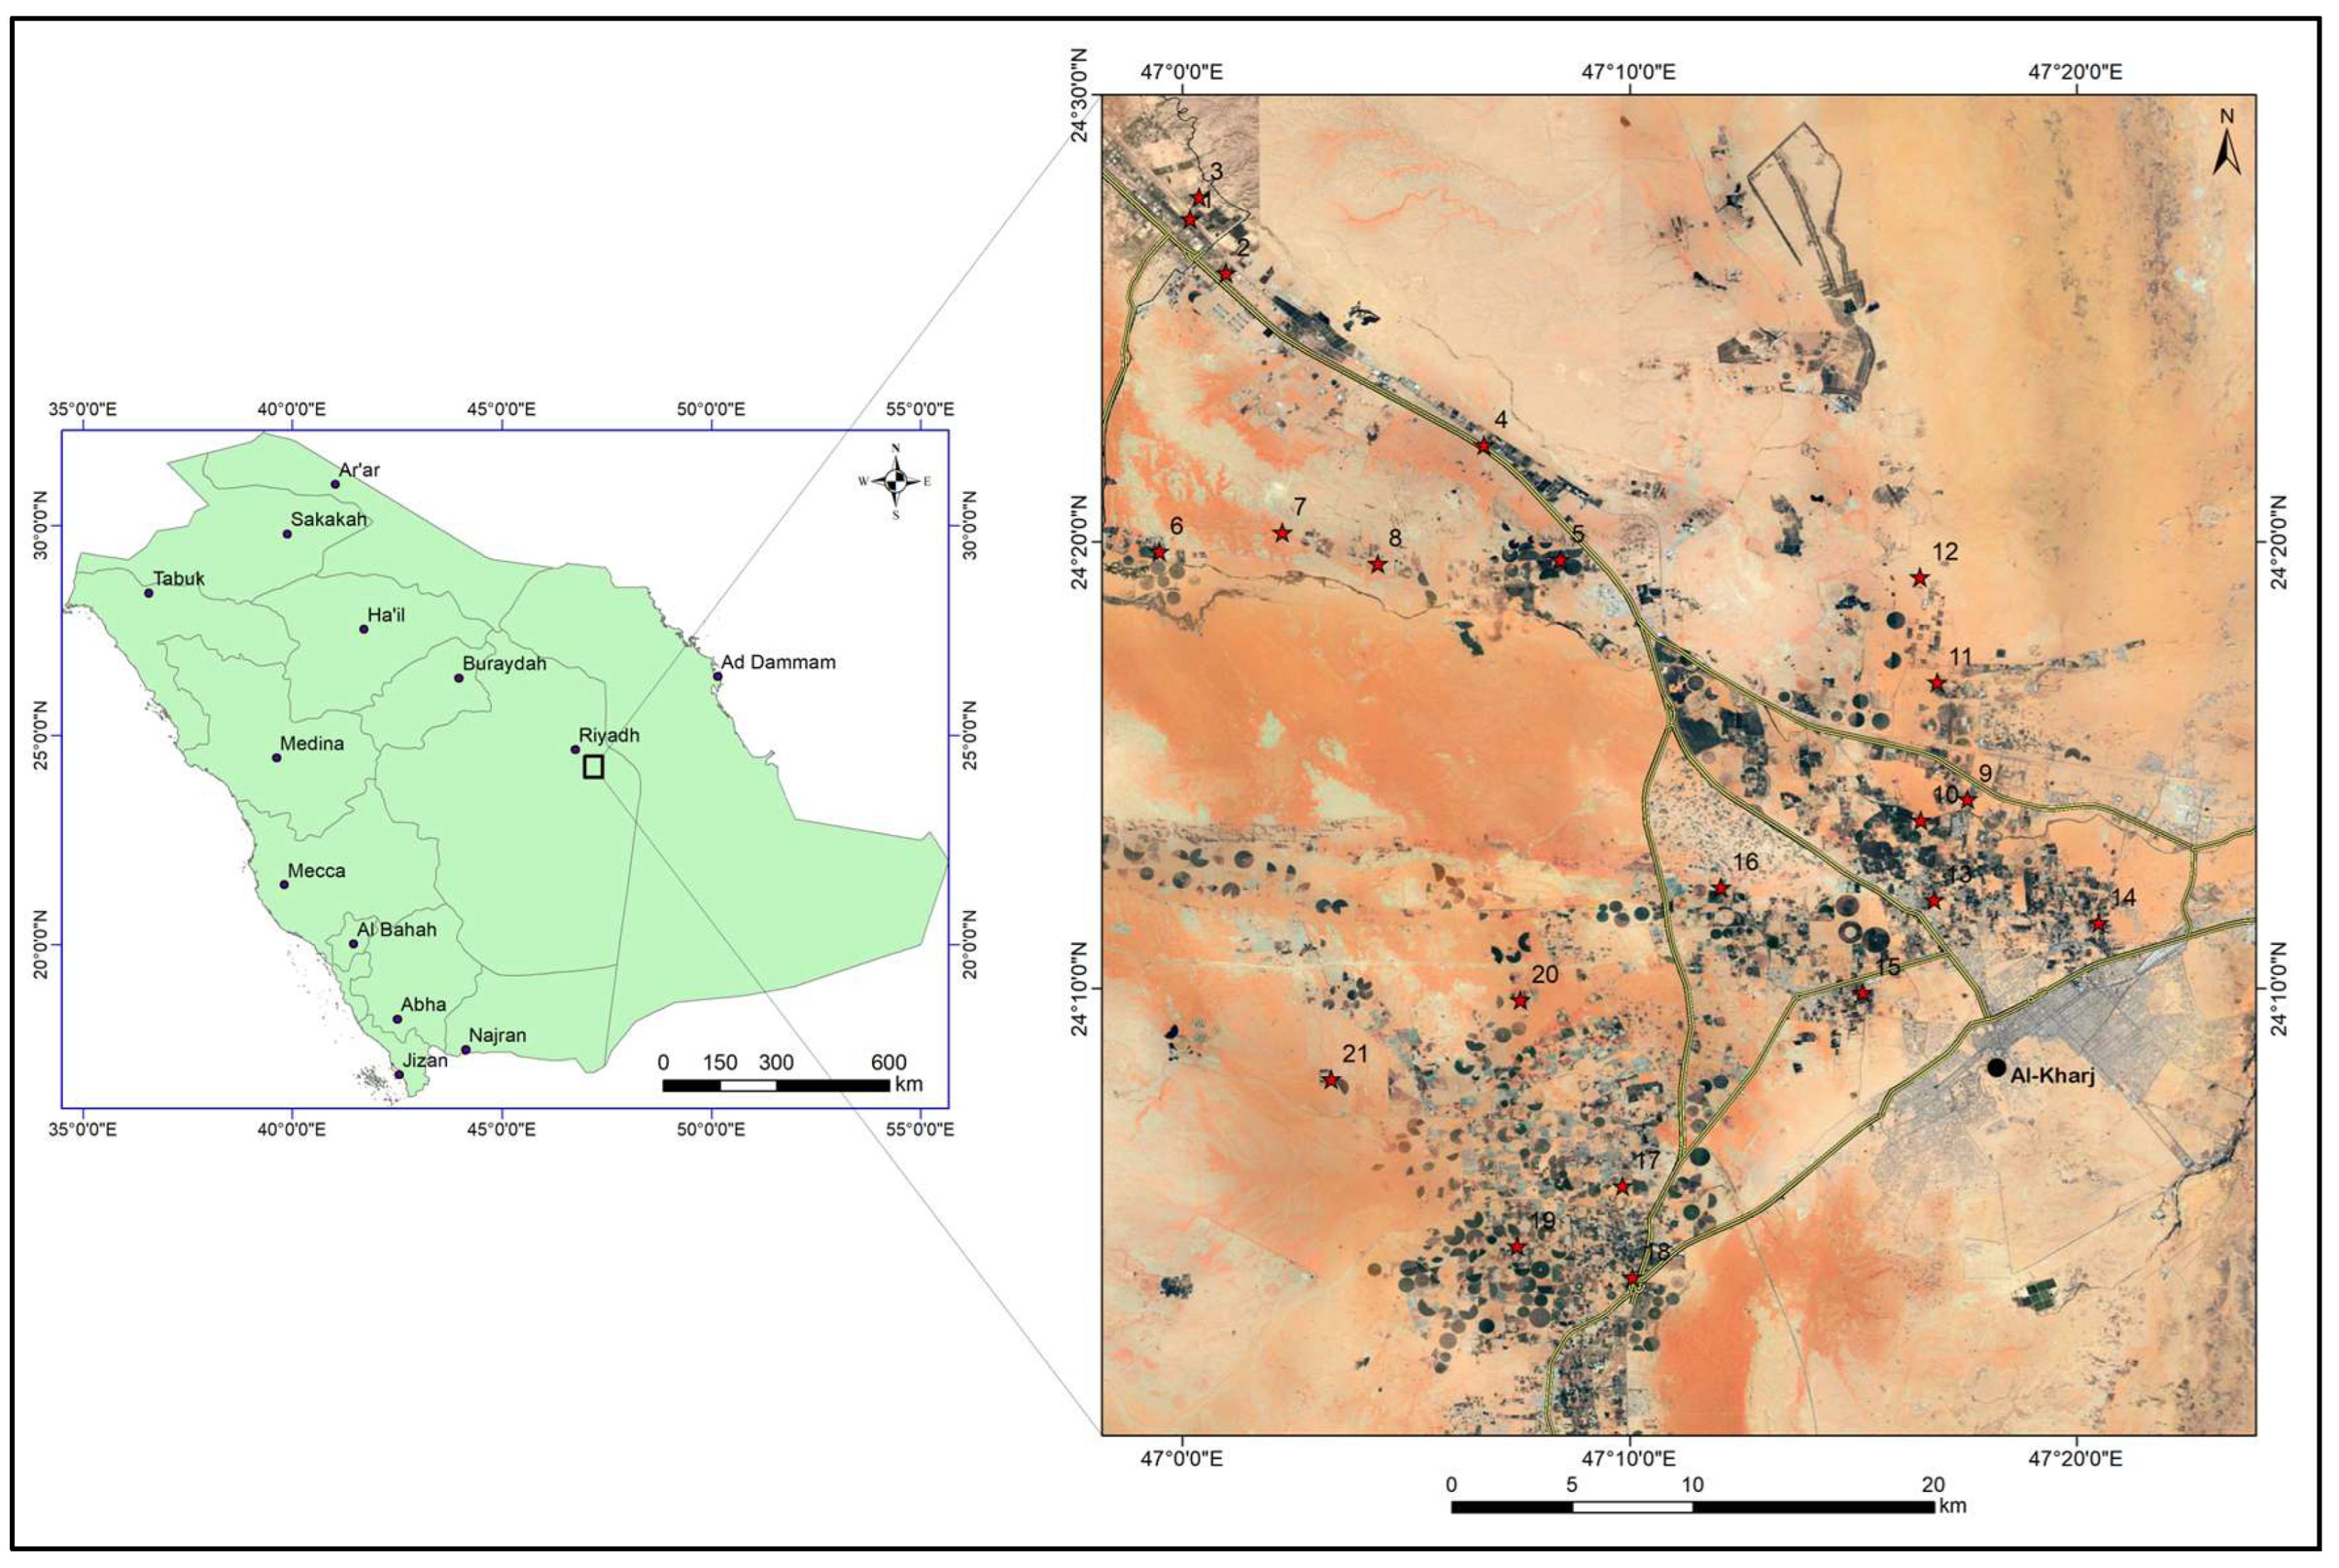
The study area lies to the south-east of Riyadh and includes the city of Al-Kharj. It is situated between latitudes 24°–24.5° N and longitudes 46.7° E–47.4° E (Figure 1). Figure 2 shows some images from the study area. The area has an arid climate with temperatures ranging between 48 °C in summer to about 3 °C in winter. The average annual rainfall in the region is less than 100 mm and the annual evaporation rates are as high as 2000 mm [13]. The elevation ranges between 650 m and 320 m above mean sea level. The northwestern part of the study area, east of the main highway corresponds to the Sulaiy escarpment (Figure 2). The Nisah graben can be seen in the southwestern part of the study area (Figure 3).
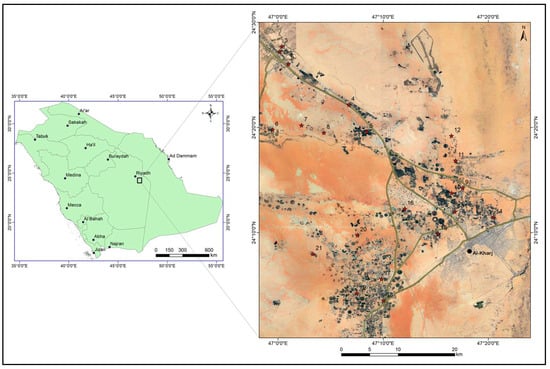
Figure 1.
Location map of the study area. Red stars represent the location of the groundwater samples.
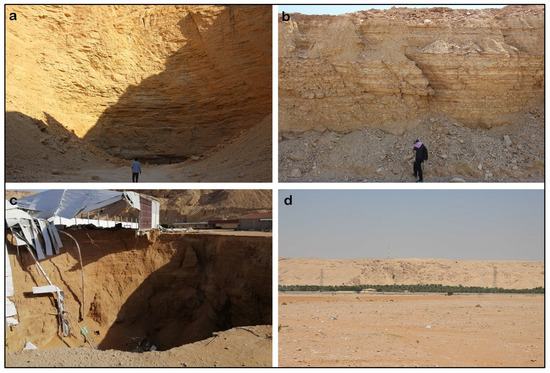
Figure 2.
Selected images from the study area (a) Section of Sulaiy Formation above Dahal Hith. (b) Limestones of Sulaiy Formation showing horizontal beds cut by fractures. (c) Cover-collapse sink hole. (d) Sulaiy escarpment with slumped beds due to dissolution of underlying Hith Formation.
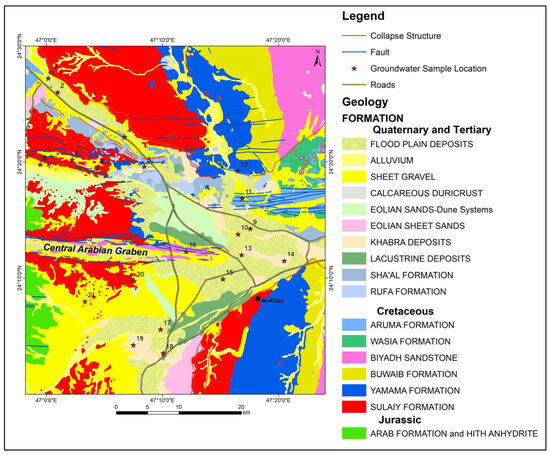
Figure 3.
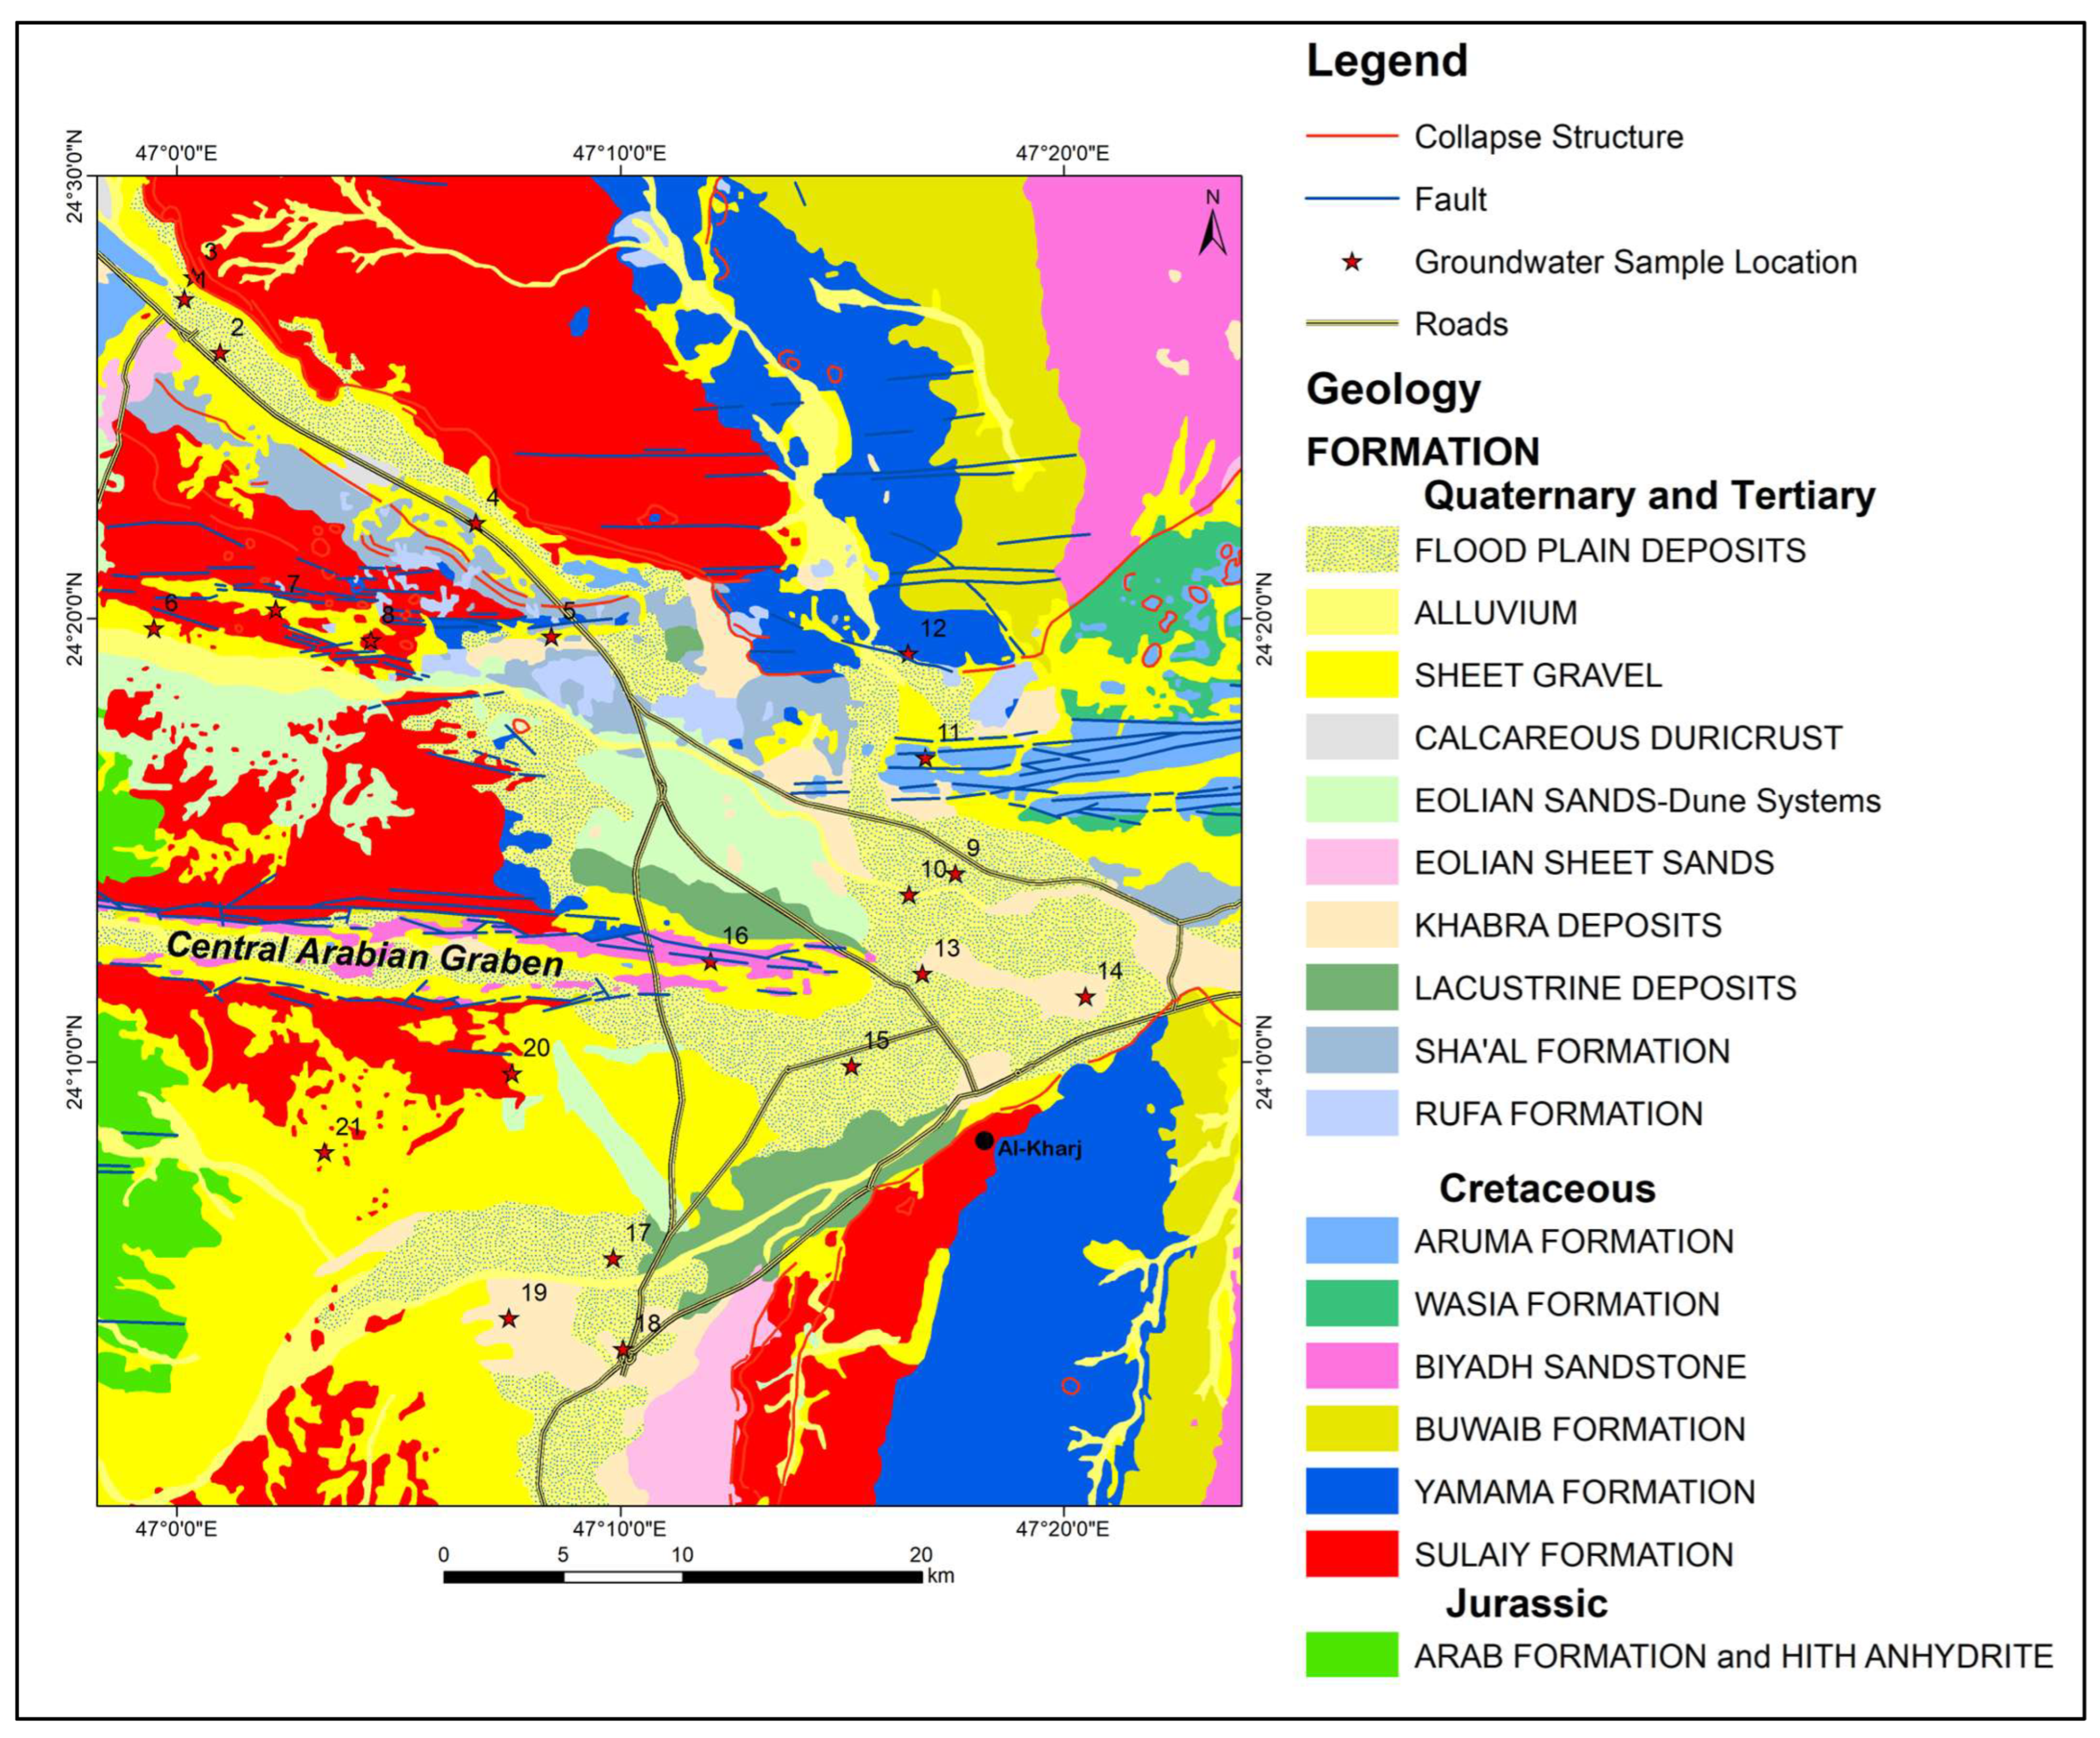
Geological map and location of groundwater samples.
Geology and Hydrogeology
The geological characteristics of the region are primarily shaped by Quaternary unconsolidated deposits and Late Jurassic Arab Formation (limestone). Wadis cut through massive limestone and sandstone formations that formed during the Late Jurassic to the Late Cretaceous period. These wadis are channels that typically lack water due to the arid climate. However, during previous pluvial periods, water flow was sufficient to incise them by several tens of meters. Today, most wadis are filled with recent sedimentary deposits, including aeolian and river deposits such as silt and clay.
Moving to the western edge of the research area, outcrops of the Late Jurassic Arab and Hith Formation (anhydrite) are observable. Ref. [14] identified anhydrite and limestone as the components of the Arab Formation, categorized into four formal members (Arab A to Arab D). The Hith Anhydrite, which lies above the Arab Formation, was initially considered part of the Arab-A member. It was later classified as a separate Formation by [15]. The Hith Formation’s type locality, Dahal Hith, located 35 km southeast of Riyadh, exhibits hypogene karstification resulting in a sinkhole nearly 60 m wide and 120 m deep [16]. This is perhaps the only locality in the middle east where the Hith Anhydrite Formation is exposed [17]. The lithological transition from Arab Formation to Hith Formation is evident at this outcrop, with conformable contact.
The study area is predominantly covered by the Cretaceous Yamama Formation (limestone) and underlying Sulaiy Formation (limestone), as shown in Figure 2. Along the natural escarpment forming the eastern edge of Riyadh city, the Sulaiy Formation, dating from the late Jurassic to the upper Cretaceous period, is exposed. While different views exist on the contact between the Hith and Sulaiy Formation, Ref. [15] considered it conformable. The Yamama Formation conformably overlies the Sulaiy Formation [18] and is characterized by a pure carbonate sequence similar to the underlying Sulaiy Formation. The lower Cretaceous Buwaib Formation (limestone with sandstone in upper parts) and Biyadh Formation (sandstone) also contribute to the geological sequence, with the latter forming an unconformable contact with the overlying Wasia Formation.
The Wasia and Biyadh Formations signify a significant change in Saudi Arabia’s carbonate rock sequence from the Lower Jurassic to the Eocene. The lower Cretaceous Biyadh sandstone Formation, characterized by light-colored, cross-bedded quartz sandstone, is in unconformable contact with the overlying Wasia Formation. The Biyadh and Wasia Formations together constitute one of Saudi Arabia’s main aquifers, extending as far east as the Arabian coastal region.
Quaternary alluvial deposits in the study area contain aeolian quartz, sand, and pebbles, interspersed with layers of sandstone and limestone boulders. These unconsolidated alluvial deposits form shallow aquifers recharged by infrequent rainfall. Structural features such as the Wadi Nisah graben and the Rufa graben run from west to east in the research area. The Sulaiy and Yamama outcrops exhibit collapse structures and karst features [19].
The Wasia–Biyadh aquifer system, a principal aquifer system of Saudi Arabia, covers only a small part of the study area in the East. Most wells tap water from the fractured Sulaiy Formation and unconsolidated alluvial deposits. The Jurassic Arab Formation also acts as a secondary aquifer in certain locations. Groundwater recharge is limited due to minimal rainfall, with most rainwater lost through evaporation. The removal of anhydrite beds from the Hith Formation has improved the permeability and storativity of the Sulaiy aquifer, making it a localized aquifer with the capacity to store water [20].
A generalized view of the aquifer system present in the study area has been presented in Table 1. The wells from which the groundwater samples have been collected in this study mostly tap the Arab Formation and the overlying Sulaiy formation with depths ranging between 100 to 150 m. The wells are located in agricultural farms and are mainly used for irrigation purposes. The piezometric head in the Arab/Suaiy aquifer within the study area varies between 550 and 300 m above sea level. The groundwater flow direction is generally from the southwest to the northeast. Recharge occurs through precipitation in the wadis and the outcrop area [20].

Table 1.
Hydrostratigraphy of the study area (modified from [15]).
3. Methodology
Thirteen rock samples from representative strata were collected from the study area. Thin sections from the collected rock samples were prepared in the rock cutting lab of the Geology and Geophysics Department of King Saud University. Each thin section was classified using the classification system described in [21].
Twenty-one groundwater samples were collected from the study area from private supply wells drilled in the bedrock. The groundwater samples were collected during March 2020. The samples were collected in 1.5 L plastic bottles. Prior to sample collection the bottles were rinsed properly. The groundwater samples were collected after 5 min of pumping. Each bottle (sample) was given a number and the sample location was recorded by a hand-held GPS. Figure 1 and Figure 3 show the location of the groundwater samples. Parameters such as Electrical Conductivity (EC), temperature, and pH were measured directly in the field by using a portable meter (Myron l ULTRAMETER). The samples were then transported to be analyzed at the King Saud University’s Central Lab Facility. Sodium (Na+), potassium (K+), magnesium (Mg2+), and calcium (Ca2+) ions were measured using an atomic absorption spectrophotometer (AAS). Bicarbonate (HCO3−) and chloride (Cl−) were analyzed using volumetric techniques. Sulfate (SO42−) was determined via the colorimetric method, and nitrate (NO3−) was assessed through ionic chromatography.
The classification of groundwater facies and the key processes influencing the overall groundwater chemistry in the region were examined using bivariate plots, such as Piper’s plot. Additionally, chloro-alkaline indices were calculated to understand base ion exchange reactions. For speciation analyses, the saturation indices of the main mineral phases were computed using the PHREEQC 2.8 speciation code. Graphs were prepared using Microsoft Excel 2019. Contour maps showing spatial distribution of TDS and NO3− were prepared using kriging technique in Surfer 14 and then were exported to Arc GIS 10.4 to prepare the final map.
4. Result and Discussion
4.1. Geological Investigation
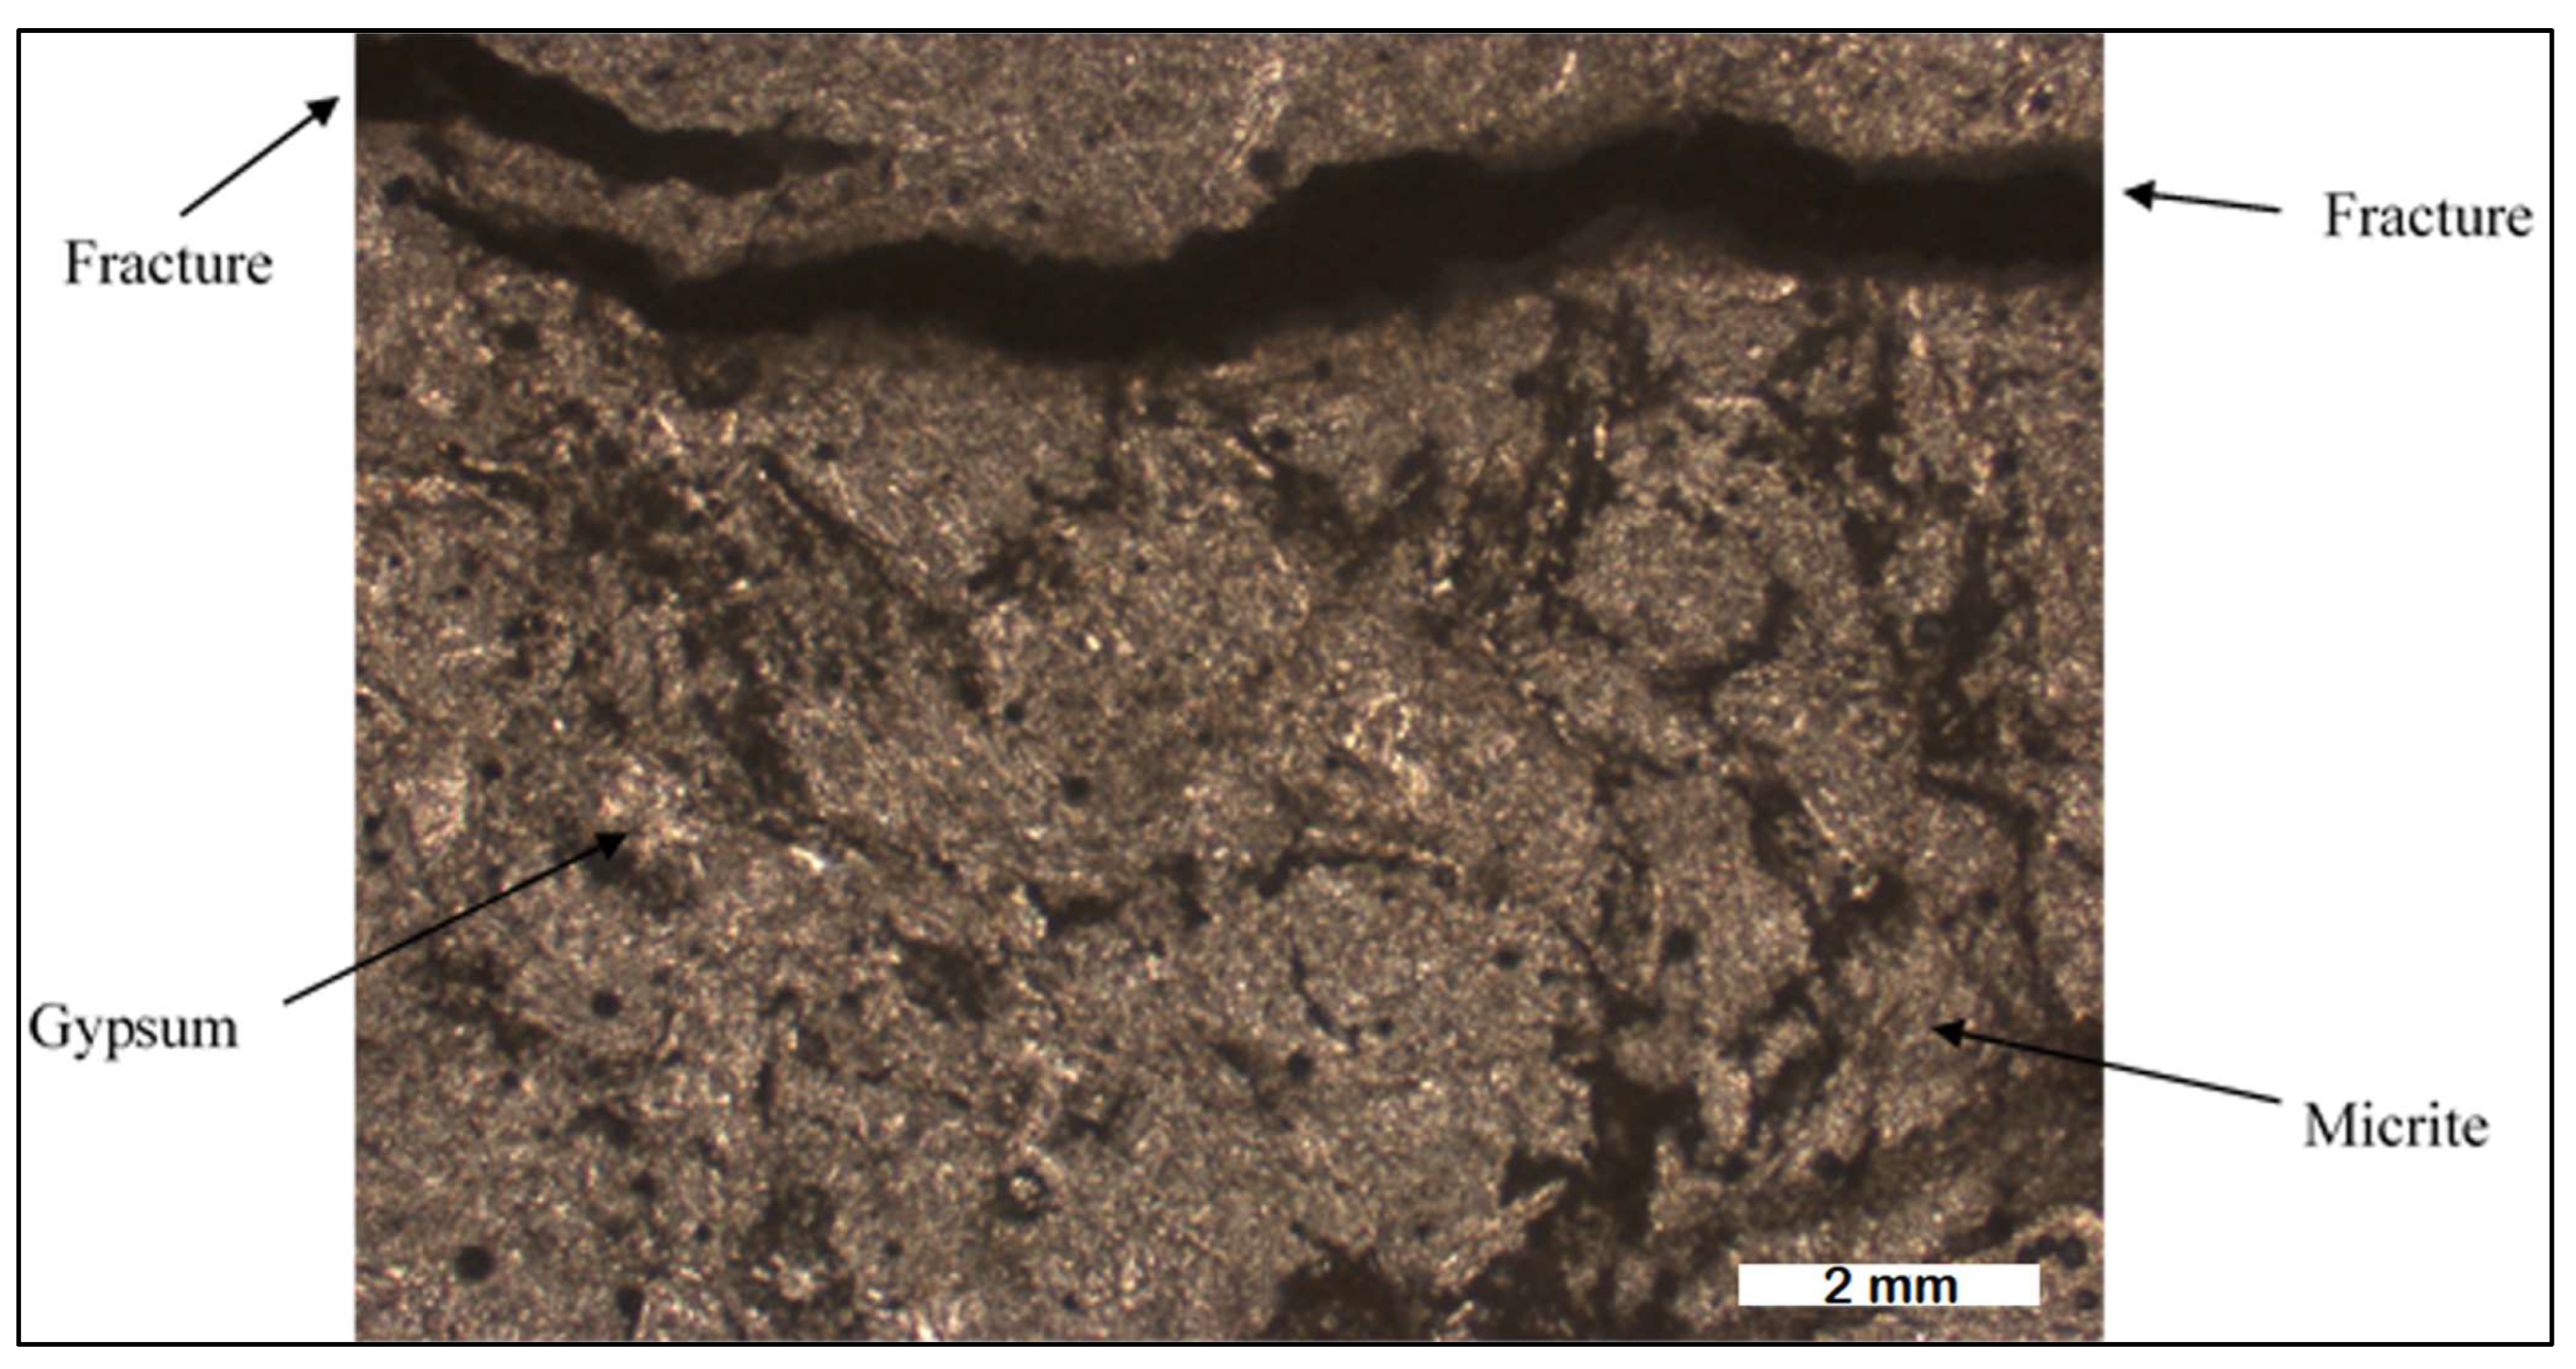
Detailed analysis of 13 rock samples obtained from the transition zone between the Hith and Sulaiy formations at Dahal Hith was carried out. The upper portion of the Hith Formation is characterized by the prevalence of laminated anhydrites, as depicted in Figure 4, with varying thicknesses extending to several tens of meters, as reported by [15]. The fine layering, ranging from millimeters to centimeters in thickness, suggests a marine origin for these anhydrites. Photomicrographs from thin sections reveal the presence of gypsum, micritic carbonate, and fractures facilitating water movement (Figure 5).
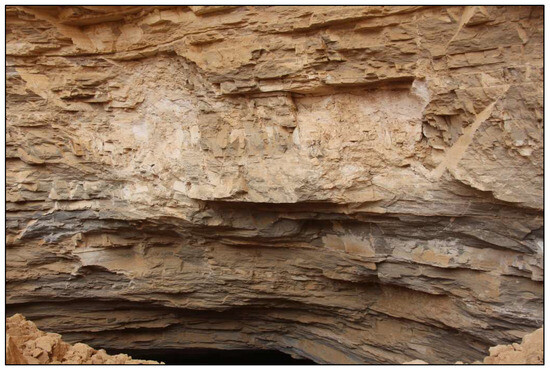
Figure 4.
Laminated anhydrites from Hith Formation in Dahal Hith (24.486195° N, 46.997111° E).
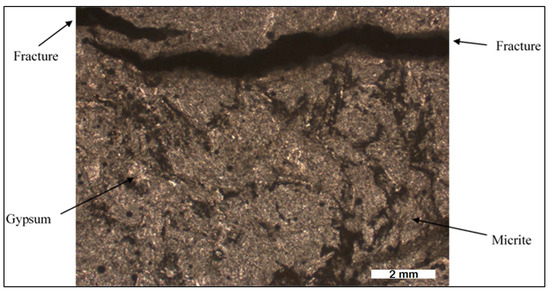
Figure 5.
Photomicrograph of Hith anhydrite from Dahal Hith.
Outcrops of Sulaiy Formation display laminated and bioturbated mudstones, indicative of sedimentation under calm, low-energy conditions. The formation, reaching a thickness of 20–30 m in the weathered subsurface zone, primarily consists of originally lithified limestone. Compaction-related damage to bioclasts is evident in thin sections, accompanied by a decrease in micrite percentage and a corresponding rise in matrix percentage.
The dissolution of anhydrite beds in the underlying Arab–Hith sequence by meteoric water has induced significant structural changes in the overlying Sulaiy Formation. This process has resulted in the development of fractures, brecciation, foliation, and the formation of cavities and vugs. The removal of anhydrite through dissolution weakens the rock structure, causing fractures and the formation of breccia. Foliation occurs due to pressure and the alignment of minerals, while cavities and vugs further compromise the rock’s integrity.
Karstification, or the formation of karst features such as sinkholes and caves, is likely to initiate along tectonic weak zones. These zones are more susceptible to deformation and fracturing, providing pathways for meteoric water to infiltrate and dissolve the anhydrite and halite. The process of karstification is particularly enhanced during periods of high groundwater recharge, which increases the amount of water entering the groundwater system and intensifies dissolution processes.
This phenomenon was especially pronounced during the humid climatic conditions in the Arabian Peninsula 5000 to 10,000 years before the present day, as indicated by [22]. The increased rainfall during this period led to higher groundwater recharge, thereby accelerating the dissolution of anhydrite and promoting the development of karst features within the Sulaiy Formation. However, it is important to recognize that this time period represents only the most recent phase of karst formation. Karst features typically develop over extensive geological timeframes, often requiring tens of thousands to millions of years. Therefore, the overall development of karst features in the Sulaiy Formation likely occurred over a much longer period.
4.2. General Hydrochemistry
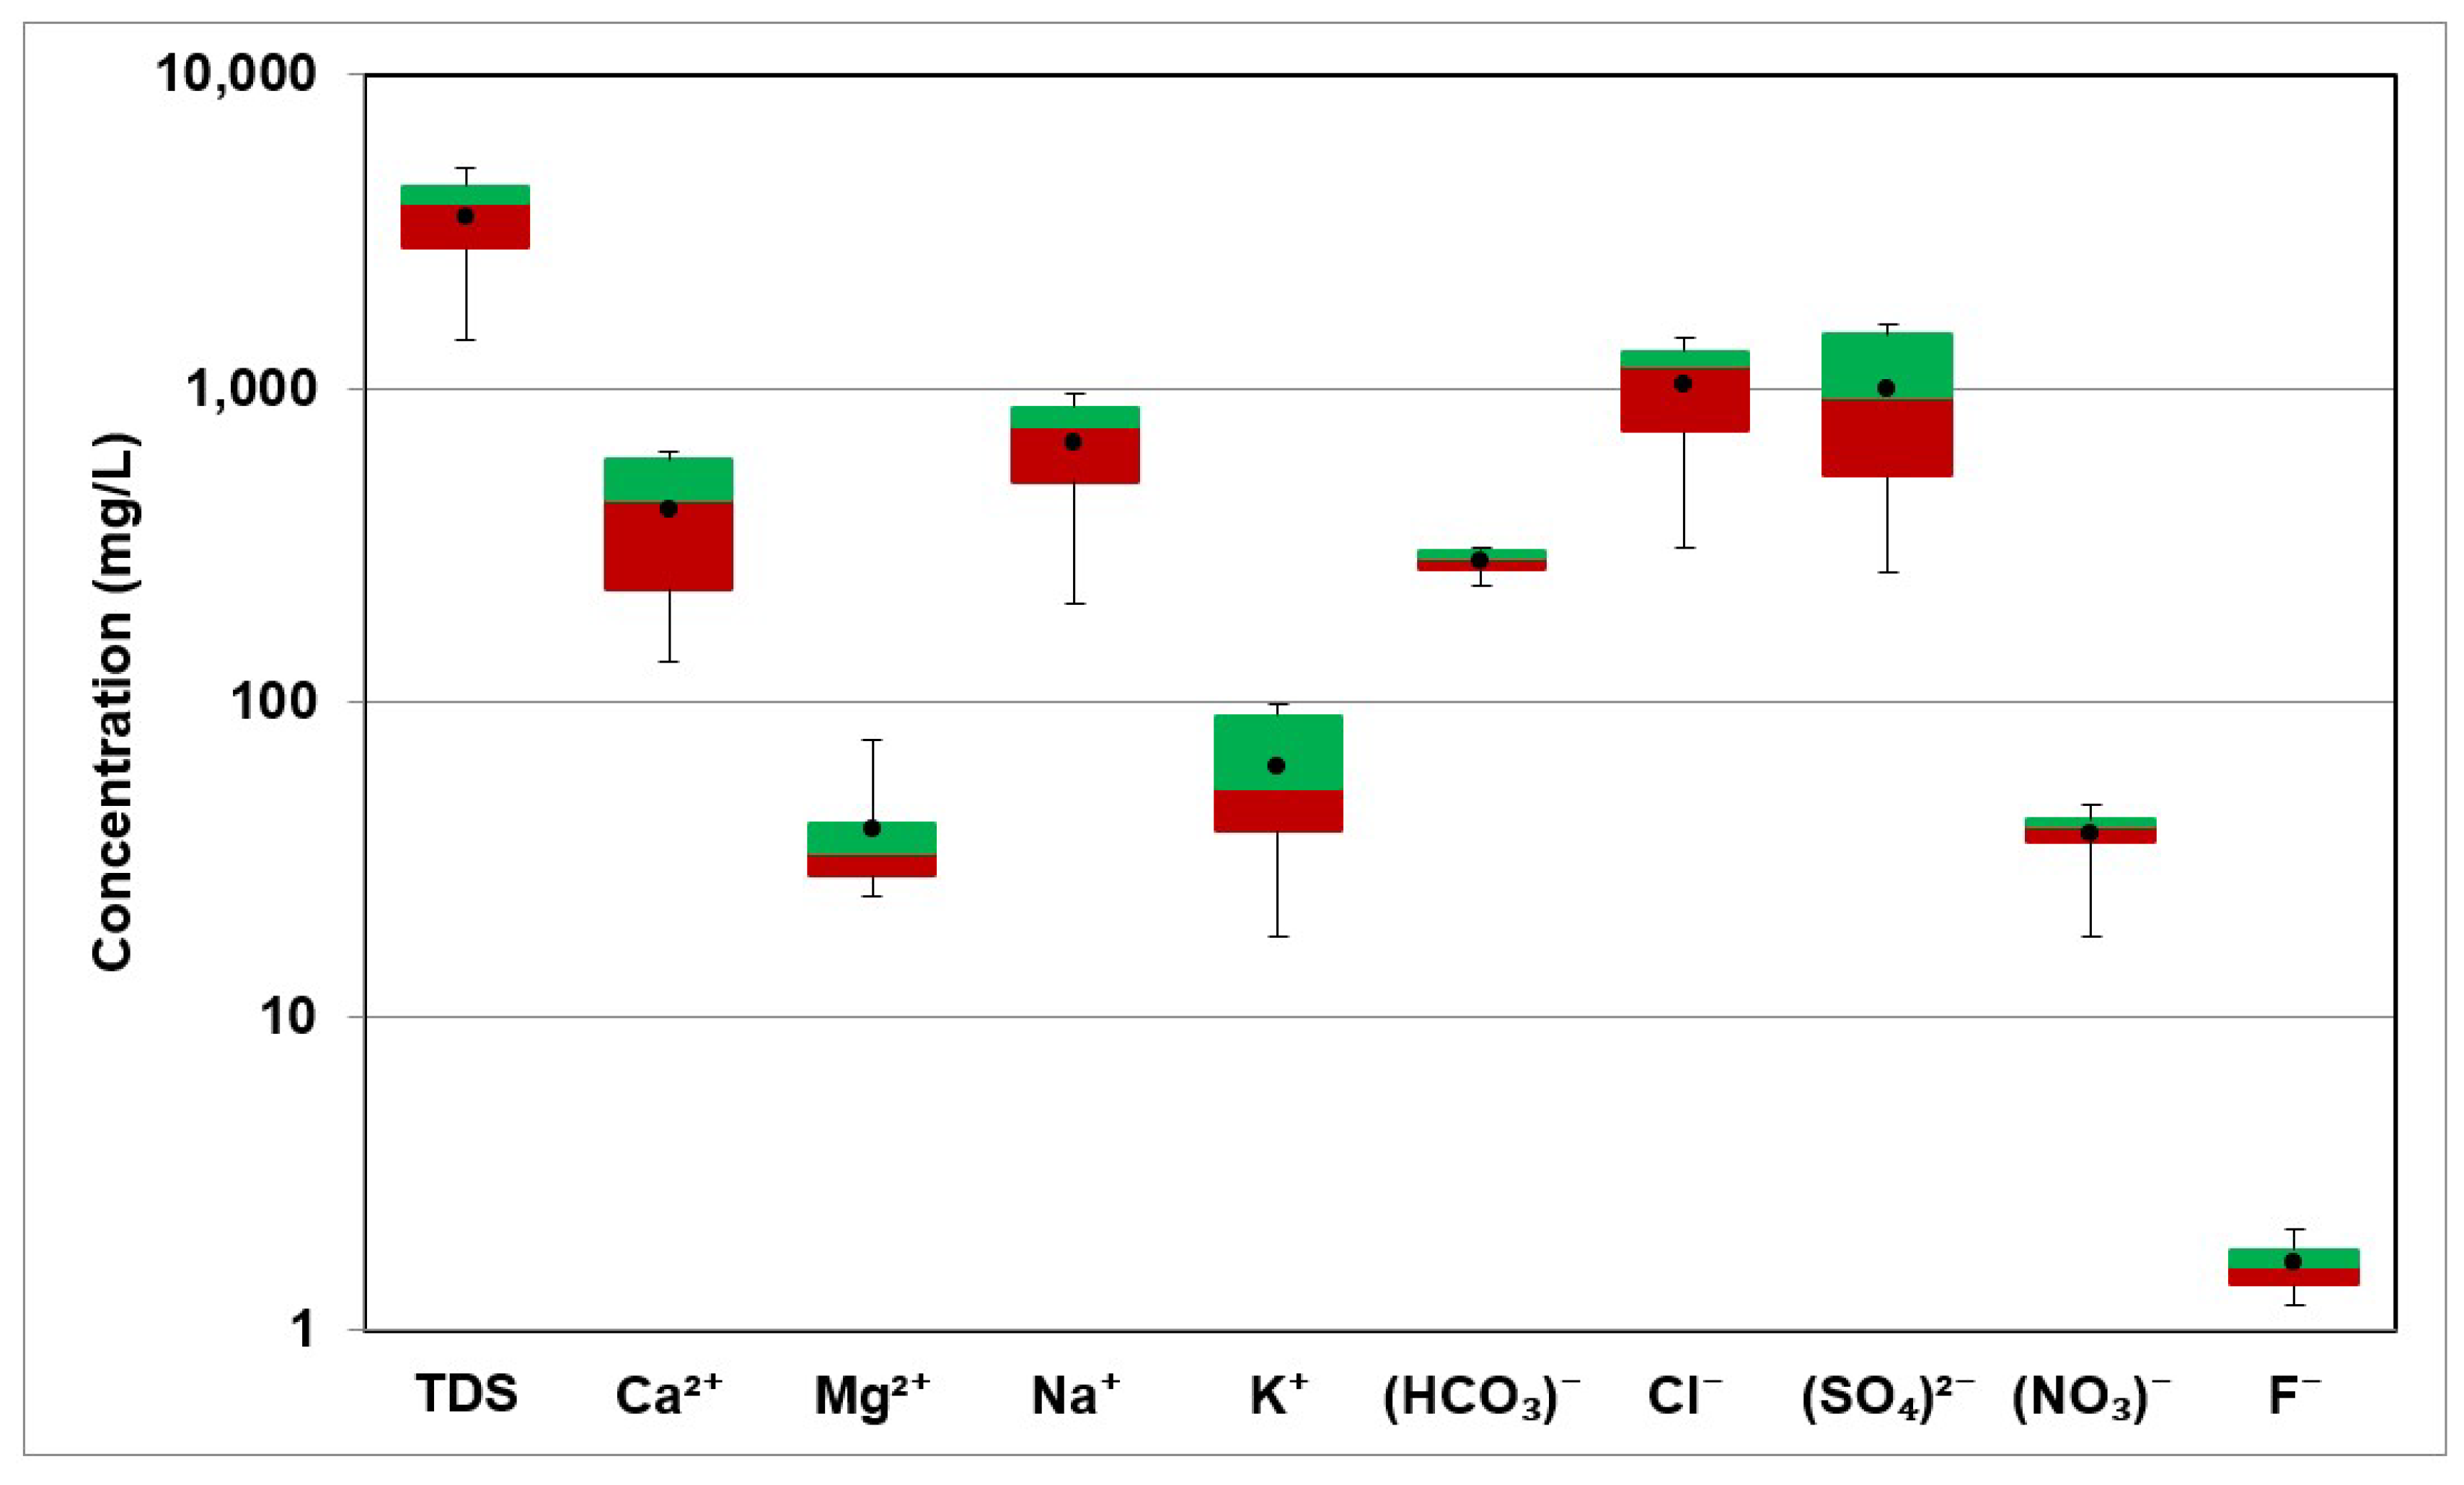
The geology of the aquifer determines how the hydrochemistry and hydrochemical processes vary both geographically and over time. The analyzed parameters were Ca2+, Mg2+, Na+, K+, HCO3−, SO42−, Cl−, NO3− and F−. Table 2 displays the values of the obtained parameters for the 21 samples. Table 3 displays the statistics of the examined parameters, including minimum, maximum, mean, and standard deviation. Figure 6 shows the box and whisker plot for the TDS and the major ions.
Table 2.
Measured values for the various parameters in the groundwater samples. Temperature is in °C. pH has no units whereas the other parameters are in mg/L.
Table 3.
General statistics of the analyzed parameters (all values are in mg/L unless otherwise mentioned).
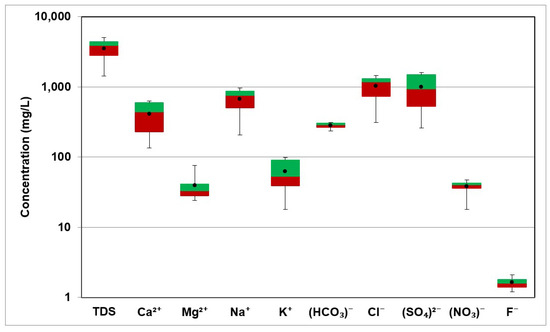
Figure 6.
Box Plot of TDS and major ions in groundwater.
The values of pH ranged between 6.74 to 7.8 with an average value of 7.1. The pH of water determines the mineral dissolution due to rock–water interaction; for example, carbonate minerals are more soluble at lower pH values [23]. Heavy metals (lead, copper, cadmium, etc.) are more soluble in water that has a low pH. The water is considered neutral when the pH is 7, but a pH > 7 is considered alkaline or basic and a pH < 7 is considered acidic.
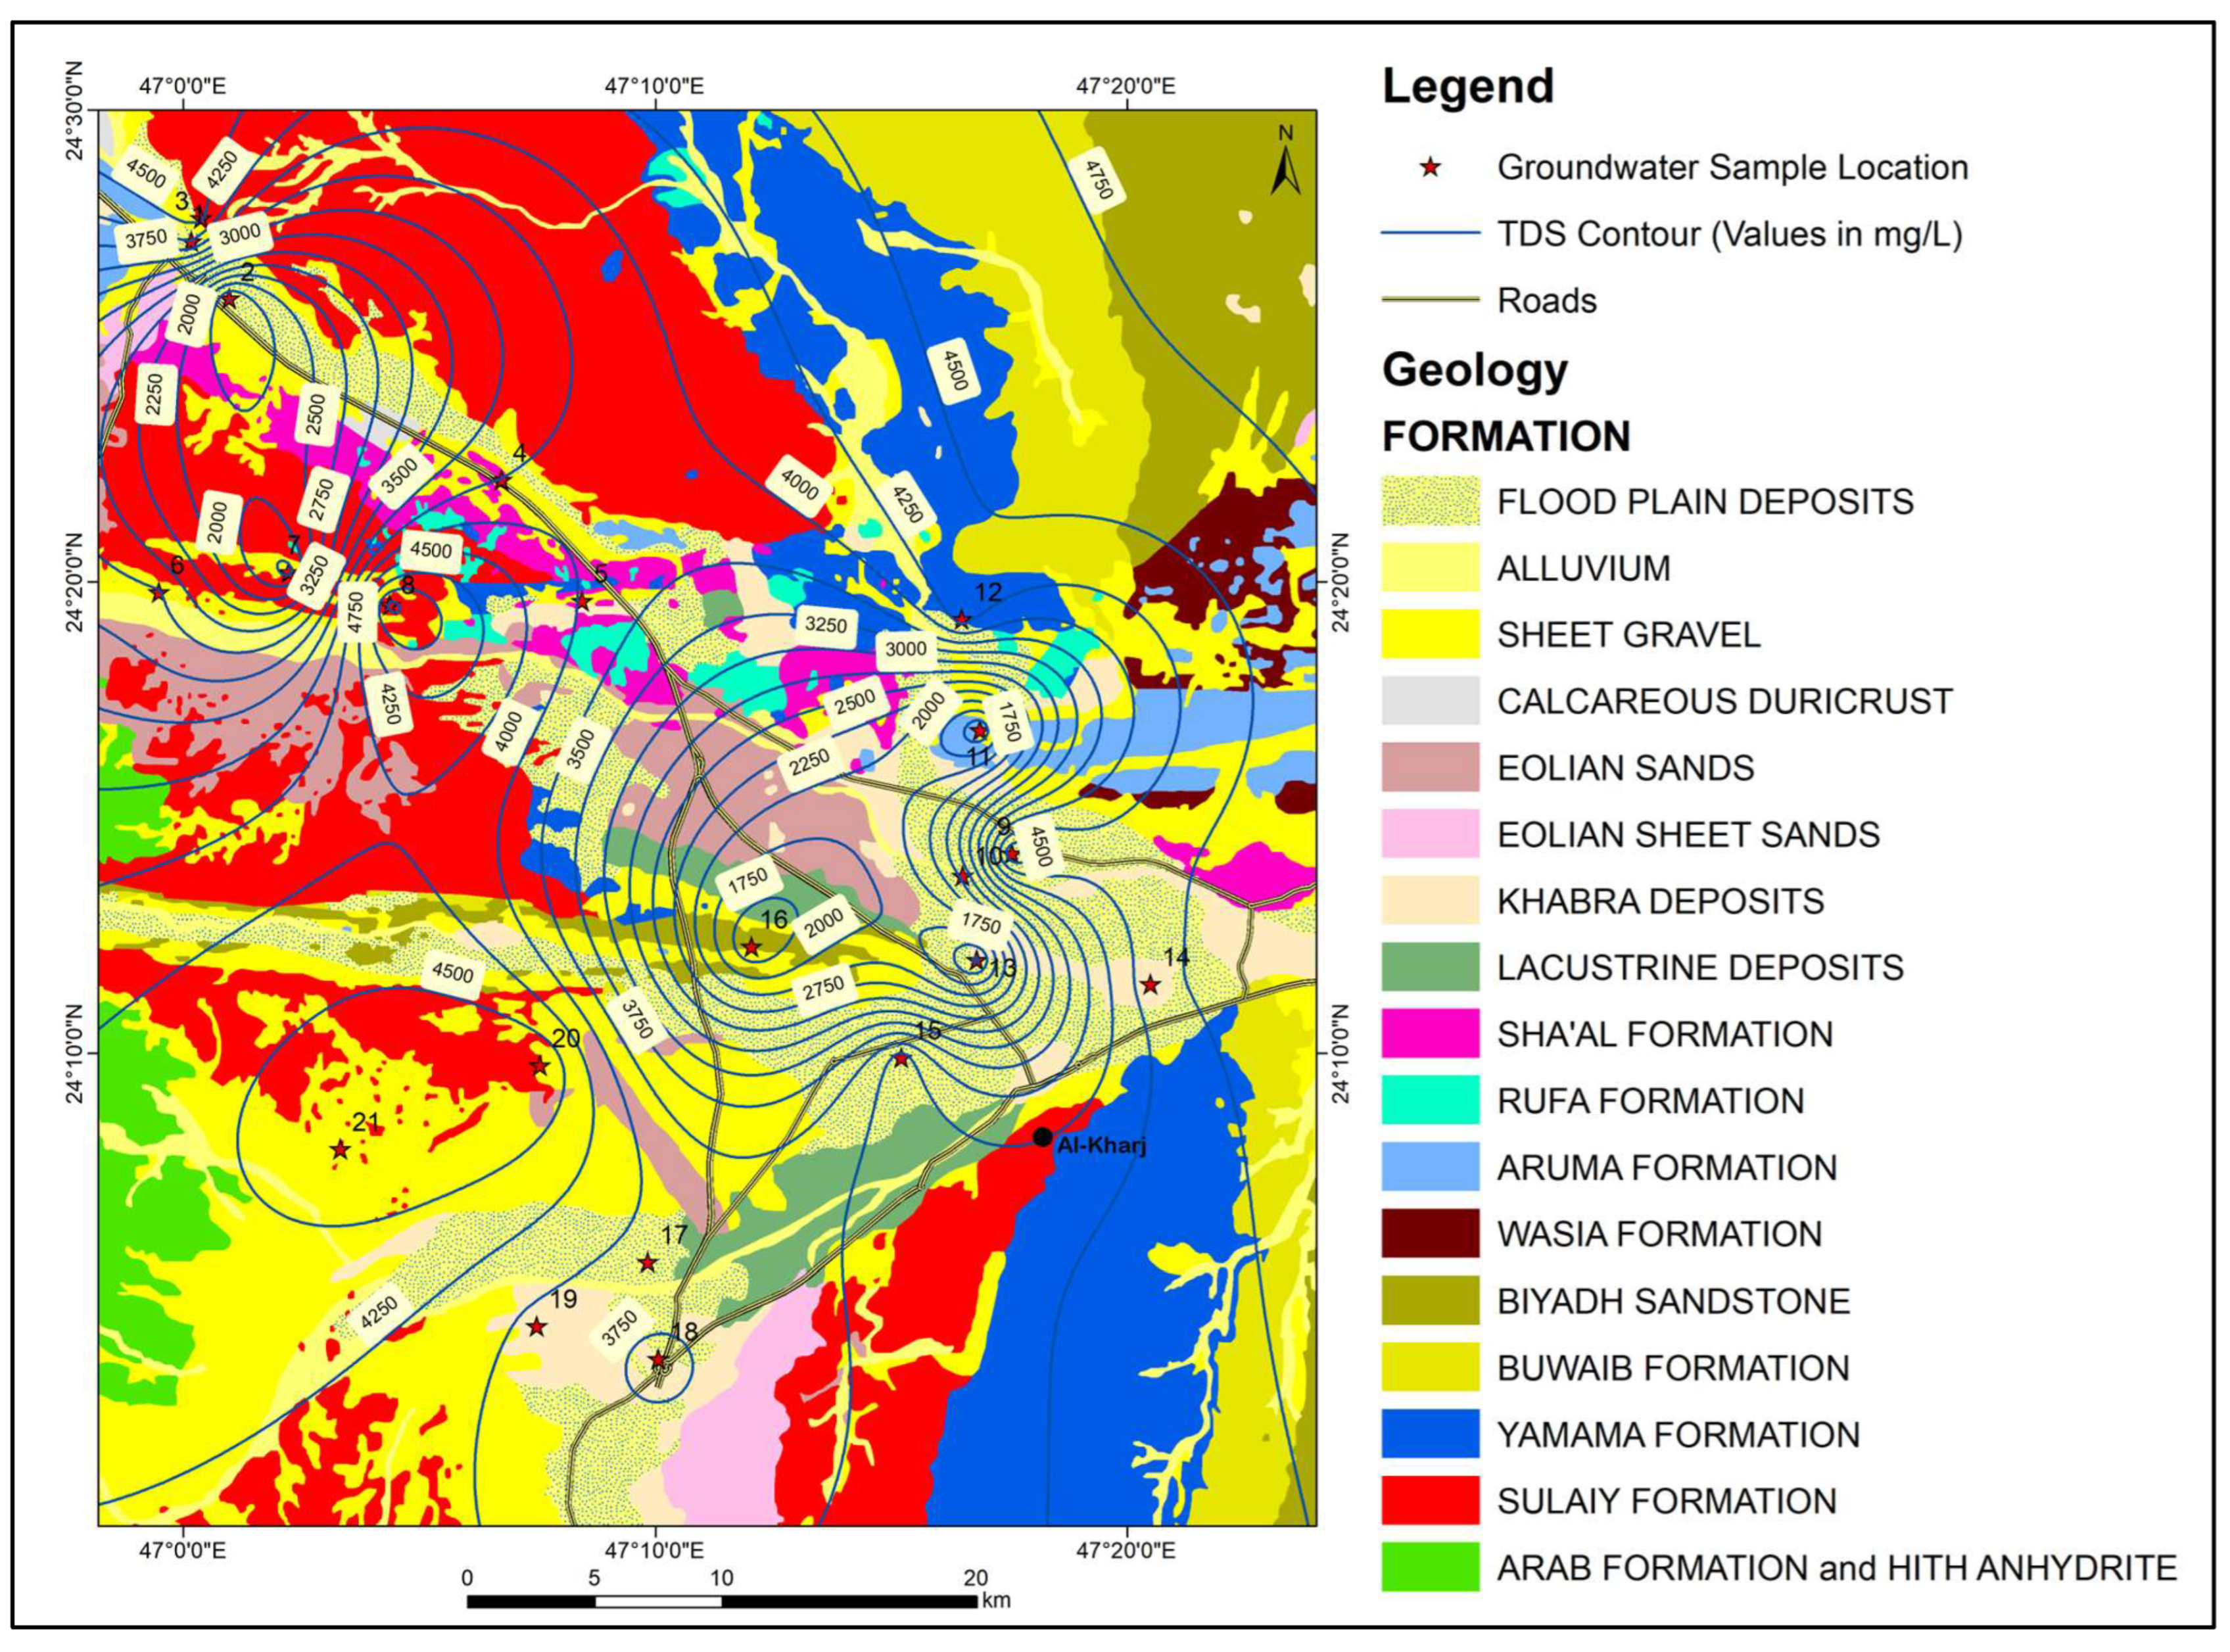
The values of Electric Conductivity ranged between 1550 µS/cm and 7650 µS/cm and the average value was 5003.54 µS/cm. The TDS values ranged between 1433.3 mg/L and 5063.5 mg/L, with an average value of 3515.87 mg/L. Water–rock interactions resulting in the dissolution of highly soluble minerals (halite and anhydrite) are the main sources of high TDS values in groundwater. Figure 7 shows the spatial distribution of TDS in the study area.
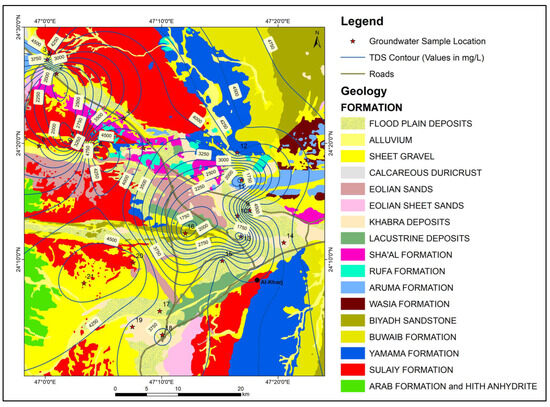
Figure 7.
Map showing the geology and spatial distribution of TDS in the study area.
The concentration of Ca2+ ranged from 134 mg/L to 628 mg/L with an average value of 410.6 mg/L. The high Ca2+ concentration was caused by the abundance of gypsum, calcite, and anhydrite rocks. The high Ca2+ concentration also led to an increase in groundwater hardness. The values of Mg2+ ranged from 24 mg/L to 76 mg/L and the average value was 39.7 mg/L. The source Mg2+ in groundwater mainly resulted from the dissolution of carbonate rocks such as dolomite CaMgCO3.
The concentration of Na+ in the study area ranges from 205 mg/L to 966 mg/L with an average value 667.8 mg/L. The primary source of Na+ in groundwater in the present study is halite (NaCl) dissolution. The K+ values ranged between 18 mg/L and 99 mg/L with an average value of 62.7 mg/L.
The values of Cl− ranged from 310 mg/L to 1437 mg/L with an average value of 1017.9 mg/L. The values of HCO3− in groundwater samples ranged from 233 mg/L to 311 mg/L with a mean of 281.1 mg/L. The concentration of SO42− in the groundwater samples ranged from 259 mg/L to 1584 mg/L and the average value was 996.1 mg/L. The gypsum (CaSO4.2H2O) and anhydrite dissolution (CaSO4) was considered as the main source of sulfate.
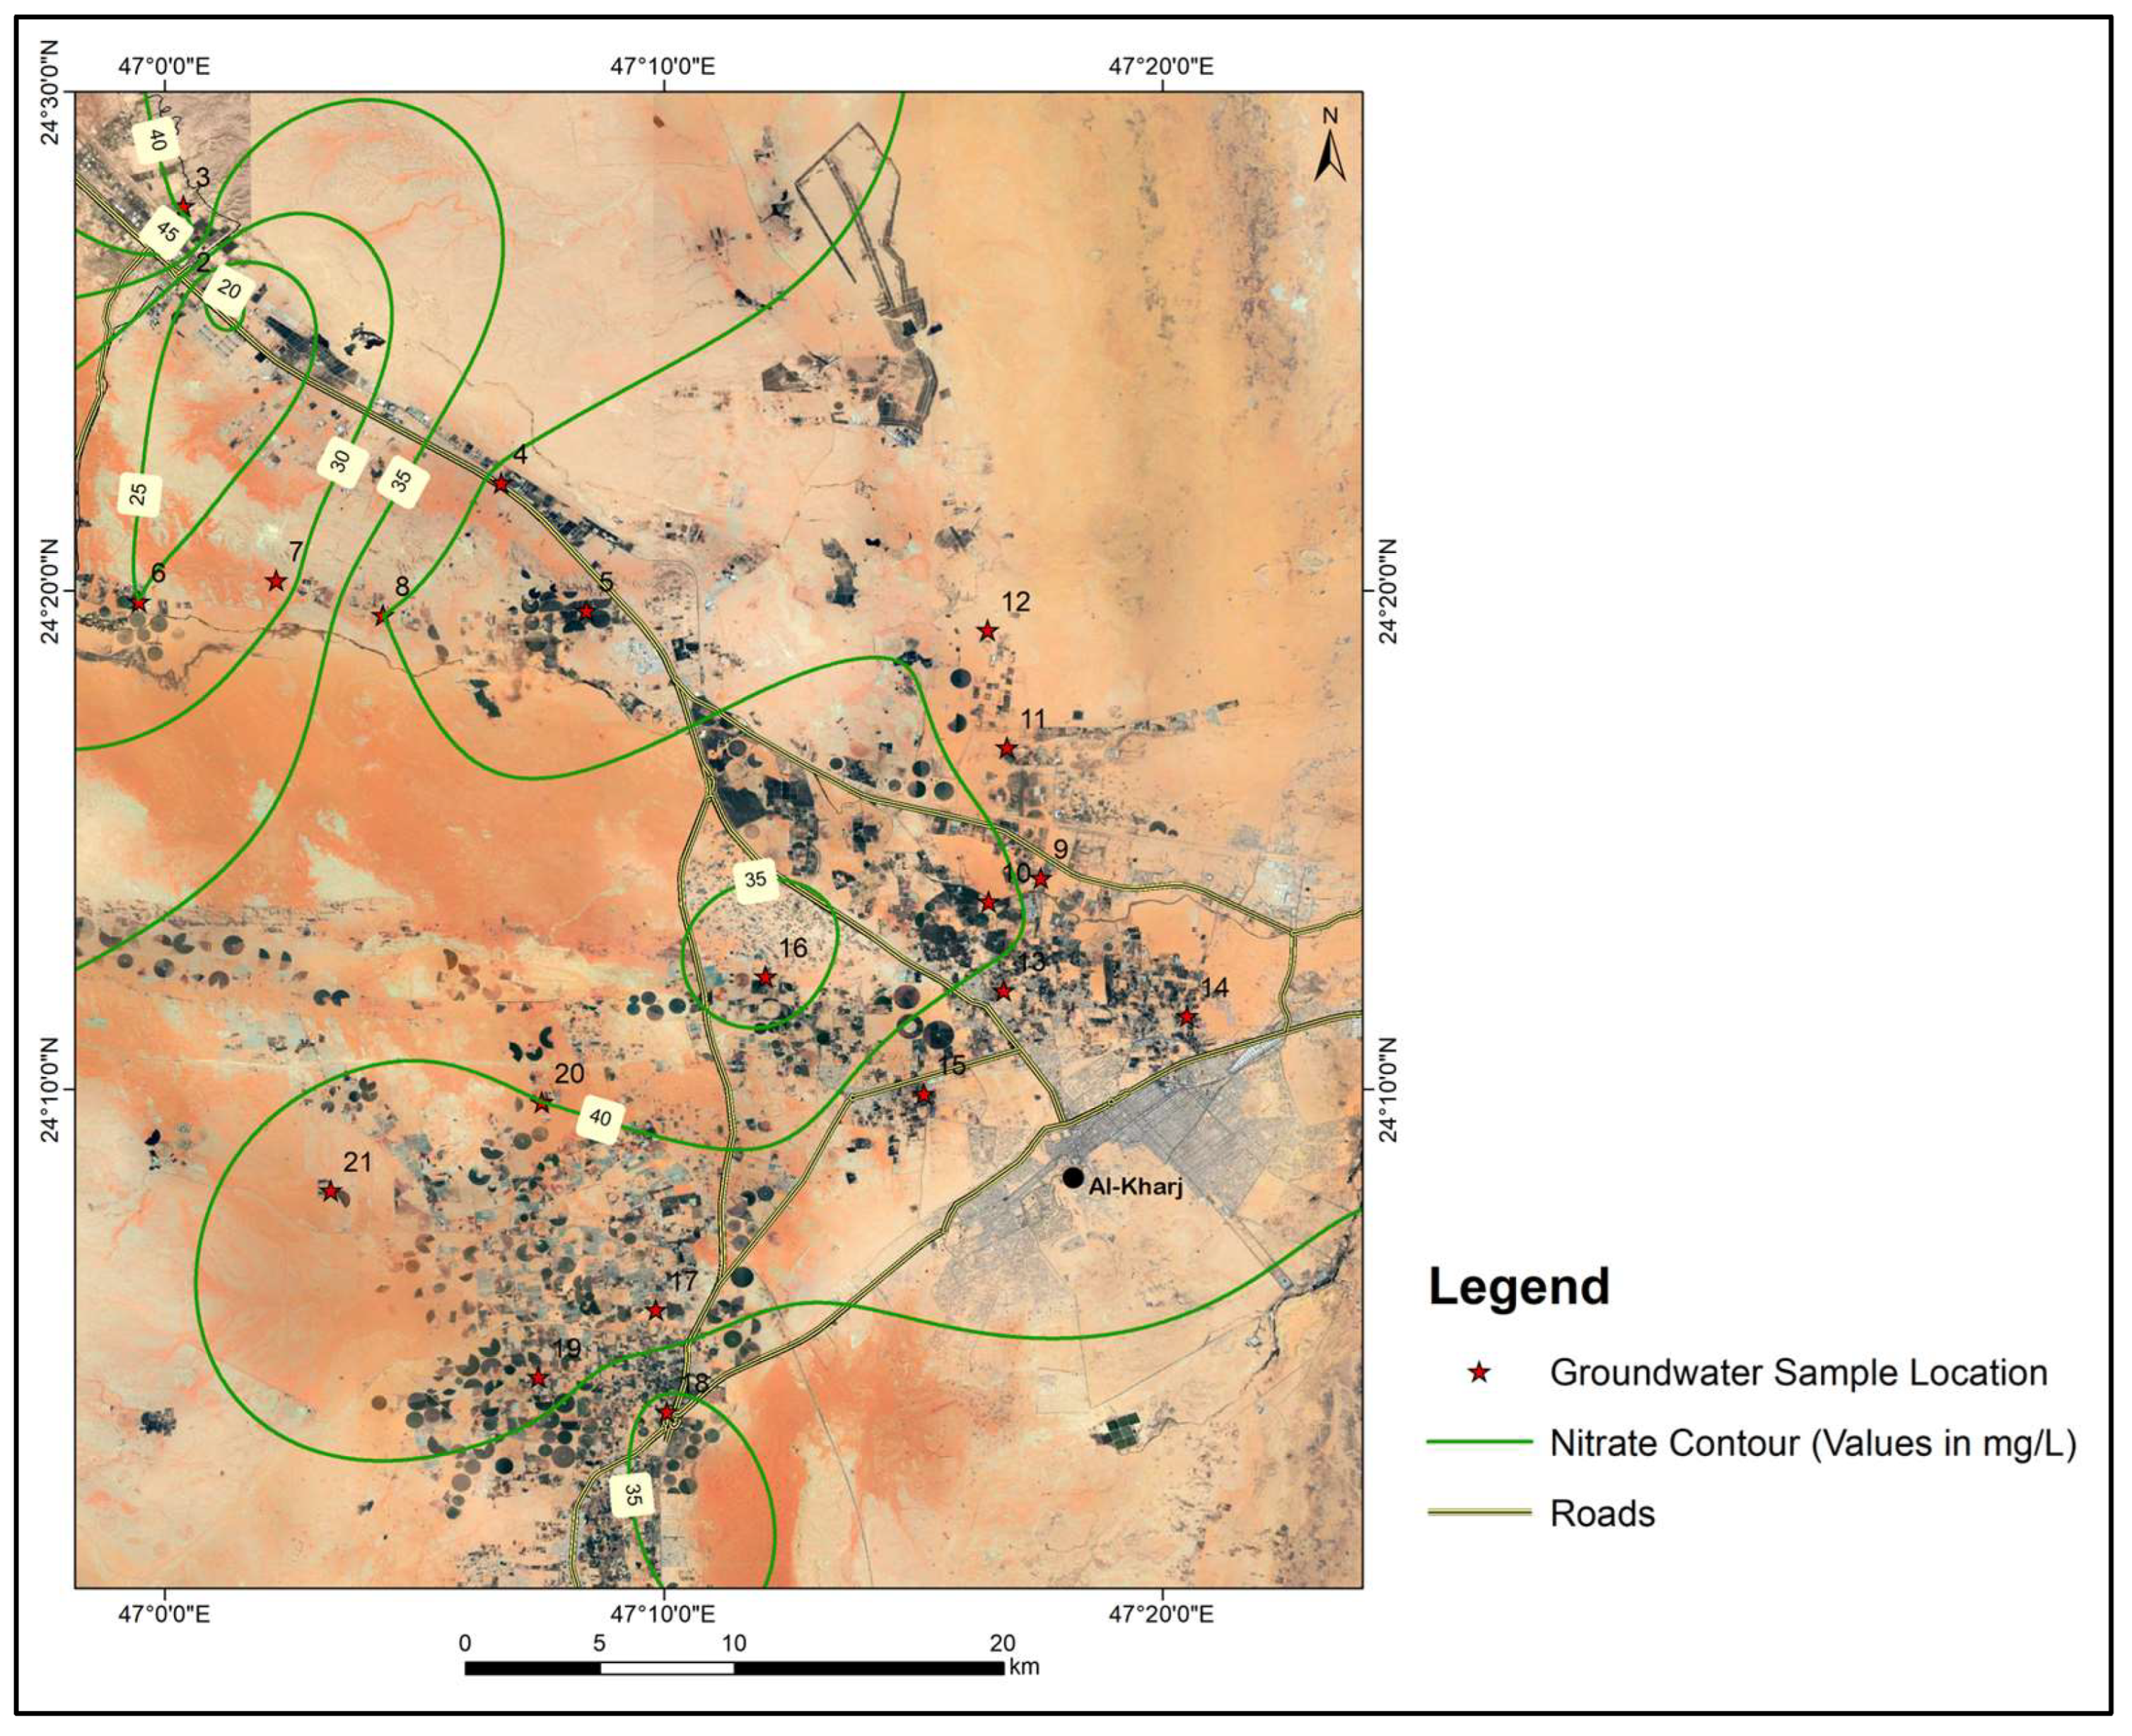
The average NO3− concentration in groundwater samples was 38.1 mg/L, while values ranged from 18 mg/L to 47 mg/L. The NO3− (nitrate) levels in the groundwater of the study area are within the World Health Organization’s [24] maximum permissible limit of 50 mg/L, ensuring compliance with public health standards. However, the authors of [25] have identified that the natural background level of nitrates in an arid region is significantly lower, at 7.2 mg/L. This contrast indicates that the nitrate levels observed in the present study, although below the threshold described by the authors of [24], are elevated relative to the natural background concentrations. Such an elevation is likely attributable to agricultural activities, which commonly involve the application of nitrogen-based fertilizers. Figure 8 presents the spatial distribution of NO3− in the study area. Sewage waste also sometimes results in a high concentration of Na+ and Cl− in groundwater. As can be seen from the satellite image in the figure, all the samples were collected from agricultural farms, which satisfactorily explains the observed levels of NO3−.
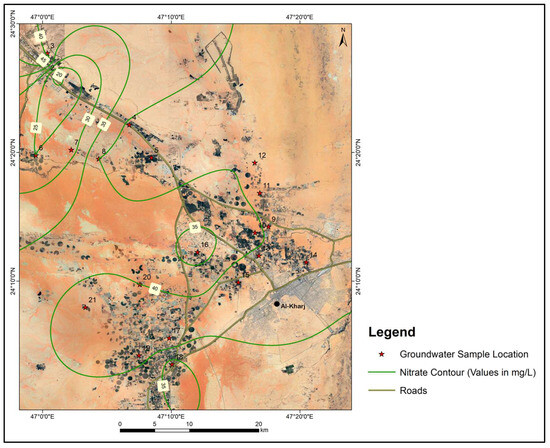
Figure 8.
Map showing the spatial distribution of nitrates in the study area.
F− concentrations ranged from 1.2 mg/L to 2.1 mg/L, with 1.6 mg/L being the average. In general, fluoride-bearing minerals in aquifers are responsible for the high concentration of F in groundwater [26].
4.3. Piper Trilinear Diagram
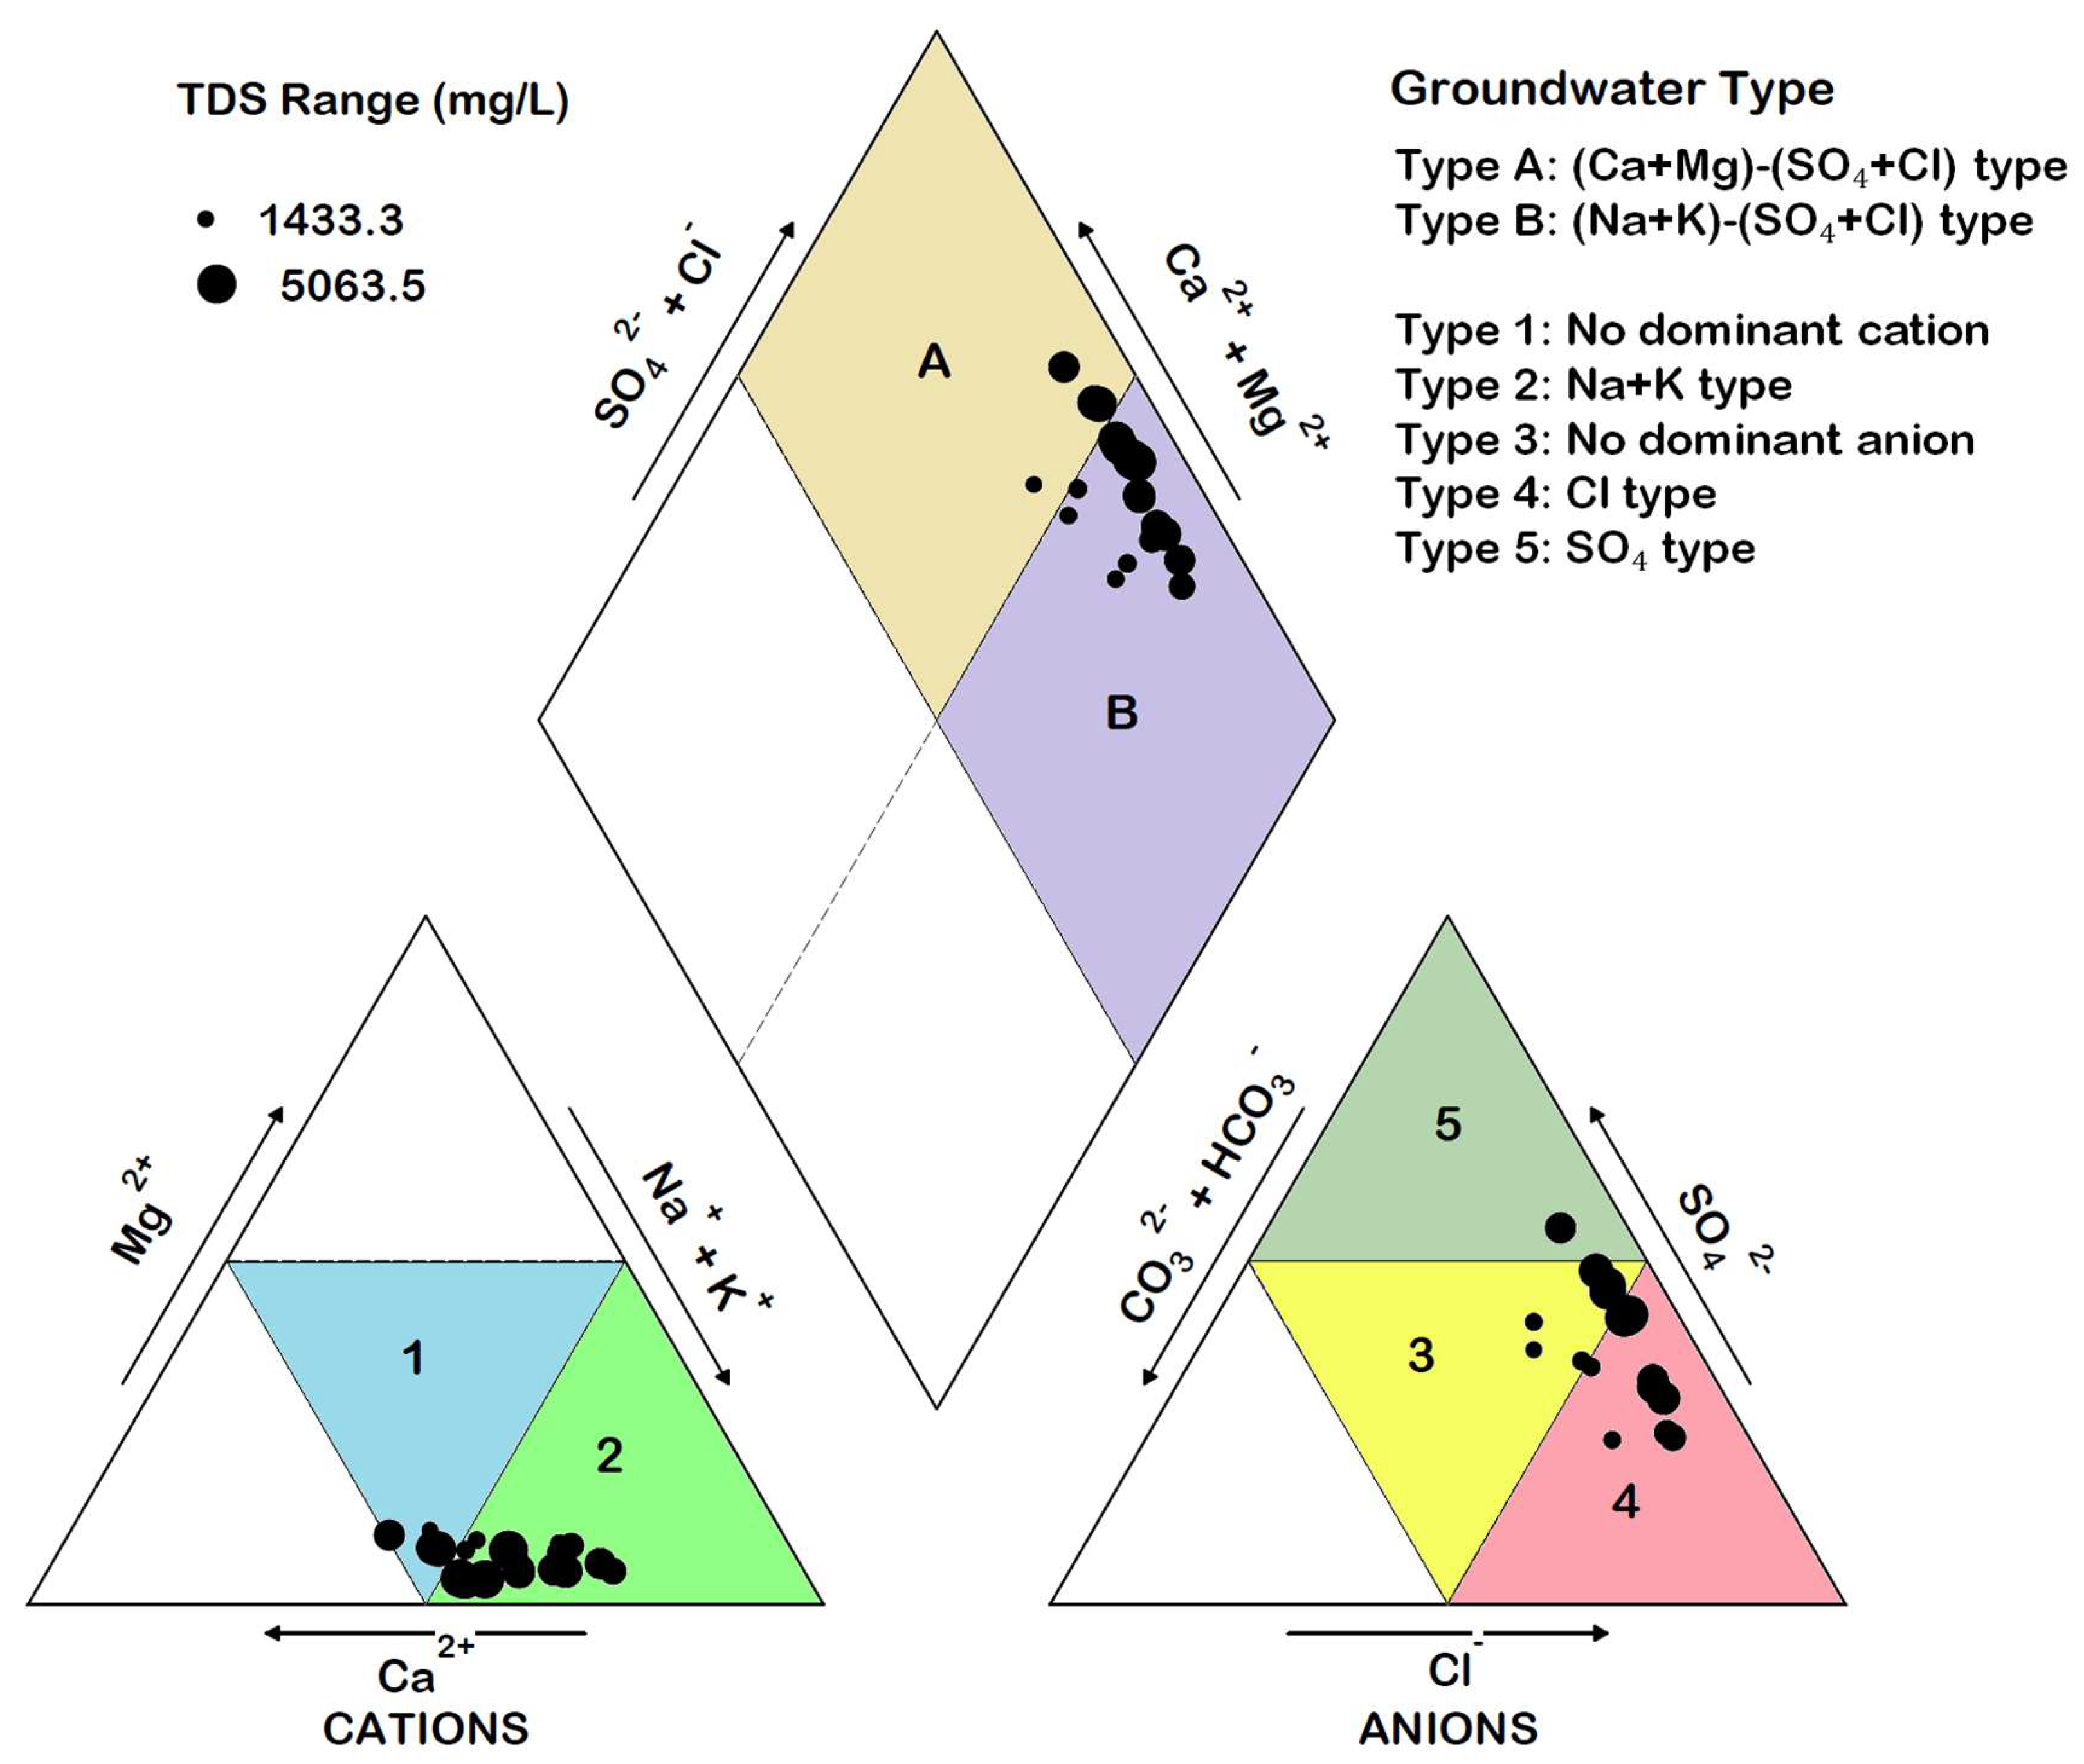
Water samples are divided into various facies types according to the principal cations and anions using Piper’s trilinear diagram. This plot can also explain the geochemical evolution of water. The lithology, kinetics, solution, and aquifer flow patterns all affect the hydrochemical facies [27].
The Piper plot for the analyzed sample is shown in Figure 9. On the cationic triangle, two types of groundwater can be seen. Type 1 is the mixed cationic species which does not show the dominance of any one cation, whereas in Type 2, the dominance of Na+ + K+ can be seen. On the anionic triangle, three types of groundwater can be seen, including the no dominant anion (Type 3), the Cl type (Type 4), and the SO42− type (Type 5). On the diamond of the Piper plot, two main hydrochemical facies can be identified: the (Ca2+ + Mg2+)–(Cl− + SO42−) Type (Type A) and the (Na+ + K+)–(SO42− + Cl−) Type (Type B). Most of the samples belong to Type B and represent the typical groundwater facies found in an environment dominated by the solution of evaporite minerals. The absence of (Ca2+ + Mg2+)–(CO32−+ HCO3−) type of groundwater probably reflects the saturation of water with respect to carbonate minerals.

Figure 9.
Piper diagram showing the main hydrochemical facies in the area.
4.4. Gibbs Diagram
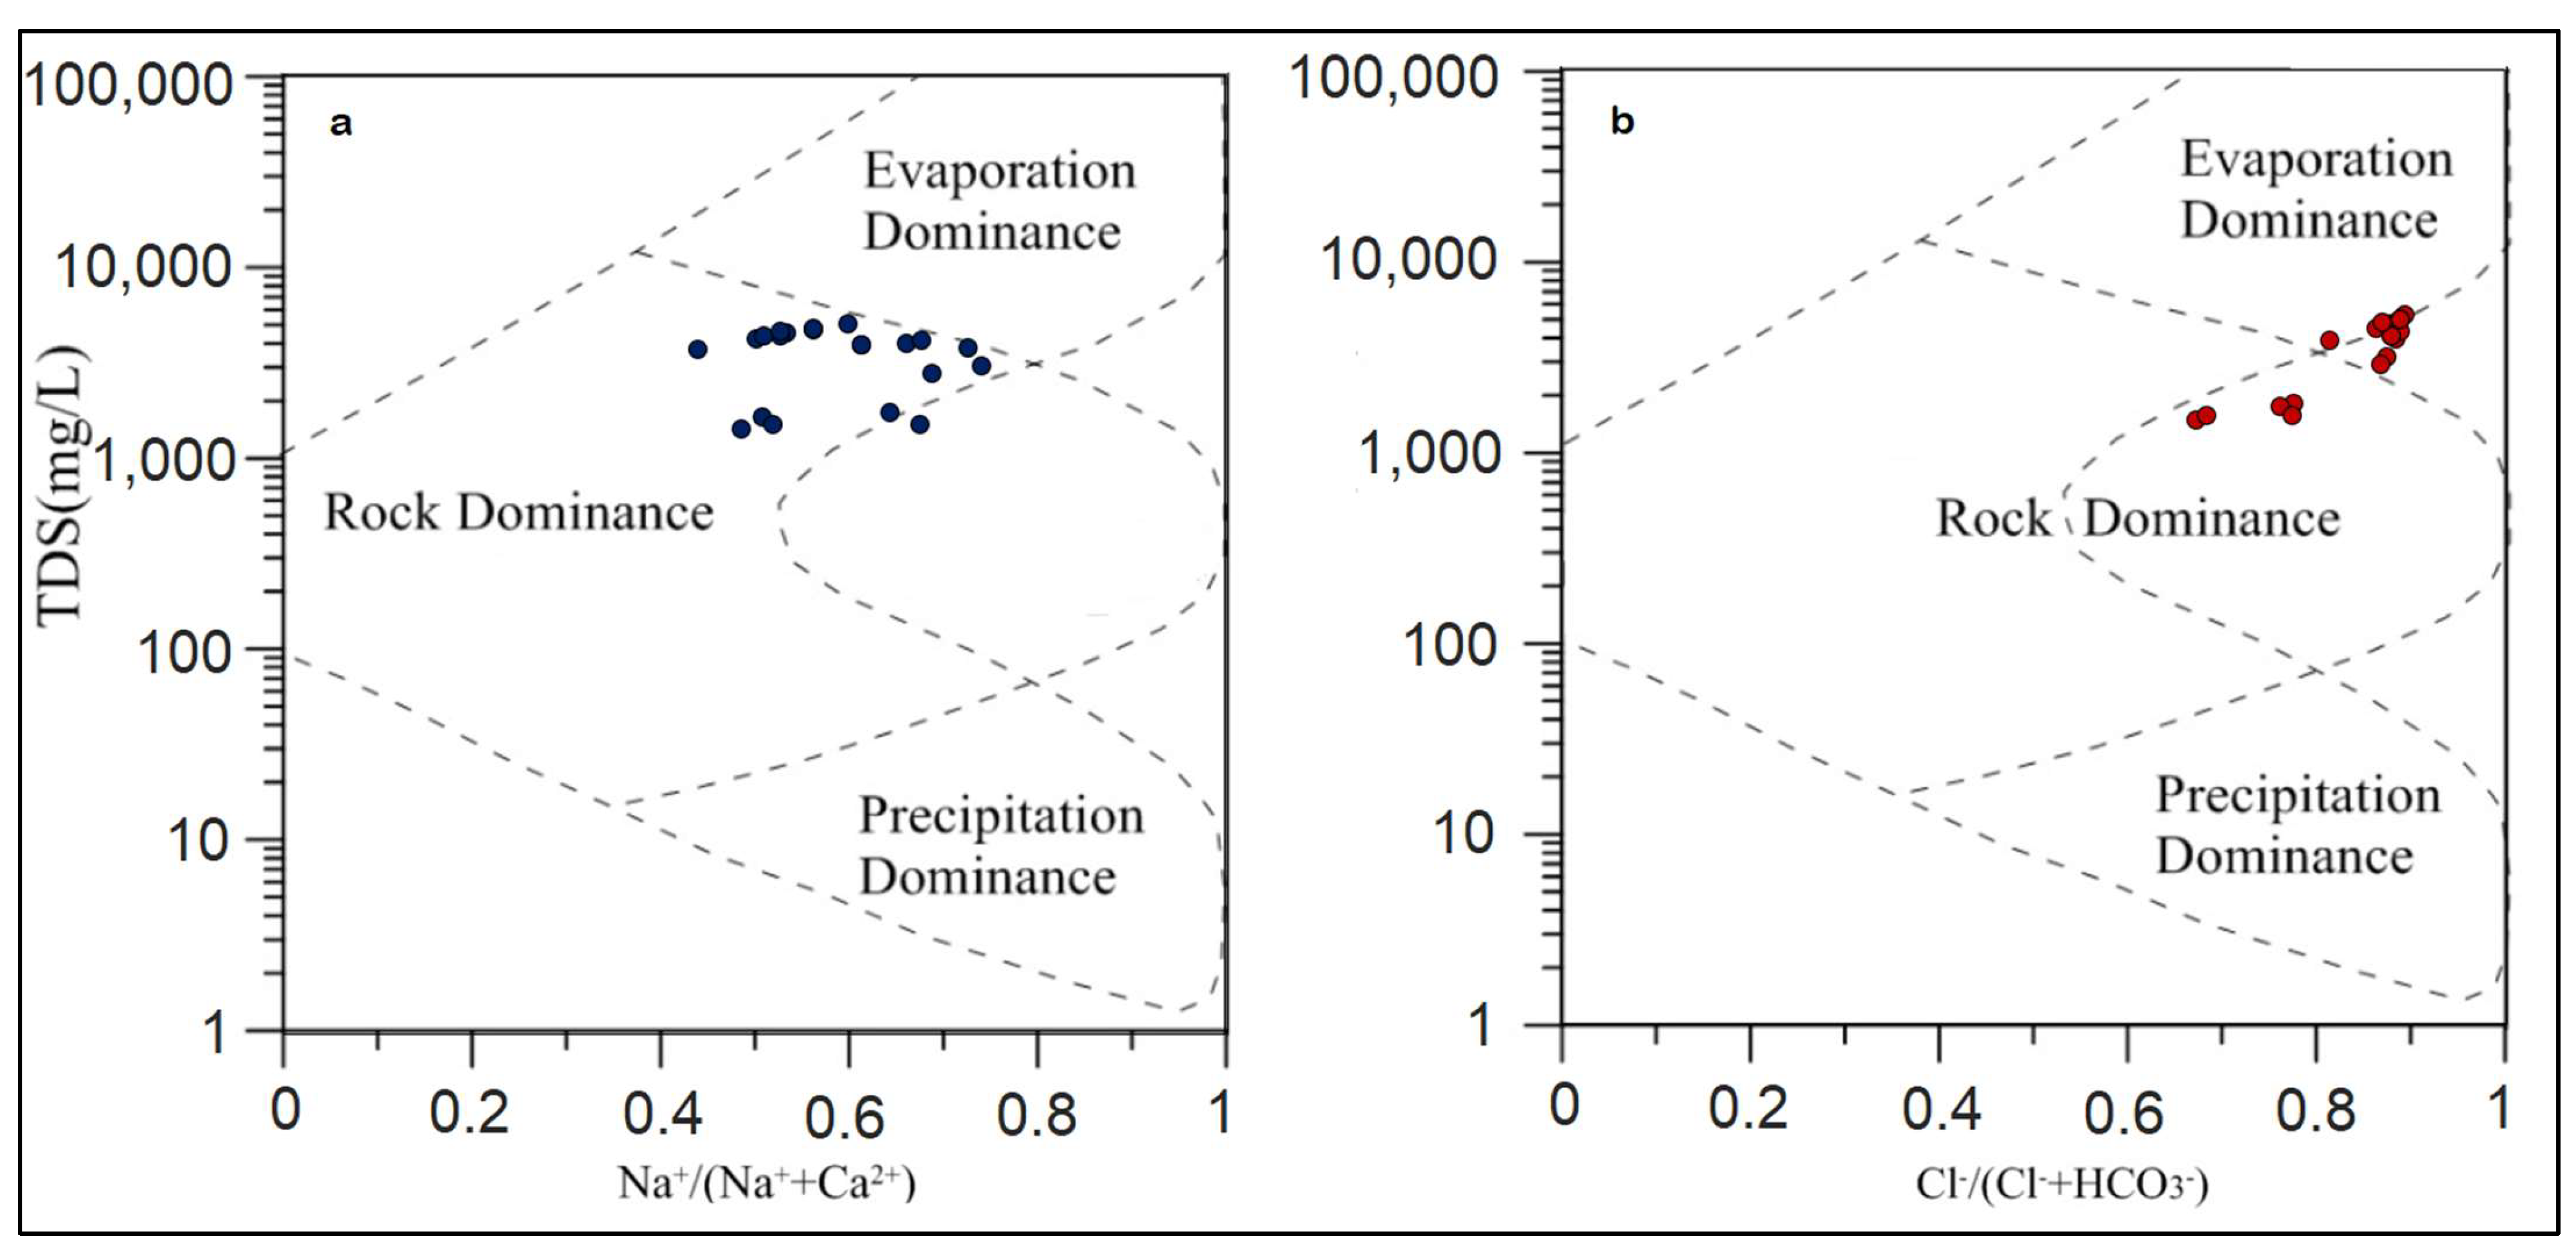
Constructing a plot between TDS vs. Na+/(Na+ + Ca2+) and TDS vs. Cl−/(Cl− + HCO3−), known as Gibbs diagrams, helps us to understand the interaction between rock and water [28]. It illustrates the connections between the various systems that affect the chemistry of water. The following equations, where all values are in meq/L, have been used to plot the results of the chemical analysis of water on the Gibbs diagram.
Gibbs ratio–I (anions) = Cl−/(Cl− + HCO3−)
Gibbs ratio–II (cations) = Na+/(Na+ + Ca2+)
The samples from the current study fall in the rock dominance zone (Figure 10a,b). The cation plot (Figure 10a) shows data points at the boundary between “Rock Dominance” and “Evaporation Dominance” zones. The average Na+/(Na+ + Ca2+) ratio is 0.59, indicating a slight dominance of Na+, likely due to halite dissolution.
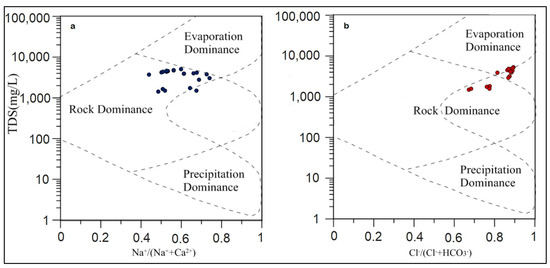
Figure 10.
Gibbs Plot showing the presence of rock dominance (mineral dissolution) environment (a) cation plot, (b) anion plot.
In a region with limestone formations, rock–water interactions would typically result in a dominance of Ca2+. However, the dissolution of minerals such as halite and anhydrite has led to higher concentrations of Na+, Cl−, Ca2+, and SO42− in the groundwater. The data points lie in the rock dominance zone (Figure 10a,b), indicating that mineral dissolution has a significant impact on the groundwater chemistry. The high TDS values observed in the area are influenced predominantly by mineral dissolution, which shifts the ion balance towards a higher concentration of sodium and chloride.
4.5. Relationship between the Ionic Species
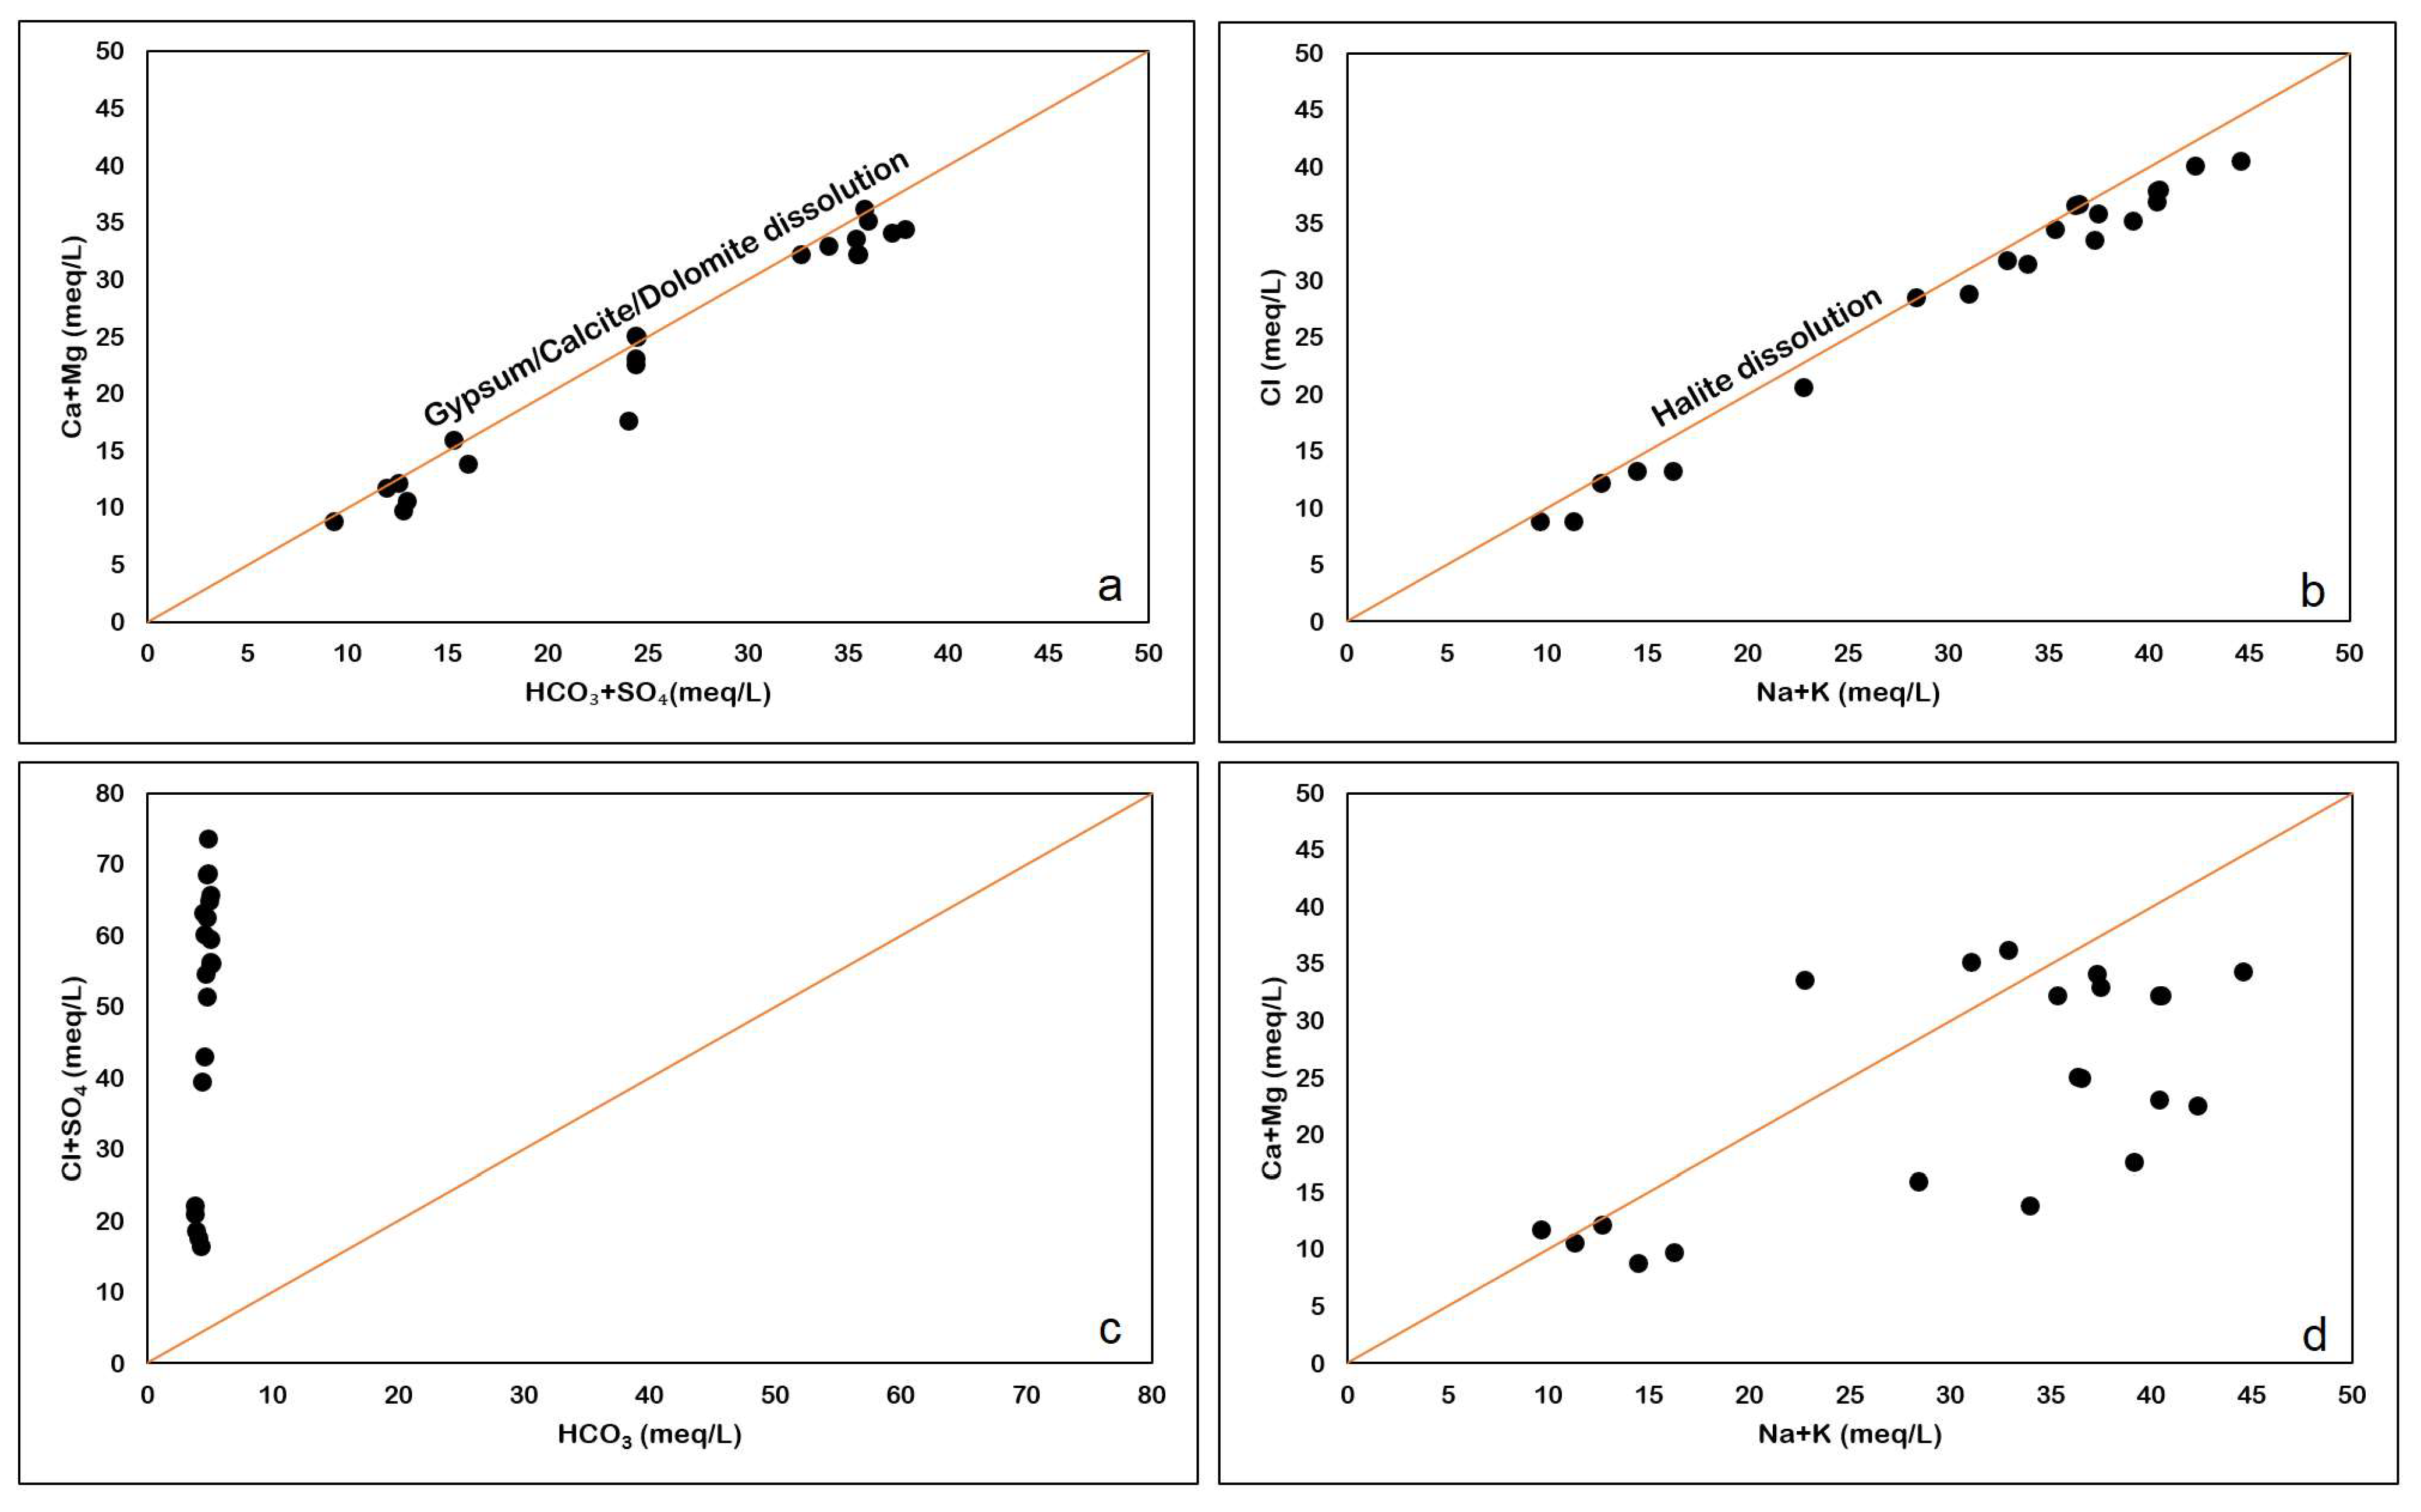
It is very important to study the relationship between major cations and anions, as they can give us an idea about the role of different processes, such as dissolution, water–rock interaction, anthropogenic activities, and the precipitation of minerals. The plot between Ca2+ + Mg2+ and HCO3− + SO42− assesses the natural bonding affinity between Ca2+ + Mg2+ and HCO3− + SO42− (Figure 11a), which may be due to gypsum/ anhydrite and calcite dissolution. It is evident from the geology of the study area that anhydrite (Hith Formation) and calcite (Sulaiy Formation) are the dominant aquifer lithologies from which groundwater is obtained, mostly for irrigation purposes. Most of the samples are plotted along the gypsum/calcite dissolution line indicating that sulfate and carbonate weathering are dominant in the study area.
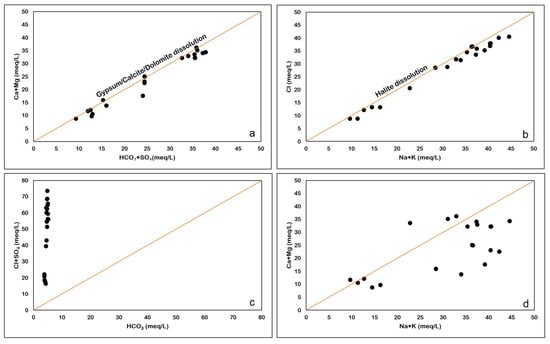
Figure 11.
(a) Ca + Mg versus HCO3 + SO4 (b): HCO3 versus Cl + SO4 plot (c): Na + K versus Cl plot (d): Na + K versus Ca + Mg plot.
The plot of HCO3− versus Cl− + SO42− (Figure 11b) shows that samples have an excess of Cl− and SO42− ions as compared to HCO3−. The data in Figure 11b imply that mineral dissolution is the key factor shaping the chemical composition of the groundwater. The dissolution of minerals such as halite and anhydrite lead to the enrichment of Cl− and SO42− in the groundwater. The presence of halite results in higher concentrations of Cl−, while the abundance of anhydrite in the aquifers contributes to the SO42− concentration in the groundwater.
On the Na+ + K+ versus Cl− plot (Figure 11c), the 1:1 line indicates the halite dissolution. Almost all the samples are plotted along this line, indicating the presence of halite dissolution. Replacement of anhydrite by halite in the Hith Formation in the study area has been reported by [29].
Na+ + K+ (alkalis) show slight abundance compared to Ca2+ + Mg (alkaline earth elements), as seen in Figure 11d. The excess alkali is from halite dissolution, whereas the Ca2+ is derived from gypsum/anhydrite dissolution.
Precipitation of calcite and gypsum dissolution has been identified as the main hydrochemical process in the Ordovician limestone groundwater in Yanzhou, North China [30]. Saturation indices in the following section confirm the same in the present study.
4.6. Saturation Index
The quantitative departure of water from equilibrium with regard to dissolved minerals is described by the saturation index (SI). Climate, rainfall, evaporation, different minerals found in geological formations, and hydrogeochemical processes like precipitation, dissolution, anthropogenic activity, ion exchange, and sorption are all elements that affect variations in the chemistry of groundwater in a given place. Instead of studying the mineralogy of the solid phase, SI and activity diagrams can be used to predict the minerals present in equilibrium with groundwater and their reactivity [31]. The following equation can be used to define SI for a specific mineral [32].
where IAP is the Ion Activity Product and Ks is the solubility product constant of the mineral.
SI = Log IAP/Ks
The SI (saturation index) indicates the thermodynamic potential for a reaction to occur, but it does not provide information about the rate of the process. However, because evaporites and carbonates react quickly, the thermodynamic predictions given by the SI are realistic and relevant for these minerals. The PHREEQC program was used to calculate the SI for each sample. SI values obtained below zero (−ve value) will indicate that the mineral is under-saturated with respect to the solution, and it tends to dissolve in the solution, but it will not precipitate. A SI value obtained above zero (+ve value) will indicate that the mineral is oversaturated with respect to the solution, and it tends to precipitate from the groundwater, but it will not dissolve. An SI value of zero will indicate that a mineral is in equilibrium with the solution, i.e., it will neither precipitate nor dissolve [33,34]. However, [35] mentioned that the equilibrium state of the solution and the rock is within SI +/− 5% Ks. This assumption implies that the groundwater chemistry is considered to be in a state where the concentrations of dissolved ions are balanced, such that they neither significantly exceed nor fall far below the saturation levels where precipitation or dissolution of minerals would occur.
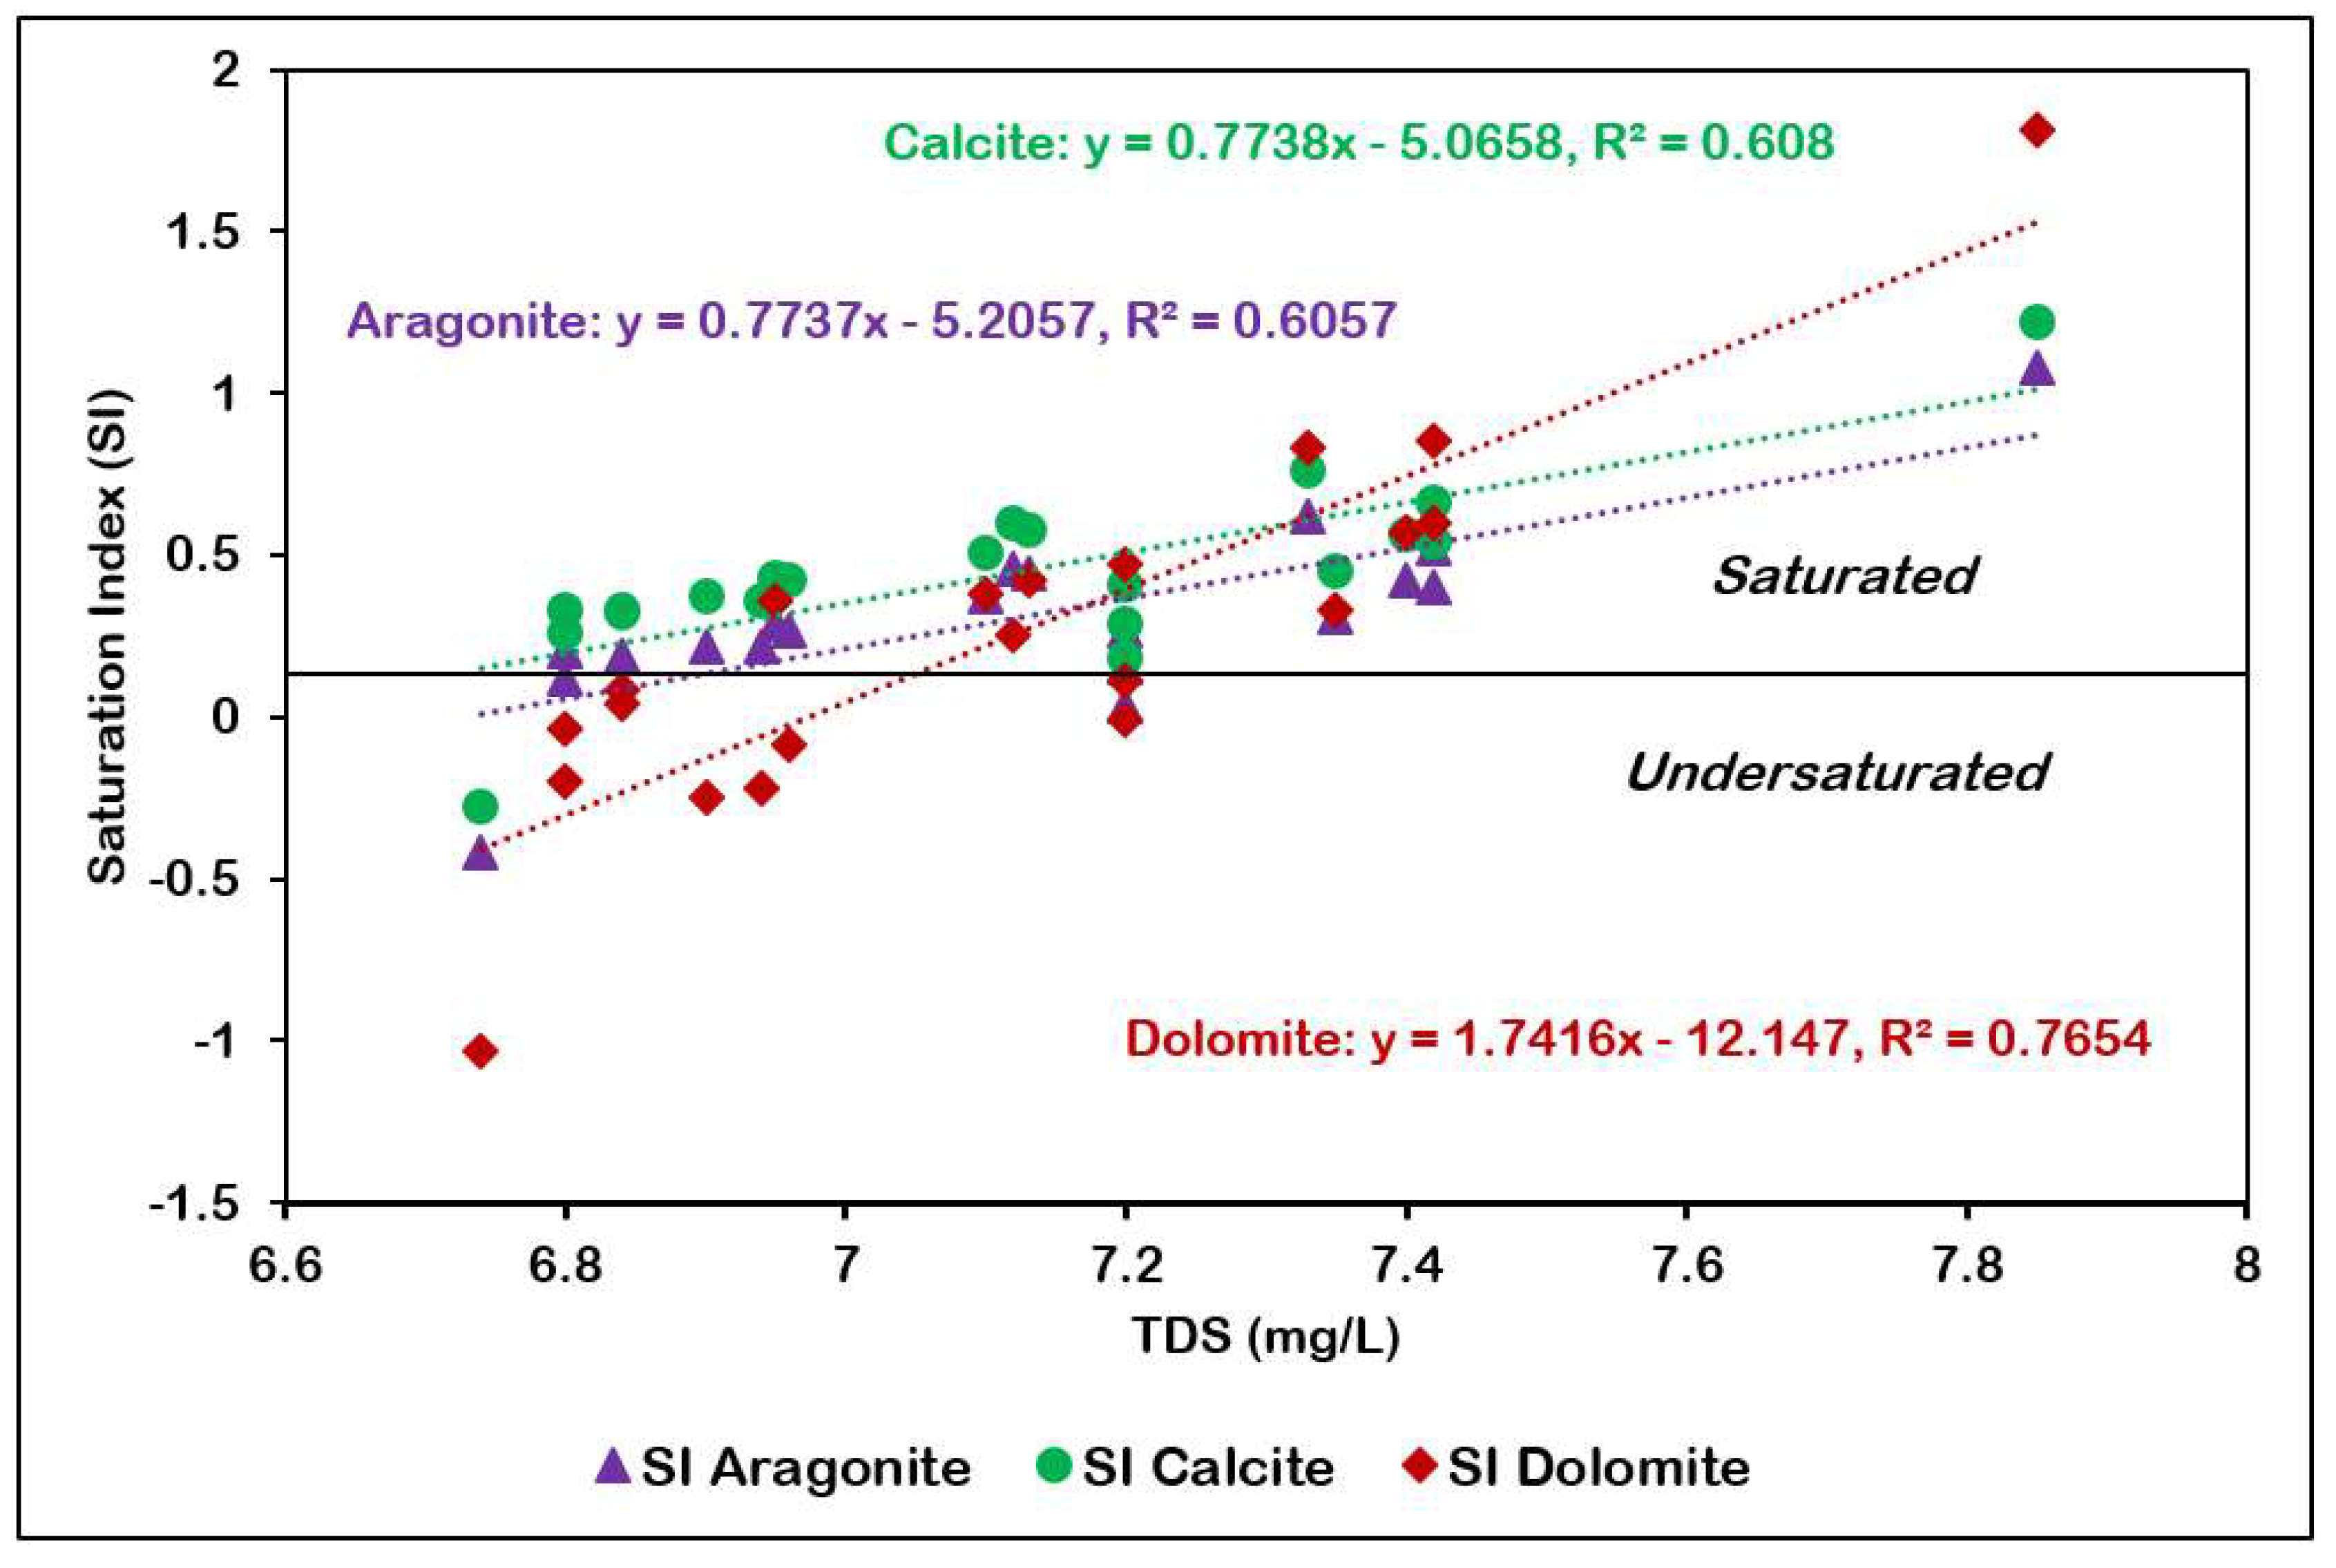
The saturation indices (SI) calculated for anhydrite, aragonite, calcite, dolomite, gypsum, and halite across 21 groundwater samples (Table 4) show the equilibrium conditions of these minerals within the aquifer system. Negative SI values indicate undersaturation, suggesting potential dissolution, while positive values indicate saturation to supersaturation, implying potential precipitation under current hydrogeochemical conditions. Aragonite, calcite and dolomite (carbonate minerals) are present in the oversaturated state. Carbonate minerals are present in the solution form in case of higher pCO2 and lower pH. The plot of SI of calcite, aragonite and dolomite against pH show increasing oversaturation with the increase in pH (Figure 12). The undersaturated conditions observed for Anhydrite, gypsum, and halite in the groundwater samples suggest a geochemical environment that is susceptible to mineral dissolution processes.
Table 4.
SI values of the different dissolved mineral species in groundwater.
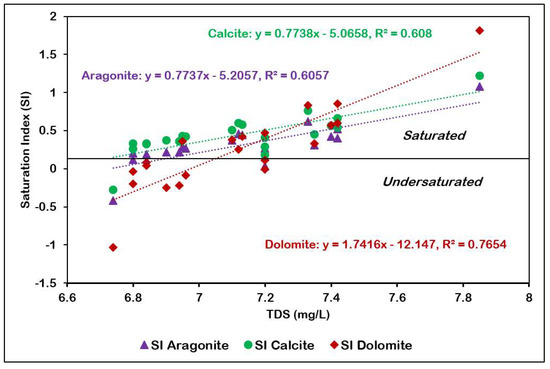
Figure 12.
pH versus SI of aragonite, calcite, and dolomite.
The calcium carbonate equilibrium reaction is given as follows:
Ca2+ + 2HCO−3→CaCO3 + CO2 + H2O
Calcium carbonate precipitation is stimulated by (a) increasing the calcium or bicarbonate concentration, (b) decreasing the CO2 concentration, (c) increasing the temperature, and (d) increasing the pH (more alkaline solution) [36]. Arid desert environments are not favorable for karst development because of extremely low rainfall, the absence of a soil profile, and sparse vegetation leading to low soil carbon dioxide levels and high rates of evaporation [37]. Of the three carbonate minerals, calcite has the highest average saturation index, followed by aragonite and dolomite. Despite being highly soluble, calcite can precipitate from groundwater when conditions lead to supersaturation.
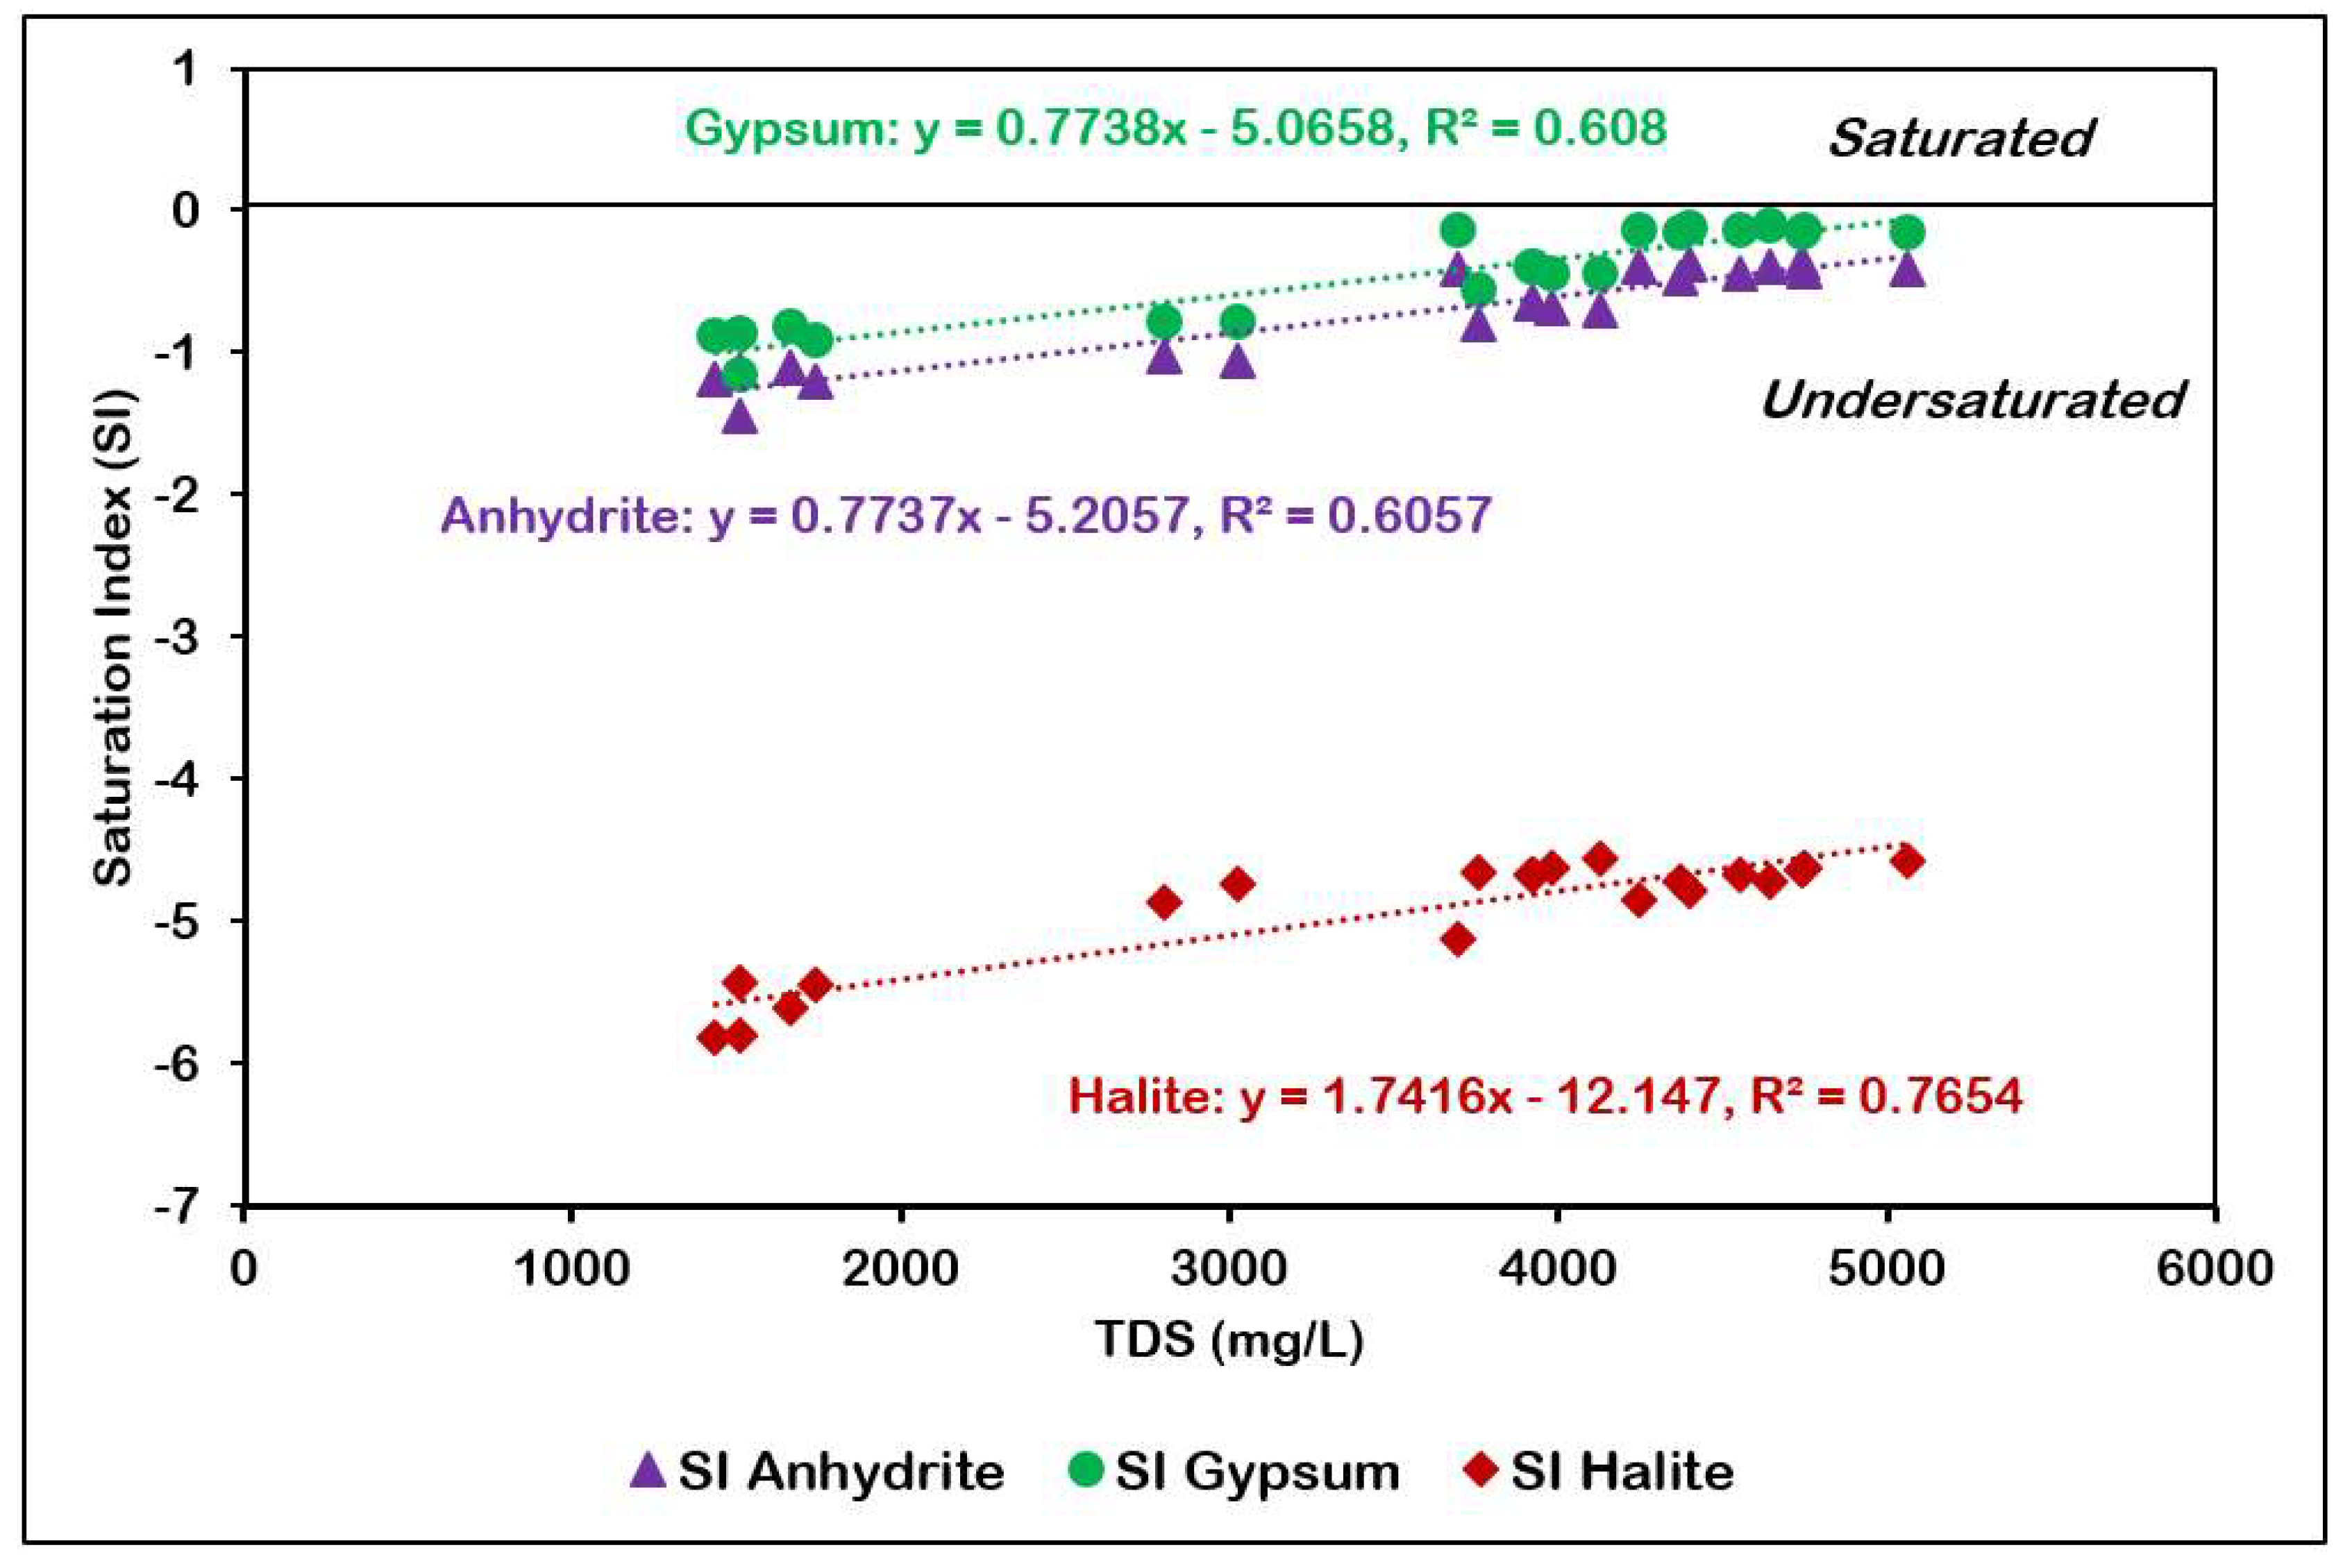
The saturation index of gypsum, anhydrite, and halite have been plotted against TDS in Figure 13. The minerals are undersaturated in groundwater and show a strong positive correlation with TDS. The undersaturated state of gypsum is indicative of the fact that the groundwater is capable of dissolving more gypsum. Gypsum/anhydrite dissolution from the Hith Formation underlying the Sulaiy formation is responsible for the presence of Ca2+ and SO42− in the groundwater. The average value of the saturation index is the inverse of their solubility in groundwater and, in this study, are in roughly the following order: halite (−4.93), gypsum (−0.46), anhydrite (−0.73), calcite (0.44), aragonite (0.3) and dolomite (0.25).

Figure 13.
TDS versus SI of anhydrite, gypsum, and halite.
4.7. Correlation Analysis
The degree of relation which exists between the variables is measured by the correlation coefficient. Correlation analysis is a descriptive technique that is used to estimate the degree of similarity between two variables [38]. The value of (r) ranges from −1 to 1. Correlation values (r) > ±0.7 indicate strong correlation, whereas r values between ±0.5 and ±0.7 show moderate correlation [39].
All the parameters were normalized before the correlation analysis was carried out. The Pearson correlation has been shown in Table 5. TDS and Ca2+ have strong correlation with Na+, HCO3−, Cl−, and SO42−. Most of the parameters have a positive correlation with one another, demonstrating a close relationship between them. Since TDS is the sum of all dissolved constituents in groundwater, it was obvious to see its strong correlation with most of the major ions.
Table 5.
Correlation matrix of physiochemical constituents of groundwater sample. **. Correlation is significant at the 0.01 level (2-tailed). *. Correlation is significant at the 0.05 level (2-tailed).
The dissolutions of gypsum and halite are the key processes that influence groundwater chemistry. The strong correlation between Na+ and Cl implies that the halite dissolution is the main source of these ions in the groundwater. Though the major ions also show relatively strong correlation with each other, it may not be related to the same geochemical processes. For example, the increase in the concentration of Na+ and SO42− may not be from the same sources. Ca2+ and Mg2+ generally show a good correlation, especially in carbonate rocks as Mg2+ can substitute for Ca2+ in most calcites. Ca2+ and SO42− showed a strong correlation mainly due to gypsum or anhydrite dissolution. Potassium and fluoride did not show any correlation with most elements. Nitrate (NO3−) exhibits a moderate positive correlation with bicarbonate (HCO3−) (r = 0.615). In agricultural areas, nitrates from fertilizers can leach into the groundwater, creating slightly acidic conditions. This acidity can enhance the dissolution of carbonate minerals such as calcite in the soil or aquifer matrix, contributing to the observed correlation between nitrate and bicarbonate.
4.8. Cover-Collapse Sinkhole Development in the Area
Cover-collapse sinkholes are geological features that occur in regions underlain by soluble carbonate rocks, such as limestone/dolomite and evaporite minerals. During the mid-Holocene, the region’s climate was humid [40,41], which must have led to substantial infiltration of water through the soil and into the underlying carbonate rock formations. The abundant rainfall and percolating water, enriched with carbon dioxide from the soil, formed a weak carbonic acid solution capable of dissolving the carbonate bedrock over time. This dissolution process created subsurface voids and cavities within the carbonate rock, a characteristic feature of karst landscapes.
As the climate shifted from humid to arid, the hydrological regime of the region changed significantly. The reduction in rainfall decreased the rate of water infiltration, slowing the dissolution of carbonate rocks. However, existing cavities and voids from the earlier humid period remained in the subsurface. These cavities were often supported by a veneer of soil and overlying unconsolidated sediments. As concluded from the Piper diagram, different ionic plots, and saturation indices, the water is oversaturated with respect to calcite. However, the dissolution of more soluble minerals such as gypsum and halite continues, as indicated by the presence of these minerals in the groundwater.
The ongoing dissolution of gypsum and halite from the Hith Formation weakens the structural integrity of the overlying Sulaiy Formation. Gypsum and halite, which are more soluble than calcite, dissolve more readily, enlarging voids and increasing the likelihood of roof collapse. The dissolution creates large, unstable underground cavities beneath a relatively thin cover of sediments and soil. As the roof of a cavity becomes too thin to support the weight of the overlying material, it eventually collapses, resulting in a cover- collapse sinkhole. The arid climate, with its lower water table and lack of substantial recharge, contributes to the instability of these sinkholes.
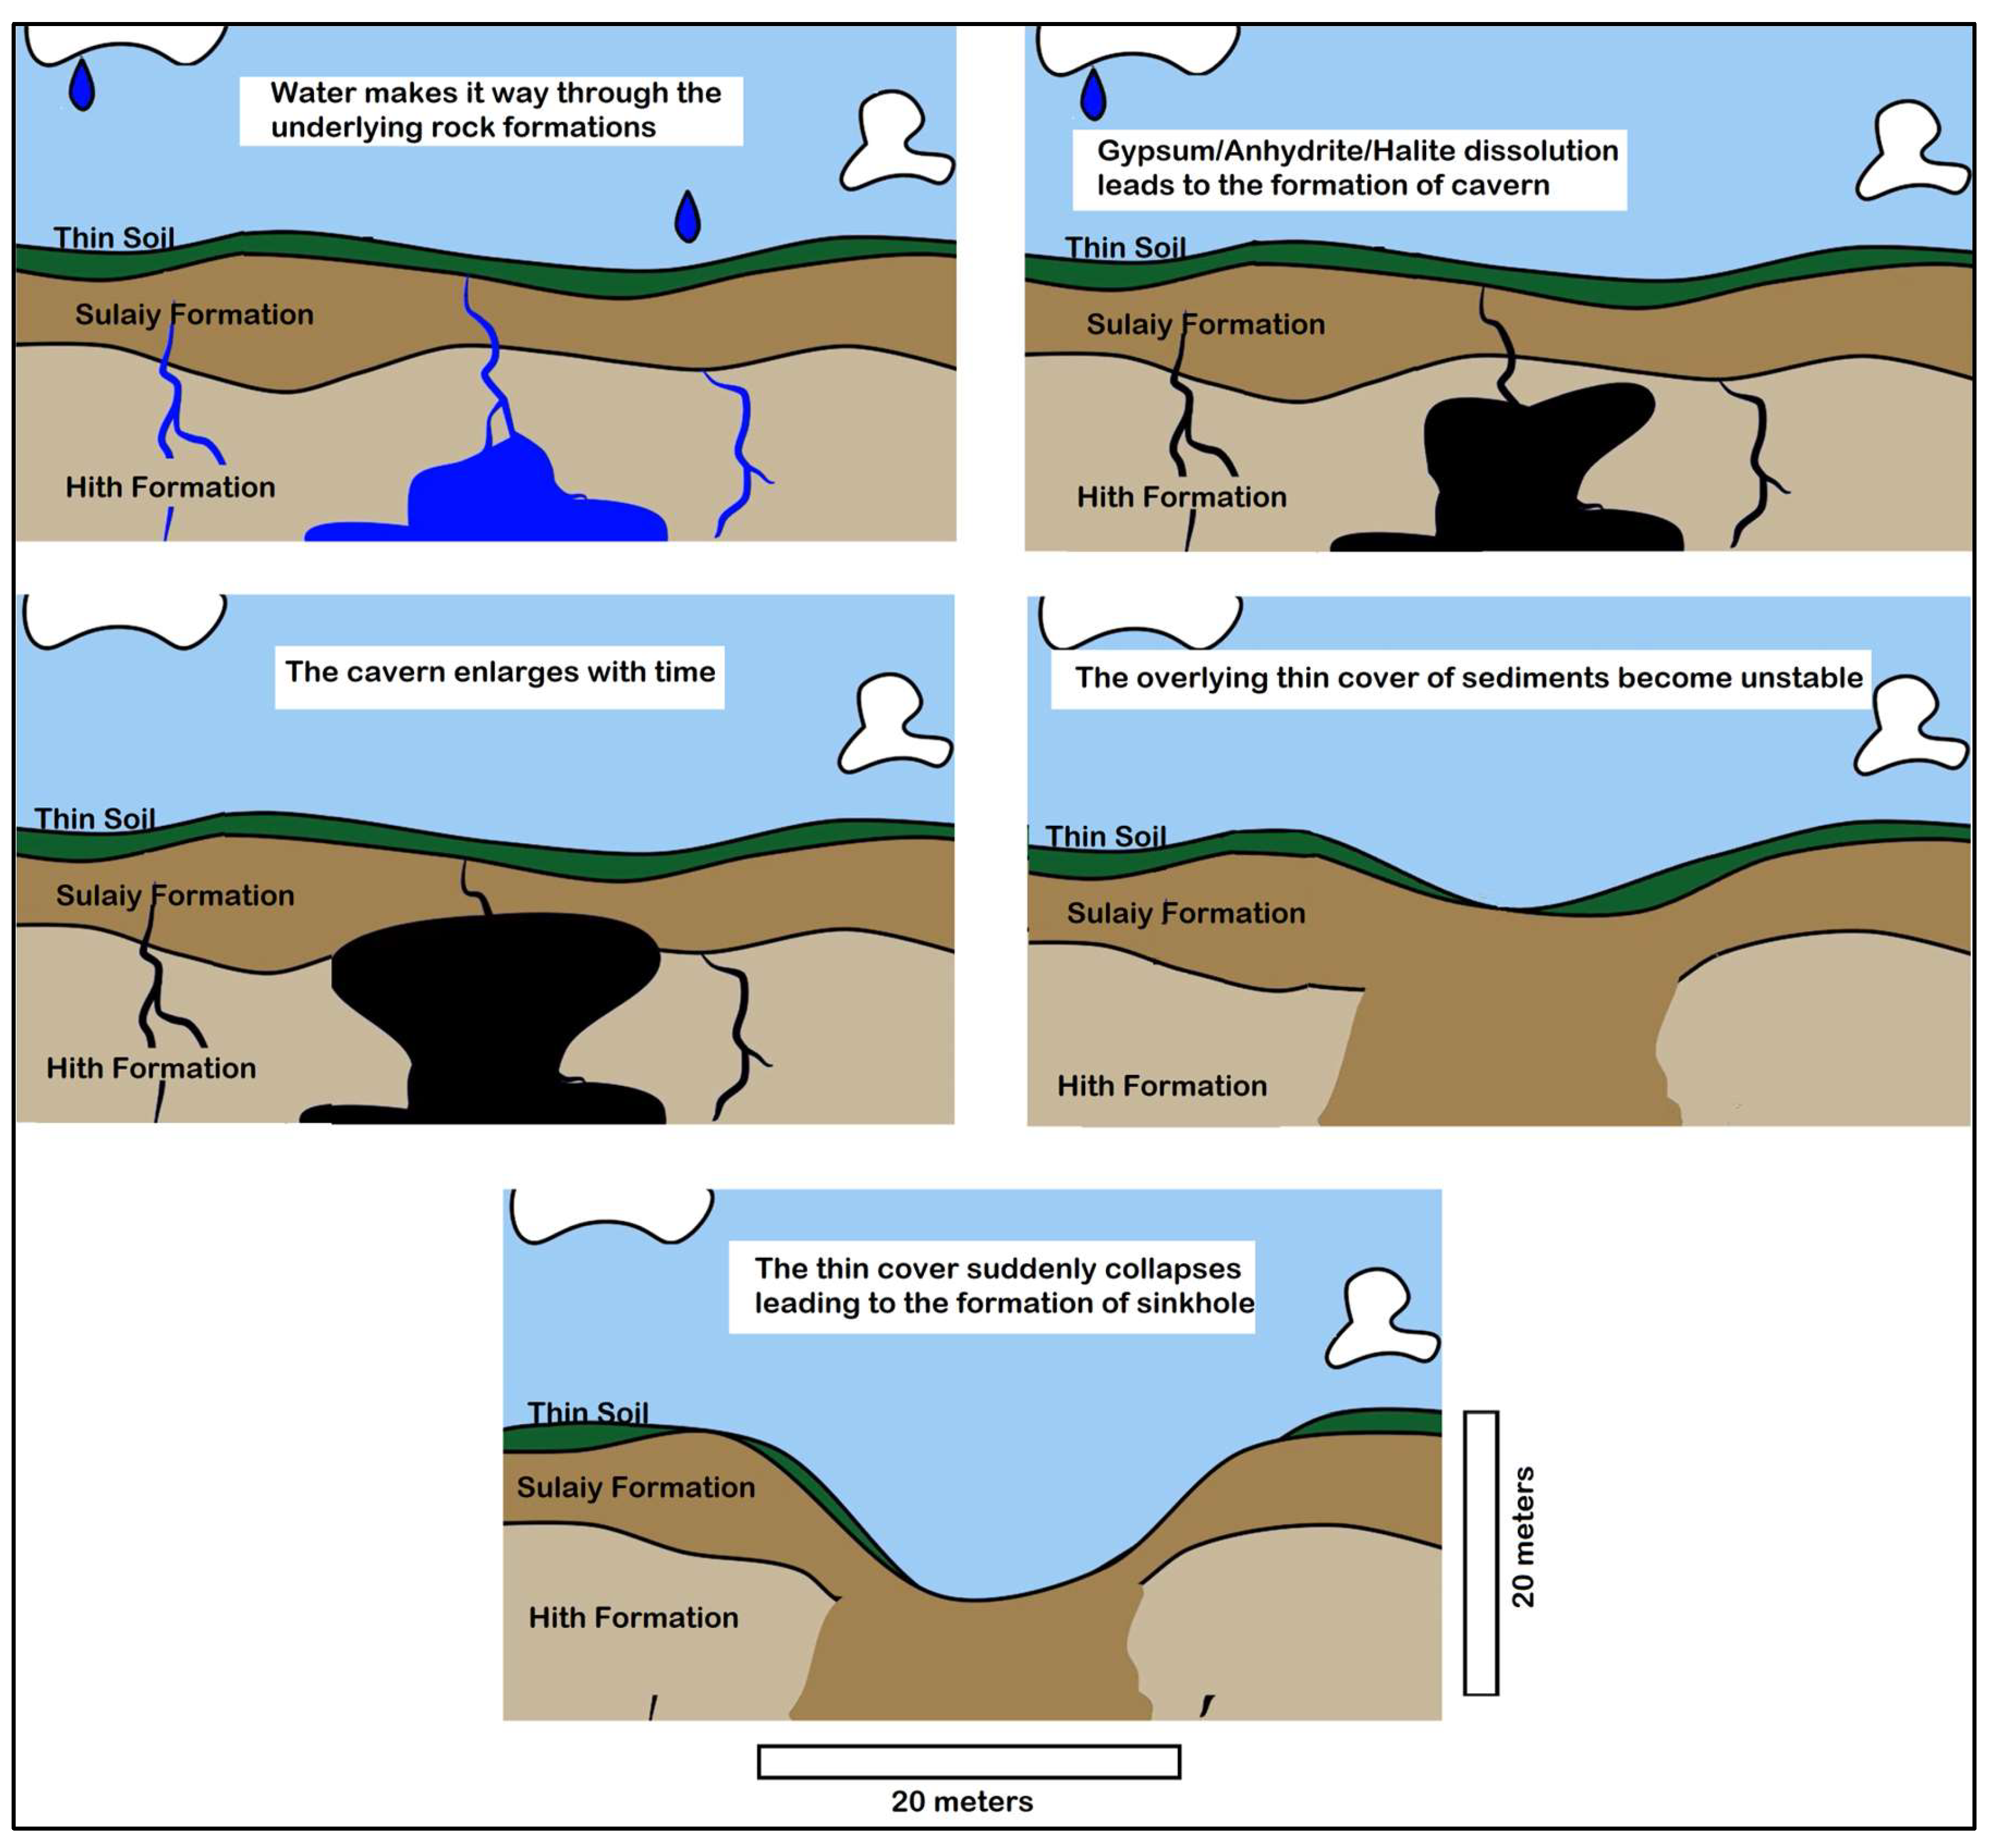
Observations indicate that these sinkholes can manifest in a matter of minutes, emphasizing the suddenness and potential for significant landscape changes associated with this geological process. The study area shows evidence of the rapid and dramatic nature of cover-collapse sinkholes (Figure 14). Figure 15 shows the process leading to the development of the cover-collapse sinkhole. The process can be triggered by additional factors such as heavy rains (which, although rare, can temporarily increase the weight of the overburden), or human activities such as drilling and construction.
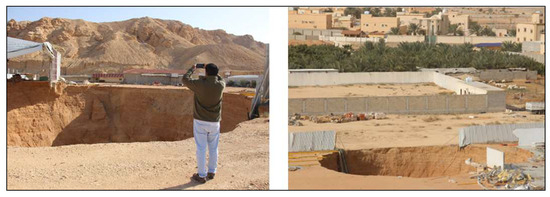
Figure 14.
Cover-collapse sink hole in the study area (24.4621409° N, 47.0062545° E).
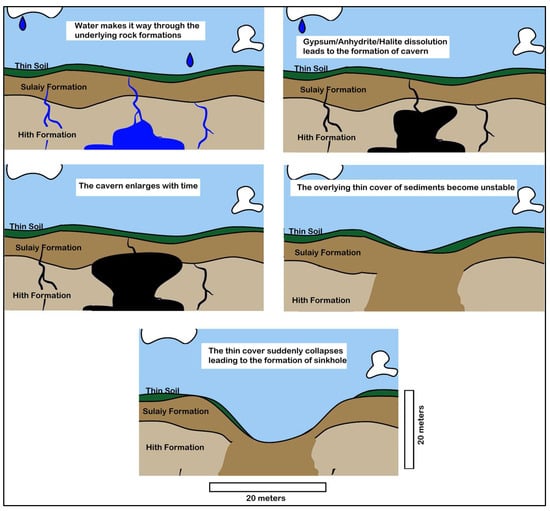
Figure 15.
Development of a cover-collapse sink hole in the study area (modified from https://youtu.be/TbiJOSkn9tE?si=5cfViC7enyJMg-LO, accessed on 1 July 2024).
5. Conclusions
The geological and hydrochemical investigations provide an understanding about the interaction between the geology and groundwater chemistry in the study area. Analyses of rock samples from the Hith and Sulaiy formations show compositional variations, including laminated anhydrites in the Hith Formation and bioturbated limestones in the Sulaiy Formation. These formations have undergone dissolution processes, resulting in fractures, brecciation, foliation, and cavities.
The transition from a humid climate during the mid-Holocene to the current arid conditions has significantly influenced karstification processes. The humid period facilitated substantial infiltration of water, leading to the dissolution of carbonate rocks and the formation of subsurface voids. The current arid climate has stopped the dissolution of carbonate minerals (calcite/aragonite/dolomite), causing them to start precipitating instead. Meanwhile, the dissolution of more soluble minerals like gypsum and halite continues. This ongoing dissolution weakens the subsurface structure, creating conditions conducive to cover-collapse sinkholes.
Hydrochemical analysis, including the assessment of pH, electric conductivity, TDS, and major ion concentrations, supports the findings of mineral dissolution and precipitation processes. The Piper trilinear diagram and Gibbs plots illustrate the geochemical evolution of groundwater, showing the dominance of rock–water interaction in influencing groundwater chemistry. The saturation indices for various minerals indicate that while carbonate minerals are oversaturated and tend to precipitate, gypsum, anhydrite, and halite remain undersaturated, promoting their dissolution.
Correlation analysis shows significant relationships between major ions, highlighting the significance of mineral dissolution, particularly of gypsum and halite, in shaping groundwater composition. Elevated levels of nitrates in groundwater, likely due to agricultural activities, is a matter of concern and needs to be closely monitored. The presence of secondary openings in the Sulaiy Formation can lead to a rapid leaching of nitrates to the groundwater.
The combined geological and hydrochemical evidence explains the processes leading to cover-collapse sinkholes in the study area. Past humid conditions initiated the formation of subsurface cavities, while the current arid climate and ongoing dissolution of soluble minerals have created a subsurface environment that is prone to sudden collapses.
A detailed mapping of all the cavities in the region through extensive geological field work, integrating it with remote sensing studies and geophysical investigation, is required, as undetected subsurface cavities can be a potential hazard for civil construction. The presence of cavities and underground dissolution pathways is a potential source of groundwater pollution from anthropogenic activities mainly agriculture, therefore periodic monitoring for groundwater quality is recommended.
Author Contributions
M.H.A.-H. was responsible for the data interpretation scientific editing and reviewing. A.A.-A. was responsible for data collection, analysis and figure preparations. F.K.Z. was responsible for manuscript organization and write-up. All authors have read and agreed to the published version of the manuscript.
Funding
This research was supported and funded by the Researchers Supporting Project (Project No. RSPD2024R781), King Saud University, Riyadh, Saudi Arabia.
Data Availability Statement
Data are contained within the article (The original contributions presented in the study are included in the article, further inquiries can be directed to the corresponding author/s).
Conflicts of Interest
The authors declare that they have no conflicts of interest.
References
- Ford, D.; Williams, P.D. Karst Hydrogeology and Geomorphology; John Wiley & Sons: Hoboken, NJ, USA, 2013. [Google Scholar]
- Li, X.; Zhang, P.; He, Z.; Huang, Z.; Cheng, M.; Guo, L. Identification of Geological Structure Which Induced Heavy Water and Mud Inrush in Tunnel Excavation: A Case Study on Lingjiao Tunnel. Tunn. Undergr. Space Technol. 2017, 69, 203–208. [Google Scholar] [CrossRef]
- Goldscheider, N.; Chen, Z.; Auler, A.S.; Bakalowicz, M.; Broda, S.; Drew, D.; Hartmann, J.; Jiang, G.; Moosdorf, N.; Stevanovic, Z.; et al. Global Distribution of Carbonate Rocks and Karst Water Resources. Hydrogeol. J. 2020, 28, 1661–1677. [Google Scholar] [CrossRef]
- Geekiyanage, N.; Goodale, U.M.; Cao, K.; Kitajima, K. Plant Ecology of Tropical and Subtropical Karst Ecosystems. Biotropica 2019, 51, 626–640. [Google Scholar] [CrossRef]
- Kranjc, A. Arid Karst or Karst in Arid Countries. In Proceedings of the 2nd Symposium on Living with Landscapes. 2010. Available online: https://ejecsite.wordpress.com/wp-content/uploads/2016/12/6-2e.pdf (accessed on 2 June 2024).
- Bakalowicz, M. Karst Groundwater: A Challenge for New Resources. Hydrogeol. J. 2005, 13, 148–160. [Google Scholar] [CrossRef]
- Amin, A.A.; Bankher, K.A. Karst Hazard Assessment of Eastern Saudi Arabia. Nat. Hazards 1997, 15, 21–30. [Google Scholar] [CrossRef]
- Hollingsworth, E. Karst Regions of the World (KROW)—Populating Global Karst Datasets and Generating Maps to Advance the Understanding of Karst Occurrence and Protection of Karst Species and Habitats Worldwide; University of Arkansas: Fayetteville, AR, USA, 2009. [Google Scholar]
- Youssef, A.M.; Al-Harbi, H.M.; Gutiérrez, F.; Zabramwi, Y.A.; Bulkhi, A.B.; Zahrani, S.A.; Bahamil, A.M.; Zahrani, A.J.; Otaibi, Z.A.; El-Haddad, B.A. Natural and Human-Induced Sinkhole Hazards in Saudi Arabia: Distribution, Investigation, Causes and Impacts. Hydrogeol. J. 2016, 24, 625–644. [Google Scholar] [CrossRef]
- Wolpert, P.; Bartenbach, M.; Suess, P.; Rausch, R.; Aigner, T.; Le Nindre, Y.M. Facies Analysis and Sequence Stratigraphy of the Uppermost Jurassic–Lower Cretaceous Sulaiy Formation in Outcrops of Central Saudi Arabia. GeoArabia 2015, 20, 67–122. [Google Scholar] [CrossRef]
- Youssef, A.M.; Zabramwi, Y.A.; Gutiérrez, F.; Bahamil, A.M.; Otaibi, Z.A.; Zahrani, A.J. Sinkholes Induced by Uncontrolled Groundwater Withdrawal for Agriculture in Arid Saudi Arabia. Integration of Remote-Sensing and Geophysical (ERT) Techniques. J. Arid Environ. 2020, 177, 104132. [Google Scholar] [CrossRef]
- Bamousa, A.O.; Memesh, A.M.; Dini, S.M. Morphotectonic Development of Mesozoic Carbonates and Evaporites of Ath-Thumamah Depression in Central Arabia. Carbonates Evaporites 2014, 29, 65–72. [Google Scholar] [CrossRef]
- Almazroui, M. Calibration of TRMM Rainfall Climatology over Saudi Arabia During 1998–2009. Atmos. Res. 2011, 99, 400–414. [Google Scholar] [CrossRef]
- Steineke, M.; Bramkamp, R.A.; Sander, N.J. Stratigraphy of Eastern Saudi Arabia. In Habitat of Oil: A Symposium; AAPG: Tulsa, OK, USA, 1958; pp. 1294–1329. [Google Scholar]
- Powers, R.W.; Ramirez, L.F.; Redmond, C.D.; Elberg, E.L., Jr. Geology of the Arabian Peninsula–Sedimentary Geology of Saudi Arabia; US Geological Survey Professional Paper, 560-D; US Geological Survey: Reston, VA, USA, 1966. [Google Scholar]
- Schleusener, F.; Kempe, S.; Dirks, H.; Rausch, R.; Göbel, P. The Sinkholes of Layla and Al-Kharj-Insights into the Karst Hydrogeology of the Upper Jurassic of Saudi Arabia. Grundwasser 2013, 18, 271–276. [Google Scholar] [CrossRef]
- Wolpert, P.J.; Bartenbach, M.; Aigner, T.; Wilson, A.O.; Al-Husseini, M.I.; Petrovic, A.; Dirks, H.; Rausch, R. Sedimentological and Sequence-Stratigraphic Analyses of the Tithonian Hith Anhydrite Formation in the Dahal Hit Outcrop, Saudi Arabia. Arab. J. Geosci. 2024, 17, 135. [Google Scholar] [CrossRef]
- Vaslet, D.; Al-Muallem, M.S.; Maddeh, S.S.; Brosse, J.M.; Fourniquet, J.; Breton, J.P.; Le Nindre, Y.M. Explanatory Notes to the Geologic Map of the Ar Riyad Quadrangle, Sheet 24 I, Kingdom of Saudi Arabia; Geosciences Map, GM-121; Saudi Arabian Deputy Ministry for Mineral Resources: Jeddah, Saudi Arabia, 1991; p. 54. [Google Scholar]
- Bamousa, A.O. Tectono-Geomorphic Development of Intra-Continental Cenozoic Depressions within Cretaceous Rocks of the Interior Homocline, Central Arabia. Arab. J. Geosci. 2018, 11, 562. [Google Scholar] [CrossRef]
- MoWE. Ministry of Water and Electricity, Kingdom of Saudi Arabia. Detailed Water Resources Studies of Khuff, Jilh, Minjur Dhruma and Overlying Aquifers, 2014; unpublished report.
- Engel, M.; Brückner, H.; Pint, A.; Wellbrock, K.; Ginau, A.; Voss, P.; Grottker, M.; Klasen, N.; Frenzel, P. The Early Holocene Humid Period in NW Saudi Arabia–Sediments, Microfossils and Palaeo-Hydrological Modelling. Quat. Int. 2012, 266, 13–141. [Google Scholar] [CrossRef]
- Folk, R.L. Spectral Subdivision of Limestone Types. Classification of Carbonate Rocks. In American Association of Petroleum Geologists Memoir I; Ham, W.E., Ed.; American Association of Petroleum Geologists: Tulsa, OK, USA, 1962; pp. 62–84. [Google Scholar]
- Bratcher, J.C.; Kaszuba, J.P.; Herz-Thyhsen, R.J.; Dewey, J.C. Ionic Strength and pH Effects on Water–Rock Interaction in an Unconventional Siliceous Reservoir: On the Use of Formation Water in Hydraulic Fracturing. Energy Fuels 2021, 35, 18414–18429. [Google Scholar] [CrossRef]
- World Health Organization. Guidelines for Drinking-Water Quality, 4th ed.; WHO: Geneva, Switzerland, 2011. [Google Scholar]
- Rahman, A.; Mondal, N.C.; Tiwari, K.K. Anthropogenic Nitrate in Groundwater and Its Health Risks in the View of Background Concentration in a Semi-Arid Area of Rajasthan, India. Sci. Rep. 2021, 11, 9279. [Google Scholar] [CrossRef] [PubMed]
- Brindha, K.; Elango, L. Fluoride in Groundwater: Causes, Implications and Mitigation Measures. Fluoride Prop. Appl. Environ. Manag. 2011, 1, 111–136. [Google Scholar]
- Back, W. Hydrochemical Facies and Ground-Water Flow Patterns in Northern Atlantic Coastal Plain. AAPG Bull. 1960, 44, 1244–1245. [Google Scholar]
- Gibbs, R.J. Mechanisms Controlling World Water Chemistry. Science 1970, 170, 1088–1090. [Google Scholar] [CrossRef]
- Hughes, G.; Naji, N. Sedimentological and Micropalaeontological Evidence to Elucidate Post-Evaporitic Carbonate Palaeoenvironments of the Saudi Arabian Latest Jurassic. Vol. Jurassica 2008, 6, 61–73. [Google Scholar]
- Han, Y.; Wang, G.; Cravotta, C.A.; Hu, W.; Bian, Y.; Zhang, Z.; Liu, Y. Hydrogeochemical Evolution of Ordovician Limestone Groundwater in Yanzhou, North China. Hydrol. Process. 2013, 27, 2247–2257. [Google Scholar] [CrossRef]
- Deutsch, W.J. Groundwater Geochemistry: Fundamentals and Applications to Contamination; CRC Press: Boca Raton, FL, USA, 2020. [Google Scholar]
- Garrels, R.M.; MacKenzie, F.T. Origin of the Chemical Compositions of Some Springs and Lakes; ACS Publications: Washington, DC, USA, 1967. [Google Scholar]
- Truesdell, A.H.; Jones, B.F. WATEQ, a Computer Program for Calculating Chemical Equilibria of Natural Waters. J. Res. U.S. Geol. Surv. 1974, 2, 233–248. [Google Scholar]
- Srinivasamoorthy, K.; Chidambaram, S.; Prasanna, M.V.; Vasanthavihar, M.; Peter, J.; Anandhan, P. Identification of Major Sources Controlling Groundwater Chemistry from a Hard Rock Terrain—A Case Study from Mettur Taluk, Salem District, Tamil Nadu, India. J. Earth Syst. Sci. 2008, 117, 49–58. [Google Scholar] [CrossRef]
- Appelo, C.A.; Postma, D. Geochemistry, Groundwater and Pollution; Balkema: Kalamazoo, MI, USA, 1993. [Google Scholar]
- El-Dessouky, H.T.; Ettouney, H.M. Fundamentals of Salt Water Desalination; Elsevier: Amsterdam, The Netherlands, 2002. [Google Scholar]
- Jennings, J.N. Karst Geomorphology; Blackwell Pub: Hoboken, NJ, USA, 1985. [Google Scholar]
- Mor, S.; Ravindra, K.; Dahiya, R.P.; Chandra, A. Leachate Characterization and Assessment of Groundwater Pollution near Municipal Solid Waste Landfill Site. Environ. Monit. Assess. 2006, 118, 435–456. [Google Scholar] [CrossRef] [PubMed]
- Venkatramanan, S.; Chung, S.Y.; Ramkumar, T.; Gnanachandrasamy, G.; Vasudevan, S. A Multivariate Statistical Approaches on Physicochemical Characteristics of Ground Water in and Around Nagapattinam District, Cauvery Deltaic Region of Tamil Nadu, India. Earth Sci. Res. J. 2013, 17, 97–103. [Google Scholar]
- Enzel, Y.; Kushnir, Y.; Quade, J. The Middle Holocene Climatic Records from Arabia: Reassessing Lacustrine Environments, Shift of ITCZ in Arabian Sea, and Impacts of the Southwest Indian and African Monsoons. Glob. Planet. Change 2015, 129, 69–91. [Google Scholar] [CrossRef]
- Nicholson, S.L.; Pike, A.W.; Hosfield, R.; Roberts, N.; Sahy, D.; Woodhead, J.; Cheng, H.; Edwards, R.L.; Affolter, S.; Leuenberger, M.; et al. Pluvial Periods in Southern Arabia over the Last 11.1 Million-Years. Quat. Sci. Rev. 2020, 229, 106112. [Google Scholar] [CrossRef]


Disclaimer/Publisher’s Note: The statements, opinions and data contained in all publications are solely those of the individual author(s) and contributor(s) and not of MDPI and/or the editor(s). MDPI and/or the editor(s) disclaim responsibility for any injury to people or property resulting from any ideas, methods, instructions or products referred to in the content. |
© 2024 by the authors. Licensee MDPI, Basel, Switzerland. This article is an open access article distributed under the terms and conditions of the Creative Commons Attribution (CC BY) license (https://creativecommons.org/licenses/by/4.0/).