
Terrestrial Heat Flow and Lithospheric Thermal Structure of the Hubao Basin, North Central China

 ,
, 
Abstract
1. Introduction
2. Geological Background
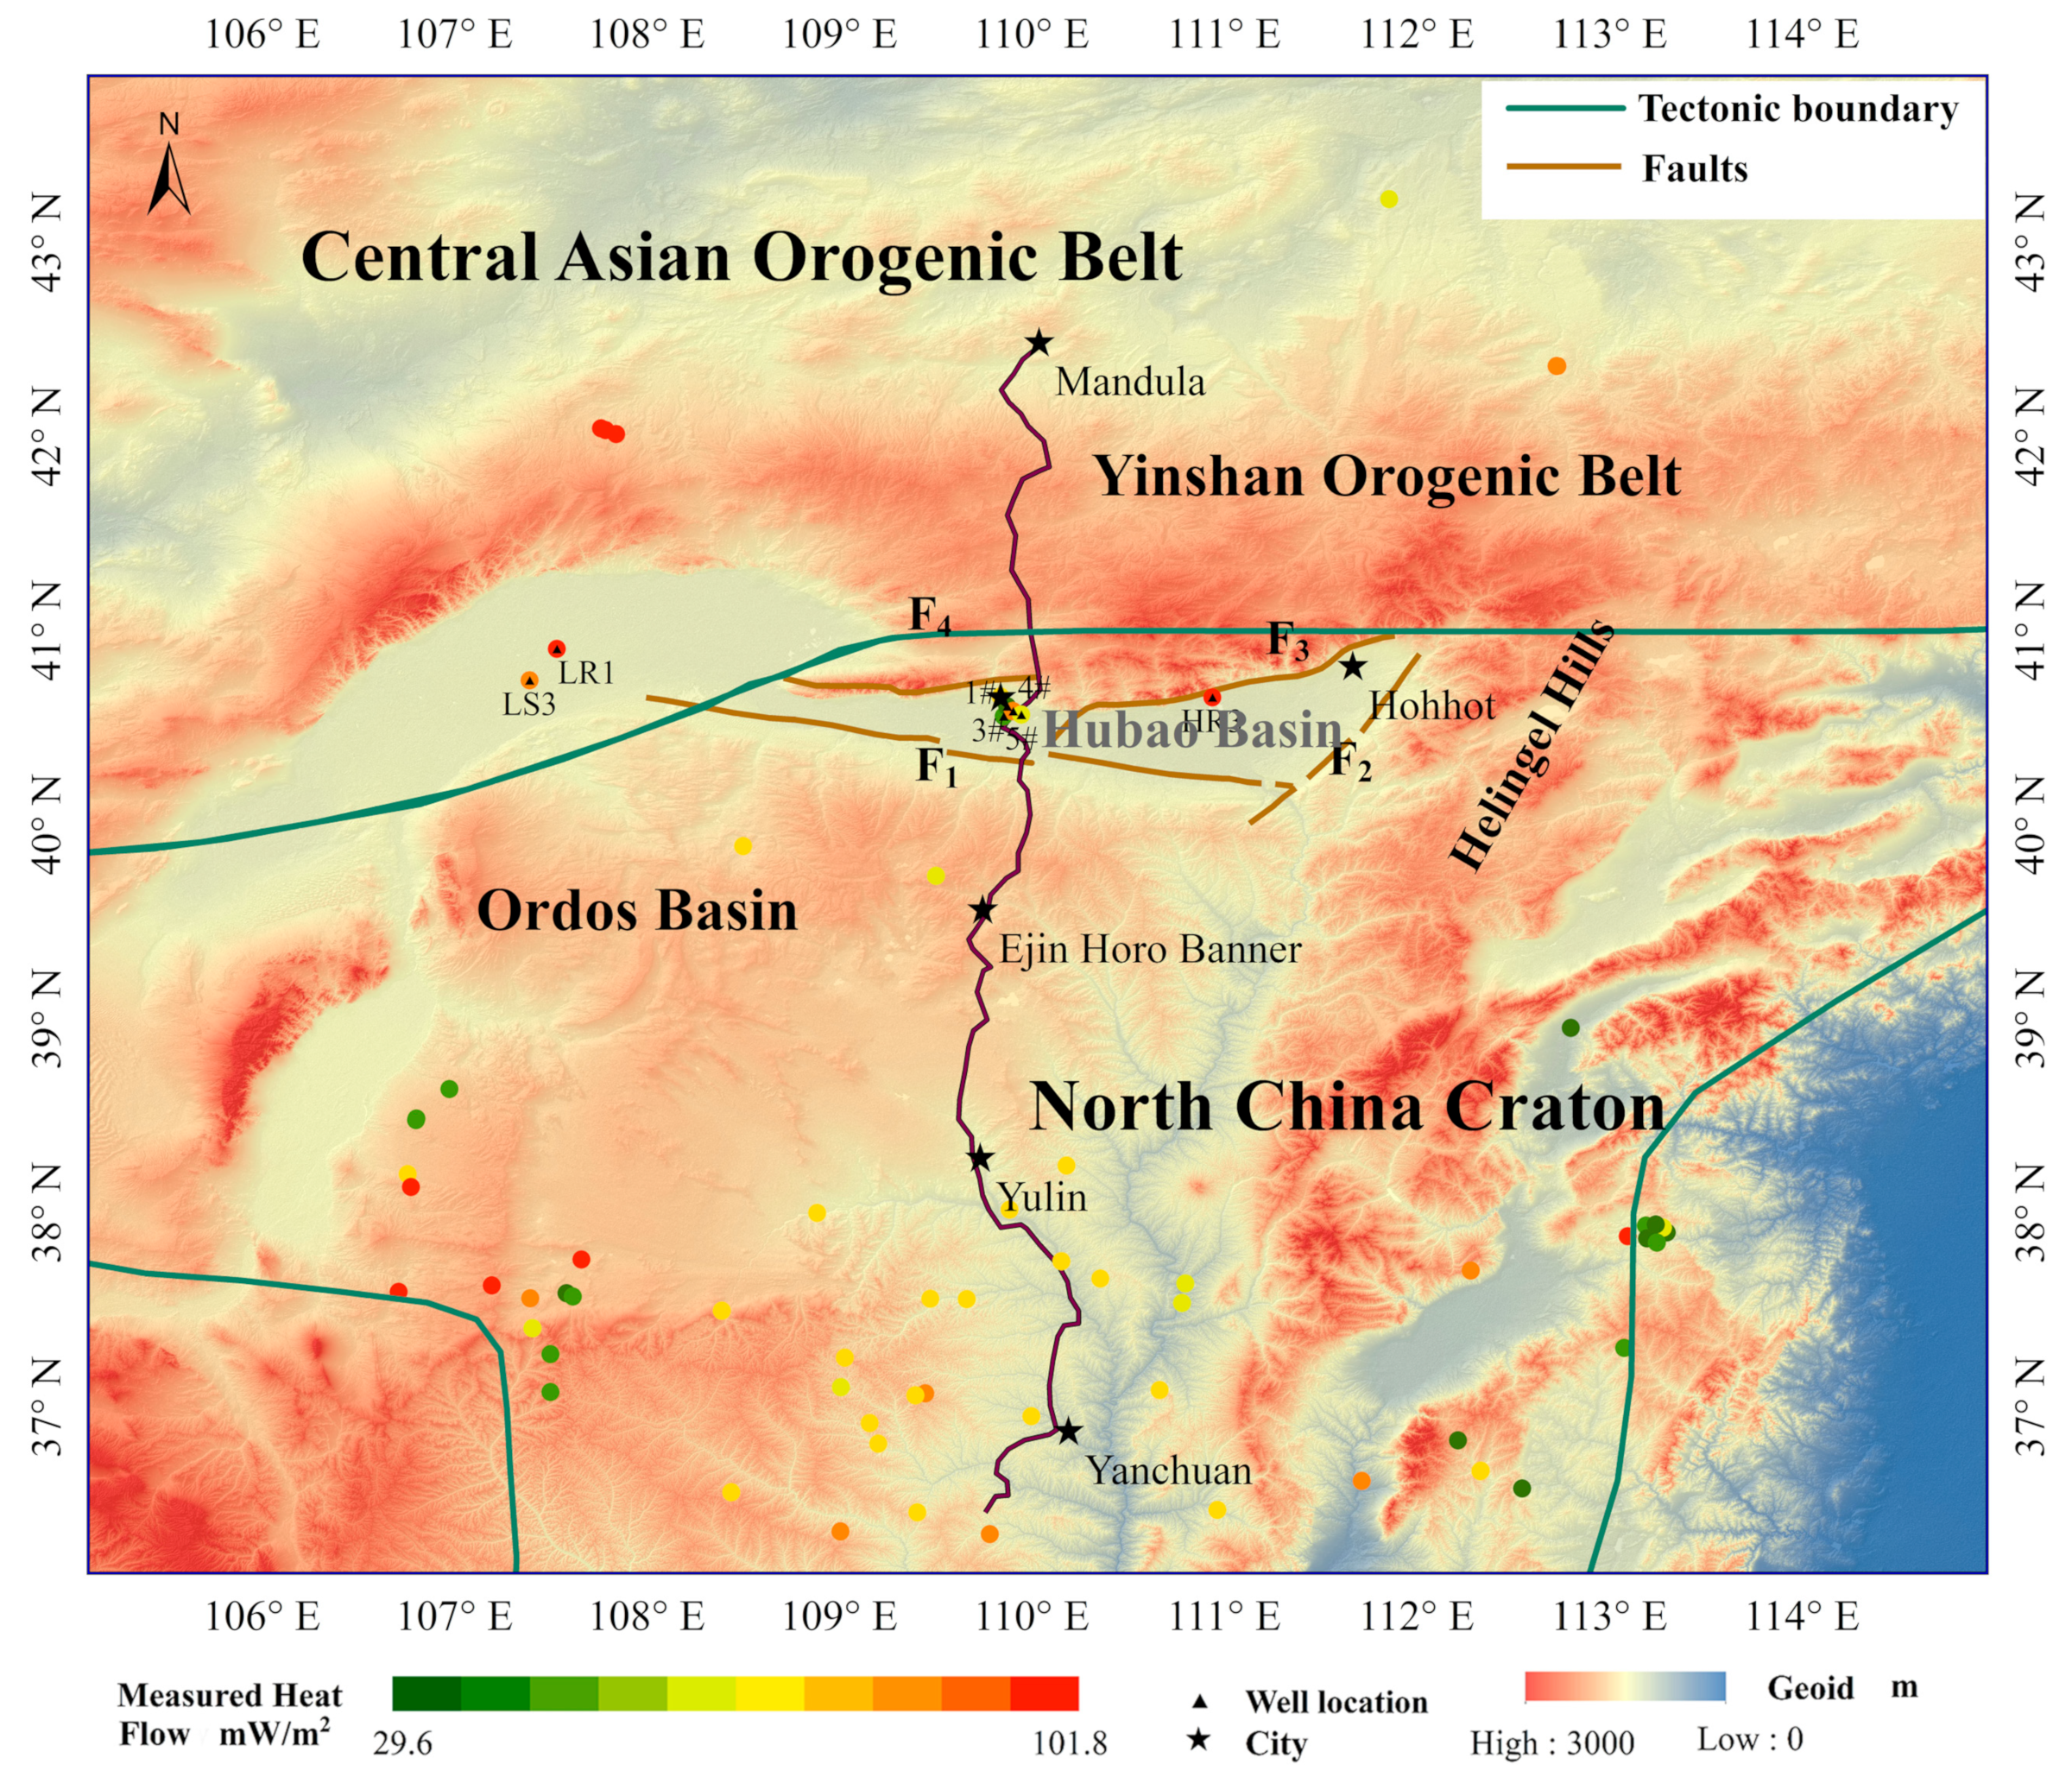
3. Heat Flow
3.1. Borehole Temperature and Geothermal Gradient
3.2. Thermal Conductivity
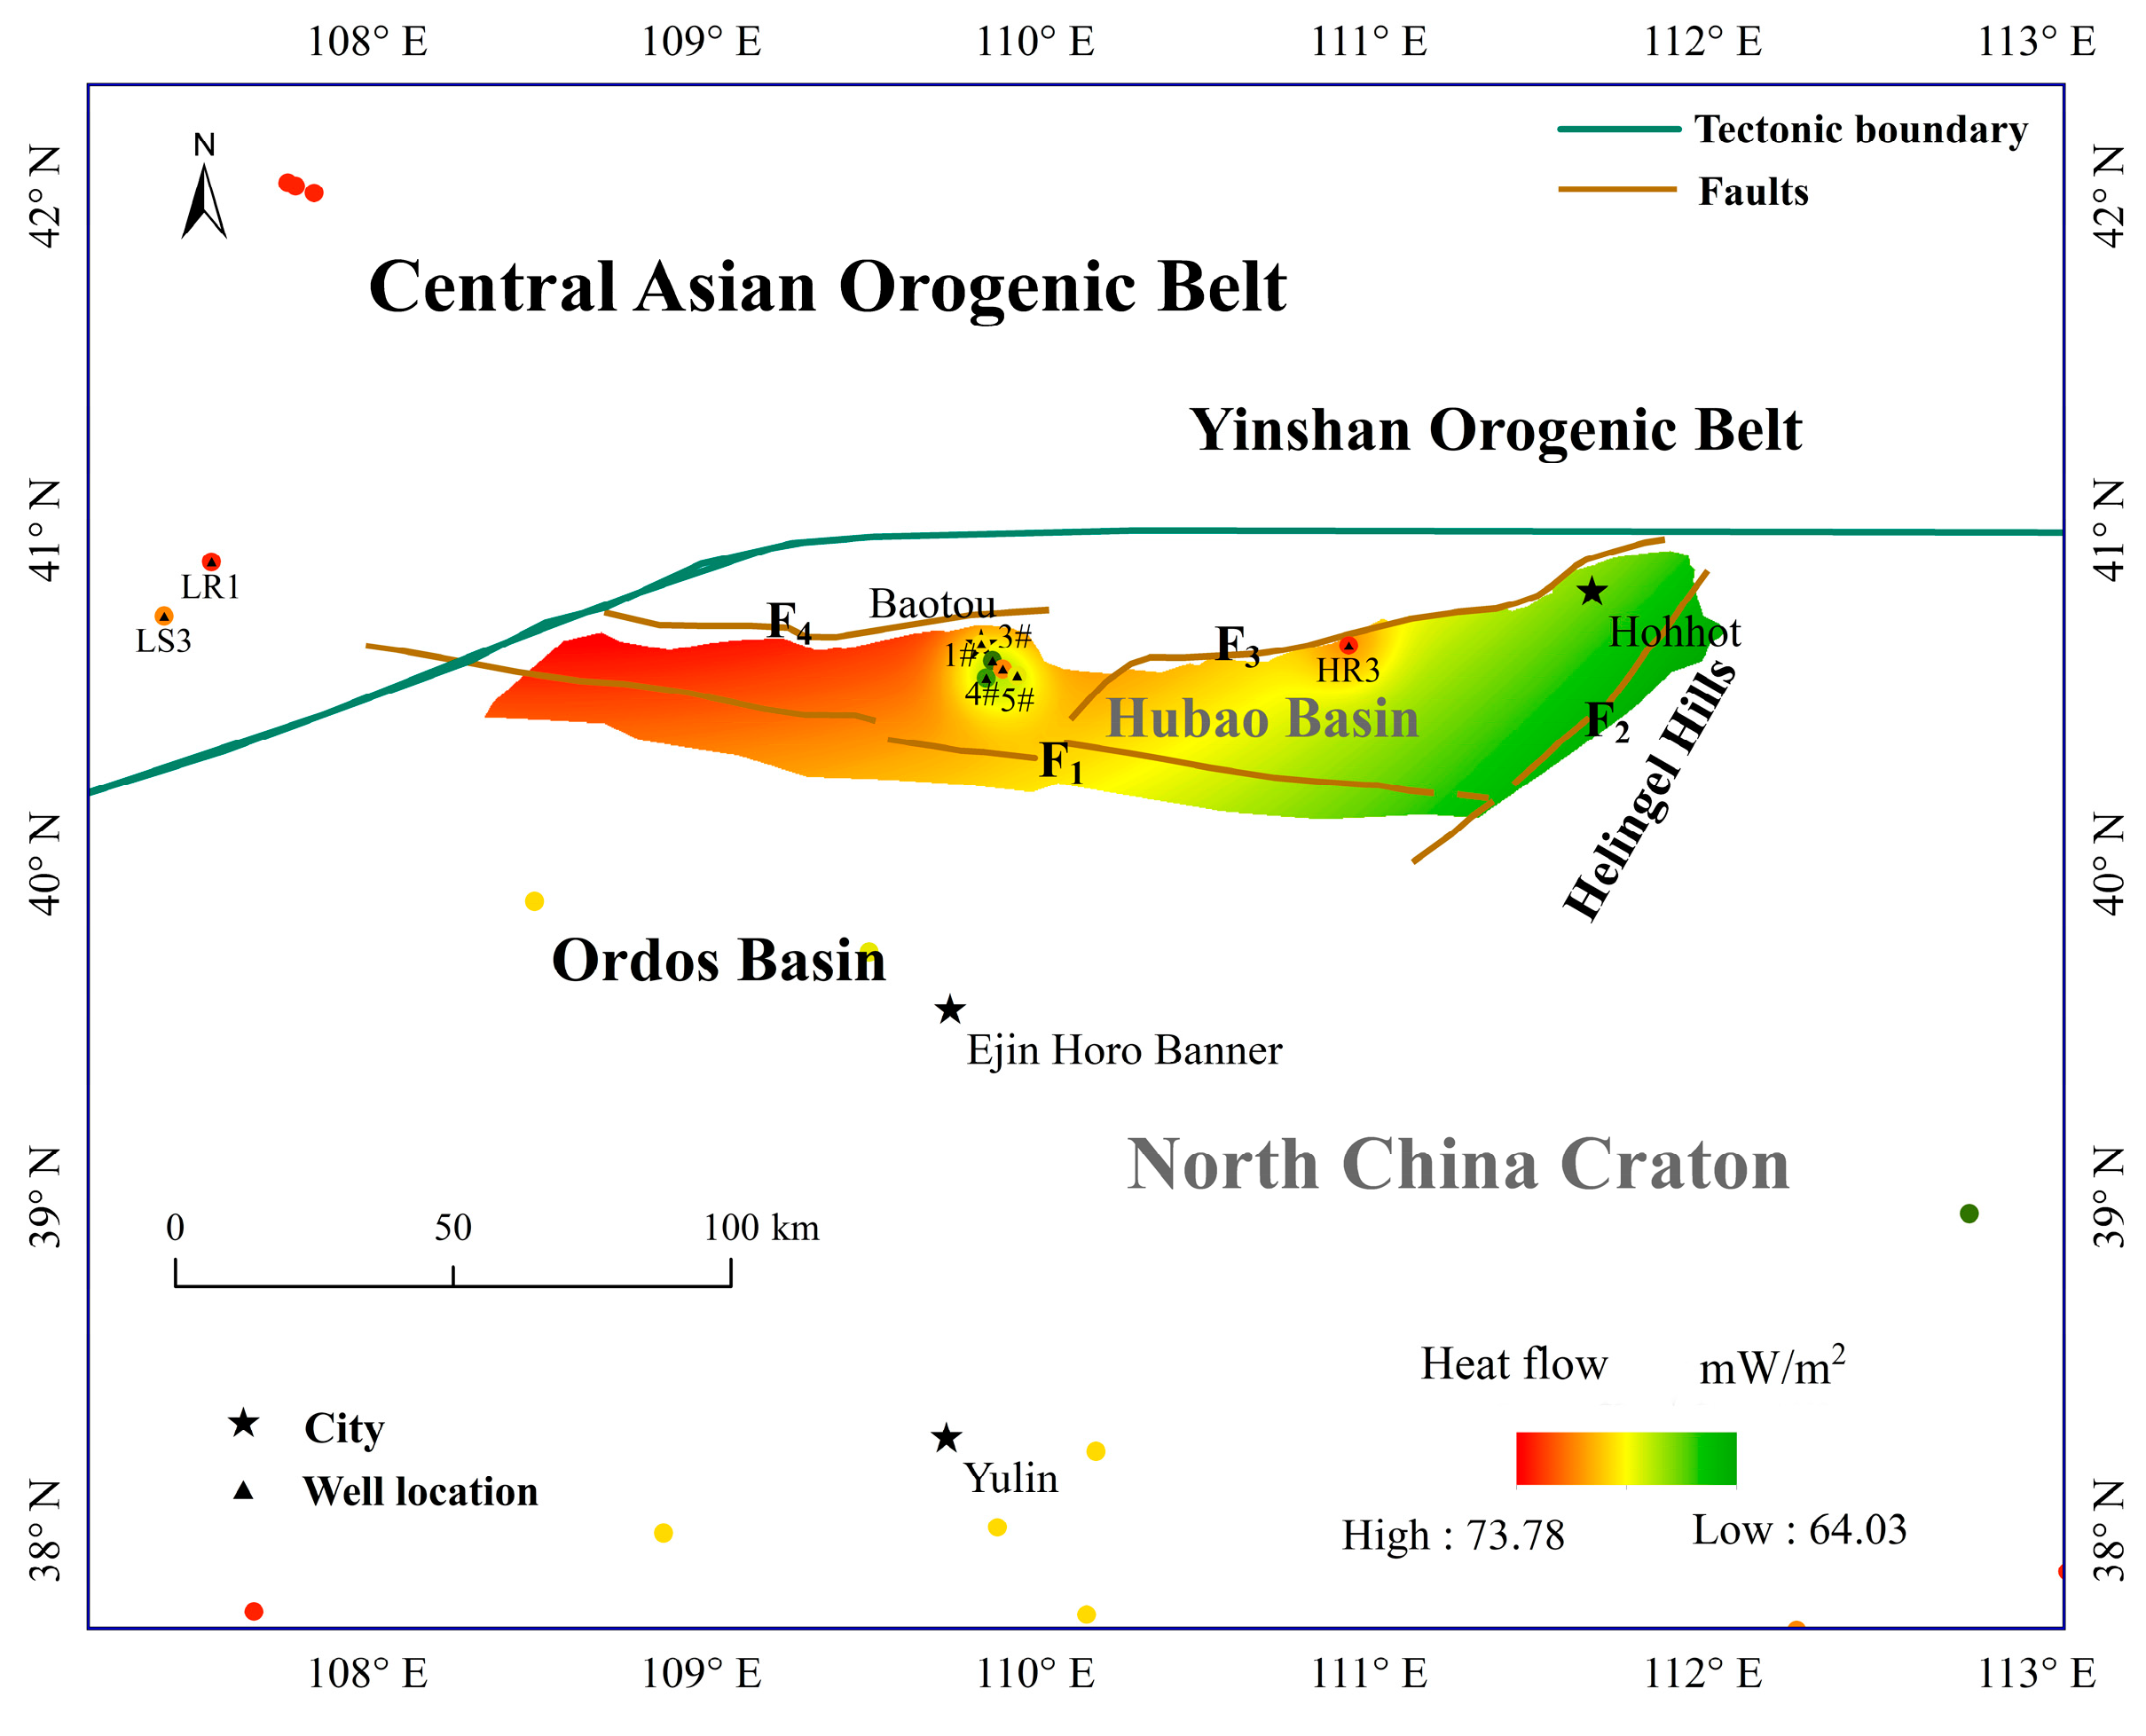
3.3. Heat Flow
4. Simulation of Lithospheric Thermal Structure
4.1. Methods and Data
4.1.1. Methods
4.1.2. Data
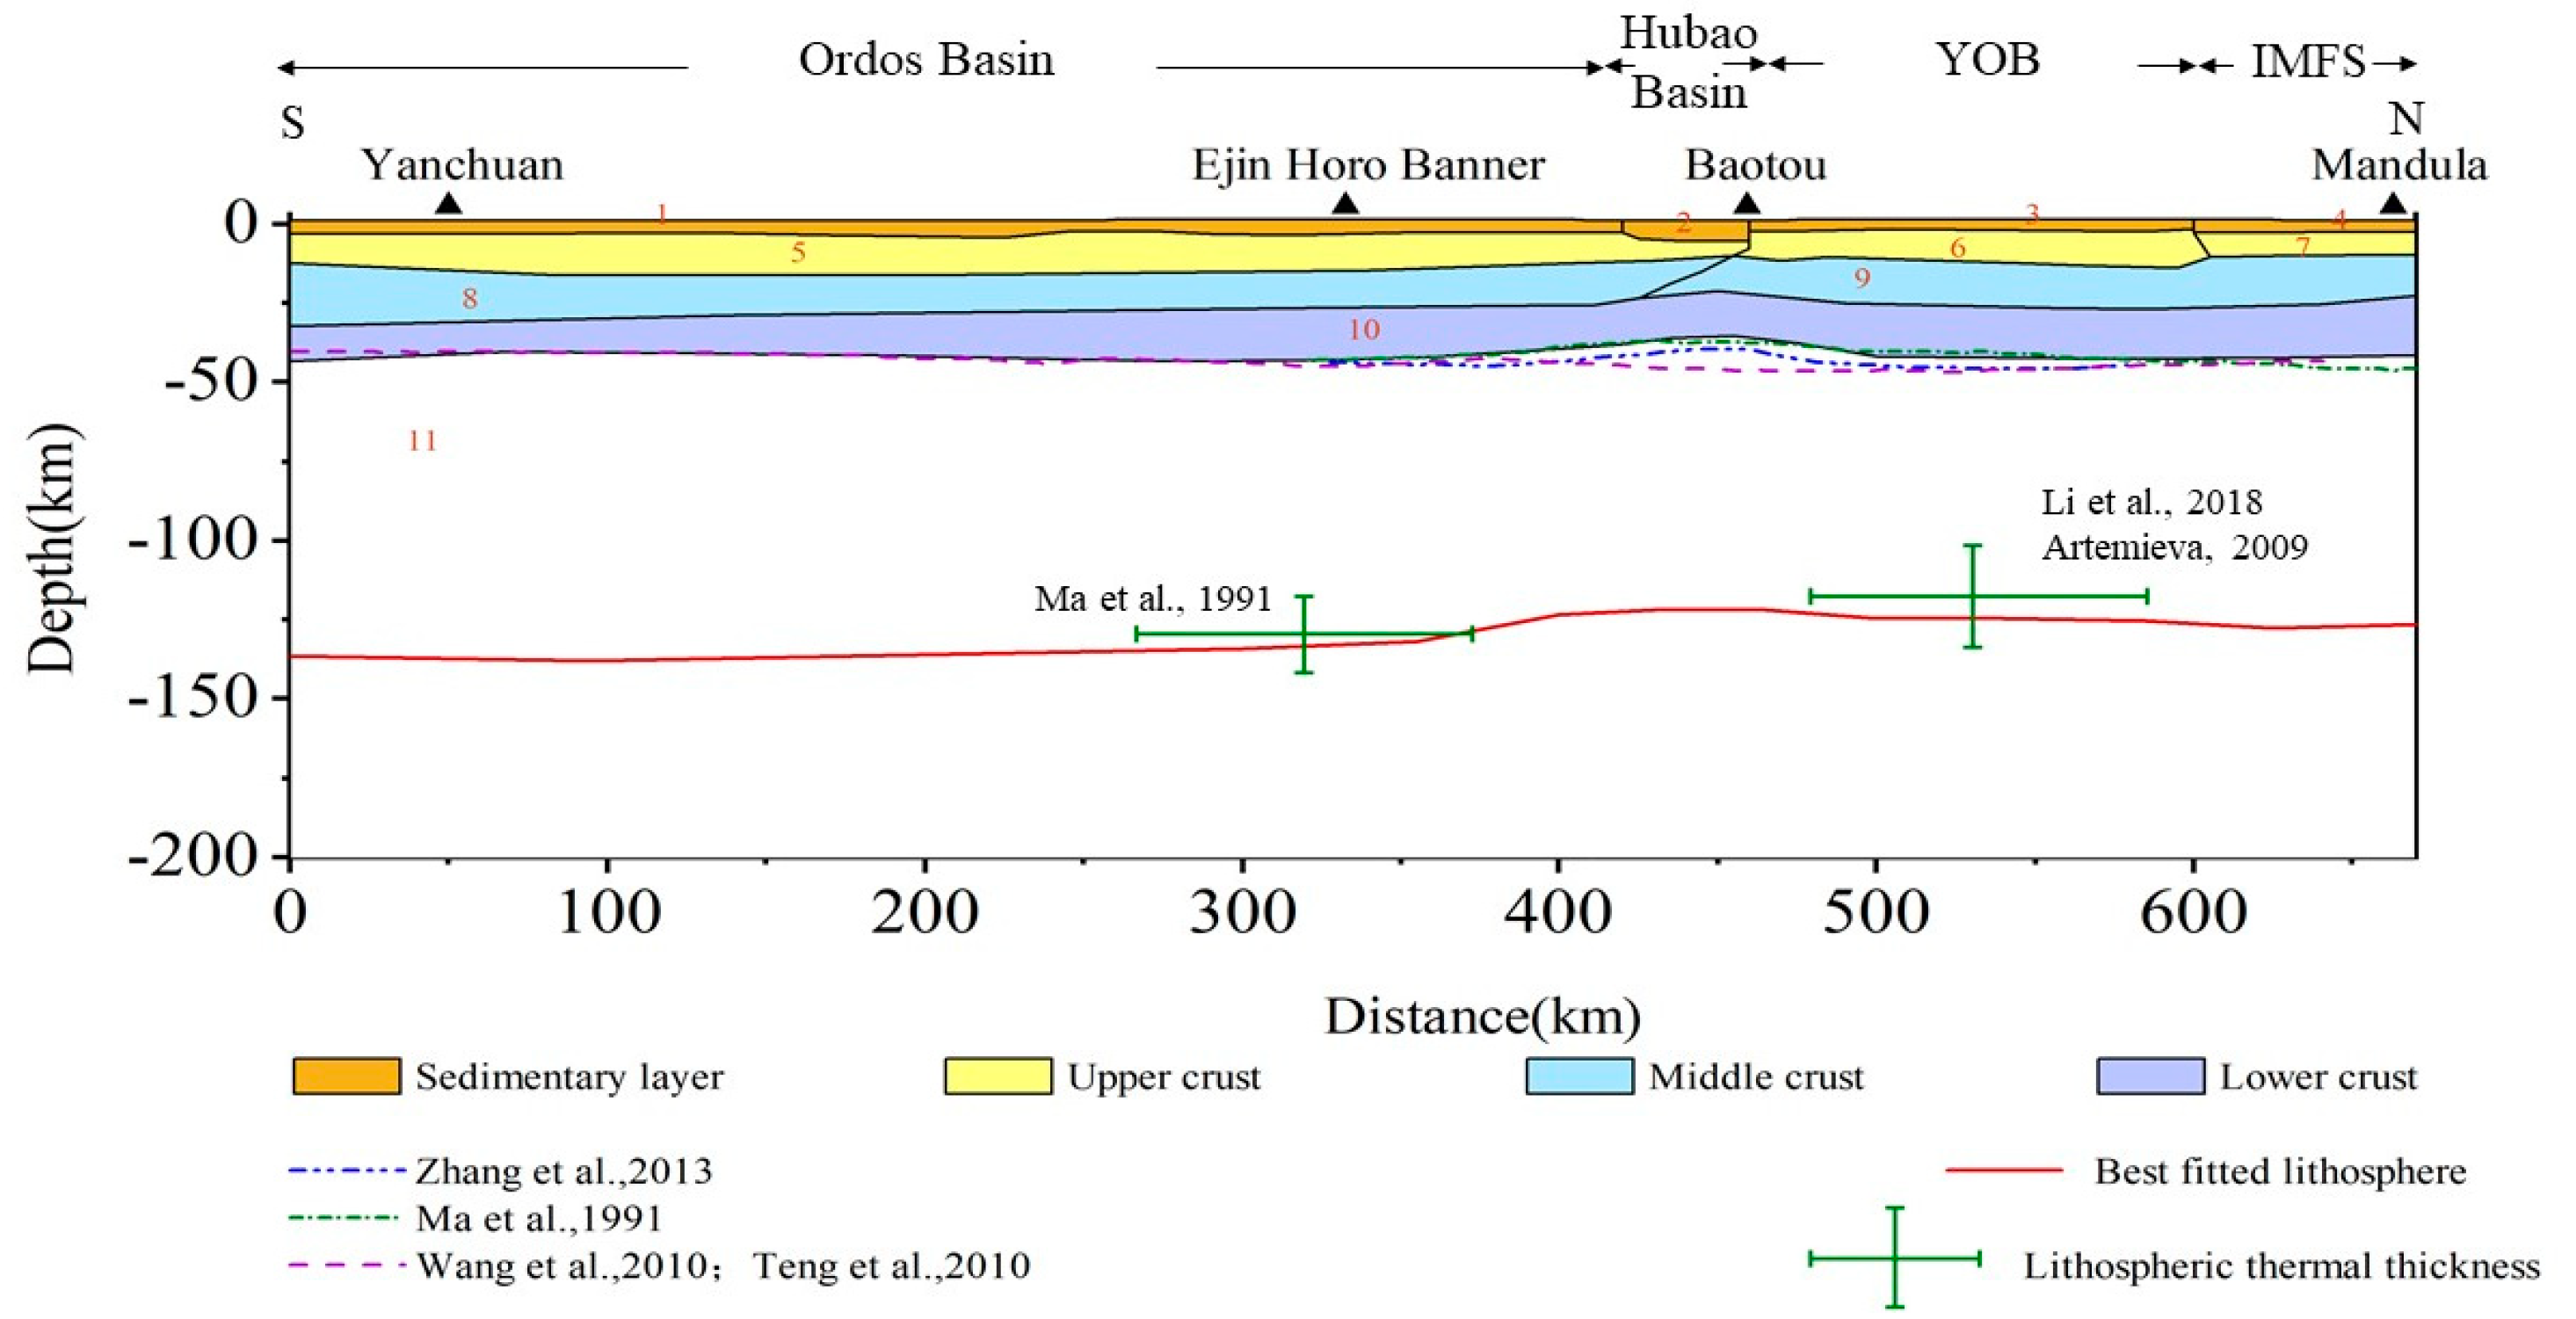
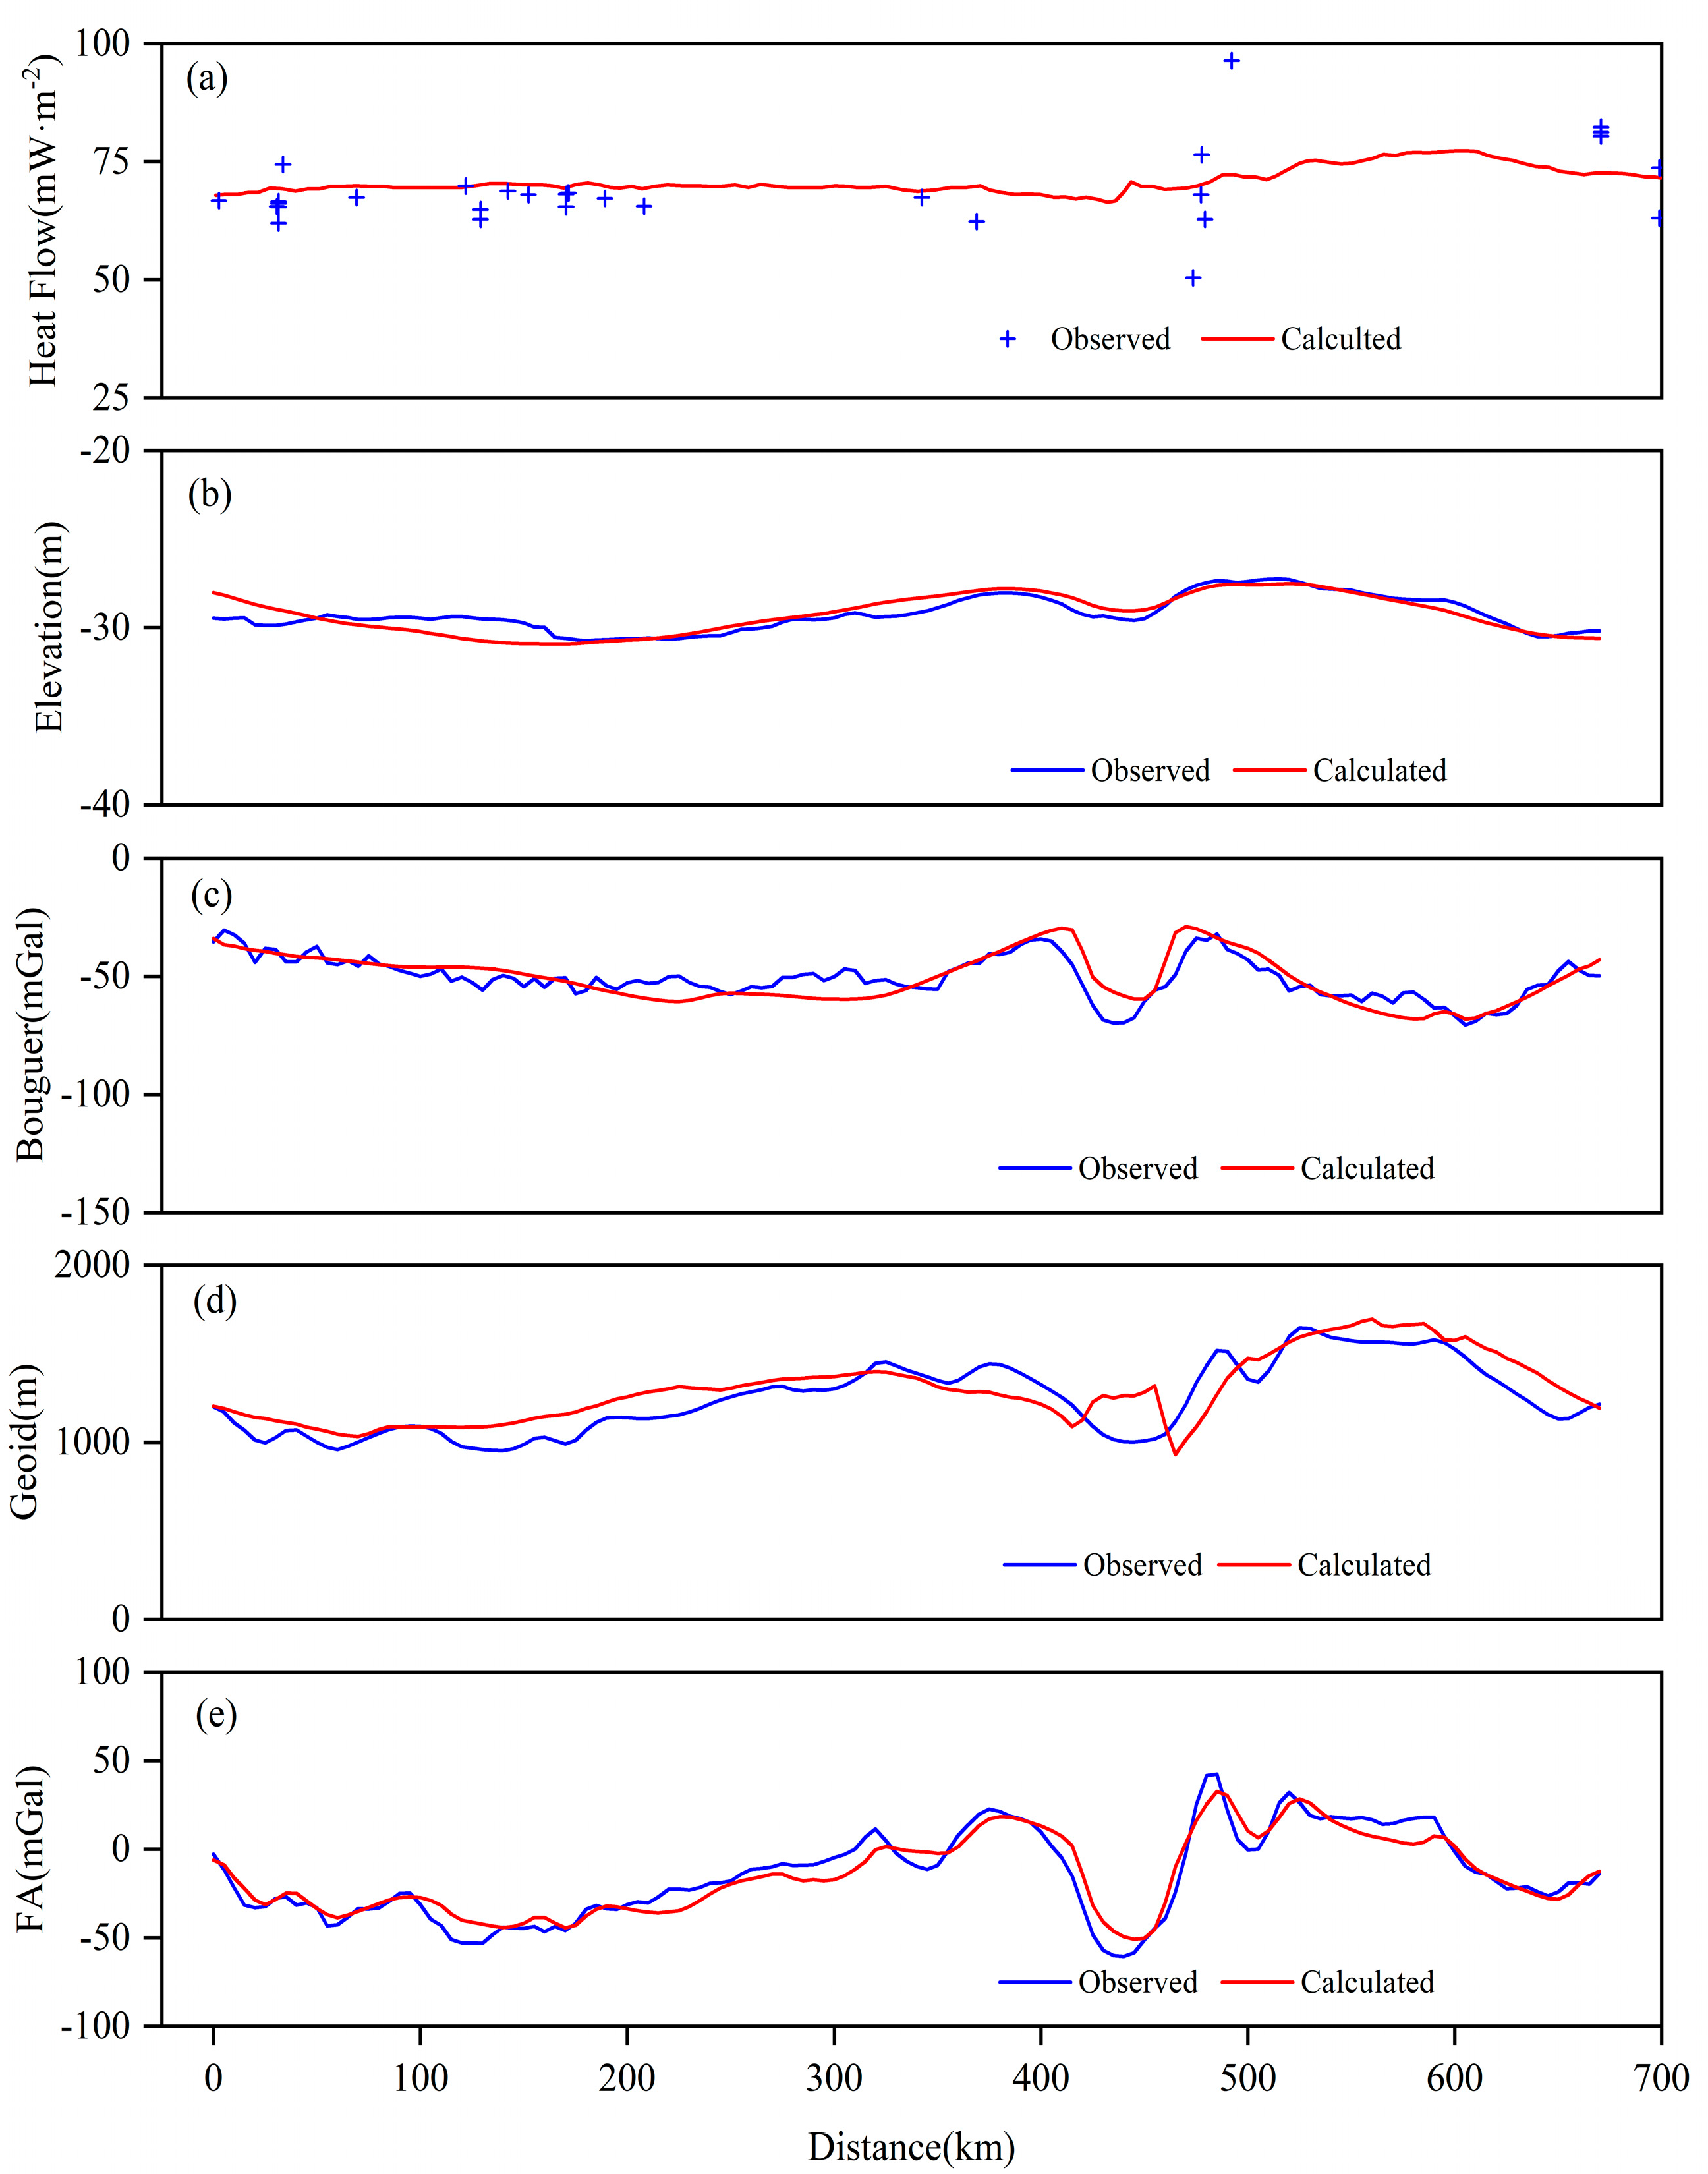
4.1.3. Build Model
4.2. The Thermal Structure of the Lithosphere
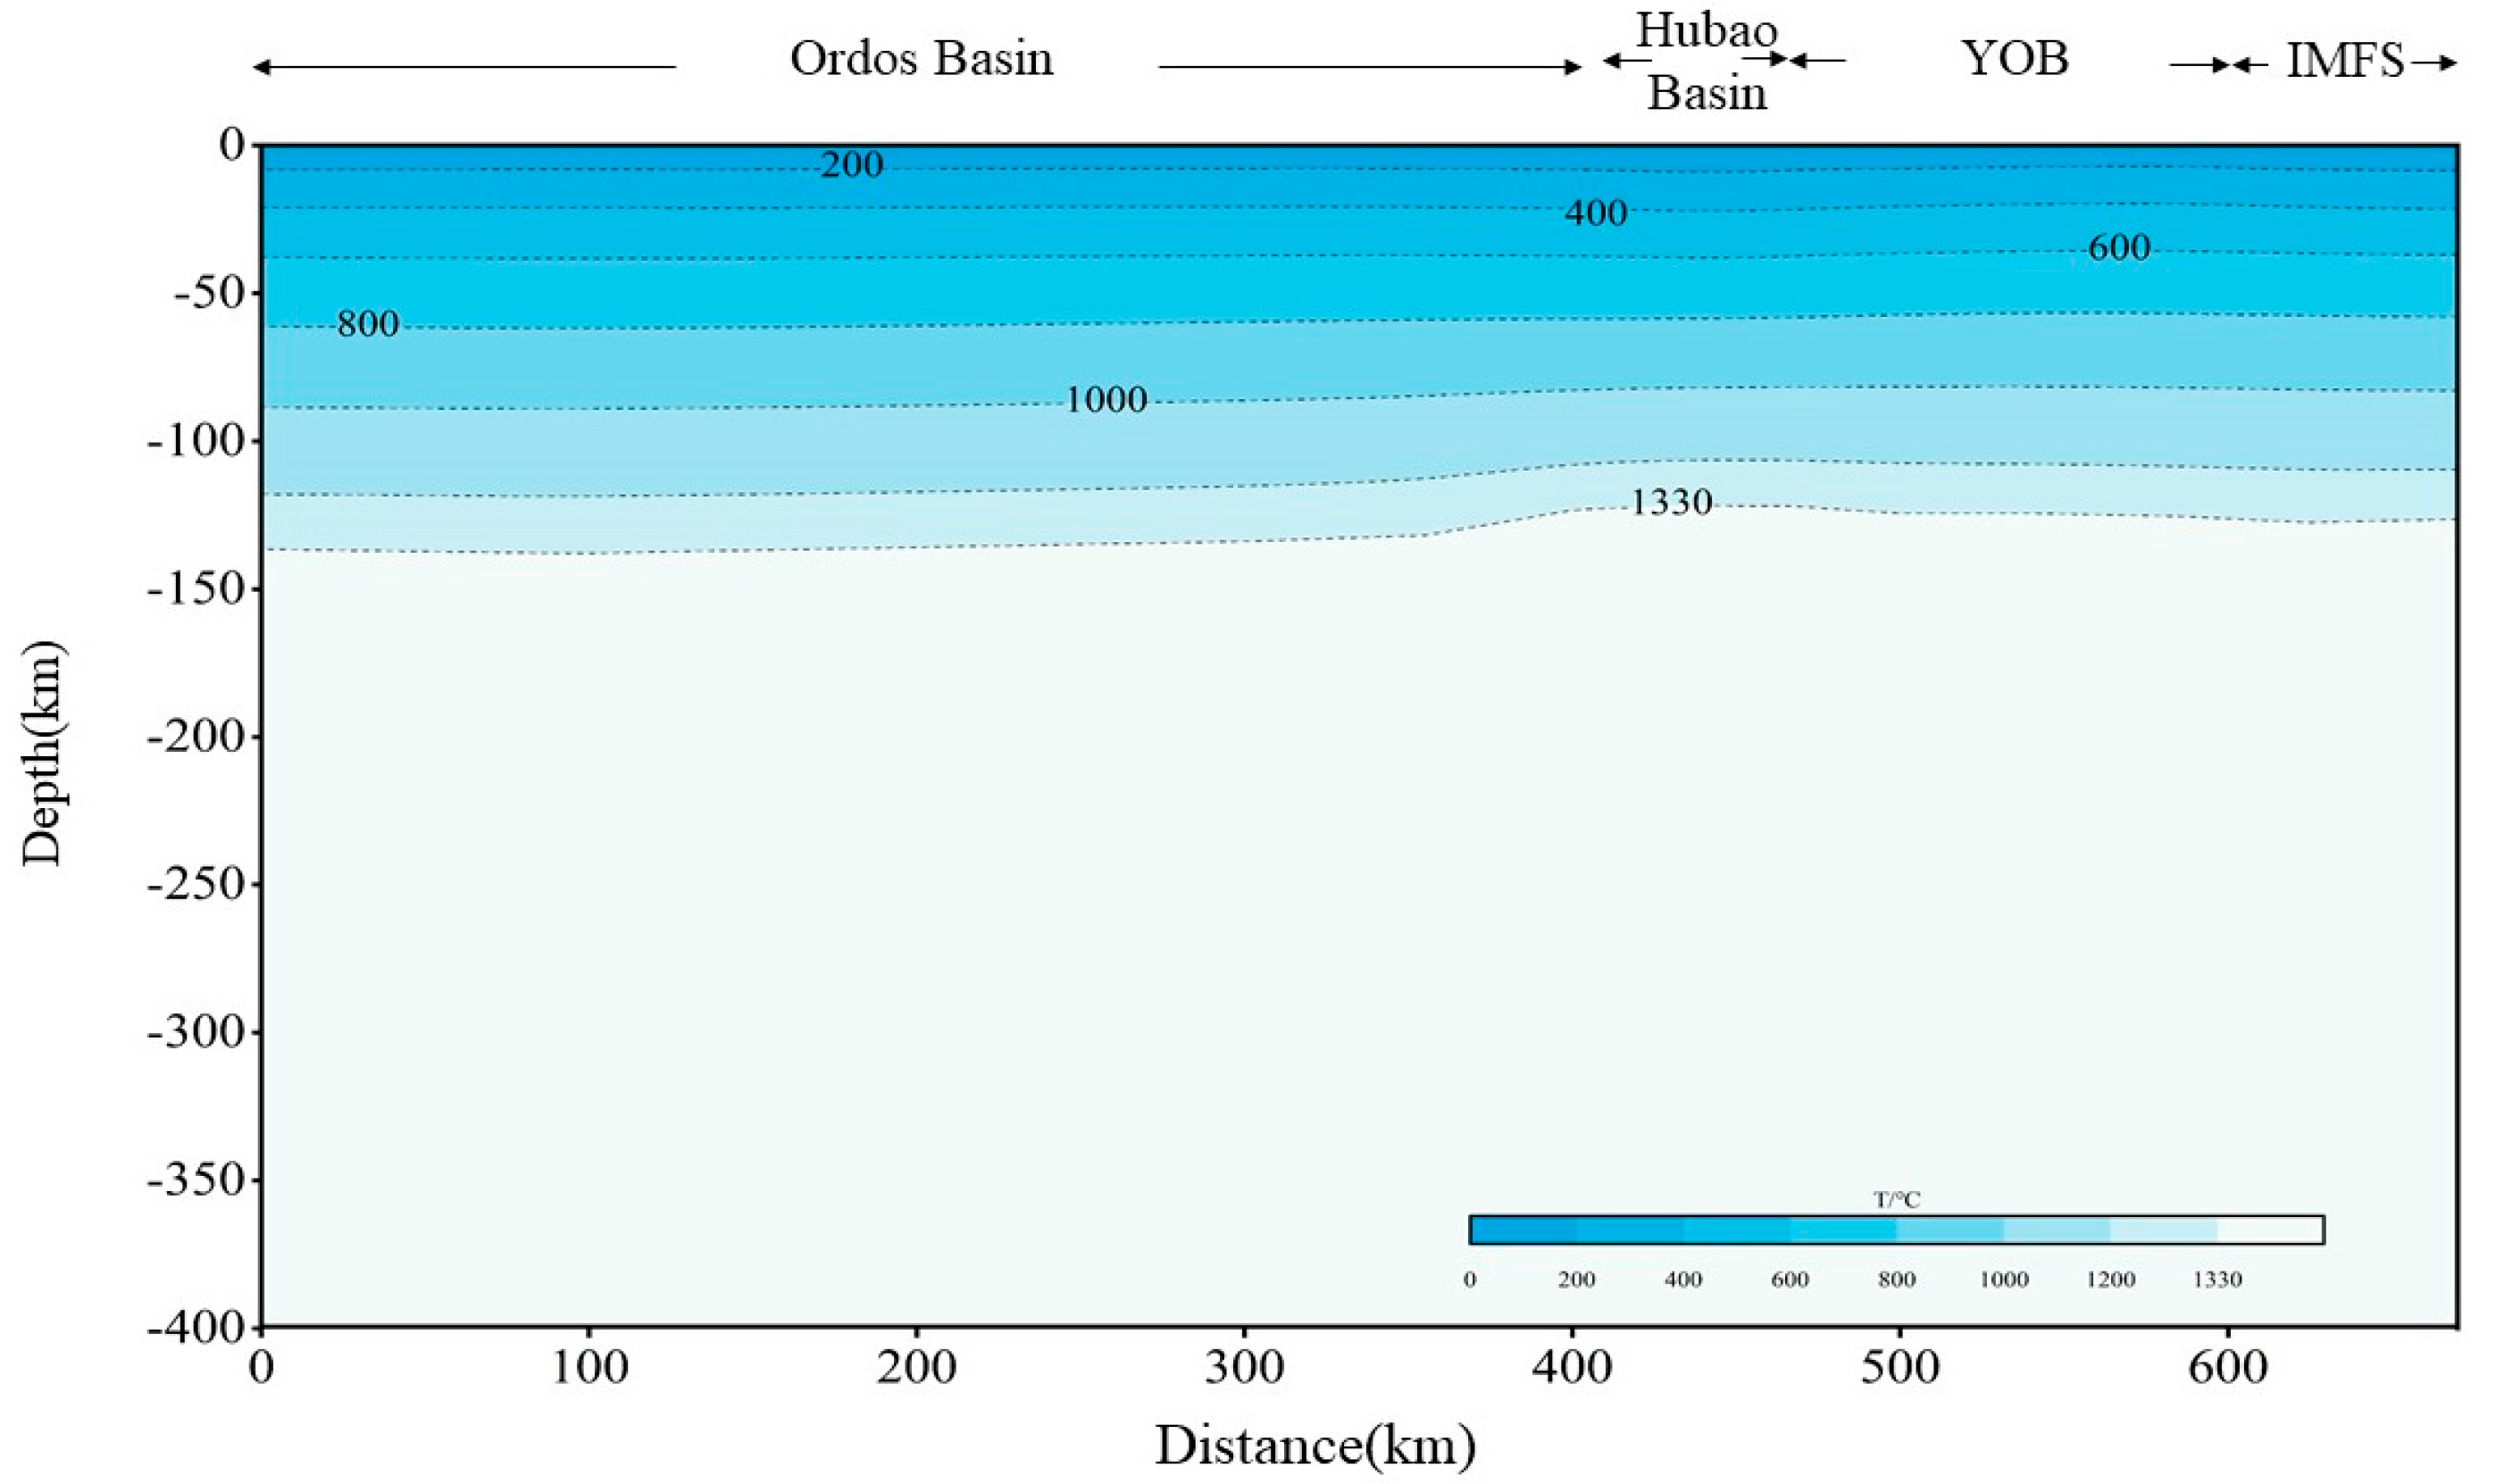
4.2.1. The Deep Temperature of the Lithosphere
4.2.2. Lithospheric Thermal Thickness
4.2.3. The Distribution of Heat Flow between the Lithospheric Crust and Mantle
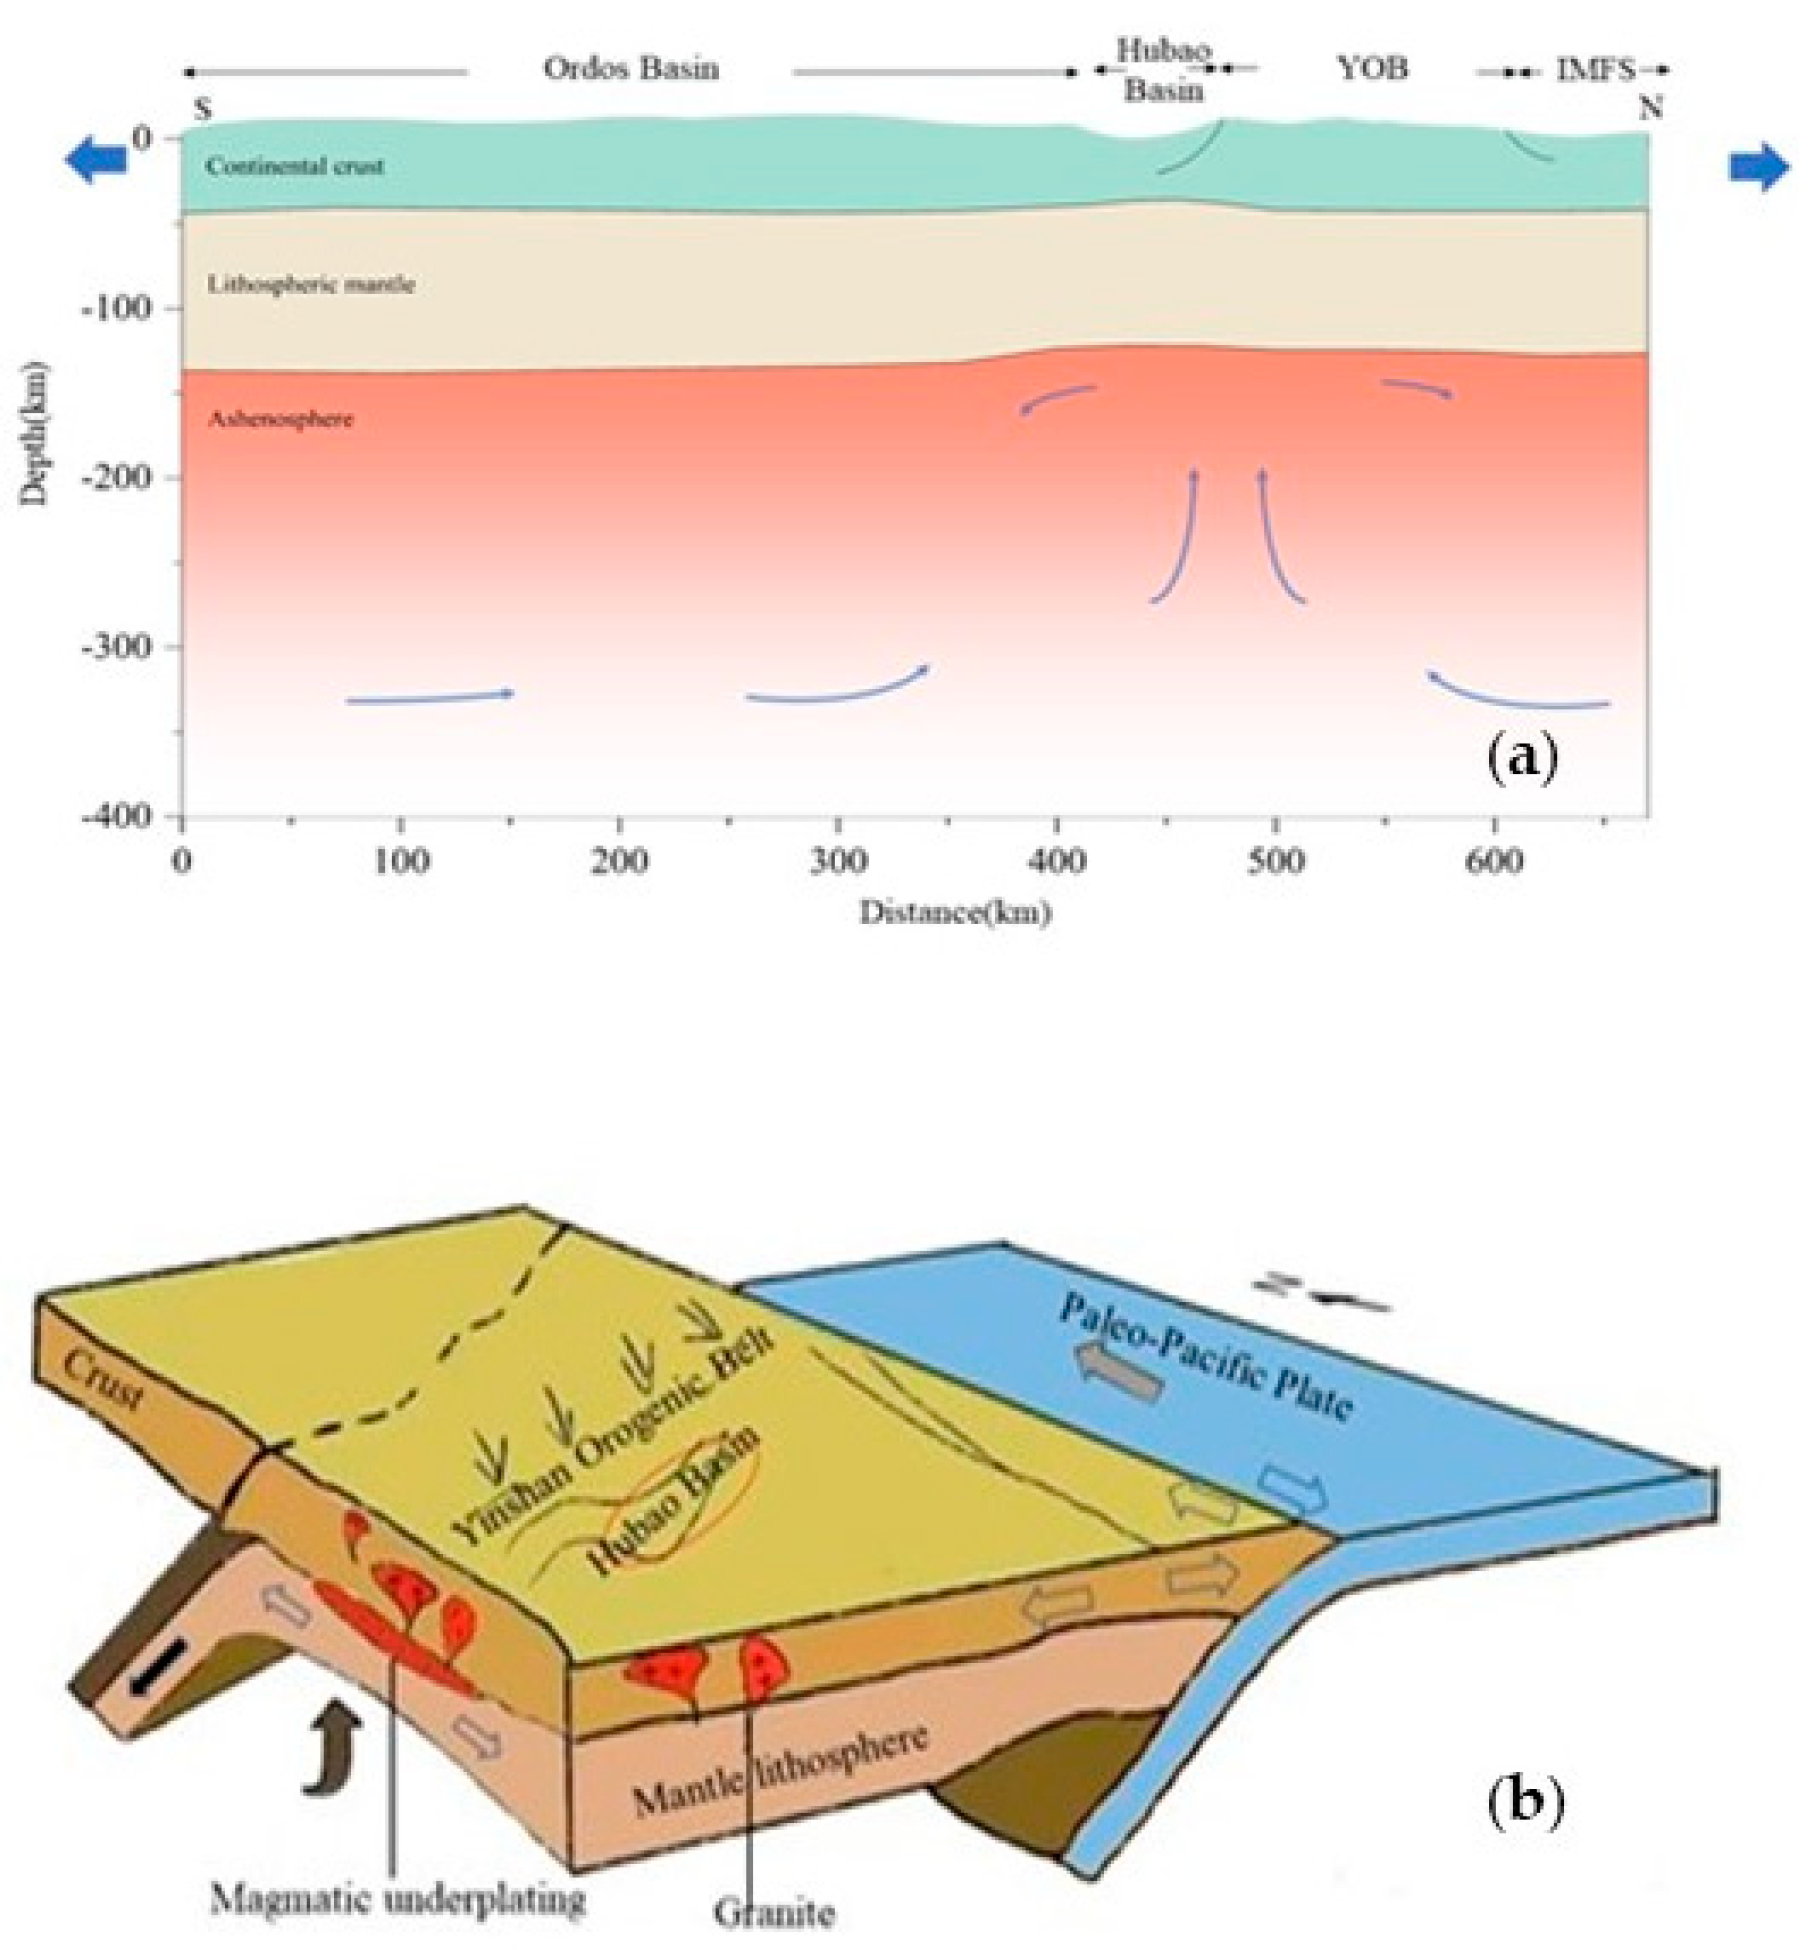
5. Analysis of the Heat Source Formation Mechanism in the Hubao Basin
6. Conclusions
- The thermal conductivity of the Hubao Basin ranges from 1.83 to 5.35 W/(m·K), with the geothermal gradient ranging from 10.2 to 33.9 °C/km. The terrestrial heat flow values range from 64.0 to 73.8 mW/m2, with an average of 65.7 ± 14.7 mW/m2, surpassing the mainland China average of 60.4 ± 12.3 mW/m2.
- Along the geophysical profile, the thermal condition of the lithosphere exhibits significant heterogeneity. The Moho temperature ranges from 570 to 652 °C, and the thickness of the thermal lithosphere shows a trend from thick to thin and then thick again from the Ordos Basin to the Hubao Basin and further to the Inner Mongolia Fold System. The average thickness of the thermal lithosphere is approximately 135.1 ± 4.02 km for the Ordos Basin,122.9 ± 0.21 km for the Hubao Basin, 125.4 ± 1.04 km for the Yinshan Orogenic Belt, and 128.1 ± 0.45km for the Inner Mongolia Fold System.
- The formation and evolution of the Hubao Basin are influenced by the collision between the Indian Plate and the Eurasian Continent, as well as the westward subduction of the Pacific Plate. The Ural Mountains and Daqing Mountains Frontal Faults within the basin, with significant segmentation, serve as potential channels for thermal anomalies.
Author Contributions
Funding
Data Availability Statement
Acknowledgments
Conflicts of Interest
References
- Wang, J.Y.; Zhang, J.; Xu, H.H.; Hu, S.B.; Huang, S.P.; Shi, X.B.; Yang, X.Q.; Shi, H.C.; Guo, X.W.; Liu, S.W.; et al. Geothermal Science and Its Applications, 1st ed.; Science Press: Beijing, China, 2015; pp. 1–548. (In Chinese) [Google Scholar]
- Chen, X.B.; Zang, S.X.; Liu, Y.G.; Wei, R.Q. The current horizontal movement state of the Ordos block and its interaction with surrounding blocks. J. Univ. Chin. Acad. Sci. 2005, 3, 309–314. [Google Scholar]
- Wang, T.; Xu, M.J.; Wang, L.S.; Liu, S.W.; Hu, X.Z. The characteristics of aeromagnetic anomalies in Ordos and its adjacent areas and their tectonic significance. Chin. J. Geophys. 2007, 1, 163–170. [Google Scholar]
- Wang, Q.S.; Teng, J.W.; Wang, G.J.; Xu, Y. Special regional gravity and magnetic fields and deep structures in the Yinshan area of Inner Mongolia. Chin. J. Geophys. 2005, 2, 314–320. [Google Scholar]
- Xu, L.B.; Wei, W.B.; Jin, S.; Ye, G.F.; Liang, H.D.; Jia, C.X.; Gong, X.; Yu, Y. Research on the deep electrical structural characteristics of the northern part of the Ordos block to the Yinshan orogenic belt. Chin. J. Geophys. 2017, 60, 575–584. [Google Scholar]
- Feng, S.Y.; Liu, B.J.; Ji, J.F.; He, Y.J.; Tan, Y.L.; Li, Y.Q. Deep seismic reflection detection of the fine structure of the lithosphere in the Hohhot Baotou Basin. Chin. J. Geophys. 2015, 58, 1158–1168. [Google Scholar] [CrossRef]
- Tian, X.B.; Teng, J.W.; Zhang, H.S.; Zhang, Z.J.; Zhang, Y.Q.; Yang, H.; Zhang, K.K. Structure of crust and upper mantle beneath the Ordos Block and the Yinshan Mountains revealed by receiver function analysis. Phys. Earth Planet. Inter. 2011, 184, 186–193. [Google Scholar] [CrossRef]
- Liu, M.; Cui, X.J.; Liu, F.T. Cenozoic rifting and volcanism in eastern China: A mantle dynamic link to the Indo-Asian collision? Tectonophysics 2004, 393, 29–42. [Google Scholar] [CrossRef]
- Teng, J.W.; Wang, F.Y.; Zhao, W.Z.; Zhang, Y.Q.; Zhang, X.K.; Yan, Y.F.; Zhao, J.R.; Li, M.; Yang, H.; Zhang, H.S.; et al. The Yinshan Orogenic Belt—Ordos Basin Rock Sphere, Block Velocity Structure, and Deep Dynamic Processes. Chin. J. Geophys. 2010, 53, 67–85. [Google Scholar]
- Zhang, Y.Q.; Teng, J.W.; Wang, F.Y.; Zhao, W.Z.; Li, M.; Wang, Q.S. The seismic wave attribute structure and lithology inference of the upper crust in the Yinshan orogenic belt and the northern region of the Ordos Basin. Chin. J. Geophys. 2011, 54, 87–97. [Google Scholar]
- Afonso, C.J.; Fernàndez, M.; Ranalli, G.; Griffin, W.L.; Connolly, J.A.D. Integrated geophysical-petrological modeling of the lithosphere and sublithospheric upper mantle: Methodology and applications. Geochem. Geophys. Geosyst. 2008, 9. [Google Scholar] [CrossRef]
- Li, J.; Han, X.M.; Wang, X.S.; Yang, H.Y.; Zhang, F.; Zhang, H. Analysis of the stress field state of the seismic source in the Hohhot Baotou Basin. Seismol. Geomagn. Obs. Res. 2017, 38, 57–64. [Google Scholar]
- Dong, T. Structural Composition and Formation and Evolution Process of the Western Section of the Northern Margin Fault Zone of the North China Craton, China. Master’s Thesis, China University of Geosciences (Beijing), Beijing, China, 2021; pp. 1–54. [Google Scholar]
- Shao, J.A.; Mu, B.L.; He, G.Q.; Zhang, L.Q. Geological processes in the tectonic superposition process of the ancient Asian and Pacific domains in northern North China. Sci. Sin. 1997, 27, 390–394. [Google Scholar]
- Zhang, C. Rock Assemblages, Zircon U-Pb Geochronological Characteristics, and Geological Significance of the Bainaimiao Group in the Sunite Right Banner Area of Inner Mongolia, China. Master’s Thesis, Jilin University, Jinlin, China, 2013; pp. 1–68. [Google Scholar]
- Wang, X.L. Research on Quaternary Sedimentary and Structural Characteristics of the Hubao Basin in Inner Mongolia, China. Master’s Thesis, China University of Geosciences (Beijing), Beijing, China, 2007; pp. 1–68. [Google Scholar]
- Geological Survey and Research Institute of Jilin University. Regional Geological Survey Report Baotou City Range (K49C004002); Geological Survey and Research Institute of Jilin University: Changchun, China, 2005; Available online: http://www.ngac.org.cn/Data/archivesFileBrowsing?DocId=cgdoi.n0001%2Fd00122694.z01_0002 (accessed on 10 August 2023).
- Xu, X.W.; Cheng, G.L.; Ma, X.Y.; Sun, Y.H.; Han, Z.J. The rotational patterns and power sources of North China and its neighboring blocks. Earth Sci. 1994, 19, 129–138. [Google Scholar]
- Deng, Q.D.; Cheng, S.P.; Min, W.; Yang, G.Z.; Ren, D.W. Discussion on the Cenozoic tectonic activity and dynamics of the Ordos block. J. Geomech. 1999, 3, 12–21. [Google Scholar]
- Xu, W.; Li, Y.; Zhou, L.M.; Ke, T.T.; Cheng, L.Y. Lithospheric thermal regime under the Qinling Orogenic Belt and the Weihe Basin: A transect across the Yangtze and the North China cratons in central China. Tectonophysics 2020, 789, 228514. [Google Scholar] [CrossRef]
- The Research Group of the Ordos Peripheral Active Fault System by the National Seismological Bureau. The Ordos Peripheral Active Fault System; Seismic Press: Beijing, China, 1988. [Google Scholar]
- Xu, M.L.; Yang, Y.B.; Sun, C.Y.; Deng, Y.M.; Zhang, G.Z.; Shi, S.L.; Su, Z.N.; Feng, C.H. Geophysical response and analysis of controlling structures for sandstone type uranium deposits in the northern Ordos Basin. Geol. Rev. 2023, 69, 213–214. [Google Scholar] [CrossRef]
- Chen, L. Concordant structural variations from the surface to the base of the upper mantle in the North China Craton and its tectonic implications. Lithos 2010, 120, 96–115. [Google Scholar] [CrossRef]
- Zhao, G.C.; Wilde, S.A.; Cawood, P.A.; Sun, M. Archean blocks and their boundaries in the North China Craton: Lithological, geochemical, structural and path constraints and tectonic evolution. Precambrian Res. 2001, 107, 45–73. [Google Scholar] [CrossRef]
- Bai, L.X. The Era Determination of the Latest Tectonic Movement in Daqingshan and Its Impact on the Tectonic Evolution of the Hetao Basin, China. Master’s Thesis, Institute of Geology, China Earthquake Administration, Beijing, China, 2018; pp. 1–80. [Google Scholar]
- Hu, J.; Tian, Y.T.; Li, Z.W.; Jiang, G.Z.; Zuo, Y.H.; Zhang, C.; Wang, Y.B.; Wang, Y.C.; Hu, S.B. GeothermoTool: An open-source software for basic geothermal calculations and plots. Geothermics 2022, 106, 102551. [Google Scholar] [CrossRef]
- Jiang, G.Z.; Hu, S.B.; Shi, Y.Z.; Zhang, C.; Wang, Z.T.; Hu, D. Terrestrial heat flow of continental China: Updated dataset and tectonic implications. Tectonophysics 2019, 753, 36–48. [Google Scholar] [CrossRef]
- Hu, S.B.; He, L.J.; Wang, J.Y. Heat flow in the continental area of China a new data set. Earth Planet. Sci. Lett. 2000, 179, 407–419. [Google Scholar] [CrossRef]
- Zhang, Q.R.; Xiao, H.P.; Rao, S.; Shi, Y.Z.; Li, W.J.; Huang, S.D.; Hu, G.M. The characteristics and controlling factors of the current geothermal field in the Songliao Basin. Bull. Geol. Sci. Technol. 2023, 42, 191–204. [Google Scholar] [CrossRef]
- Zeyen, H.; Fernàndez, M. Integrated Lithospheric Modeling Combining Thermal, Gravity, and Local Isostasy Analysis—Application to the Ne Spanish Geotransect. J. Geophys. Res.-Solid Earth 1994, 99, 18089–18102. [Google Scholar] [CrossRef]
- Ricard, Y. Mantle convection in the Earth and planets. Science 2002, 295, 802–803. [Google Scholar] [CrossRef]
- Connolly, J.A.D. Computation of phase equilibria by linear programming: A tool for geodynamic modeling and its application to subduction zone decarbonation. Earth Planet. Sci. Lett. 2005, 236, 524–541. [Google Scholar] [CrossRef]
- Carballo, A.; Fernandez, M.; Jimenez-Munt, I.; Torne, M.; Vergés, J.; Melchiorre, M.; Pedreira, D.; Afonso, J.C.; Garcia-Castellanos, D.; Díaz, J.; et al. From the North-Iberian Margin to the Alboran Basin: A lithosphere geo-transect across the Iberian Plate. Tectonophysics 2015, 663, 399–418. [Google Scholar] [CrossRef]
- Wang, Q.S.; Teng, J.W.; An, Y.L.; Zhang, Y.Q. Gravity Field and Deep Structures in the Yinshan Mountains and the Northern Ordos Basin. Prog. Geophys. 2010, 25, 1590–1598. [Google Scholar]
- Jiang, G.Z.; Gao, P.; Rao, S.; Zhang, L.Y.; Tang, X.Y.; Huang, F.; Zhao, P.; Pang, Z.H.; He, L.J.; Hu, S.B.; et al. Compilation of terrestrial heat flow data in Chinese Mainland (fourth edition). Chin. J. Geophys. 2016, 59, 2892–2910. [Google Scholar]
- Ma, X.Y.; Liu, C.S.; Liu, G.D. The geological section from Xiangshui, Jiangsu to Mandula, Inner Mongolia. Acta Geol. Sin. 1991, 3, 199–215. [Google Scholar] [CrossRef]
- Pavlis, N.K.; Holmes, S.A.; Kenyon, S.C.; Factor, J.K. The development and evaluation of the Earth Gravitational Model 2008 (EGM2008). J. Geophys. Res. Solid Earth 2012, 117. [Google Scholar] [CrossRef]
- Sandwell, D.T.; Harper, H.; Tozer, B.; Smith, W.H.F. Gravity field recovery from geodetic altimeter missions. Adv. Space Res. 2021, 68, 1059–1072. [Google Scholar] [CrossRef]
- Chen, Z.Y. Geological and Tectonic Evolution of the Middle Proterozoic Paleozoic in the Guyang Mandula Region of Inner Mongolia, China. Doctoral Thesis, China University of Geosciences (Beijing), Beijing, China, 2005; pp. 1–151. [Google Scholar]
- Ran, Y.K.; Zhang, P.Z.; Chen, L.C. Research on the Late Quaternary Paleoseismic Integrity of the Daqing Mountain Front Fault in the Hetao Fault Zone. Earth Sci. Front. 2003, S1, 207–216. [Google Scholar]
- Li, M.K.; Song, X.D.; Li, J.T.; Bao, X.W. Lithospheric structure and tectonic significance of large basins in Chinese Mainland. Earth Sci. 2018, 43, 3362–3372. [Google Scholar]
- Artemieva, I.M.; Mooney, W.D. The continental lithosphere: Reconciling thermal, seismic, and petrologic data. Lithos 2009, 109, 23–46. [Google Scholar] [CrossRef]
- Huang, F.; He, L.J.; Wu, Q.J. Lithospheric thermal structure of the Ordos Basin and its implications to destruction of the North China Craton. Chin. J. Geophys. 2015, 58, 3671–3686. [Google Scholar]
- Zang, S.X.; Liu, Y.G.; Ning, J.Y. Thermal structure of lithosphere in North China. Chin. J. Geophys. 2002, 45, 51–62. [Google Scholar]
- Rao, S.; Jiang, G.Z.; Gao, Y.J.; Hu, S.B.; Wang, J.Y. The thermal structure of the lithosphere and heat source mechanism of geothermal field in Weihe Basin. Chin. J. Geophys. 2016, 59, 2176–2190. [Google Scholar]
- Zuo, Y.H.; Jiang, S.; Wu, S.H.; Xu, W.; Zhang, J.; Feng, R.P.; Yang, M.H.; Zhou, Y.S.; Madhava, S. Terrestrial heat flow and lithospheric thermal structure in the Chagan Depression of the Yingen-Ejinaqi Basin, north central China. Basin Res. 2020, 32, 1328–1346. [Google Scholar] [CrossRef]
- Qiu, N.S.; Zuo, Y.H.; Chang, J.; Xu, W.; Zhu, C.Q. Comparison of Mesozoic and Cenozoic thermal systems in typical basins of eastern and western China. Earth Sci. Front. 2015, 22, 157–168. [Google Scholar] [CrossRef]
- Zuo, Y.H.; Qiu, N.S.; Chang, J.; Hao, Q.Q.; Li, Z.X.; Li, J.W.; Li, W.Z.; Xie, C.H. Research on the thermal structure of the Mesozoic and Cenozoic lithosphere in the Bohai Bay Basin. Acta Geol. Sin. 2013, 87, 145–153. [Google Scholar]
- Xu, W. Research on the Mesozoic Cenozoic Thermal System and Lithospheric Thinning in the Bohai Bay Basin, China. Doctoral Thesis, China University of Petroleum (Beijing), Beijing, China, 2019; pp. 1–109. [Google Scholar]
- Liu, S.W.; Li, X.L.; Hao, C.Y.; Li, X.D. Heat flow, deep temperature and thermal structure in Tarim Basin. Earth Sci. Front. 2017, 24, 41–55. [Google Scholar] [CrossRef]
- Liang, Y.B. The first discovery of uranium thorium ore and cerium sodium carbonate ore in the Baiyun Ebo iron mining area. Geol. Explor. 1979, 8, 21. [Google Scholar]
- Yang, M.Z.; Li, Y.C. Research on uranium thorium minerals in the Baiyun Ebo deposit in Inner Mongolia. China Sci. Bull. 1980, 12, 558–560. [Google Scholar]
- Zhao, C.Y. Thorium and Uranium in Baiyun Ebo (1). Rare Earth Inf. 2006, 7, 12–15. [Google Scholar]
- Wang, X.K. Geochemical Evaluation of Urban Ecosystems in Hohhot and Baotou Cities, China. Doctoral Thesis, China University of Geosciences (Beijing), Beijing, China, 2012; pp. 1–150. [Google Scholar]
- Wang, P.J.; Li, X.L.; Gong, Y.L.; Li, B.H.; Zhang, X. Using aerial geophysical data to delineate hidden rock (magnetic) bodies—taking the Bayannur Baotou area as an example. Geol. Chem. Miner. 2012, 34, 249–254. [Google Scholar]
- Lei, J.S.; Zhai, D.P. P-wave tomography and origin of the Changbai intraplate volcano in Northeast Asia. Tectonophysics 2005, 397, 281–295. [Google Scholar] [CrossRef]
- Zhao, D.P.; Maruyama, S.; Omori, S. Mantle dynamics of Western Pacific and East Asia: Insight from seismic tomography and mineral physics. Gondwana Res. 2007, 11, 120–131. [Google Scholar] [CrossRef]
- Zhang, J.J.; Zheng, J.L.; Wang, H.B.; Guo, L.; Liu, J.; Qi, G.W. The Late Mesozoic Early Cenozoic tectonic events in Daqingshan Panyangshan, Inner Mongolia and their implications for the tectonic evolution of the northern margin of North China. Earth Sci. Front. 2024, 31, 127–141. [Google Scholar] [CrossRef]


| Geological Period | Number of Samples | Lithology | Thermal Conductivity (W/(m·K)) |
|---|---|---|---|
| Neogene (N) | 4 | Sandstone, conglomerate, sandstone clay | 2.67 |
| Cretaceous (K) | 4 | Sandstone, mudstone, shale | 1.83 |
| Jurassic (J) | 9 | Sandstone, granite, feldspar quartz sandstone, limestone | 2.75 |
| Triassic (T) | 2 | Sandstone | 4.96 |
| Well Number | Longitude | Latitude | Geothermal Gradient (°C/km) | Thermal Conductivity (W/(m·K)) | Heat Flow (mW/m2) |
|---|---|---|---|---|---|
| 1# | 109.84° | 40.66° | 22.8 | 2.67 | 60.9 |
| 2# (ZK1) | 109.86° | 40.56° | 18.9 | 2.67 | 50.5 |
| 3# | 109.87° | 40.61° | 10.2 | 2.59 | 26.4 |
| 4# | 109.90° | 40.58° | 26.7 | 2.55 | 68.1 |
| 5# | 109.95° | 40.56° | 21.1 | 2.67 | 56.3 |
| LR1 | 107.53° | 40.90° | 28.3 | 2.67 | 75.6 |
| LS3 | 107.39° | 40.74° | 24.6 | 2.67 | 65.7 |
| HR3 | 110.94° | 40.65° | 33.9 | 2.54 | 86.1 |
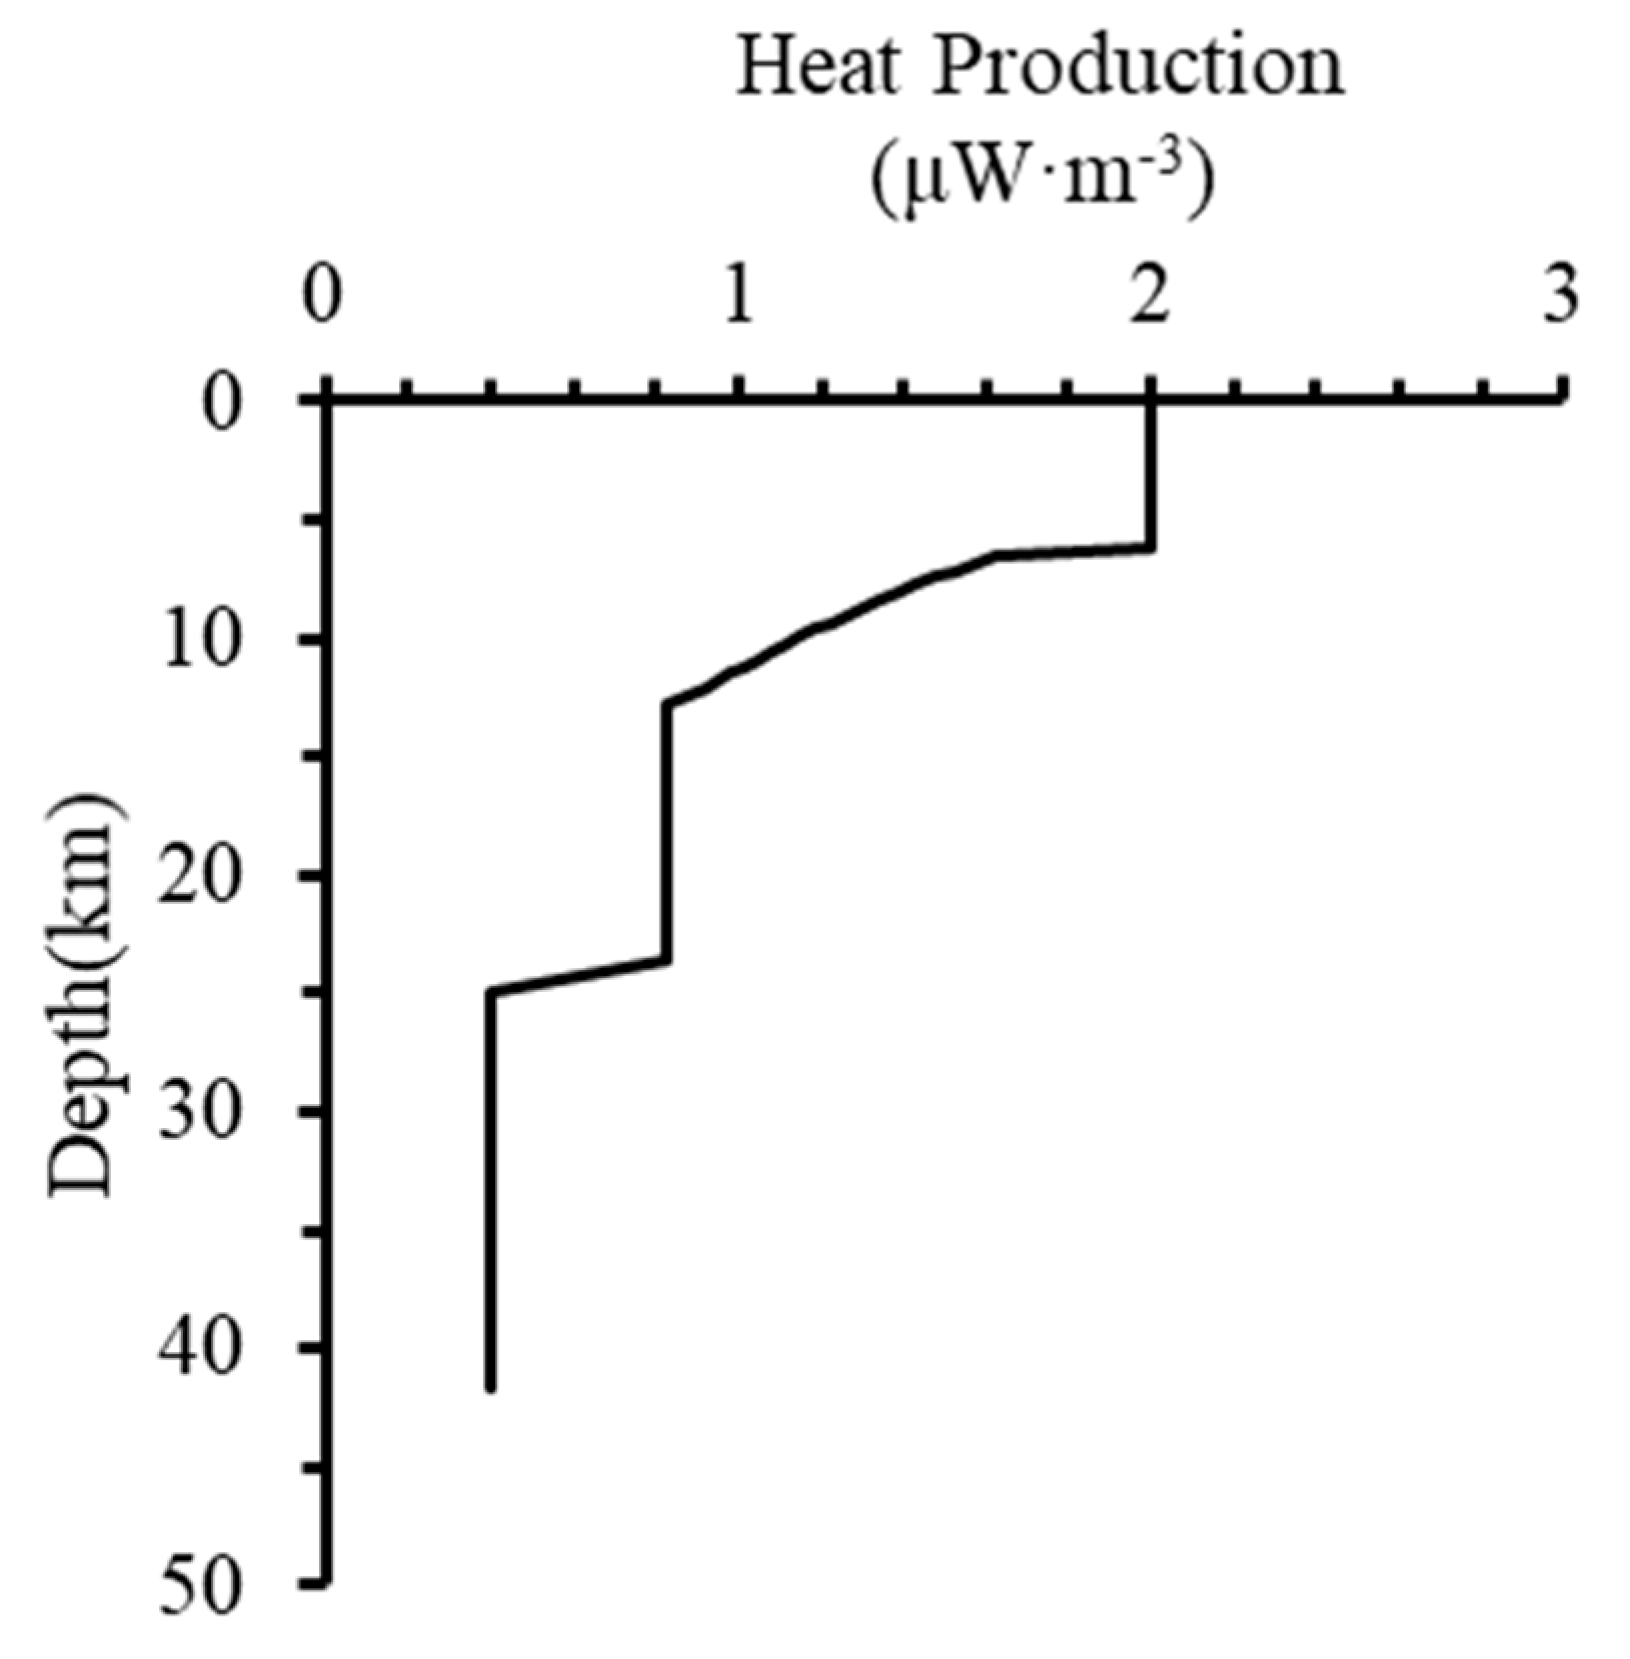
| Crustal Structure | Density (kg/m3) | Thermal Conductivity (W/(m·k)) | Heat Production (μW/m3) | |
|---|---|---|---|---|
| Sedimentary layer | 1 | 2600 ① | 2.74 ② | 1.61 ② |
| 2 | 2490 ① | 3.05 | 2.00 | |
| 3 | 2520 ① | 3.05 | 2.00 | |
| 4 | 2620 ① | 3.05 | 2.00 | |
| Upper crust | 5 | 2710 ① | 3.00 ③ | 1.67 ④ |
| 6 | 2820 ① | 3.00 ③ | 2.31 ⑤ | |
| 7 | 2820 ① | 3.00 ③ | 2.31 ⑤ | |
| Middle crust | 8 | 2920 ① | 2.80 ③ | 0.83 ③ |
| 9 | 2840 ① | 2.80 ③ | 0.83 ③ | |
| Lower crust | 10 | 3000 ① | 2.60 ③ | 0.40 ③ |
| Upper mantle | 11 | 3245 | 2.10 | 0.03 |
| SiO2 | Al2O3 | FeO | CaO | MgO | K2O | Na2O |
|---|---|---|---|---|---|---|
| 52.26 | 17.62 | 5.0 | 12.05 | 7.25 | 0.28 | 1.81 |
Disclaimer/Publisher’s Note: The statements, opinions and data contained in all publications are solely those of the individual author(s) and contributor(s) and not of MDPI and/or the editor(s). MDPI and/or the editor(s) disclaim responsibility for any injury to people or property resulting from any ideas, methods, instructions or products referred to in the content. |
© 2024 by the authors. Licensee MDPI, Basel, Switzerland. This article is an open access article distributed under the terms and conditions of the Creative Commons Attribution (CC BY) license (https://creativecommons.org/licenses/by/4.0/).
Share and Cite
Gong, Z.; Xu, W.; Tang, X.; Zhu, G.; Yang, Y.; Guo, T.; Wang, S. Terrestrial Heat Flow and Lithospheric Thermal Structure of the Hubao Basin, North Central China. Water 2024, 16, 1980. https://doi.org/10.3390/w16141980
Gong Z, Xu W, Tang X, Zhu G, Yang Y, Guo T, Wang S. Terrestrial Heat Flow and Lithospheric Thermal Structure of the Hubao Basin, North Central China. Water. 2024; 16(14):1980. https://doi.org/10.3390/w16141980
Chicago/Turabian StyleGong, Ziqin, Wei Xu, Xiaoyin Tang, Genggeng Zhu, Yuliang Yang, Tianqi Guo, and Sen Wang. 2024. "Terrestrial Heat Flow and Lithospheric Thermal Structure of the Hubao Basin, North Central China" Water 16, no. 14: 1980. https://doi.org/10.3390/w16141980
APA StyleGong, Z., Xu, W., Tang, X., Zhu, G., Yang, Y., Guo, T., & Wang, S. (2024). Terrestrial Heat Flow and Lithospheric Thermal Structure of the Hubao Basin, North Central China. Water, 16(14), 1980. https://doi.org/10.3390/w16141980