Abstract
Cadmium (Cd) and zinc (Zn) in seawater enter the human body through the food chain. Combined toxicity tests indicated that high concentrations of Cd(II) and low concentrations of Zn(II) had a synergistic effect on humans. Thus, there is an urgent need to prepare a sensor for rapid and simultaneous detection of Cd(II) and Zn(II) in seawater. Herein, a reduced graphene oxide/carboxylated multi-walled carbon nanotube (rGO/MWCNT-COOH)-modified glassy carbon electrode was prepared in the experiments using the dropping method. The synthesis of various materials achieved the purpose of expanding the surface area, and scanning electron microscopy was used to observe the structure of the composite membrane. Moreover, the large number of functional groups on the surface of the composite membrane can also increase the adsorption of ions. For the determination of trace cadmium (II) and zinc (II) in seawater, the method used was differential pulse voltammetry (DPV). The results show that the peak current, which was obtained in the range of 5–400 μg/L for Cd(II) and Zn(II), has a linear relationship with concentration, corresponding to the detection limits of 0.8 μg/L for Cd(II) and 0.98 μg/L for Zn(II). The modified electrode was used to determine the Cd(II) and Zn(II) content in the coastal seawater of the Maowei Sea, and the recovery rate was between 95.8 and 98.2% for Cd(II) and 96.7~99.4% for Zn(II), which provided a novel approach of detection to define trace Cd(II) and Zn(II) in seawater.
1. Introduction
Excessive heavy metal ions from industrial sewage and emissions cause a serious threat to marine ecosystems due to scientific and technological developments. Their carcinogenicity, teratogenicity, and mutagenicity [1] are increasing hazards to public health and safety. Mercury, chromium, cadmium (Cd), lead, and zinc (Zn) are particularly relevant. This study focuses on Cd and Zn ions in seawater. The heavy metals Cd and Zn tend to coexist in the aquatic environment; further, because of their similar atomic structure, ionic radius, and electronegativity, they may interact and interfere with each other in the same biological system.
Zn is an essential trace element for aquaculture animals. Zn deficiency or excess in feed has serious negative effects on the growth, development, and nutritional metabolism of aquatic animals; therefore, it is particularly relevant to investigate the mechanism of Zn homeostasis regulation in organisms [2]. Cd is one of the non-essential trace harmful elements in organisms. In recent years, the increase in industrial pollution has caused Cd to exceed the standard for aquatic animals. Cd has a long residual time, can accumulate and can be transferred along the food chain, thus posing a threat to human health [3].
The joint toxicity test showed that high concentrations of Cd(II) and low concentrations of Zn(II) on the clam have a synergistic effect, and with a decrease in the concentration of Cd(II), the synergistic effect becomes weaker; high concentrations of Zn(II) and low concentrations of Cd(II) on the clam have an antagonistic effect, but with an increase in the concentration of Zn(II) this effect shifts toward each acting as an independent agent [4]. According to Hou Liping et al., through the combined toxicity study of Cd and Zn in grass carp, it was found that the coexistence of metals increased the permeability of the cell membrane, and thus toxicity increased synergistically. Moreover, the enrichment of Cd in fish can change the permeability of the cell membrane [5]. Therefore, it is particularly relevant to establish a rapid, convenient, and low-cost assay for the mixed detection of Cd and Zn ions.
Currently, apart from electrochemical analysis, the main methods most commonly used for heavy metal detection include spectrophotometry, chemiluminescence, high-performance liquid chromatography, ion chromatography, atomic spectrometry, and mass spectrometry [6,7,8,9,10]. Although these methods are accurate and effective, they are complicated to operate and costly. In the current study, we selected the electrochemical method. Electrochemical analysis has become a relevant method for the detection of heavy metals because of its environmental protection, easy and convenient operation, simple instrumentation, ease of integration, and miniaturisation [11,12,13]. In electrochemical detection, it is necessary to convert complex and difficult-to-measure chemical parameters into easily accessible electrical parameters and use the changes in electrical parameters to achieve rapid detection of chemical reaction processes [14]. The traditional three-electrode detection system is composed of an electrolyte solution, working electrode, reference electrode, auxiliary electrode, electrochemical workstation, and host computer. The electrodes are separate and work together, forming a “three electrodes, two circuits” structure with the power supply, voltmeter, and ammeter in the electrochemical workstation [15]. In this experiment, the working electrode selected is a glassy carbon electrode. Glassy carbon electrode has the advantages of good electrical conductivity, high chemical stability, small thermal expansion coefficient, hard texture, good airtightness, and a wide range of polarisation. It can be made into a cylinder, disc, and other electrode shapes and can be used as an inert electrode for anodic dissolution, and cathodic and voltammetric determination of valence ions. It can also be used as a matrix to create a mercury film glassy carbon electrode, chemically modified electrodes, and so on. It has been widely used in electrochemical experiments or electroanalytical chemistry. In the electrochemical method, the modification of the surface of the working electrode is particularly relevant, and in this thesis, graphene oxide and multi-walled carbon nanotubes were selected.
Graphene, a new type of carbon nanomaterial, has been widely used in recent years; further, this quasi-two-dimensional nanomaterial [16,17] has the advantages of a rapid electron transfer rate and high electrocatalytic activity [18]. After the oxidation of ordinary graphene, graphene oxide is obtained, and a large number of oxygen-containing functional groups are added to its surface, which makes it more active and catalytic [19]. The modification of graphene oxide on the surface of glassy carbon electrodes can be reduced electrochemically, and the specific surface area of the electrode and the detected signals are significantly improved after the reduction [20]. Another type of nanomaterial, multi-walled carbon nanotubes [21], has been widely used in the fields of environmental, food, and pharmaceutical analyses since its discovery due to its good mechanical strength, unique surface effect, electrical conductivity, and strong catalytic properties [22].
In the current study, for the detection of heavy metal contaminants in the marine environment, graphene oxide and multi-walled carbon nanotubes were used to prepare enhanced, modified membranes. A rapid, wide-detection-range, high-sensitivity microfluidic detection platform was studied to achieve real-time, rapid detection of zinc and cadmium ions in water, effectively preventing zinc and cadmium ions from causing serious harm to marine ecosystems and human beings.
2. Experimental
2.1. Instruments and Reagents
The CHI830D electrochemical workstation (Shanghai, China), FA224 electronic analytical balance (Shanghai Hai Lichen Instrument Technology, Shanghai, China), JP-040s ultra-sonic cleaner (Shenzhen Jianmeng Ultra-sonic Instrument, Shenzhen, China), LC-LX-H165A high-speed centrifuge (Shanghai Hai Lichen Instrument Technology), DHG-101 electric blast drying oven (Shanghai Changyi Instrument Equipment, Shanghai, China), TESCAN MIRA LMS high-resolution scanning electron microscope (TESCAN Limited, Brno, Czech Republic), and PLUSE2-5TH ultra-pure water system (Nanjing Easy Pure Tech Development, Nanjing, China) were used in this study.
Carboxylated multi-walled carbon nanotubes (purity ≥ 99.9%), graphene (purity ≥ 98%), and dimethylformamide (DMF) (purity ≥ 99.8%), were from Shanghai Aladdin Biochemical Technology, Shanghai, China; cadmium ion standard solution (1 mg/mL) and zinc ion standard solution (1 mg/mL) were from the National Nonferrous Metals and Electronic Materials Analysis and Testing Centre. The purities used were either analytical pure or good-grade pure. Ultra-pure water with a resistivity of 18.0 MΩ·cm was used in the experiment. The seawater samples for the spiked recovery experiments were collected from lakes near Beibu Gulf University, originating from waters close to the Maowei Sea.
2.2. Preparation of a Modified Electrode
The surface of the glassy carbon electrode was polished with alumina paste powder with diameters of 1.0 μm, 0.3 μm, and 50 nm and washed in ultra-pure water and anhydrous ethanol by ultra-sonic washing for 3 min. The cleaned electrode was placed into a 0.1 mol/L potassium ferrocyanide solution for cyclic voltammetry testing.
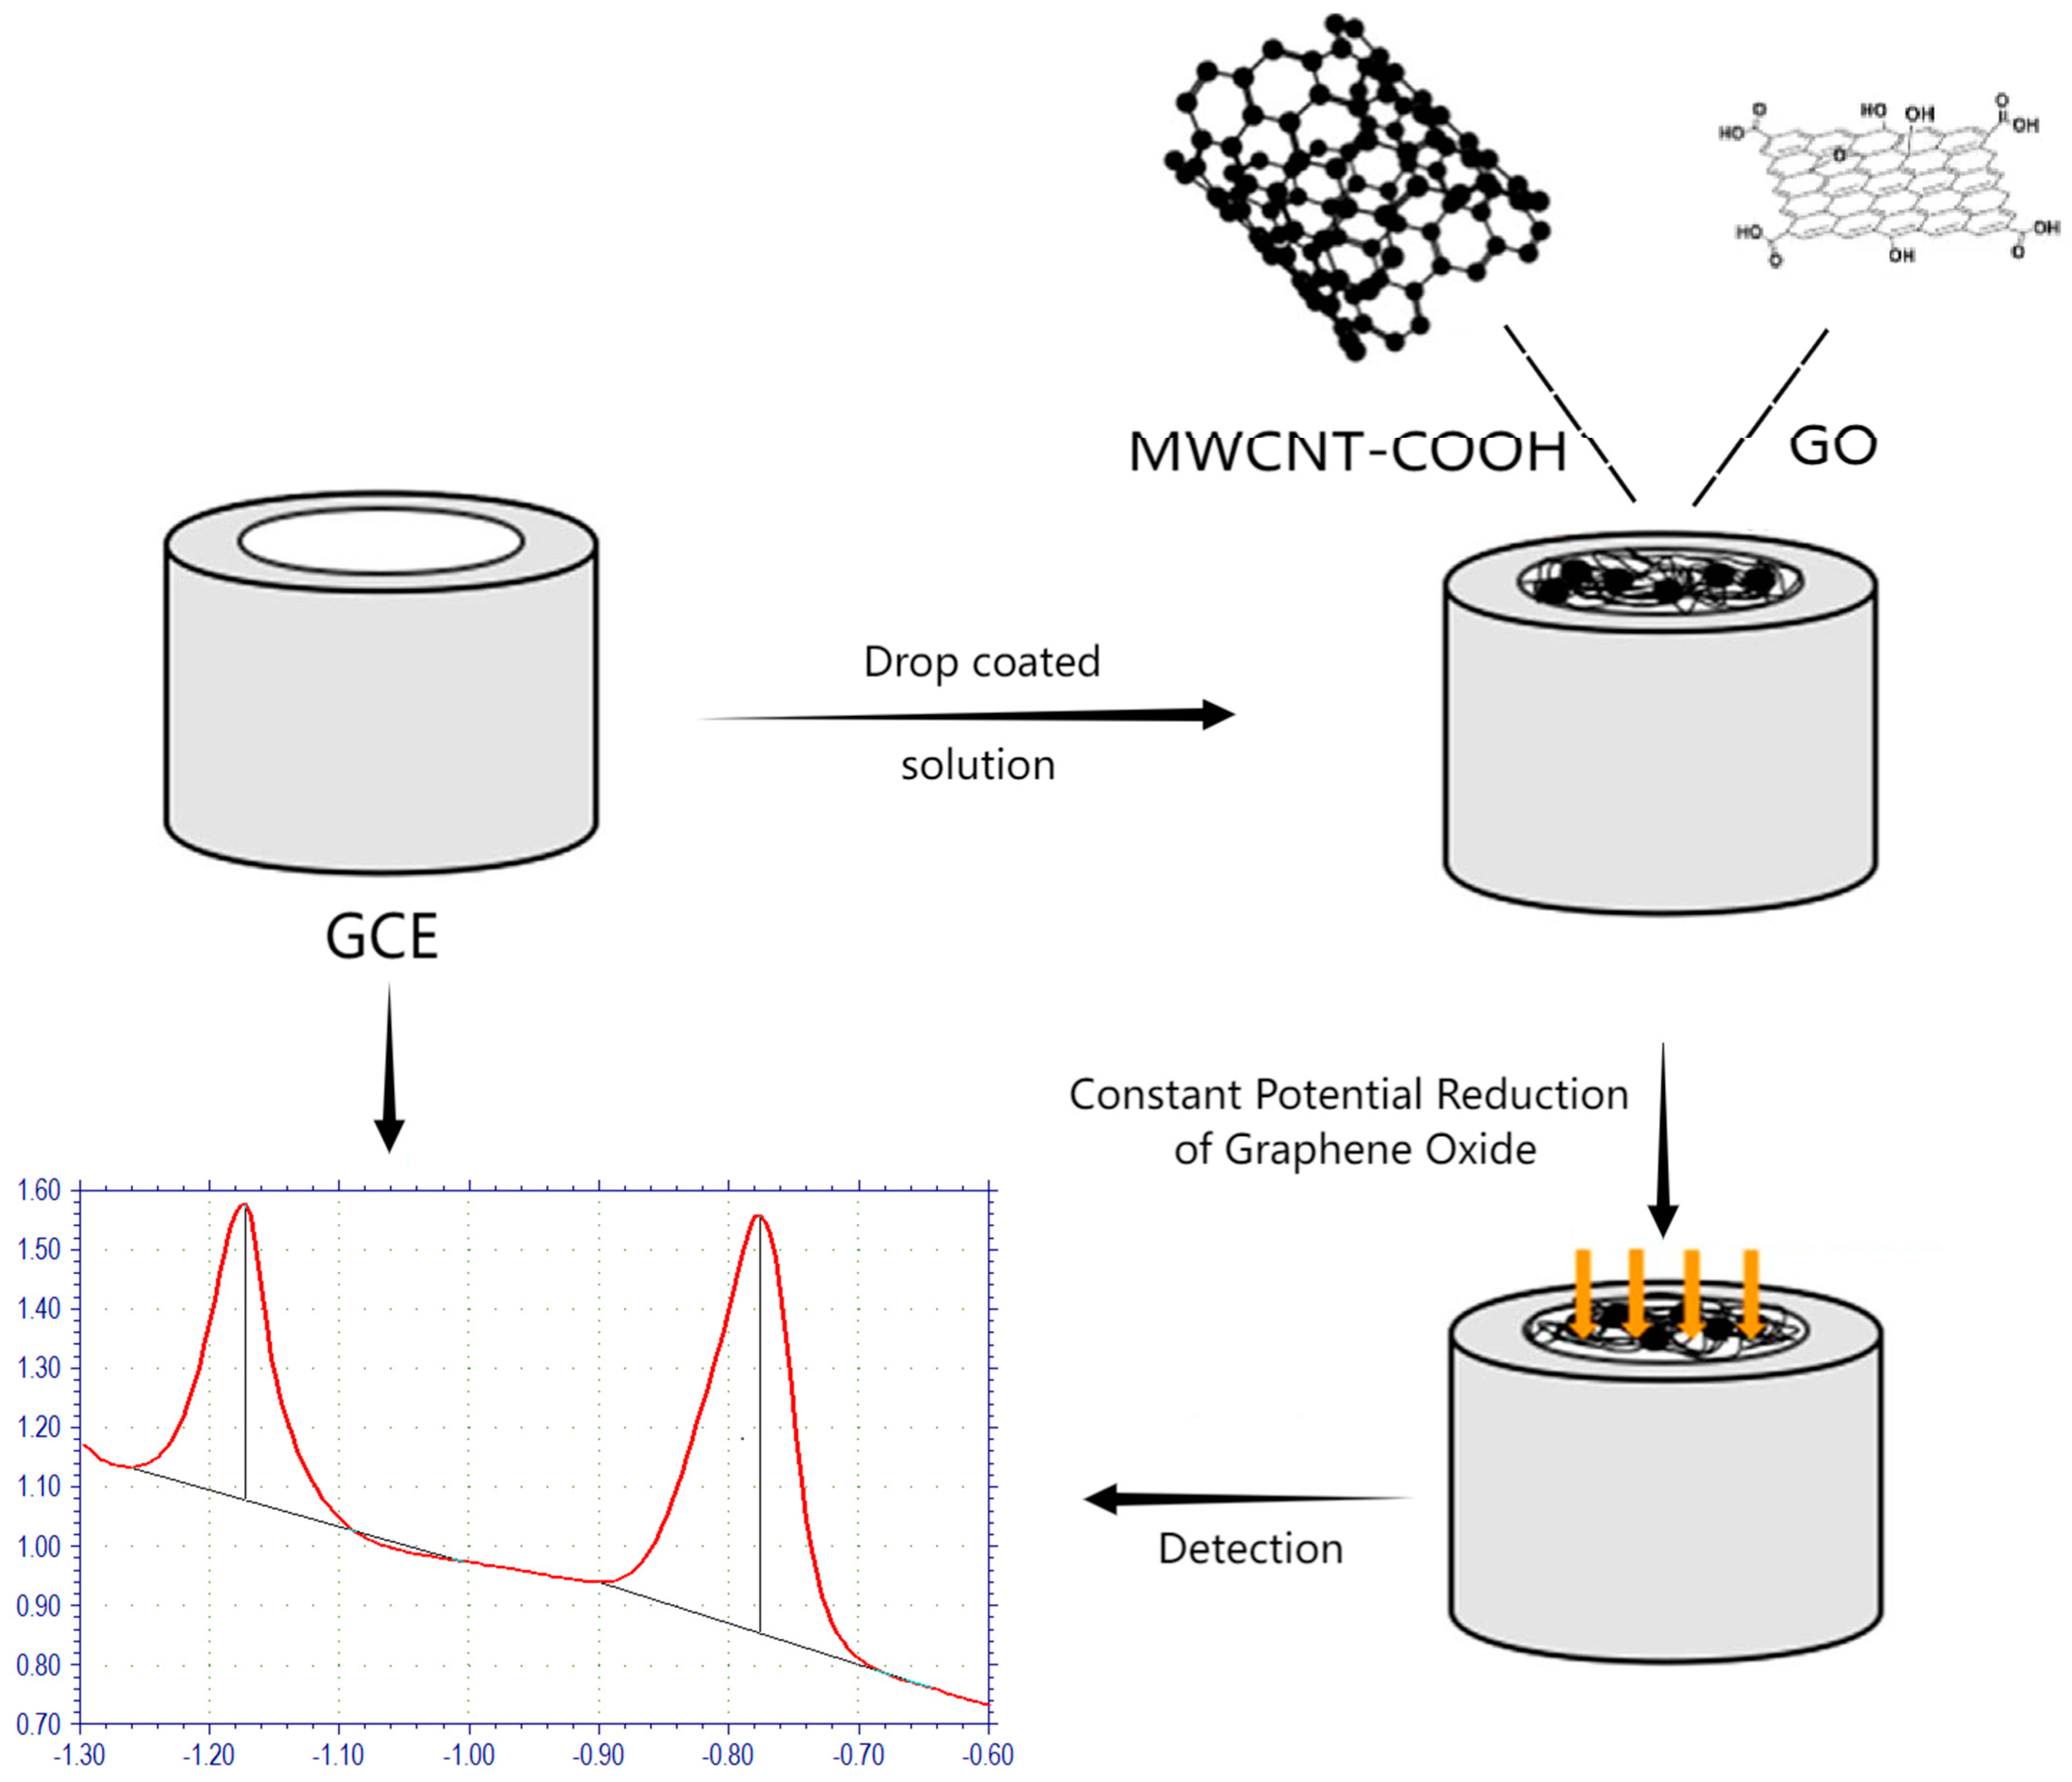
Appropriate amounts of GO and MWCNT-COOH powder were weighed, added to DMF, and ultra-sonically dispersed for 8 h to obtain stable dispersion. Briefly, 10 μL of the suspension was applied vertically dropwise to a clean GCE surface. GO/MWCNT-COOH/GCE is produced by drying in an electric blast drying oven. The electrically reduced graphene oxide/carboxylated multi-walled carbon nanotube composite-modified electrode (rGO/MWCNT-COOH/GCE) was obtained by a constant potential reduction for 600 s.The schematic diagram of detection mechanism is shown in Figure 1.

Figure 1.
Schematic diagram of detection mechanism.
2.3. Experimental Measurement
First, the standard solutions of Zn and Cd ions were diluted to different concentrations by using 0.1 mol/L pH 5.0 sodium acetate buffer (HAc-NaAc). Subsequently, the rGO/MWCNT-COOH/GCE, platinum wire electrode, and saturated mercuric chloride electrode were placed into the solution for constant potential enrichment of Cd(II) and Zn(II), with an enrichment potential of −1.3 V and an enrichment time of 500 s. Finally, the differential pulse voltammetry (DPV) detection was performed after the enrichment was completed; further, the scanning potential interval was set at −1.3 to −0.6 V, the potential increment at 50 mV, the frequency at 25 Hz, the amplitude at 5 mV, and the resting time at 30 s.
3. Results and Discussion
3.1. Electrochemical Characterisation of Modified Materials
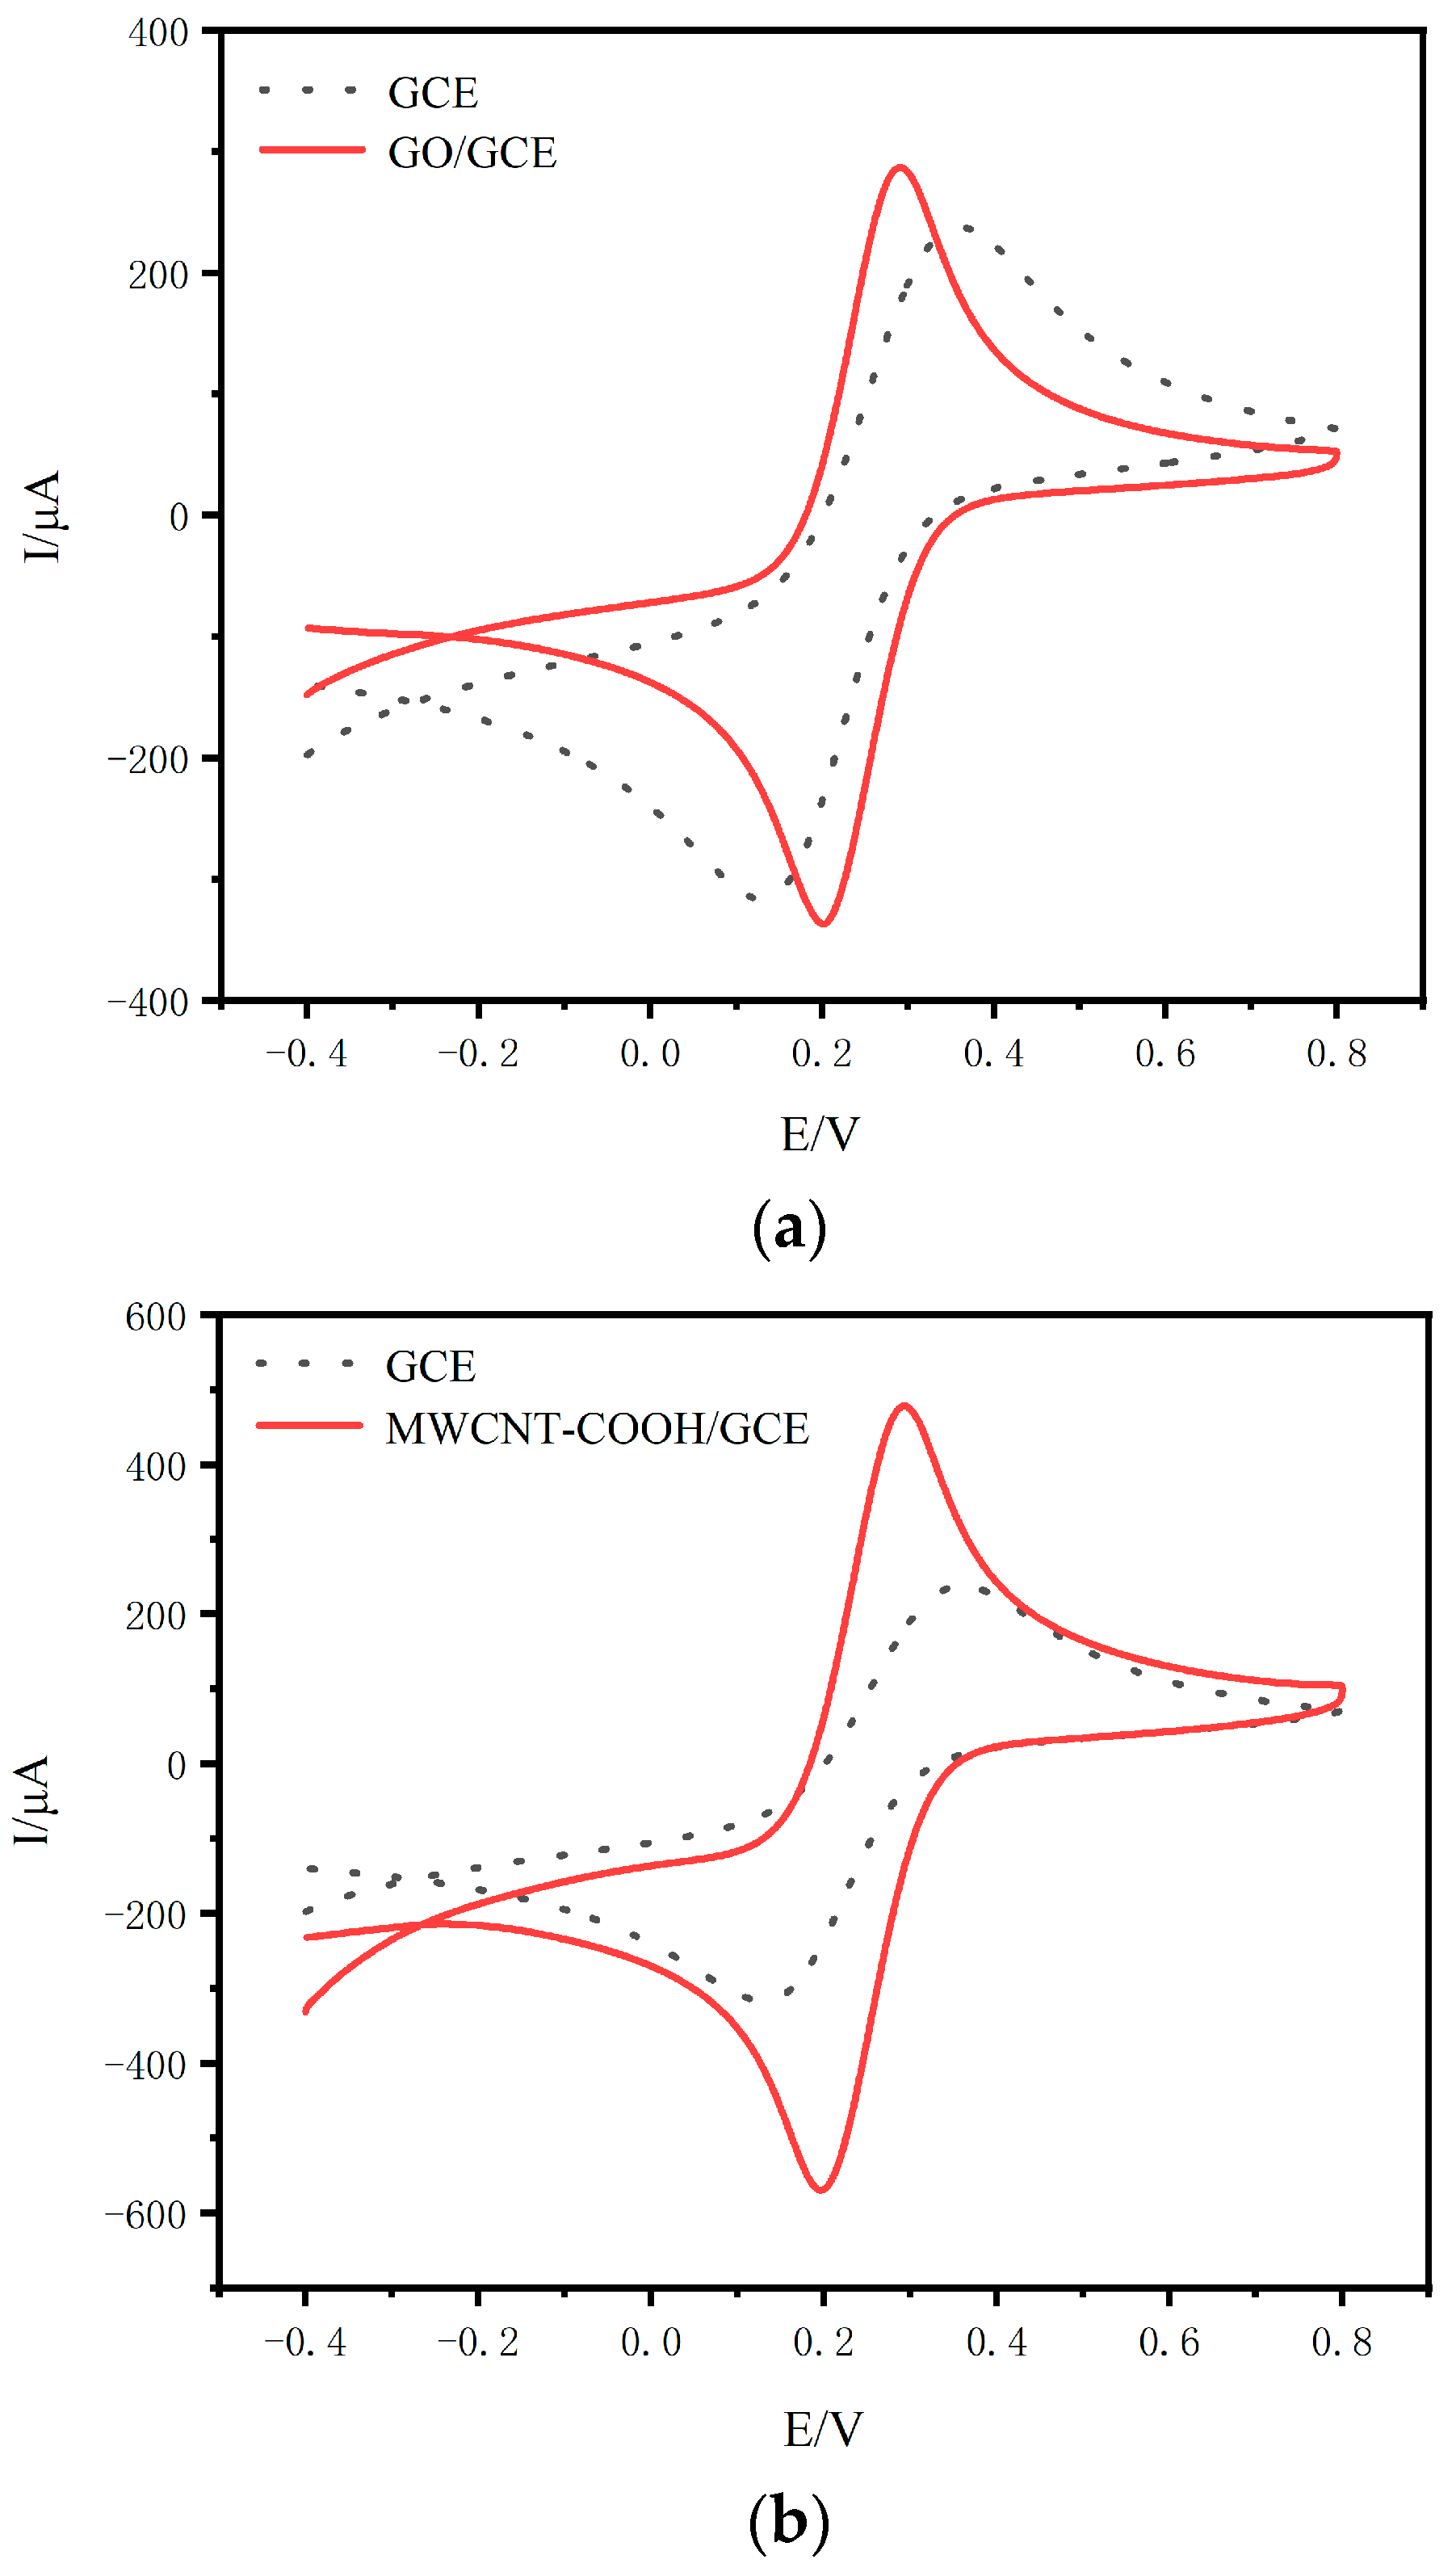
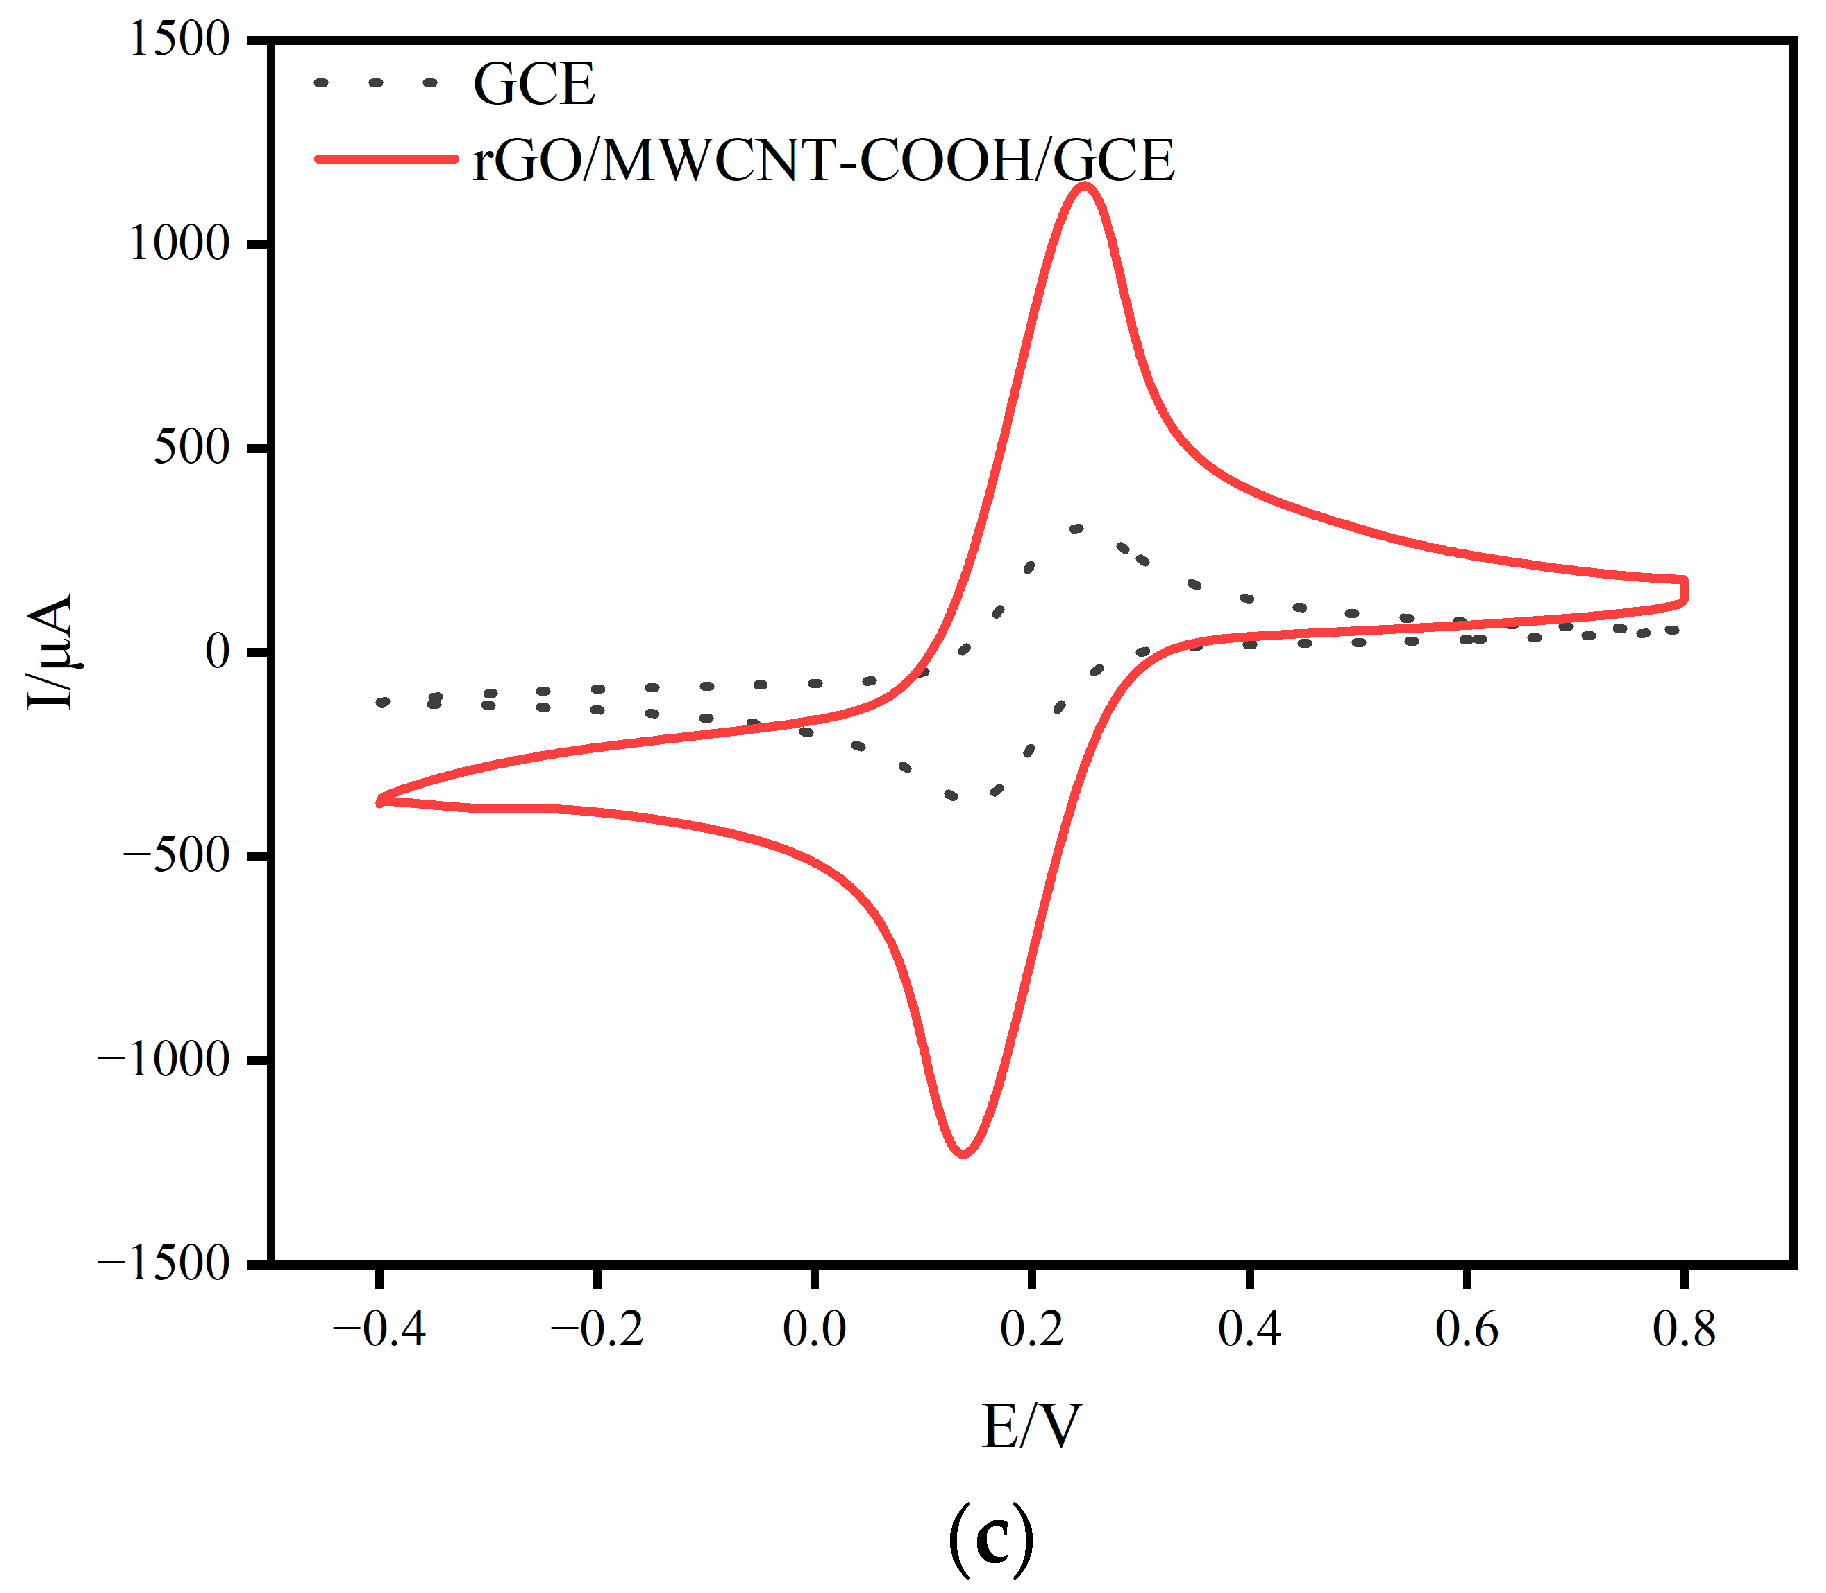
CV scanning was performed by placing GCE, GO/GCE, MWCNT-COOH/GCE, and rGO/MWCNT-COOH/GCE in a 1 mmol/L potassium ferricyanide solution, and the experimental results are shown in Figure 2a–c. The effective surface area was calculated to be 0.296 cm2 for GO/GCE, 0.519 cm2 for MWCNT-COOH/GCE, and 1.09 cm2 for rGO/MWCNT-COOH/GCE. rGO/MWCNT-COOH/GCE showed a significant increase in redox peak current compared with GCE, suggesting that the rGO/MWCNT-COOH composite modification material can accelerate the electrode surface electron transfer rate, enhance the reversibility of the electrode reaction, and have excellent electrical conductivity [23]. The ion-selective enhancement modification film was successfully modified on the surface of the microelectrode. It is also shown that the zinc ion selectively enhanced modified film can increase the specific surface area of the microelectrode and improve electrochemical detection of microelectrodes with increased reversibility of the electrode reaction. From the voltammogram, it can be seen that the oxidation peak current appears to increase rapidly when the scanning voltage reaches a certain value. This is because the voltage at this time makes the electrode sufficient to capture the electrons of the ions in the surrounding solution. As the ions are continuously consumed, the current begins to decrease until it is almost 0; later, when a reverse voltage is applied, the ions that had lost their electrons from the electrode gain electrons to return to a reduced state. This process is just the opposite of the oxidation peak, and the combination of the two is the reversibility of the electrode process.
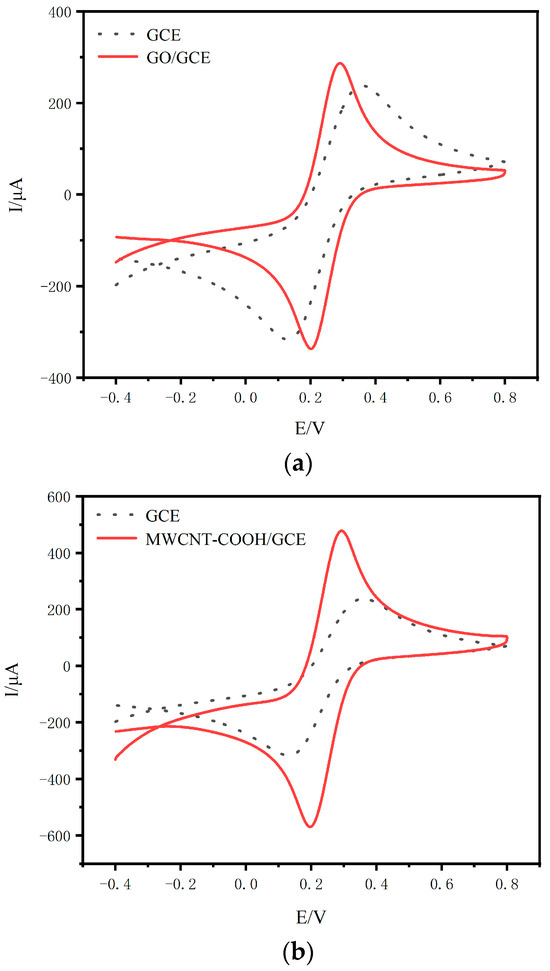
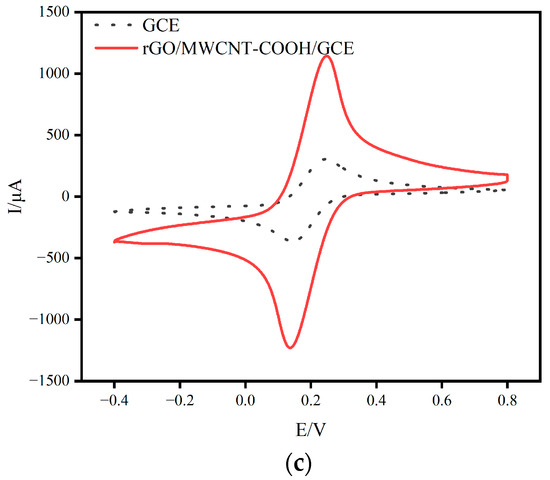
Figure 2.
(a) Cyclic voltammetric curve of GO/GCE in a 0.1 mol/L potassium ferricyanide solution. (b) Cyclic voltammetric curve of MWCNT-COOH/GCE in a 0.1 mol/L potassium ferricyanide solution. (c) Cyclic voltammetric curve of rGO/MWCNT-COOH/GCE in a 0.1 mol/L potassium ferricyanide solution.
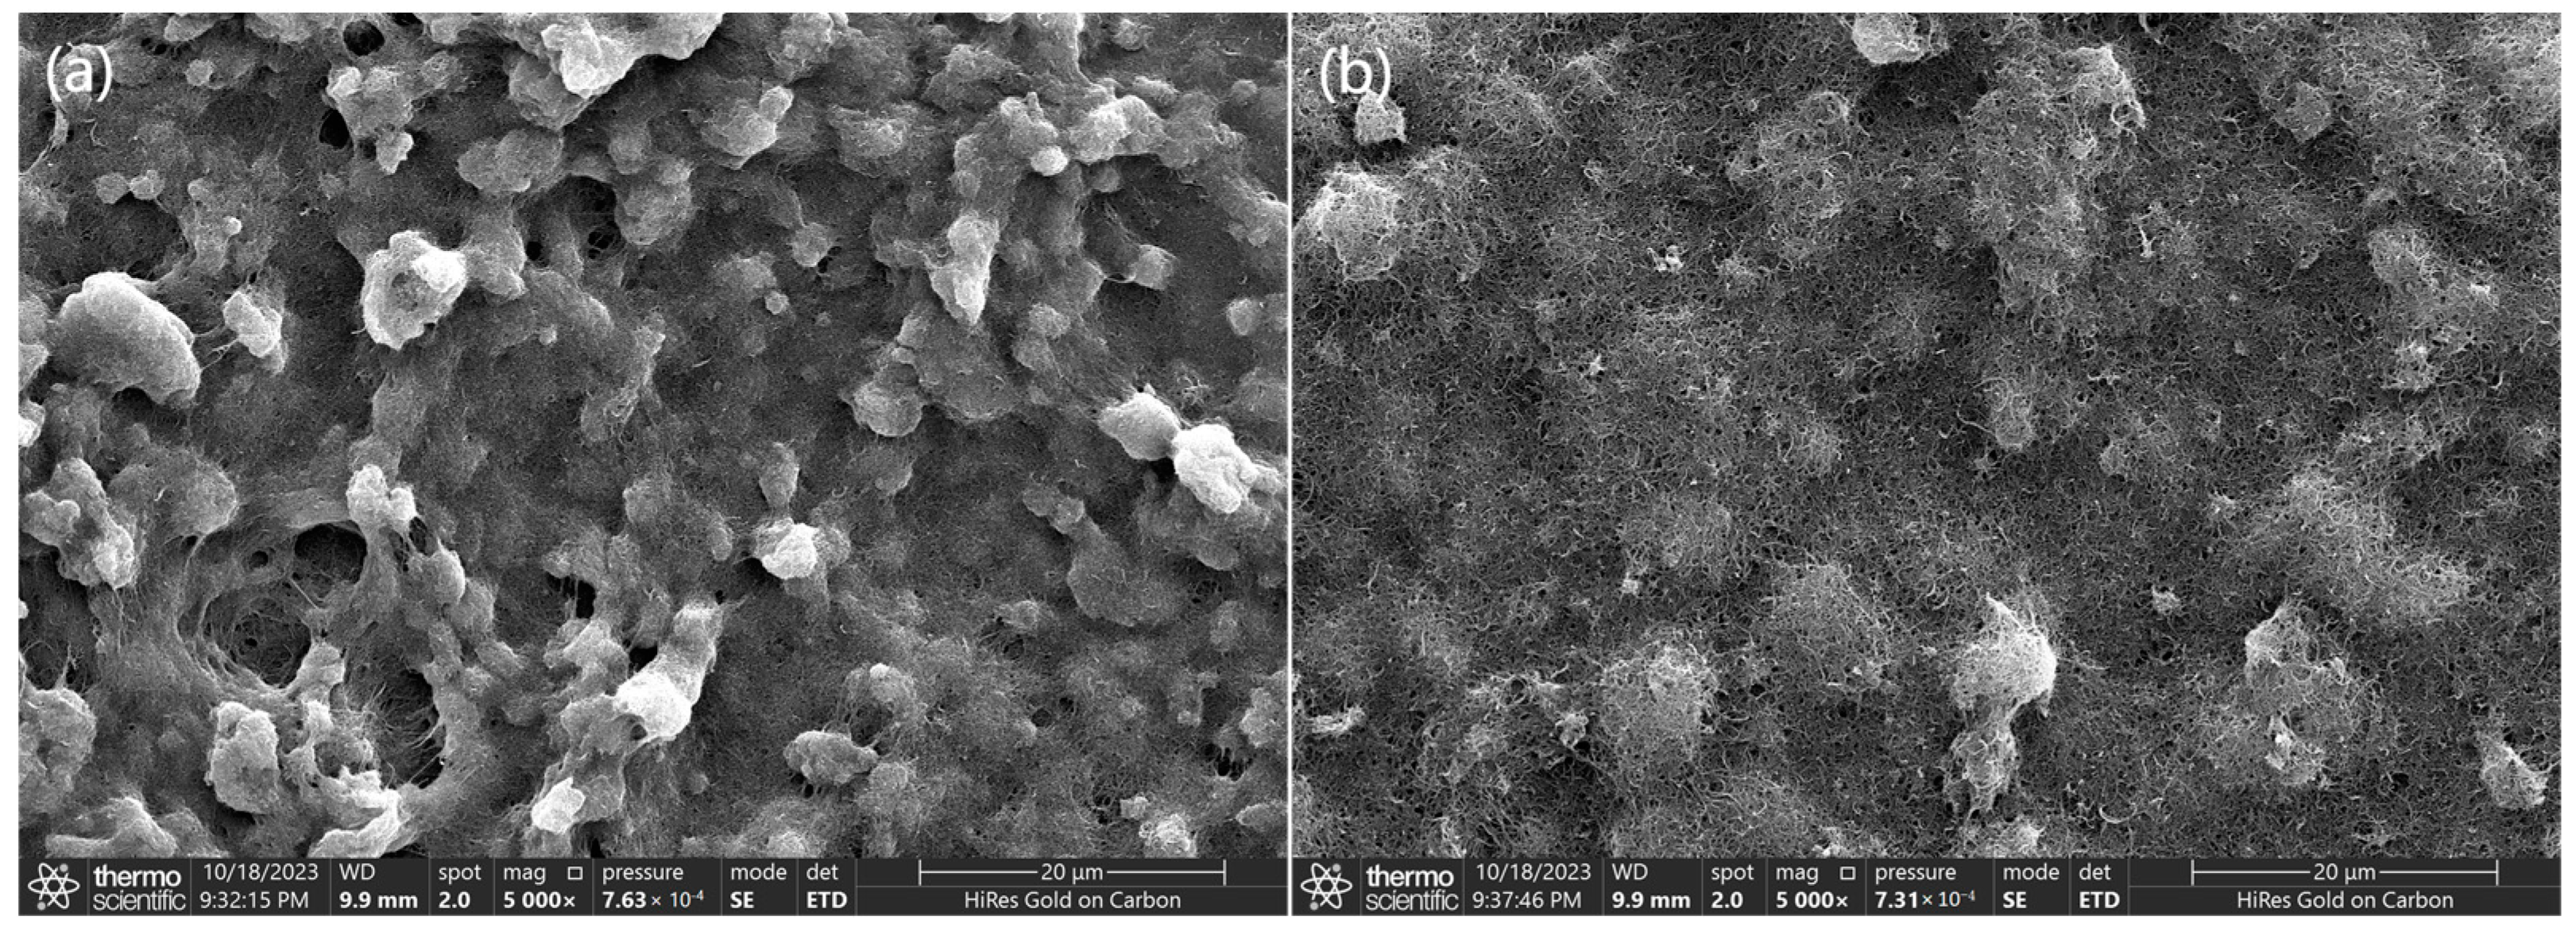
Figure 3a,b depict scanning electron microscopy (SEM) images of rGO-MWCNT-COOH treated by shock mixing in DMF. After a magnification of 5000×, it is evident that graphene oxide forms a multi-layered lamellar uneven structure after reduction, and a large amount of dispersed MWCNT-COOH is attached to the electrode surfaces and between the crevices, which makes the specific surface area of the material increase significantly. Concurrently, the number of active sites on the surface of the material is also increased substantially. This is extremely favourable for the enhancement of the physical adsorption and electrochemical properties of the material.

Figure 3.
(a) rGO/MWCNT-COOH/GCE SEM material. (b) MWCNT-COOH/GCE SEM material.
3.2. Detection Performance of Modified Electrodes
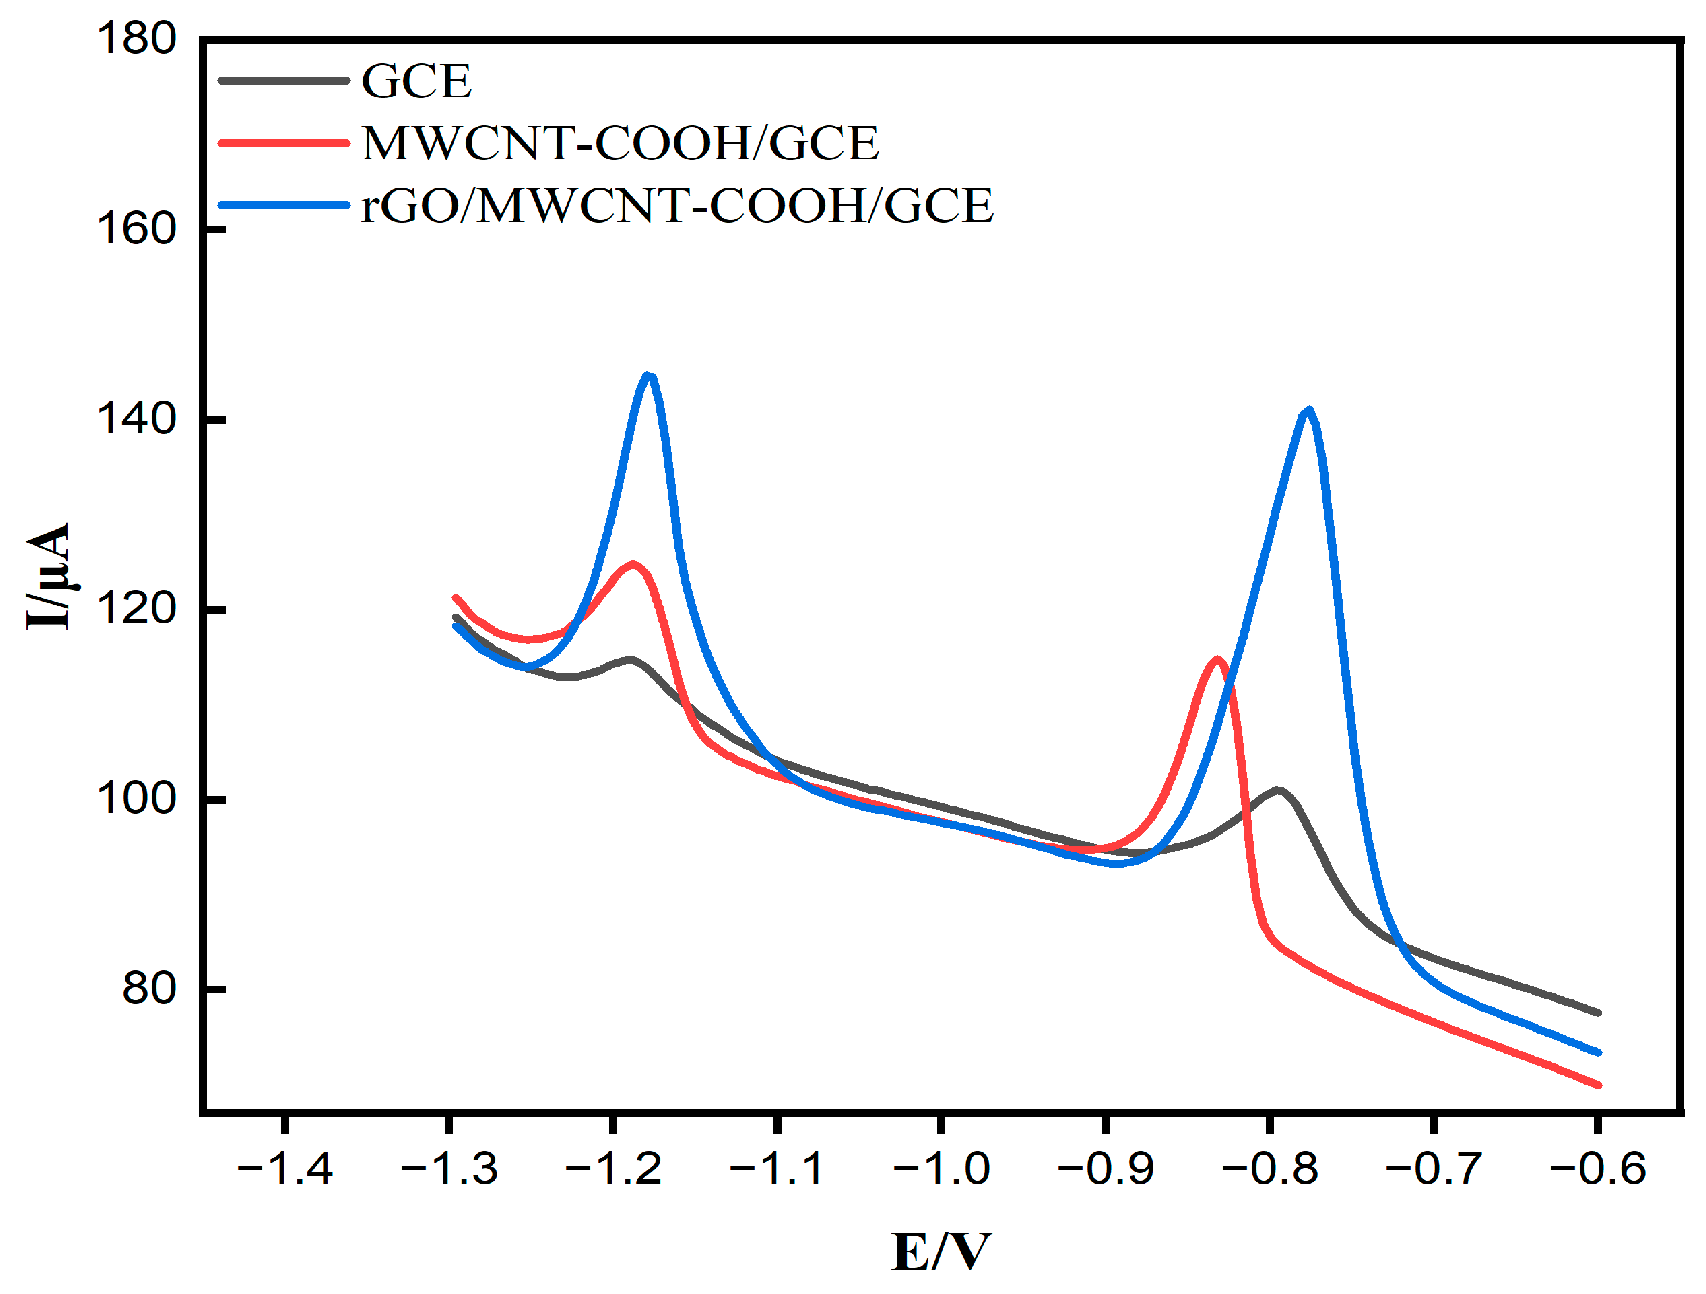
The strength of three different electrodes, rGO/MWCNT-COOH/GCE, MWCNT-COOH/GCE, and GCE, in response to Cd(II) and Zn(II) signals, was compared by DPV. As shown in Figure 4, all three electrodes show apparent dissolution peaks of Zn(II) at −1.2 V and Cd(II) at −0.8 V. Because of the combination of rGO and MWCNT-COOH, the dissolution peak current of rGO/MWCNT-COOH/GCE is larger than that of the other two working electrodes; further, the specific surface area of the working electrode is effectively enlarged, which provides better electrocatalytic performance and improves the detection signals for these two heavy metal ions. This is because rGO and MWCNT-COOH have good conductivity and large specific surface area for Cd(II) and Zn(II) adsorption, and MWCNT-COOH adsorbed on the surface of rGO increases the specific surface area, and also provides a large number of active sites, which is conducive to physical adsorption of the material and improves the electrochemical detection performance. This indicates that the microelectrodes modified by the zinc ion selectivity-enhanced composite membrane selected in this paper have good sensitivity and selectivity for zinc ion detection.
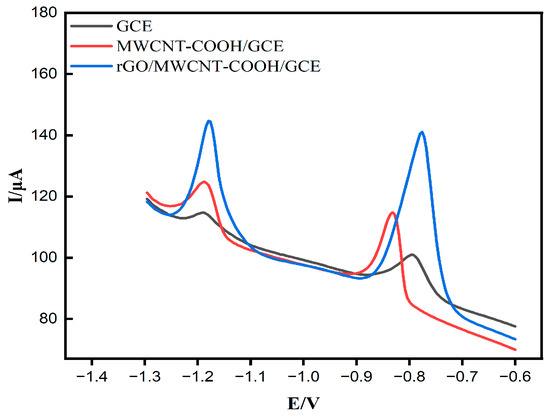
Figure 4.
DPSV plot of the different electrodes in a solution of sodium acetate containing 500 μg/L of Cd(II) and Zn(II).
3.3. Optimisation of Measurement Conditions
3.3.1. Effects of Buffer Solution and pH Value
Buffer solutions have a direct impact on the stability, anti-interference, and peak size of zinc ion detection due to the different electrolytes in different buffer solutions, resulting in different effects on heavy metal ion detection. The DPV assay was performed in potassium chloride buffer solution (KCl), phosphate buffer solution (PBS), and acetate buffer solution (HAc-NaAc) that all contained 500 μg/mL of mixed ions; the concentration of all three buffer solutions was 0.1 mol/L and the pH was 5.0. The measurements indicated that the peak ionic currents measured in the HAc-NaAc buffer solution were greater than in the remaining two buffer solutions, and therefore the HAc-NaAc solution was chosen as the buffer solution in this paper.
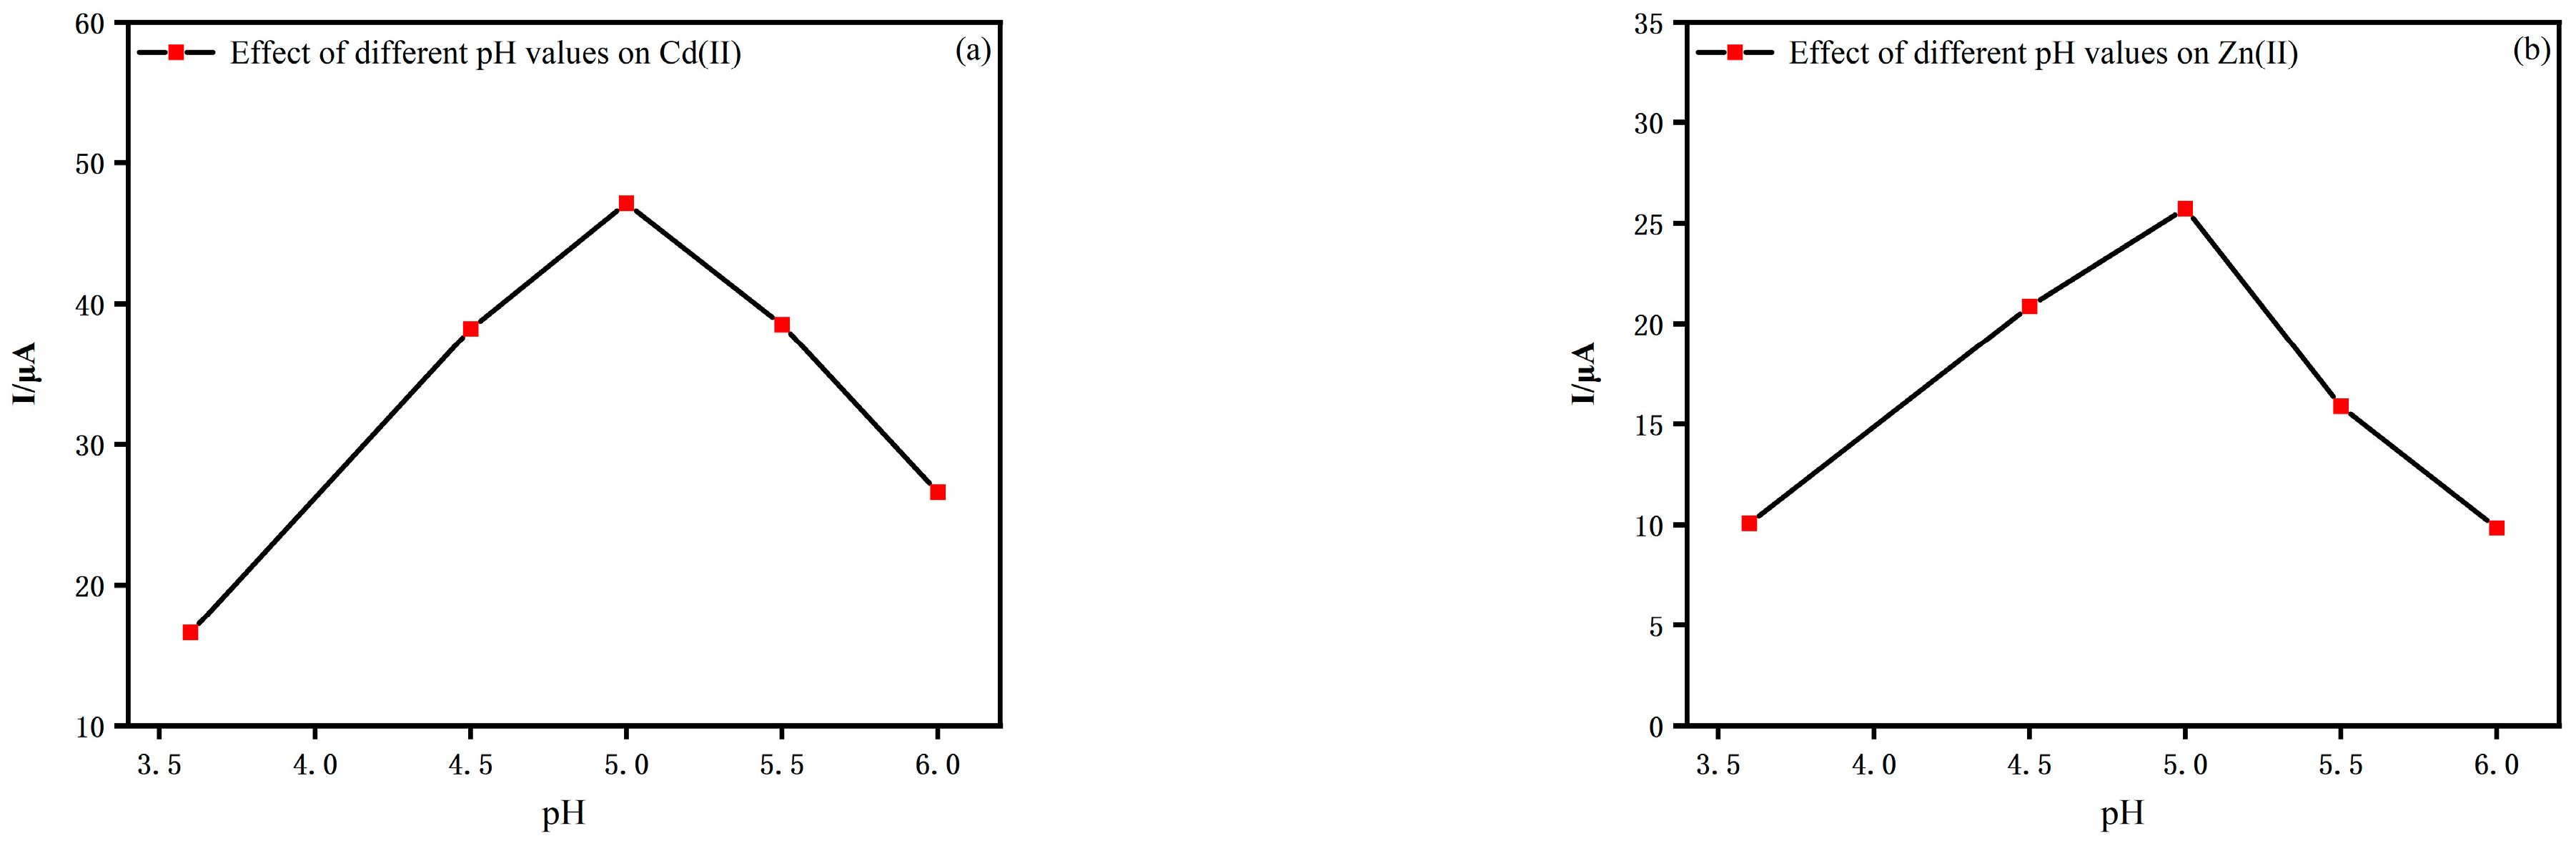
Figure 5a,b show the current response of Cd(II) and Zn(II) in 1 mmol/L HAc-NaAc solution. The peak response current increases at pH values from 3.5 to 5.0 and decreases at pH values above 5.0. This is due to the phenomenon of hydrogen evolution that leads to a decrease in Cd and Zn deposition at low pH, whereas at high pH, complexes are created and affect the dissolution signal.
Figure 5.
(a) Effect of different pH values on Cd(II). (b) Effect of different pH values on Zn(II).
3.3.2. Effects of Accumulation Potential and Accumulation Time
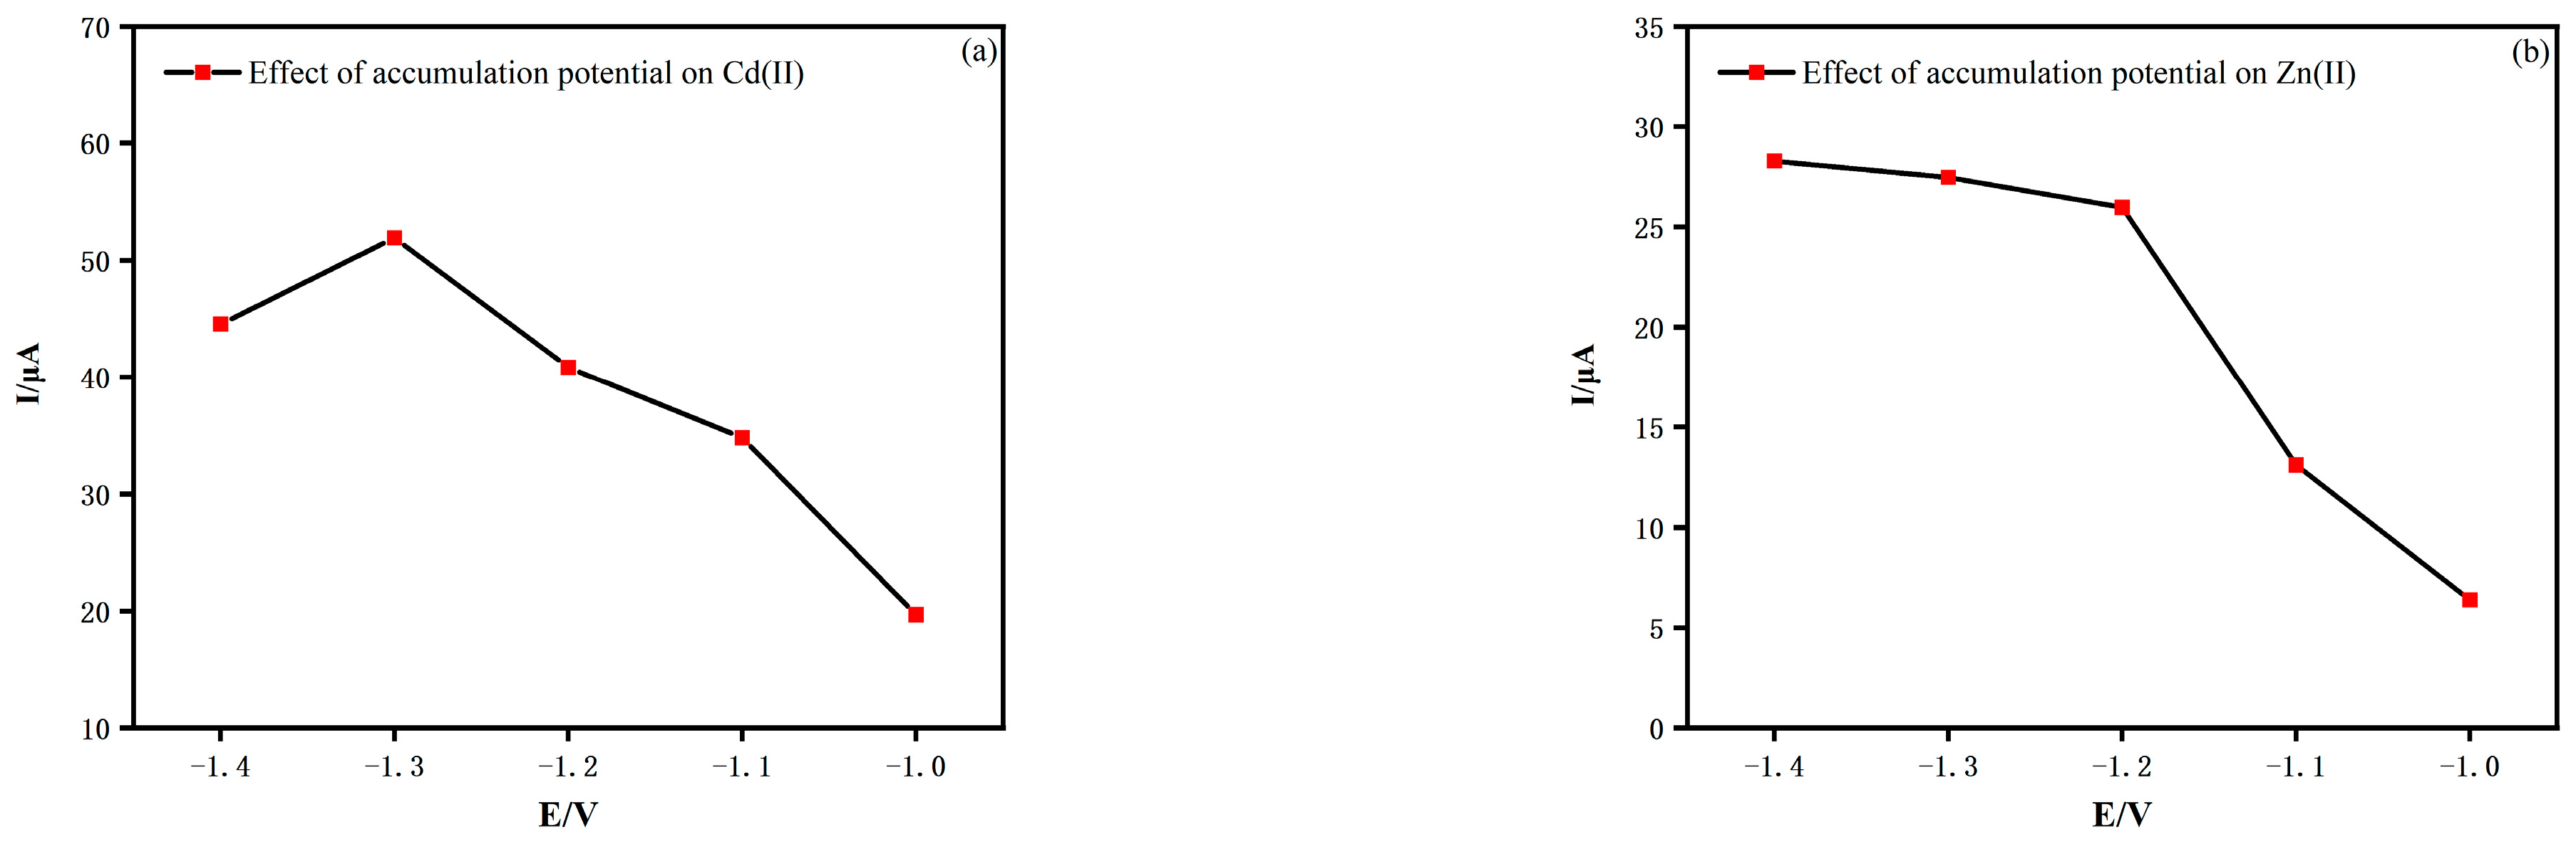
Figure 6a show the peak current densities of Cd(II) on rGO/MWCNT-COOH GCE as the accumulation potential varies from −1.40 to −1.00 V. When the detection potential is shifted forward from −1.40 V to −1.30 V, the current density of Cd(II) increases significantly due to the enhanced kinetics. The current density of Cd(II) reaches its maximum value at an accumulation potential of −1.30 V; as the accumulation potential continues to move from −1.30 V to −1.00 V, the current density decreases due to the interference of hydrogen evolution.

Figure 6.
(a) Effect of accumulation potential on Cd(II). (b) Effect of accumulation potential on Zn(II).
In order to maintain consistency of experimental conditions, Figure 6b show the peak current densities of Zn(II) on rGO/MWCNT-COOH GCE as the accumulation potential varies from −1.40 to −1.00 V. The peak current does differ much between −1.4 V and −1.3 V. This is due to the fact that Zn(II) accumulates more readily at more negative potentials, while beyond −1.3 V, the peak current drops significantly due to hydrogen evolution.
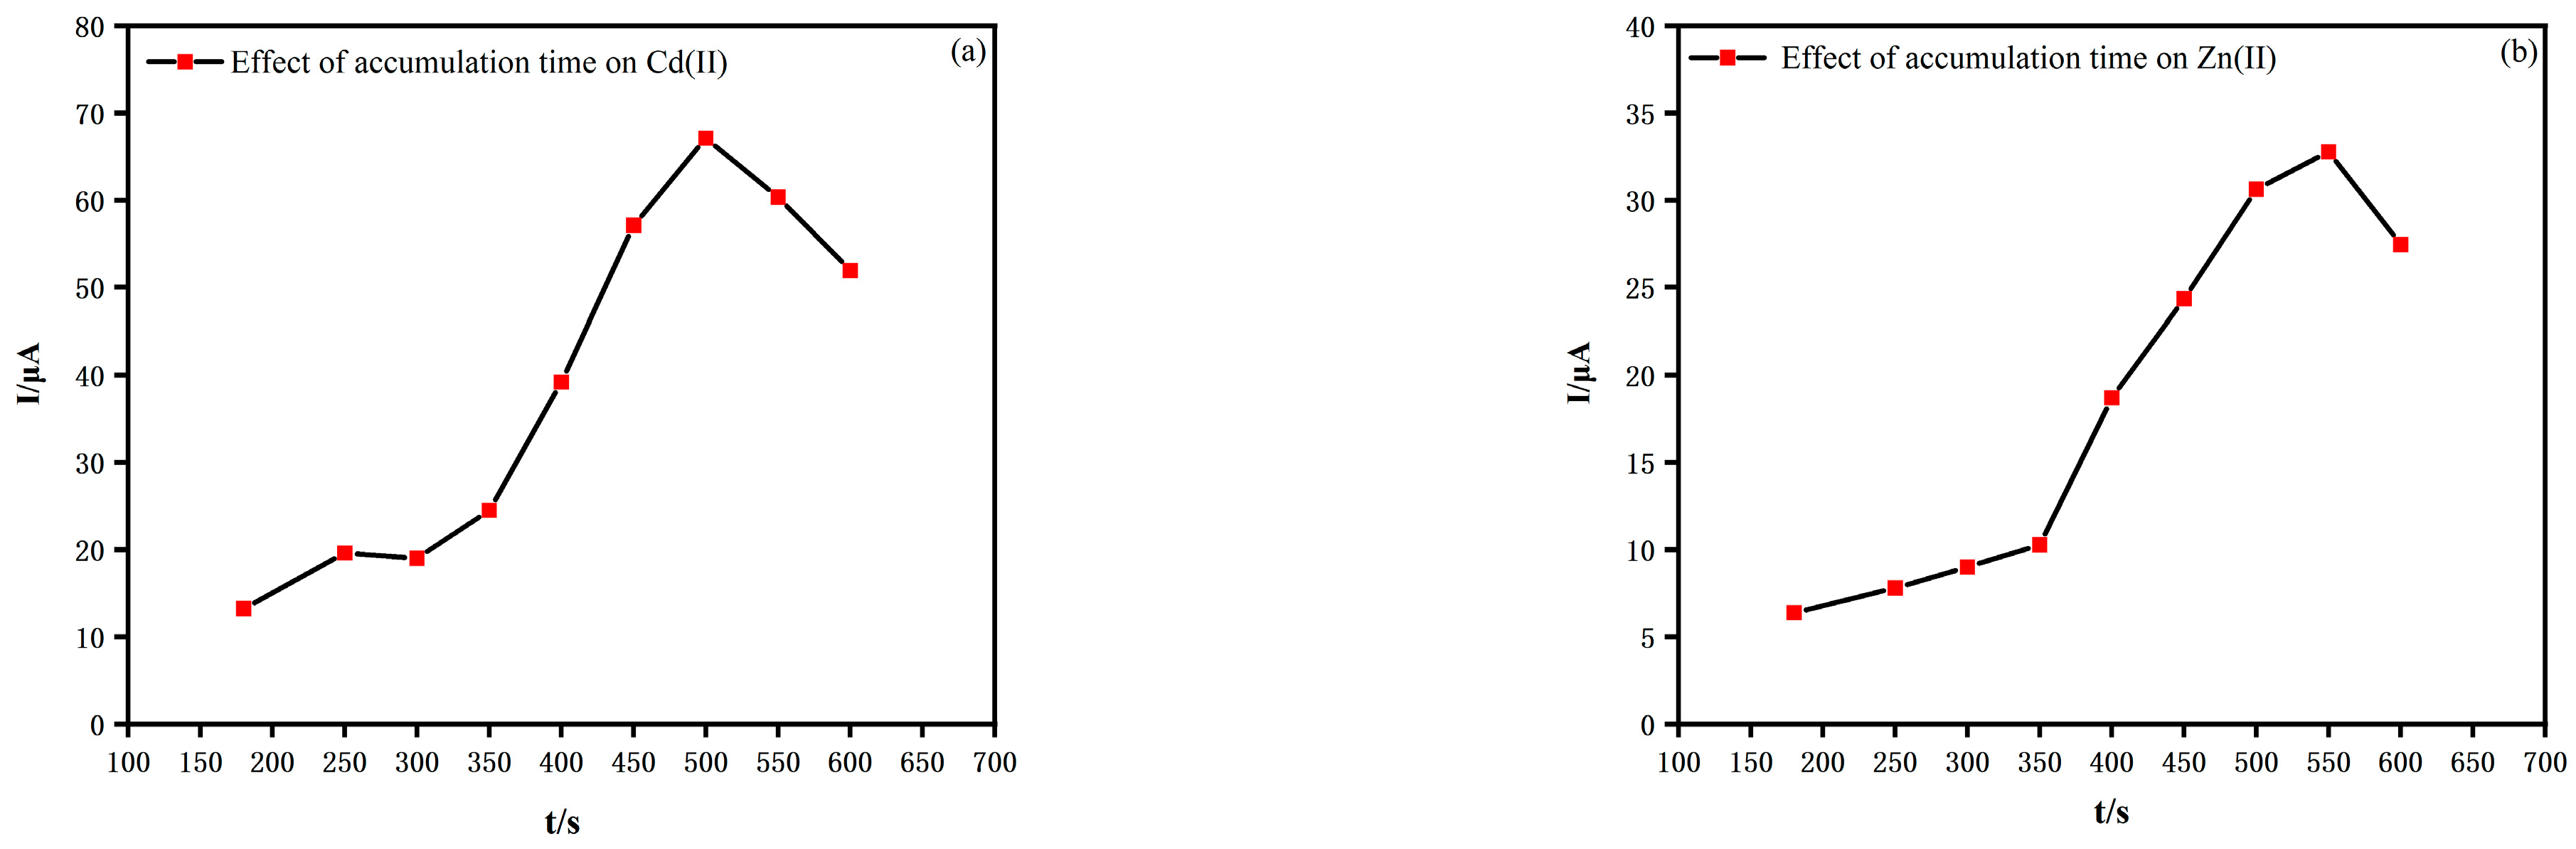
As shown in Figure 7a, the longer the accumulation time, the higher the peak current density, from 180 to 500 s, and then it slowly decreases as the accumulation time exceeds 500 s for Cd(II). As shown in Figure 7b, the longer the accumulation time, the higher the peak current density, from 180 to 550 s, and then it slowly decreases as the accumulation time exceeds 550 s for Zn(II). The reason is that during accumulation, if the diffusion rate of the analyte on the electrode surface is limited and the diffusion rate of the analyte is far lower than the accumulation rate on the electrode surface, a long accumulation time may lead to a thicker diffusion layer of the analyte, and the rate of increase of the analyte concentration on the electrode surface slows down, which leads to a decrease in the potential.
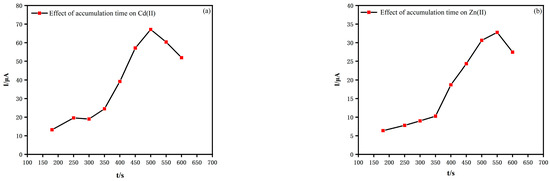
Figure 7.
(a) Effect of accumulation time on Cd(II). (b) Effect of accumulation time on Zn(II).
3.3.3. Effect of Film Thickness
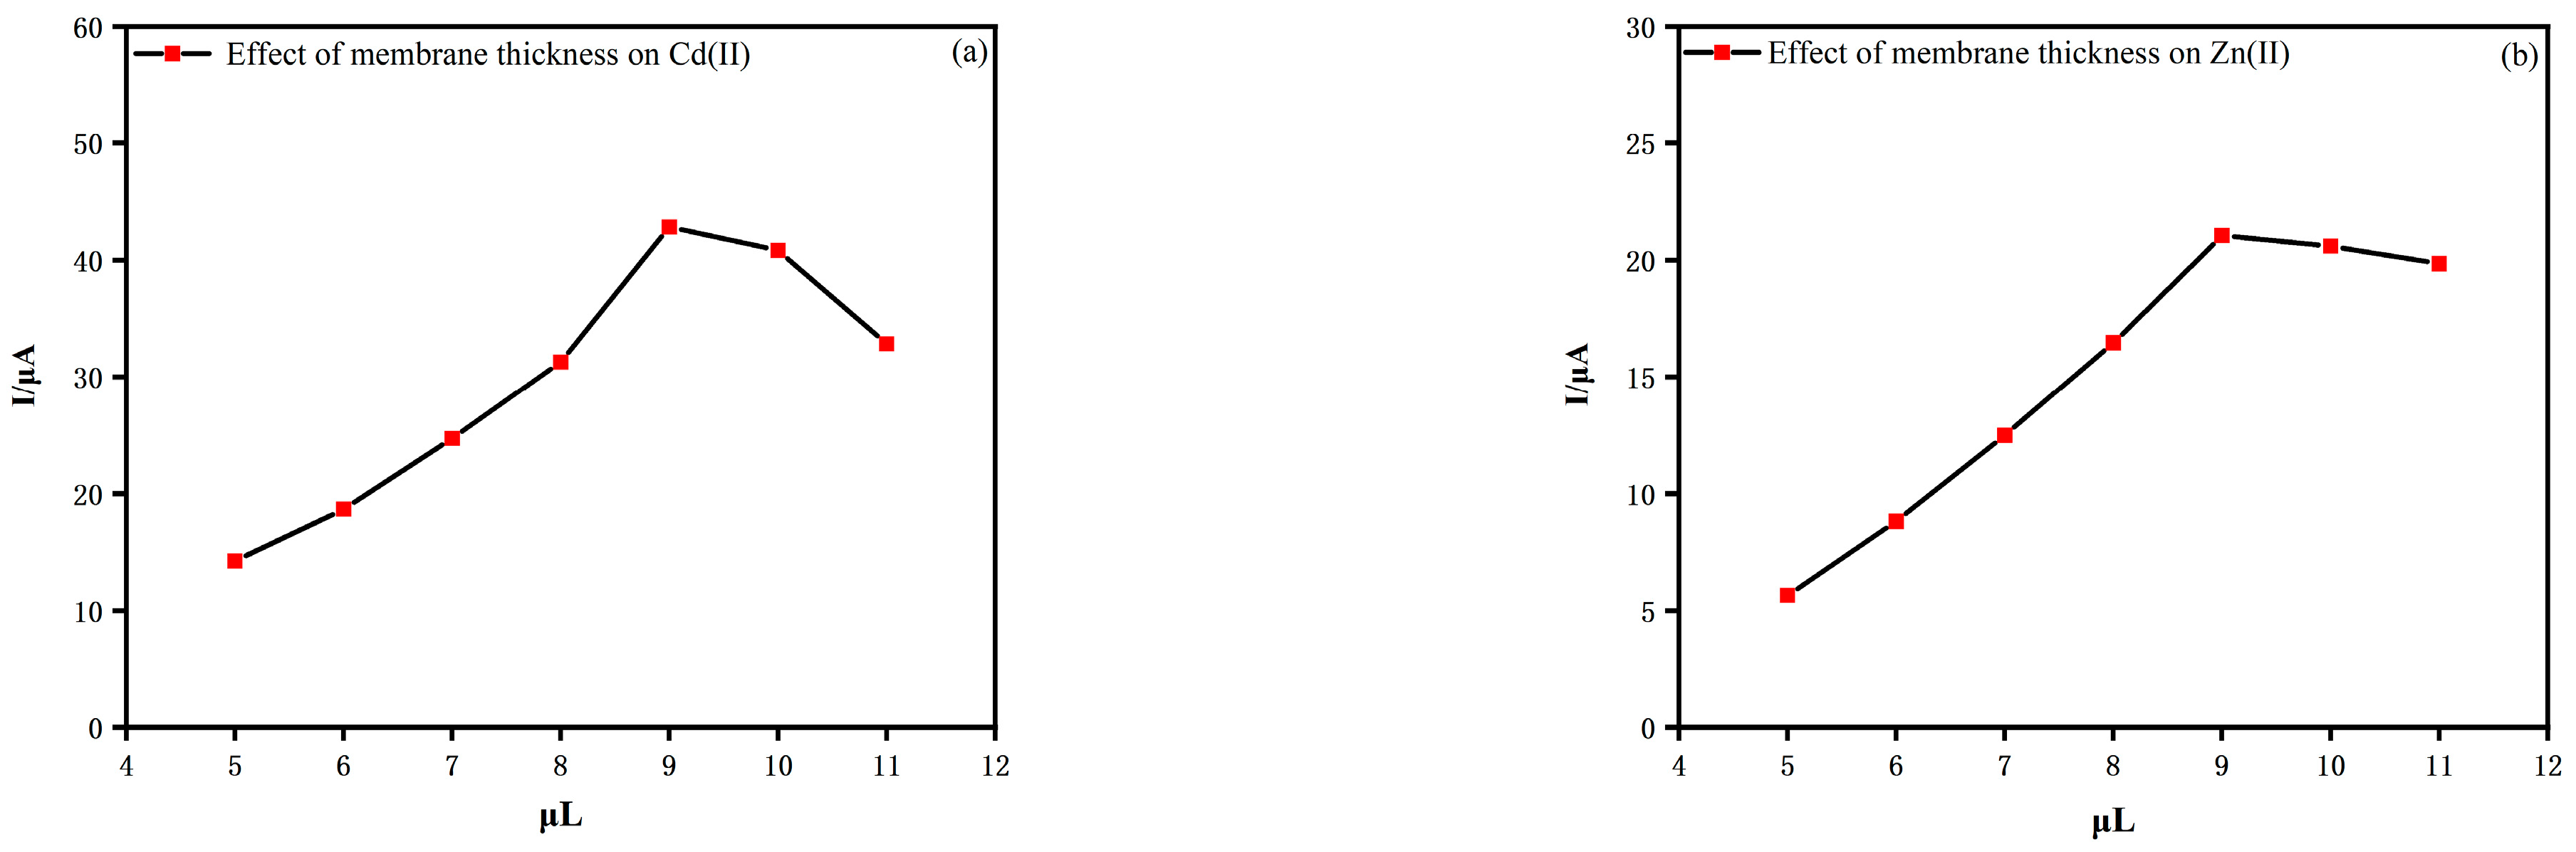
The effect of film thickness on the peak current of Cd(II) and Zn(II) dissolution was investigated, as shown in Figure 8a,b. The film thickness referred to in this article refers to the amount of drop coating of the modified material. In the experiment, the volume of the modified film was selected from 5 to 9 μL. And the peak current reaches the maximum value when the volume is 9 μL, which was attributed to the fact that too thick a film reduces the electron transmittance, while too thin a film does not have the optimum adsorption capacity.
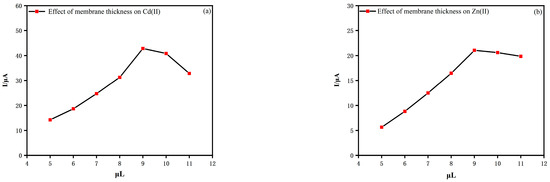
Figure 8.
(a) Effect of membrane thickness on Cd(II). (b) Effect of membrane thickness on Zn(II).
3.4. Orthogonal Experiments with Optimised Conditions
In this paper, two metal ions are detected at the same time. In order to be able to determine the optimal optimisation conditions while keeping the experimental conditions consistent, orthogonal tests were designed to validate the above-selected optimal experimental conditions. The orthogonal table of type L9(34) was selected to establish a four-factor, three-level experimental condition, as shown in Table 1. According to the four factors of different pH, accumulation potential, accumulation time, and film thickness, the optimal levels of the previous experiments were taken with the left and right two neighbouring two levels, respectively, to construct a four-factor, three-level orthogonal table. That is, L9(34)-type orthogonal table, where L is the table code, 9 is the number of experimental programmes, 3 is the number of levels, and 4 is the number of factors.

Table 1.
Four-factor, three-level experimental conditions.
After selecting the orthogonal test factor level table, the orthogonal test assistant software “Microsoft Excel 2016” can be used to fill in the corresponding factors and levels to generate the orthogonal test protocol table. This is because the orthogonal test protocol table has already disrupted the factor level arrangement and combinations so that the optimal conditions can be verified in the minimum number of experiments. In the experiment, each level was calculated three times, calculating the mean and extreme deviation of the results of three experiments at the same level and establishing effect curves for trends in the levels of each factor based on mean values. It was determined by a calculation that 5.0 was the optimal value of the three levels of the factor pH, −1.3 V was the optimal value of the three levels of the factor potential, 500 s was the optimal value of the three levels of the accumulation time, and 9 μL was the optimal value of the three levels of the film thickness.
3.5. Mixed Determination of Heavy Metal Ions
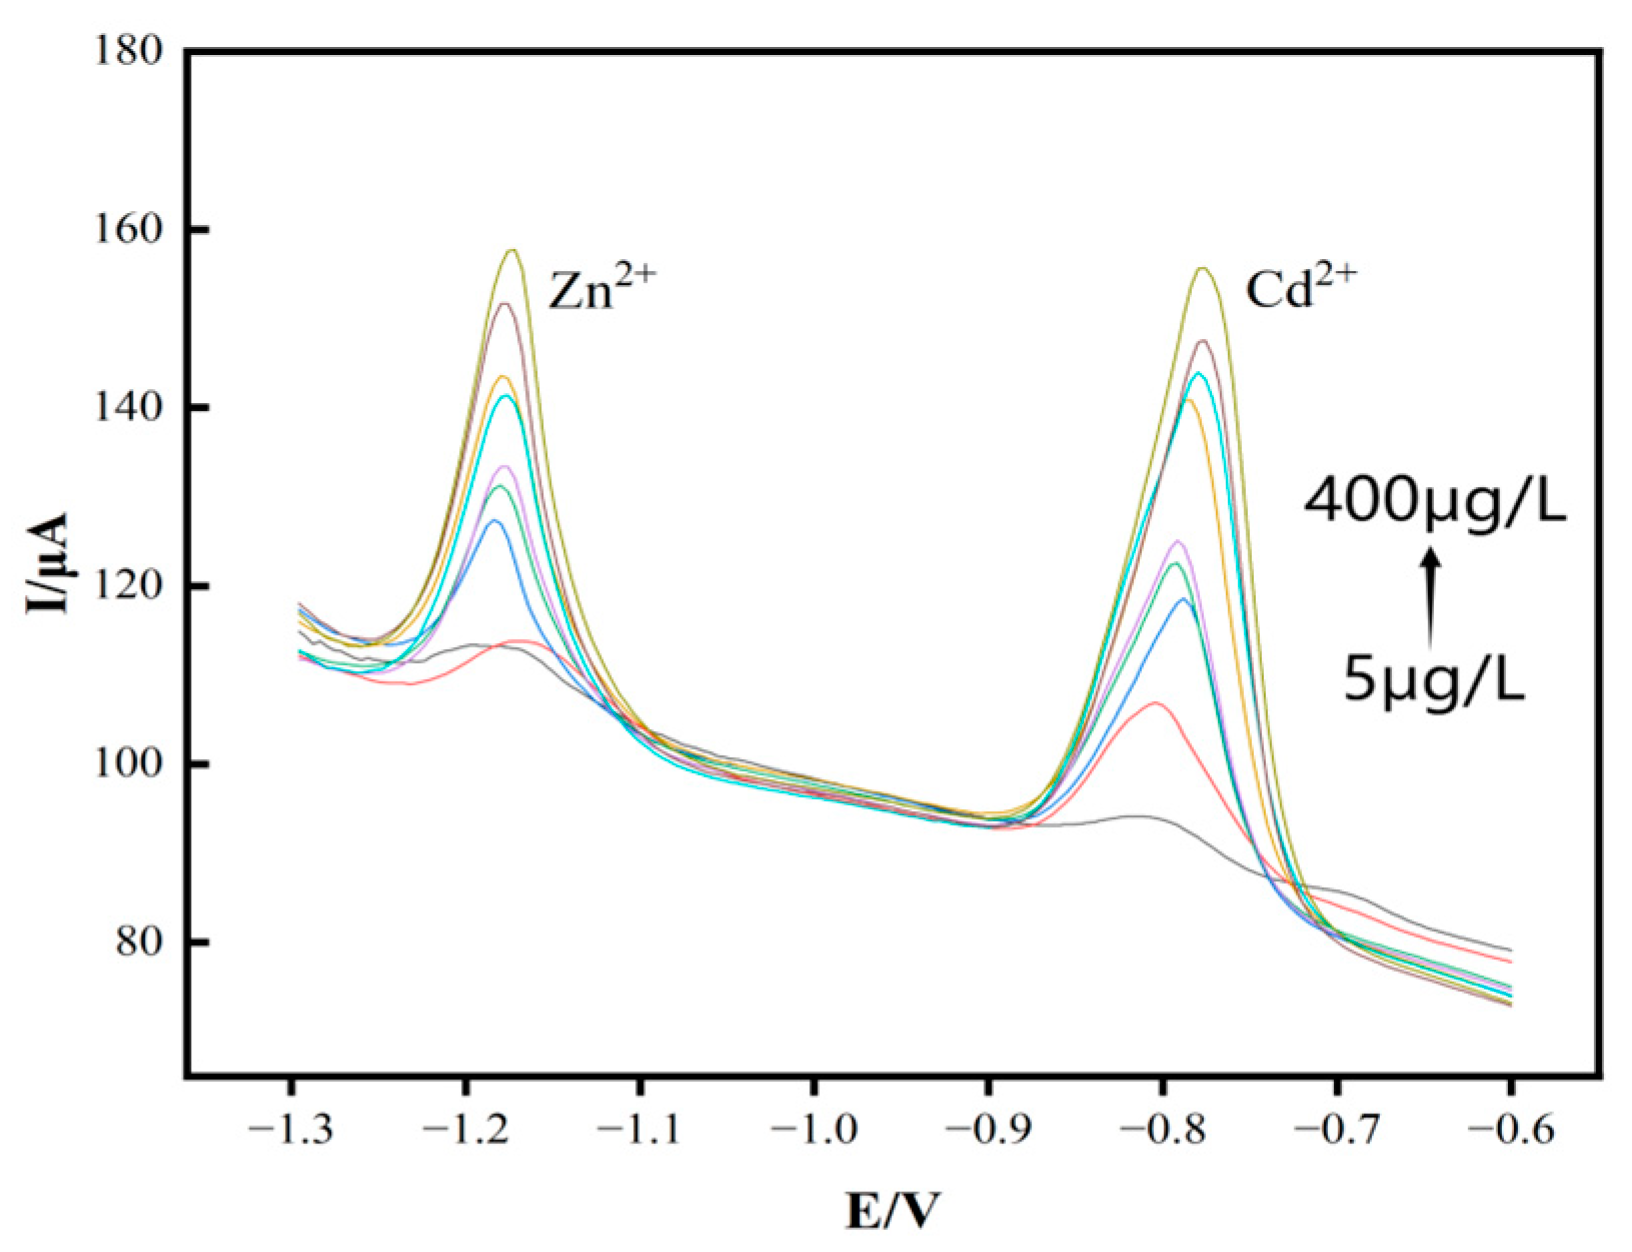
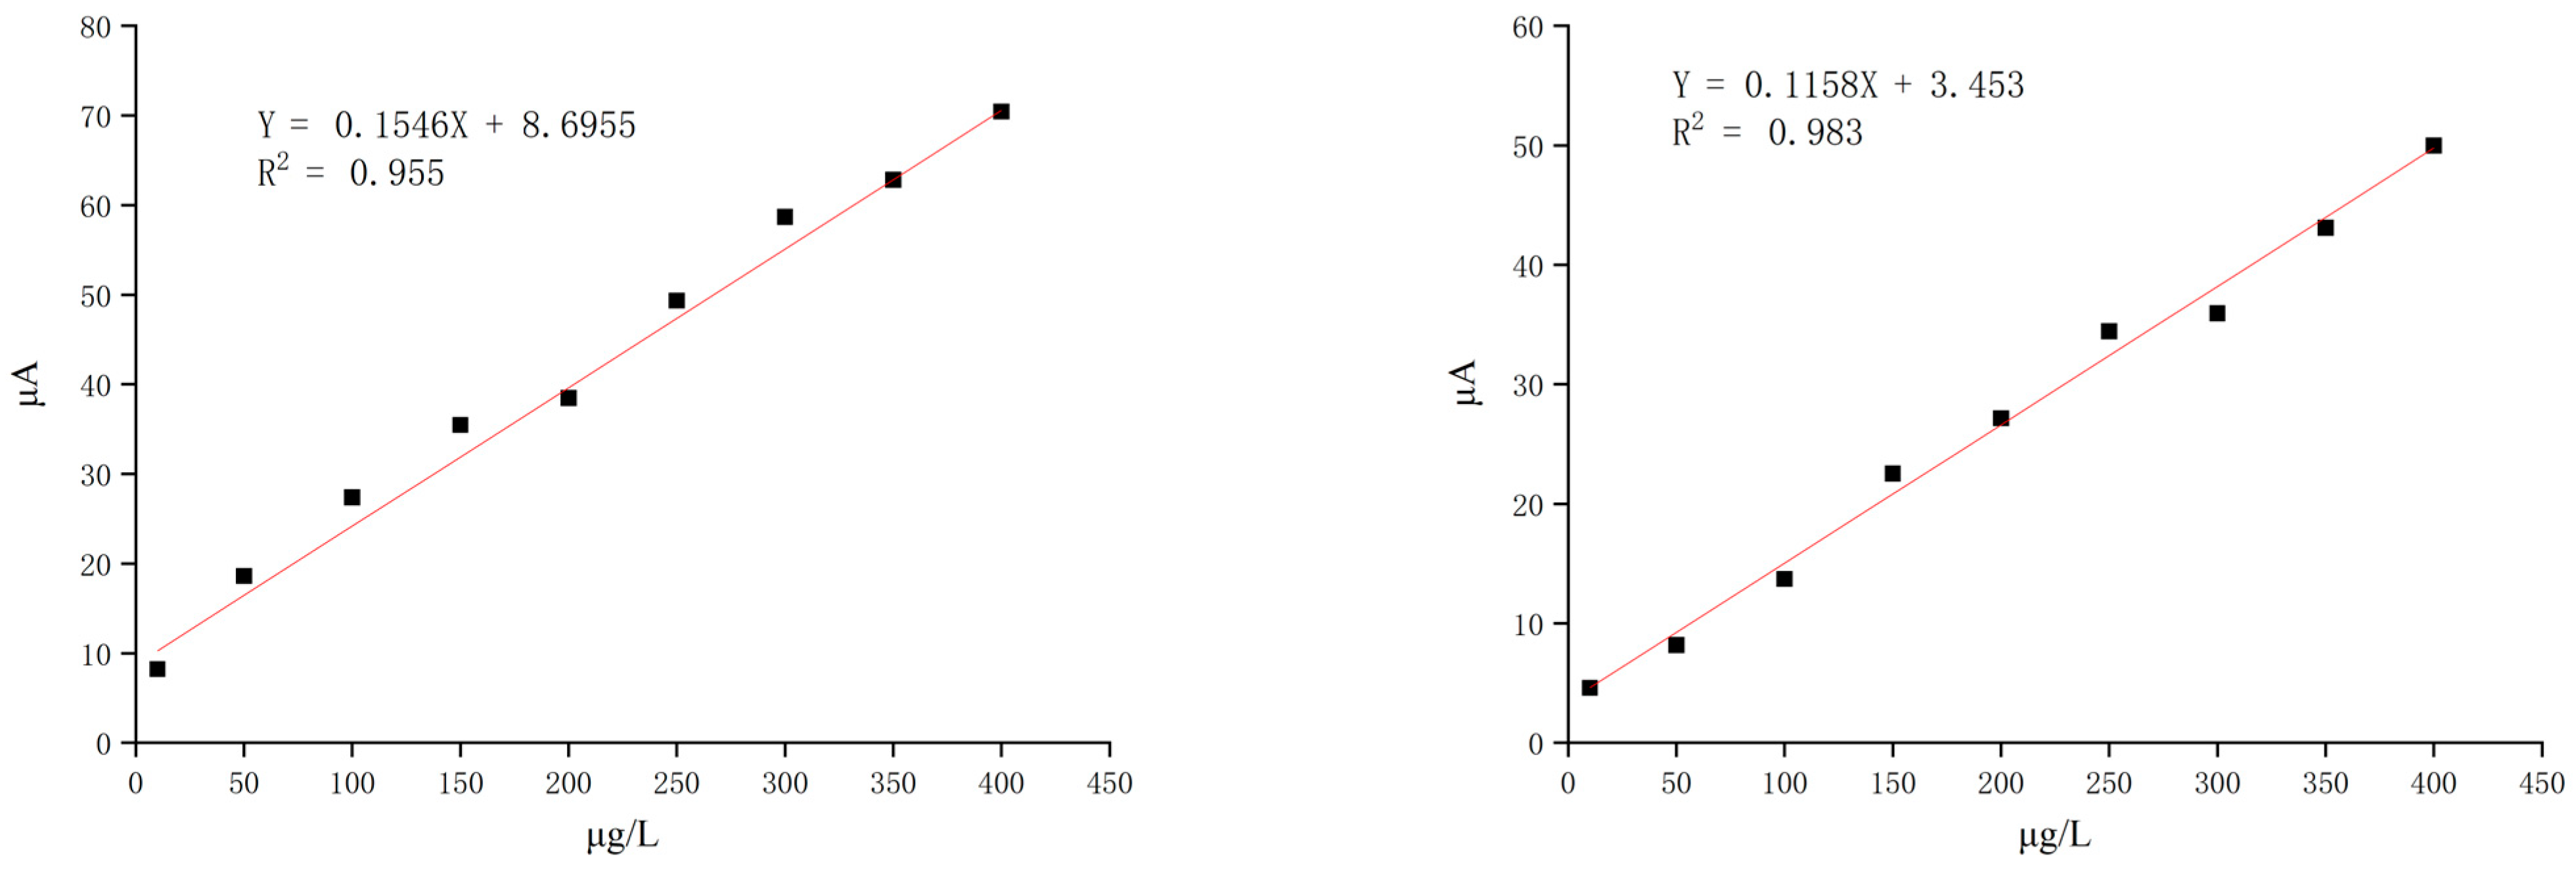
Under the optimal conditions, the DPV detection was conducted on the mixed solution samples with different concentrations of Cd(II) and Zn(II), and the results of the DPV curves in the range of 5–400 μg/L are shown in Figure 9. Figure 10a shows the relationship between the oxidation peak current of Cd(II) and its concentration, which showed a good linear relationship in the range of 5–400 μg/L. The calculated linear regression equation was Y = 0.1546X + 8.6955, with a linear correlation coefficient of R2 = 0.955, and the limit of detection was 0.81 μg/L, which was lower than the permissible limit of Cd(II) concentration in drinking water stipulated by the WHO and China [24,25]. Figure 10b shows the relationship between the oxidation peak current and concentration of Zn(II), which showed a good linear relationship at 5–400 μg/L. The calculated linear regression equation was Y = 0.1158X + 3.453, with a linear correlation coefficient of R2 = 0.983 and a detection limit of 0.98 μg/L. The experiments showed that rGO/MWCNT-COOH/GCE had good electrochemical performance, high sensitivity, and a low detection limit in the mixed solution of Cd(II) and Zn(II).
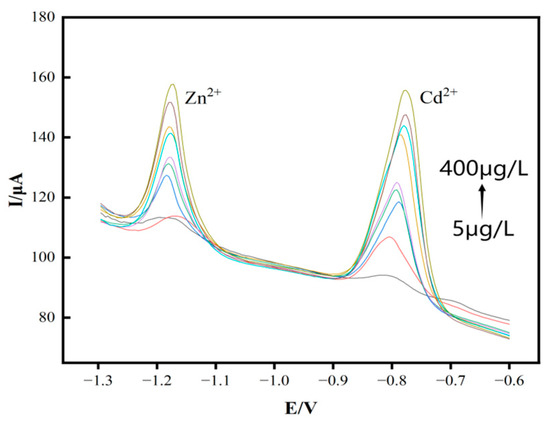
Figure 9.
Voltammogram of rGO/MWCNT-COOH/GCE on the dissolution of Cd(II) and Zn(II) at different concentrations (5–400 μg/L).
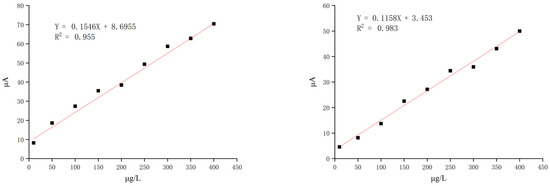
Figure 10.
(a) Linear regression curves for Cd(II). (b) Linear regression curves for Zn(II).
3.6. Stability and Reproducibility Experiment
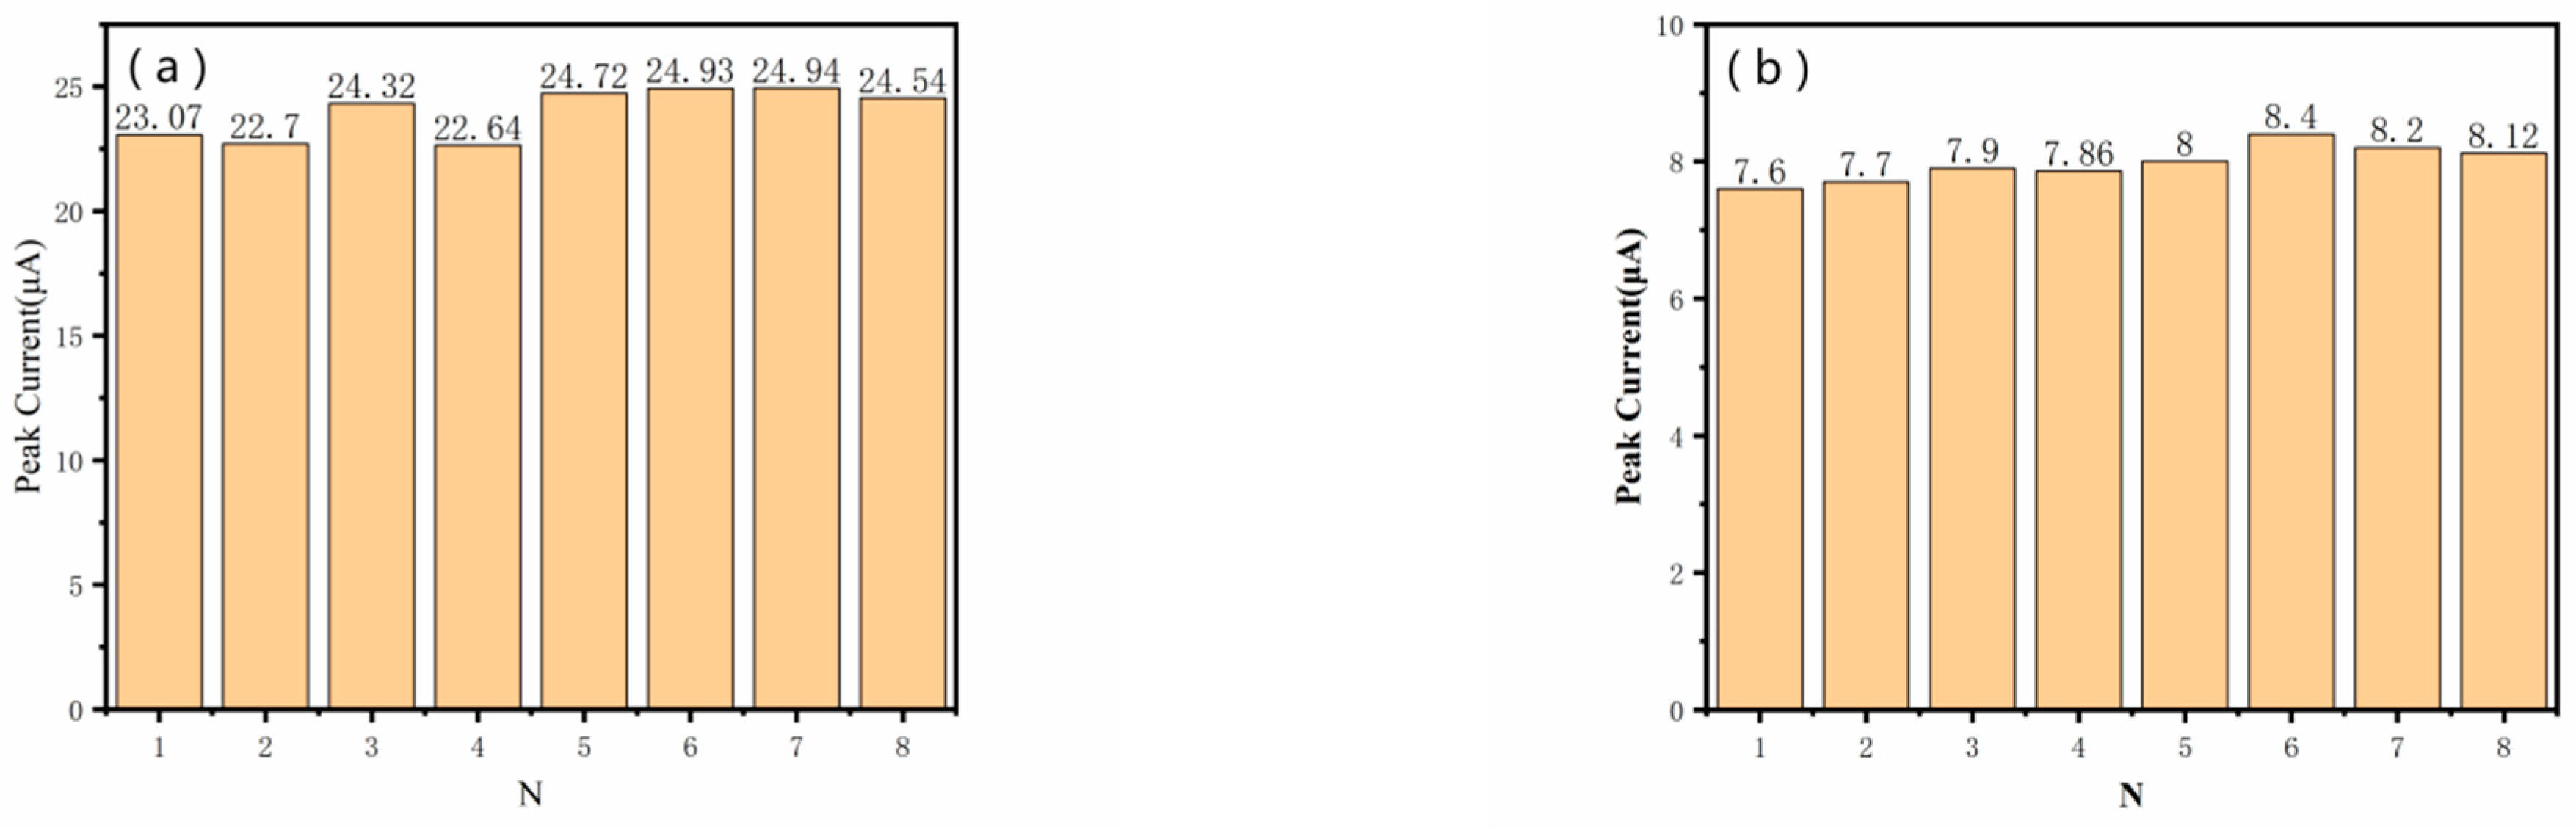
In practical applications, stability is a relevant indicator for improving the usefulness of sensors. To evaluate the stability of rGO/MWCNT-COOH/GCE-modified materials in multiple experiments, we performed eight consecutive DPV experiments in a 0.1 mol/L HAc-NaAc buffer with a pH of 5. The concentrations of Cd(II) and Zn(II) were all 100 μg/L. Figure 11a shows the experimental results for Cd(II), with an RSD of 4.1% for the peak dissolved current in eight DPV experiments. Figure 11b shows the experimental results for Zn(II), with an RSD of 3.3% for the peak dissolution current in eight DPV experiments, which indicated that the rGO/MWCNT-COOH/GCE modification material had good stability.
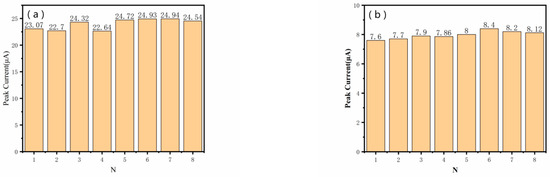
Figure 11.
(a) Eight stability changes of the same modified electrode in 100 μg/L of Cd(II). (b) Eight stability changes of the same modified electrode in 100 μg/L of Zn(II).
Reproducibility is also an important indicator of sensor performance when it comes to the actual detection of heavy metal ions in the ocean. There are several key aspects to this. Stable signal output: The modified electrode should be able to produce a stable and reproducible electrochemical signal over multiple uses. This means that the electrode should be able to produce a similar response when multiple measurements are made under the same conditions, ensuring that the measured current or potential change in relation to analyte concentration is predictable and repeatable. Reduced measurement errors: Good reproducibility reduces measurement errors due to variations in electrode performance. If the response of the electrode varies greatly at different times or under different conditions, it may lead to inconsistency in the analytical results, which will affect the reliability and interpretability of the experimental results. Validation of the analytical method: In scientific research and industrial applications, there is a need to ensure the validity and credibility of the electrochemical analytical method. The good reproducibility of modified electrodes is one of the important bases for verifying the feasibility and validity of analytical methods. Cost-effectiveness and resource-saving: modified electrodes with good reproducibility can effectively reduce the number of experimental repetitions and save experimental costs and time. In research and application, it is often necessary to carry out multiple repetitions of experiments to ensure the reliability of the results, and a stable modified electrode can significantly reduce these costs.
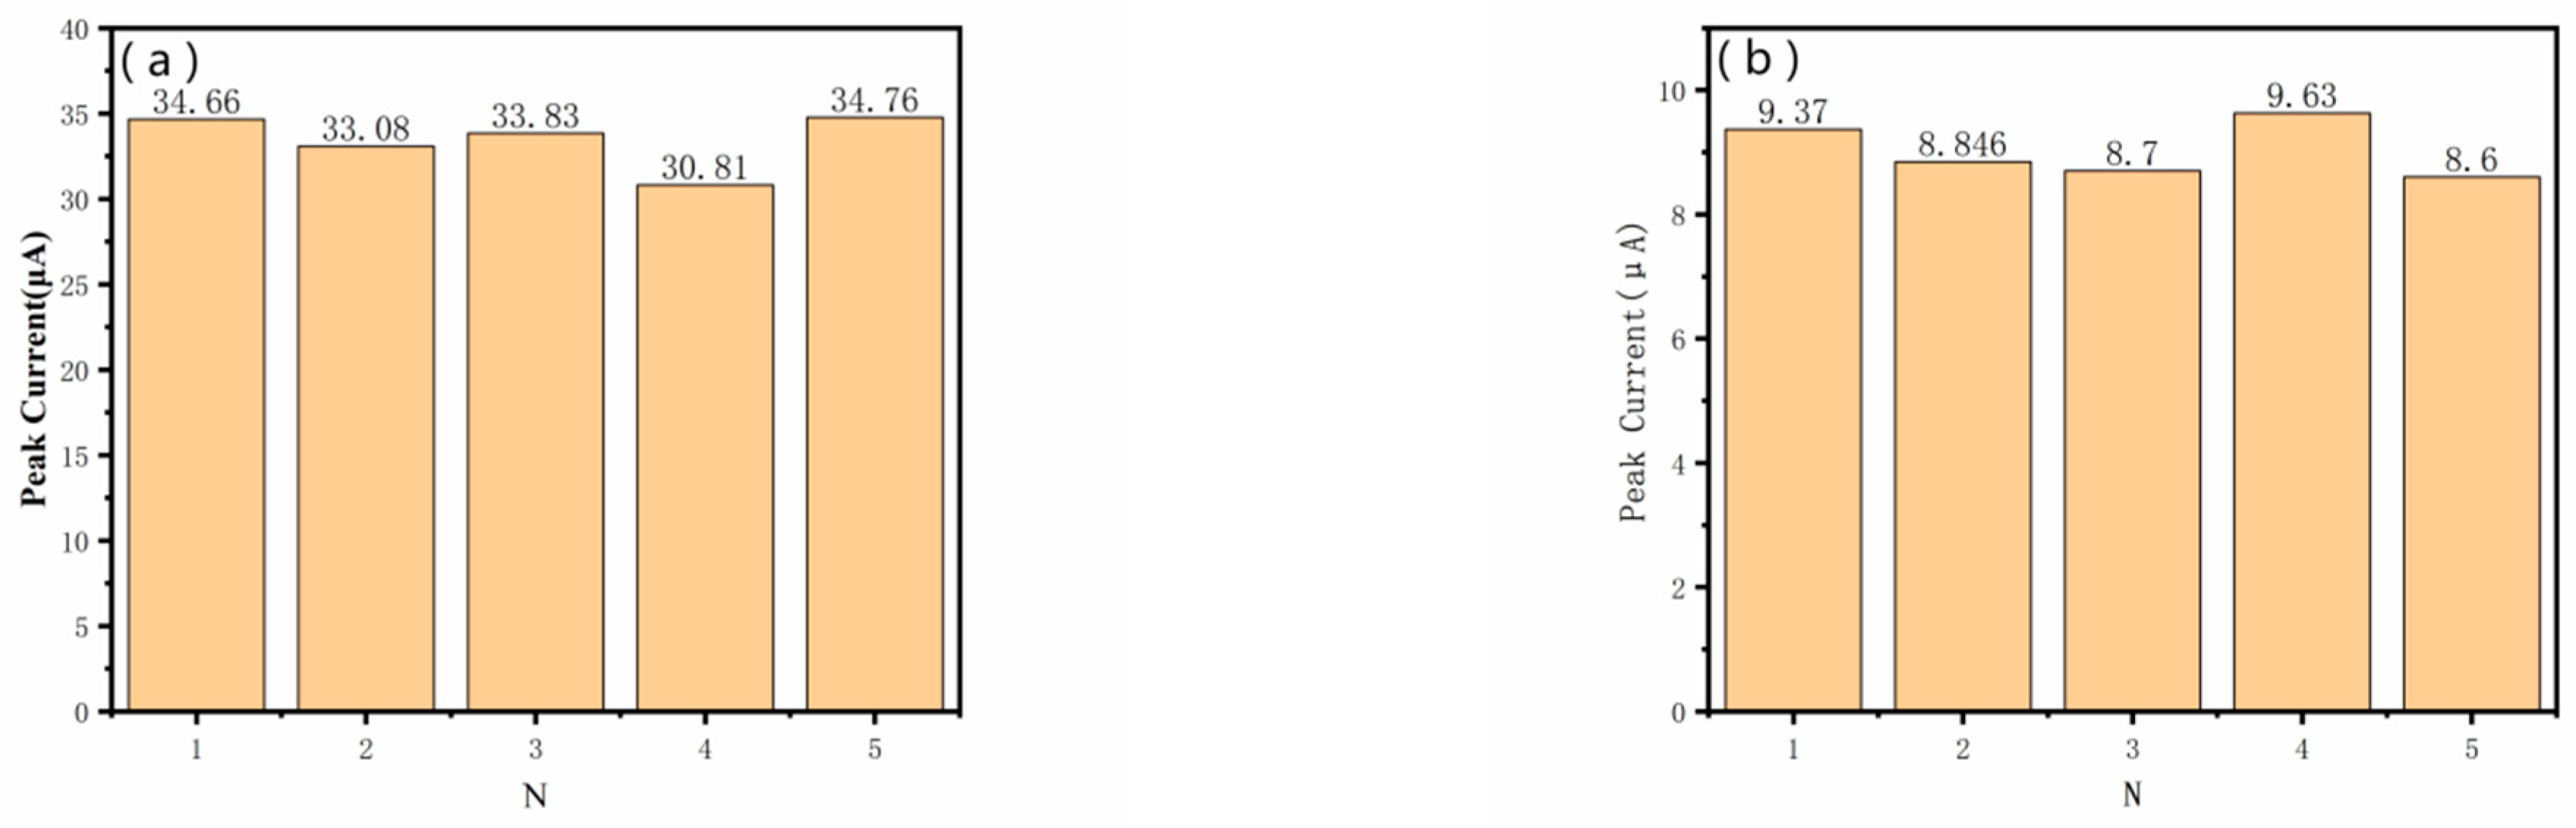
According to Figure 12a,b, five different batches of GCE electrodes with this composite material were prepared in a HAc-NaAc buffer solution with a concentration of 150 μg/L of Cd(II) and Zn(II). Based on the peak dissolution currents obtained from the five experiments, the relative standard errors (RSDs) were calculated to be 4.8% and 4.9%.
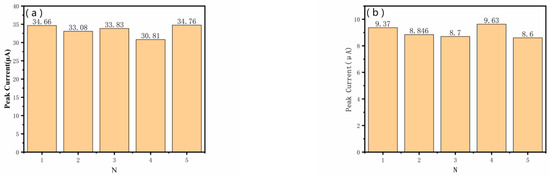
Figure 12.
(a) Reproducibility of different modified electrodes in 150 μg/L of Cd(II). (b) Reproducibility of different modified electrodes in 150 μg/L of Zn(II).
3.7. Disturbance Experiments
In order to evaluate the immunity of the microfluidic system and to ensure the detection performance of the system in the seawater base, the immunity of the system can be tested by adding interfering ions. When 50-fold Cl−, Na+, and K+ were added as interfering ions to a mixed buffer solution containing 300 μg/L of zinc–cadmium ions, the rates of change of the peak currents were all within 5%, indicating that the interfering ions at the above concentrations had no significant effect on the system. The interferences of three heavy metal ions, Pb(II), Hg(II), and Cu(II), on the detection of the system were also investigated because the heavy metal ions would occupy the binding sites of Zn(II) ion-selective enhancement modification membranes on the surface of microelectrodes with Zn(II) ions, which would affect the redox process of Zn(II) ions, and thus interfere with the system’s detection of Cd(II) and Zn(II). The experimental results showed that the variation rates of the peak dissolution currents of Cd(II) and Zn(II) under the conditions of 10-fold concentration of Pb(II), Hg(II), and Cu(II) were within 10%, which indicated that the microfluidic system studied in this paper has a strong ability to resist interference and can be used for zinc ion concentration detection in seawater bases.
3.8. Sensitivity Analysis
In order to further study the detection performance of the microfluidic system discussed in this paper on zinc ions, the detection effect of different electrodes on zinc ions in recent years will be compared this year, as shown in Table 2 and Table 3. The comparison results with other studies show that the rGO/MWCNT-COOH/GCE studied in this paper has a smaller gap with the results of other studies in terms of detection range and detection limit, with a wider detection range and lower detection limit, so the system can be applied to the detection of seawater-based Cd(II) and Zn(II).
Table 2.
Comparison of different electrodes for Cd(II) detection.
Table 3.
Comparison of different electrodes for Zn(II) detection.
3.9. Sample Analysis
Water samples were obtained from Beibu Gulf University’s internal lake water, originating from near-shore seawater in the Maowei Sea area, with a mixed composition. Table 4 shows the results of the water quality analyses at the three sites. The water samples were collected from three different locations at large intervals in the university lake, and the samples were left for 48 h to fully precipitate the impurities. The upper layer of the sample was filtered using a 0.45 μm membrane, and 20 mL of the filtered sample was used for spiking and recovery experiments. From Table 5 and Table 6, it is evident that the concentration of Cd(II) and Zn(II) in the actual water samples is far lower than the maximum concentration of Cd(II) and Zn(II) in the drinking water specified by the state. The spiked recovery for Cd(II) is between 96.4% and 98.2%, and for Zn(II), it is between 96.7% and 99.4%; this modified electrode has good performance in detecting trace Cd(II) and Zn(II) concentrations in real samples.
Table 4.
Results of water quality monitoring.
Table 5.
Recovery rate of spikes of Cd(II).
Table 6.
Recovery rate of spikes of Zn(II).
4. Conclusions
In the present study, the reduced graphene oxide/carboxylated multi-walled carbon nanotube composite-modified electrode was successfully prepared by using the constant potential reduction method. The related characterisation was conducted to investigate the electrochemical behaviours of Cd(II) and Zn(II) on the surface of this composite-modified electrode; further, the experimental conditions were optimised to explore the feasibility of the determination of Cd(II) and Zn(II).
The linear range of Cd(II) was 5–400 μg/L with a detection limit of 0.8 μg/L, and the linear range of Zn(II) was 5–400 μg/L with a detection limit of 0.98 μg/L. The composite electrode of reduced graphene oxide/carboxylated multi-walled carbon nanotubes has a large specific surface area, and a large number of active sites on the surface, and the method of operation is stable, rapid, and simple. Carboxylated multi-walled carbon nanotube composite as a substrate combined with reduced graphene oxide; this is a new method for detecting heavy metal ions in coastal seawater.
Author Contributions
Conceptualization, Y.G. and W.Q.; methodology, Y.G., W.Q. and W.T.; investigation, W.T., Z.Z. and H.H.; writing—original draft preparation, Y.G.; writing—review and editing, W.Q.; visualization, Y.G. and W.T.; Validation, W.T.; supervision, C.Q. and W.Q.; project administration, C.Q. and W.Q.; funding acquisition, C.Q. All authors have read and agreed to the published version of the manuscript.
Funding
High-end Foreign Experts Introduction Program (G2022033007L), CSSC Guangxi Shipbuilding and Marine Engineering Technology Cooperation Project (ZCGXJSB20226300222-06), and Qinzhou Scientific Research and Technology Development Program (202116622).
Data Availability Statement
The original contributions presented in the study are included in the article, further inquiries can be directed to the corresponding author.
Conflicts of Interest
The authors declare no conflict of interest.
References
- Cai, L.M.; Wang, Q.S.; Luo, J.; Chen, L.G.; Zhu, R.L.; Wang, S.; Tang, C.H. Heavy metal contamination and health risk assessment for children near a large Cu-smelter in central China. Sci. Total Environ. 2019, 650, 725–733. [Google Scholar] [CrossRef]
- Wei, L.; Liu, J.; Cheng, Z. Effects and hazards of zinc on biological health. In Proceedings of the Symposium of the Chinese Trace Element Scientific Research Society, Haikou, China, 1 April 2004. [Google Scholar]
- Wang, L.; Wu, C. Morphological analysis of cadmium in aquatic products and its hazards. Fujian Fish. 2014, 36, 78–84. [Google Scholar]
- Chen, X.; Wu, W.; Lin, L. Acute toxicity and combined toxicity of heavy metals Cd and Zn to clams. Jiangsu Agric. Sci. 2014, 42, 241–244. [Google Scholar]
- Hou, L.; Ma, G. Acute toxicity and combined toxicity of cadmium and zinc to grass carp species. Freshw. Fish. 2002, 44–46. [Google Scholar] [CrossRef]
- Porento, M.; Sutinen, V.; Julku, T.; Oikari, R. Detection of copper in water using on-line plasma-excited atomic absorption spectroscopy (AAS). Appl. Spectrosc. 2011, 65, 678–683. [Google Scholar] [CrossRef]
- Xu, W.; Hao, X.; Li, T.; Dai, S.; Fang, Z. Dual-Mode Fluorescence and Visual Fluorescent Test Paper Detection of Copper Ions and EDTA. ACS Omega 2021, 6, 29157–29165. [Google Scholar] [CrossRef] [PubMed]
- Hu, Q.; Yang, G.; Zhao, Y.; Yin, J. Determination of copper, nickel, cobalt, silver, lead, cadmium, and mercury ions in water by solid-phase extraction and the RP-HPLC with UV-Vis detection. Anal. Bioanal. Chem. 2003, 375, 831–835. [Google Scholar] [CrossRef] [PubMed]
- Zhang, L.; Nie, X.Y.; Le, T. Rapid determination of 15 metallic elements in 2 kinds of coix seeds by inductively coupled plasma-mass spectrometry after closed-vessel microwave digestion. J. Food Process Eng. 2017, 40, e12528. [Google Scholar] [CrossRef]
- Zhou, F.; Li, C.; Yang, C.; Zhu, H.; Li, Y. A spectrophotometric method for simultaneous determination of trace ions of copper, cobalt, and nickel in the zinc sulfate solution by ultraviolet-visible spectrometry. Spectrochim. Acta Part A Mol. Biomol. Spectrosc. 2019, 223, 117370. [Google Scholar] [CrossRef]
- Paramasivam, G.; Palem, V.V.; Meenakshy, S.; Suresh, L.K.; Gangopadhyay, M.; Antherjanam, S.; Sundramoorthy, A.K. Advances on Carbon Nanomaterials and Their Applications in Medical Diagnosis and Drug Delivery. Colloids Surf. B Biointerfaces 2024, 114032. [Google Scholar] [CrossRef]
- Singh, A.; Shah, S.S.; Sharma, C.; Gupta, V.; Sundramoorthy, A.K.; Kumar, P.; Arya, S. An approach towards different techniques for detection of heavy metal ions and their removal from waste water. J. Environ. Chem. Eng. 2024, 241, 113032. [Google Scholar] [CrossRef]
- Dutt, S.; Singh, A.; Mahadeva, R.; Sundramoorthy, A.K.; Gupta, V.; Arya, S. A reduced graphene oxide-based electrochemical sensing and eco-friendly 4-nitrophenol degradation. Diam. Relat. Mater. 2024, 141, 110554. [Google Scholar] [CrossRef]
- Qin, X. Application of electrochemical detection in environmental monitoring and analysis. Heilongjiang Environ. Bull. 2023, 36, 157–159. [Google Scholar]
- Shi, Q.; Wang, H.; Liu, S.; Luo, Q.; Bian, Z. Optimization of a three-electrode system for electrochemical reduction–oxidation of 4-chlorophenol with response surface methodology. Toxicol. Environ. Chem. 2016, 98, 327–344. [Google Scholar] [CrossRef]
- Kumar, T.V.; Rajendran, J.; Atchudan, R.; Arya, S.; Govindasamy, M.; Habila, M.A. Cobalt ferrite/semiconducting single-walled carbon nanotubes based field-effect transistor for determination of carbamate pesticides. Environ. Res. 2023, 238, 117193. [Google Scholar] [CrossRef] [PubMed]
- Kamalasekaran, K.; Magesh, V.; Atchudan, R.; Arya, S.; Sundramoorthy, A.K. Development of electrochemical sensor using iron (III) phthalocyanine/gold nanoparticle/graphene hybrid film for highly selective determination of nicotine in human salivary samples. Biosensors 2023, 13, 839. [Google Scholar] [CrossRef] [PubMed]
- Gu, L.; Liu, Y. Square-wave dissolution voltammetry determination of zinc at graphene oxide modified carbon paste electrodes. Chem. Res. Appl. 2016, 28, 36–41. [Google Scholar]
- Zhang, S.; Kang, W.; Niu, L. Determination of dopamine by nanogold/graphene composite membrane-modified sensor and its application. Chem. Res. Appl. 2019, 31, 1593–1599. [Google Scholar]
- Manojkumar, K.; Sivaramakrishna, A.; Vijayakrishna, K. A short review on stable metal nanoparticles using ionic liquids, supported ionic liquids, and poly (ionic liquids). J. Nanoparticle Res. 2016, 18, 103. [Google Scholar] [CrossRef]
- Liu, X.; Liu, G.; Deng, P.; He, X.; Xiao, Y.; Liang, X.; Jiang, H. Determination of vanillin by voltammetry of multi-walled carbon nanotube modified glassy carbon electrode. J. Anal. Test. 2019, 38, 312–317. [Google Scholar]
- Zeng, C.; Li, J.; Nian, Z. Electrochemical behaviour of levofloxacin hydrochloride on poly(L-arginine)/multi-walled carbon nanotube modified electrodes. Chem. Res. Appl. 2014, 26, 1534–1538. [Google Scholar]
- Hu, C.; Hua, Y. Basic Principle of Linear Scanning Voltammetry and Voltammogram Analysis; University Chemistry: Wuhan, China, 2021; pp. 126–132. [Google Scholar]
- GB 5749-2022; National Hygiene and Health Commission of the People’s Republic of China. Hygienic Standard for Drinking Water: Beijing, China, 2022.
- World Health Organisation. Guidelines for Drinking Water Quality; Shanghai Jiao Tong University Press: Shanghai, China, 2014. [Google Scholar]
- Cui, F.; Zhao, Y.; Wang, S.; Zhuo, B.; Liu, W. Construction of bismuth nanoparticles/flower-like carbon spheres electrochemical sensor and detection of heavy metals in Pueraria Mirifica. J. Shenyang Pharm. Univ. 2023, 745–752. [Google Scholar] [CrossRef]
- Qiao, X. Electrochemical Sensing Method Constructed by Carbon-Based Materials Applied to the Detection of Lead and Cadmium Ions; Central South Forestry University of Science and Technology: Changsha, China, 2023. [Google Scholar]
- Chang, Z. Construction of Bismuth-Containing Portable Heavy Metal Ion Sensor and Detection of Cd(II); Harbin Institute of Technology: Harbin, China, 2022. [Google Scholar]
- Ya, F. Study on Cadmium Ion Detection in Graphene-Based Nanoparticle Modified Electrode; Guangxi University: Nanning, China, 2022. [Google Scholar]
- Akhtar, M.; Sohail, M.; Warsi, M.F.; Ibrahim, M.M.; Amin, M.A.; Shahid, M. Fe3O4 nanochips loaded MXenes/g-C3N4 nanocomposite for ultrasensitive electrochemical detection of zinc (II), cadmium (II), lead (II), copper (II) and mercury (II) metal ions. FlatChem 2023, 41, 100537. [Google Scholar] [CrossRef]
- Aziz, S.F.N.A.; Ainliah Alang Ahmad, S. Electrochemical detection of nickel (II) and zinc (II) ions by a dicarboxyl-Calix [4] arene-based sensor (Calix/MPA/Au) through differential pulse voltammetry analysis. J. Water Supply Res. Technol. Aqua 2023, 72, 160–172. [Google Scholar] [CrossRef]
- Qin, J.; Li, W.; Cai, K.; Wang, D.; Peng, C.; Luo, L.; Song, S.; Mei, Y.; Wang, Y. Simultaneous electrochemical detection of zinc and copper in fruit juice using Hg/CMWCNTs@ ZIF-8 modified glassy carbon electrode. Microporous Mesoporous Mater. 2023, 360, 112721. [Google Scholar] [CrossRef]
- Seanghirun, W.; Samoson, K.; Cotchim, S.; Kongkaew, S.; Limbut, W. Green electrochemical sensor for Zn (II) ions detection in human seminal fluid. Microchem. J. 2020, 157, 104958. [Google Scholar] [CrossRef]
Disclaimer/Publisher’s Note: The statements, opinions and data contained in all publications are solely those of the individual author(s) and contributor(s) and not of MDPI and/or the editor(s). MDPI and/or the editor(s) disclaim responsibility for any injury to people or property resulting from any ideas, methods, instructions or products referred to in the content. |
© 2024 by the authors. Licensee MDPI, Basel, Switzerland. This article is an open access article distributed under the terms and conditions of the Creative Commons Attribution (CC BY) license (https://creativecommons.org/licenses/by/4.0/).