Abstract
The drainage capacity of stormwater inlets, which serve as the connection between the surface and the underground drainage system, directly affects surface runoff and the drainage capacity of underground drainage systems. However, in reality, stormwater inlets are often blocked due to the accumulation of leaves, human waste disposal and other factors, resulting in a greatly reduced drainage capacity of the drainage network and, in turn, urban waterlogging disasters. In view of the problem of stormwater inlet blockage, employing a typical waterlogging point in the Lianjiang Middle Road area of Fuzhou city as the research object, the stormwater inlet equivalent drainage method was adopted in this paper to characterize the drainage capacity of the pipe network and enable the control of the stormwater inlet blockage state. Coupled with the stormwater inlet drainage equation, an improved ITF-FLOOD two-dimensional hydrodynamic model was constructed, and the influence of stormwater inlet blockage on urban waterlogging under different rainfall return periods was simulated and analyzed. With increasing rainfall return period, the influences of stormwater inlet blockage on both the maximum area and the depth of accumulated water in the study area gradually decreased compared with those of a nonblocked stormwater inlet, and the growth proportions decreased from 43.35% and 34.58% under the 1-year rainfall scenario to 3.34% and 9.76% under the 50-year rainfall scenario, respectively. However, in terms of the change in the accumulated water level, stormwater inlet blockage will cause an increase, and the influence will always be significant. Overall, stormwater inlet blockage aggravated the waterlogging risk and the extent of waterlogging. Therefore, the results provided a reference for the construction of an urban waterlogging model and have certain guiding significance for waterlogging prevention and control in the study area prone to stormwater inlet blockage.
1. Introduction
In recent years, with the development of society and the economy, the urban population has increased, and the urbanization rate in China has continued to increase [1]. Many natural bedding surfaces have been transformed into hardened pavements, which, while satisfying the needs of the urban population in terms of production and living, has also generated negative impacts, such as the frequent occurrence of disasters during extreme weather events. Such consequences have also led to the frequent occurrence of heavy rainfall and flooding [2]. Compared with inland cities, coastal cities are more severely affected by summer typhoon landfalls [3,4,5]. Therefore, targeted research on waterlogging is important for urban construction.
Because of the increasing frequency of urban flooding disasters, urban flood management has become a real problem. To accurately determine the cause of waterlogging and provide an effective decision-making basis for waterlogging prevention and control, scholars have extensively studied the causes of waterlogging. Most scholars have attributed urban flooding to both natural and human factors [6,7]. From the perspective of natural factors, global warming has increasingly exacerbated the heat island effect and rain island effect, leading to the frequent occurrence of heavy rainfall and flooding disasters [8,9,10]. Alemaw et al. [11] constructed a Storm Water Management Model (SWMM) to detect overloads in sewer systems during extreme rainfall events and to simulate and predict the relationships between precipitation parameters and sewer collection system overflows. Affected by rainstorms and floods, backward river water can cause serious waterlogging. Liu et al. [12] established a drainage model of a pipe network and simulated the drainage of water outlets under different river levels. Regional topographic features also affect the magnitude of urban rainfall. Based on 20 years of urban stormwater inundation records from 1993 to 2012 for Japan, Komori et al. [13] identified and analyzed the frequent areas of urban rainfall-related floods in the cities of Osaka and Nagoya, Japan, by principal component analysis of topographic features. From a human factor perspective, low construction standards of urban drainage systems can aggravate the occurrence of urban flooding events [14]. In addition, due to the accelerating urbanization process, the increase in impervious surfaces is one reason for the frequent occurrence of urban flooding disasters [15,16,17]. From a land use change perspective, Ahmad et al. [18] analyzed the increase in the urbanization rate in Srinagar city from 1972 to 2014 using remote sensing data and assessed its impacts on the extent of waterlogging inundation and the risk of waterlogging. Wang et al. [19] explored the impacts of landscape patterns and topography on waterlogging based on records of historical waterlogging events.
However, most surface runoff generated by rainfall flows into the underground drainage system through stormwater inlets at the surface. The drainage capacity of stormwater inlets, which serve as the connection between the surface and the underground drainage system, directly affects surface runoff and the drainage capacity of the underground drainage system. In addition, stormwater inlets can intercept floating pollutants to prevent underground pipeline blockage, which can result in drainage system failure. In practice, stormwater inlets are often blocked due to the accumulation of leaves and human waste and other factors, which greatly reduces the drainage capacity of stormwater inlets, resulting in serious urban waterlogging disasters. Scholars have widely investigated stormwater inlets, and the main research methods are physical model experiments, theoretical analysis, and three-dimensional numerical simulations [20,21,22]. By establishing a physical model experimental platform, Kim et al. [23] derived a calculation equation for stormwater inlet interception flow, and the factors influencing the capacity of a single stormwater inlet were explored to provide a theoretical basis for the layout and installation of stormwater inlets. Based on theoretical analysis, Noh et al. [24] reported that different inflow conditions can affect the discharge patterns of stormwater inlets, so they classified the discharge patterns of stormwater inlets into weir flow and orifice flow and calibrated the flow coefficient under these two discharge patterns. With the use of the numerical simulation method, Martins et al. [25] revealed the three-dimensional hydraulic characteristics of the flow field within a stormwater inlet and derived flow coefficient equations that can be directly used as the internal boundary conditions of the dual-drainage model. In addition, Martins et al. [26] combined physical experiments with numerical simulations to investigate the interception performance of stormwater inlets and found that the geometric characteristics of stormwater inlets, road characteristics and flow velocity are all influencing factors. Rubinato et al. [27] explored the factors influencing the discharge capacity of ten circular stormwater grates and focused on the effects of the porosity of the stormwater grate and the depth of water in front of the grate on the discharge capacity of stormwater inlets. The results showed that the interception efficiency of stormwater inlets was positively correlated with the water depth in front of the gate and its porosity.
Through many studies, the causes of urban waterlogging have been expressed more systematically, and the factors influencing urban waterlogging have been more clearly defined. Failure of the drainage system due to stormwater inlet blockage is one reason. However, existing studies have focused on only the drainage capacity of stormwater inlets and its influencing factors from a blockage mechanism perspective, but there are few applications in simulation analysis of urban waterlogging. Therefore, the problem of stormwater inlet blockage must still be investigated.
In this paper, Guohuo East Road (the middle section of Lianjiang Middle Road and Changle Middle Road), which is a typical waterlogging point in the Lianjiang Middle Road area of Fuzhou city, was chosen as the research object, and the ITF-FLOOD model, which was independently developed by the China Institute of Water Resources and Hydropower Research, was applied. The stormwater inlet equivalent drainage method was adopted to characterize the drainage capacity of the pipe network and enable the control of the stormwater inlet blockage state. Moreover, coupled with the stormwater inlet drainage equation, an improved ITF-FLOOD two-dimensional hydrodynamic model was constructed to explore the effects of stormwater inlet blockage on urban waterlogging. The results of this study could provide a reference for the construction of urban waterlogging models and could have certain guiding significance for waterlogging prevention and control in areas prone to stormwater inlet blockage.
2. Materials and Methods
2.1. Research Area and Data
Fuzhou is a coastal city in China. The area mainly exhibits a subtropical monsoon climate and a subtropical maritime climate. The city has a total land area of 11,968 km2, and there are 107 inland rivers in the urban area. The number of monthly maximum rainfall days in the urban area is 18 days, the average number of annual rainfall days is 149 days, the maximum daily rainfall is 170.9 mm, the average annual rainfall is 1367.5 mm, and the maximum annual rainfall is 2074.6 mm. The annual flood season usually lasts from April to October, with the peak of typhoon activity occurring from July to September. Typhoons make landfall in Fuzhou twice a year on average, and the heavy precipitation associated with typhoons is a major cause of the frequent waterlogging in Fuzhou city.
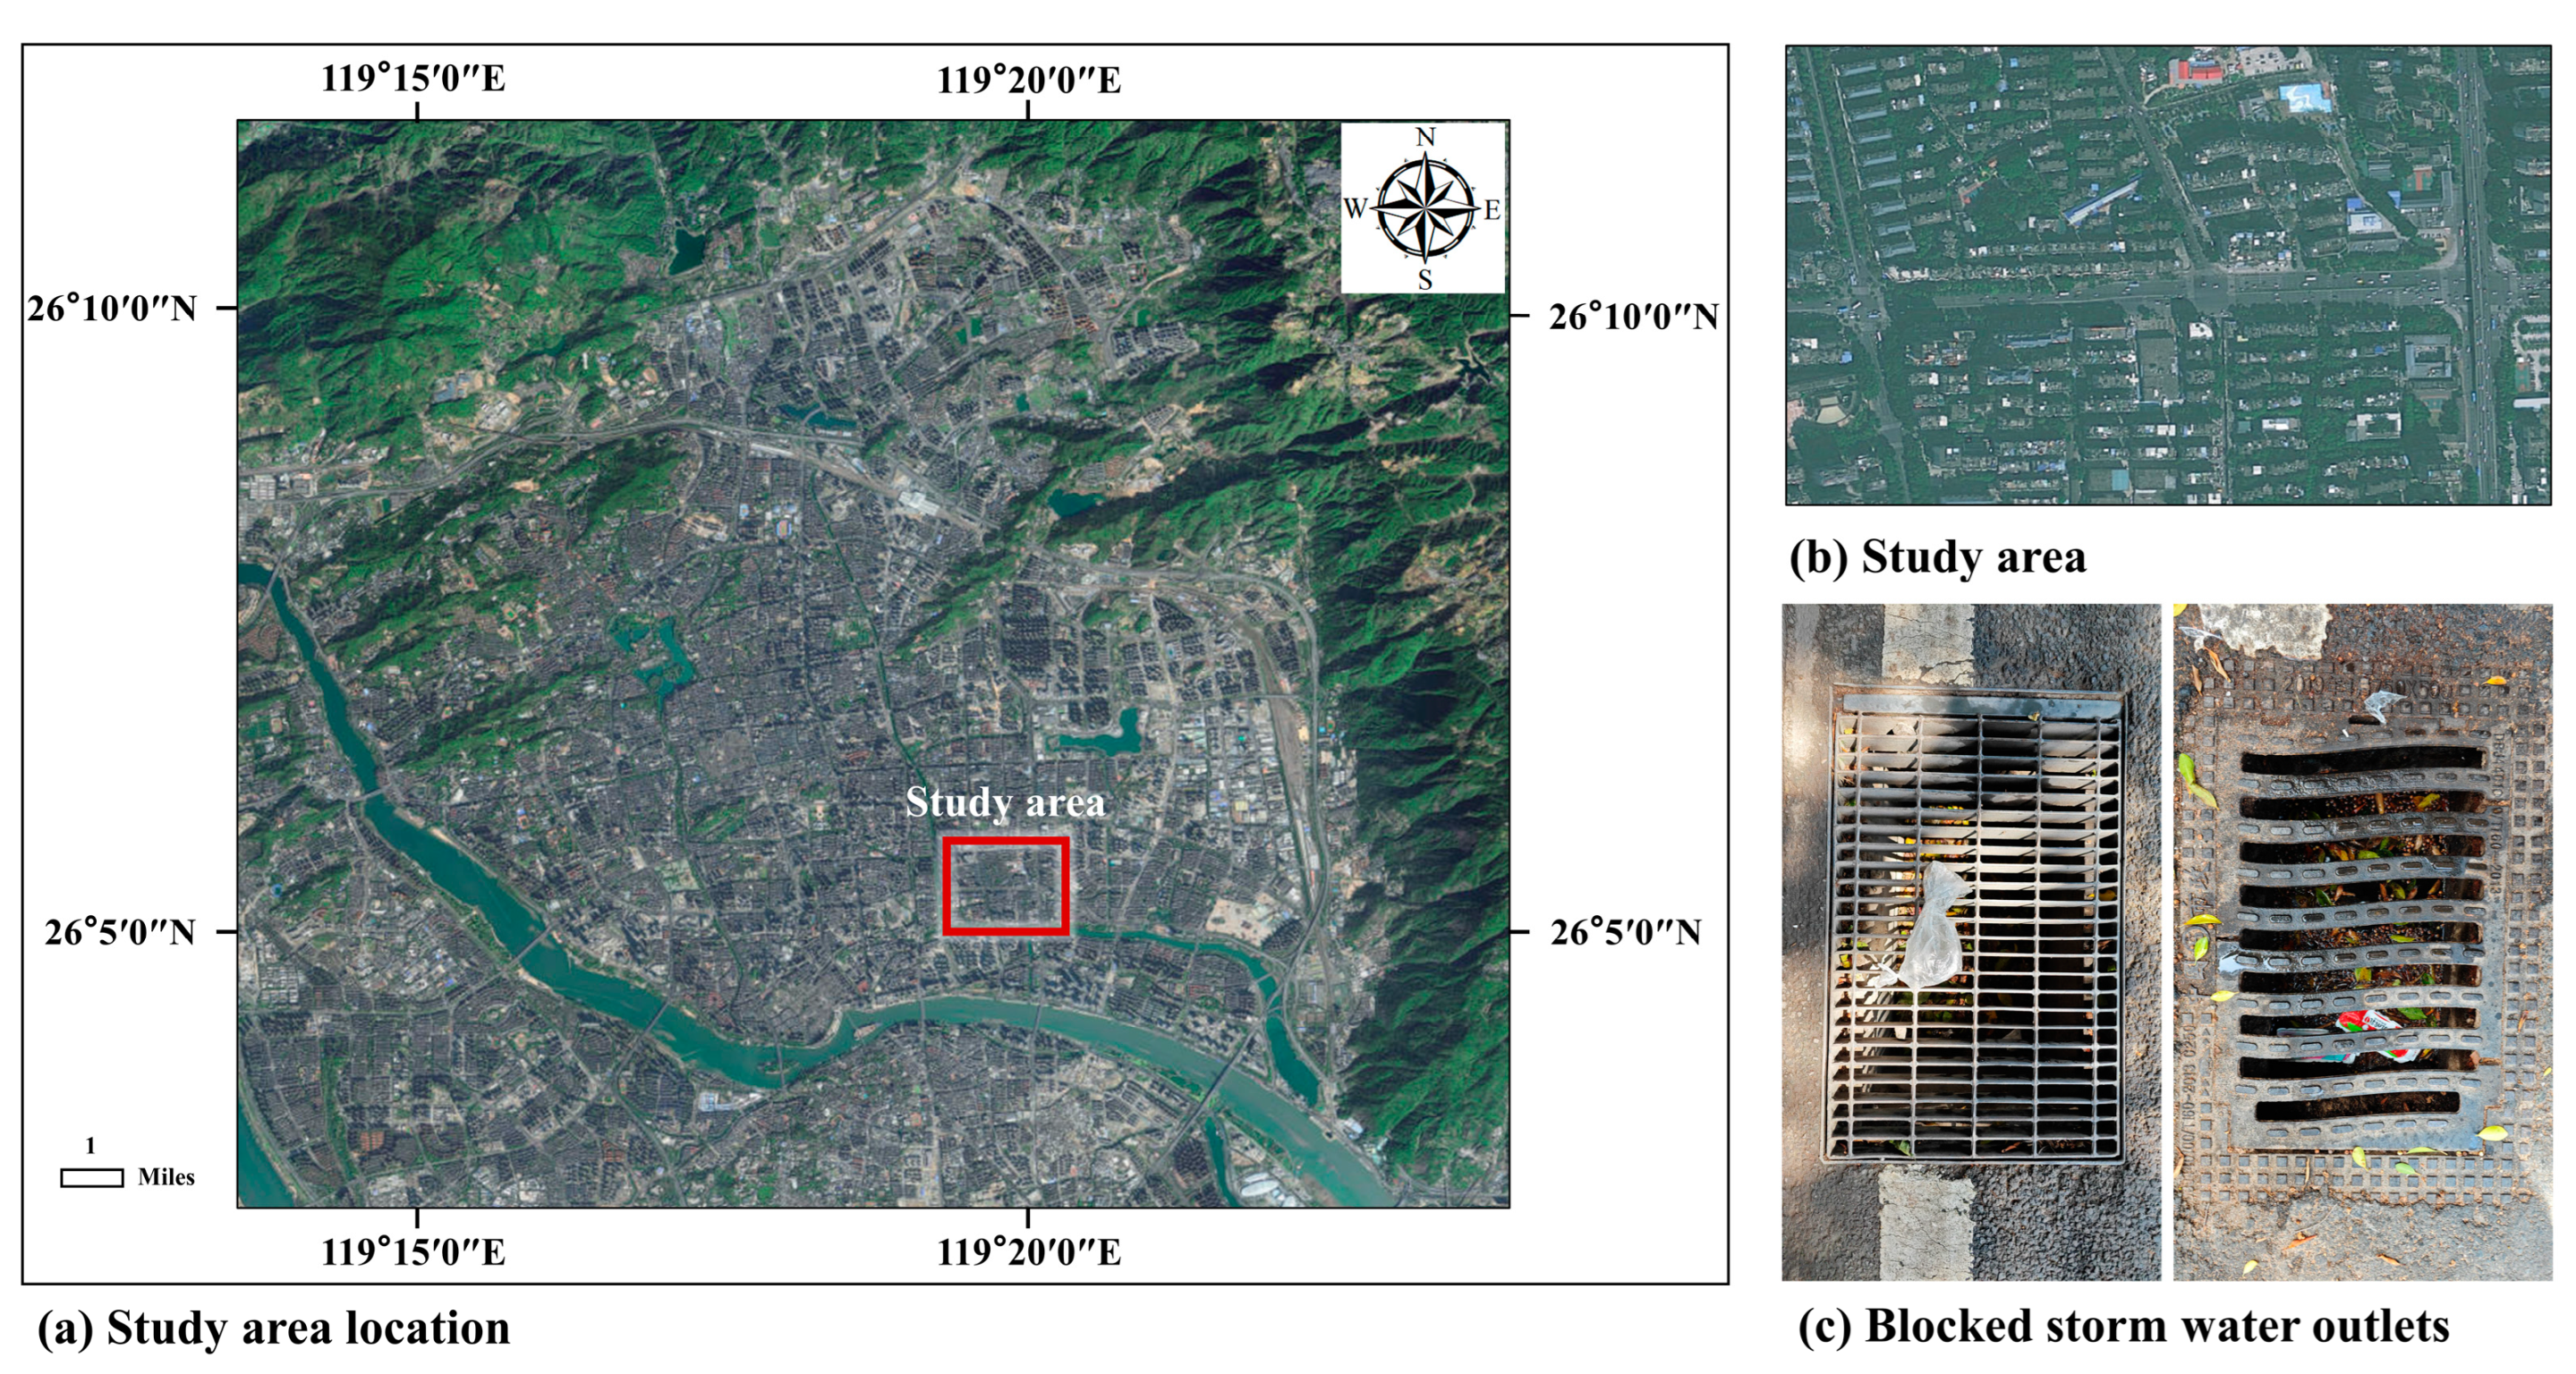
Based on the waterlogging records for Fuzhou from 2017 to 2022 obtained from the governmental department, Guohuo East Road (the middle section of Lianjiang Middle Road and Changle Middle Road) was adopted as the research object, and the selected waterlogging point is the intersection of Guohuo East Road and Lianhui Road, as shown in Figure 1. A total of 17 waterlogging events occurred in the area, 8 of which involved stormwater inlet blockage.
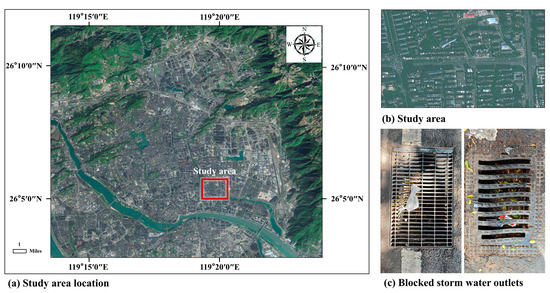
Figure 1.
Location map of the study area.
2.2. DEM Reconstruction
2.2.1. DEM Reconstruction Process
With the continuous development of science and technology, an increasing number of hydrodynamic models have been applied in the simulation of urban waterlogging. Basic data, especially DEM elevation data, directly affect the accuracy of the hydrodynamic model simulation results. Even a small deviation from the basic data may lead to a large error between the simulation results and the actual conditions. The original raster data exhibit low elevation accuracy, but they cover a wide range and can characterize the overall change in mountainous terrain. In contrast, manual mapping data exhibit high accuracy and can accurately represent the elevation change in partial areas. The disadvantage is that their coverage is low and limited to streets and surrounding road areas. Therefore, within the street area, the low-precision basic data were transformed into higher-precision elevation data by using multisource data fusion, which can not only meet the accuracy requirements of the model but also clearly reflect the spatial change trend in the surface elevation. This method provides a reference for urban waterlogging model construction.
The basic data needed for DEM reconstruction include the original DEM elevation raster data, land use data, and ground elevation data of inspection wells, stormwater grates, and manholes within the pipe network. First, the street ranges in the original DEM elevation raster data were deleted, and the retained non-street range elevation raster data were converted into elevation points. Then, the “Selection by location” function in ArcGIS was applied to select elevation points within the building range. The elevation of the selected elevation point was uniformly increased by 10 m using the “Field calculator” tool, and elevation data of the corrected building elevation points were obtained. Next, the street elevation was processed based on manually mapped ground elevation data from inspection wells, stormwater grates, manholes, etc. First, the “Create fishing net” tool was used to divide the street area into 2 m × 2 m fishing nets with imaging element sizes, and the “Spatial connection” function was then employed to combine the fishing network with the ground elevation data of inspection wells, stormwater gates and manholes to obtain reconstructed street elevation data. The street range elevation points and non-street range elevation points were merged to obtain a combined complete raster, and inverse distance weighted (IDW) interpolation was performed. Finally, a reconstructed partial terrain DEM based on multisource data fusion was obtained. Figure 2 shows a diagram of the DEM reconstruction process. Figure 3 shows a flowchart of the DEM reconstruction process.
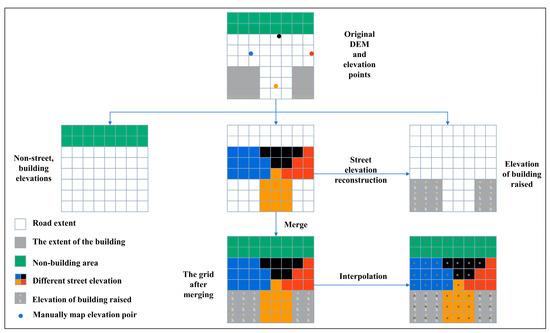
Figure 2.
Diagram of the DEM reconstruction process (2 m × 2 m fishing nets).
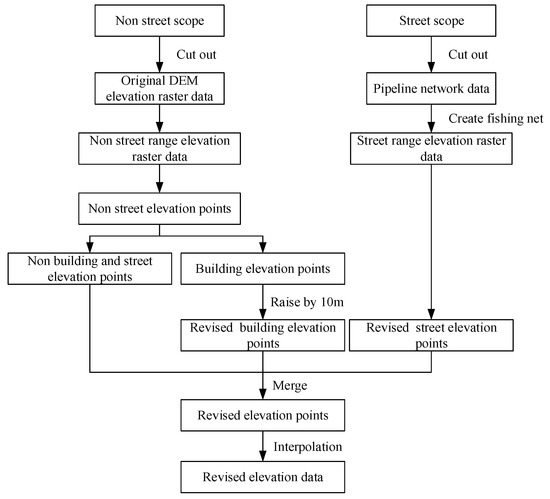
Figure 3.
DEM reconstruction flow chart.
2.2.2. Spatial Interpolation
Spatial interpolation aims to obtain the functional relationship that best expresses a series of known spatial data, and values can be derived for any location within the region based on this functional relationship. The obtained values can be discrete points or partitioned data. The ground elevation data were used as discrete points. To improve the DEM accuracy, the Inverse Distance Weight (IDW) interpolation method was adopted for spatial interpolation.
The IDW was first proposed by Shepard, which is based on the principle of similarity and assumes that the sampling points will have a local influence on the values of the interpolation points, which will gradually weaken as the distance increases [28]. For example, suppose there are M known sample points near an interpolation point. Then, the influence of these known sample points on that interpolation point is inversely related to the distance. In other words, the sample points closer to the interpolation point exhibit a higher weight.
In the IDW interpolation method, the distance factor is accounted for, which can be combined with the direction factor when anisotropy occurs. In terms of the distance, the weight factor decreases with increasing distance, which can be fitted with a power function. Because it is a global interpolation algorithm and all the discrete points participate in the numerical calculation, there are still certain requirements for the accuracy of the dataset. Therefore, it is necessary to determine whether the considered discrete point data are accurate before interpolation.
In this paper, interpolation was conducted after combining two types of elevation data, and spatial interpolation was performed by limiting the interpolation distance (assuming that the resolution of the original DEM is D, the resolution of the constructed mesh size d should ensure D > 2d). When there is an elevation difference between the sidewalk and the main lane, in the traditional spatial interpolation method, the elevation of the interpolation point will be affected by the elevations of the sidewalk and the main lane. Moreover, the elevation of the interpolation point will generally change smoothly, yielding a high elevation value, which cannot reflect the vertical change in terrain. In the boundary region of the road, the effect of abrupt vertical changes on the elevation of the interpolation points should be considered only when there are reference points both inside and outside the road. If there are only reference points inside the road within the restricted interval, the effect of points outside the road is not considered. This problem can be effectively solved by the fusion of partial terrain data with multisource data.
2.2.3. Comparison of the DEM Reconstruction Results
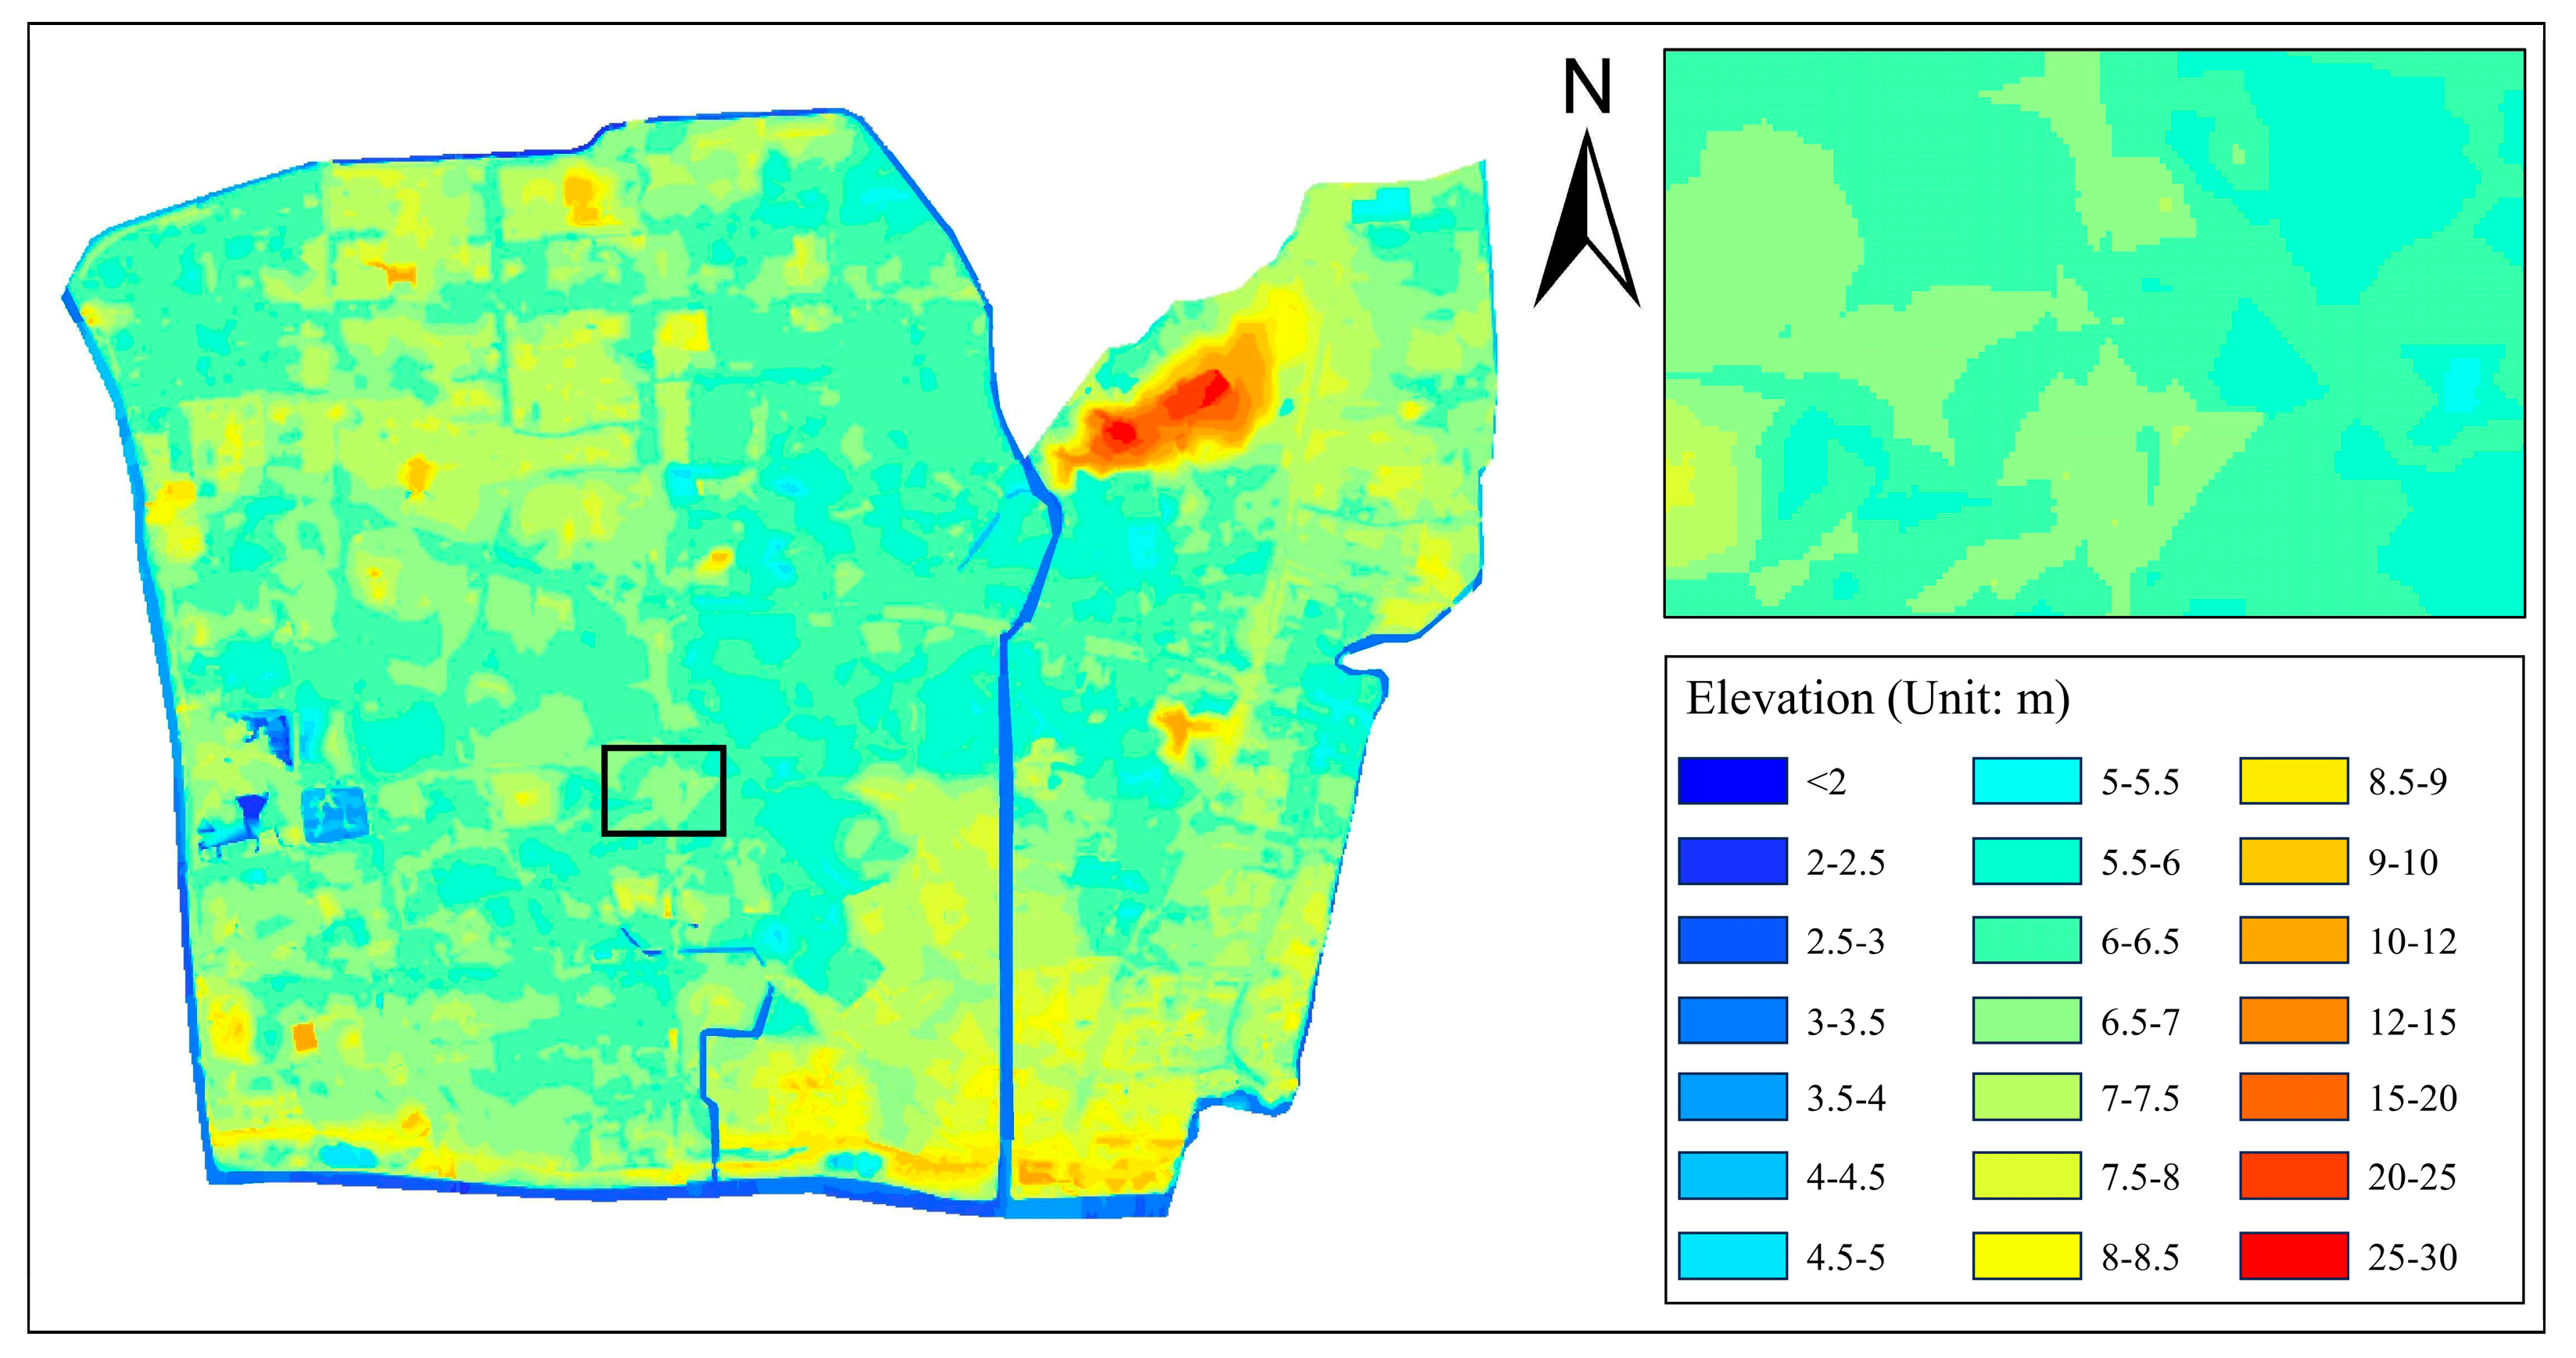
Figure 4 shows the original DEM elevation data (Fuzhou, China), and Figure 5 shows the locally reconstructed DEM elevation data. By comparison, the building and road areas in the original DEM elevation data are very fuzzy and difficult to distinguish, while those in the partially reconstructed DEM elevation data are very obvious.
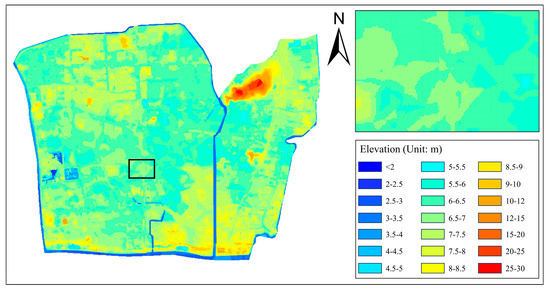
Figure 4.
Original DEM and the intersection of the Lianjiang Middle Road and Jinlian Road.
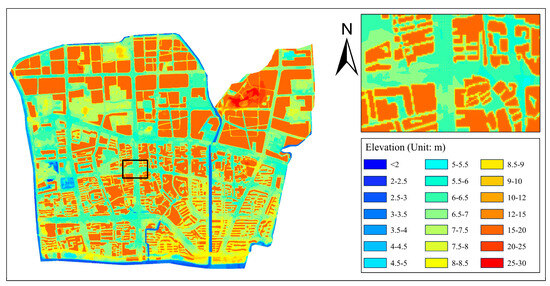
Figure 5.
Reconstructed DEM and the intersection of the Lianjiang Middle Road and Jinlian Road.
2.3. Methodology
2.3.1. ITF-FLOOD Model
The ITF-FLOOD model is known as the Integrated Terrestrial Fluxes model, abbreviated as InTerFlux or ITF-FLOOD, which is a hydrodynamic model independently developed by the China Institute of Water Resources and Hydropower Research. In this model, graphics processing unit (GPU) parallel computing is adopted based on the Compute Unified Device Architecture (CUDA). Preprocessing is completed on the central processing unit (CPU), and the grid parameters and physical quantities are then uploaded to the GPU for iterative calculation. Upon output, the required physical quantities are downloaded to the CPU for postprocessing. Figure 6 shows the GPU computing process. The model can be used to simulate the whole study area with high efficiency and high resolution. However, the ITF-FLOOD model is not sensitive to the Manning coefficient n, and the size and time step of the model’s grid elements have a significant impact on the model’s results. An excessively large grid element size can lead to model instability, while an excessively long time step can result in inaccurate model results.
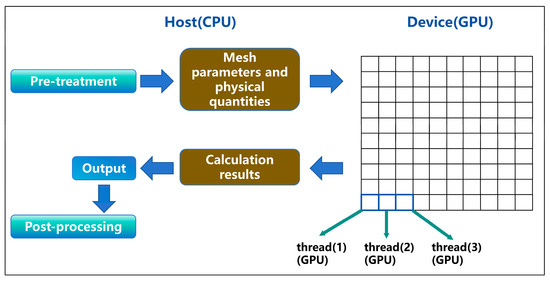
Figure 6.
GPU computing process.
The model can capture both surface hydrodynamics and water flow in the drainage system.
Channel flows are treated using a one-dimensional approach that captures the downstream propagation of flood waves and the response of water flow toward free surface slopes. The continuity and momentum equations are expressed in Equations (1) and (2), respectively:
The flood inundation process can be modeled using the storage unit method. Since the topography of a city does not significantly change and there are no surges or rapidly changing currents during urban flooding, this method can be used to simulate the surface water flow process with the following control equations:
where is the unit change in the water depth (m), is the unit change in the volume (m3), is the time interval (s), and and are orthogonal directions.
The Saint–Venant inertia equation can be used for the flow of two neighboring units:
where is the flow velocity at the boundary of the adjacent cell (m/s), is the gravitational acceleration (m/s2), n is the roughness, is the water level gradient of the adjacent cell, and is the depth of water flow at the interface of the adjacent cell (m).
The water flow depth at the interface of adjacent units can be calculated as follows:
where h1 and h2 are the water depths of the two neighboring units (m) and z1 and z2 are the ground elevations of the two neighboring units (m).
Soil infiltration can be calculated using the Green–Ampt method [29] as follows:
where is the soil infiltration capacity (mm/h), is the saturated hydraulic conductivity (mm/h), is the soil suction at the wetting front, is the difference between the saturated and initial soil water contents, and F is the cumulative infiltration (mm).
The ITF-FLOOD model comprises one control parameter file (csv format), six asc format files and four csv format files, as detailed in Table 1.

Table 1.
ITF-FLOOD model file description.
2.3.2. SWMM and ITF-FLOOD Coupling Model
The SWMM has a hydrological and hydrodynamic module, which can perform one-dimensional hydrodynamic simulation calculations, but cannot perform two-dimensional surface inundation processes. The ITF-FLOOD model has the ability to calculate two-dimensional surface inundation processes, but there are certain shortcomings in one-dimensional hydrodynamic simulation calculations. Therefore, by coupling the SWMM with the ITF-FLOOD model, a comprehensive calculation of urban hydrology, one-dimensional pipeline network hydrodynamics, and two-dimensional surface hydrodynamics can be completed, thereby making a more detailed and comprehensive analysis of urban waterlogging situations. The coupling process of the waterlogging coupling model is shown in Figure 7.
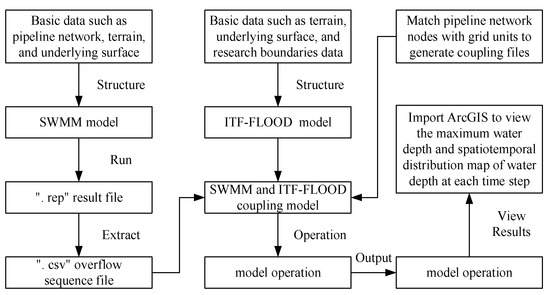
Figure 7.
SWMM and ITF-FLOOD coupling process.
Due to the complexity of considering bidirectional coupling in synchronization, it is difficult to achieve in a short period of time. Therefore, the coupling model only considers unidirectional coupling, that is, the SWMM simulates the pipeline overflow process as the input condition for the ITF-FLOOD model to calculate the two-dimensional surface inundation process.
2.3.3. Generalized Drainage Capacity of Pipe Network
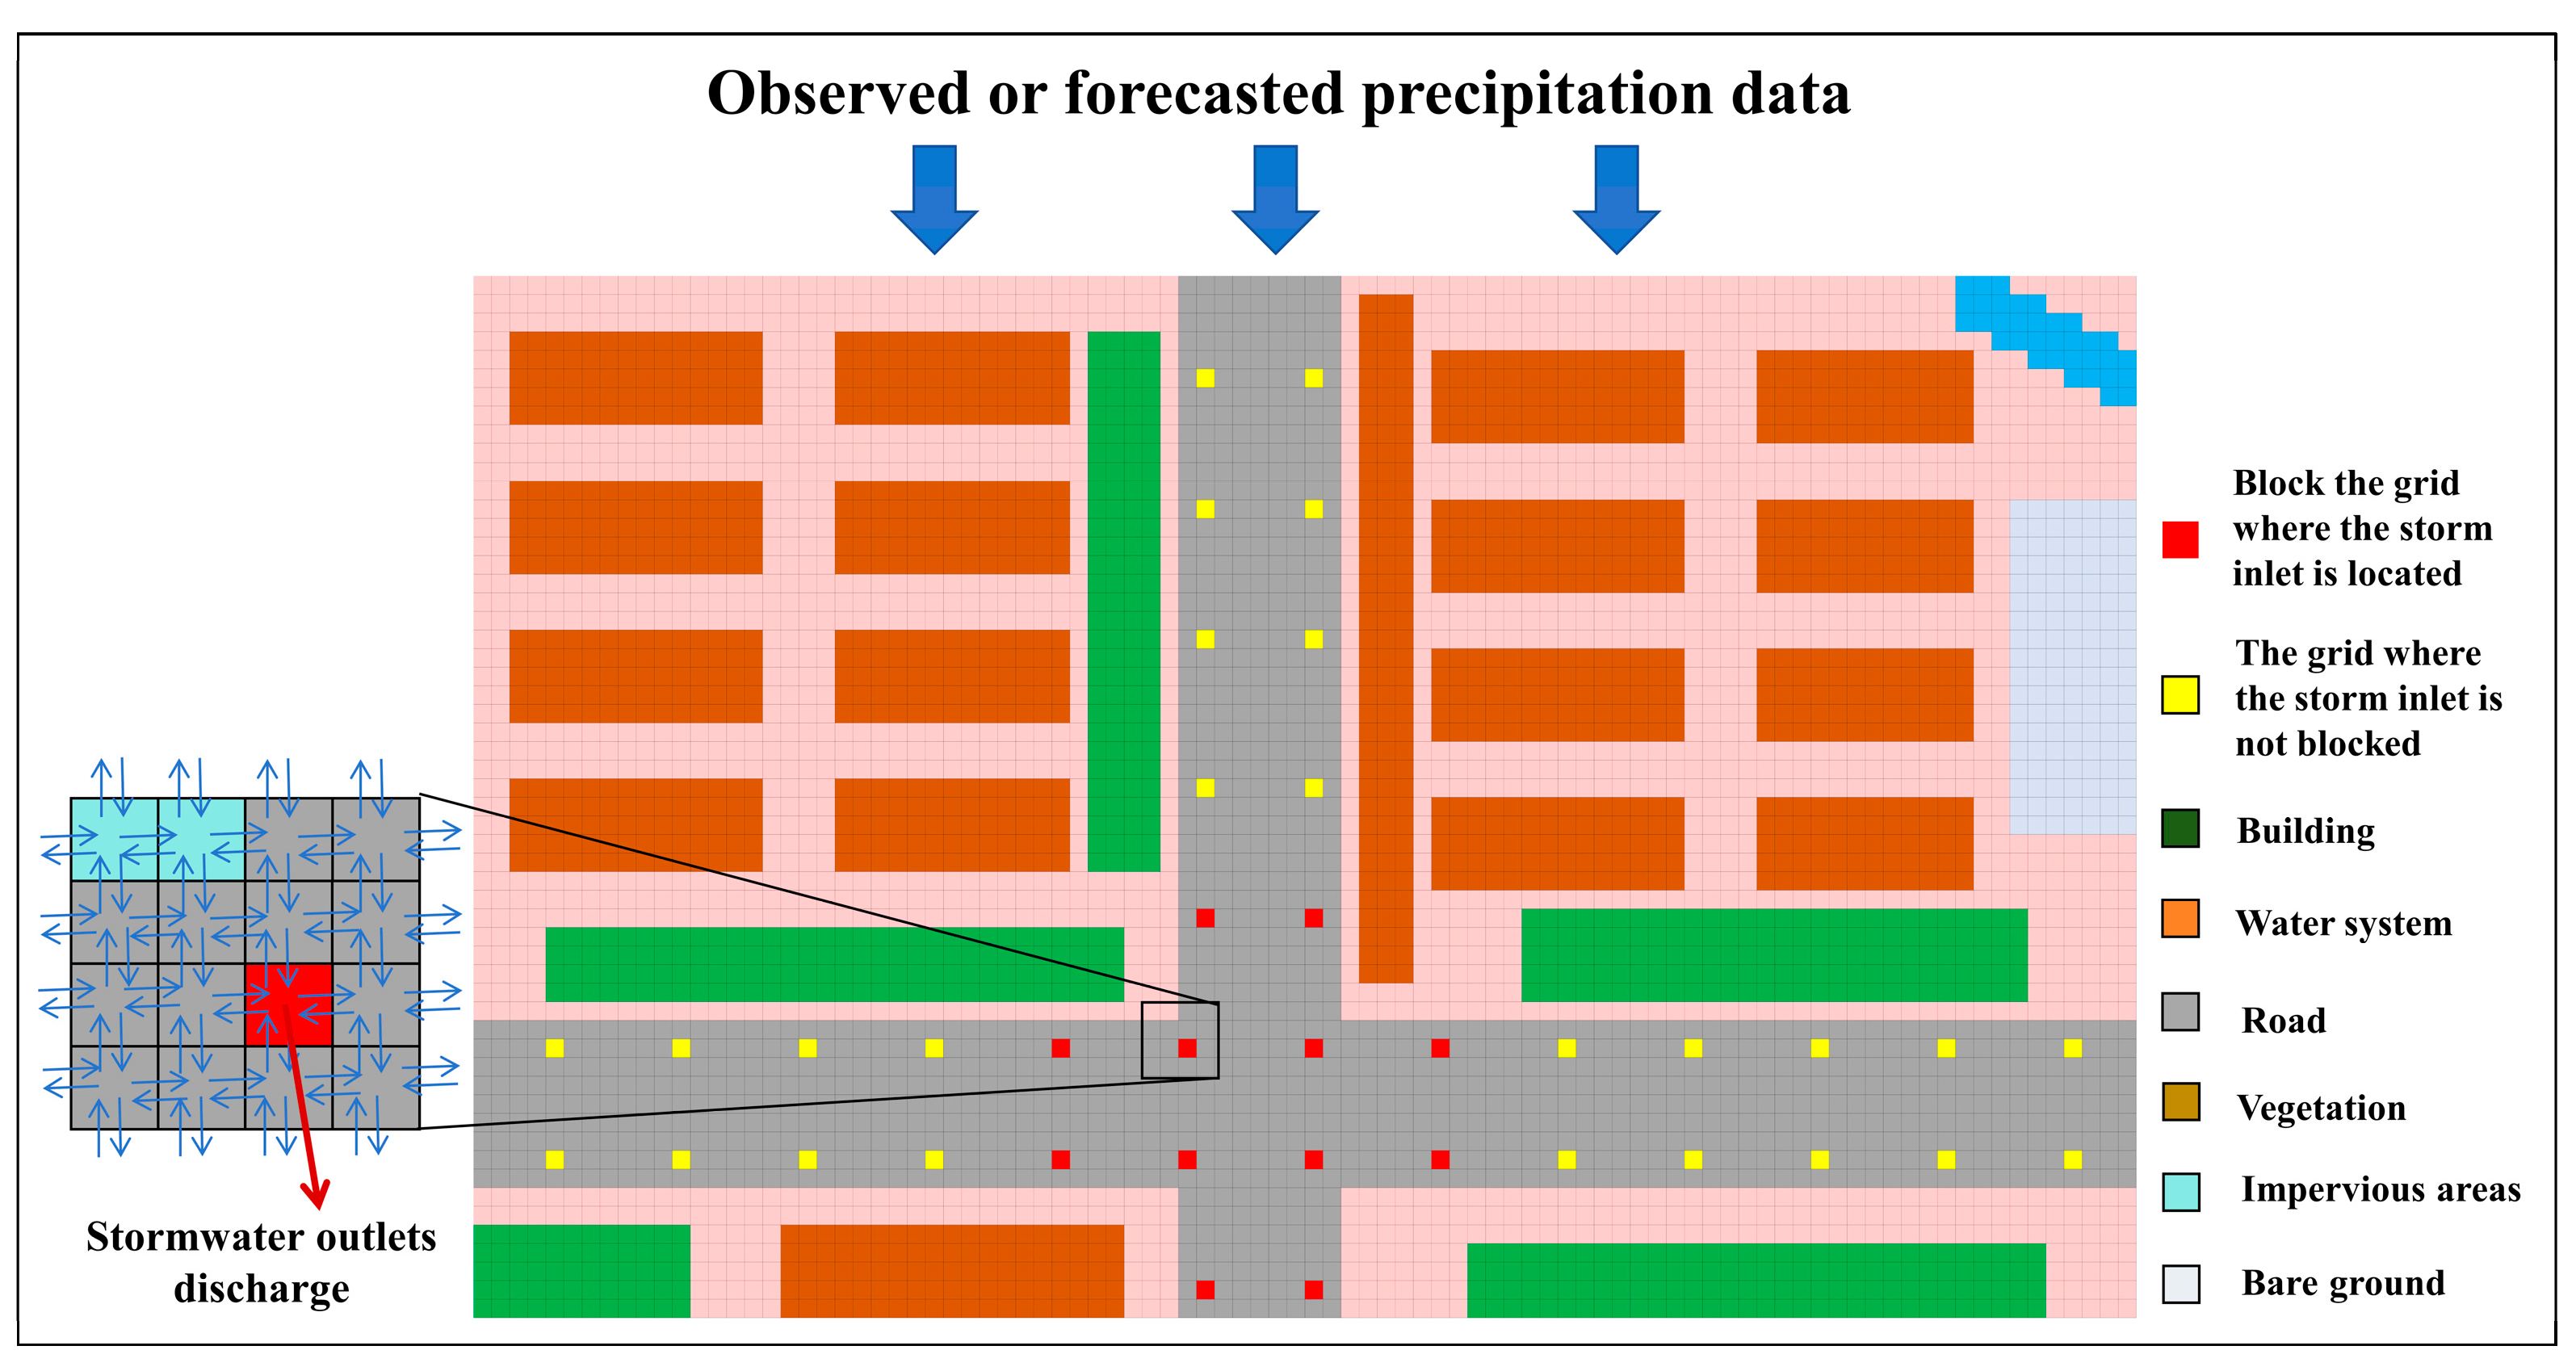
The drainage process of the pipe network was generalized by using the equivalent drainage method for stormwater inlets, and a schematic of the equivalent drainage method for stormwater inlets is shown in Figure 8. The method involves setting the sink term in the continuity equation to characterize the centralized drainage process of stormwater inlets, as expressed in Equation (7). This method accounts for the actual pipe network layout range and the actual amount of water flow into the pipe network from stormwater inlets. Yang et al. [30] demonstrated that this method can provide a suitable simulation accuracy by considering the Xixian New District in Shaanxi Province as the study area.
where R is the net rain rate (mm/h), i is the rainfall intensity (mm/h), f is the infiltration rate (mm/h), hinlet is the drainage capacity of the grid where the stormwater inlet is located (mm/h), qinlet is the discharge of the stormwater inlet (m3/s), and Araster is the area of a single grid (m2).
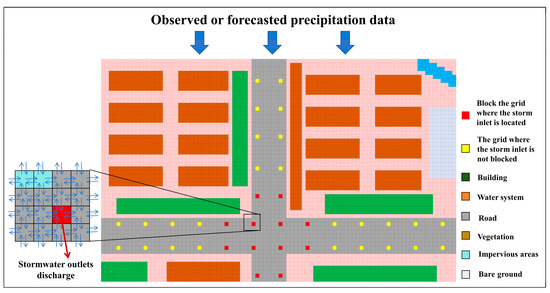
Figure 8.
Diagram of the equivalent drainage method for stormwater inlets.
2.3.4. Simulation of STORMWATER Inlet Blockage
- (1)
- Calculation equation for the stormwater inlet discharge capacity
With increasing storm flow, the depth of the confluent rainwater in front of stormwater inlets increases, and the flow pattern of stormwater inlets can be categorized into weir flow, orifice flow, and nozzle flow according to the drainage capacity of the connecting pipe and inlet grate and the capacity of the storm well. When stormwater inlets are blocked, their flow discharge pattern and capacity are not easy to determine. Based on physical model tests and the dimension analysis method, Xia et al. [31] established an expression for the drainage capacity of stormwater inlets under different blockage conditions of the connecting pipe and rain grate, as expressed in Equations (8) and (9).
where is the discharge of the stormwater inlet (m3/s), k is the blockage coefficient, is the magnitude parameter, A is the net water area of the rain grate (m2), u is the flow rate (m/s), Fr is the Froude number, and CR is the blockage degree.
- (2)
- Control of the stormwater inlet blockage state
To control the stormwater inlet blockage state, a stormwater inlet blockage state control file, namely i20_block_dtkz.csv, was defined, and the blockage coefficient k was used to control the stormwater inlet blockage state. When the stormwater inlets are not blocked, the blockage degree CR is 0, and the blockage coefficient k is 1. Moreover, when the stormwater inlets are completely blocked, the blockage degree CR is 1, and the blockage coefficient k is 0. The degree and coefficient of partial blockage are set proportionally.
2.4. Model Building
2.4.1. Construction of a Two-Dimensional Hydrodynamic Model Coupled with the Stormwater Inlet Discharge
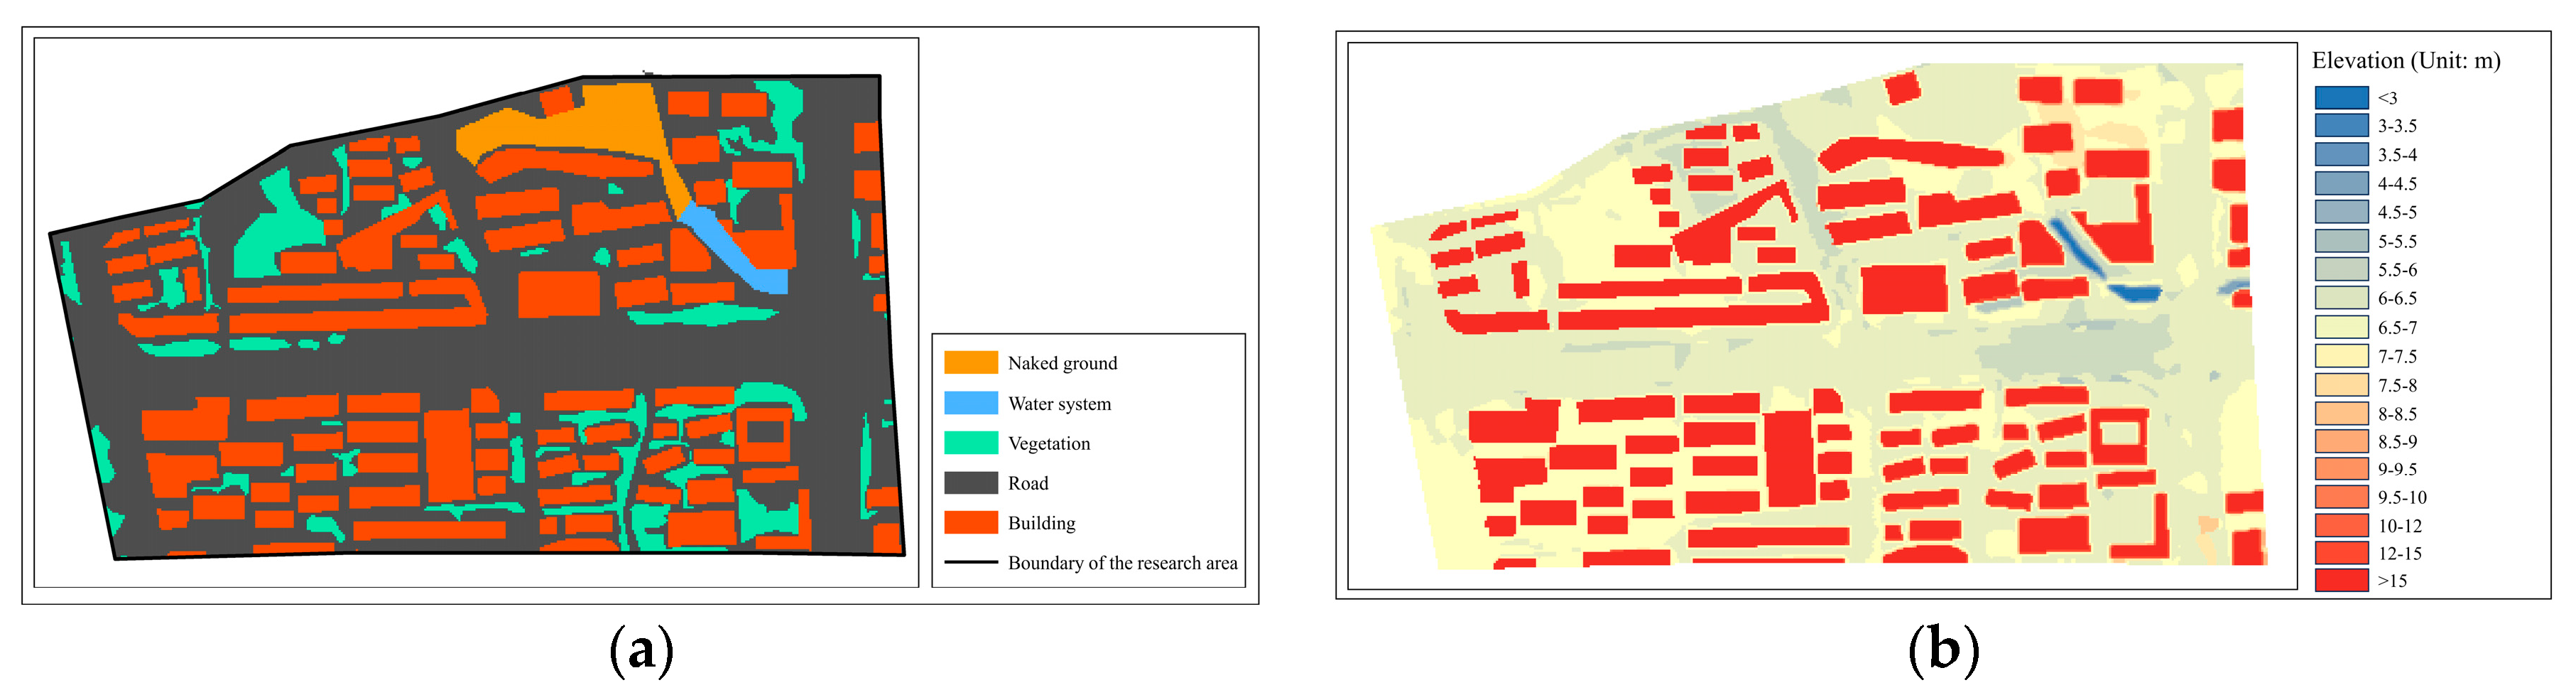
Runoff simulation in the study area was conducted using the direct rainfall method, namely, the raster-based runoff simulation method. The whole study area was divided into structural computational units according to topographic rasters. Each computational unit contains information such as elevation, roughness coefficient, infiltration parameters, percentage of the impervious area, and depth of depression. The study area was divided into 92,516 rasters, and the pixel size was 2 m × 2 m. The simulation time step was 10 min. To ensure calculation stability, the initial surface water depth was set to 0.03 m, and the boundary of the study area was defined as an open boundary. The basic data (Fuzhou, China) needed for model construction are shown in Figure 9. The land use was divided into five types, including bare land, water systems, vegetation, roads, and buildings.
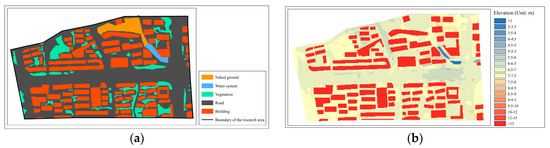
Figure 9.
Basic data for the study area: (a) land use; (b) reconstruction of DEM elevation data.
2.4.2. Parameter Calibration and Validation
To ensure that the model exhibits high accuracy and practicability, it is necessary to calibrate and verify the model parameters. Based on the initial model parameters, the historical rainfall data were input, and the measured data were compared with the simulated data. By adjusting the parameter values, the simulated results could be fitted better with the measured data.
The Nash–Sutcliffe efficiency coefficient (NSE) is a commonly used model accuracy evaluation index that measures the consistency between simulated and measured values by comparing the process lines. The closer the NSE value is to 1, the higher the degree of agreement between the simulation results and the monitoring values. It is generally believed that when NSE < 0, the simulation results are completely inconsistent with the actual situation, and it is meaningless to use the simulation results to describe the display process. In actual parameter calibration and model validation, it is generally believed that NSE ≥ 0.5, and the simulation results are basically consistent with the monitoring values. For high standard models, the critical value of evaluation indicators can be further increased to define simulation results that meet the requirements.
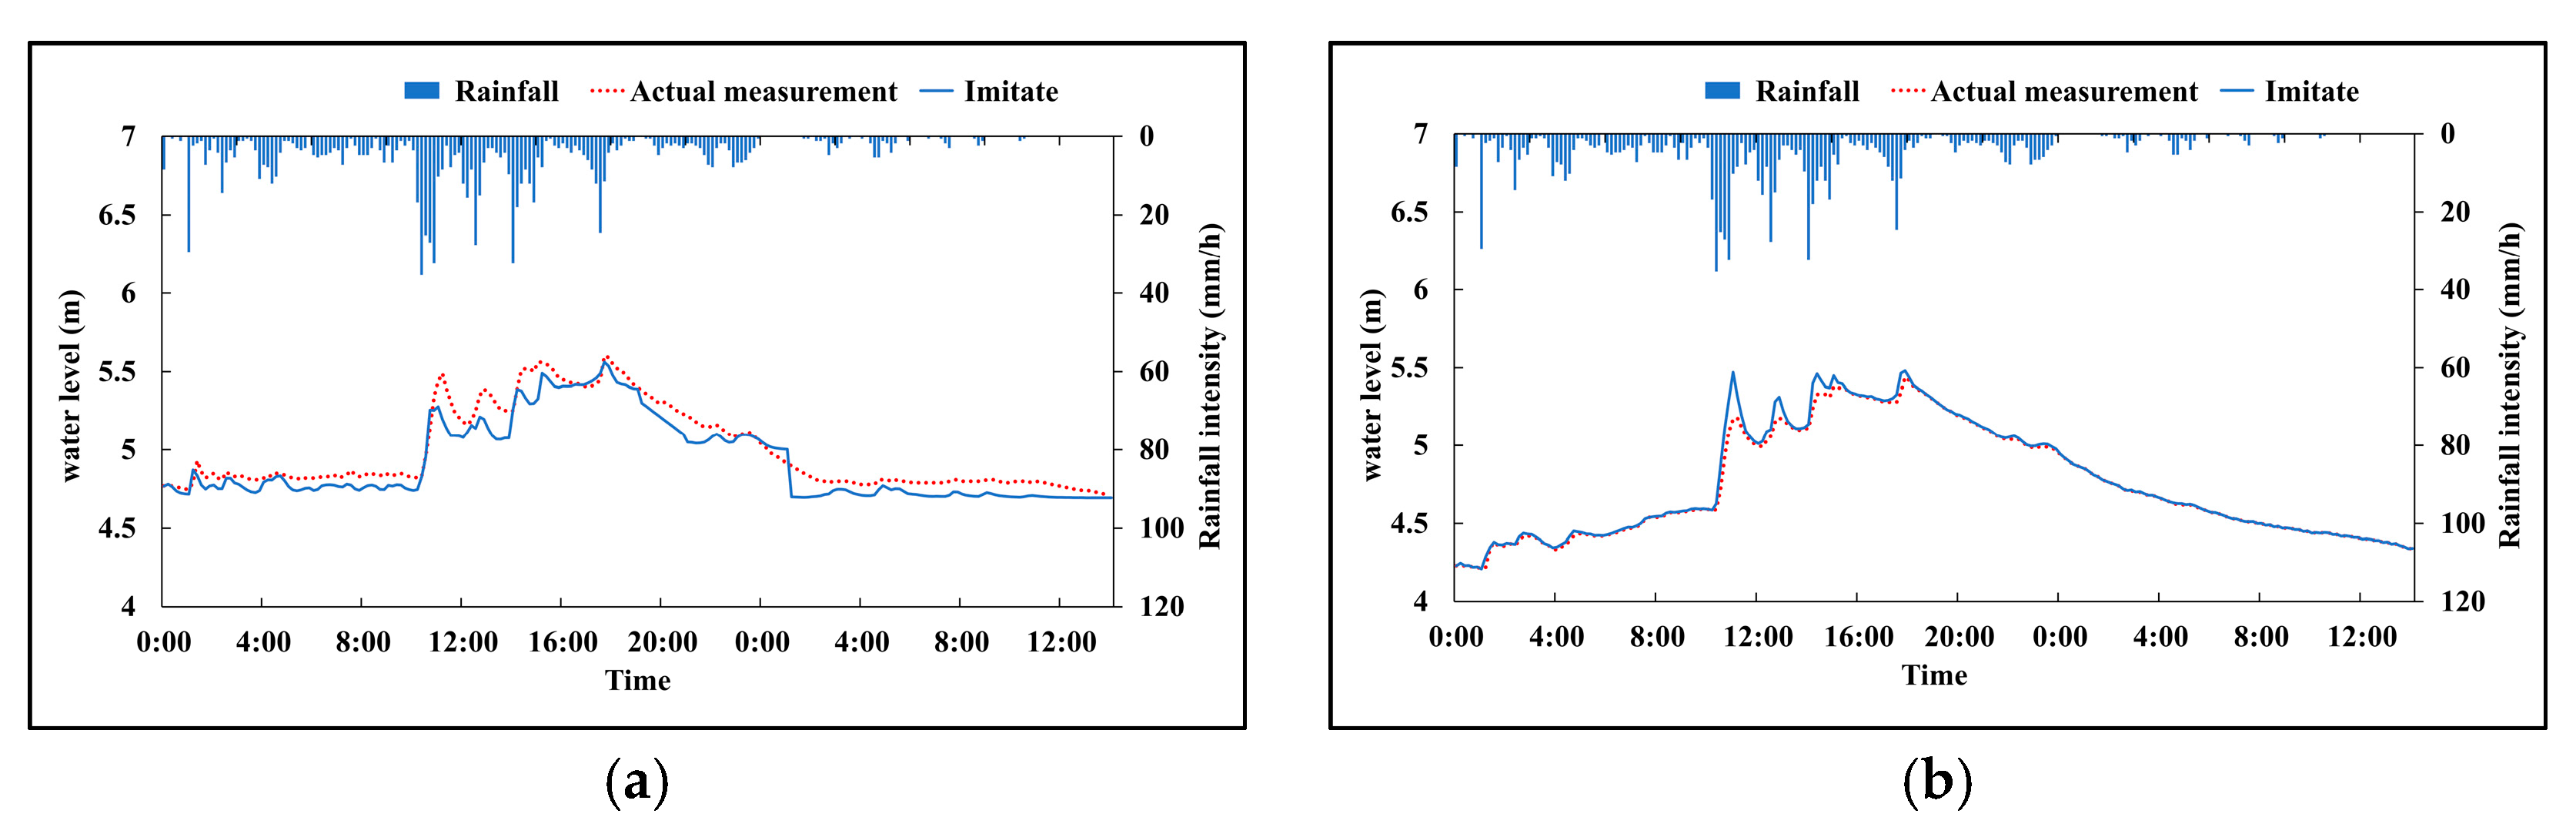
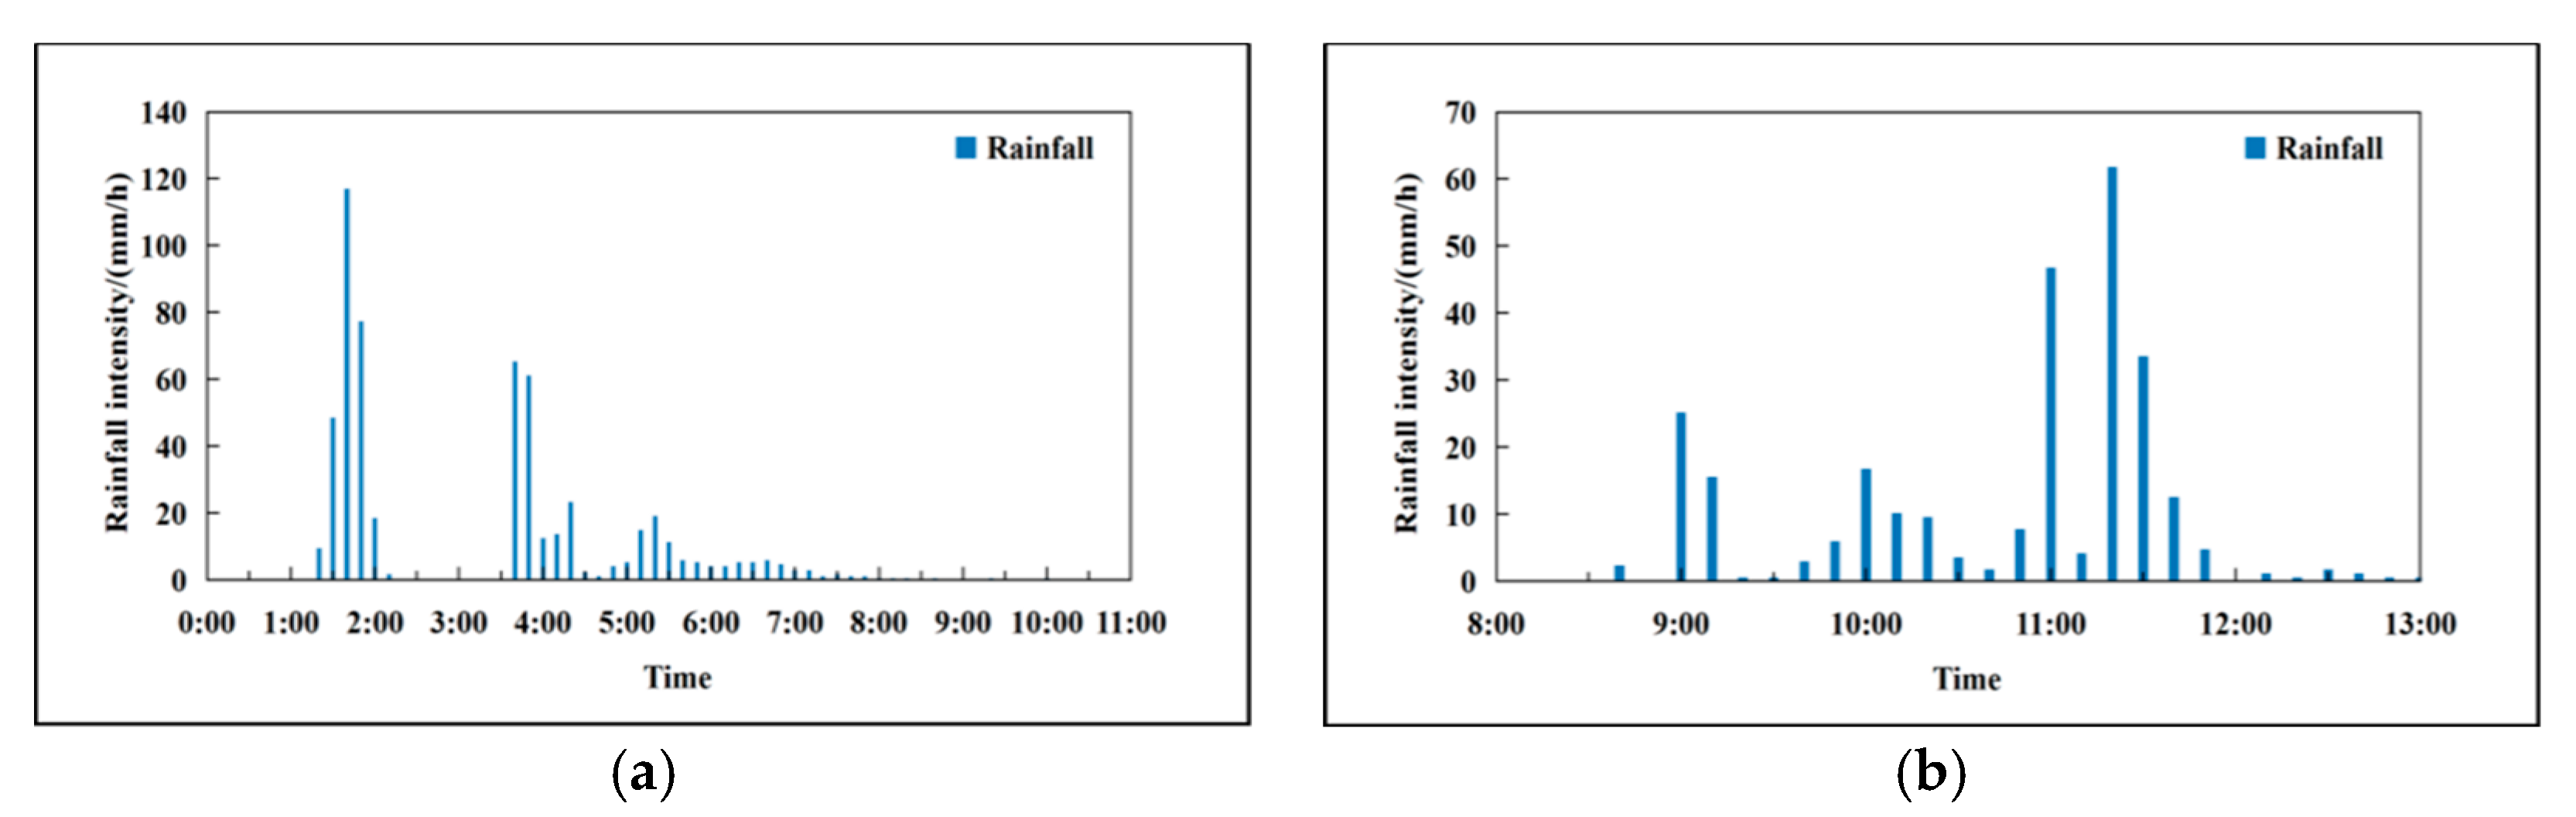
Rainfall from 12:00 on 1 August to 0:00 on 2 August 2021 was selected to determine SWMM parameters, and rainfall data from 9:00 on 5 August to 00:00 on 6 August and from 00:00 on 6 August to 14:00 on 7 August (Figure 10) were selected to verify the model. The measured water levels of two pipeline level measurement stations were compared with the simulated water levels of the model (the pipeline level measurement station numbers are marked as J1 and J2). Figure 11 shows the comparison results of underground water levels during rainfall from 9:00 on 5 August to 00:00 on 6 August, and Figure 12 shows the comparison results of underground water levels during rainfall from 00:00 on 6 August to 14:00 on 7 August.
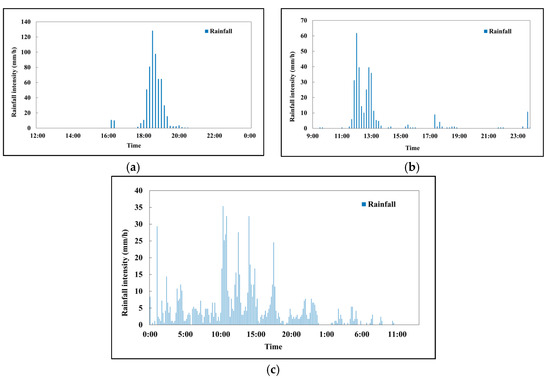
Figure 10.
Measured rainfall process: (a) rainfall process from 12:00 on 1 August 2021 to 0:00 on 2 August 2021; (b) rainfall process from 9:00 on 5 August 2021 to 0:00 on 6 August 2021; (c) rainfall process from 0:00 on 6 August 2021 to 14:00 on 7 August 2021.
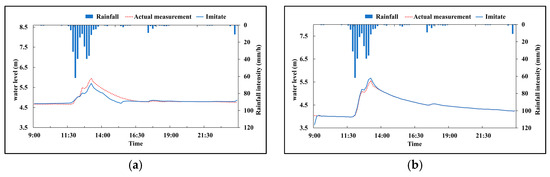
Figure 11.
5 August, 9:00–6 August, 00:00 rainfall well level comparison results: (a) comparison of J1 downhole liquid level simulation results; (b) comparison of J2 downhole liquid level simulation results.
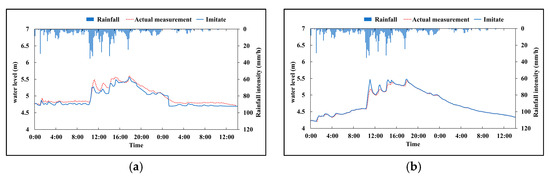
Figure 12.
6 August, 00:00–7 August, 14:00 rainfall well level comparison results: (a) comparison of J1 downhole liquid level simulation results; (b) comparison of J2 downhole liquid level simulation results.
From Figure 10, it can be seen that during the rainy period from 9:00 on 5 August to 00:00 on 6 August, the time error of the peak liquid level underground in inspection well J1 was 0 min, the error of the peak size was 0.250 m, the relative error was 0.099, and the NSE was 0.813; the peak time error of the underground liquid level in inspection well J2 is 0 min, the peak size error is 0.112 m, the relative error is 0.052, and the NSE is 0.977. From Figure 11, it can be seen that during the rainy period from 00:00 on 6 August to 14:00 on 7 August, the time error of the peak liquid level in inspection well J1 was 10 min, the error of the peak size was 0.039 m, the relative error was 0.017, and the NSE was 0.508; the peak time error of the liquid level in the J2 inspection well is 0 min, the peak size error is 0.041 m, the relative error is 0.020, and the NSE is 0.987. The model performs well in terms of peak time error and peak size error, with a peak time deviation of less than 1 h and a peak deviation of less than 25%, without significant deviation. At the same time, the Nash efficiency coefficient, NSE, is greater than 0.5, indicating a high degree of fit in the simulation results and a good simulation effect.
Two rainfall grades, namely heavy rain and rainstorm, were selected for coupled model calibration and validation. The rainfall processes during the two events are shown in Figure 13. The maximum rainfall intensity was 61.8 mm/h, with a total rainfall of 45.4 mm for the heavy rainfall event on 1 September 2022, and the maximum rainfall intensity was 117 mm/h, with a total rainfall of 94.1 mm for the rainstorm on 27 April 2023. On 27 April 2023, debris blocked the connecting branch pipes in a total of 6 rainwater wells within the study area, and the degree of blockage was relatively high. For the rainfall event on 1 September 2022, since the actual blockage is unknown, it was assumed that the locations of stormwater inlet blockage were the same as those during the rainfall event on 27 April 2023.
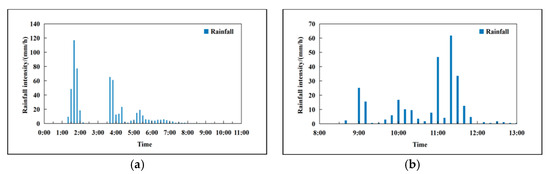
Figure 13.
Rainfall data for the two rainfall events: (a) on 1 September 2022; (b) on 27 April 2023.
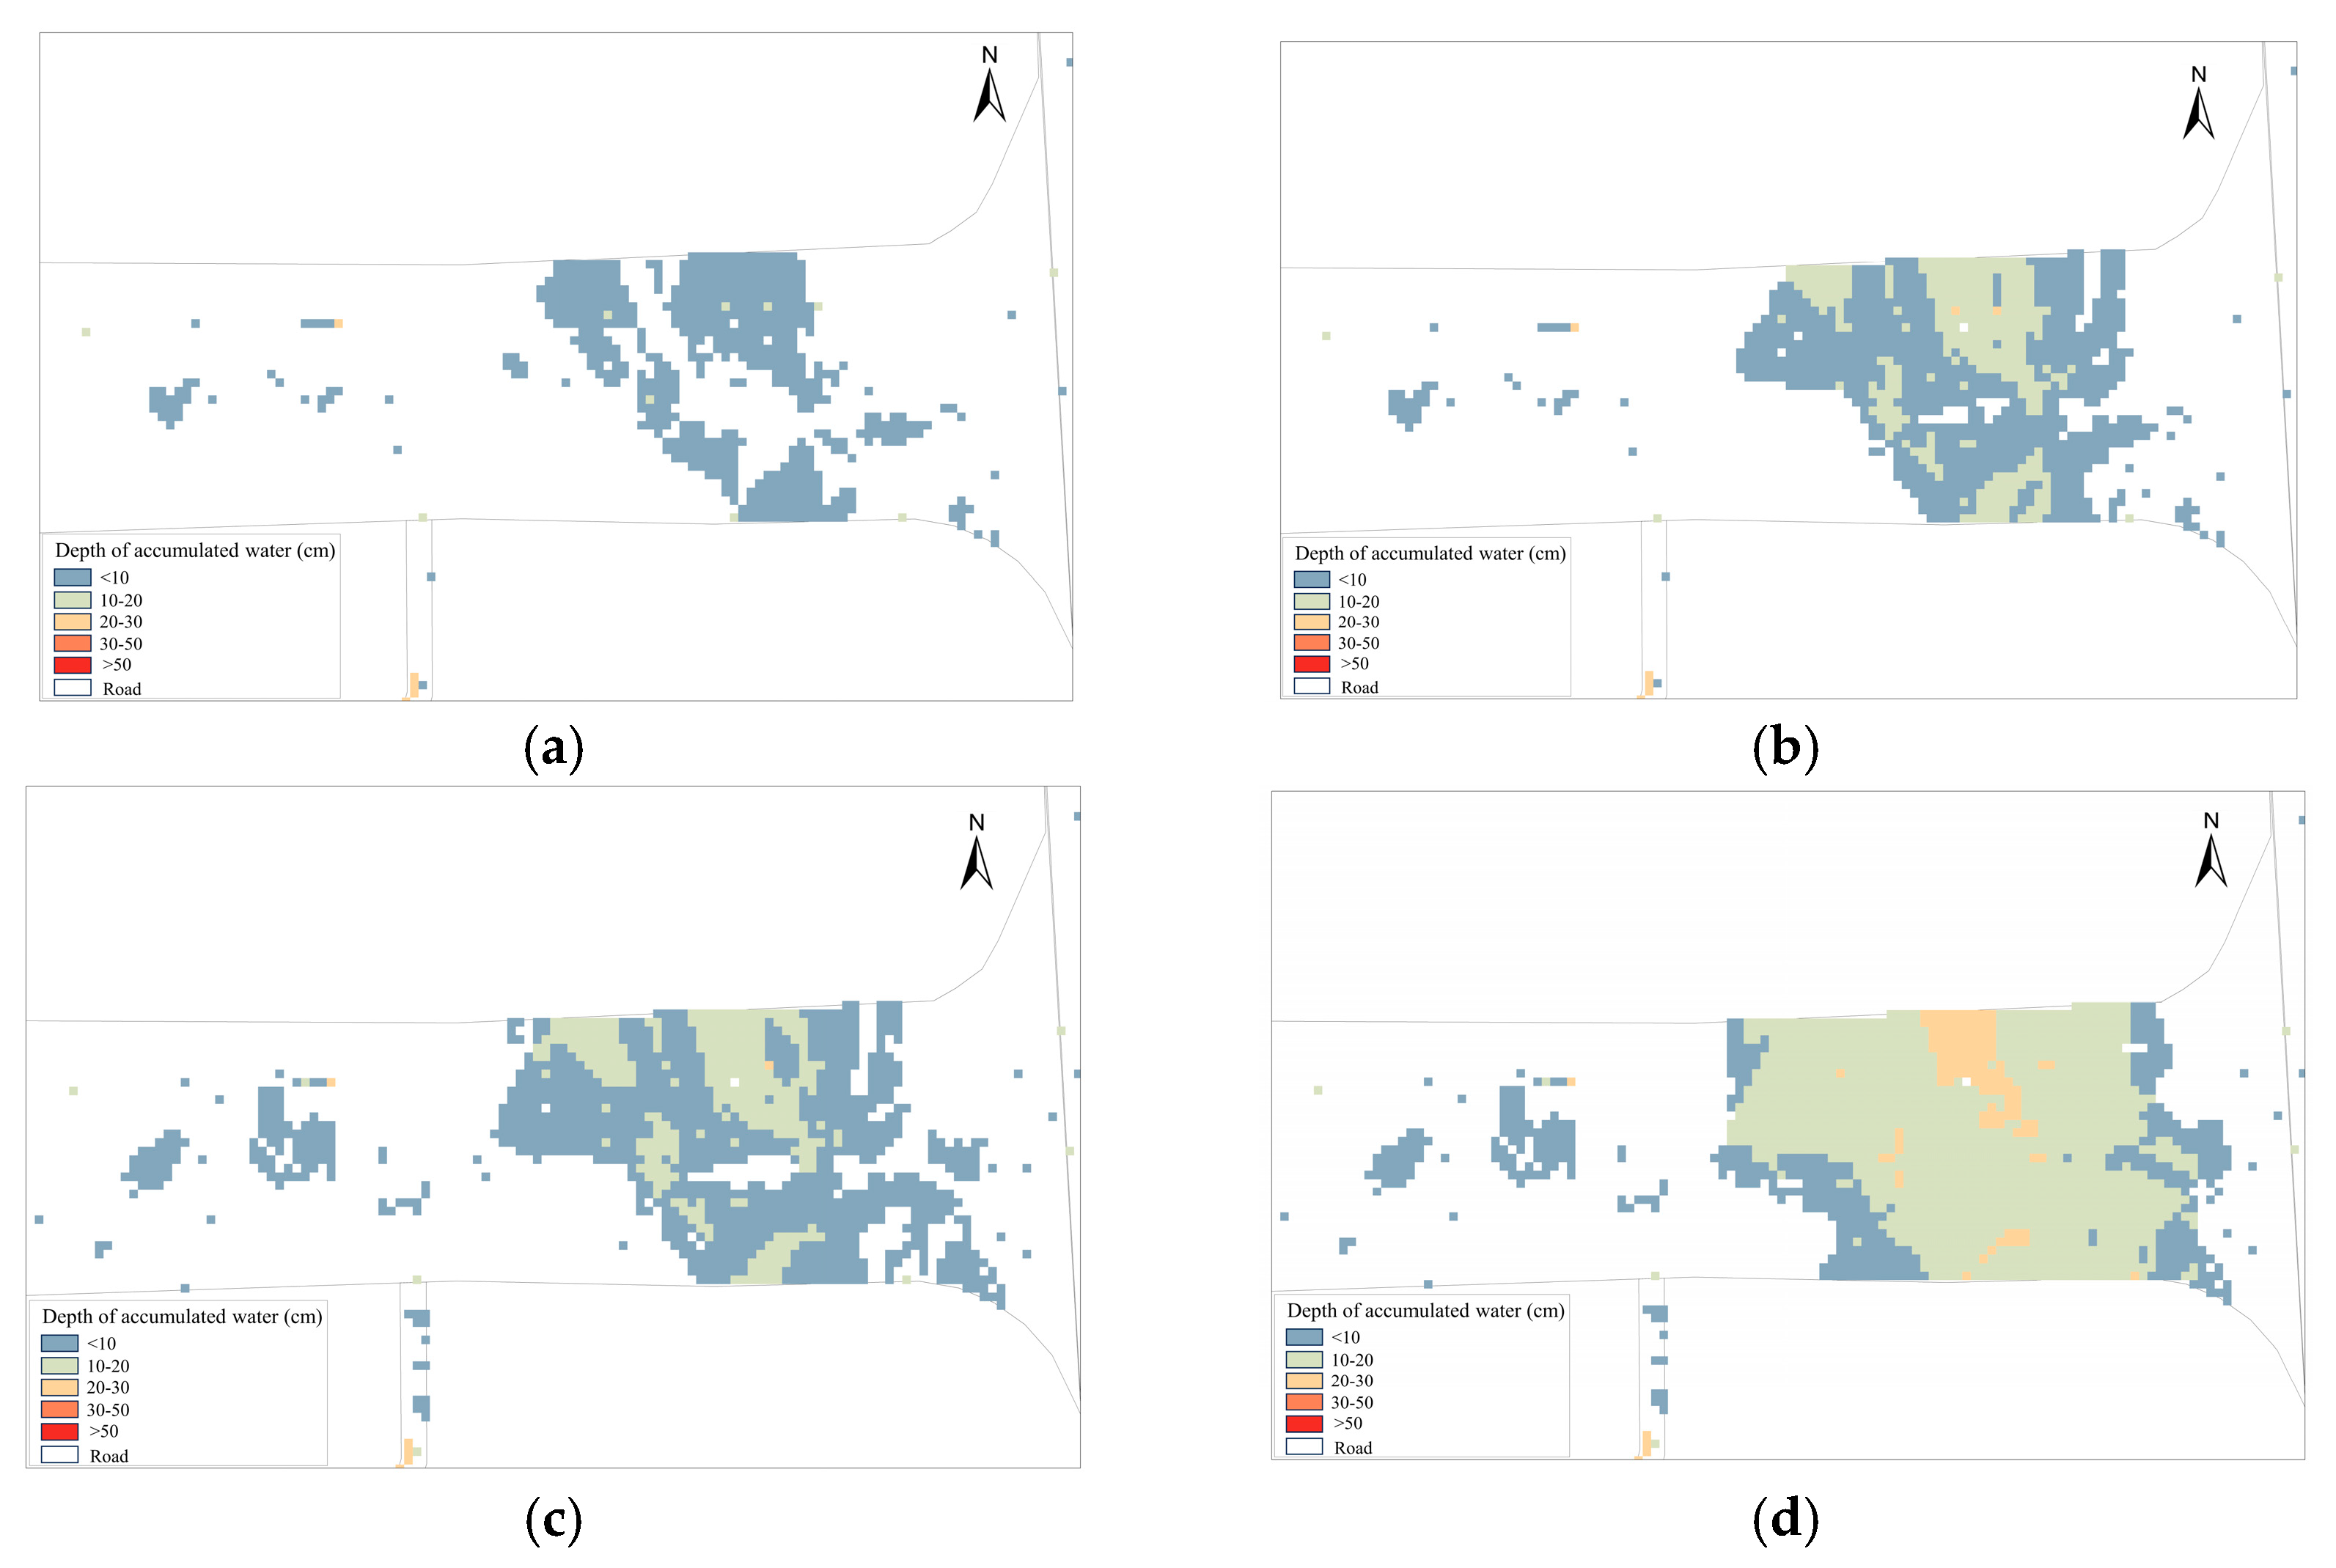
Since the actual degree of stormwater inlet blockage could not be accurately described, it was assumed that the degree of blockage of each stormwater inlet blockage was the same during both rainfall events in the calibration process. Figure 14 shows the simulation results for the maximum depth of accumulated water during the two rainfall events. Due to the lack of information on the measured area of accumulated water, the simulated results were relatively accurate compared with the field investigation results and ponding disposal photos. The maximum depths of accumulated water during the two rainfall events were compared. During the rainfall event on 1 September 2022, the degree of stormwater inlet blockage was 50%, the simulated maximum depth of accumulated water was 23 cm, and the measured depth of accumulated water was 20 cm, with an error of 15%. During the rainfall event on 27 April 2023, the degree of stormwater inlet blockage was 80%, the simulated maximum depth of accumulated water was 30 cm, and the measured depth of accumulated water was 28 cm, with an error of 7.14%. The errors of the two sets of rainfall simulation results were less than 20%, indicating that the model is relatively accurate.
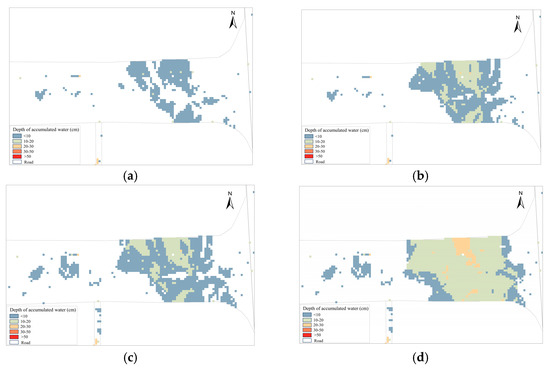
Figure 14.
Maximum depth of accumulated water simulation results for the two rainfall events: (a) nonblocked stormwater inlet on 1 September 2022; (b) stormwater inlet blockage on 1 September 2022; (c) nonblocked stormwater inlet on 27 April 2023; (d) stormwater inlet blockage on 27 April 2023.
3. Analysis of the Impact of Stormwater Inlet Blockage on Waterlogging
3.1. Different Rainfall Scenarios
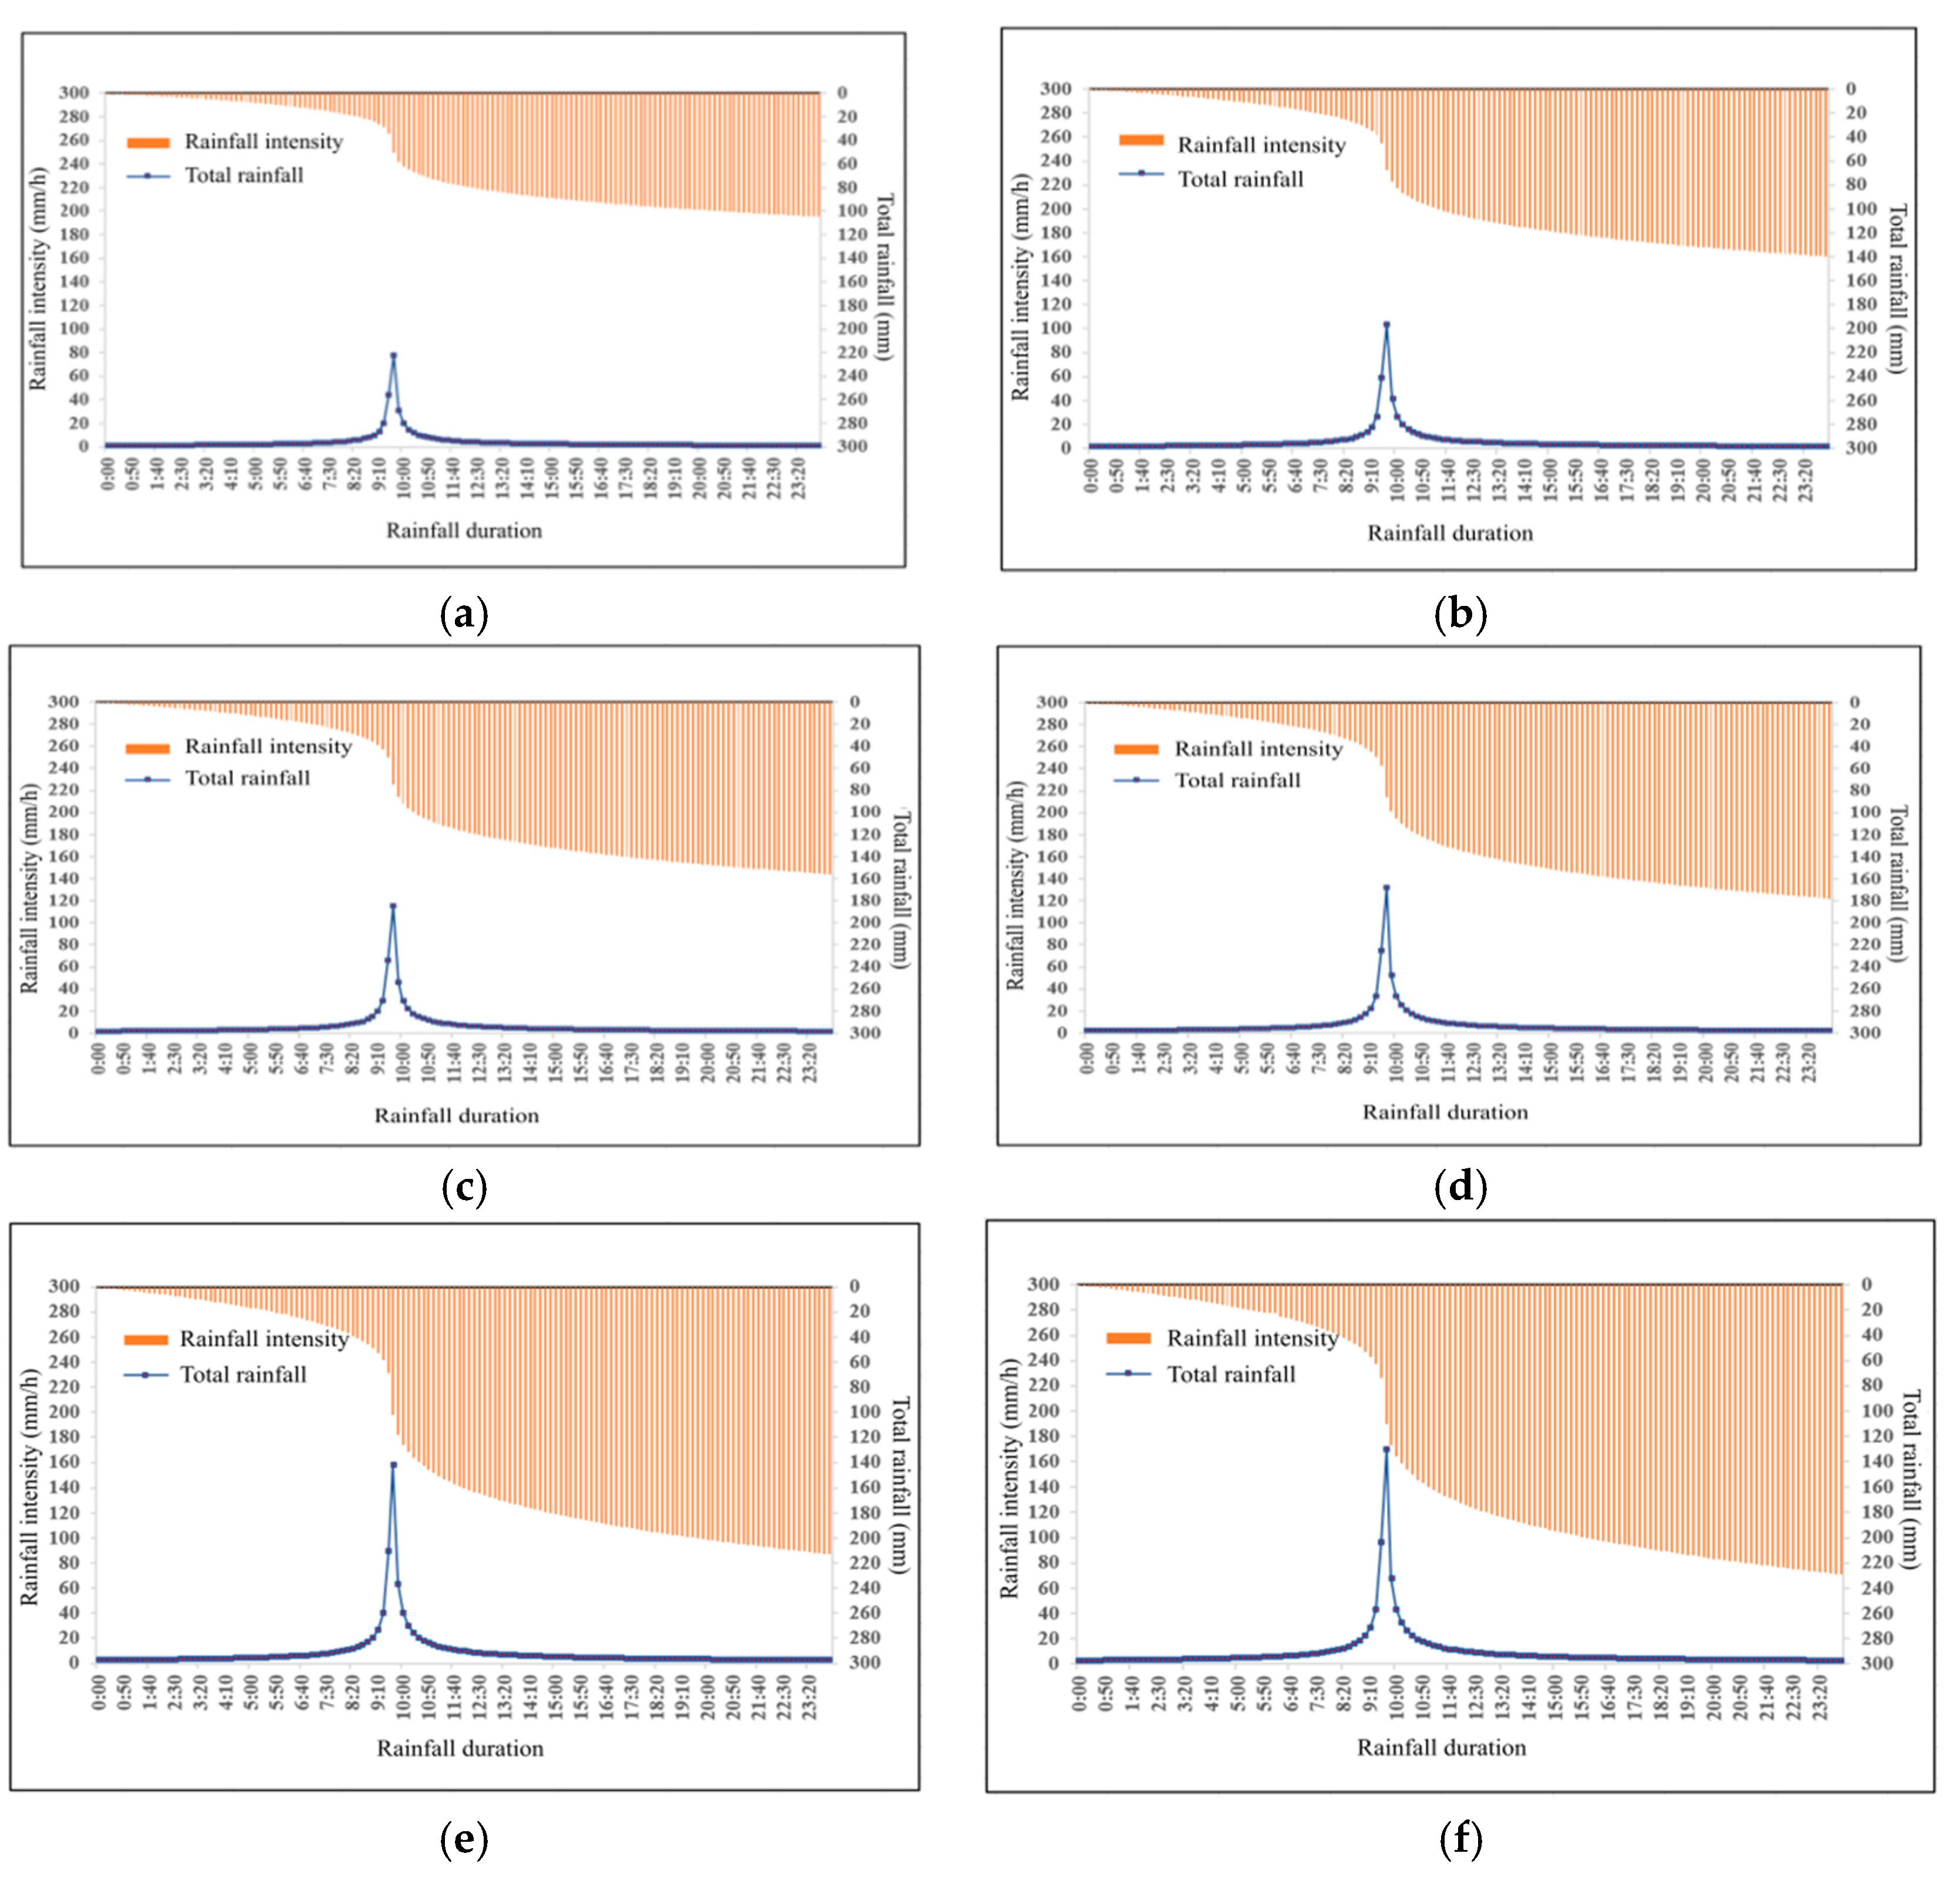
According to the rainstorm intensity equation for Fuzhou city, as expressed in Equation (10), the Chicago rainfall generator was employed [32], the rainfall duration was set to 6 h, the time interval was set to 10 min, and the rain peak coefficient was set to 0.4. Six rainfall scenarios were designed, namely, 1-year, 3-year, 5-year, 10-year, 30-year, and 50-year recurrence scenarios. The rainfall events under the different scenarios are shown in Figure 15. The maximum rainfall intensity and total rainfall amount under the different rainfall scenarios are summarized in Table 2.
where q is the intensity of the rainstorm (mm/min), T is the rainfall recurrence period, and t is the rainfall duration (min).
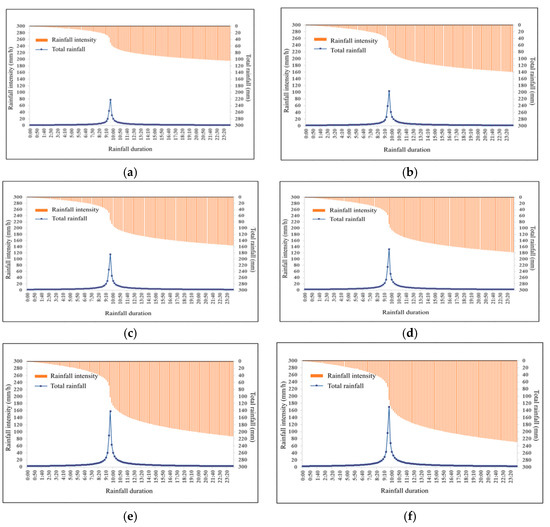
Figure 15.
The process of different rainfall return periods: (a) 1a; (b) 3a; (c) 5a; (d) 10a; (e) 30a; (f) 50a.
Table 2.
Options of the different rainfall return periods.
3.2. Analysis of the Simulation Results
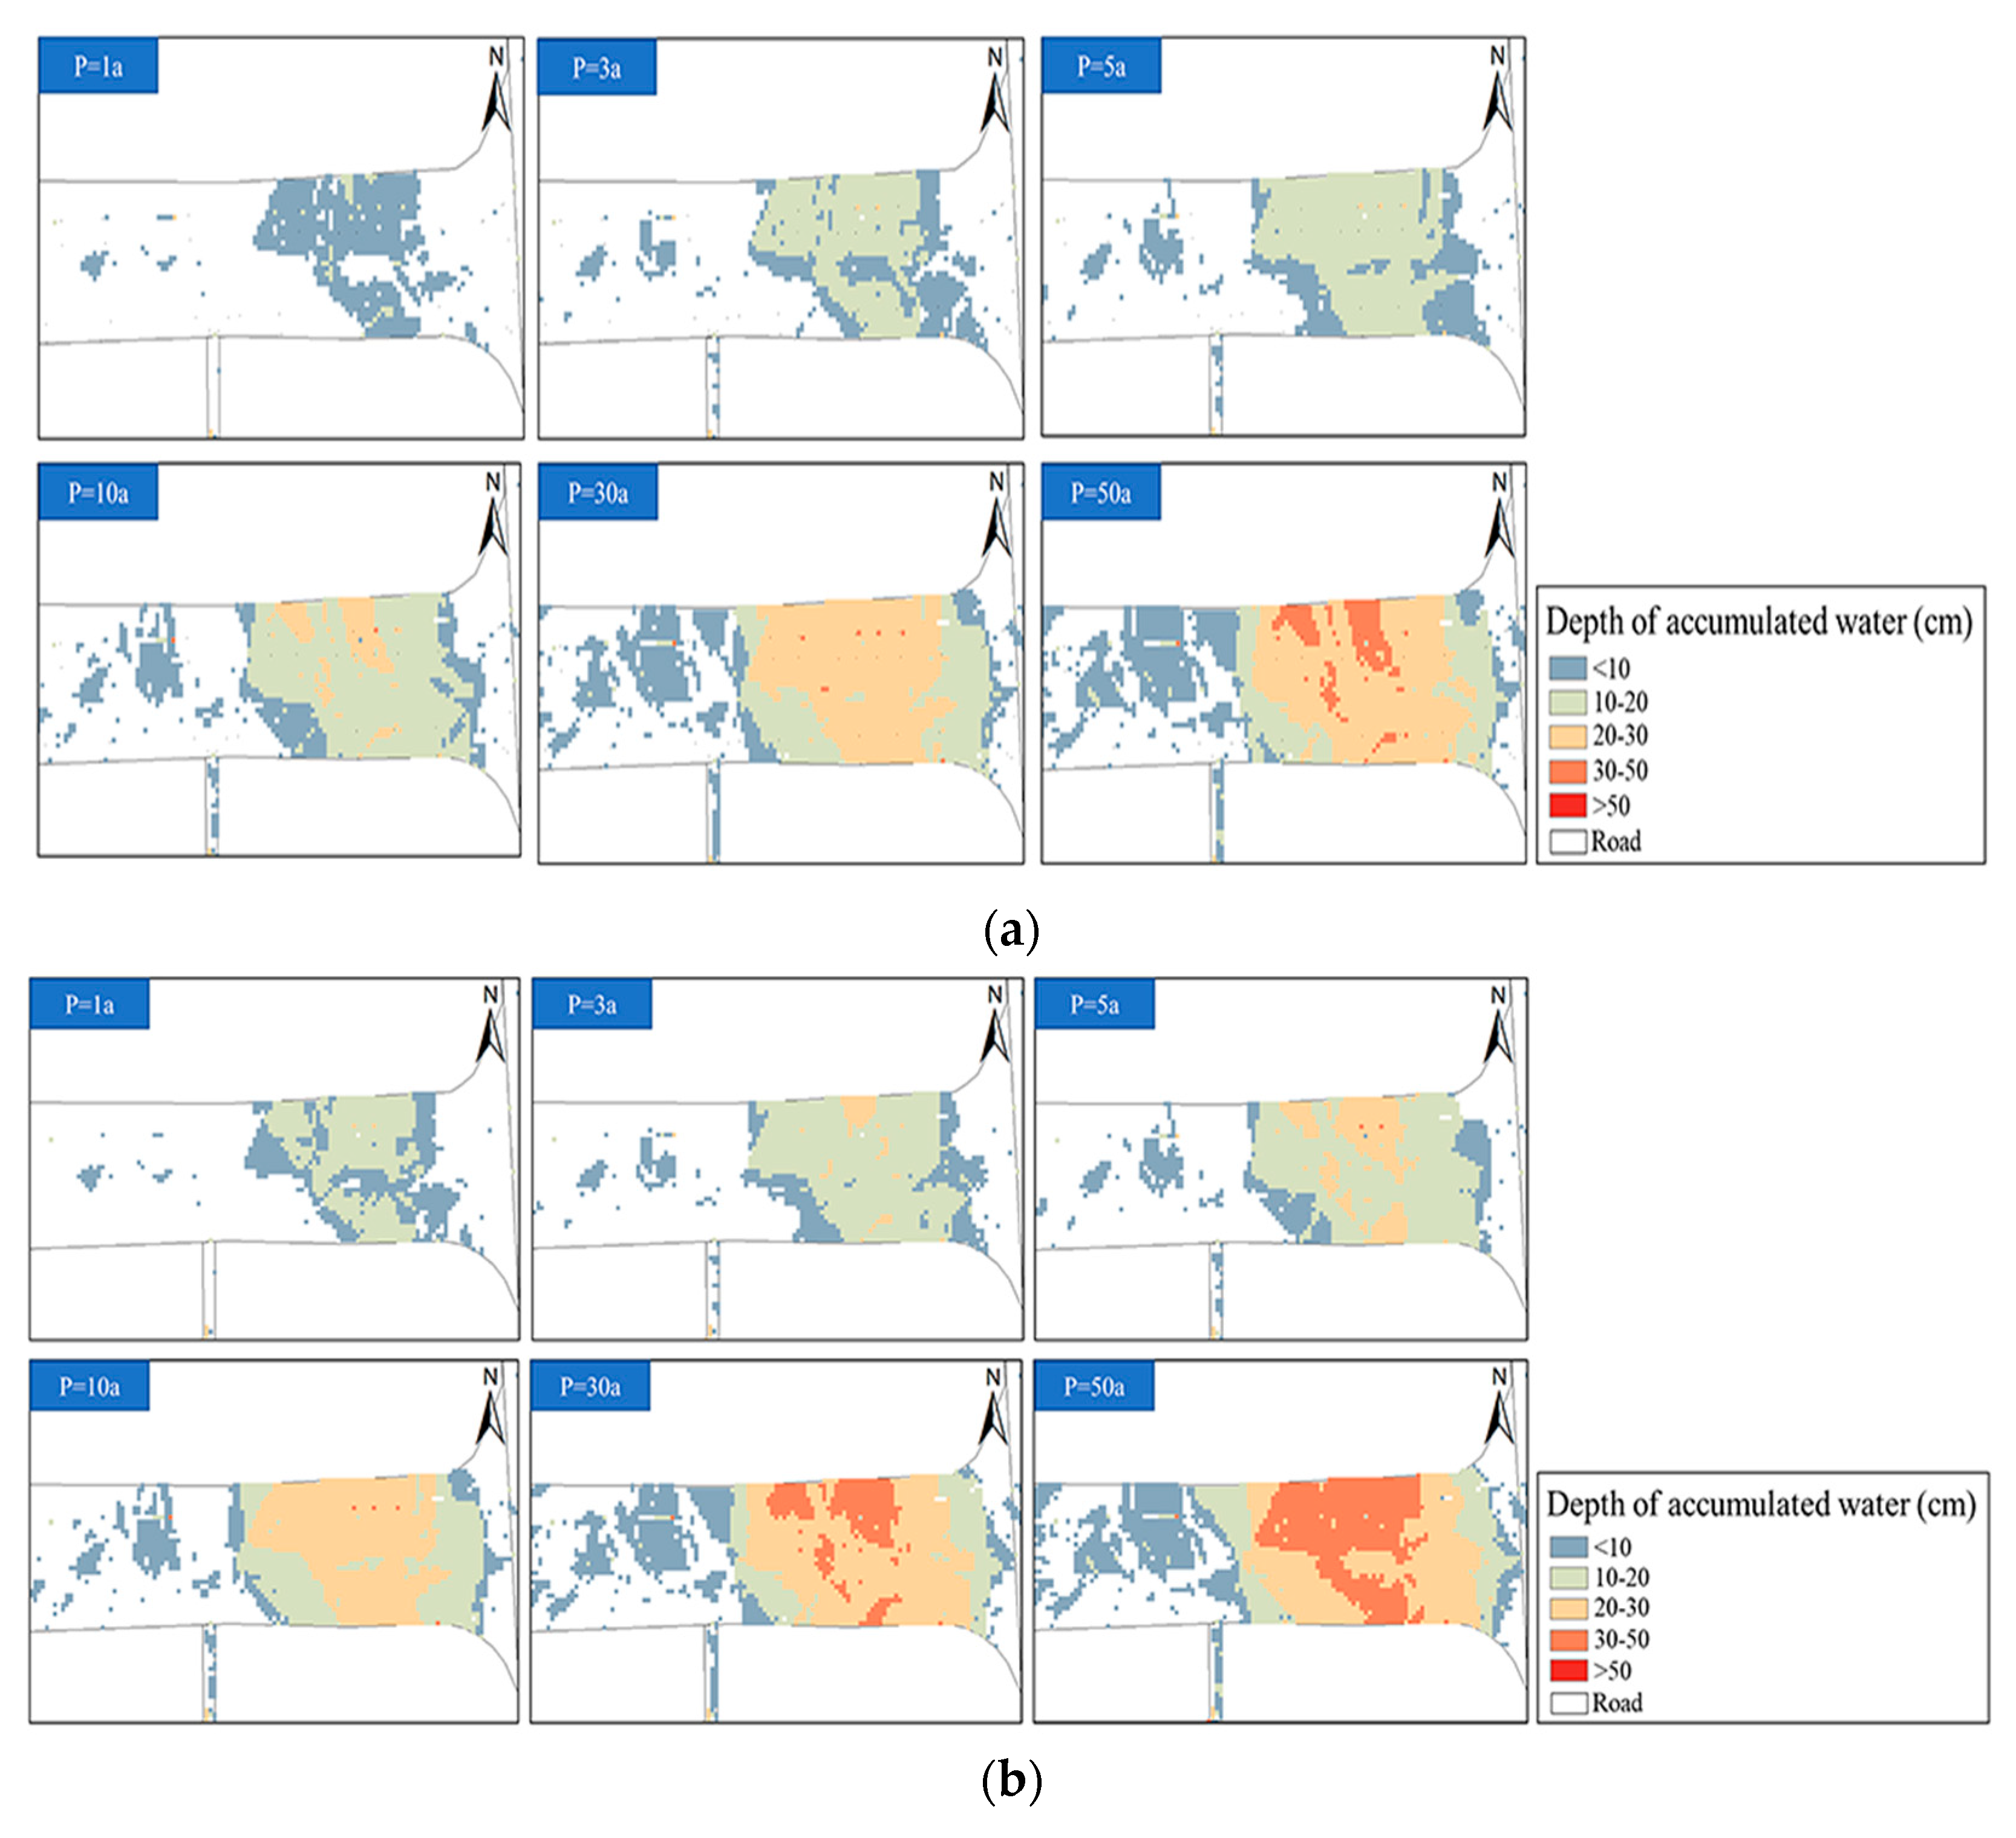
Notably, stormwater inlet blockage was set to be consistent with that during the rainfall event on 27 April 2023, and the influences of stormwater inlet blockage on waterlogging under the different rainfall scenarios were compared and analyzed. For the convenience of observation, the depths of accumulated water were classified into five levels: the blue risk level (0~10 cm), green risk level (10~20 cm), orange risk level (20~30 cm), dark orange risk level (30~50 cm), and red risk level (greater than 50 cm). Figure 16 shows the simulation results of the maximum depth of accumulated water under the different rainfall scenarios.

Figure 16.
Simulation results under different rainfall return periods with different stormwater inlet blockage conditions: (a) nonblocked stormwater inlet; (b) stormwater inlet blockage.
Both the total area and the depth of accumulated water were compared between the different rainfall scenarios with different stormwater inlet blockage conditions, and the results are listed in Table 3. In the case of the 1-year rainfall scenario, the area and the maximum depth of accumulated water due to stormwater inlet blockage increased by 43.35% and 31.58%, respectively, compared with those associated with the nonblocked stormwater inlet. Under the 3-year rainfall scenario, the growth rates of the area and maximum depth of accumulated water decreased by 19.32% and 20.00%, respectively. When the rainfall recurrence period was once in 5 years, compared with that for a rainfall recurrence period of once in 3 years, the growth rate of the area of accumulated water showed a downward trend, at 11.85%, but the growth rate of the maximum ponding depth increased from 20.00% to 22.22%. Under the 10-year rainfall scenario, compared with those under the 5-year rainfall scenario, the increases in the total area and the depth of accumulated water due to stormwater inlet blockage slightly decreased, from 11.85% and 22.22% to 11.40% and 19.35%, respectively. When the rainfall scenario was up to the 30-year recurrence period, the maximum area and the depth of accumulated water due to stormwater inlet blockage increased by 4.04% and 10.53%, respectively, compared with those associated with nonblocked stormwater inlet. Under the 50-year rainfall scenario, the area and the depth of accumulated water caused by stormwater inlet blockage increased by only 3.34% and 9.76%, respectively. Overall, with increasing rainfall intensity, stormwater inlet blockage will cause an increase in both the maximum area and the depth of accumulated water in the study area, while the growth rates basically showed a downward trend compared with the conditions of the nonblocked stormwater inlet, indicating that with increasing rainfall intensity, the influence of stormwater inlet blockage on waterlogging gradually decreased. Therefore, we should consider the changes in the rainfall intensity in the future.
Table 3.
Statistics of waterlogging under the different rainfall scenarios with different stormwater inlet blockage conditions.
The impact of stormwater inlet blockage on the waterlogging conditions in the study area was further analyzed. The area of each waterlogging level under the different scenarios of nonblocked stormwater inlet and stormwater inlet blockage was statistically analyzed. The results are listed in Table 4. Table 5 provides the percentage increase in the area of each waterlogging level with stormwater inlet blockage compared with that of the nonblocked stormwater inlet.
Table 4.
Ponding area at the different levels under the different stormwater inlet blockage conditions (m2).
Table 5.
Area growth ratio of each water level compared with that of the nonblocked group (%).
Table 4 and Table 5 show, notably, that during the 1-year rainfall return period, the depth of accumulated water under nonblocked stormwater inlet conditions was less than 20 cm, even remaining less than 10 cm for the most part. The depth of accumulated water under stormwater inlet blockage conditions was less than 30 cm and mainly ranged from 10 to 20 cm. Compared with the nonblocked stormwater inlet, stormwater inlet blockage imposed the greatest impact on the depth of accumulated water ranging from 10 to 20 cm, and the increase ratio was 1384.78%. Under the 3-year rainfall scenario, the maximum depth of accumulated water for the nonblocked stormwater inlet increased to 20~30 cm, and that for both nonblocked stormwater inlet and stormwater inlet blockage mainly ranged from 10 cm to 20 cm. Compared with the status of the nonblocked stormwater inlet, the depth of accumulated water ranged from 20 to 30 cm, and the growth rate was 1900.00%. Under the 5-year rainfall return period, the depth of accumulated water for both nonblocked stormwater inlet and stormwater inlet blockage was the same as that under the 3-year rainfall scenario, mainly ranging from 10 to 20 cm. Compared with the nonblocked stormwater inlet, stormwater inlet blockage exerted the greatest impact on the depth of accumulated water within the range of 20~30 cm, and the increase ratio was the highest, at 7640.00%. Under the 10-year rainfall scenario, the depth of accumulated water for the nonblocked stormwater inlet mainly ranged from 10 to 20 cm, and that for stormwater inlet blockage largely ranged from 20 to 30 cm. Compared with that for the nonblocked stormwater inlet, the depth of accumulated water for stormwater inlet blockage was less than 20 cm, ranging from 10 to 20 cm. Stormwater inlet blockage imposed the greatest impact on the depth of accumulated water within the range of 20~30 cm, and the increase ratio was 389.45%. Up to the 30-year rainfall return period, the depth of accumulated water for both the nonblocked stormwater inlet and stormwater inlet blockage mainly ranged from 20 to 30 cm. Compared with the case of the nonblocked stormwater inlet, the depth of accumulated water within the range of 30~50 cm was most affected by stormwater inlet blockage, and the growth proportion reached a maximum of 4287.50%. Under the 50-year rainfall scenario, the depth of accumulated water for both nonblocked stormwater inlet and stormwater inlet blockage mainly ranged from 20 to 30 cm. Compared with that for nonblocked stormwater inlet, the depth for stormwater inlet blockage decreased within the ranges of less than 10 cm, 10~20 cm and 20~30 cm, while stormwater inlet blockage exerted the greatest impact on the depth of accumulated water within the range of 30–50 cm, with a growth proportion of 245.95%.
In terms of the total area of accumulated water, stormwater inlet blockage yielded the greatest impact under the 1-year rainfall scenario, with a 43.35% increase. The influence of stormwater inlet blockage on the area of accumulated water in the study block gradually decreased with increasing rainfall recurrence period. Under the 50-year rainfall scenario, stormwater inlet blockage only resulted in a 3.34% increase in the total area of accumulated water. The impact of stormwater inlet blockage on the maximum depth of accumulated water generally decreased with increasing rainfall recurrence period. This may occur because the effects of the rainfall intensity and low-elevation terrain on waterlogging increased, thus weakening the effect of stormwater inlet blockage on waterlogging. In terms of changes within the different accumulated water level ranges, stormwater inlet blockage caused an increase in the level of accumulated water, a reduction in the proportion of low-risk areas, and an increase in the proportion of high-risk areas. Moreover, with increasing rainfall recurrence period, the level of accumulated water most affected by stormwater inlet blockage differed. Under the 1-year rainfall scenario, the level of accumulated water most affected by stormwater inlet blockage was 10–20 cm. Under the 3-year, 5-year and 10-year rainfall scenarios, the level of accumulated water most affected by stormwater inlet blockage was 20–30 cm, while under the 30-year and 50-year rainfall scenarios, the level of accumulated water most affected by stormwater inlet blockage was 30–50 cm. Overall, stormwater inlet blockage aggravated the waterlogging risk and the extent of waterlogging, which could result in more severe waterlogging disasters.
4. Discussion
The hydraulic roughness coefficient has a significant impact on the simulation results of the SWMM. When the hydraulic roughness coefficient increases, it indicates that the water flow velocity per unit width decreases, the flow velocity decreases, and thus affects the changes in water level. But for the independent ITF-FLOOD model, there was no significant impact. For the SWMM and ITF-FLOOD coupling model, the hydraulic roughness coefficient will affect the input of the ITF-FLOOD model. But stormwater inlet blockage has a more significant impact on the simulation results, as it can lead to a decrease in the drainage capacity of the pipeline network, a decrease in runoff, and thus affect the changes in water level.
To alleviate the impact of stormwater inlet blockage on the risk of waterlogging, prevention and control recommendations are proposed in terms of both stormwater inlet installation and management measures. The specific suggestions are as follows:
- (1)
- Replace aged or easily clogged stormwater grates
The aging of drainage facilities can affect the discharge rate of rainwater. Management personnel can replace aged or easily clogged stormwater grates in the research area with anti-clogging types through investigation. This type of stormwater grate can effectively intercept debris, garbage, and other blockages, thereby reducing the degree and probability of stormwater inlet blockage. In addition, the intercepted blockages are stored on the surface of the stormwater inlet for easy maintenance and treatment by management personnel.
- (2)
- Implement a stormwater inlet subcontracting system
The large number and wide distribution of stormwater inlets are important factors leading to the neglect of stormwater inlet management. Moreover, some businesses or households randomly discard oil and debris in stormwater inlets, which greatly reduces the drainage efficiency. Given these problems, it is recommended that the front door responsibility system be implemented in areas where stormwater inlets are often blocked. For example, the supervision and inspection of stormwater inlets should be subcontracted to nearby businesses or households. During periods without rain, the responsible businesses or households are responsible for supervising the behavior of randomly throwing waste and other debris into stormwater inlets, assessing the status of stormwater inlets before rainfall onset, and reporting severe stormwater inlet blockage to the management department, which will then perform timely dredging work. At the same time, some incentive measures can be adopted to ensure smooth implementation.
- (3)
- Combining other measures to address accumulated water
The simulation results showed that under high-intensity rainfall, although the stormwater inlets were not blocked, waterlogging in the study area was severe. Therefore, under high-intensity rainfall, it is not enough to implement a single treatment measure for dredging rainwater orifices. Notably, it is necessary to combine other drainage measures to prevent and control waterlogging in the study area to effectively reduce the risk of waterlogging disasters.
5. Conclusions
In this paper, the drainage capacity of the pipe network was generalized by using the equivalent drainage method for stormwater inlets. By coupling the stormwater inlet drainage equation, the ITF-FLOOD two-dimensional hydrodynamic model was improved to construct a coupled waterlogging model of the typical waterlogging point of Guohuo East Road in the middle Lianjiang Road area of Fuzhou city. The effect of stormwater inlet blockage on waterlogging under different rainfall scenarios was simulated and analyzed by setting the stormwater inlet blockage state, which provided a reference for the construction of an urban waterlogging model and has certain guiding significance for waterlogging prevention and control in the study area prone to stormwater inlet blockage. The results indicated that both the total area and the maximum depth of accumulated water caused by stormwater inlet blockage increased by 43.35% and 31.58%, respectively, compared with those associated with the nonblocked stormwater inlet under the 1-year rainfall scenario. When the rainfall intensity was once in fifty years, the total area of accumulated water due to stormwater inlet blockage increased by only 3.34% compared with the nonblocked stormwater inlet, and the maximum depth of accumulated water increased by only 9.76%. With increasing rainfall recurrence period, the effects of stormwater inlet blockage on the area and the maximum depth of accumulated water gradually decreased, but the effect of stormwater inlet blockage on the level of accumulated water increased. Overall, stormwater inlet blockage aggravates the risk level and extent of waterlogging, resulting in severe waterlogging disasters.
Author Contributions
Conceptualization, W.G.; Validation, W.G. and M.Z.; Data Curation, W.G. and M.Z.; Writing—Review and Editing, W.G.; Supervision, W.G.; Funding Acquisition, W.G.; Methodology, M.Z.; Formal Analysis, M.Z., X.L. and H.H.; Writing—Original Draft, M.Z.; Investigation, X.L.; Resources, H.H. and S.L.; Project Administration, Y.L. All authors have read and agreed to the published version of the manuscript.
Funding
This research was funded by Hebei Natural Science Foundation, grant number [E2021402039], Hebei Natural Science Foundation, grant number [E2024402142] and the Water Conservancy Technology Promotion Program of Shanxi province, grant number [2021LS011].
Data Availability Statement
The data included in this study are available from the corresponding author on reasonable request.
Conflicts of Interest
The authors declare no conflicts of interest.
References
- Qi, G.Z.; Wang, Z.B.; Wei, L.J.; Wang, Z.X. Multidimensional effects of urbanization on PM2.5 concentration in China. Environ. Sci. Pollut. Res. 2022, 29, 77081–77096. [Google Scholar] [CrossRef] [PubMed]
- Duan, C.Y.; Zhang, J.Q.; Chen, Y.N.; Lang, Q.L.; Zhang, Y.C.; Wu, C.Y.; Zhang, Z. Comprehensive Risk Assessment of Urban Waterlogging Disaster Based on MCDA-GIS Integration: The Case Study of Changchun, China. Remote Sens. 2022, 14, 3101. [Google Scholar] [CrossRef]
- Yu, H.F.; Zhao, Y.L.; Fu, Y.C.; Li, L. Spatiotemporal Variance Assessment of Urban Rainstorm Waterlogging Affected by Impervious Surface Expansion: A Case Study of Guangzhou, China. Sustainability 2018, 10, 3761. [Google Scholar] [CrossRef]
- Chen, X.S.; Jiang, S.L.; Xu, L.S.; Xu, H.G.; Guan, N.N. Resilience assessment and obstacle factor analysis of urban areas facing waterlogging disasters: A case study of Shanghai, China. Environ. Sci. Pollut. Res. 2023, 30, 65455–65469. [Google Scholar] [CrossRef] [PubMed]
- Xie, S.; Liu, W.; Yuan, Z.; Zhang, H.Y.; Lin, H.; Wang, Y.Q. Integrated Risk Assessment of Waterlogging in Guangzhou Based on Runoff Modeling, AHP, GIS and Scenario Analysis. Water 2022, 14, 2899. [Google Scholar] [CrossRef]
- Qi, W.C.; Ma, C.; Xu, H.S.; Zhao, K. Urban flood response analysis for designed rainstorms with different characteristics based on a tracer-aided modelling simulation. J. Clean. Prod. 2022, 335, 131797. [Google Scholar] [CrossRef]
- Zhang, Q.F.; Wu, Z.F.; Zhang, H.; Dalla Fontana, G.; Tarolli, P. Identifying dominant factors of waterlogging events in metropolitan coastal cities: The case study of Guangzhou, China. Environ. Manag. 2020, 271, 110951. [Google Scholar] [CrossRef]
- Merz, B.; Blöschl, G.; Vorogushyn, S.; Dottori, F.; Aerts, J.C.J.H.; Bates, P.; Bertola, M.; Kemter, M.; Kreibich, H.; Lall, U.; et al. Causes, impacts and patterns of disastrous river floods. Nat. Rev. Earth. Environ. 2021, 2, 592–609. [Google Scholar] [CrossRef]
- Bryndal, T.; Franczak, P.; Kroczak, R.; Cabaj, W.; Kołodziej, A. The impact of extreme rainfall and flash floods on the flood risk management process and geomorphological changes in small Carpathian catchments: A case study of the Kasiniczanka river (Outer Carpathians, Poland). Nat. Hazards 2017, 88, 95–120. [Google Scholar] [CrossRef]
- Zhao, X.F.; Li, H.M.; Cai, Q.; Pan, Y.; Qi, Y. Managing Extreme Rainfall and Flooding Events: A Case Study of the 20 July 2021 Zhengzhou Flood in China. Climate 2023, 11, 228. [Google Scholar] [CrossRef]
- Alemaw, B.F.; Tafesse, N.T. Urban Stormwater and Sewerage Modelling: An Approach for Peak Runoff and Volume Assessment. J. Water Resour. Prot. 2021, 13, 855–880. [Google Scholar] [CrossRef]
- Liu, Y.; Zhang, S.H.; Su, H.D.; Wang, D.; Gu, Q.H. Modelling and Application of Urban Drainage Based on Mike Urban Model. IOP Conf. Ser. Earth Environ. Sci. 2020, 474, 062003. [Google Scholar] [CrossRef]
- Komori, D.; Nakaguchi, K.; Inomata, R.; Oyatsu, Y.; Tachikawa, R.; Kazama, S. Topographical Characteristics of Frequent Urban Pluvial Flooding Areas in Osaka and Nagoya Cities, Japan. Water 2022, 14, 2795. [Google Scholar] [CrossRef]
- Zhang, Q.F.; Wu, Z.F.; Tarolli, P. Investigating the Role of Green Infrastructure on Urban WaterLogging: Evidence from Metropolitan Coastal Cities. Remote Sens. 2021, 13, 2341. [Google Scholar] [CrossRef]
- Wu, J.S.; Sha, W.; Zhang, P.H.; Wang, Z.Y. The spatial non-stationary effect of urban landscape pattern on urban waterlogging: A case study of Shenzhen City. Sci. Rep. 2020, 10, 7369. [Google Scholar] [CrossRef]
- Zhao, Y.J.; Xia, J.; Xu, Z.X.; Zou, L.; Qiao, Y.F.; Li, P. Impact of Urban Expansion on Rain Island Effect in Jinan City, North China. Remote Sens. 2021, 13, 2989. [Google Scholar] [CrossRef]
- Hu, M.C.; Zhang, X.Q.; Siu, Y.L.; Li, Y.; Tanaka, K.; Yang, H.; Xu, Y.P. Flood Mitigation by Permeable Pavements in Chinese Sponge City Construction. Water 2018, 10, 172. [Google Scholar] [CrossRef]
- Ahmad, T.; Pandey, A.C.; Kumar, A. Evaluating urban growth and its implication on flood hazard and vulnerability in Srinagar city, Kashmir Valley, using geoinformatics. Arab. J. Geosci. 2019, 12, 308. [Google Scholar] [CrossRef]
- Wang, L.Y.; Li, Y.; Hou, H.; Chen, Y.; Fan, J.J.; Wang, P.; Hu, T.G. Analyzing spatial variance of urban waterlogging disaster at multiple scales based on a hydrological and hydrodynamic model. Nat. Hazards 2022, 114, 1915–1938. [Google Scholar] [CrossRef]
- Zhang, K.; Li, J.K.; Ning, L.Z.; Xie, W.F.; Li, Y.F.; Ullah, Z.; Peng, K. Three-Dimensional Numerical Simulation Research on Discharge Characteristics of Storm-Drain Inlet in Low-Lying Areas. Water Resour. Manag. 2023, 37, 5273–5287. [Google Scholar] [CrossRef]
- Yu, S.; Zhang, S.H.; Di, S.C.; Zhou, X.; Ge, J.; Xiao, B.Q. Effect of combined flat and vertical renovation of urban road gullies on surface water flooding prevention based on physical model experiments. J. Hydraul. Eng. 2022, 53, 854–861. [Google Scholar]
- Harada, S. Application of Porous Concrete Infiltration Techniques to Street Stormwater Inlets That Simultaneously Mitigate against Non-Point Heavy Metal Pollution and Stormwater Runoff Reduction in Urban Areas: Catchment-Scale Evaluation of the Potential of Discrete and Small-Scale Techniques. Water 2023, 15, 1998. [Google Scholar] [CrossRef]
- Kim, J.S.; Kwak, C.J.; Jo, J.B. Enhanced method for estimation of flow intercepted by drainage grate inlets on roads. J. Environ. Manag. 2021, 279, 111546. [Google Scholar] [CrossRef] [PubMed]
- Noh, S.J.; Lee, S.; An, H.; Kawaike, K.; Nakagawa, H. Ensemble urban flood simulation in comparison with laboratory-scale experiments: Impact of interaction models for manhole, sewer pipe, and surface flow. Adv. Water Resour. 2016, 97, 25–37. [Google Scholar] [CrossRef]
- Martins, R.; Leandro, J.; Carvalho, R.F.D. Characterization of the hydraulic performance of a gully under drainage conditions. Water Sci. Technol. 2014, 69, 2423–2430. [Google Scholar] [CrossRef] [PubMed]
- Martins, R.; Rubinato, M.; Kesserwani, G.; Leandro, J.; Djordjević, S.; Shucksmith, J.D. On the characteristics of velocities fields on the vicinity of manhole inlet grates during flood events. Water Resour. Res. 2018, 54, 6408–6422. [Google Scholar] [CrossRef]
- Rubinato, M.; Lee, S.; Martins, R.; Shucksmith, J.D. Surface to sewer flow exchange through circular inlets during urban flood conditions. J. Hydroinform. 2018, 20, 564–576. [Google Scholar] [CrossRef]
- Santoso, B.P.; Yanto, M.; Apriyono, A. Inverse distance weighting interpolated soil properties and their related landslide occurrences. MATEC Web Conf. 2018, 195, 03013. [Google Scholar] [CrossRef]
- Tügel, F.; Hassan, A.; Hou, J.; Hinkelmann, R. Applicability of Literature Values for Green–Ampt Parameters to Account for Infiltration in Hydrodynamic Rainfall–Runoff Simulations in Ungauged Basins. Environ. Model. Assess. 2022, 27, 205–231. [Google Scholar] [CrossRef]
- Yang, D.; Hou, J.M.; Li, B.R.; Li, D.L.; Li, Y.Q.; Fu, D.Y.; Ji, G.Q. Generalized simulation of drainage process in urban networks without data. J. Water Res. Water Eng. 2020, 31, 139–144. [Google Scholar]
- Xia, J.Q.; Cheng, Q.; Dong, B.L.; Zhang, X.L. Experimental study on the effect of clogging on the inlet discharge capacity. Adv. Water Sci. 2020, 31, 843–851. [Google Scholar]
- Chen, J.; Li, Y.; Zhang, C. The Effect of Design Rainfall Patterns on Urban Flooding Based on the Chicago Method. Int. J. Environ. Res. Public Health 2023, 20, 4245. [Google Scholar] [CrossRef] [PubMed]


Disclaimer/Publisher’s Note: The statements, opinions and data contained in all publications are solely those of the individual author(s) and contributor(s) and not of MDPI and/or the editor(s). MDPI and/or the editor(s) disclaim responsibility for any injury to people or property resulting from any ideas, methods, instructions or products referred to in the content. |
© 2024 by the authors. Licensee MDPI, Basel, Switzerland. This article is an open access article distributed under the terms and conditions of the Creative Commons Attribution (CC BY) license (https://creativecommons.org/licenses/by/4.0/).