Article

Effects of Freeze–Thaw Cycles and the Prefreezing Water Content on the Soil Pore Size Distribution

1
School of Water Conservancy & Civil Engineering, Northeast Agricultural University, Harbin 150030, China
2
Heilongjiang Provincial Key Laboratory of Water Resources and Water Conservancy Engineering, Northeast Agricultural University, Harbin 150030, China
*
Author to whom correspondence should be addressed.
Water 2024, 16(14), 2040; https://doi.org/10.3390/w16142040
Submission received: 26 May 2024 / Revised: 12 July 2024 / Accepted: 17 July 2024 / Published: 18 July 2024

Abstract

:
Volumetric changes induced by soil moisture phase changes can lead to pore system redistribution in freezing and thawing soil, which in turn affects soil strength and stability. The prefreezing water content and the number of freeze–thaw cycles (FTCs) affecting key factors of soil pore changes, and they determine the volumetric change magnitude and frequency during ice–water phase transitions. This study aims to reveal the effect of the prefreezing water content and the number of freeze–thaw cycles on the pore size distribution (PSD) of black soil, meadow soil and chernozem, which account for the largest arable land area in Heilongjiang Province, China. In situ soil samples with different prefreezing water contents were subjected to 1, 2, 3, 5, 10, and 20 FTCs, and then nuclear magnetic resonance (NMR) was used to quantify the PSD. It was shown that the pore sizes of the three soil types spanned multiple orders of magnitude, ranging from 0.001 to 100 μm overall. The inflection point of the cumulative porosity curves of all three soils occurred near 0.1 μm. For black soil and chernozem with high prefreezing water contents, when the number of FTCs reached 10 or 20, the soil self-weight led to thaw settlement, which reduced the difference in the total porosity of the soils with varying moisture contents. The initial FTC exerts the most significant influence on the pore structure. The impact of the prefreezing water content on soil pore structure diminishes as the number of FTCs increases. The plant root residues rendered meadow soil less sensitive to water content differences after the first FTCs but also limited the development of macropores during the late freeze–thaw period. The prefreezing water content alters the distribution of soil moisture before freezing and has a greater influence on the pore distribution of frozen-thawed soils compared to the cumulative effect of multiple FTCs.

1. Introduction

In the Northern Hemisphere, over half of the land area experiences seasonal freezing and thawing on an annual average basis [1], which significantly impacts hydrological cycle processes such as evaporation and infiltration in these regions. With global warming, continued population growth, and increased industrial activity, the connections within the soil moisture cycle and its profound impact on the environment have received increased attention. Under the influence of atmospheric temperature changes, seasonal freeze–thaw cycles (FTCs) inevitably occur in near-surface soils. This leads to physical, chemical, and biological alterations within the soil [2], triggering frost heave, melt settlement, and soil erosion [3,4,5], resulting in significant changes in soil structures and functions [6]. Essentially, most of the above can be attributable to changes in the soil structure, which can reflect the texture [7], control soil function [8], influence soil erosion [9], and provide space for plant roots [10]. The FTCs of soil encompass highly complex hydrological, thermal, and mechanical processes involving multiple soil phases, such as solids, liquids, and gases. Temperature changes can disrupt the soil phase equilibrium and produce more profound effects on the soil pore area and pore size [11].
Increasing the number of FTCs is usually a time-consuming process. Therefore, the number of FTCs in relevant studies is commonly small. A single FTC is probably the most common, with most studies involving the use of fewer than five FTCs [12,13,14]. Both the temperature and precipitation during the freeze–thaw period affect the frequency of soil FTCs. In seasonally frozen areas at high latitudes or high altitudes, soils usually undergo more than ten or even dozens of FTCs during the freeze–thaw period [15,16,17,18]. During periodic freezing and thawing, soils can develop cracks and joints that alter the pore distribution [19]. At the early stages of freezing and thawing, there exerts a limited effect on soil moisture due to the small depth of freeze–thaw. As agglomerates are compressed, the number of macropores in the surface layer increases, increasing permeability [3]. Subsequent freezing is more likely to develop in deeper parts because the latent heat of frozen soils is low, and after the first few FTCs, dramatic changes in the soil matrix influence the soil behavior in the following freeze–thaw processes [20].
The initial conditions such as the prefreezing moisture content contribute significantly to the generation of substance and energy gradients [21]. The presence of voids and sufficiently small pores between soil particles allows for a portion of water to remain unfrozen when the soil temperature drops below freezing [22]. At the same freezing temperature, the contents of ice and liquid moisture in frozen soil are primarily influenced by the prefreezing water content [23]. Ice crystals will lead to a decrease in soil stability, but under a low initial water content, the volume expansion due to freezing can be contained within the air-filled pore volume [24]. The permeability of the soil is usually determined by the number of pores that can accommodate water and air [25]. In open systems, the hydraulic conductivity is the main controlling factor during soil freezing, whereas in closed systems, the prefreezing water content governs the nature and extent of the freezing process [26]. Continuous global warming can increase the snowmelt speed, affecting the frequency of soil FTC and the initial water content. Agricultural technical measures such as fall plowing and winter irrigation can also significantly alter the soil moisture content [27,28,29].
The FTCs of soil in cold regions significantly impact agricultural and engineering activities such as freeze–thaw erosion and frost heave. Understanding the influences of varying prefreezing water contents and FTCs on soil pore structure is crucial for practical production such as autumn irrigation and spring plowing. Most relevant studies have been conducted using reformed soils [13,30], the preparation of which usually involves crushing, air-drying, and compaction steps, in which the relatively stable pore structure of in situ soils is destroyed, rendering them more vulnerable to freeze–thaw actions. There can be a fundamental difference between a newly prepared sample in the laboratory and one subjected to various natural processes, such as weathering, FTCs, and wet and dry cycles in the field [31]. Different sample preparation methods may also influence the impact of FTCs. Larger soil column tests are usually time-consuming and laborious, while a smaller number of FTCs does not capture the cumulative effect of FTCs [32]. Under climate change conditions, the reaction of soil subjected to multiple FTCs is very important. In summary, in this study, closed-system tests involving different numbers of FTCs were conducted under fixed freezing temperature and FTC conditions of soils with varying prefreezing water contents. Subsequently, the quantitative analysis of soil pore size distribution (PSD) was conducted using nuclear magnetic resonance (NMR) to examine the impacts of prefreezing water content and the number of FTCs.

2. Materials and Methods

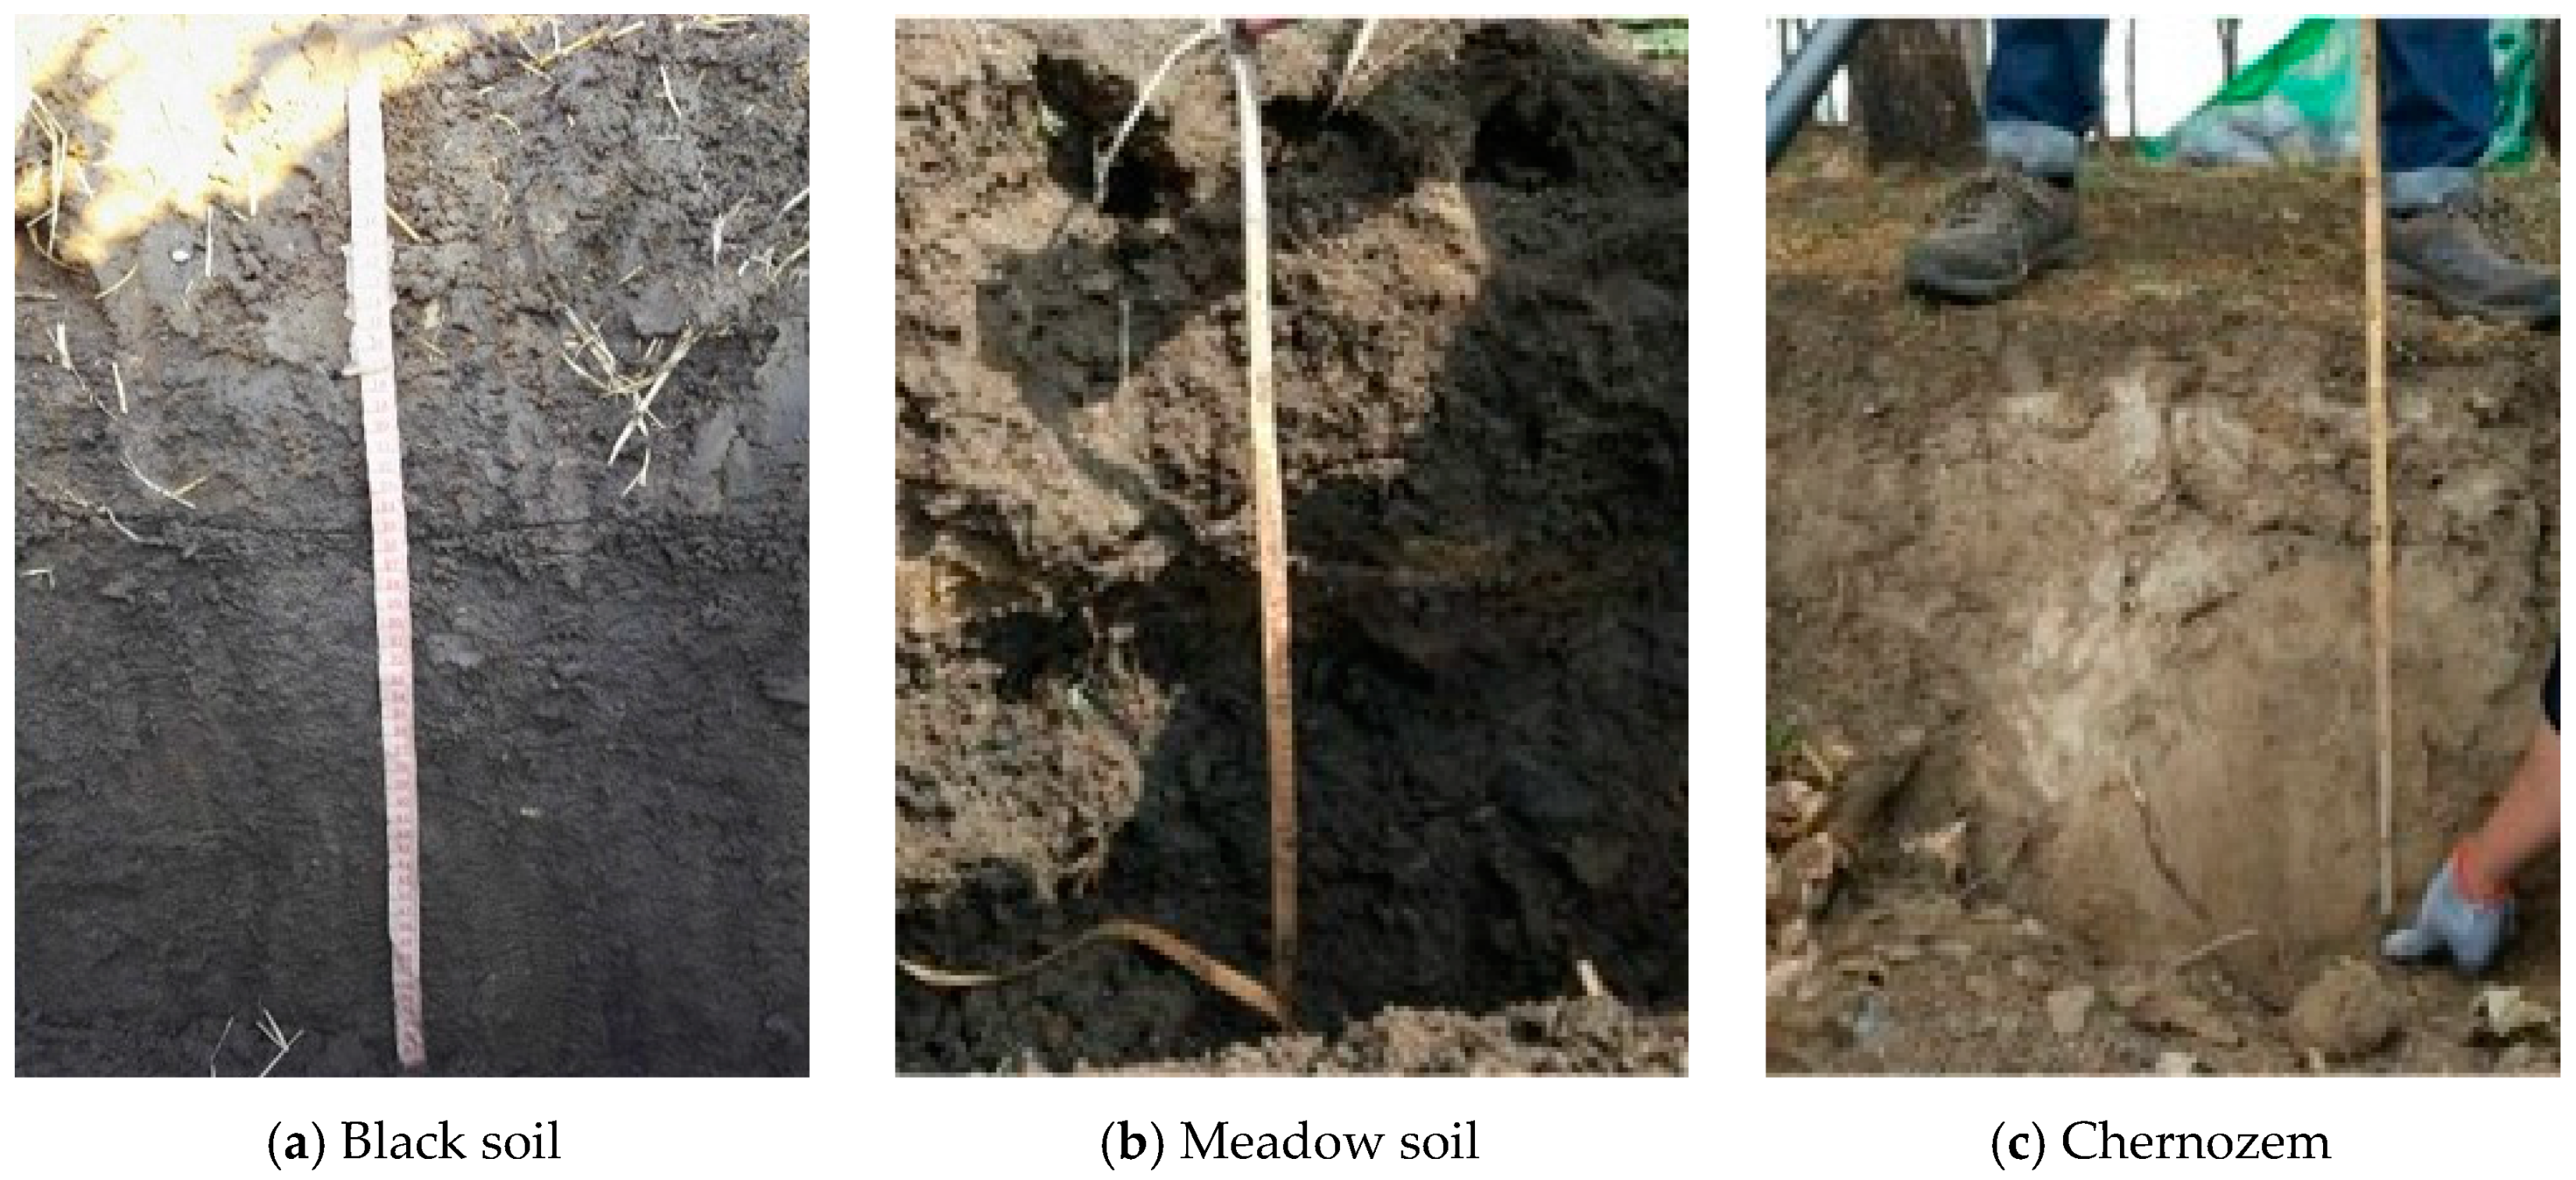
2.1. Soil Sampling Sites and Basic Soil Properties

Referring to the results of the Second National Soil Census of China, the three kinds of soils that occupy the largest arable land area in Heilongjiang Province are black soil, meadow soil, and chernozem [33]. The locations of the sampling sites and soil information are provided in Table 1. At each sampling site, more than 100 cutting ring samples and several loose soil samples were obtained for the FTC tests and basic soil properties measurements. The typical profiles and stratification of soils are shown in Figure 1.
The experimental black soil was collected in Xiangfang District, Harbin. The soil-forming parent material is loess-like sediment, with a loose and moist black soil layer that is approximately 20–40 cm thick. The natural vegetation is a weed community, with soybean planted during the reproductive period. Meadow soil was extracted from Xingan township, Zhaoyuan County. The parent material is river alluvium, the natural vegetation is weeds, and the local farmland is planted with rice. Chernozem was collected on gentle slopes in the undulating plain of Fengle township, Zhaozhou County. The soil-forming parent material is loess-like sediment. A lime reaction can be observed throughout the entire profile, and the surface layer is lighter in color than other layers, mostly grayish yellowish brown (generally 10–20 cm thick). Agricultural land is planted with wheat, corn, and soybeans.
The fundamental characteristics of the test soil, namely the dry bulk weight, organic matter content and soil texture, were assessed using the Wilcox method, potassium dichromate combustion method and laser diffraction method, respectively [34]. The results are presented in Table 2.

2.2. Test Scheme

The black soil sampling site was located at the Water Conservancy Comprehensive experiment station of Northeast Agricultural University. The temperature and water content of the in situ black soil at different depths over the last three years were measured using hydrothermal sensors (ET100, INSENTEK, Hangzhou, China). Variation curves are shown in Figure 2.
As shown in Figure 2, the soil temperature usually descended below 0 °C in late November, reaching the lowest temperatures in mid- to late January. Nevertheless, the presence of snow and crop straw prevent the minimum soil temperature from surpassing −10 °C at all depths except for the surface. Surface temperatures usually exceeded 0 °C in mid-March, while the soil temperatures slowly recovered, with the soil at a depth of 30 cm not completely thawing until April. The patterns of liquid water content exhibited similar changes to those observed in soil temperature. Following the freezing of the soil in late November, there was a rapid decrease in the presence of liquid water, reaching a minimum value of approximately 12% in January.
Referring to the above data, the minimum temperature of the FTCs was established at −10 °C, while the prefreezing moisture content in the soil was controlled at 30%, 20%, and 10%. With the use of vacuum equipment, the saturation in the soil body was increased to above 98%. The soil samples were subsequently allowed to stand for a period of 6 h and then subjected to low-temperature drying at 30 °C in an oven. Changes in the water content were controlled by the drying time in conjunction with weighing. Soil samples with varying prefreezing water contents were frozen along one direction from top to bottom using a thermostatic cold bath device in an artificial climate chamber. A total of 1, 3, 5, 10 and 20 FTCs were administered to the soil specimens with distinct prefreezing moisture contents. The duration of the freezing and thawing processes was set at 8 h each. Three replications were set up for each treatment.
Since metal ions can affect the NMR measurement results, a polytetrafluoroethylene (PTFE) tube was employed to extract soil samples. Subsequently, the samples were subjected to vacuum saturation and then enveloped in plastic wrap, allowing them to settle for 6 h. The samples were then placed in the imaging and analysis system of the NMR instrument (MesoMR12-060H-I type, Suzhou Newmark Analytical Instruments Co., Ltd., Suzhou, China) to measure the relaxation time. The main magnetic field strength was 0.29 T, accompanied by a magnet frequency of 12.32 MHz. The magnet homogeneity was 18.85 ppm, and the magnetic field stability was 115 Hz/h. The magnet temperature during measurements was maintained at 32 °C, the sampling frequency was 250 kHz, the cumulative number of sampling times was 16, the sampling time was 10,000 ms, and the number of returns was 3000.

2.3. Methods and Principles

Regarding fluids in porous materials such as soil and rock, three relaxation mechanisms usually exist: free relaxation, surface relaxation and diffusion relaxation. When these three phenomena coexist, the transverse relaxation rate of the fluid inside the pores can be given as [35]:
1 T 2 = 1 T 2 , f r e e + 1 T 2 , s u r f a c e + 1 T 2 , d i f f u s i o n
Here, T2,free represents the free relaxation time of the pore fluid, ms; T2,surface refers to the relaxation time of the pore fluid induced by surface relaxation, ms; and T2,diffusion refers to the diffusion relaxation time, ms.
Due to the effect of capillary forces and adsorption, the moisture inside porous media such as soil and rock is limited to the pore space. Then, the first term on the right side of Equation (1) can be neglected. The diffuse relaxation term in Equation (1) may be disregarded under conditions of homogeneity in the magnetic field, low gradient values, and a small echo time. Based on the assumption that the soil pores are tubular, the aforementioned equation can be simplified as [36]:
1 T 2 = ρ 2 F r
where F is the shape parameter, which can be set to 2 for tubular pores [37], and r is the pore radius, μm. ρ2 is the surface relaxation strength, a parameter to characterize the properties of porous media, μm/s. As the medium in this study is soil, the value of ρ2 was taken as 10 μm/s [38]. The above equation can be used to transform the T2 curve into a PSD curve. Consequently, we can yield information on the internal structure of soil pores. Notably, the soil must be completely saturated before the NMR measurements to comprehensively represent the distribution state of pores of different sizes.
For porous media, different pore sizes result in various T2 relaxation times. The transverse relaxation measured by the CPMG sequence is not the attenuation of a single T2 value but the overall distribution of T2 values under multiple pore sizes [39,40]. So, the total relaxation M(t) can be expressed as:
M ( t ) = i A i exp ( t T 2 i )
where Ai and T2i represent the proportion and relaxation time of component i, respectively. With the use of appropriate mathematical inversion techniques, T2 distribution curves of the fluids in pores of different sizes can be obtained using Equation (3).

3. Results

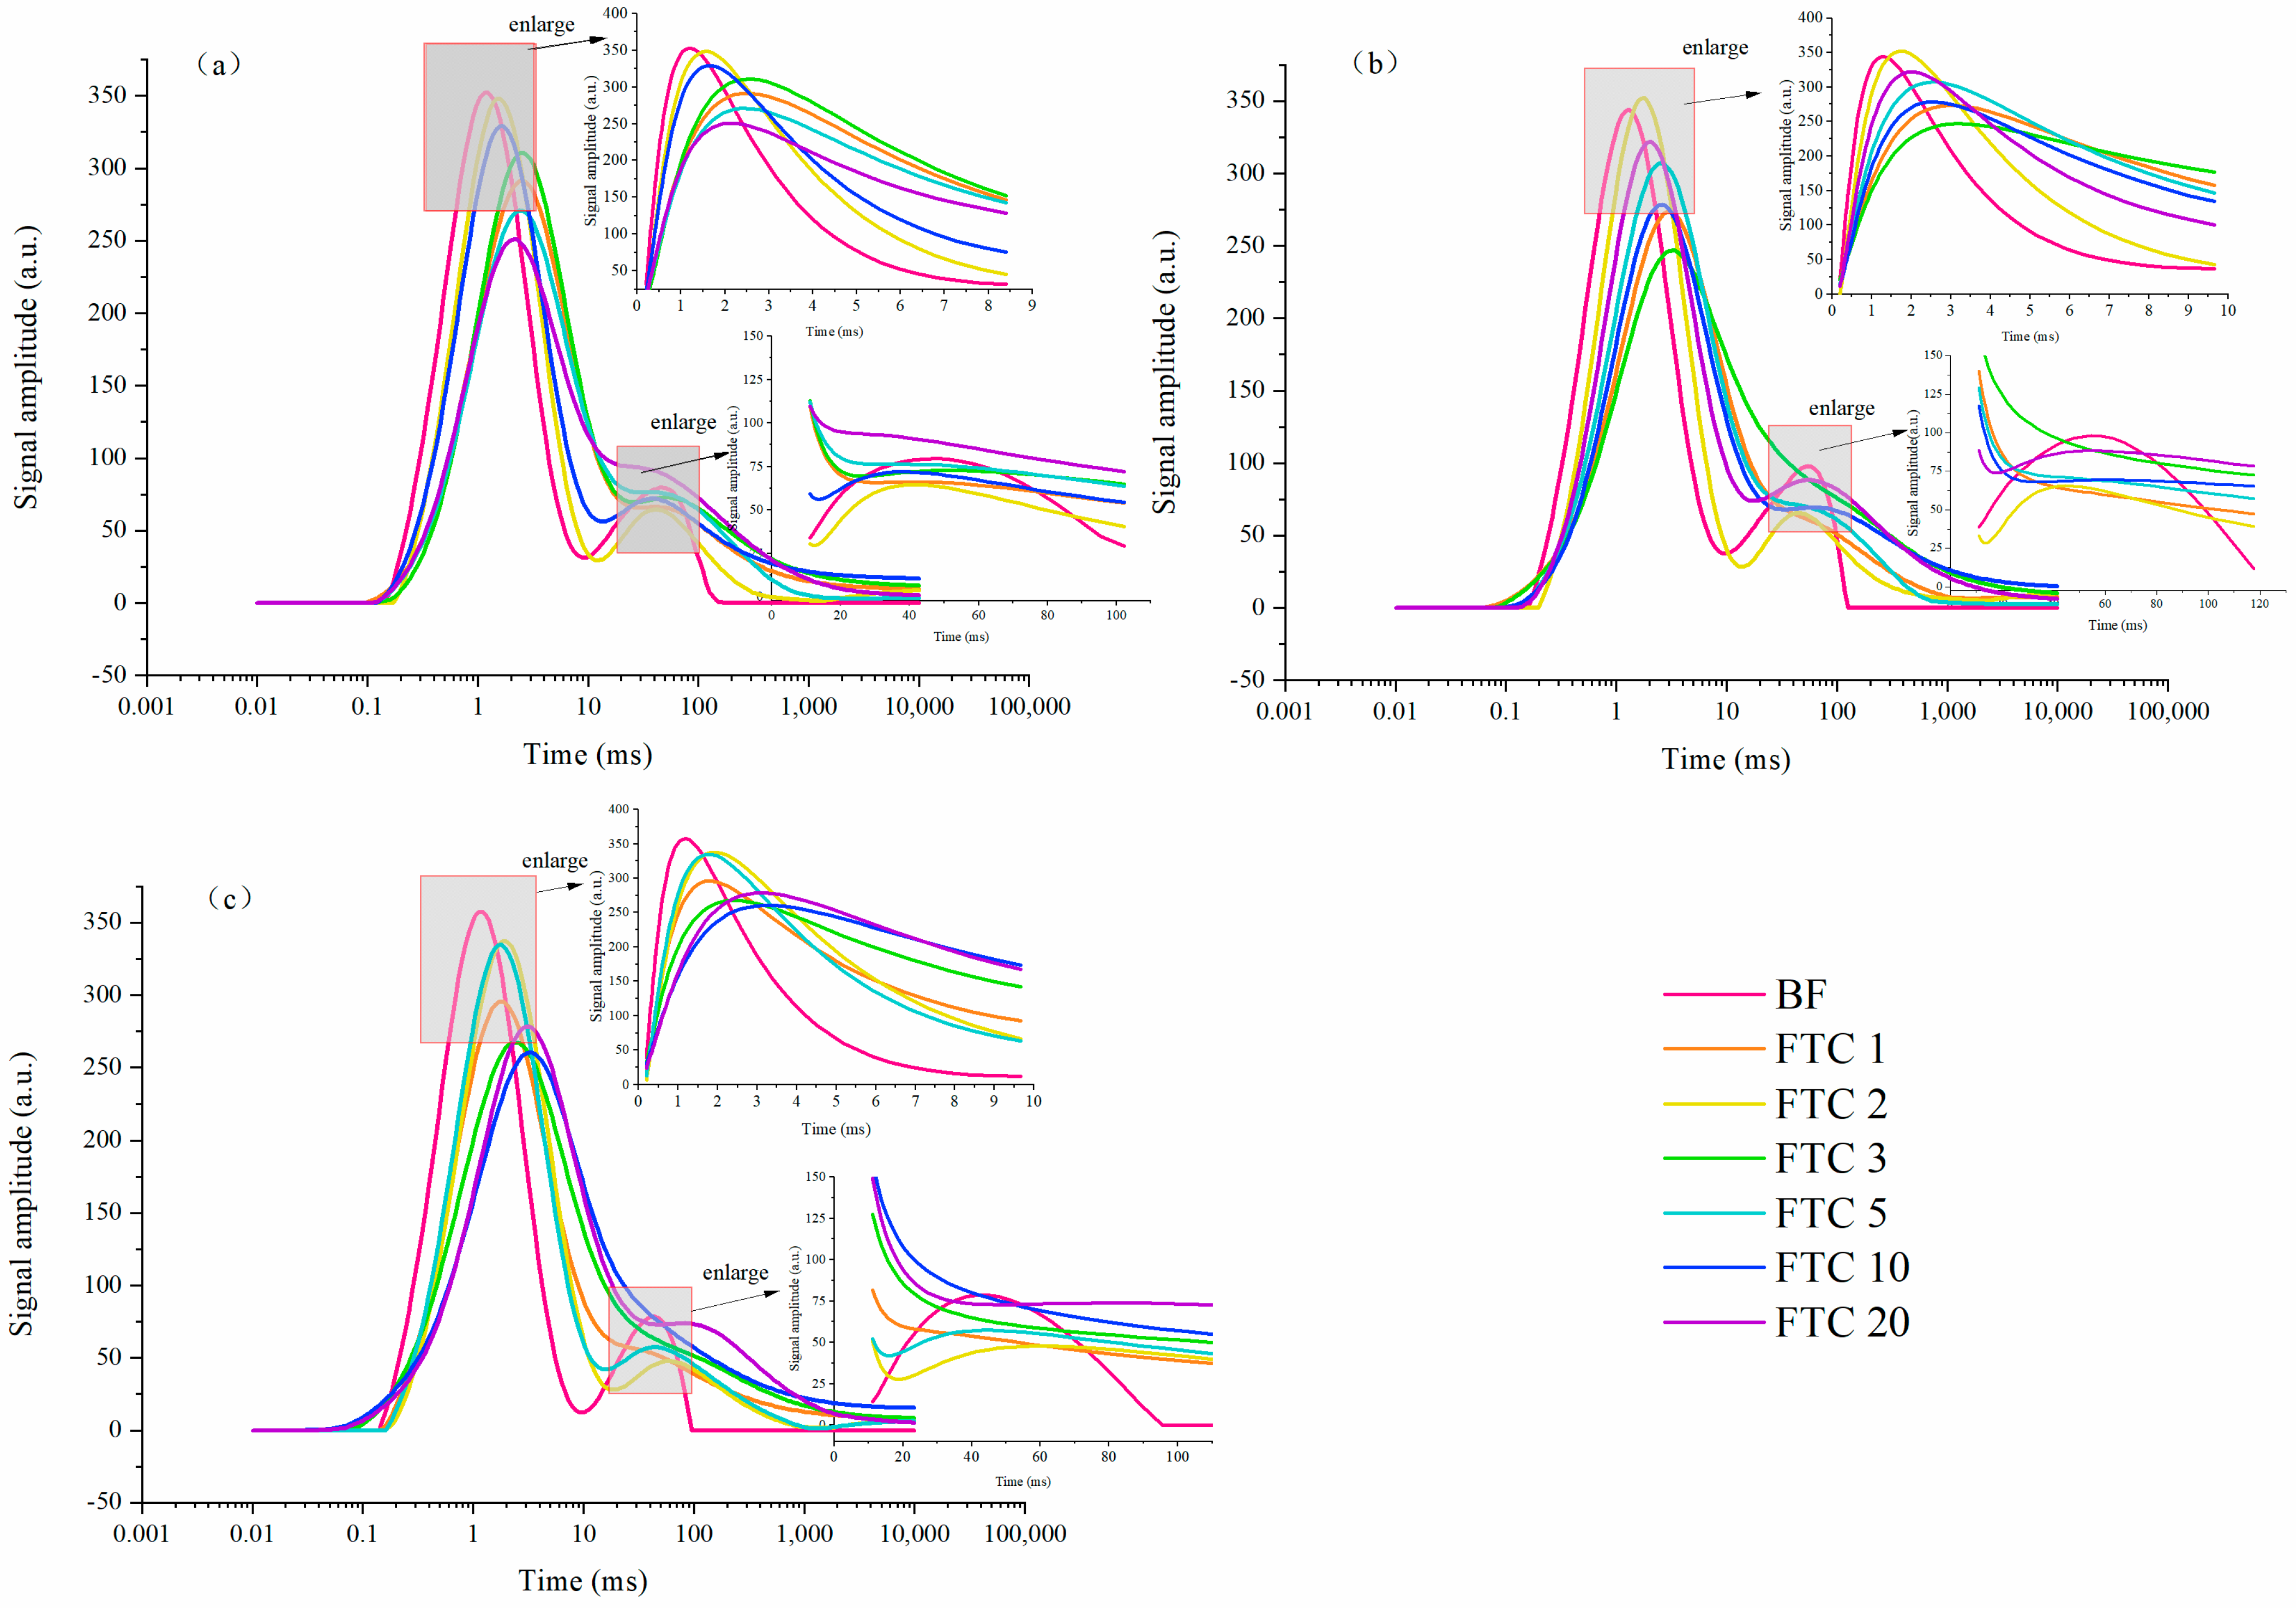
3.1. T2 Curves for Three Kinds of Soils

According to the Fourier transform principle, the T2 distribution curves of black soil, meadow soil and chernozem under different numbers of FTC numbers were obtained by inversion in self-contained software (v4.0), as shown in Figure 3, Figure 4 and Figure 5.
As shown in the figure, for the samples with a 10% initial water content, before freezing, the relaxation time of black soil mainly ranged from approximately 0.03 to 30 ms, that of meadow soil ranged from approximately 0.1 to 200 ms, and that of chernozem ranged from approximately 0.1 to 500 ms. On the basis of the morphology of the spectrograms, the height and area of the second peaks were relatively small, indicating that most soil pores exhibited a relatively small size, and the number of large and medium pores was much smaller than that of small pores. The first peak of the black soil samples corresponds to a relaxation time ranging from approximately 0.1 to 3 ms, and the peak apex corresponds to approximately 1 ms. The first peaks of the meadow soil and chernozem samples ranged from approximately 0.2 to 10 ms, and the peak apexes corresponded to 1 and 2 ms, respectively. This indicates that the distribution range of the pores in the black soil samples was smaller, and the sizes of the small and large pores were more concentrated. The apex signal intensity showed that the meadow soil samples contained the most small pores, while the black soil samples contained the smallest number of macropores.
Subsequent to the initial FTC, the bimodal peaks observed in the T2 curves of the black soil and meadow soil samples decreased to different degrees, with the smaller pores decreasing more significantly than the macropores. Moreover, all the curves shifted to the right to varying degrees overall. The relaxation time of the fluid in the soil pores decreased, and the relaxation speed increased overall, which suggests that the soil pore radius increased. The alteration in the vertical coordinate signified a decrease in the quantities of both small and large pores, which were initially abundant prior to freezing. However, the pore size and porosity increased overall due to the transformation of the pore water phase. In addition, the signal intensity of the part between the two peaks increased after freezing and thawing, suggesting that this process yielded a more uniform soil pore distribution. The quantity of soil pores declined as the number of FTCs increased. However, the smaller pores became interconnected, leading to the formation of larger pores. Consequently, both the pore size and total porosity increased. This suggests that the cyclic transition of water from solid to liquid prompted the displacement and reorganization of soil particles, ultimately resulting in the redistribution of the pore structure.

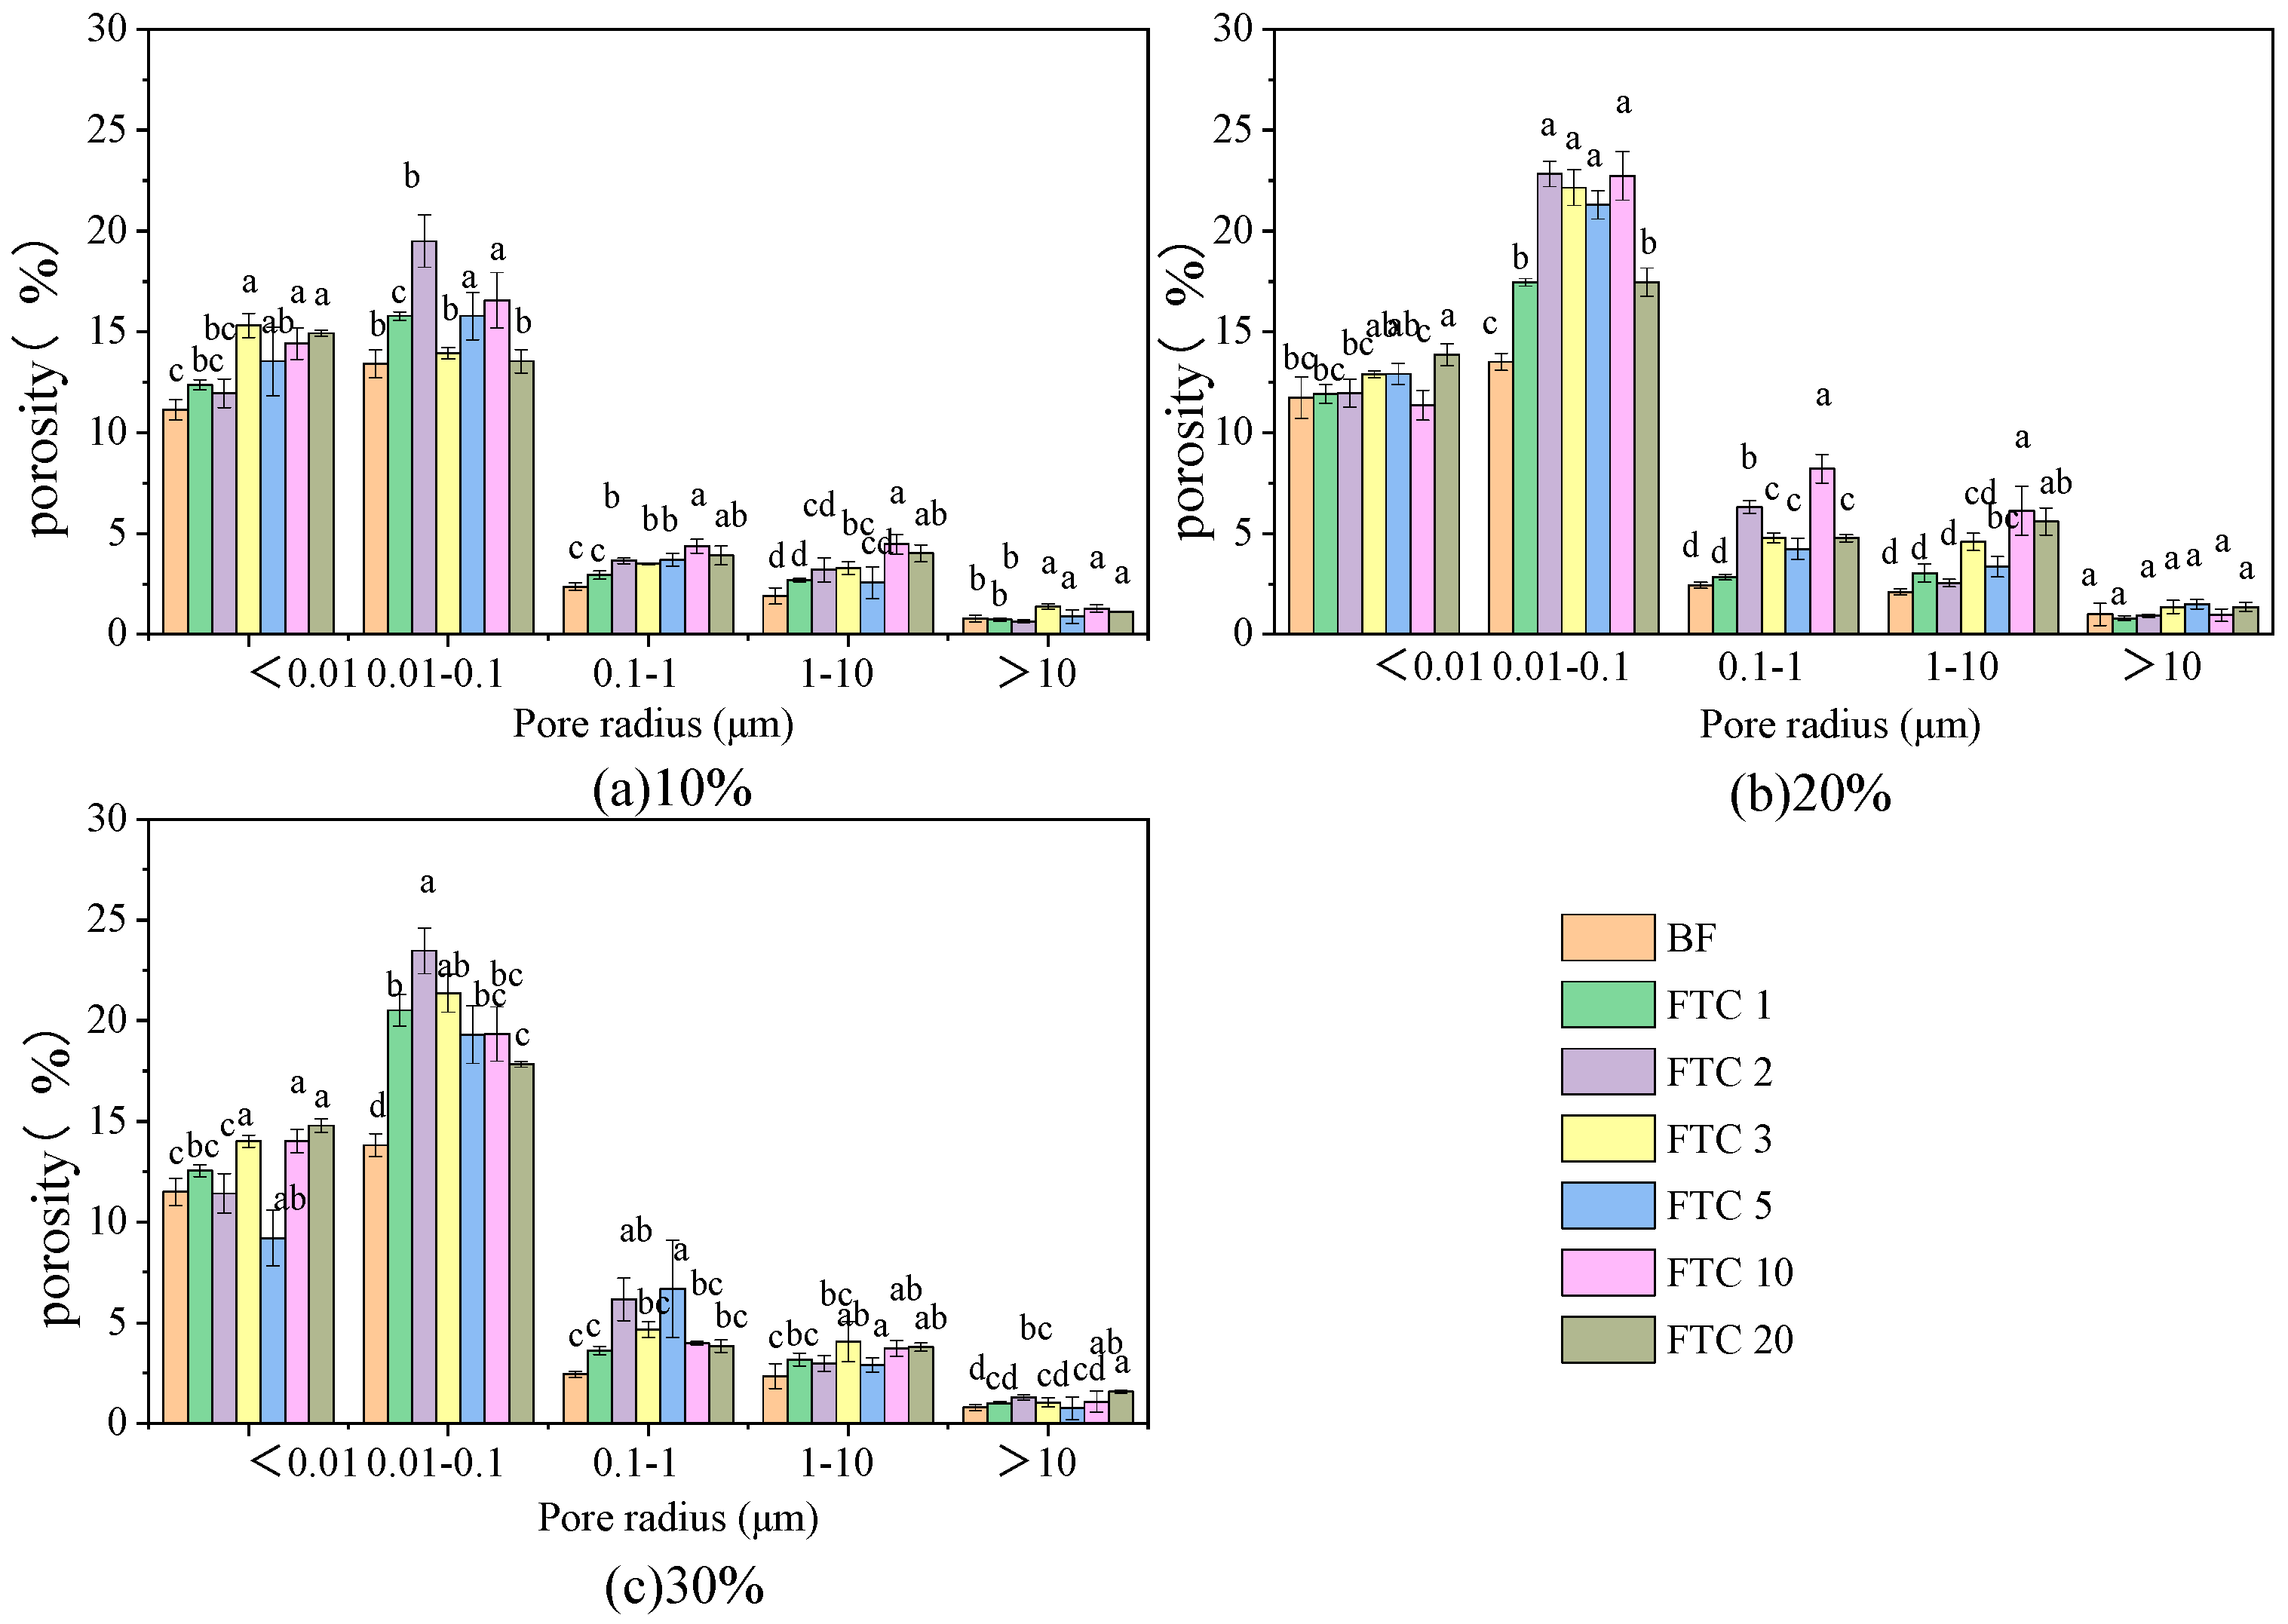
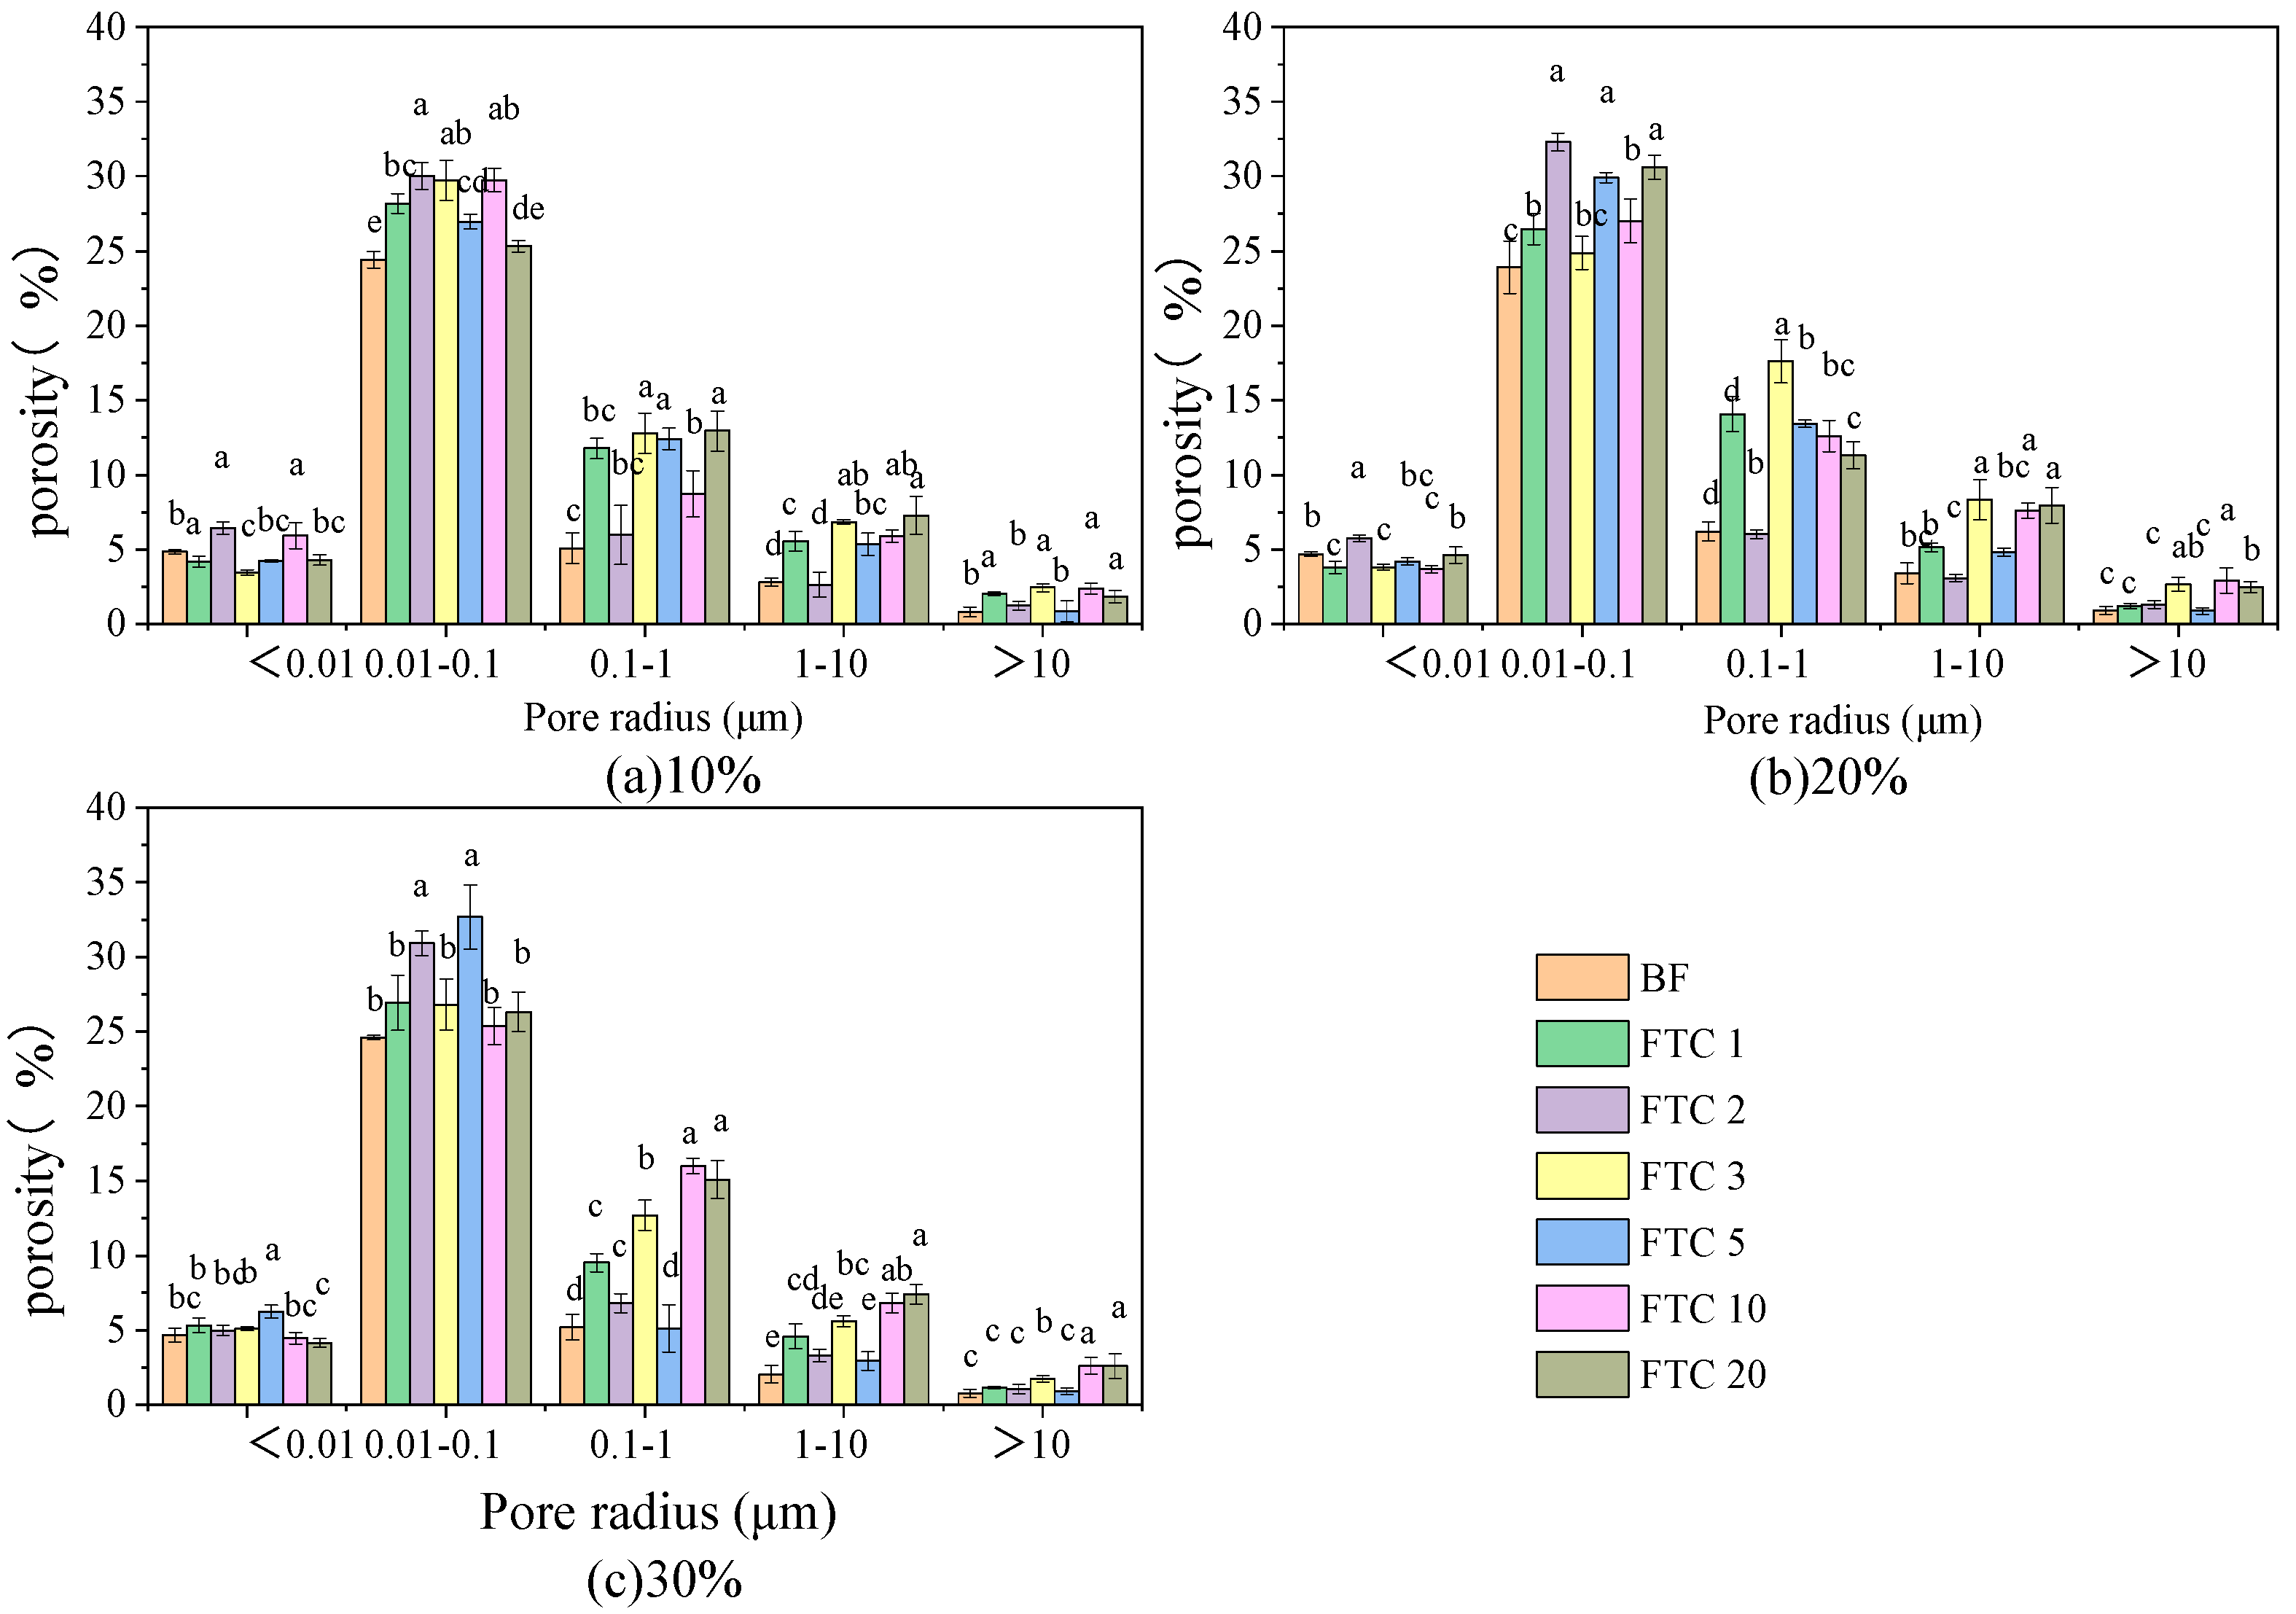
3.2. Soil PSD and Porosity Changes under Different Numbers of FTCs

The soil pore was categorized into five ranges based on pore size: <0.01 μm, 0.01–0.1 μm, 0.1–1 μm, 1–10 μm, and >10 μm. The PSD of black soil, meadow soil, and chernozem under varying numbers of FTCs is depicted in Figure 6, Figure 7 and Figure 8.
As shown, at an initial water content of 10%, before freezing, black soil exhibited the highest percentage of <0.01 μm pores, at 11.15%; meadow soil exhibited the highest percentage of 0.01–0.1 μm pores, at 23.42%; and chernozem exhibited the highest percentage of 0.1–1 μm pores, at 8.80%. For macropores with a pore size >10 μm, meadow soil exhibited the lowest percentage, at 0.82%. In all three soils, the 0.01–0.1 μm pores constituted the largest pore size fraction. After the first FTC, the <0.01 μm pores in black soil, meadow soil and chernozem increased to different degrees. In regard to the 0.01–0.1 μm pores, the fraction in black soil decreased by 2.63%, while that in meadow soil and chernozem decreased by 3.77% and 3.35%, respectively. Regarding the 0.1–1 μm pores and the 1–10 μm pores, the fraction in black soil and meadow soil increased, while that in chernozem decreased. In regard to the >10 μm pores, the fraction in black soil remained almost unchanged, while that in meadow soil and chernozem increased appropriately. After 20 FTCs, the <0.01 μm and 1–10 μm pores in black soil and chernozem increased the most, while the 0.1–1 μm and 1–10 μm pores in meadow soil increased the most.
Among all three soils, the fraction of >10 μm pores was the smallest, but chernozem exhibited the largest corresponding pore size fraction. The 0.01–0.1 μm pores were the most abundant, and meadow soil exhibited the largest corresponding pore size fraction. Compared to that of black soil and chernozem, meadow soil exhibited a more uniform PSD, with the 0.01–10 μm pore size range accounting for more than 90% of the total porosity. The change in the small pore size fraction of the meadow soil was significantly smaller than that of the black soil and chernozem due to the influence of the residual plant root system. As the number of FTCs increased, without any water replenishment and under the impact of moisture evaporation, the settlement quantity in the gradually thawing soil increased. Consequently, the settlement amount surpassed the frost heave caused by water freezing, leading to a reduction in soil porosity after 10 or 20 FTCs.
The curves of the cumulative porosity and pore volume percentage with pore size of the soils for different numbers of FTCs are shown in Figure 9.
As shown in the cumulative soil porosity curves, the pore radius of the three soils generally varied between 0.001 and 100 μm. The porosity of the black soil before freezing was approximately 30%, and that of the meadow soil and chernozem approached 40%. As the number of FTCs increased, a gradual upward shift of the cumulative curve occurred. Moreover, the magnitude of this upward shift amplified with larger pore sizes. The cumulative porosity curve exhibited a discernible division into two distinct segments in terms of its shape. The initial segment encompassed pore sizes ranging from 0.001 to 0.1 μm, displaying a steep and linear curve with a notably high slope. The second segment corresponded to pore sizes of 0.1–100 μm, and the curve slowly increased with a low slope. With an increasing number of FTCs, the inflection point between the two curve segments gradually shifted to the right. The soil porosity generally increased by 10% to 20% after multiple FTCs. The second curve segment contributed more notably to the increase in porosity, and pores larger than 0.1 μm in size changed more significantly with an increasing number of FTCs. The pore volume percentage curve could also be divided into two segments. Before freezing, approximately 80% to 90% of the soil pores of the three soils exhibited pore radii <0.1 μm. Following the FTCs, the pore volume percentage decreased, particularly in proximity to the inflection point of the curve. Consequently, the initial segment of the curve exhibited a more pronounced and linear decline, while the second segment displayed a flatter trend. These observations suggest that the FTCs of soil led to a decrease in the proportion of pores smaller than 0.1 μm and an increase in the proportion of pores larger than 0.1 μm. However, it is important to note that the rise in the percentage of larger pores primarily stemmed from an increase in their quantity rather than a decrease in smaller pores.

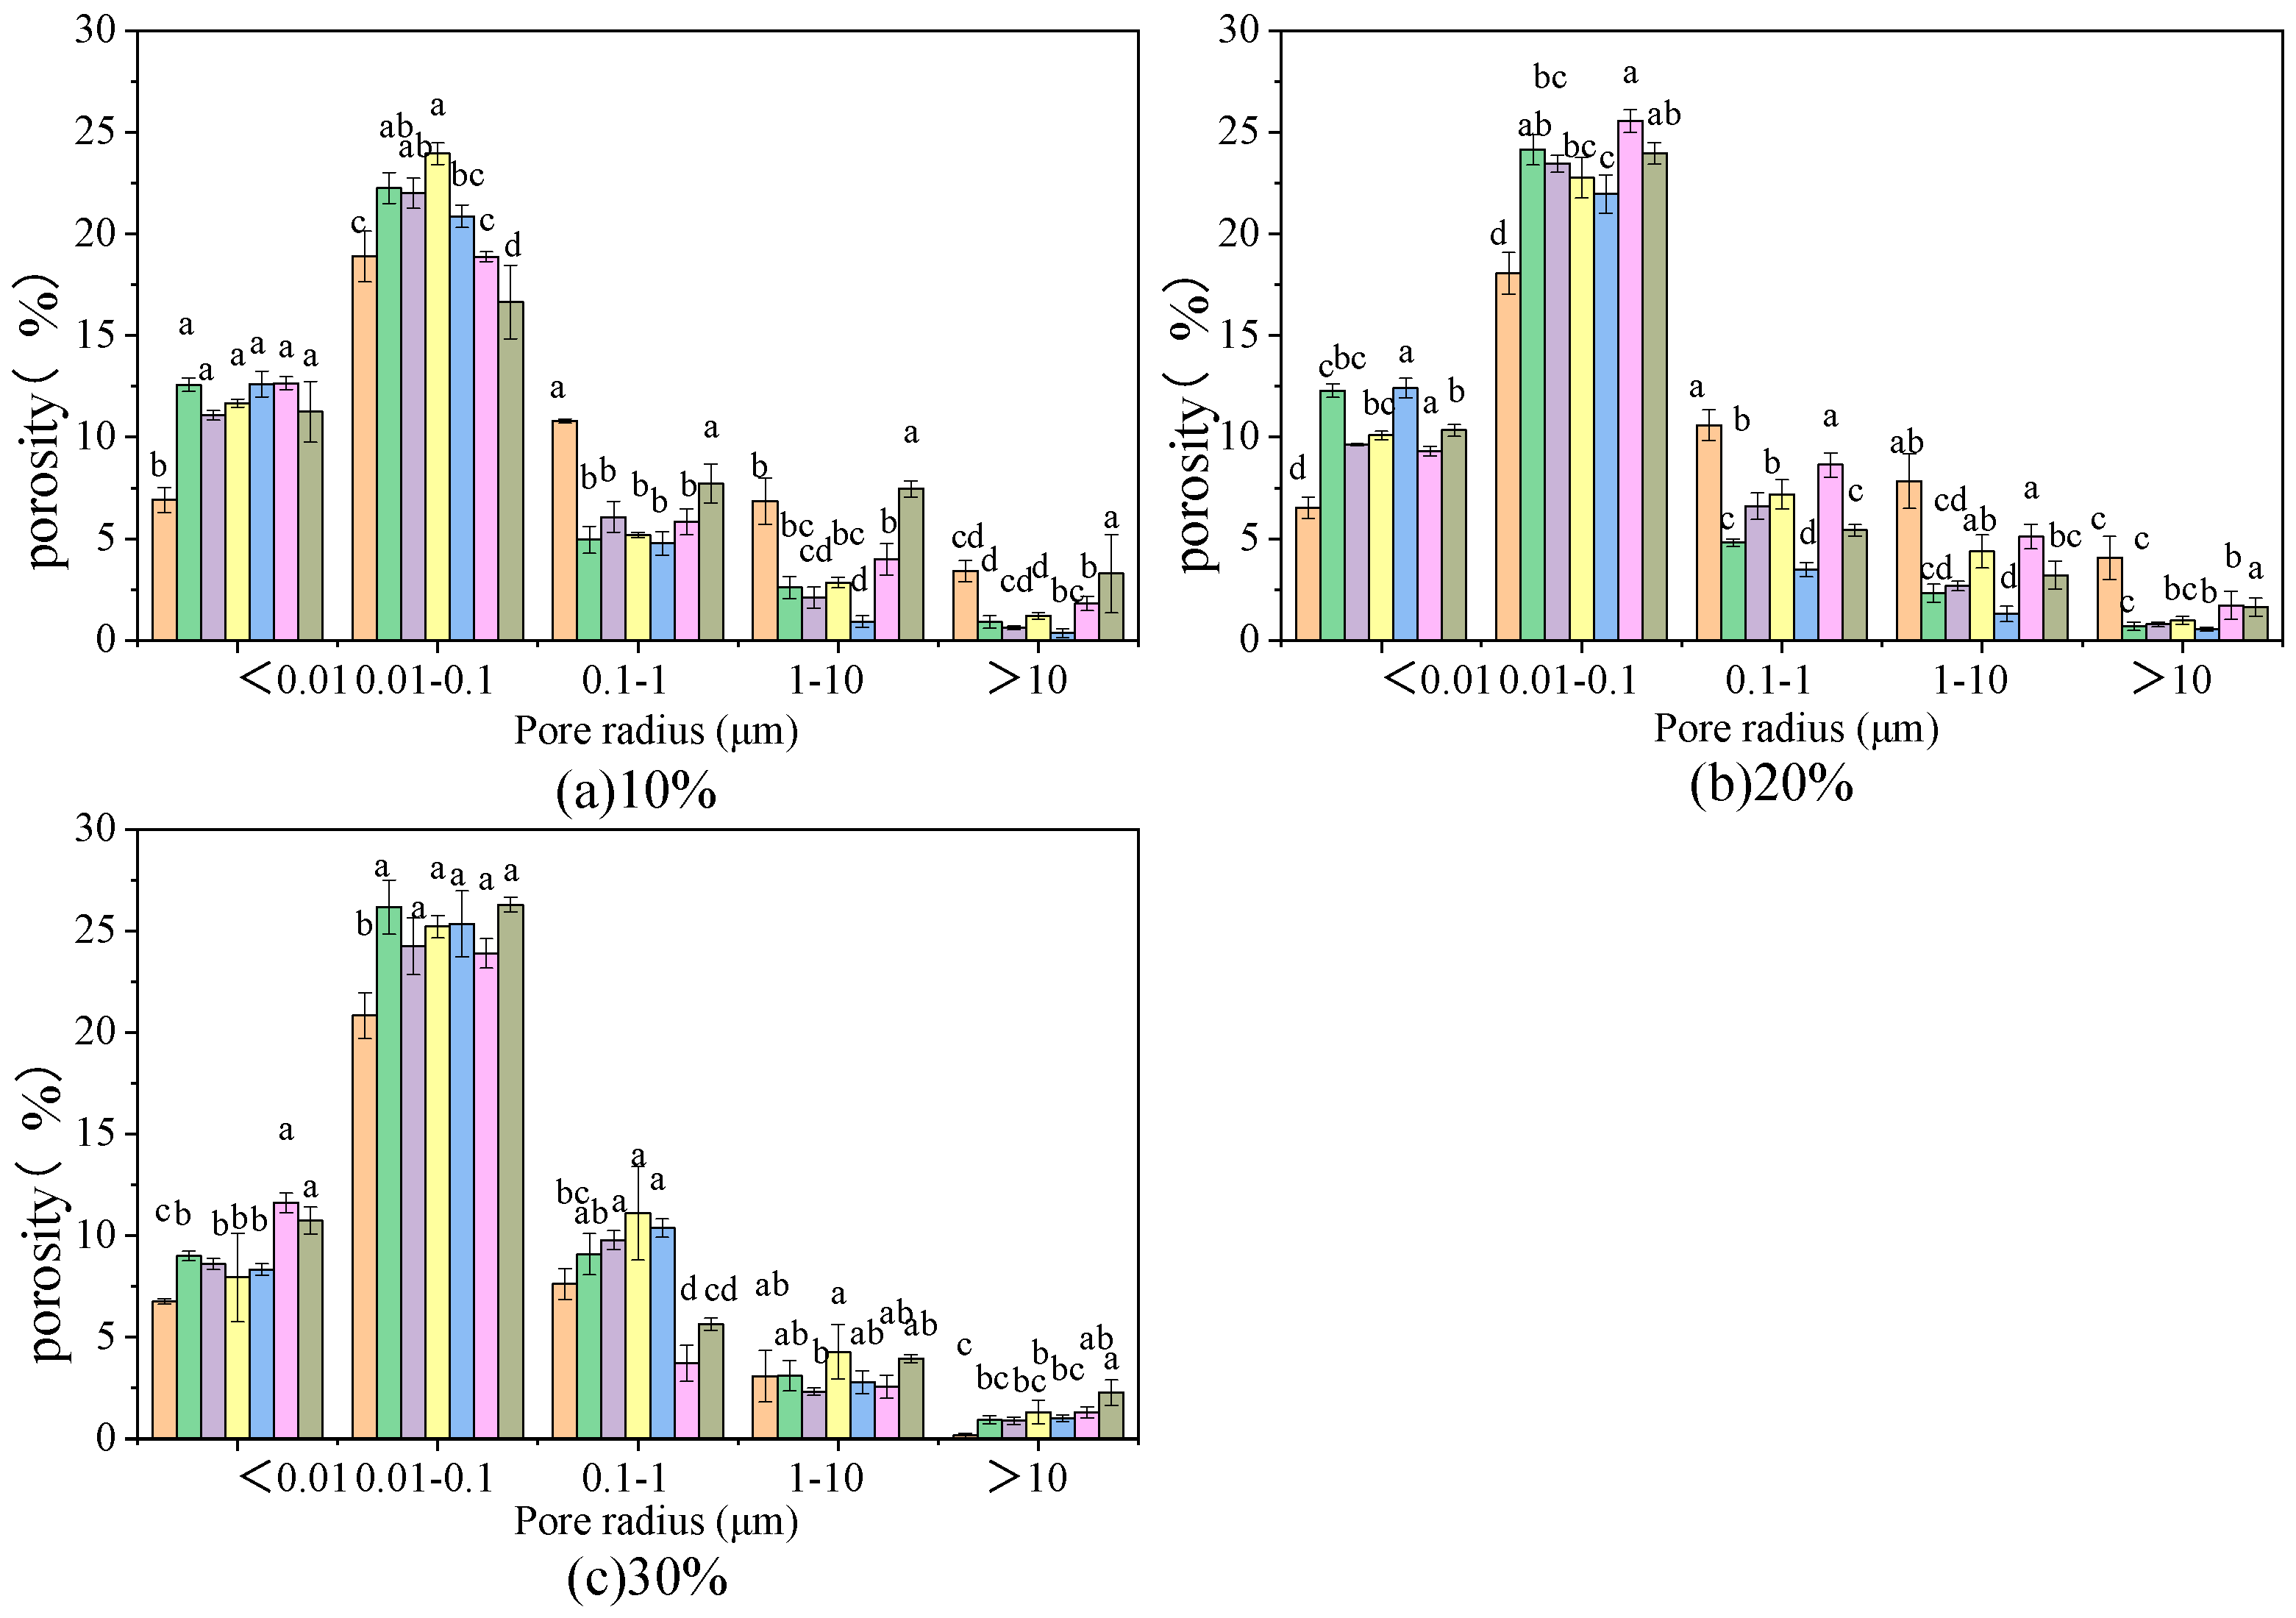
3.3. Soil PSD and Porosity Change for Different Prefreezing Water Contents

After the samples with various prefreezing moisture contents experienced different numbers of FTCs, the distribution of pores ranges was determined, as shown in Figure 10.
As shown in Figure 9, after the first FTC, the total soil porosity increased by 4.98%, 5.29%, and 9.75%. The observed increase mainly occurred in the three pore size ranges of 0.01–10 μm, of which the largest change was observed for the 0.01–0.1 μm pores. This pore size fraction increased by 2.34%, 3.94%, and 6.70%, respectively, accounting for 46.99%, 74.48%, and 68.72%, respectively, of the total porosity change. The black soils with higher initial moisture content showed a decrease in the total porosity after 20 and 5 cycles, respectively. The magnitude of the change in the pore space gradually increased, the relatively stable structure was destroyed, particles were rearranged, and the soil volume was altered, finally resulting in melt-induced settlement. At a higher prefreezing water content, the structure was more easily damaged, and melt-induced settlement was more likely to occur. The total porosity of the soil with a 10% initial water content stopped changing after five FTCs, but the proportion of the different pore sizes still fluctuated to a certain extent.
The effect of the prefreezing moisture content on the PSD of meadow soil was relatively simple. After the first FTC, the total porosity increased by 6.37%, 7.21%, and 9.79%. The total porosity continued to increase after the subsequent FTCs, in which the pore size fraction of 0.01–0.1 μm no longer significantly increased or decreased. After 20 cycles, the total porosity increased by approximately 14–20%. The <0.01 μm pore size fraction varied very slightly among the different water contents and changed only slightly with an increasing number of FTCs. Regarding the other pores, the effect of the first two cycles was smaller, but after the third cycle, the magnitude of the change in the porosity of the soil sample with a prefreezing water content of 30% began to increase. The total porosity of the chernozem samples increased by 3.24%, 4.96%, and 6.96% after the first FTC. The samples with two higher water contents showed a certain degree of decrease after 10 and 5 FTCs, respectively. The total porosity increased by 6.76%, 11.21% and 10.06% after 20 FTCs. Regarding the soil sample with an initial moisture content of 10%, the change in the <0.01 μm pores after the first three cycles accounted for more than 90% of the total porosity increase. The increase in the total porosity mainly originated from the larger pores, such as the 0.1–1 μm, 1–10 μm and >10 μm pores.

4. Discussion

4.1. The Effect of the Surface Relaxation Strength on the NMR Measurements

To quantitatively estimate the PSD, the surface relaxation strength of the solid must be determined, which differs for each solid–fluid combination and is difficult to calculate or derive without using a particular measurement method [41]. The surface relaxation strength is 0.8 μm/s for quartz, 47 μm/s for medium sand, 3.6 μm/s for fine sand, and 1–16 μm/s for soil [42,43,44,45]. It has also been suggested that surface relaxation is similar for large- and medium-sized pores between different soil types. In most research on PSD estimation, the fast diffusion mechanism has been adopted, so the relaxation time is governed only by the solid surface relaxation strength and relaxation time [46].
Jaeger et al. [46] examined the direct proportionality between the NMR relaxation time and pore radius and proposed a dual relaxation model. In the model, two surface relaxation parameters are defined for micro- and mesopores, and the form of the distribution function is related to the soil texture [46]. Meyer et al. calibrated and validated a variety of soil materials and obtained a single calibration curve for estimating the surface relaxation strength of soil from seven soil samples, yielding surface relaxation strengths of 551.7 and 9.6 μm/s for macro- and mesopores, respectively [38]. In addition, the surface relaxation strength linearly increases with increasing Mn2+ and Fe3+ concentrations at the pore surface and is further affected by the particle type [47]. Although the value of the surface relaxation strength changes with soil chemical composition, for a given soil, the value is a constant, independent of the temperature and pressure [48]. In addition, the pore radius and surface relaxation strength exhibit a linear relationship, and even if different values are considered, only the absolute value of the pore radius is influenced. Moreover, the final result simply entails a shift in the horizontal coordinate of the T2 relaxation time curves, while the interrelationships between the pore distributions of the various soil types are unchanged. In this study, the vast majority of the soils after FTCs showed only one main peak in the T2 curve, indicating that the PSDs were relatively concentrated, and the use of a single surface relaxation strength was more appropriate. In addition to direct measurements, the surface relaxation strength can be computed using an empirical equation [49].

4.2. Effect of FTCs on the Soil Pore Structure

The alteration in the pore system emerges as a crucial outcome of the modifications in structural morphology and stability. The soil macroporosity increases under the influence of FTCs, especially in finer textured soils, which also leads to an increase in the soil permeability [50,51,52]. In many cases, this increase comes at the expense of the microporosity, as the soil pore ratio and ultimate water-holding properties decrease while the hydraulic conductivity increases [53]. The findings on the effect of FTCs are often mixed and susceptible to the experimental conditions. The frequency of FTCs at the soil surface could be limited in areas subjected to long periods of subfreezing temperatures, while there are also differences between the effects of sustained freezing over long periods and extensive FTCs [54,55].
The stability of the soil pore structure is usually inversely related to the number of FTCs [56,57,58]. It has been concluded that the structural stability increases after three FTCs, whereas the soil stability decreases after six FTCs [59,60]. Moreover, it has been noted that the greatest change effects have been observed for five to ten cycles [61]. Within the first ten freeze–thaw cycles, the present study obtained similar conclusions. The more consistent conclusion is that the benefits of freezing and thawing exponentially decrease with increasing number of cycles, with the highest variability in metrics such as the shear strength and maximum consolidation pressure occurring after the first FTC, beyond which no notable variations have been observed [62]. The trends in the soil PSD and porosity under FTC conditions remain relatively controversial. Research on the impact of FTCs on soil mechanical properties has indicated an elevation in porosity, consequently reducing soil strength [63]. Liu et al. [61] observed that the total soil porosity and the quantity of pores with a larger effective radius exhibited a substantial increase as the number of FTCs accumulated. For in situ soils, which are inherently stable, the ability to resist freeze–thaw damage is relatively high. Artificially configured (disturbed) soils do not contain a preexisting pore network to control the freezing process and typically require a larger number of FTCs to achieve overall equilibrium [64].

4.3. Effect of the Prefreezing Water Content on the Soil Pore Structure

Based on soil thermodynamics, it is considered that ice will first appear in macropores as soil begins to freeze [65]. When the prefreezing water content is very low, water is confined to the smallest internal pores of agglomerates, which may occur in the free state or adsorbed on the surface of clay grains. The prefreezing water content affects the amount of frost heave and melt-induced settlement of soil and determines its height change after FTCs. With increasing initial water content, more free water begins to freeze in the larger pores when the temperature drops. Below a certain initial water content, the air-filled pore space is large enough to accommodate volume expansion as water changes from liquid water to ice. This is a major reason for the slight change in the soil porosity at low water contents. Freezing at low water contents may actually enhance the structural stability, and when the water content reaches as low as approximately 65% saturation, the freezing process functions as a compressor of the soil around pore ice, which can cause an increase in the structural stability after drying [66].
As ice develops in soil, when macropores are depleted of free water that can easily freeze, the pore pressure becomes negative, and they gradually start to absorb water from smaller pores. This causes soil particle rearrangement and consolidation [67]. In this study, low-temperature consolidation was not found in low-water-content soils, mainly because of the relatively low initial porosity, rendering the soils less susceptible to consolidation. Hamilton [68] suggested that there exists a limiting moisture content below which contraction resulting from freezing is balanced with soil volume expansion. Occasionally, the soil volume may hardly change after freezing even if the prefreezing water content is high. Dagesse [24] suggested that when the soil water content is controlled at 74% to 90% of saturation, there is no significant change in the soil volume after freezing. Frost heave occurs only when the water content is higher than 90%. At water contents below 70%, the volume of nonrigid clay soil may even decrease due to drying and shrinkage effects.
For the black soil and chernozem samples with a high prefreezing water content in this study, a certain degree of decrease in the total porosity was observed when the number of FTCs was large, which is mainly due to melt-induced settlement of the frozen soil. In soils characterized by elevated prefreezing water content, freezing results in the formation of a greater quantity of pore ice, thereby leading to the disruption of the initial soil pore structure and subsequent expansion in volume. The reduction in water during the FTCs leads to soil shrinkage, with a greater prefreezing water content resulting in a larger relative volume shrinkage. Additionally, repeated FTCs can increase soil pore space, decrease density, and weaken the soil. Finally, melt-induced settlement occurred under the action of the soil self-weight, which was macroscopically manifested as a decrease in height. In studies dedicated to soil frost heave and melt settlement, via quantitative analysis of data retrieved from displacement sensors in the freeze–thaw cycling system, it has also been demonstrated that a higher water content and more FTCs can cause an increase in the thaw coefficient [69,70].

5. Conclusions

In this study, the alteration pattern of the PSD in different types of in situ soils subjected to freeze–thaw cycling was revealed, and the impacts of the number of FTCs and prefreezing water content on the pore characteristics were investigated. The specific conclusions are as follows:
(1) Differences in the prefreezing water content did not affect the pore distribution in unfrozen soils. The pore sizes of the black, meadow, and chernozem samples spanned multiple orders of magnitude and generally ranged from 0.001 to 100 μm. Considering that the inflection point of the cumulative porosity curves of all three soils occurred near 0.1 μm, this value is recommended as a critical threshold for the equivalent pore size in loamy soils. The impact of the prefreezing water content on soil pore structure diminishes as the number of FTCs increases. The plant root residues rendered meadow soil less sensitive to water content differences after the first FTCs but also limited the development of macropores during the late freeze–thaw period. In the case of black soil and chernozem with high initial moisture content, the disparity in total porosity between soil samples with varying prefreezing moisture contents decreases after undergoing freezing and thawing, while the distinction in pore sizes remains substantial.
(2) The initial FTC exerts the most significant influence on the pore structure. After the first FTC, the proportion of small pores decreased more significantly than that of large pores, but the total soil porosity increased. With an increasing number of FTCs, the variation range of both the small and large pores gradually increased. The total porosity of most samples was the highest after 10 FTCs. Affected by the number of cycles and water content, some soil samples exhibited a decrease in the porosity after 20 cycles.
(3) The prefreezing water content can alter the distribution of soil moisture before freezing, thereby exerting a greater influence on the pore distribution of frozen–thawed soils compared to the cumulative effect of multiple FTCs. In comparison to other factors impacting soil PSD, the initial water content significantly contributes to the impact of FTCs.
(4) It is important to note that while NMR instruments can quickly provide precise T2 curves, accurate surface relaxation strength of soils are essential to obtain the most exact PSD. It is crucial to measure the surface relaxation strength of soils individually, especially for different types and textures, rather than to mix the value or over-rely on models. The results of this study will be useful in controlling the soil moisture status of farmland before freezing, and it is also worth further research in soil freeze–thaw erosion and foundation soil management in cold regions.

Author Contributions

Conceptualization, R.J. and X.B.; methodology, investigation, data curation, writing—original draft preparation, R.J.; formal analysis, X.W.; writing—review and editing, R.H. and X.W.; software, X.L.; visualization, H.Y.; supervision, project administration, X.B.; funding acquisition, X.B. All authors have read and agreed to the published version of the manuscript.

Funding

This research was funded by the Natural Science Foundation of Heilongjiang Province of China (Science and Technology Department of Heilongjiang Province, LH2022E012), the National Science Foundation for Distinguished Young Scholars (National Natural Science Foundation of China, 51825901), the Heilongjiang Province “Outstanding Young Teachers” Basic Research Support Program (Education Department of Heilongjiang Province, YQJH2023207).

Data Availability Statement

Data used in this study are available at Figshare and accessed on 11 October 2023. (https://doi.org/10.6084/m9.figshare.24287857.v1).

Acknowledgments

We are grateful to Qiang Fu for his financial support.

Conflicts of Interest

The authors declare no conflicts of interest.

References

  1. Zhang, T.; Barry, R.; Knowles, K.; Ling, F.; Armstrong, R. Distribution of seasonally and perennially frozen ground in the Northern Hemisphere. In Proceedings of the 8th International Conference on Permafrost, Zürich, Switzerland, 21–25 July 2003; pp. 1289–1294. [Google Scholar]
  2. Nie, S.; Jia, X.; Zou, Y.; Bian, J. Effects of Freeze–Thaw Cycles on Soil Nitrogen Transformation in Improved Saline Soils from an Irrigated Area in Northeast China. Water 2024, 16, 653. [Google Scholar] [CrossRef]
  3. Gao, Z.; Hu, X.; Li, X.-Y.; Li, Z.-C. Effects of freeze-thaw cycles on soil macropores and its implications on formation of hummocks in alpine meadows in the Qinghai Lake watershed, northeastern Qinghai-Tibet Plateau. J. Soils Sediments 2021, 21, 245–256. [Google Scholar] [CrossRef]
  4. Sorensen, P.O.; Finzi, A.C.; Giasson, M.-A.; Reinmann, A.B.; Sanders-DeMott, R.; Templer, P.H. Winter soil freeze-thaw cycles lead to reductions in soil microbial biomass and activity not compensated for by soil warming. Soil Biol. Biochem. 2018, 116, 39–47. [Google Scholar] [CrossRef]
  5. Musa, A.; Ya, L.; Anzhi, W.; Cunyang, N. Characteristics of soil freeze–thaw cycles and their effects on water enrichment in the rhizosphere. Geoderma 2016, 264, 132–139. [Google Scholar] [CrossRef]
  6. Fu, Q.; Zhao, H.; Li, T.; Hou, R.; Liu, D.; Ji, Y.; Zhou, Z.; Yang, L. Effects of biochar addition on soil hydraulic properties before and after freezing-thawing. Catena 2019, 176, 112–124. [Google Scholar] [CrossRef]
  7. Dexter, A.; Czyż, E.; Gaţe, O. Soil structure and the saturated hydraulic conductivity of subsoils. Soil Tillage Res. 2004, 79, 185–189. [Google Scholar] [CrossRef]
  8. Xiao, L.; Yao, K.; Li, P.; Liu, Y.; Zhang, Y. Effects of freeze-thaw cycles and initial soil moisture content on soil aggregate stability in natural grassland and Chinese pine forest on the Loess Plateau of China. J. Soils Sediments 2020, 20, 1222–1230. [Google Scholar] [CrossRef]
  9. Muukkonen, P.; Hartikainen, H.; Alakukku, L. Effect of soil structure disturbance on erosion and phosphorus losses from Finnish clay soil. Soil Tillage Res. 2009, 103, 84–91. [Google Scholar] [CrossRef]
  10. Ma, R.; Cai, C.; Li, Z.; Wang, J.; Xiao, T.; Peng, G.; Yang, W. Evaluation of soil aggregate microstructure and stability under wetting and drying cycles in two Ultisols using synchrotron-based X-ray micro-computed tomography. Soil Tillage Res. 2015, 149, 1–11. [Google Scholar] [CrossRef]
  11. Wan, X.; Lai, Y.; Wang, C. Experimental study on the freezing temperatures of saline silty soils. Permafr. Periglac. Process 2015, 26, 175–187. [Google Scholar] [CrossRef]
  12. Wu, Y.; Zhai, E.; Zhang, X.; Wang, G.; Lu, Y. A study on frost heave and thaw settlement of soil subjected to cyclic freeze-thaw conditions based on hydro-thermal-mechanical coupling analysis. Cold Reg. Sci. Technol. 2021, 188, 103296. [Google Scholar] [CrossRef]
  13. Henry, H.A. Soil freeze–thaw cycle experiments: Trends, methodological weaknesses and suggested improvements. Soil Biol. Biochem. 2007, 39, 977–986. [Google Scholar] [CrossRef]
  14. Qi, J.; Vermeer, P.A.; Cheng, G. A review of the influence of freeze-thaw cycles on soil geotechnical properties. Permafr. Periglac. Process 2006, 17, 245–252. [Google Scholar] [CrossRef]
  15. Henry, H.A. Climate change and soil freezing dynamics: Historical trends and projected changes. Clim. Chang. 2008, 87, 421–434. [Google Scholar] [CrossRef]
  16. Hall, K. Evidence for freeze–thaw events and their implications for rock weathering in northern Canada: II. The temperature at which water freezes in rock. Earth Surf. Process Landf. 2007, 32, 249–259. [Google Scholar] [CrossRef]
  17. Groffman, P.M.; Driscoll, C.T.; Fahey, T.J.; Hardy, J.P.; Fitzhugh, R.D.; Tierney, G.L. Colder soils in a warmer world: A snow manipulation study in a northern hardwood forest ecosystem. Biogeochemistry 2001, 56, 135–150. [Google Scholar] [CrossRef]
  18. Fraser, J.K. Freeze-thaw frequencies and mechanical weathering in Canada. Arctic 1959, 12, 40–53. [Google Scholar] [CrossRef]
  19. Eigenbrod, K. Effects of cyclic freezing and thawing on volume changes and permeabilities of soft fine-gained soils. Can. Geotech. J. 1996, 33, 529–537. [Google Scholar] [CrossRef]
  20. Guo, D.; Yang, M.; Wang, H. Sensible and latent heat flux response to diurnal variation in soil surface temperature and moisture under different freeze/thaw soil conditions in the seasonal frozen soil region of the central Tibetan Plateau. Environ. Earth Sci. 2011, 63, 97–107. [Google Scholar] [CrossRef]
  21. Granger, R.; Gray, D.; Dyck, G. Snowmelt infiltration to frozen prairie soils. Can. J. Earth Sci. 1984, 21, 669–677. [Google Scholar] [CrossRef]
  22. Niu, G.-Y.; Yang, Z.-L. Effects of frozen soil on snowmelt runoff and soil water storage at a continental scale. J. Hydrometeorol. 2006, 7, 937–952. [Google Scholar] [CrossRef]
  23. Wang, E.; Cruse, R.M.; Chen, X.; Daigh, A. Effects of moisture condition and freeze/thaw cycles on surface soil aggregate size distribution and stability. Can. J. Soil Sci. 2012, 92, 529–536. [Google Scholar] [CrossRef]
  24. Dagesse, D.F. Freezing-induced bulk soil volume changes. Can. J. Soil Sci. 2010, 90, 389–401. [Google Scholar] [CrossRef]
  25. Pittman, F.; Mohammed, A.; Cey, E. Effects of antecedent moisture and macroporosity on infiltration and water flow in frozen soil. Hydrol. Process 2020, 34, 795–809. [Google Scholar] [CrossRef]
  26. Wang, C.; Li, S.; Lai, Y.; Chen, Q.; He, X.; Zhang, H.; Liu, X. Predicting the Soil Freezing Characteristic from the Particle Size Distribution Based on Micro-Pore Space Geometry. Water Resour. Res. 2022, 58, e2021WR030782. [Google Scholar] [CrossRef]
  27. Lu, X.; Li, R.; Shi, H.; Liang, J.; Miao, Q.; Fan, L. Successive simulations of soil water-heat-salt transport in one whole year of agriculture after different mulching treatments and autumn irrigation. Geoderma 2019, 344, 99–107. [Google Scholar] [CrossRef]
  28. Parkin, G.; von Bertoldi, A.P.; McCoy, A.J. Effect of tillage on soil water content and temperature under freeze–thaw conditions. Vadose Zone J. 2013, 12, vzj2012.0075. [Google Scholar] [CrossRef]
  29. Li, Z.; Ma, L.; Flerchinger, G.N.; Ahuja, L.R.; Wang, H.; Li, Z. Simulation of overwinter soil water and soil temperature with SHAW and RZ-SHAW. Soil Sci. Soc. Am. J. 2012, 76, 1548–1563. [Google Scholar] [CrossRef]
  30. Ferrick, M.; Gatto, L.W. Quantifying the effect of a freeze–thaw cycle on soil erosion: Laboratory experiments. Earth Surf. Process Landf. J. Br. Geomorphol. Res. Group 2005, 30, 1305–1326. [Google Scholar] [CrossRef]
  31. Konrad, J.-M.; Seto, J. Frost heave characteristics of undisturbed sensitive Champlain Sea clay. Can. Geotech. J. 1994, 31, 285–298. [Google Scholar] [CrossRef]
  32. Lewis, J.; Sjöstrom, J. Optimizing the experimental design of soil columns in saturated and unsaturated transport experiments. J. Contam. Hydrol. 2010, 115, 1–13. [Google Scholar] [CrossRef] [PubMed]
  33. Land Administrative Bureau of Heilongjiang Province. Heilongjiang Soil; Agriculture Press: Beijing, China, 1992.
  34. Jiang, R.; Li, T.; Liu, D.; Fu, Q.; Hou, R.; Li, Q.; Cui, S.; Li, M. Soil infiltration characteristics and pore distribution under freezing–thawing conditions. Cryosphere 2021, 15, 2133–2146. [Google Scholar] [CrossRef]
  35. Coates, G.R.; Xiao, L.; Prammer, M.G. NMR Logging Principles and Applications; Haliburton Energy Services Publication: Houston, TX, USA, 1999. [Google Scholar]
  36. Tian, H.; Wei, C.; Wei, H.; Yan, R.; Chen, P. An NMR-based analysis of soil-water characteristics. Appl. Magn. Reson. 2014, 45, 49–61. [Google Scholar] [CrossRef]
  37. Godefroy, S.; Korb, J.-P.; Fleury, M.; Bryant, R. Surface nuclear magnetic relaxation and dynamics of water and oil in macroporous media. Phys. Rev. E 2001, 64, 021605. [Google Scholar] [CrossRef] [PubMed]
  38. Meyer, M.; Buchmann, C.; Schaumann, G. Determination of quantitative pore-size distribution of soils with 1H NMR relaxometry. Eur. J. Soil Sci. 2018, 69, 393–406. [Google Scholar] [CrossRef]
  39. Sleutel, S.; Cnudde, V.; Masschaele, B.; Vlassenbroek, J.; Dierick, M.; Van Hoorebeke, L.; Jacobs, P.; De Neve, S. Comparison of different nano-and micro-focus X-ray computed tomography set-ups for the visualization of the soil microstructure and soil organic matter. Comput. Geosci. 2008, 34, 931–938. [Google Scholar] [CrossRef]
  40. Nunan, N.; Ritz, K.; Rivers, M.; Feeney, D.S.; Young, I.M. Investigating microbial micro-habitat structure using X-ray computed tomography. Geoderma 2006, 133, 398–407. [Google Scholar] [CrossRef]
  41. Kleinberg, R. Pore size distributions, pore coupling, and transverse relaxation spectra of porous rocks. J. Magn. Reson. Imaging 1994, 12, 271–274. [Google Scholar] [CrossRef]
  42. Chen, X.; Li, L.; Li, X.; Kang, J.; Xiang, X.; Shi, H.; Ren, X.J.W. Effect of biochar on soil-water characteristics of soils: A pore-scale study. Water 2023, 15, 1909. [Google Scholar] [CrossRef]
  43. Rahmati, M.; Pohlmeier, A.; Abasiyan, S.M.A.; Weihermüller, L.; Vereecken, H. Water retention and pore size distribution of a biopolymeric-amended loam soil. Vadose Zone J. 2019, 18, 1–13. [Google Scholar] [CrossRef]
  44. Jaeger, F.; Grohmann, E.; Schaumann, G.E. 1 H NMR relaxometry in natural humous soil samples: Insights in microbial effects on relaxation time distributions. J. Plant Soil 2006, 280, 209–222. [Google Scholar] [CrossRef]
  45. Matteson, A.; Tomanic, J.; Herron, M.; Allen, D.; Kenyon, W. NMR relaxation of clay/brine mixtures. SPE Reserv. Eval. Eng. 2000, 3, 408–413. [Google Scholar] [CrossRef]
  46. Jaeger, F.; Bowe, S.; Van As, H.; Schaumann, G. Evaluation of 1H NMR relaxometry for the assessment of pore-size distribution in soil samples. Eur. J. Soil Sci. 2009, 60, 1052–1064. [Google Scholar] [CrossRef]
  47. Bryar, T.R.; Daughney, C.J.; Knight, R.J. Paramagnetic effects of iron (III) species on nuclear magnetic relaxation of fluid protons in porous media. J. Magn. Reson. 2000, 142, 74–85. [Google Scholar] [CrossRef] [PubMed]
  48. Bryar, T.R.; Knight, R.J. Sensitivity of nuclear magnetic resonance relaxation measurements to changing soil redox conditions. Geophys. Res. Lett. 2002, 29, 50-51–50-54. [Google Scholar] [CrossRef]
  49. Kenyon, W.; Day, P.; Straley, C.; Willemsen, J. A three-part study of NMR longitudinal relaxation properties of water-saturated sandstones. SPE Form. Eval. 1988, 3, 622–636. [Google Scholar] [CrossRef]
  50. Watanabe, K.; Kito, T.; Dun, S.; Wu, J.Q.; Greer, R.C.; Flury, M. Water infiltration into a frozen soil with simultaneous melting of the frozen layer. Vadose Zone J. 2013, 12, vzj2011.0188. [Google Scholar] [CrossRef]
  51. Watanabe, K.; Wake, T. Hydraulic conductivity in frozen unsaturated soil. In Proceedings of the 9th International Conference on Permafrost, Fairbanks, AK, USA, 29 June–3 July 2008; pp. 1927–1932. [Google Scholar]
  52. McCauley, C.A.; White, D.M.; Lilly, M.R.; Nyman, D.M. A comparison of hydraulic conductivities, permeabilities and infiltration rates in frozen and unfrozen soils. Cold Reg. Sci. Technol. 2002, 34, 117–125. [Google Scholar] [CrossRef]
  53. Benoit, G.R.; Voorhees, W.B. Effect of freeze–thaw activity on water retention, hydraulic conductivity, density, and surface strength of two soils frozen at high water content. In Proceedings of the International Conference on Frozen Soil Impact on Agricultural, Range, and Frost Lands, Washington, DC, USA, 21–22 March 1990; pp. 45–51. [Google Scholar]
  54. Yergeau, E.; Kowalchuk, G.A. Responses of Antarctic soil microbial communities and associated functions to temperature and freeze–thaw cycle frequency. Environ. Microbiol. 2008, 10, 2223–2235. [Google Scholar] [CrossRef]
  55. Ho, E.; Gough, W. Freeze thaw cycles in Toronto, Canada in a changing climate. Theor. Appl. Climatol. 2006, 83, 203–210. [Google Scholar] [CrossRef]
  56. Liu, B.; Fan, H.; Jiang, Y.; Ma, R. Linking pore structure characteristics to soil strength and their relationships with detachment rate of disturbed Mollisol by concentrated flow under freeze–thaw effects. J. Hydrol. 2023, 617, 129052. [Google Scholar] [CrossRef]
  57. Shen, J.; Wang, Q.; Chen, Y.; Han, Y.; Zhang, X.; Liu, Y. Evolution process of the microstructure of saline soil with different compaction degrees during freeze-thaw cycles. Eng. Geol. 2022, 304, 106699. [Google Scholar] [CrossRef]
  58. Zhao, Y.-D.; Hu, X. How Do Freeze–Thaw Cycles Affect the Soil Pore Structure in Alpine Meadows Considering Soil Aggregate and Soil Column Scales? J. Soil Sci. Plant Nutr. 2022, 22, 4207–4216. [Google Scholar] [CrossRef]
  59. Park, S.-E.; Bartsch, A.; Sabel, D.; Wagner, W.; Naeimi, V.; Yamaguchi, Y. Monitoring freeze/thaw cycles using ENVISAT ASAR Global Mode. Remote Sens. Environ. 2011, 115, 3457–3467. [Google Scholar] [CrossRef]
  60. Lehrsch, G.A. Freeze-thaw cycles increase near-surface aggregate stability. Soil Sci. 1998, 163, 63–70. [Google Scholar] [CrossRef]
  61. Liu, B.; Ma, R.; Fan, H. Evaluation of the impact of freeze-thaw cycles on pore structure characteristics of black soil using X-ray computed tomography. Soil Tillage Res. 2021, 206, 104810. [Google Scholar] [CrossRef]
  62. Formanek, G.E.; McCool, D.K.; Papendick, R.I. Freeze-thaw and consolidation effects on strength of a wet silt loam. Trans. ASAE 1984, 27, 1749–1752. [Google Scholar] [CrossRef]
  63. Munkholm, L.J.; Schjønning, P.; Kay, B.D. Tensile strength of soil cores in relation to aggregate strength, soil fragmentation and pore characteristics. Soil Tillage Res. 2002, 64, 125–135. [Google Scholar] [CrossRef]
  64. Dagesse, D.F. Effect of the Freeze/Thaw Process on the Structural Stability of Soil Aggregates. Ph.D. Thesis, University of Guelph, Guelph, ON, Canada, 2006. [Google Scholar]
  65. Brun, M.; Lallemand, A.; Quinson, J.-F.; Eyraud, C. A new method for the simultaneous determination of the size and shape of pores: The thermoporometry. Thermochim. Acta 1977, 21, 59–88. [Google Scholar] [CrossRef]
  66. Hamilton, J. Behavior of expansive soils in western Canada. In Proceedings of the Expansive Soils, Denver, CO, USA, 16 June 1980; pp. 815–833. [Google Scholar]
  67. Othman, M.A.; Benson, C.H. Effect of freeze–thaw on the hydraulic conductivity and morphology of compacted clay. J. Can. Geotech. J. 1993, 30, 236–246. [Google Scholar] [CrossRef]
  68. Hamilton, A.J.C.G.J. Freezing shrinkage in compacted clays. Can. Geotech. J. 1966, 3, 1–17. [Google Scholar] [CrossRef]
  69. Li, G.-y.; Ma, W.; Mu, Y.-h.; Wang, F.; Fan, S.-z.; Wu, Y.-h. Effects of freeze-thaw cycle on engineering properties of loess used as road fills in seasonally frozen ground regions, North China. J. Mt. Sci. 2017, 14, 356–368. [Google Scholar] [CrossRef]
  70. Lu, J.; Zhang, M.; Zhang, X.; Pei, W.; Bi, J. Experimental study on the freezing–thawing deformation of a silty clay. Cold Reg. Sci. Technol. 2018, 151, 19–27. [Google Scholar] [CrossRef]
Figure 1. Soil profiles at the sampling sites.
Water 16 02040 g001
Figure 2. Temperature and water content variation curves of black soil at different depths. (a) Soil temperature; (b) Water content.
Water 16 02040 g002
Figure 3. T2 spectrum distribution of black soil. Note: prefreezing water content: (a) 10%; (b) 20%; (c) 30%.
Water 16 02040 g003
Figure 4. T2 spectrum distribution of meadow soil. Note: prefreezing water content: (a) 10%; (b) 20%; (c) 30%.
Water 16 02040 g004
Figure 5. T2 spectrum distribution of chernozem. Note: prefreezing water content: (a) 10%; (b) 20%; (c) 30%.
Water 16 02040 g005
Figure 6. PSD of the black soil with different prefreezing water contents under different numbers of FTCs. Note: (a) 10%; (b) 20%; (c) 30%. Note: different letters indicate significant differences (p < 0.01).
Water 16 02040 g006
Figure 7. PSD of the meadow soil with different prefreezing water contents under different numbers of FTCs. Note: (a) 10%; (b) 20%; (c) 30%. Note: different letters indicate significant differences (p < 0.01).
Water 16 02040 g007
Figure 8. PSD of the chernozem with different prefreezing water contents under different numbers of FTCs. Note: (a) 10%; (b) 20%; (c) 30%. Note: different letters indicate significant differences (p < 0.01).
Water 16 02040 g008
Figure 9. Cumulative porosity and pore volume percentage curves of the soils for different numbers of FTCs. Note: (a) black soil; (b) meadow soil; (c) chernozem.
Water 16 02040 g009
Figure 10. Changes in the pore size fractions of the soils with different prefreezing water contents under different numbers of FTCs. Note: (a) black soil; (b) meadow soil; (c) chernozem.
Water 16 02040 g010
Table 1. Details of the soil sampling sites.
Soil TypeCropland Area/hm2Typical Profile LocationCoordinate
Black soil1.77 × 105Xiangfang District, Harbin126.73° E, 45.75° N
Meadow soil1.10 × 105Xingan township, Zhaoyuan County125.08° E, 45.52° N
Chernozem2.22 × 105Fengle township, Zhaozhou County125.42° E, 45.78° N
Table 2. Basic physical and chemical properties of the test soil.
Soil TypesBulk Density g/cm3Organic Content g/kgElectrical Conductivity s/mParticle Size/%Soil Texture
Sand/mm
(2~0.05)
Silt/mm
(0.05~0.002)
Clay/mm
(<0.002)
Black soil1.6528.320.0212.6470.8216.54Silt loam
Meadow soil1.5316.510.019.5273.0017.48
Chernozem1.5526.520.0138.9950.3010.71
Disclaimer/Publisher’s Note: The statements, opinions and data contained in all publications are solely those of the individual author(s) and contributor(s) and not of MDPI and/or the editor(s). MDPI and/or the editor(s) disclaim responsibility for any injury to people or property resulting from any ideas, methods, instructions or products referred to in the content.

