Abstract
The Three Gorges Reservoir (TGR), a landmark of human engineering, has significantly altered the hydrodynamics and ecology of its surrounding environment. Our research explores the hydrodynamic and ecological changes in the TGR, focusing on their implications for reservoir-induced water quality and water resource issues. We designed a 2D hydrodynamic and water quality model and implemented 15 operational scenarios with an advanced dynamic storage capacity method for the TGR during flood season, drawdown and impoundment periods. Our simulations well reproduced and predicted water levels, discharge rates, and thermal conditions of the TGR, providing critical insights. The dynamic storage capacity method significantly improved the precision of water level simulations. This approach achieved modeling errors below 0.2 m when compared to real measurements from seven stations. We performed a detailed analysis of the sensitive, sub-sensitive, and insensitive areas during three reservoir operation periods. The drawdown period showed the most extensive impact range (468 km river channel), while the impoundment period had the least impact range (76 km river channel). Furthermore, we quantified the delay of temperature waves during these periods, observing a maximum delay of approximately 120 km and a minimum delay of less than 10 km, which underscores the variability in hydrodynamic responses under different operational scenarios. Our findings reveal the complex sensitivities of the TGR to varied operational modes, aiding in the development of eutrophication and water resources control strategies. Our modeling application provides different operational scenarios and insights for ecological management strategies in large dam systems globally, informing future water resource management and policy-making, ensuring sustainable and effective management of large reservoir systems.
1. Introduction
Across millennia, aquatic ecosystems have evolved with their hydrothermal environments, forming complex and dynamic interactions [1,2]. The evolution of aquatic ecosystems is not static; they are constantly changing and adapting to environmental pressures and human activities, such as climate variations, land use changes, and water resource management, etc. The recent surge in dam constructions has significantly altered these ecological systems [3,4,5], bringing both benefits in hydropower and water management, but also altering the hydrothermal dynamics of riverine ecosystems [6,7]. These changes present potential risks to aquatic ecosystems [8,9,10]. For example, dam construction and management can contribute to greenhouse gas emissions, while eutrophication may occur in reservoirs resulting in poor water quality [11,12,13].
The Three Gorges Reservoir (TGR) stands as a prime example of such infrastructural advancements and their potential environmental impacts. Following the construction of the TGR, dramatic changes have occurred in its aquatic habitat, including an expanded water surface, reduced flow rates, and increased sediment deposition. This transformation has led to a new equilibrium in the ecosystems, creating a hybrid river–reservoir environment [14,15,16].
Although numerous studies have explored the long-term ecological and hydrothermal consequences of reservoir operations [17,18,19], there remains a gap in understanding the short-term impacts of water level fluctuations, particularly in large systems like the TGR. We hypothesize that daily water level fluctuations, caused by short-term scheduling in the TGR, result in significant changes in water temperature and levels. These changes affect the hydrodynamics and ecological health of the reservoir’s different regions. Understanding these variations in the TGR could provide insights for managing similar large dam systems globally.
Focusing on the TGR, the current study aims to understand the complex relationship between dam operations, water level fluctuations, and hydrothermal dynamics. Our modeling application, focused on the Three Gorges Dam (TGD), provides different operational scenarios and insights for ecological management strategies. This approach ensures sustainable and effective management of large reservoir systems similar to the TGD, informing future water resource management and policy-making.
2. Methods
2.1. Study Area and Data Collection
Located in the Yangtze River, China, the TGR serves as a prime example of a standard channel reservoir. With its impressive capacity of 39.3 billion cubic meters (3.93 × 10¹⁰ m3), the TGR ranks as the world’s foremost hydropower station. Since its first filling in June 2003, which increased the water level to 135 m, followed by a further increase to 175 m in 2010, the TGR has witnessed regular fluctuations in water levels between 145 and 175 m [15].
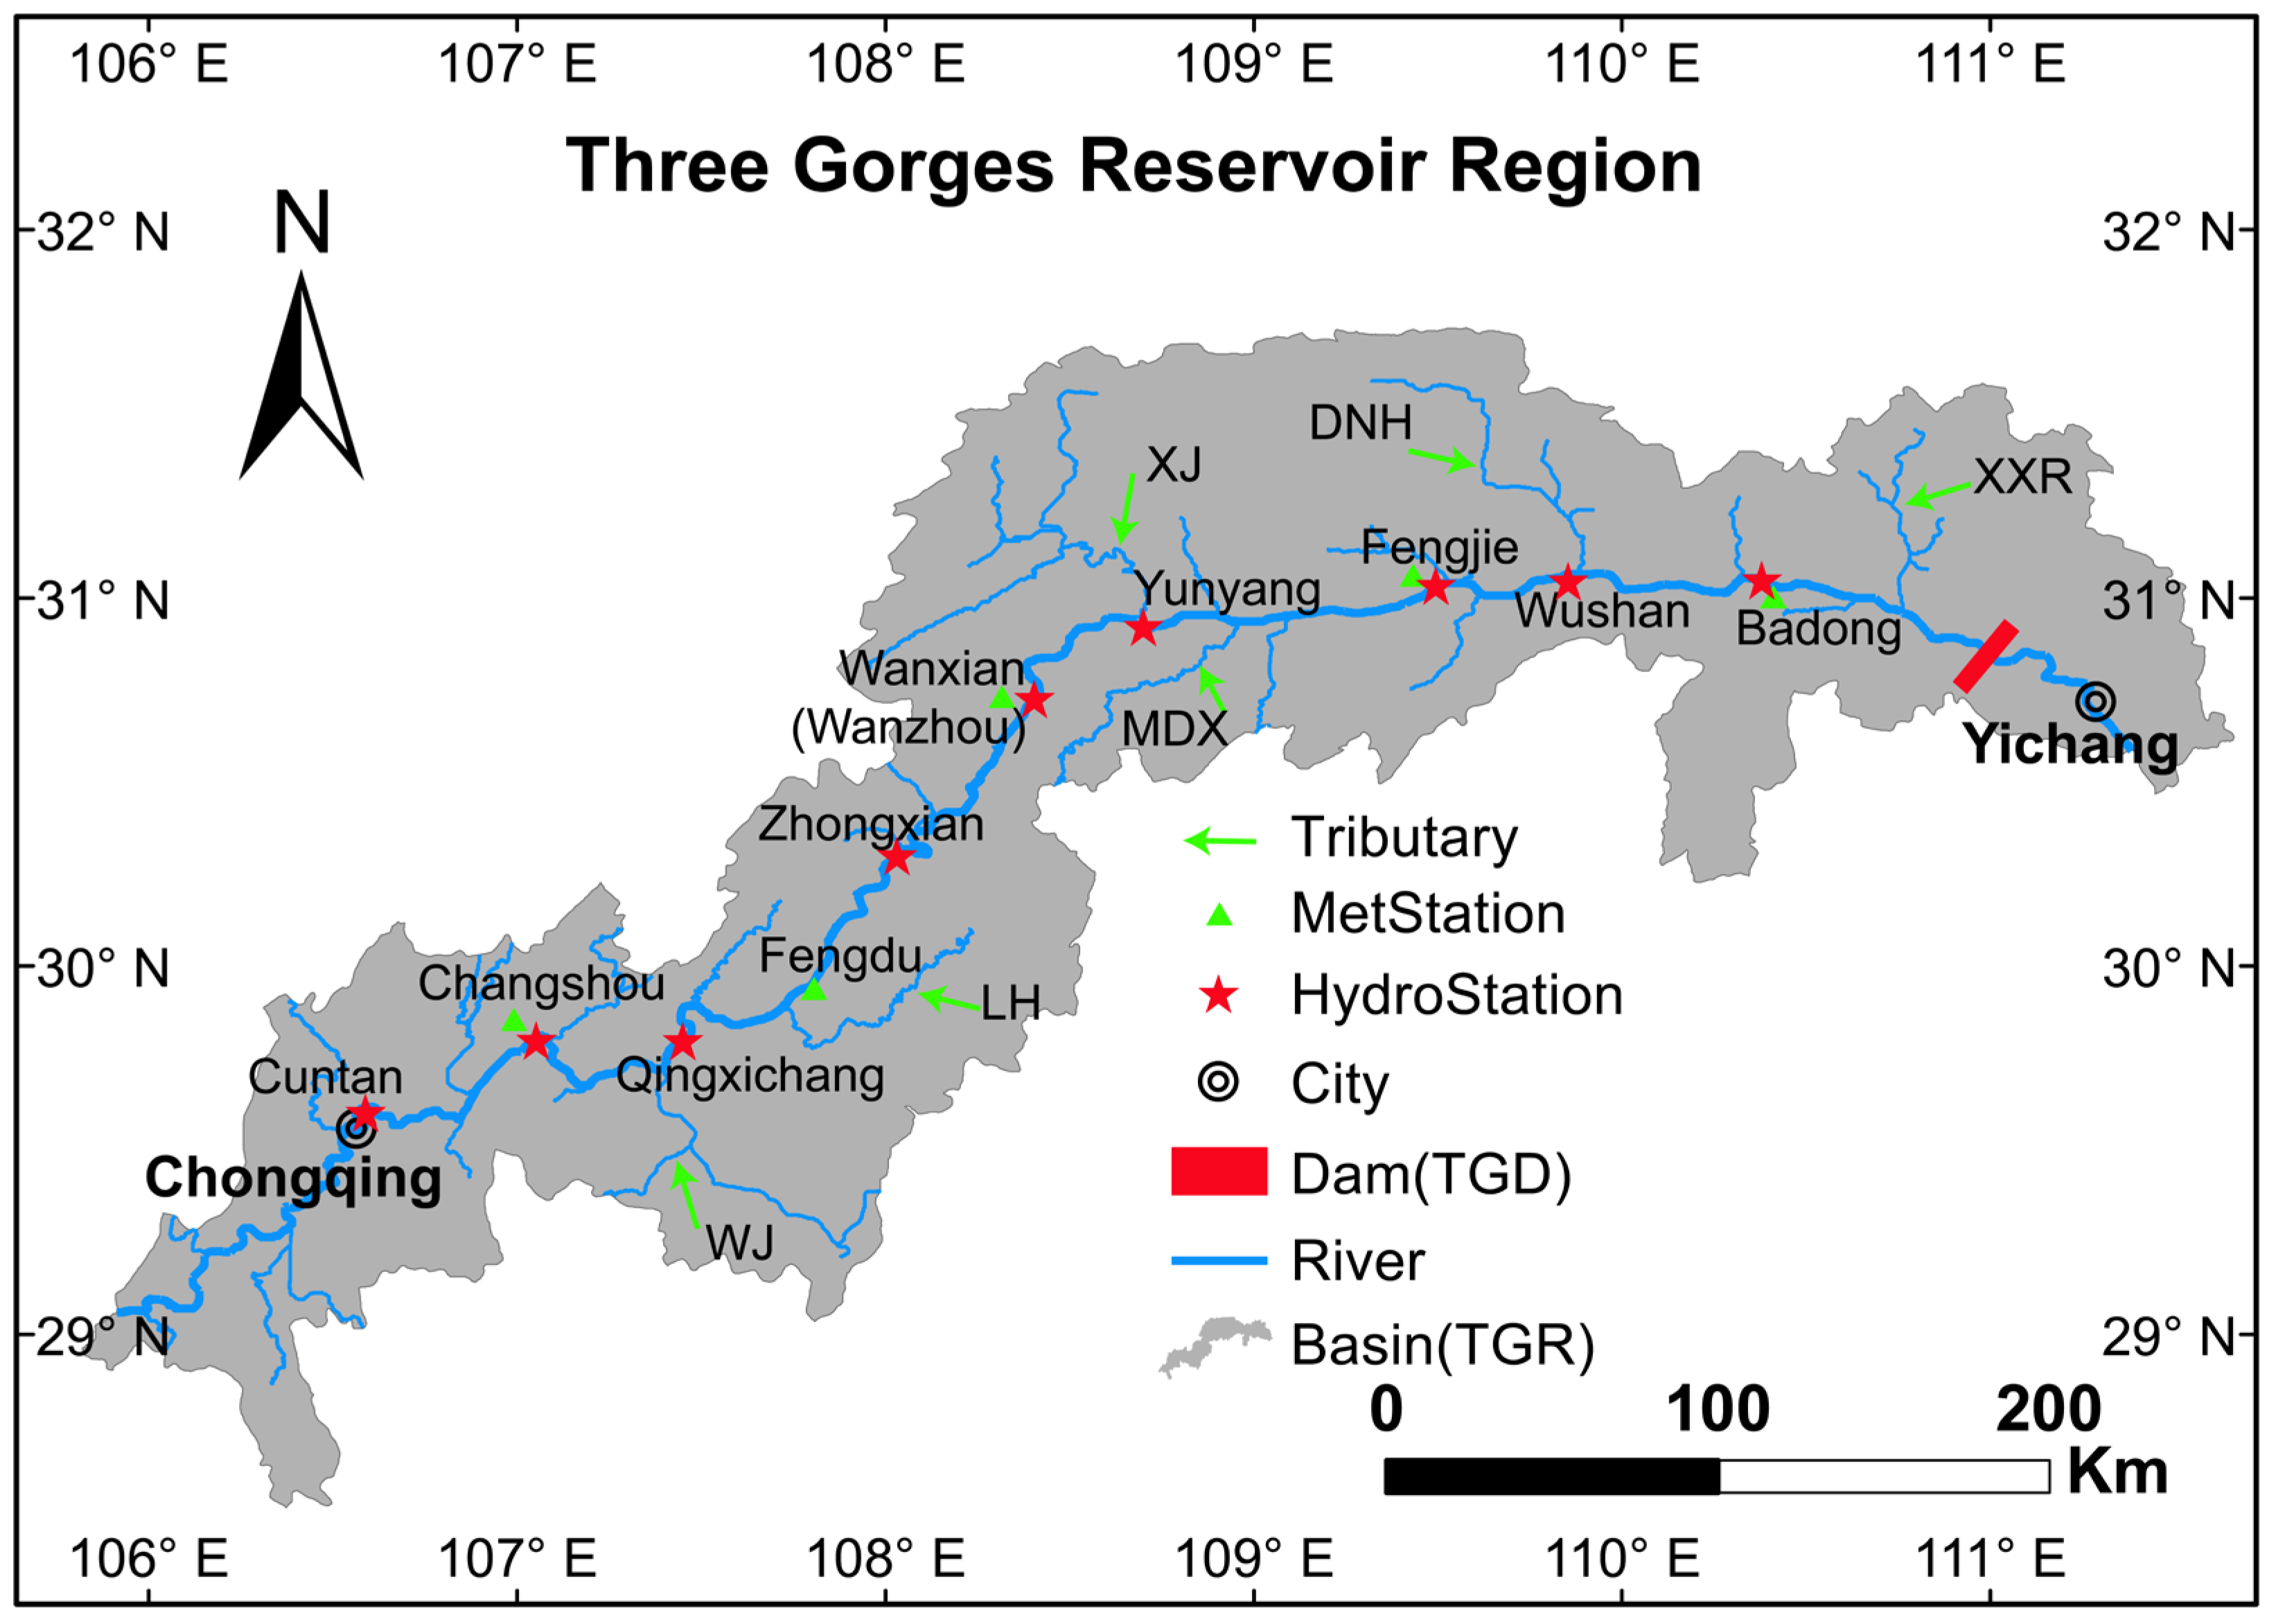
This study focuses on the backwater region of the TGR, extending from the Cuntan hydrologic station in Chongqing City to the Three Gorges Dam (TGD) in Zigui, Yichang City, covering a span of approximately 604 km (Figure 1). There are 6 larger tributaries considered in the subsequent model: Wujiang (WJ), Longhe (LH), Xiaojiang (XJ), Modaoxi (MDX), Daninghe (DNH), and Xiangxi River (XXR).
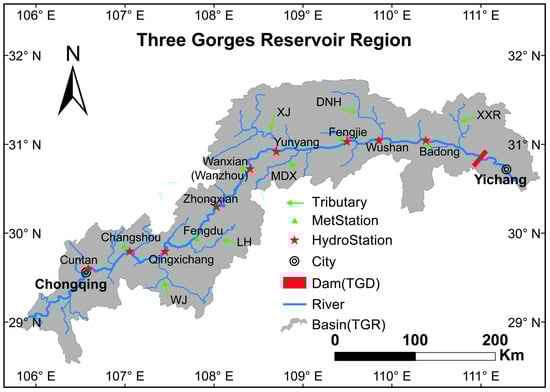
Figure 1.
The spatial representation of the Three Gorges Reservoir (TGR) (highlighting the backwater area, extending from the Cuntan hydrologic station in Chongqing City to the Three Gorges Dam in Zigui, Yichang City. Key sections including Cuntan, Changshou, Wanxian, Yunyang, Fengjie, Wushan, Badong, and the TGD are displayed in green or red shapes).
2.2. Model Development
2.2.1. Model Grid Generalization
CE-QUAL-W2 is a two-dimensional (longitudinal-vertical) laterally averaged hydrodynamic and water quality model developed by the U.S. Army Corps of Engineers’ Waterways Experiment Station. It is suitable for numerical simulation of long and narrow rivers, estuaries, and reservoirs. This model has been successfully used in many peer-reviewed studies on hydrodynamics and water quality [20]. The model has been applied to rivers [21], lakes [22,23], reservoirs [24,25], estuaries [26,27], and their combinations, including entire river basins with multiple reservoirs and river segments. Additionally, CE-QUAL-W2 also performs well in modeling laboratory tanks [28], showcasing its reliability and feasibility in both natural and controlled settings.
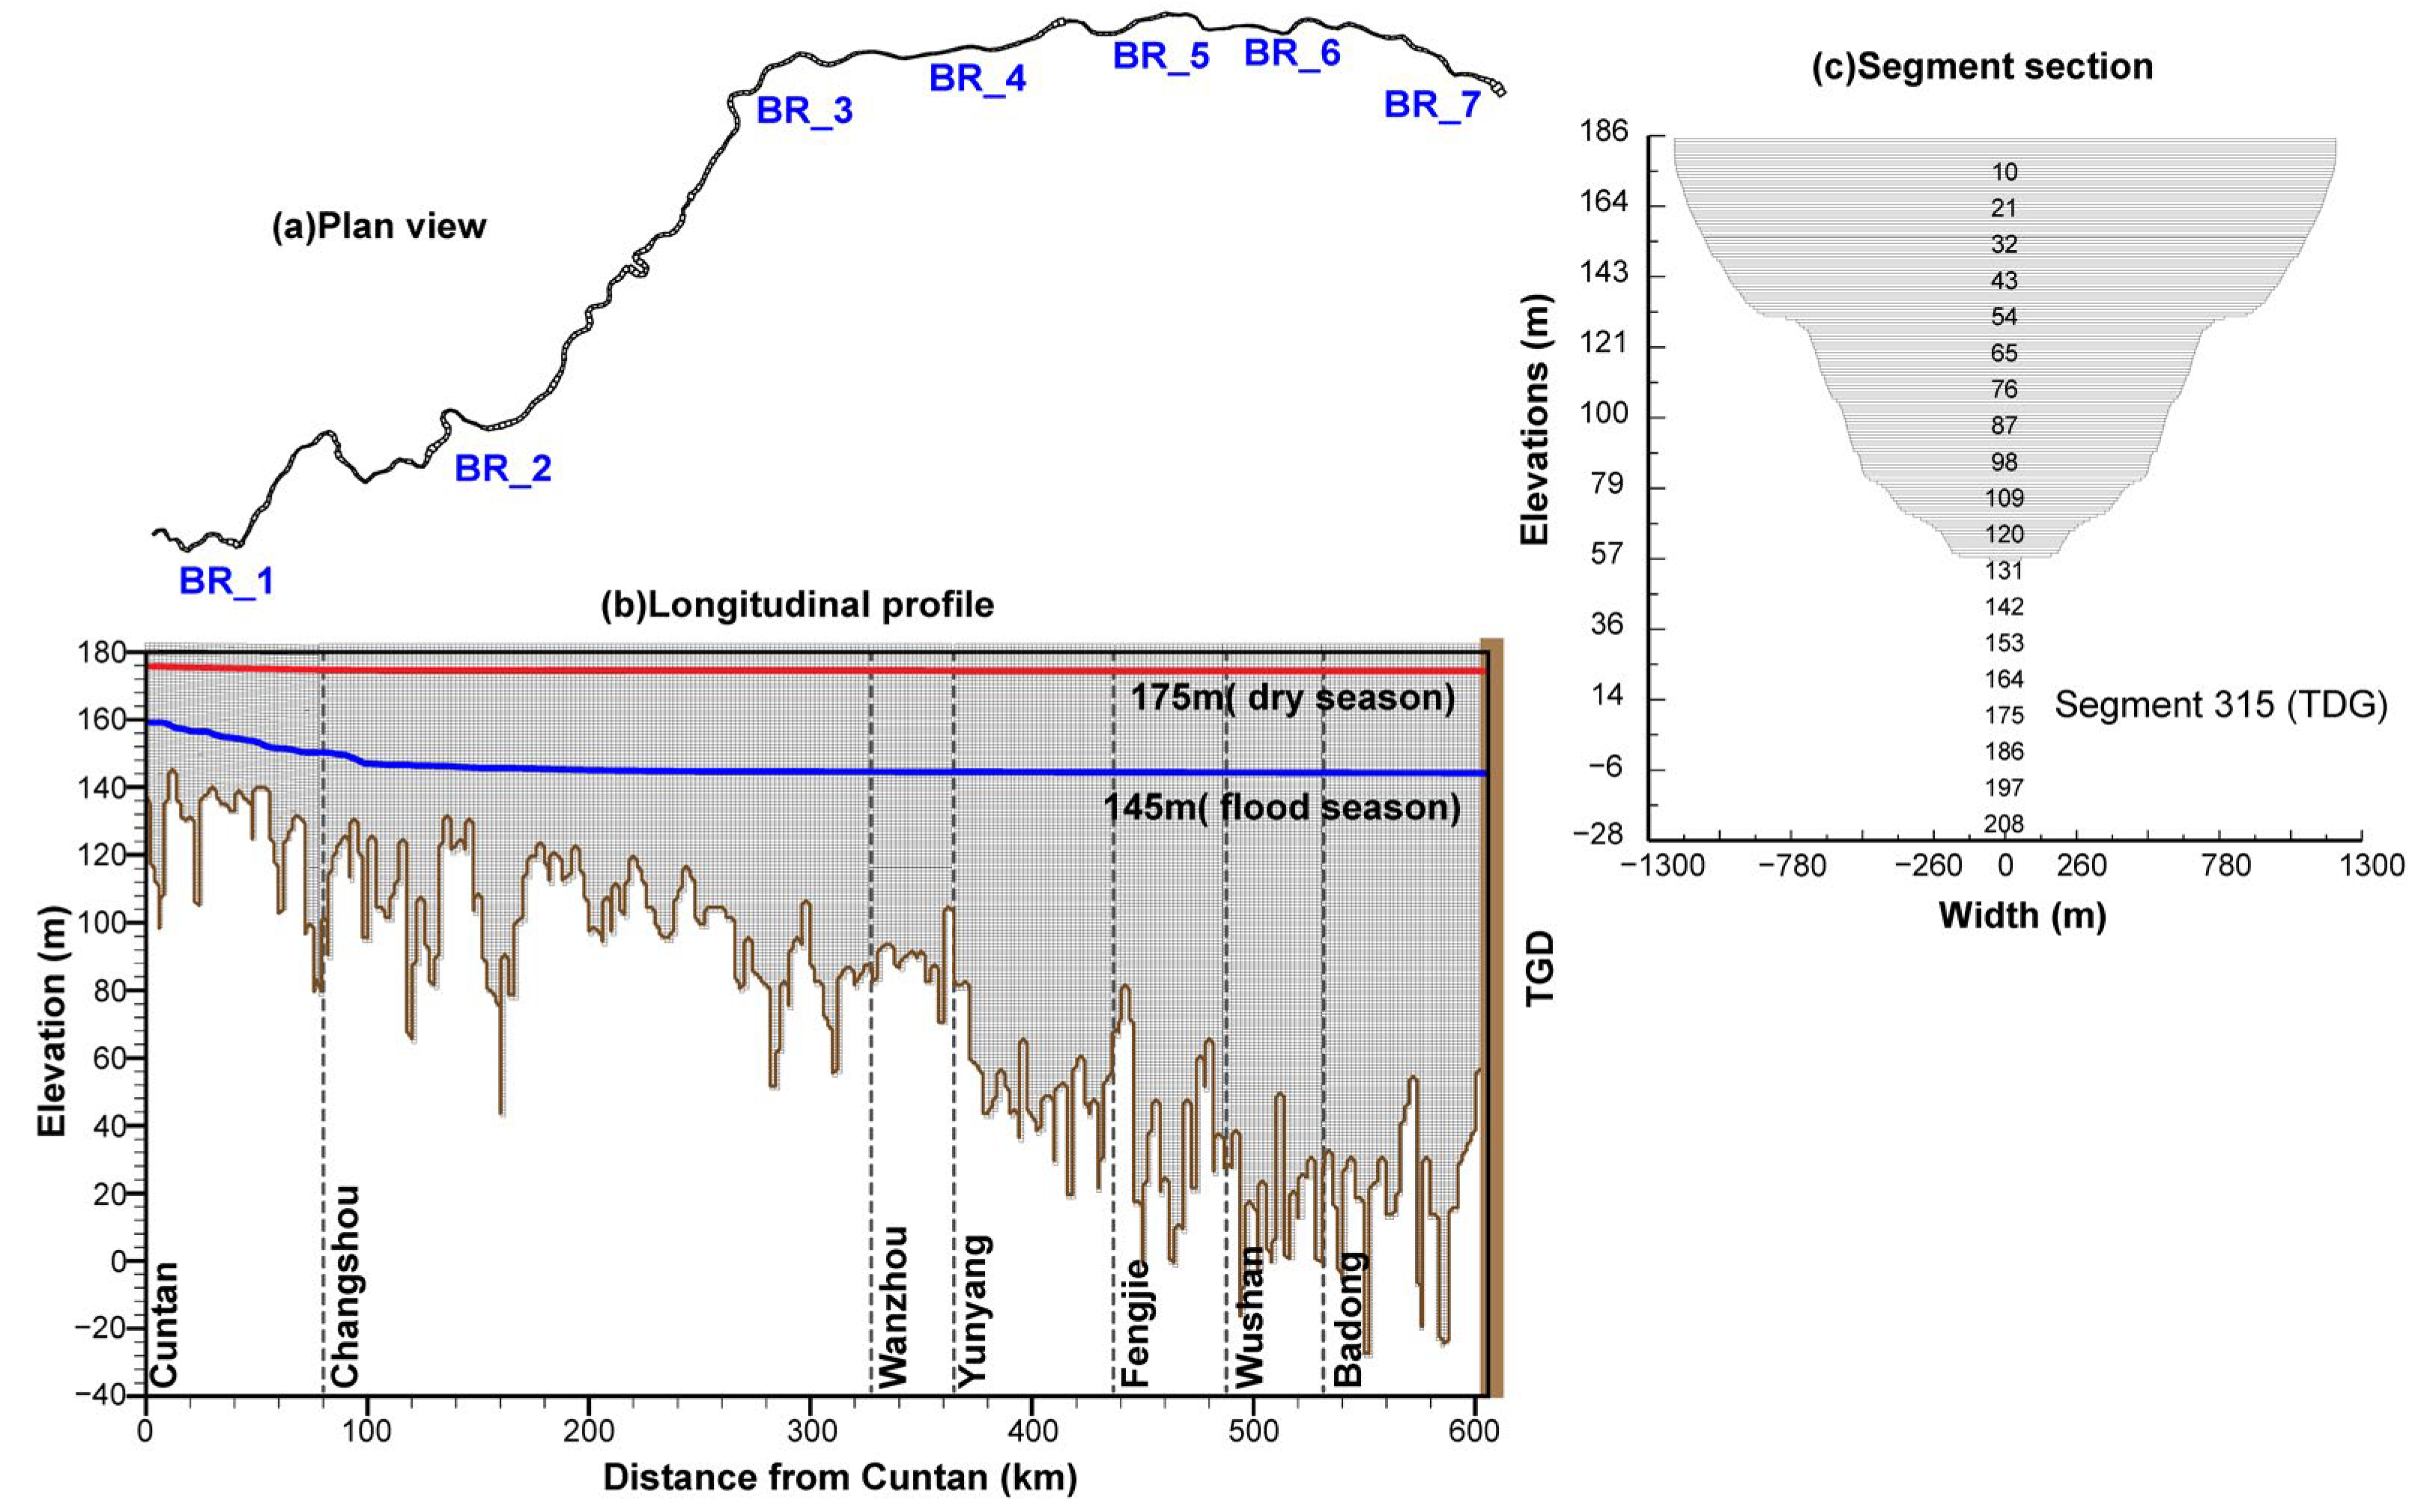
The computational grid system of the TGR model used a rectangular grid. This grid system (Figure 2) was divided into 7 branches (waterbodies), with 8 key cross-sections including Cuntan, Changshou, Wanxian, Yunyang, Fengjie, Wushan, Badong, and the TGD (Table 1). The grid was defined by a longitudinal length of 2000 m, vertical layer spacing of 1 m, and a width for each layer derived from the average width of the section, calculated using data from over 100 large cross-sections. The TGR model consisted of 316 segments and 214 layers. It specified two distinct slopes, one for the permanent backwater region, set at zero, and another for the fluctuating backwater area, set at a non-zero value. In the modeling process, the mainstream of the TGR was considered with detailed bathymetry, while tributaries were treated as point source loadings and were not included in the bathymetric data.
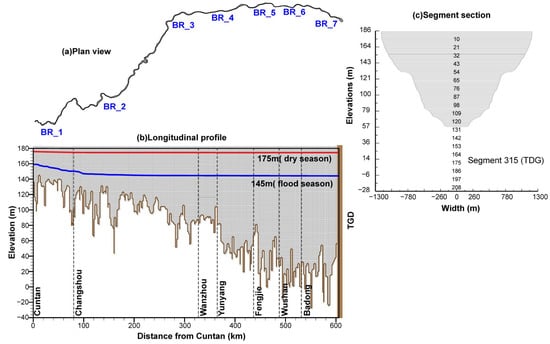
Figure 2.
Grids of TGR model: (a) plan view, (b) longitudinal profile, and (c) segment section for TGD. There were 316 segments and 214 layers in total. Length = 2000 m. Layer height = 1 m.

Table 1.
Bathymetry parameters for all waterbodies.
A more detailed description of the data required for modeling in this study is provided in the Supplementary Materials (Figures S1–S5 and Tables S1 and S2).
2.2.2. Assessment of Model Performance
To assess the model’s effectiveness, two primary metrics were utilized, the mean error (ME) and the absolute mean error (AME). The ME offers insights into the model’s bias, whereas the AME provides an average error measure, reflecting the model’s overall performance. These metrics are widely recognized in the scientific community for evaluating the congruence between models and observed data [20,24,26]. The calculation formula is as follows:
where n is the number of observations, is the observation, and is the simulated value.
This model’s starting date was 1 May 2014 (Julian day = 121) and ending date was 30 April 2015 (Julian day = 485). The calibration and validation of the model demonstrated that the simulated water elevation was quite close to the observed elevation, with an |ME| less than 0.2 and an AME less than 0.37. Additionally, the |ME| of the surface water temperature in key sections was less than 0.35 °C (Figures S4 and S5).
2.2.3. Reservoir Operation Scenarios
As an annual regulation reservoir, the TGR has four operation periods during a hydrological year: a dry season (winter), a drawdown period (spring), a flood season (summer), and an impoundment period (autumn). During the dry season, the TGR maintains a high water level of 175 m from November to April of the following year. The drawdown period extends from mid-May to June. In the flood season, the water level is lowered to 145 m from June to August. Lastly, the impoundment period occurs from September to November, preparing the reservoir for the upcoming hydrological cycle.
According to the tide-type ecological operation method [14,29] and the TGR regulation rule (China Three Gorges Corporation), five specific regulation scenarios have been implemented for each operation period. These regulation scenarios are significant in managing the reservoir’s hydrological dynamics.
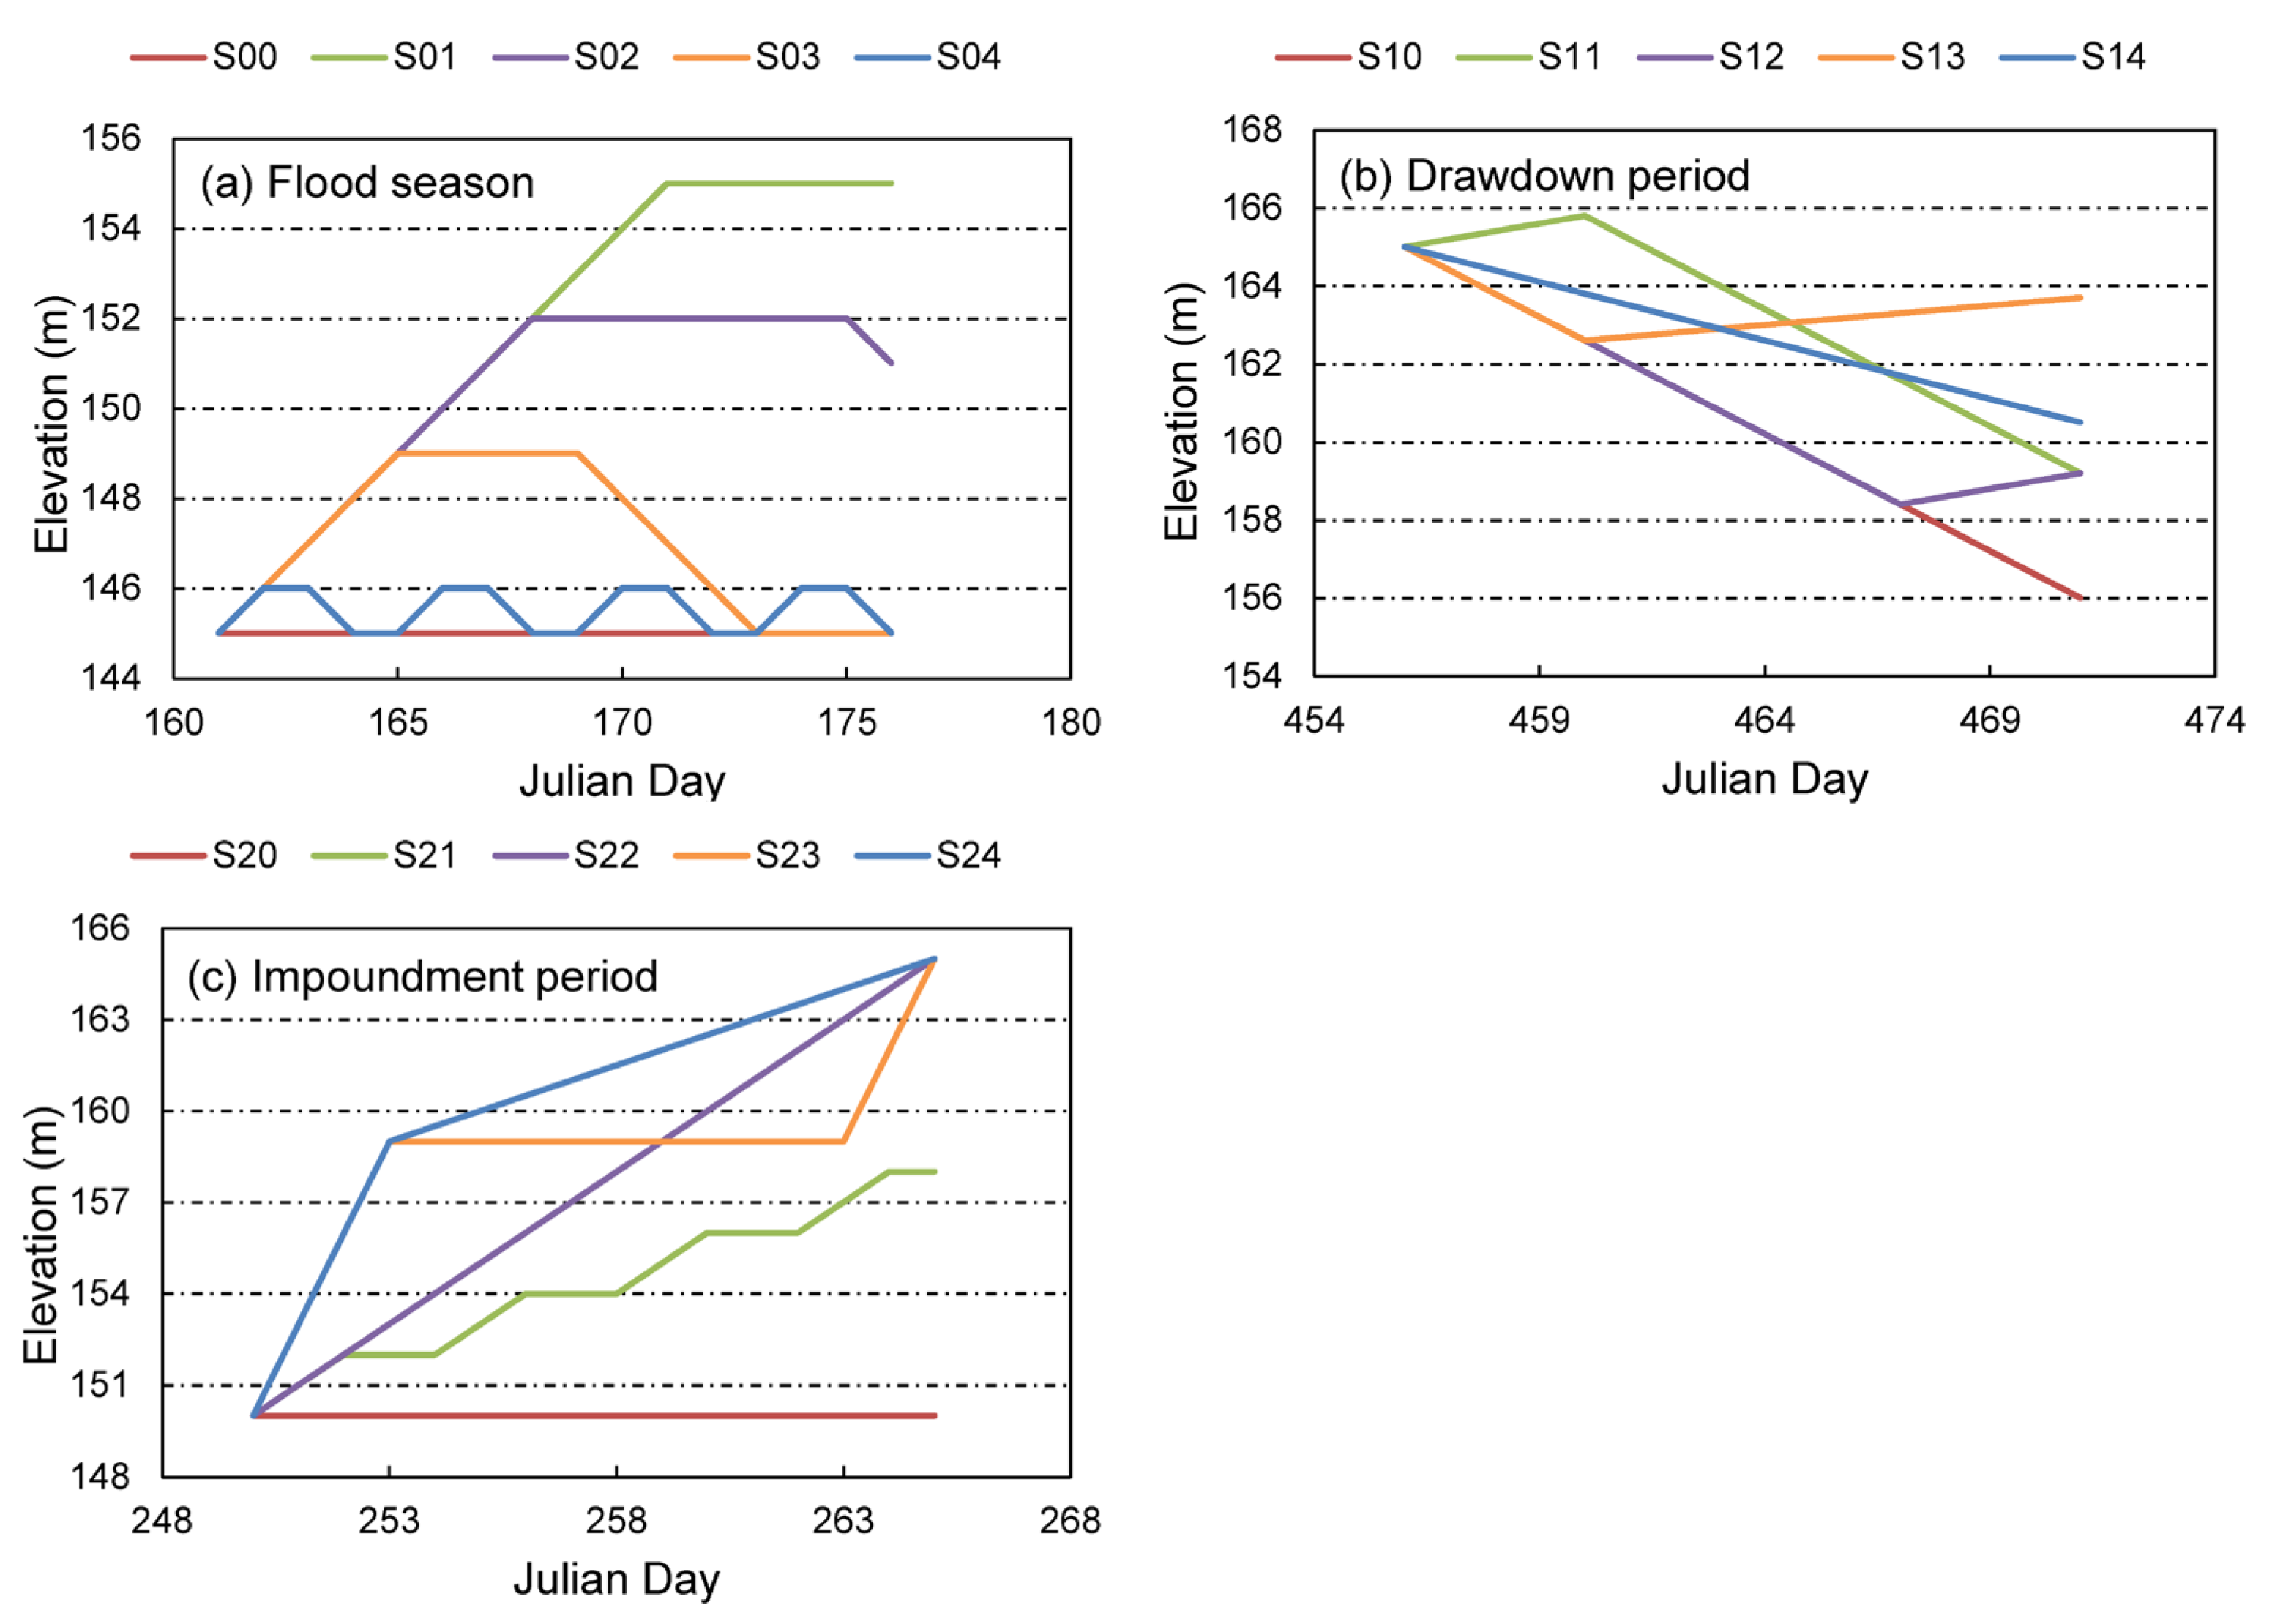
The water level process under the tide-type ecological operation method has been parameterized into six types: initial water level (IWL), daily fluctuation in the first fluctuation period (DF1), daily fluctuation in the second fluctuation period (DF2), duration of the first fluctuation period (DLDF1), duration of the second fluctuation period (DLDF2), days with an unchanged water level (DWLU), and duration for the scheduling period (DSP). These parameters for the typical regulation scenarios are detailed in Table 2, providing a comprehensive view of each scheme’s characteristics. Additionally, Figure 3 graphically depicts the water level process, illustrating the fluctuations and patterns across different periods within the TGR operation, each water level process lasting 15 days.
Table 2.
Parameters of reservoir regulation scenarios.
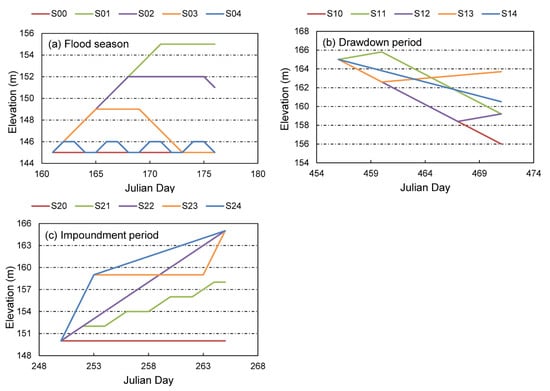
Figure 3.
Water level processes for different regulation schemes: (a) flood season, (b) drawdown period, and (c) impoundment period with different initial water levels (145 m, 165 m, and 150 m).
2.3. Defining Sensitivity Zones in Channel Reservoirs
Channel reservoirs are characterized by a pronounced longitudinal gradient change pattern, with deeper waters near the dam head and shallower waters in the tail and tributary backwater areas. These unique bathymetric morphologies and flow characteristics give rise to hydrodynamic properties that differ from typical rivers and lakes, where flow velocity and other parameters exhibit a combination of both riverine and lake features. From the dam’s head to the reservoir’s end, a gradient change is apparent, leading to the categorization of the reservoir into river-type, transition-type, and lake-type zones [30]. Due to varying discharge rates and distances from the dam, different sections of the backwater area respond differently to water level fluctuations at the dam. For instance, a daily rise of 1.5 m in the water level at the TGD, sustained over a week, could potentially cause the water level in the Wushan section (Da’ning River) to increase by up to 1.4 m per day. However, the Yunyang section (Xiaojiang River) and Wanzhou section only reach a maximum of 1.3 m per day, lagging by approximately one day. The Qingxichang section only achieves a maximum change of 0.5 m per day, with almost no significant change occurring in the Cuntan section.
To investigate the extent of the backwater area impacted by the TGD’s water level fluctuations in different seasons, ‘sensitivity zoning’ was employed. This method separated the channel reservoir into different sensitivity zones based on the correlation analysis of various hydrodynamic characteristics across different sections (Figure 4). A correlation coefficient (|R|) value of ≥0.9 denotes a ‘Sensitive Area’; a value between 0.5 and <0.9 signifies a ‘Sub-sensitive Area’; and a value of <0.5 indicates an ‘Insensitive Area’.
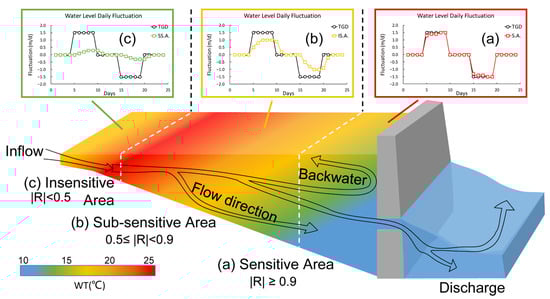
Figure 4.
Longitudinal zoning of sensitivity in channel reservoirs and their response to tide-type operations at TGD. (a–c) Daily water level fluctuations in different zones. V.S. tide-type operation at TGD. S.A., SS.A., and IS.A. represent “sensitive area”, “sub-sensitive area” and “insensitive area”.
3. Results
3.1. Correlation Analysis of Water Level Daily Fluctuations in Different Scenarios
To understand the impact of reservoir operations on water level fluctuations, a correlation analysis was conducted on key sections of the TGR, with the correlation coefficients presented in Table 3. The analysis revealed that the sensitivity of areas within the reservoir varies across different operation periods (Figure 5).
Table 3.
Correlation coefficients (|R|) of typical sites during different periods. (p < 0.01).
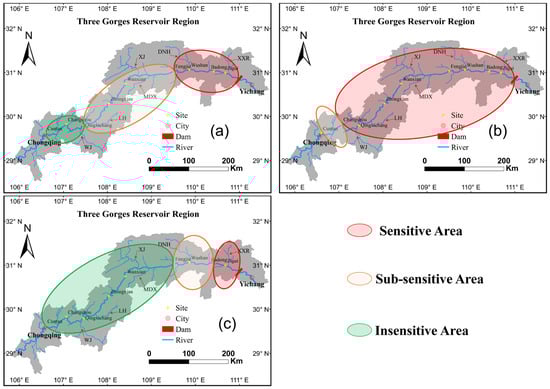
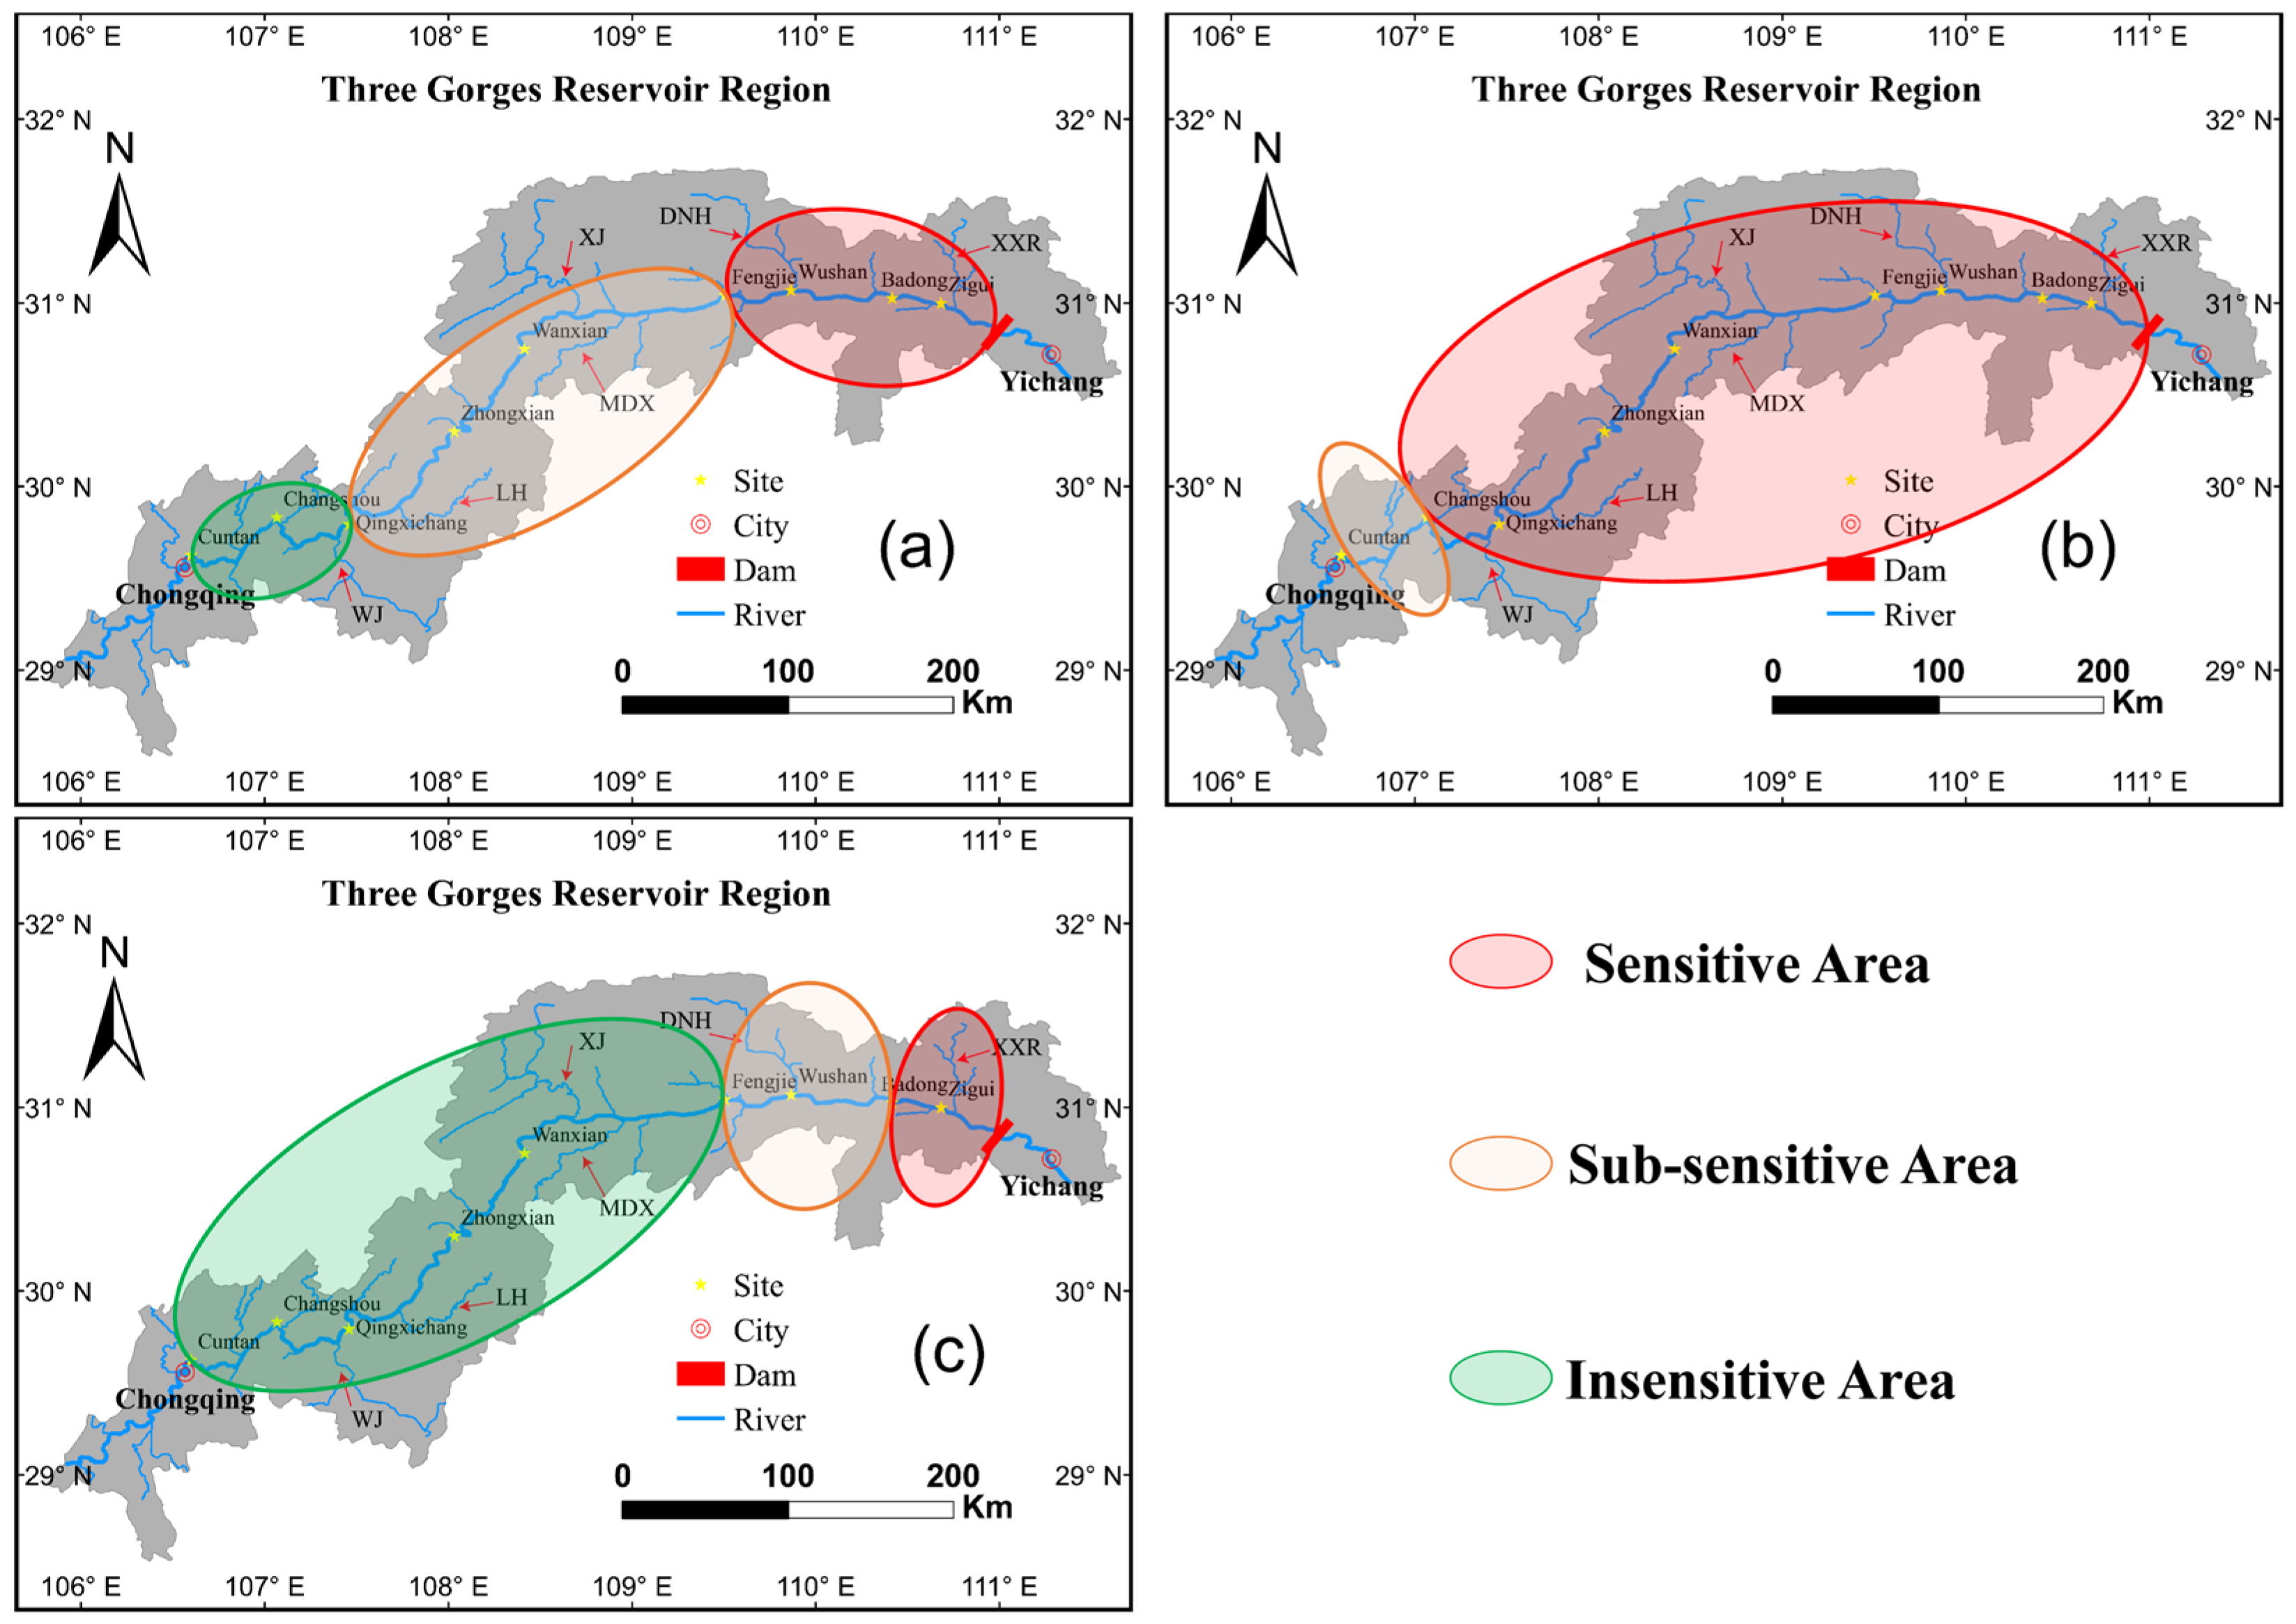
Figure 5.
Zoning of sensitivity in TGR during different operation periods: (a) flood season, (b) drawdown period, and (c) impoundment period.
In the flood season, the section from Fengjie to the TGD was identified as a sensitive area, spanning a river length of 168 km, which constituted 27.8% of the total river length. The area from Qingxichang to Fengjie was classified as a sub-sensitive area, covering 300 km (49.7% of the total river length). Finally, the segment from Cuntan to Qingxichang was designated as an insensitive area, with a river length of 136 km, accounting for 22.5% of the total river length. This scenario reflects the influence of operational strategies on water level dynamics.
During the drawdown period, the sensitive area extended from Qingxichang to the TGD, covering 468 km (77.5% of the total river length), marking the largest sensitive zone. The sub-sensitive area during this period ranged from Changshou to Qingxichang, covering a distance of 136 km (22.5% of the total river length). These variations highlight the changing impact of water level management across the reservoir.
In the impoundment period, the sensitive area was from Badong to the TGD, covering 76 km (12.6% of the total river length). The sub-sensitive area extended from Zhongxian to Badong, covering 288 km (47.7% of the total river length). Additionally, the river channel from Cuntan to Zhongxian was identified as the insensitive area, spanning 240 km (39.7% of the total river length). This distribution was primarily due to the lower discharge rates during this period. Contrary to common expectations, the sensitive area in the impoundment period was smaller than in the flood season, mainly because the upstream section is more influenced by inflow and less influenced by the backwater effect of the reservoir. However, if the discharge exceeds inflow, the extent of the impact of water level scheduling increases, highlighting the complexity of managing reservoir operations.
This correlation analysis underscores the importance of tailoring reservoir management strategies to the specific dynamics of each operational period, ensuring an optimal balance between water resource utilization and environmental conservation.
3.2. Surface Water Temperature Variability under Different Scenarios
As depicted in Figure 6, surface water temperatures in the TGR display varying patterns under different operational scenarios, with each scenario revealing its unique characteristics.
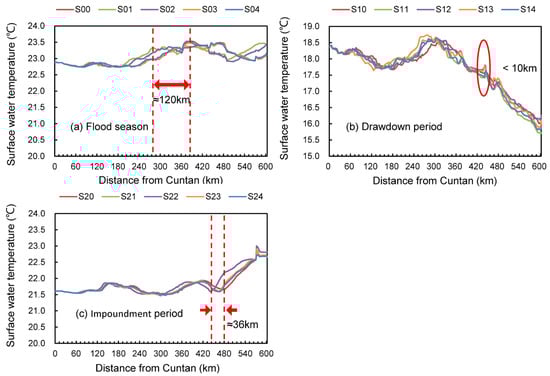
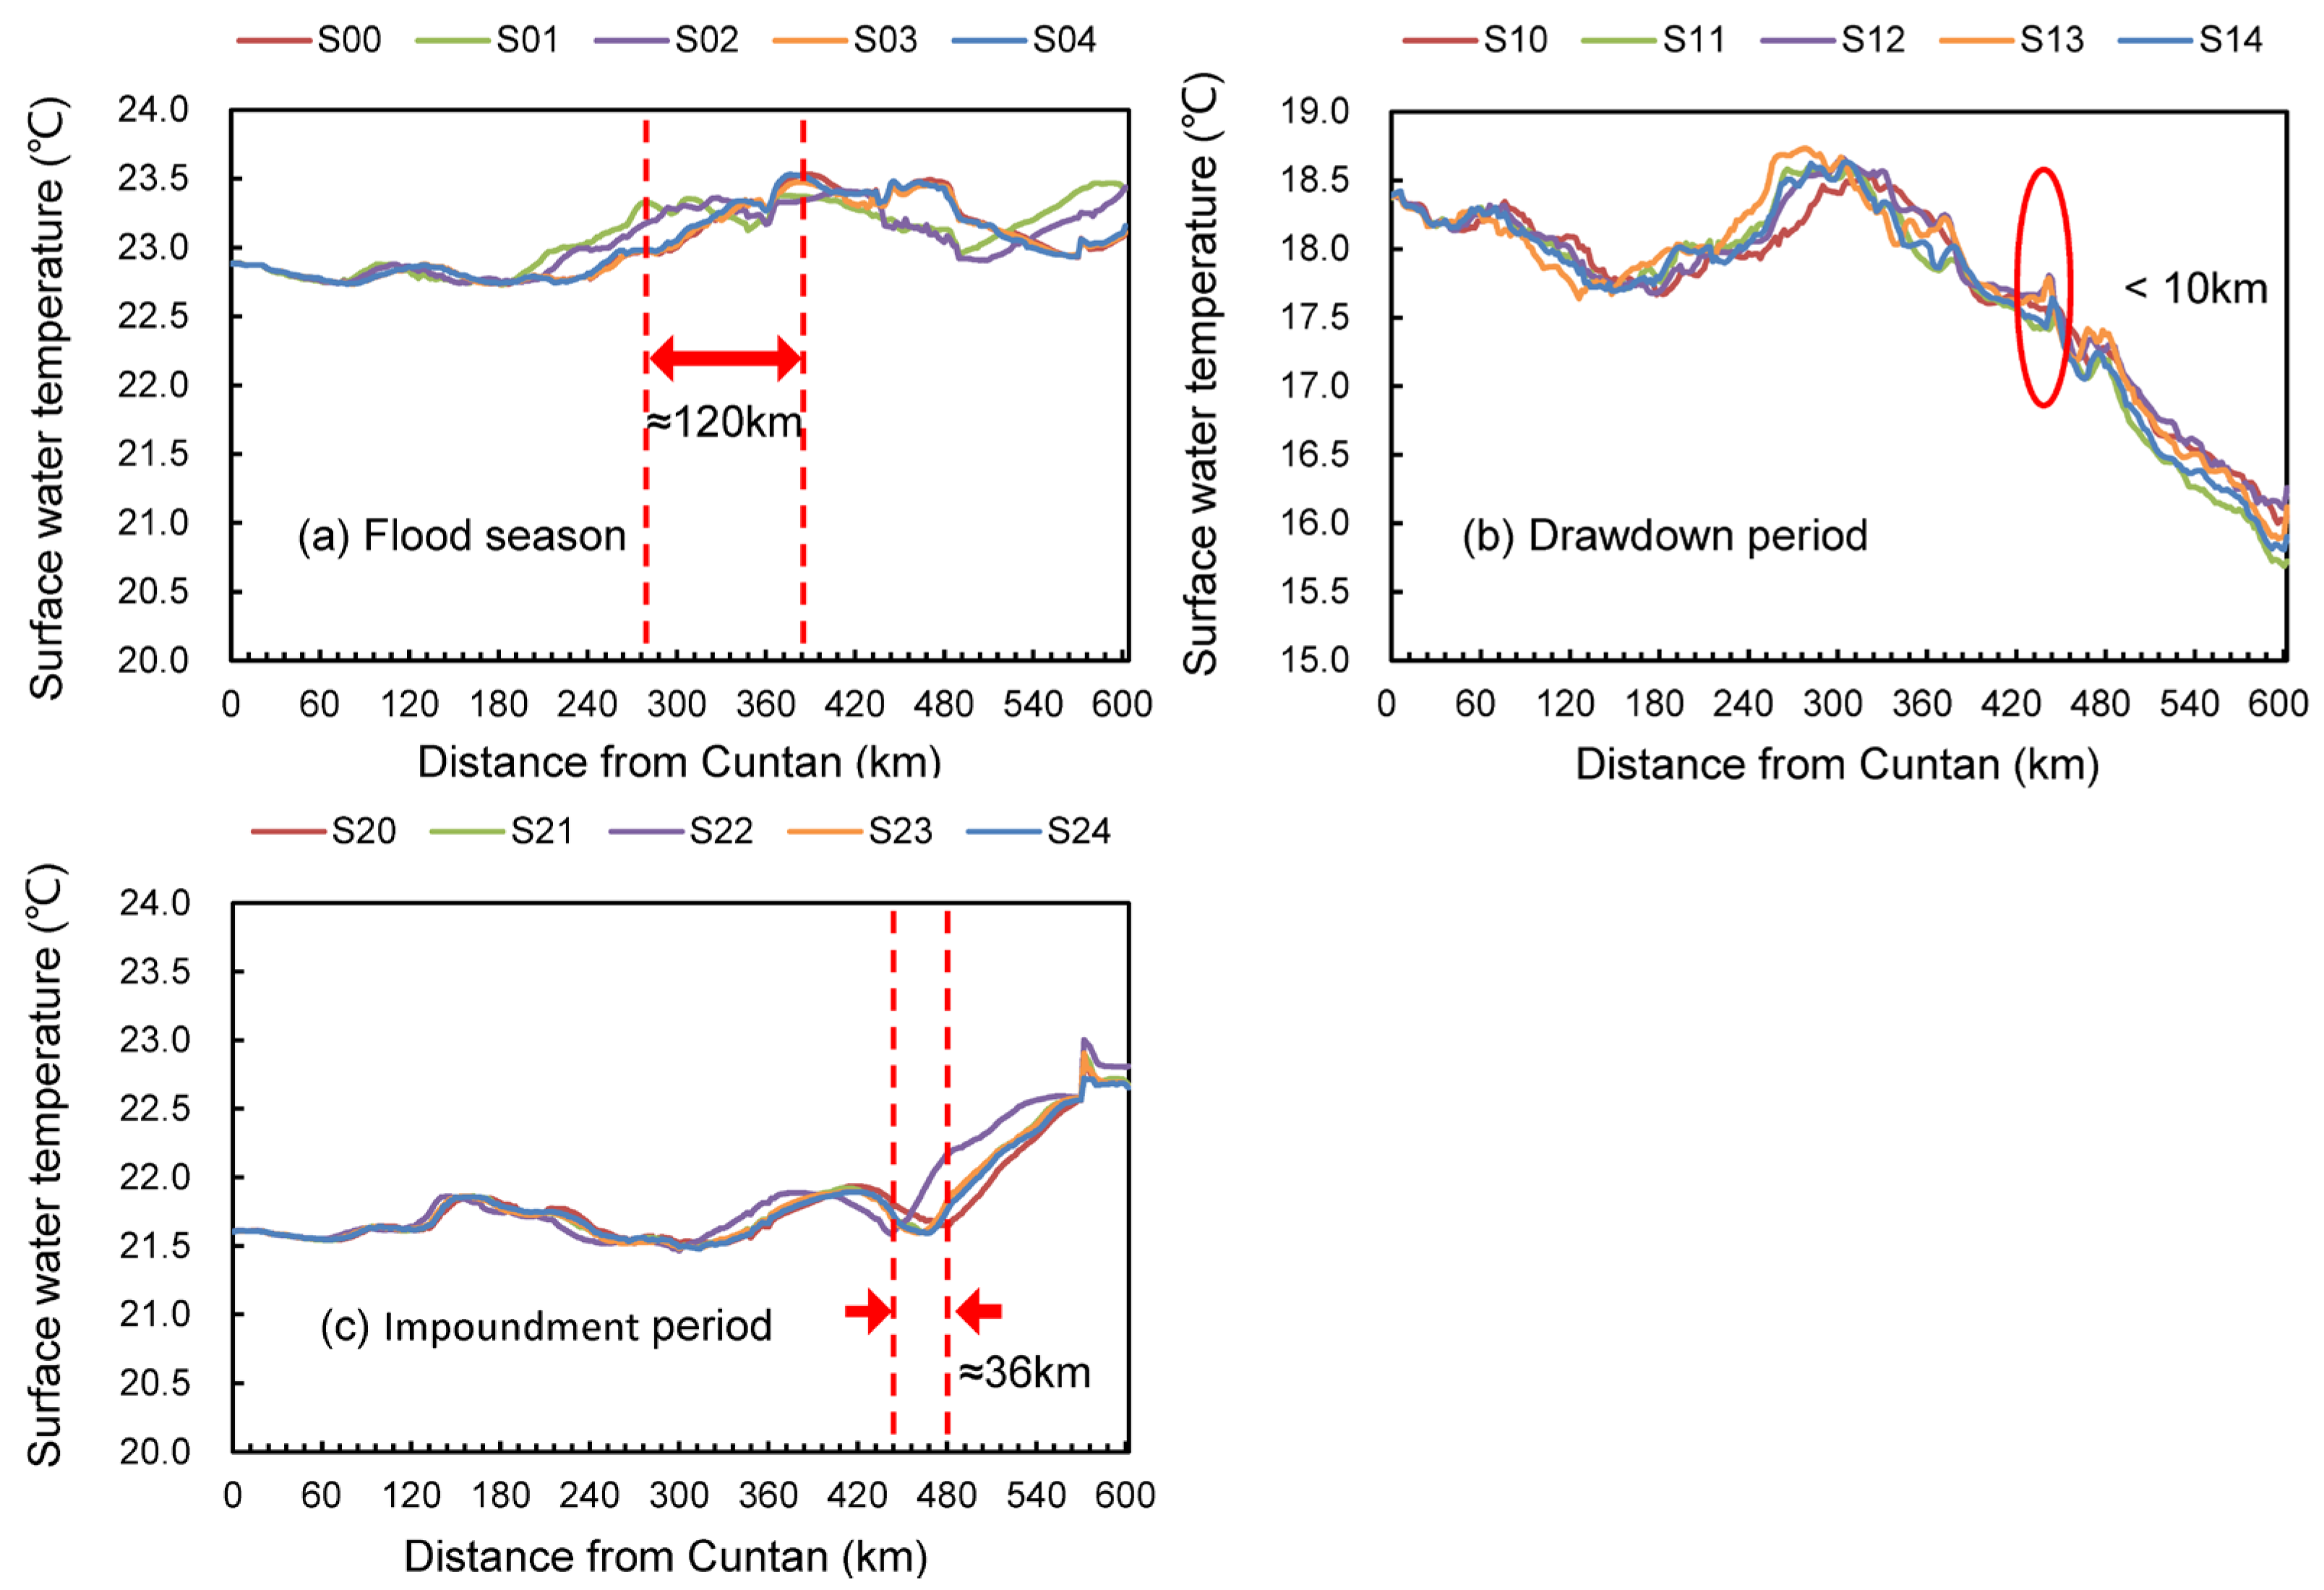
Figure 6.
Surface water temperature in different scenarios: (a) flood season, (b) drawdown period, and (c) impoundment period.
- (a)
- Flood Season Analysis:
The flood season revealed similar temperature change patterns under five regulation conditions, with comparable highest, lowest, and average surface temperatures. The spatial distribution of temperatures, including the location of peak temperatures and the high-temperature zone, was influenced by water level processes, but not significantly by water level fluctuations during the scheduling period.
In S01 to S04, water levels in the TGR exceeded the 145 m benchmark observed in the baseline S00. This indicates higher water storage in these scenarios compared to baseline. Temperature Waves: A notable feature in these scenarios (S01–S04) was the delayed propagation of surface water temperature waves compared to the baseline S00. Interestingly, a direct relationship was observed; higher water levels corresponded to a slower transfer speed of the temperature wave. When the water level in front of the dam rose by 10 m (comparing S01 with S00), the propagation of the temperature wave from upstream to downstream was delayed over a range of approximately 120 km.
- (b)
- Drawdown Period Analysis:
The spatial distribution of surface water temperature in the mainstream during the drawdown period remained consistent across different regulation conditions, with stability upstream and a downward trend midstream and downstream. The highest and average surface temperatures varied minimally (<0.2 °C), and the lowest temperature difference was small (<0.4 °C). The temperature in front of the dam was more influenced by water level fluctuations than by final water level height. For instance, scenarios 10 and 12, both ending at 159.2 m, exhibited a 0.6 °C temperature difference in front of the dam due to differing water level trajectories.
Across all five regulation schemes (S10 to S14), a consistent observation was the minimal fluctuation in the reservoir’s water volume. The consistency in water volume led to uniformity in surface water temperature waves across these scenarios. The spatial difference in the phase of temperature waves was essentially negligible, not exceeding 10 km, because of the minimal differences in water volume during the drawdown period.
- (c)
- Impoundment Period Analysis:
The water temperature trends observed during the impoundment period showed similarities to those in the flood season. During the impoundment period, when the water level in front of the dam rises (using S20 as a benchmark), the delay in the propagation of the water temperature wave along the river at the end of the regulation period ranged from 15 to 36 km. The maximum spatial delay occurred in scenario S22, as this scenario maintained a daily fluctuation of 1 m/d for continuous storage over 15 days, whereas other scenarios experienced a slowdown in the rate of water storage.
3.3. Variation of Vertical Water Temperature in Different Scenarios
Variations in water temperature within the TGR were noticeable, both vertically and longitudinally (Figure 7), and were significantly influenced by different operational scenarios.
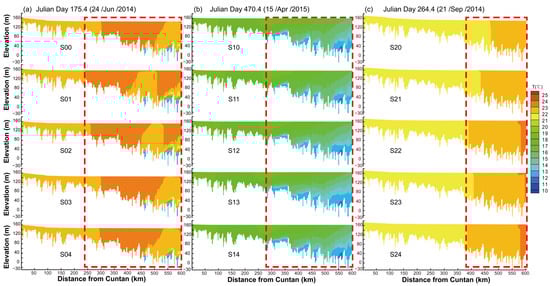
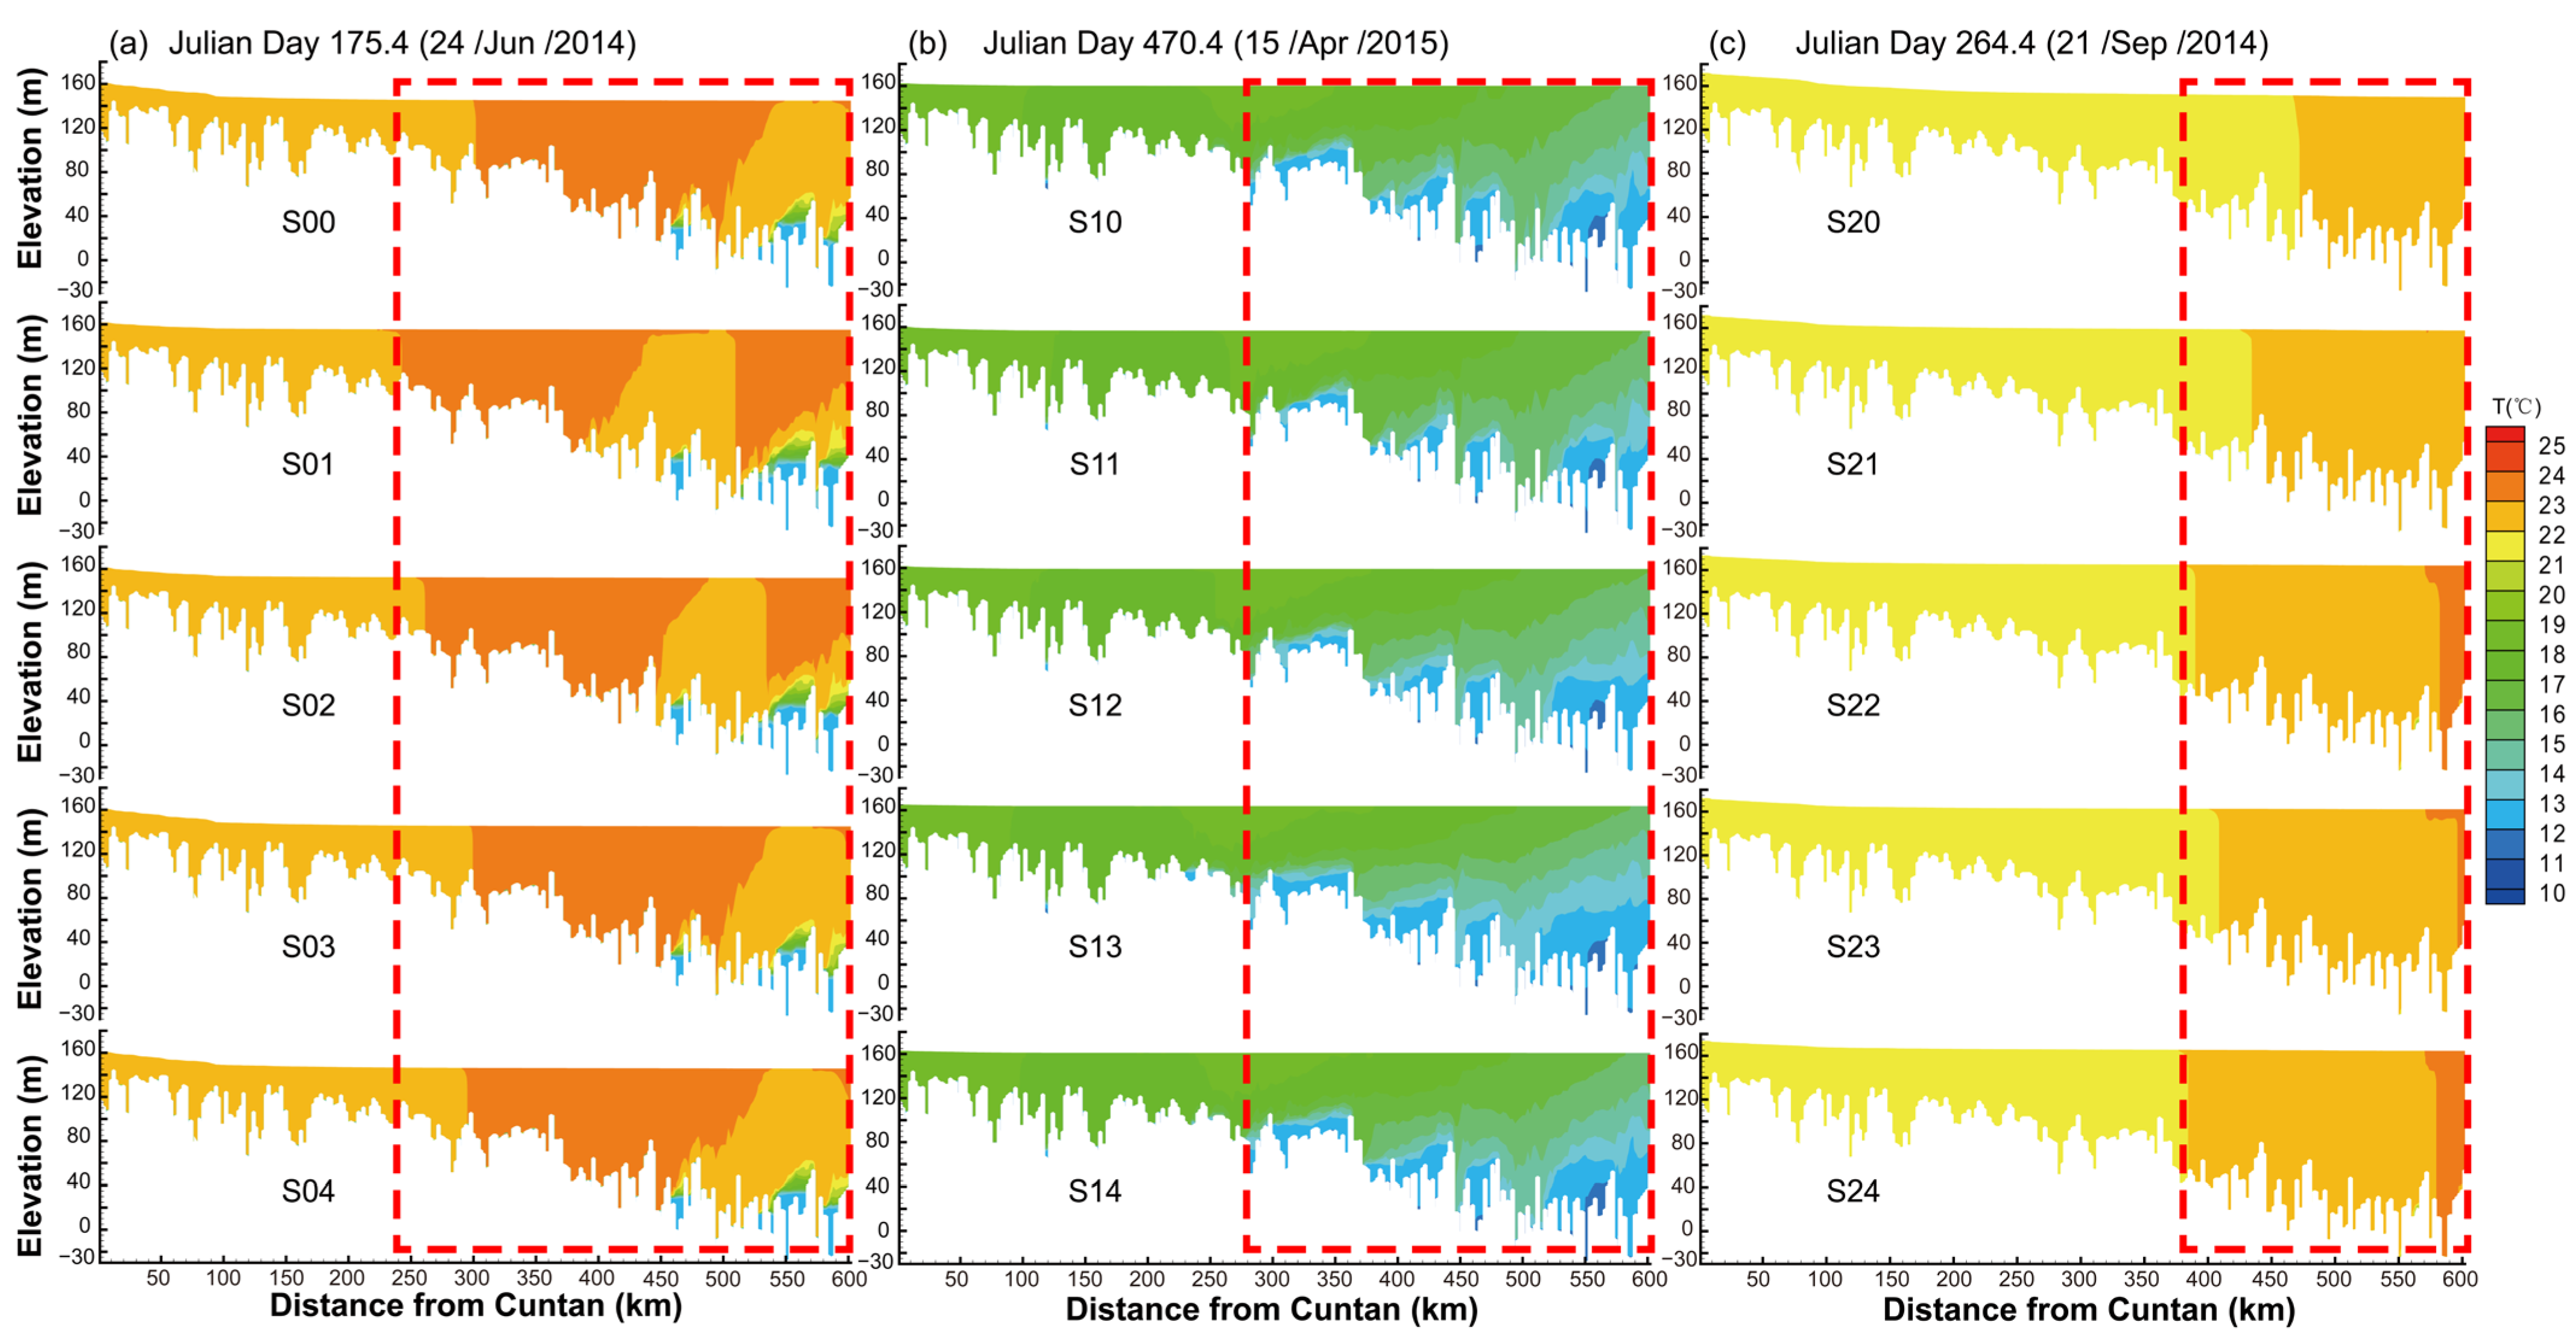
Figure 7.
Water temperature longitudinal profile after different scenarios: (a) flood season, Julian Day = 175.4, (b) drawdown period, Julian Day = 470.4, and (c) impoundment period, Julian Day = 264.4.
During the flood season, under five conditions (S00–S04), the TGR exhibited consistent vertical temperature conditions. In the upstream sections, the water temperature was almost uniformly mixed, showing negligible vertical stratification. However, a dispersion phenomenon occurred in the vertical temperature profile, resulting in temporary stratification in some parts of the river, such as the middle section of the reservoir. This is attributed to the discharge of water from the mid-upper layer of the reservoir, leading to faster surface water flow compared to the bottom layer. Each condition presented specific stratification profiles, with onset points ranging from 455 km to 462 km and peak stratification occurring between 550 km and 560 km. The differences in water temperature between the surface and bottom layers varied, with maximum differences reaching up to 11.98 °C, although variations near the dam were generally minimal, usually under 1 °C.
During the drawdown period, similar conditions were observed under five different conditions (S10–S14), characterized by upstream temperature homogeneity and downstream stratification. Stratification onset points shifted from around 280 km to 310 km, with peaks up to 560 km, and temperature differences ranged from 4.16 °C to 5.97 °C. The temperature differential near the dam was more significant, reaching up to 2.8 °C. The trend of outflow exceeding inflow during this period implies that operational scheduling only alters the length of the stratified section without significantly impacting the vertical temperature structure.
During the impoundment period, stratification was minimal. However, longitudinal temperature distribution was evident, influenced by water level variations. In conditions S22 to S24, higher water levels led to clearer stratification layers, marked by localized high surface temperatures extending from the CJXX to the dam front (approximately 32 km river length). For both the flood season and impoundment periods, our results showed that if the water level remained constant, temperature variations occurred longitudinally along the river. During rising water conditions, an “S”-shaped thermal stratification formed near the dam, caused by the strengthening backwater effects (S01, S02, and S22, S23, S24).
4. Discussion
4.1. Modeling Backwater Fluctuations: Implications, Challenges and Perspectives
The backwater region presents an interesting characteristic; it is like a natural river at low water levels and transforms into a reservoir-like state at higher water levels. This characteristic poses unique challenges for reservoir simulation and water quality management. Typically, such reservoir simulations assume a uniform water level [20]; however, natural rivers exhibit a gradient on the water surface [31]. This condition becomes particularly crucial in the case of water quality and resource management for the TGR.
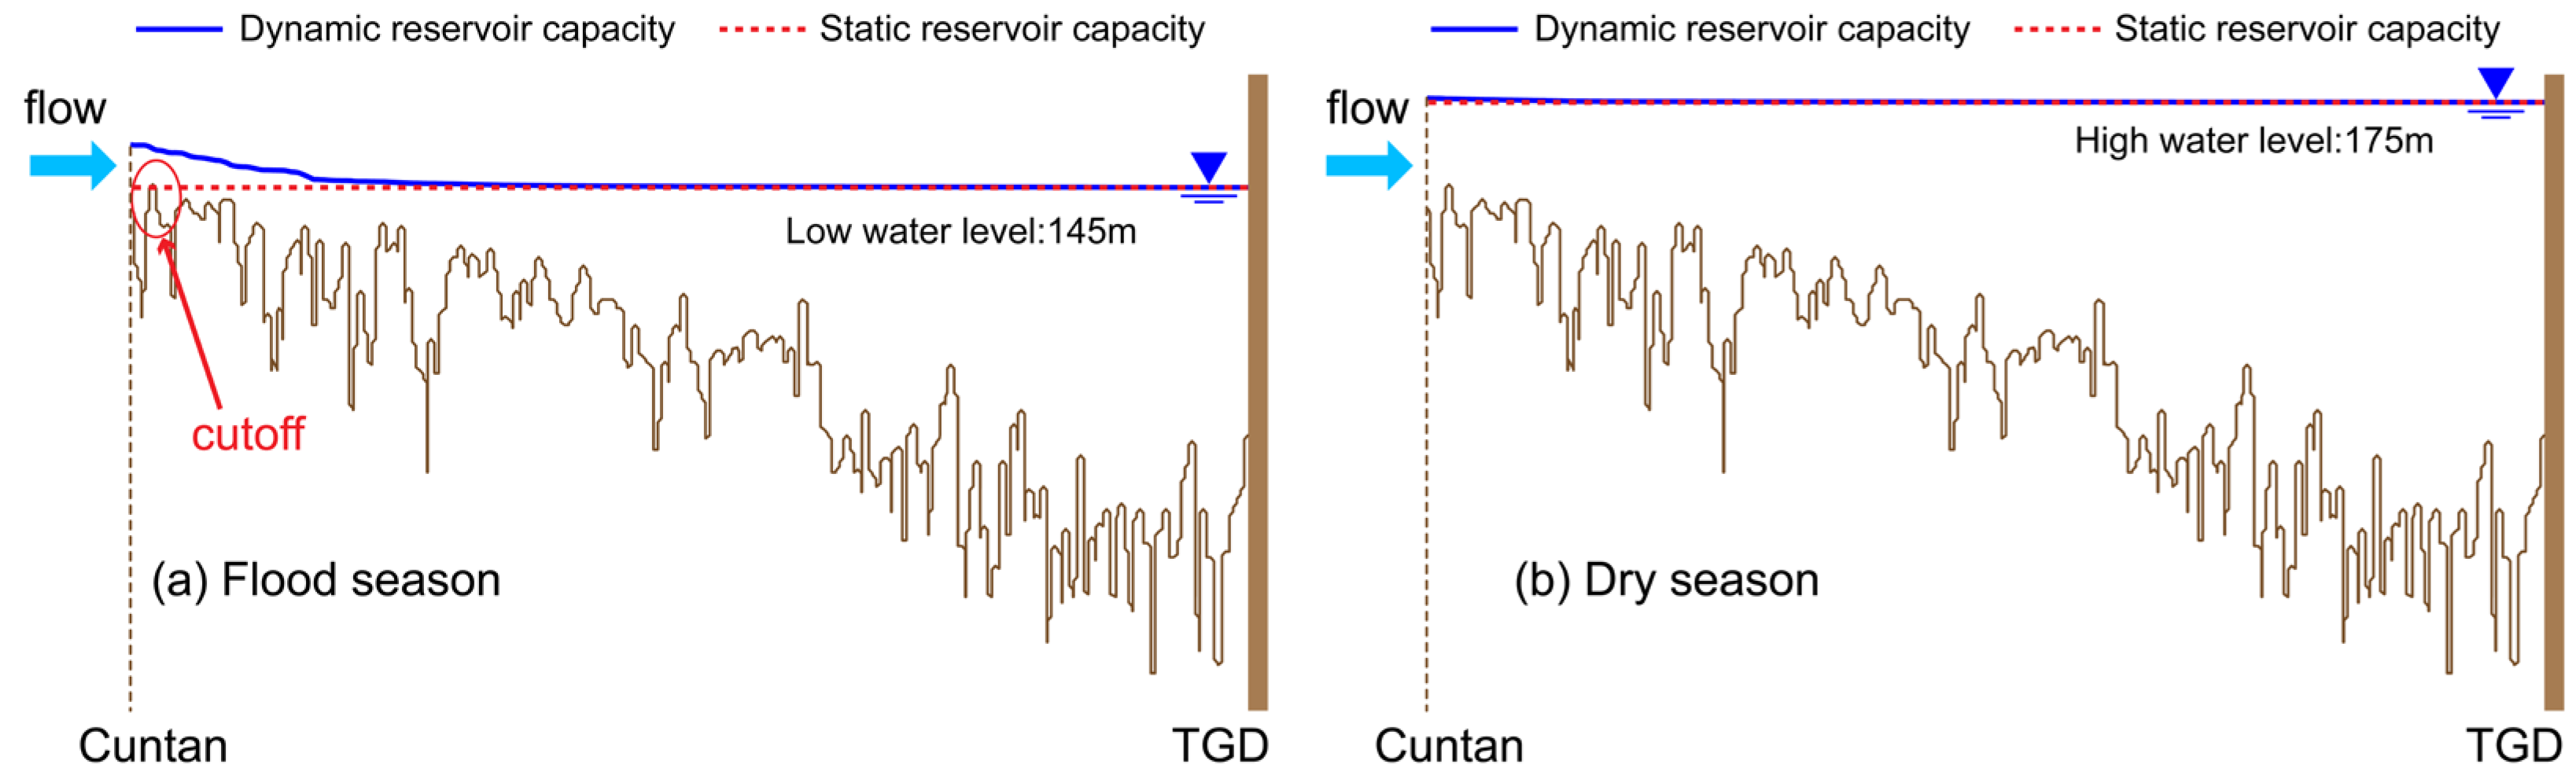
Ignoring the variations of the fluctuating backwater region during simulations can lead to significant errors [32,33]. This is particularly evident when considering the reservoir’s capacity. Simulated estimates (or static capacity) may not accurately reflect the actual capacity (or dynamic capacity), especially at lower water levels. This discrepancy can be attributed to factors such as the elevation at the riverbed’s base at the end of the TGR. During low water level periods, the error in estimating water levels becomes non-negligible. In some scenarios, this can even result in a complete disruption of the flow, underscoring the need for more detailed modeling approaches that account for the variation of the backwater region (Figure 8).

Figure 8.
Dynamic and static reservoir capacity of TGR under different water levels: (a) flood season and (b) dry season.
Our results highlight the complexities of modeling dynamic water systems like the TGR and underscore the importance of integrating natural river characteristics into simulation models for more accurate and effective reservoir water resource and water quality management. However, the reliability of these results depends on the suitability of the modeling data. Over the course of long-term reservoir operation, sedimentation will occur and alter the bottom topography, thereby impacting the hydrodynamic characteristics of the reservoir area. It is reasonable for this TGR model to match the simulation period of the model with the bathymetric data surveyed in 2013, spanning from 1 May 2014 to 30 April 2015. The topographic data will need to be updated accordingly if there are any updates made to the study period.
4.2. Role of Reservoir Operations on Tributaries in Different Sensibility Zones
The sensitivity zones of different tributary estuaries vary across seasons, as does their susceptibility to fluctuations in water levels upstream of the dam. Firstly, the XXR falls within a highly responsive area during all three periods and exhibits extreme sensitivity to water level fluctuations in the TGR. This forms the basis for ecological operation and algae control measures in the XXR. Secondly, the representative tributaries in the middle and at the end of the reservoir are only sensitive during the drawdown period, such as XJ and LH, respectively. Therefore, if environmental issues like algal blooms arise in spring within these rivers, emergency regulations can be implemented through water level adjustments. During the flood season and impoundment period, however, this approach may not be effective; other alternative methods for environmental governance are required.
How does reservoir scheduling impact the water environment conditions of different tributaries? There are two aspects to consider. Firstly, water level fluctuations affect various estuaries located within distinct sensitive areas with varying potential energy [34]. Secondly, water temperature waves accelerate or decelerate propagation processes along the main stream due to operations at the TGR resulting in increased or decreased temperatures at river mouths, thereby influencing water exchange patterns among major tributaries.
XXR experiences thermal stratification for the majority of the year [35]. Lakes often display static stratification [36], while rivers, due to their high flow velocity, typically prevent stratification. However, reservoirs and especially their tributaries can manifest characteristics of both lakes and rivers. This unique combination can lead to the formation of density currents [37,38]. The depth of the intrusion layer is dictated by the temperature differential between the intrusion flow and the existing stratification in the bay [26,39,40,41].
Notably, the depth of this intrusion layer is influenced by water level fluctuations. For instance, density currents shifted from the middle to the surface layer during rising water levels [39]. Such shifts are crucial since only these transfers can effectively mitigate algal blooms in XXR. In this study, we conducted a sensitivity analysis on the reservoir area impacted by the operations of the TGR during different periods, providing valuable support for enhancing and refining the TGR regulation rule. For instance, the flood limit water level (145 m) could be raised to help control blooms in XXR at appropriate times during the flood season. By reservoir scheduling to induce these shifts, it provides an innovative yet straightforward strategy for algal bloom management. This approach essentially converges on the concept of ecology operation.
With the development of cascade hydropower projects and more attention to the ecological environment, the ability of reservoirs to effectively balance eco-environmental and dynamoelectric benefits through operational strategies is a matter of significant concern for all stakeholders involved [42]. There have been relevant studies on the impact of reservoir operations on aquatic ecosystems of tributaries [3,43] and the enhancement of tributary water environments through these operations [44].
5. Conclusions
This current study presents a thorough examination of the water level and temperature of the TGR on the Yangtze River. We analyzed the effects of reservoir operations on hydraulic characteristics, with a focus on the TGR’s backwater region. We conclude that:Large reservoir modeling research needs to consider dynamic storage capacity to achieve higher accuracy and to better reflect real conditions.
- (1)
- During different operational periods of the reservoir, the range of areas affected by changing water levels varies. The sensitive zone is largest during the drawdown period (468 km river channel), making it more feasible to achieve ecological benefits through operational regulation. Conversely, during the impoundment period, the sensitive zone is the smallest (76 km river channel), posing challenges for enhancing ecological and environmental benefits through operational regulations. During the flood season, the sensitive zone is moderate in size (168 km river channel), but ecological and environmental benefits need to be considered with priority of ensuring flood control objectives.
- (2)
- The fluctuation in reservoir water levels alters the propagation speed of surface temperature waves in the river direction by increasing or decreasing the water volume. The propagation of surface water temperature waves from upstream to downstream could be delayed over a range of approximately 120 km in the flood season and could be delayed by about 36 km in the impoundment period. However, the spatial difference in the phase of temperature waves did not exceed 10 km during the drawdown period.
- (3)
- The study of surface and vertical water temperature variabilities revealed different patterns across the flood season, drawdown, and impoundment periods. In most cases, the vertical water temperature in the TGR was well-mixed, but occasionally, short-term stratification occurred due to the flow velocity among the surface, middle, and bottom layers.
In summary, our research offers a comprehensive understanding of the TGR’s hydrodynamic and thermal characteristics during short-term scheduling. These insights provide significant scientific evidence for developing effective reservoir management strategies, beneficial for the TGR and other large-scale reservoirs worldwide.
Supplementary Materials
The following supporting information can be downloaded at https://www.mdpi.com/article/10.3390/w16142045/s1, Figure S1: Inflows and outflows; Figure S2: Air temperature and dew point temperature in typical weather stations of TGR; Figure S3: Wind rose diagrams in typical weather stations of TGR; Figure S4: Comparisons of the simulated and observed water level; Figure S5: Comparisons of the simulated and observed surface water temperature; Table S1: Location and data information; Table S2: Location and data information. References [45,46] were cited in the Supplementary Materials.
Author Contributions
Y.X.: writing—original draft, conceptualization, software, validation, formal analysis, writing—review and editing. S.Y.: writing—original draft, writing—review and editing. D.L.: supervision, writing—review and editing. J.M.: software. M.C.: writing—review and editing. All authors have read and agreed to the published version of the manuscript.
Funding
This work was supported by the National Natural Science Foundation of China (Grant Nos. U2040220, 52179065), the Natural Science Foundation of Hubei Province, China (No.2024AFD369), the Open Project Funding of Key Laboratory of Intelligent Health Perception and Ecological Restoration of Rivers and Lakes, Ministry of Education, Hubei University of Technology (HGKFZ01), the Innovation Demonstration Base of Ecological Environment Geotechnical and Ecological Restoration of Rivers and Lakes (2020EJB004), and the Major Science and Technology Program of The Ministry of Water Resources (SKS-2022077).
Data Availability Statement
The data presented in this study are available on request from the corresponding author.
Acknowledgments
The writers acknowledge engineers in China Three-gorge Corporation for their help with data collection. The writers also acknowledge the assistance of anonymous reviewers.
Conflicts of Interest
The authors declare no conflicts of interest.
References
- Benjankar, R.; Tonina, D.; McKean, J.A.; Sohrabi, M.M.; Chen, Q.; Vidergar, D. Dam Operations May Improve Aquatic Habitat and Offset Negative Effects of Climate Change. J. Environ. Manag. 2018, 213, 126–134. [Google Scholar] [CrossRef] [PubMed]
- Smucker, N.J.; Beaulieu, J.J.; Nietch, C.T.; Young, J.L. Increasingly Severe Cyanobacterial Blooms and Deep Water Hypoxia Coincide with Warming Water Temperatures in Reservoirs. Glob. Chang. Biol. 2021, 27, 2507–2519. [Google Scholar] [CrossRef] [PubMed]
- Zarfl, C.; Lumsdon, A.E.; Berlekamp, J.; Tydecks, L.; Tockner, K. A Global Boom in Hydropower Dam Construction. Aquat. Sci. 2015, 77, 161–170. [Google Scholar] [CrossRef]
- Grill, G.; Lehner, B.; Thieme, M.; Geenen, B.; Tickner, D.; Antonelli, F.; Babu, S.; Borrelli, P.; Cheng, L.; Crochetiere, H.; et al. Mapping the World’s Free-Flowing Rivers. Nature 2019, 569, 215–221. [Google Scholar] [CrossRef] [PubMed]
- Maavara, T.; Chen, Q.; Van Meter, K.; Brown, L.E.; Zhang, J.; Ni, J.; Zarfl, C. River Dam Impacts on Biogeochemical Cycling. Nat. Rev. Earth Environ. 2020, 1, 103–116. [Google Scholar] [CrossRef]
- Wang, Y.; Zhang, N.; Wang, D.; Wu, J.; Zhang, X. Investigating the Impacts of Cascade Hydropower Development on the Natural Flow Regime in the Yangtze River, China. Sci. Total Environ. 2018, 624, 1187–1194. [Google Scholar] [CrossRef] [PubMed]
- Zhang, P.; Yang, Z.; Cai, L.; Qiao, Y.; Chen, X.; Chang, J. Effects of Upstream and Downstream Dam Operation on the Spawning Habitat Suitability of Coreius Guichenoti in the Middle Reach of the Jinsha River. Ecol. Eng. 2018, 120, 198–208. [Google Scholar] [CrossRef]
- Wu, H.; Chen, J.; Xu, J.; Zeng, G.; Sang, L.; Liu, Q.; Yin, Z.; Dai, J.; Yin, D.; Liang, J.; et al. Effects of Dam Construction on Biodiversity: A Review. J. Clean. Prod. 2019, 221, 480–489. [Google Scholar] [CrossRef]
- Song, J.-H.; Ma, L.; Her, Y.; Li, Y. Immediate Influences of a Large Dam Construction on Local Storm Event Patterns and Weather Variables: A Case Study of the Three Gorges Project. Weather 2020, 75, 99–103. [Google Scholar] [CrossRef]
- Barbarossa, V.; Schmitt, R.J.P.; Huijbregts, M.A.J.; Zarfl, C.; King, H.; Schipper, A.M. Impacts of Current and Future Large Dams on the Geographic Range Connectivity of Freshwater Fish Worldwide. Proc. Natl. Acad. Sci. USA 2020, 117, 3648–3655. [Google Scholar] [CrossRef] [PubMed]
- Yu, Z.; Wang, L. Factors Influencing Thermal Structure in a Tributary Bay of Three Gorges Reservoir. J. Hydrodyn. 2011, 23, 407–415. [Google Scholar] [CrossRef]
- Winemiller, K.O.; McIntyre, P.B.; Castello, L.; Fluet-Chouinard, E.; Giarrizzo, T.; Nam, S.; Baird, I.G.; Darwall, W.; Lujan, N.K.; Harrison, I.; et al. Balancing Hydropower and Biodiversity in the Amazon, Congo, and Mekong. Science 2016, 351, 128–129. [Google Scholar] [CrossRef] [PubMed]
- Yang, H.; Guo, W.; Wang, H. Anthropogenic Intensification of the Eco-Hydrothermal Regime Transition in Regulated Rivers: The Cumulative Effect of Cascade Reservoirs. J. Environ. Manag. 2024, 349, 119478. [Google Scholar] [CrossRef] [PubMed]
- Liu, D.; Yang, Z.; Ji, D.; Ma, J.; Cui, Y.; Song, L. A Review on the Mechanism and Its Controlling Methods of the Algal Blooms in the Tributaries of Three Gorges Reservoir. J. Hydraul. Eng. 2016, 47, 443–454. (In Chinese) [Google Scholar] [CrossRef]
- Wang, L.; Li, H.; Yang, Z.; Zhang, J.; Deng, C.; Yang, F.; Zheng, B. Four Effects of Water Environment Evolution in Early Period (2003–2012) after Impoundment of the Three Gorges Reservoir. Res. Environ. Sci. 2020, 33, 1109–1118. (In Chinese) [Google Scholar] [CrossRef]
- Cai, Q.; Hu, Z. Studies on Eutrophication Problem and Control Strategy in the Three Gorges Reservoir. Acta Hydrobiol. Sin. 2006, 30, 7–11. (In Chinese) [Google Scholar] [CrossRef]
- Blaen, P.J.; Hannah, D.M.; Brown, L.E.; Milner, A.M. Water Temperature Dynamics in High Arctic River Basins. Hydrol. Process. 2013, 27, 2958–2972. [Google Scholar] [CrossRef]
- Sun, Y.; Tang, D.; Dai, H.; Liu, P.; Sun, Y.; Cui, Q.; Zhang, F.; Ding, Y.; Wei, Y.; Zhang, J.; et al. A Real-Time Operation of the Three Gorges Reservoir with Flood Risk Analysis. Water Sci. Technol.-Water Supply 2016, 16, 551–562. [Google Scholar] [CrossRef]
- Xu, Y.; Guo, X.; Dan, Y.; Yang, Z.; Ma, J.; Liu, D.; Xu, Y. Impact of Cascade Reservoirs on Continuity of River Water Temperature: A Temperature Trend Hypothesis in River. Hydrol. Process. 2021, 35, e13994. [Google Scholar] [CrossRef]
- Cole, T.M.; Wells, S.A. CE-QUAL-W2: A Two-Dimensional, Later-Ally Averaged, Hydrodynamic and Water Quality Model, Version 4.0 User Manual; Department of Civil and Environmental Engineering, Portland State University: Portland, OR, USA, 2016. [Google Scholar]
- Al-Murib, M.D.; Wells, S.A. Hydrodynamic and Total Dissolved Solids Model of the Tigris River Using CE-QUAL-W2. Environ. Process. 2019, 6, 619–641. [Google Scholar] [CrossRef]
- Berger, C.; Wells, S.A.; Annear, R.L. Laurance Lake Temperature Model; Technical Report EWR-01-04; Water Quality Research Group, Department of Civil and Environmental Engineering, Portland State University: Portland, OR, USA, 2005. [Google Scholar]
- Wells, S.A.; Berger, C.J. Modeling the Response of Dissolved Oxygen to Phosphorus Loading in Lake Spokane. Lake Reserv. Manag. 2016, 32, 270–279. [Google Scholar] [CrossRef]
- Long, L.; Ji, D.; Liu, D.; Yang, Z.; Lorke, A. Effect of Cascading Reservoirs on the Flow Variation and Thermal Regime in the Lower Reaches of the Jinsha River. Water 2019, 11, 1008. [Google Scholar] [CrossRef]
- He, W.; Wang, H.; Zhang, J.; Xu, H.; Xiao, Y. Diurnal Variation Characteristics of Thermal Structure in a Deep Reservoir and the Effects of Selective Withdrawal. J. Environ. Manag. 2023, 333, 117459. [Google Scholar] [CrossRef] [PubMed]
- Ma, J.; Liu, D.; Wells, S.A.; Tang, H.; Ji, D.; Yang, Z. Modeling Density Currents in a Typical Tributary of the Three Gorges Reservoir, China. Ecol. Model. 2015, 296, 113–125. [Google Scholar] [CrossRef]
- Li, Y.; Sun, J.; Lin, B.; Liu, Z. Thermal-Hydrodynamic Circulations and Water Fluxes in a Tributary Bay of the Three Gorges Reservoir. J. Hydrol. 2020, 585, 124319. [Google Scholar] [CrossRef]
- Xu, Y.; Ma, J.; Yang, Z. Calibration of Kinetic Parameters and Numerical Simulation of Growth of Microcystis Aeruginosa Cultured in Laboratory. J. Ecol. Rural Environ. 2018, 34, 267–275. (In Chinese) [Google Scholar]
- Yang, Z.; Liu, D.; Ji, D.; Ma, J. Feasibility Study on Tide-Type Ecological Operation Method to Control Algal Bloom in Tributaries of Three Gorges Reservoir. Water Resour. Power 2015, 33, 48–50+109. (In Chinese) [Google Scholar]
- Zhang, Y.; Zheng, B.; Fu, G.; Liu, H. On the Assessment Methodology and Standards for Nutrition Status in Channel Type Reservoirs Based on Zoning of Eutrophication Sensitivity. Acta Sci. Circumstantiae 2006, 26, 1016–1021. (In Chinese) [Google Scholar] [CrossRef]
- Zhang, S.; Jing, Z.; Yi, Y.; Wu, Y.; Zhao, Y. The Dynamic Capacity Calculation Method and the Flood Control Ability of the Three Gorges Reservoir. J. Hydrol. 2017, 555, 361–370. [Google Scholar] [CrossRef]
- Jing, Z.; An, W.; Zhang, S.; Xia, Z. Flood Control Ability of River-Type Reservoirs Using Stochastic Flood Simulation and Dynamic Capacity Flood Regulation. J. Clean. Prod. 2020, 257, 120809. [Google Scholar] [CrossRef]
- Zhang, R.; Zhang, S.; Wen, X.; Jing, Z. Refined Scheduling Based on Dynamic Capacity Model for Short-Term Hydropower Generation. Water Resour. Manag. 2023, 37, 21–35. [Google Scholar] [CrossRef]
- Ji, D.; Zhou, Z.; Yang, Z.; Long, L.; Wang, Y. Study on the Gravity Wave Induced by the Diurnal Variation of Outflow Discharge in the Three Gorges Reservoir. J. Hydraul. Eng. 2021, 52, 111–119. (In Chinese) [Google Scholar] [CrossRef]
- Long, L.; Xu, H.; Yan, M.; Yang, X.; Zhao, X.; Ji, D.; Cui, Y.; Yang, Z.; Liu, D.; Yang, Z. Variable Drivers of Surface Turbulence under Condition of Stratified Density Currents in a Tributary Bay of Three Gorges Reservoir. J. Hydrol. 2023, 623, 129849. [Google Scholar] [CrossRef]
- Boehrer, B.; Schultze, M. Stratification of Lakes. Rev. Geophys. 2008, 46, RG2005. [Google Scholar] [CrossRef]
- Jin, J.; Wells, S.A.; Liu, D.; Yang, G.; Zhu, S.; Ma, J.; Yang, Z. Effects of Water Level Fluctuation on Thermal Stratification in a Typical Tributary Bay of Three Gorges Reservoir, China. PeerJ 2019, 7, e6925. [Google Scholar] [CrossRef]
- Noori, R.; Tian, F.; Ni, G.; Bhattarai, R.; Hooshyaripor, F.; Klöve, B. ThSSim: A Novel Tool for Simulation of Reservoir Thermal Stratification. Sci. Rep. 2019, 9, 18524. [Google Scholar] [CrossRef] [PubMed]
- Yang, Z.J.; Liu, D.F.; Ji, D.B.; Xiao, S.B. Influence of the Impounding Process of the Three Gorges Reservoir up to Water Level 172.5 m on Water Eutrophication in the Xiangxi Bay. Sci. China Technol. Sci. 2010, 53, 1114–1125. [Google Scholar] [CrossRef]
- Chuo, M.; Ma, J.; Liu, D.; Yang, Z. Effects of the Impounding Process during the Flood Season on Algal Blooms in Xiangxi Bay in the Three Gorges Reservoir, China. Ecol. Model. 2019, 392, 236–249. [Google Scholar] [CrossRef]
- Xu, Y.; Xu, P.; Yang, Z.; Liu, D.; Ma, J. Dynamic Replenishment Process of Nutrients in Tributary of Channel Reservoir. Environ. Sci. 2018, 39, 765–773. (In Chinese) [Google Scholar] [CrossRef]
- Xu, C.; Zhu, D.; Guo, W.; Ouyang, S.; Li, L.; Bu, H.; Wang, L.; Zuo, J.; Chen, J. Multi-Objective Ecological Long-Term Operation of Cascade Reservoirs Considering Hydrological Regime Alteration. Water 2024, 16, 1849. [Google Scholar] [CrossRef]
- Zhi, X.; Chen, L.; Chen, S.; Yu, J.; Jiang, J.; Xu, Y.; Li, L.; Meng, X.; Shen, Z. Heterogeneity and Influencing Factors of Algal Blooms in the Reservoir-Impacted Tributary: Evidence from Remote Sensing and Physical-Based Model. J. Hydrol. 2024, 634, 131058. [Google Scholar] [CrossRef]
- Zhang, H.; Chang, J.; Gao, C.; Wu, H.; Wang, Y.; Lei, K.; Long, R.; Zhang, L. Cascade Hydropower Plants Operation Considering Comprehensive Ecological Water Demands. Energy Convers. Manag. 2019, 180, 119–133. [Google Scholar] [CrossRef]
- MET4 and MET4A Calculation of Dew Point. Archived from the Original on 26 May 2012. Available online: https://archive.ph/20120526034637/http://www.paroscientific.com/dewpoint.htm (accessed on 7 October 2014).
- Barenbrug, A.W.T. Psychrometry and Psychrometric Charts, 3rd ed.; Cape and Transvaal Printers Ltd.: Cape Town, South Africa, 1974. [Google Scholar]

Disclaimer/Publisher’s Note: The statements, opinions and data contained in all publications are solely those of the individual author(s) and contributor(s) and not of MDPI and/or the editor(s). MDPI and/or the editor(s) disclaim responsibility for any injury to people or property resulting from any ideas, methods, instructions or products referred to in the content. |
© 2024 by the authors. Licensee MDPI, Basel, Switzerland. This article is an open access article distributed under the terms and conditions of the Creative Commons Attribution (CC BY) license (https://creativecommons.org/licenses/by/4.0/).