
Effect of Grain Size on the Uniaxial Compressive Strength of Ice Forming with Different Wind Speeds in a Cold Laboratory

Abstract
:1. Introduction
2. Methods
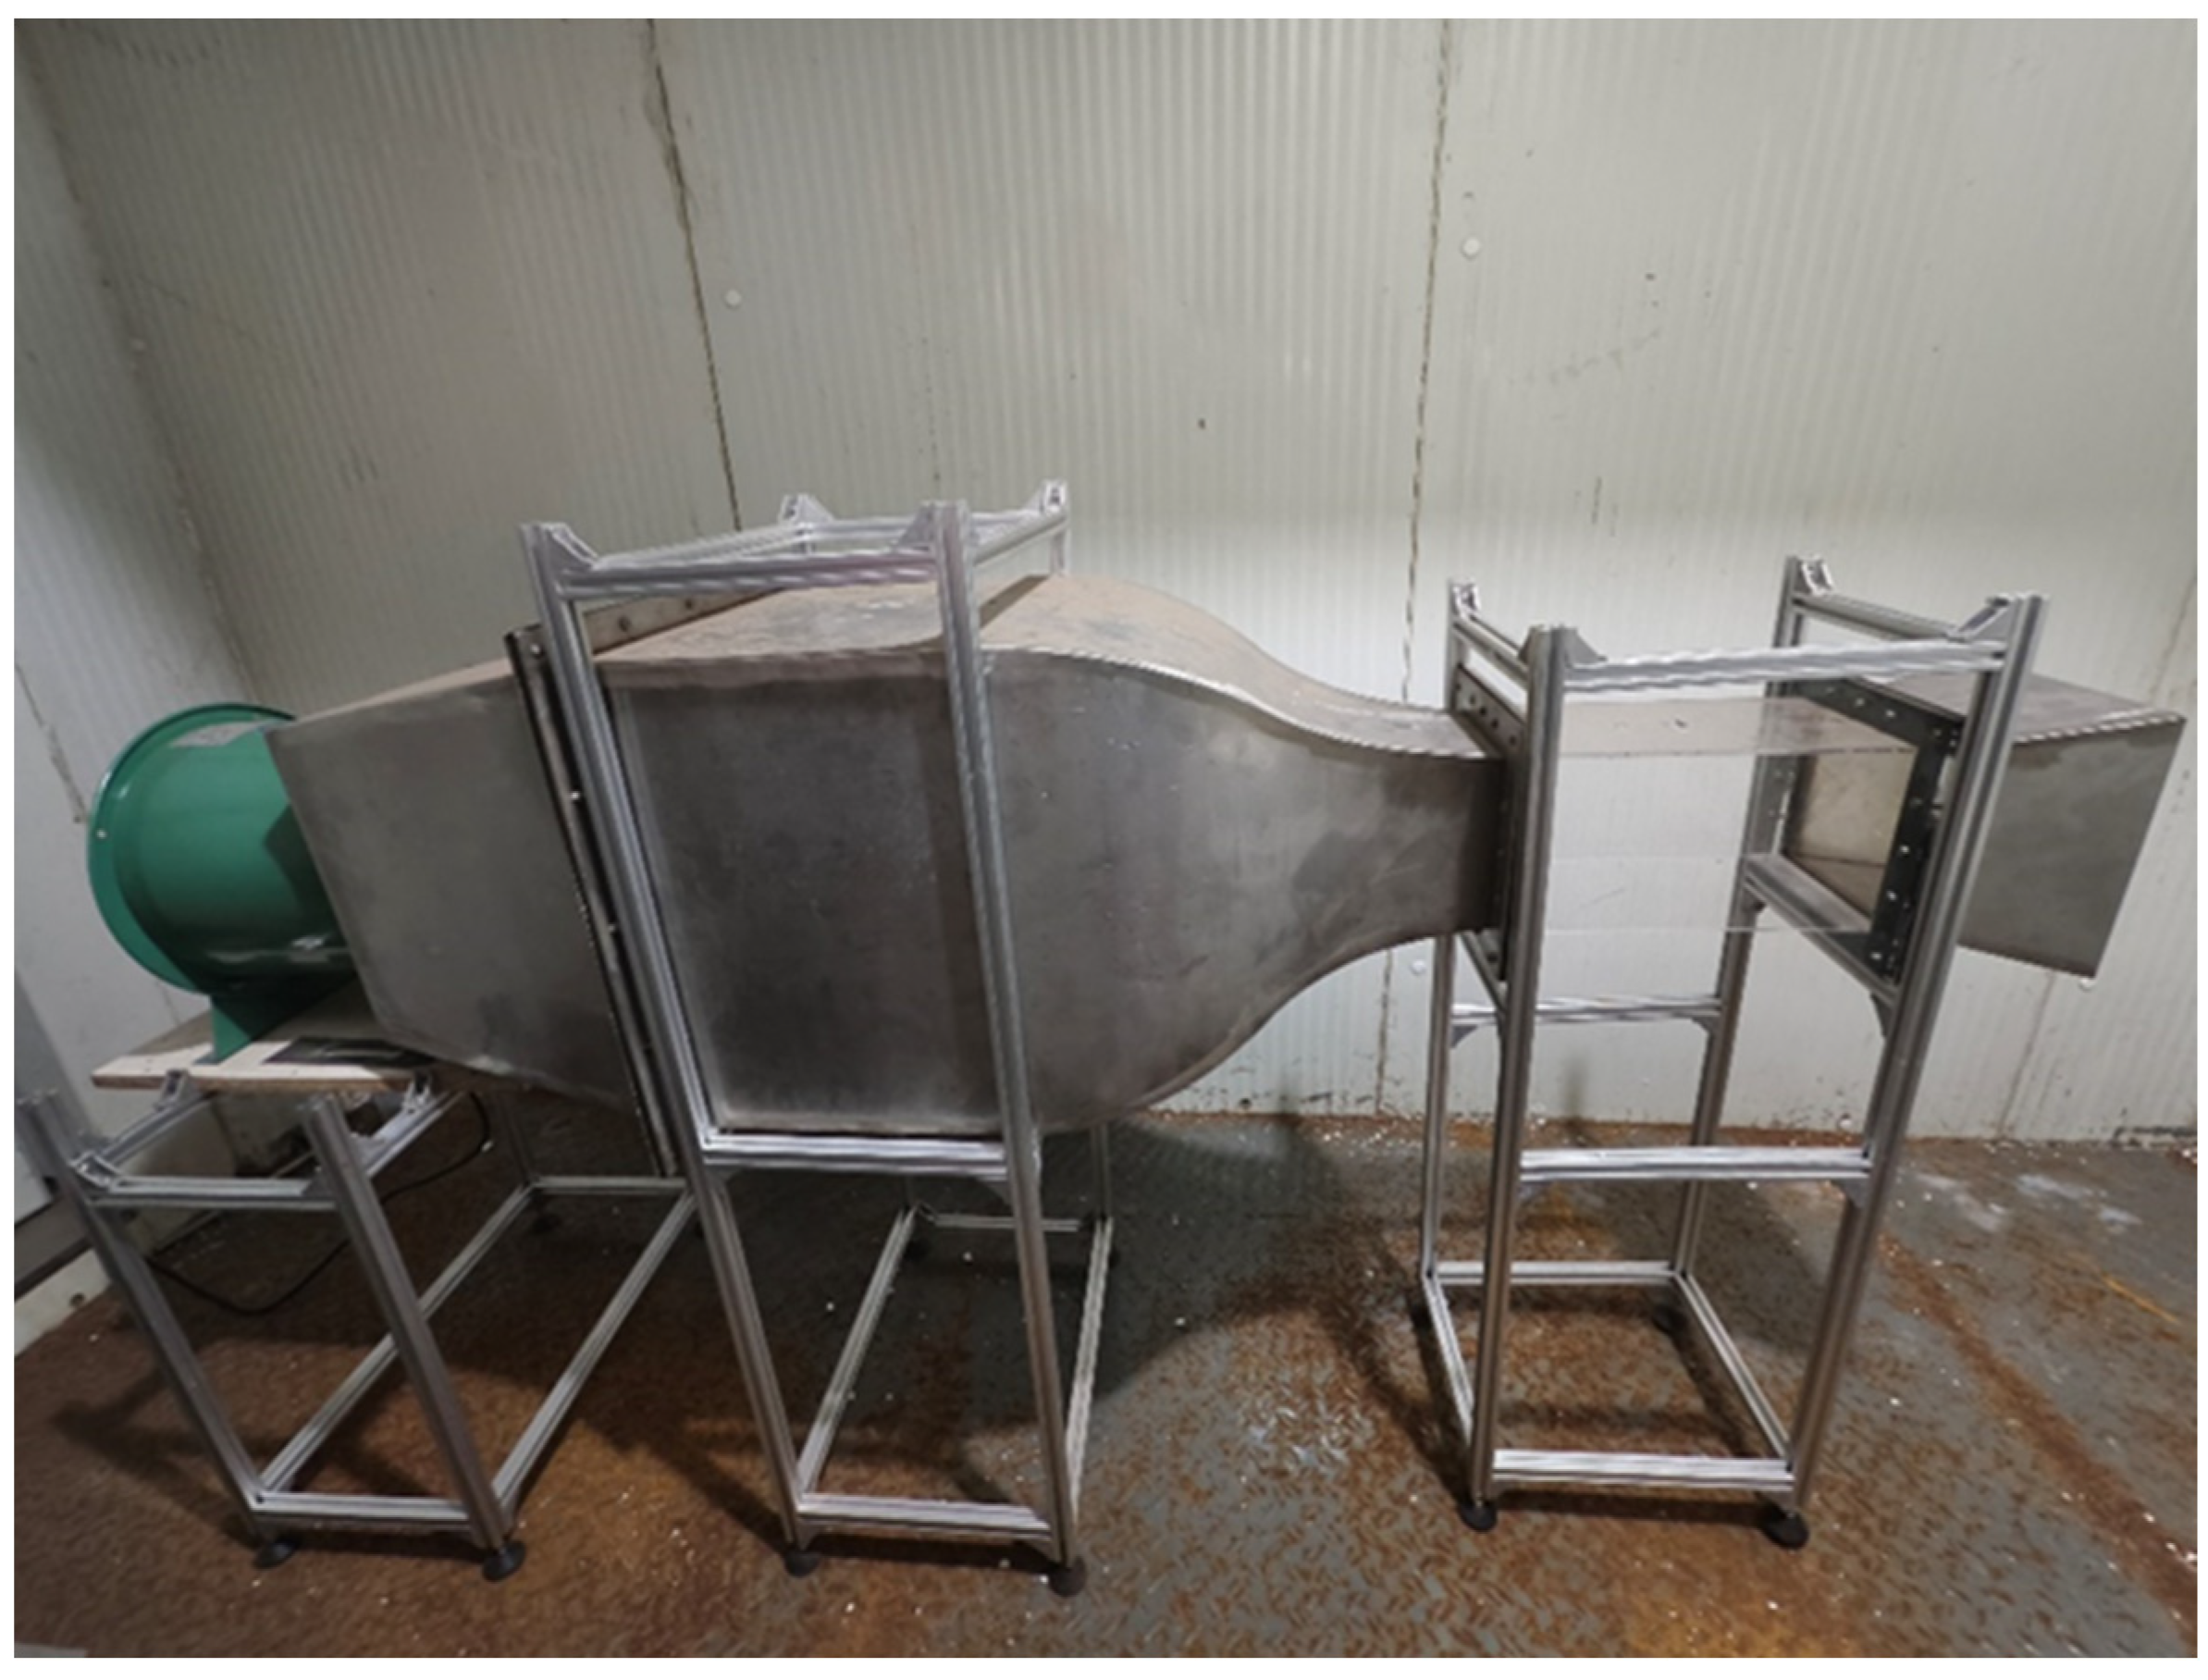
2.1. Wind Tunnel
2.2. Preparation of Distilled Water Ice and Test Specimens
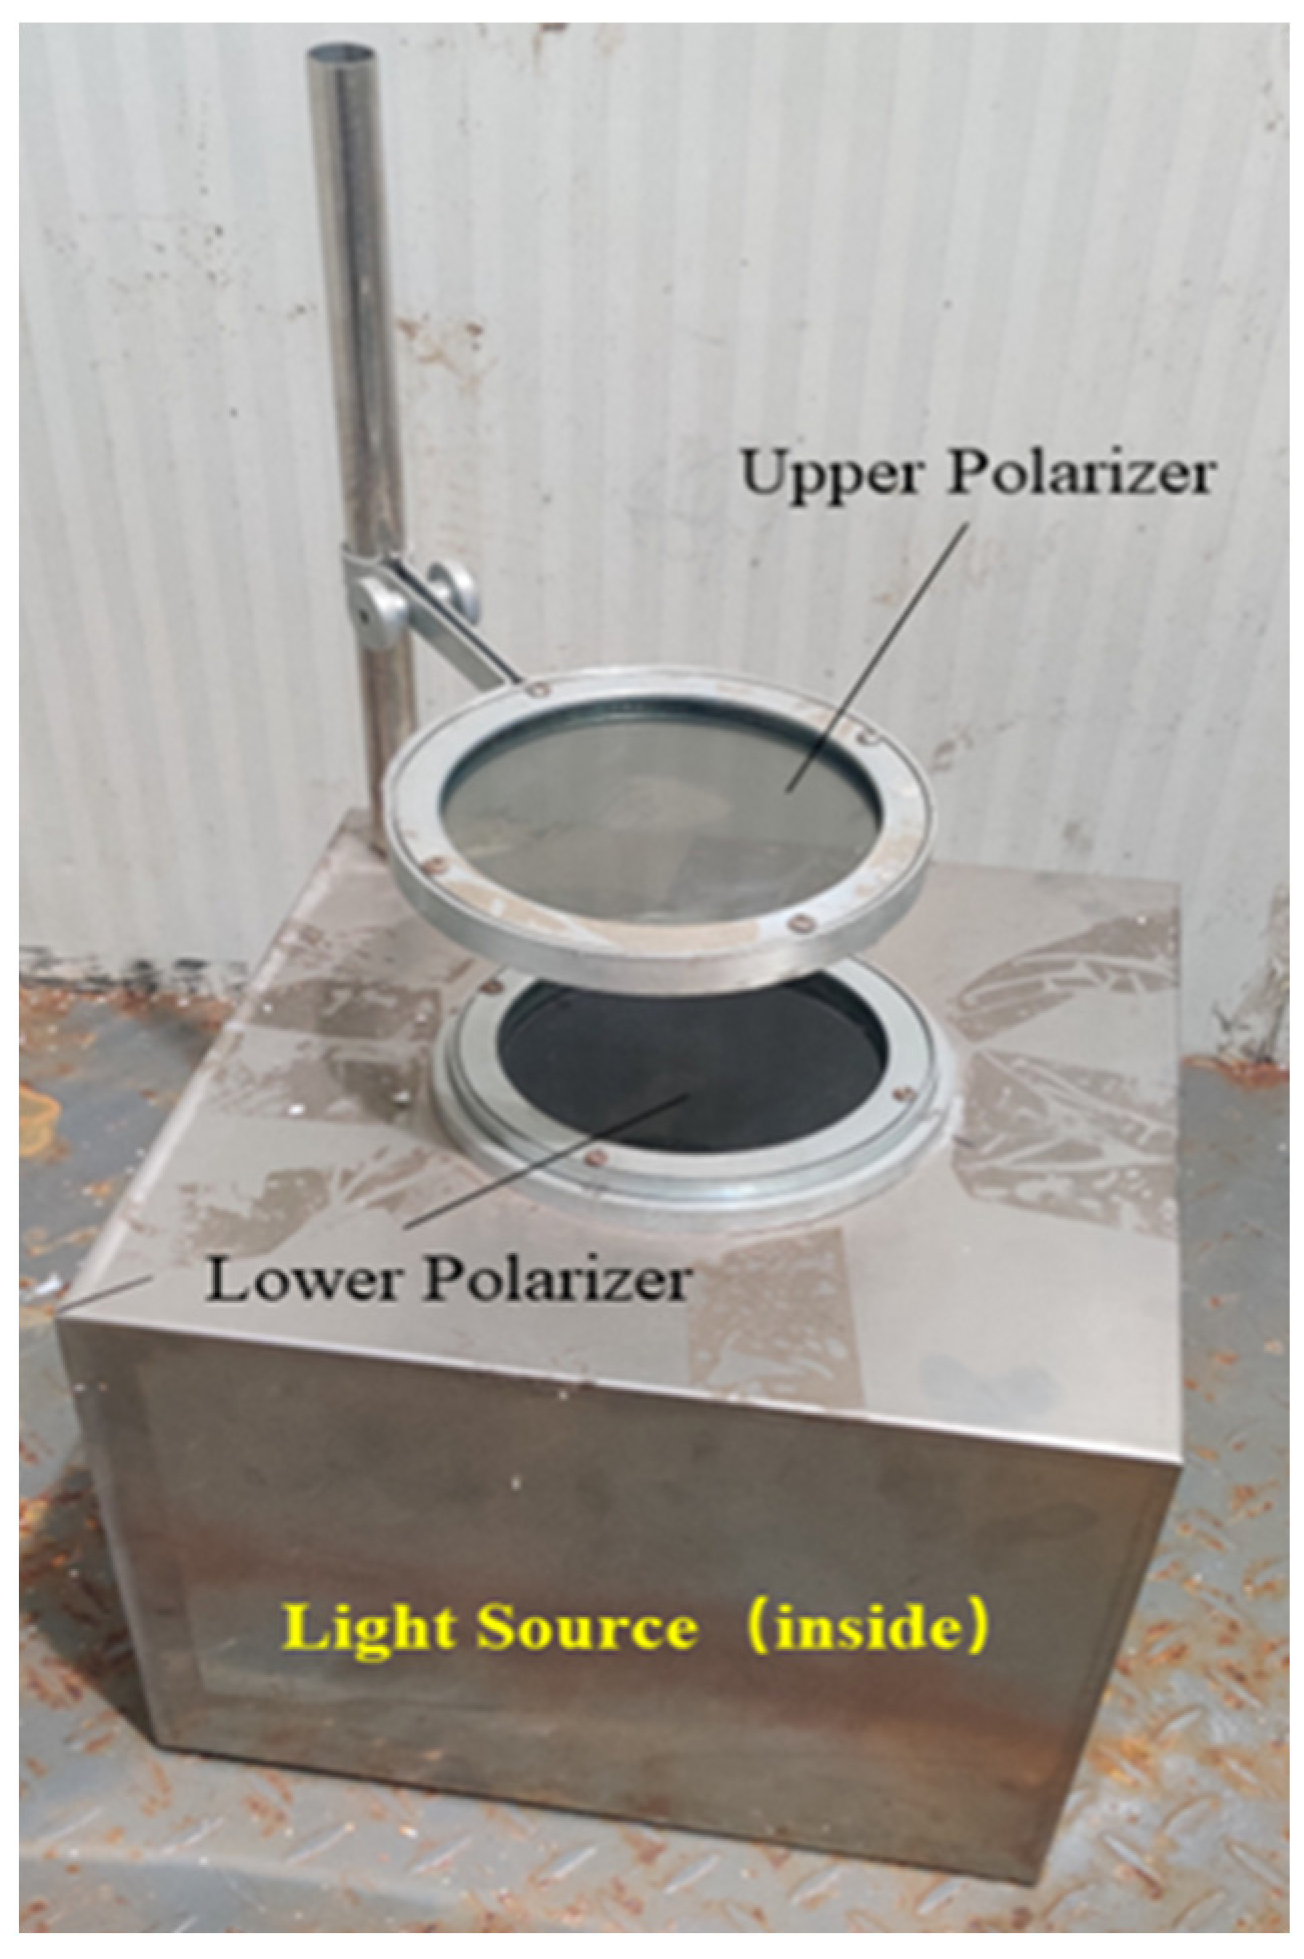
2.3. Measurement Method for Ice Crystals
2.4. Uniaxial Compression Test
2.4.1. Test Devices
2.4.2. Test Principle and Procedure
2.4.3. Test Errors
3. Results
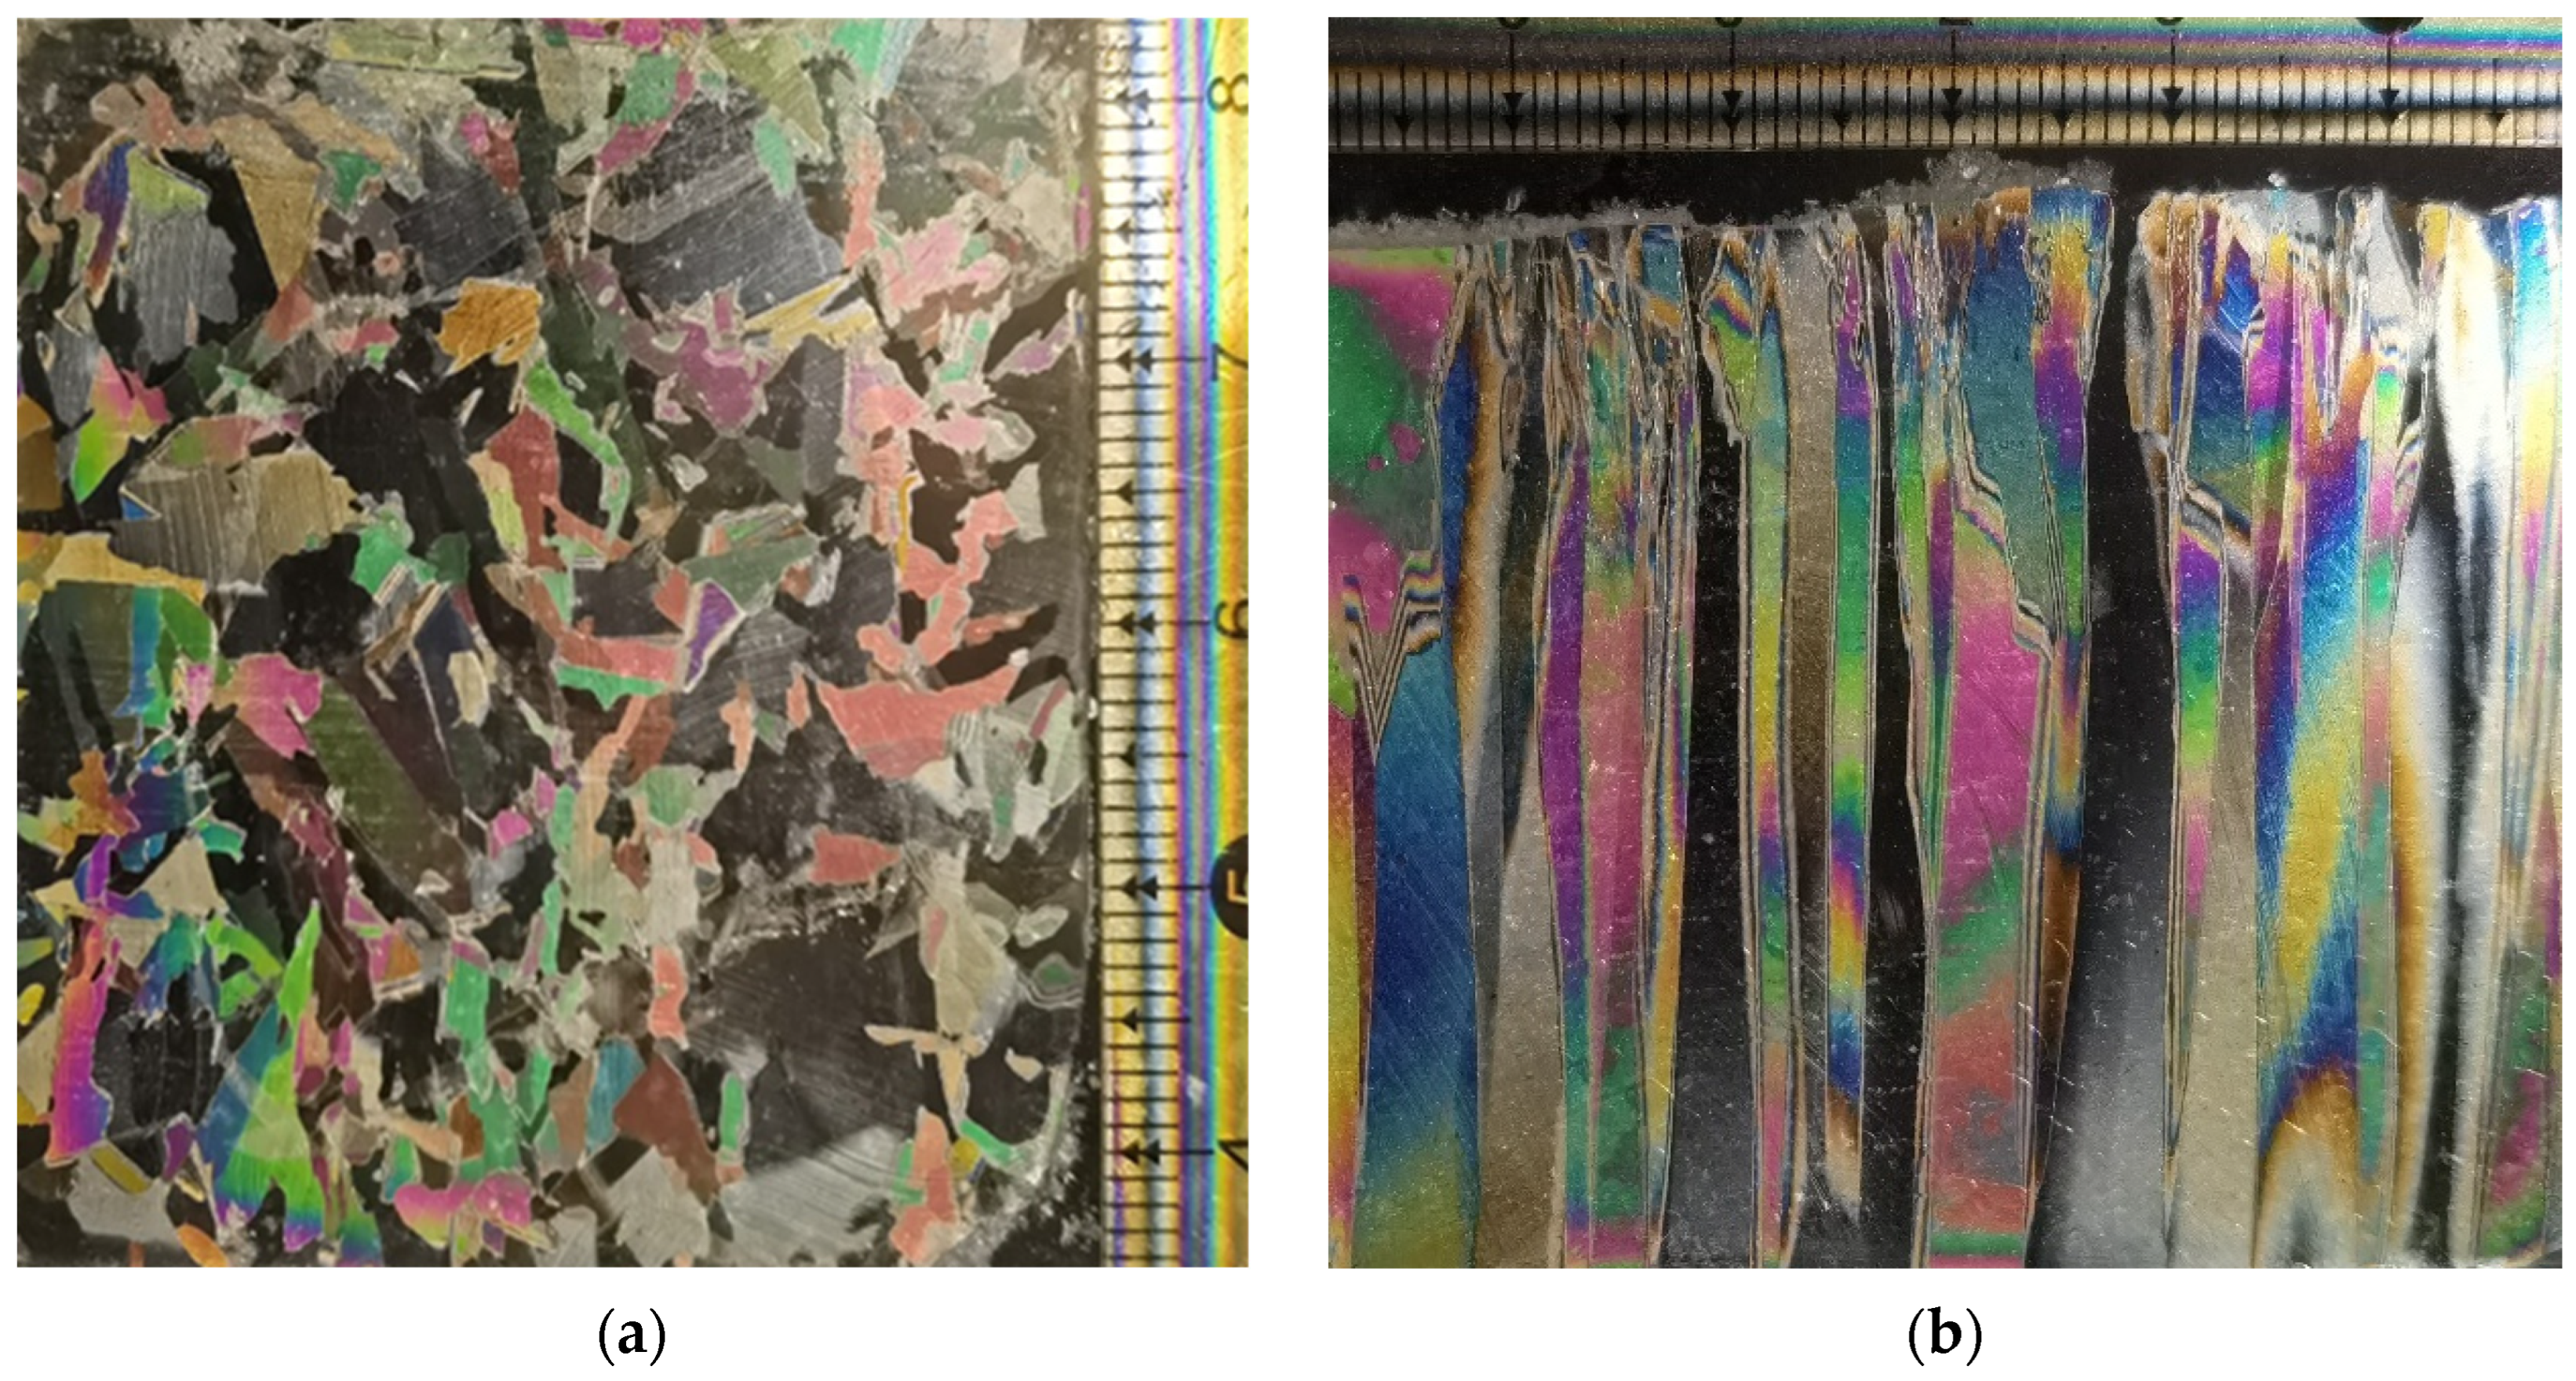
3.1. Results of Ice Crystal Structure
3.2. Results of Uniaxial Compression Test
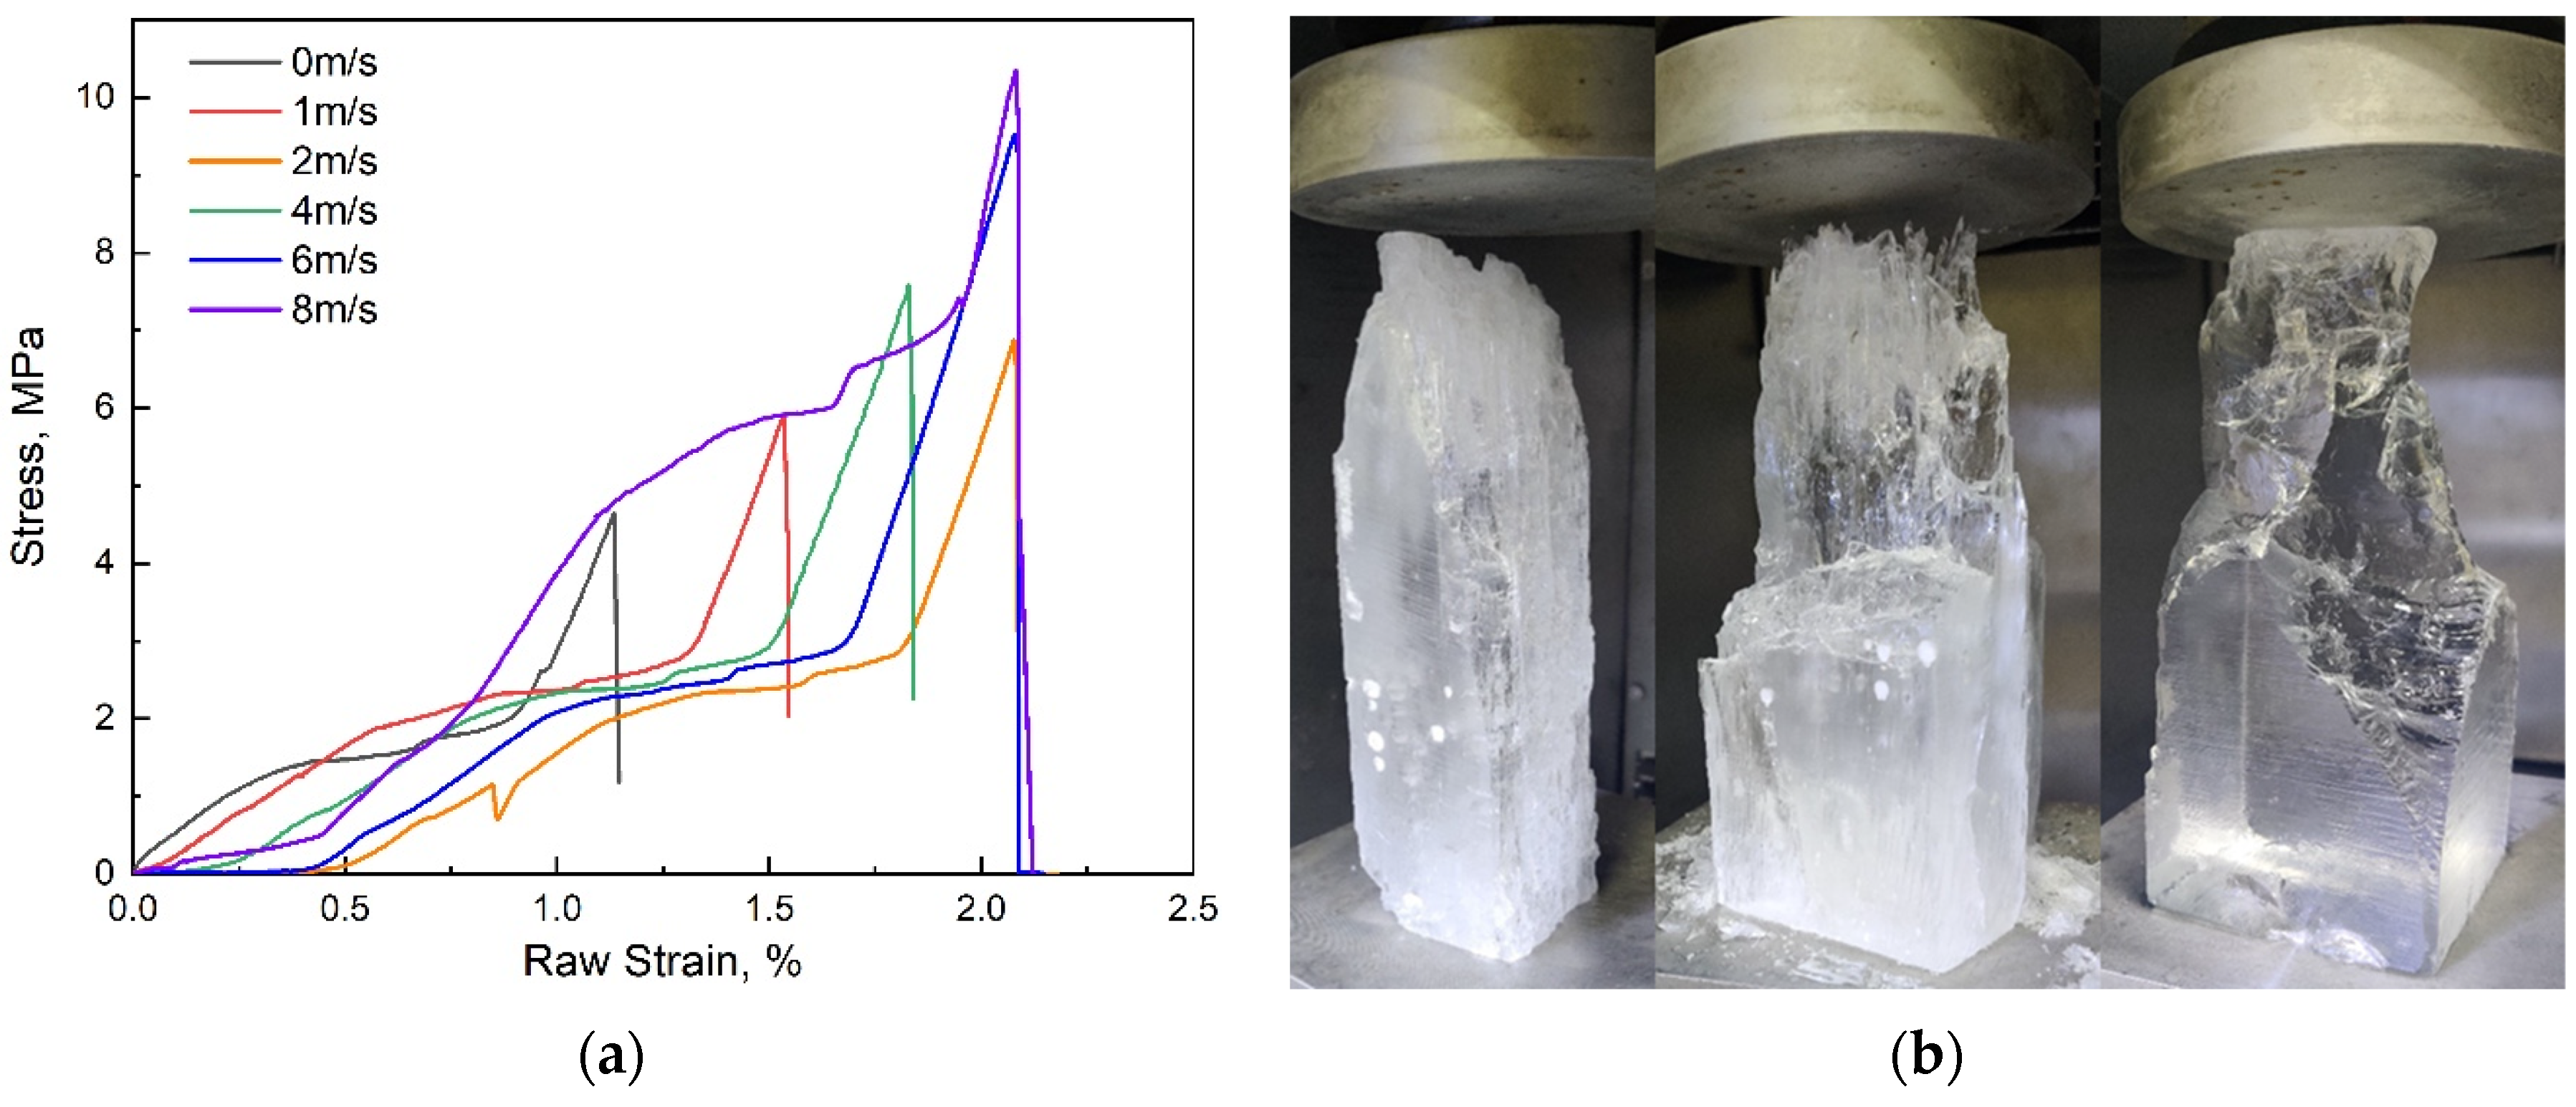
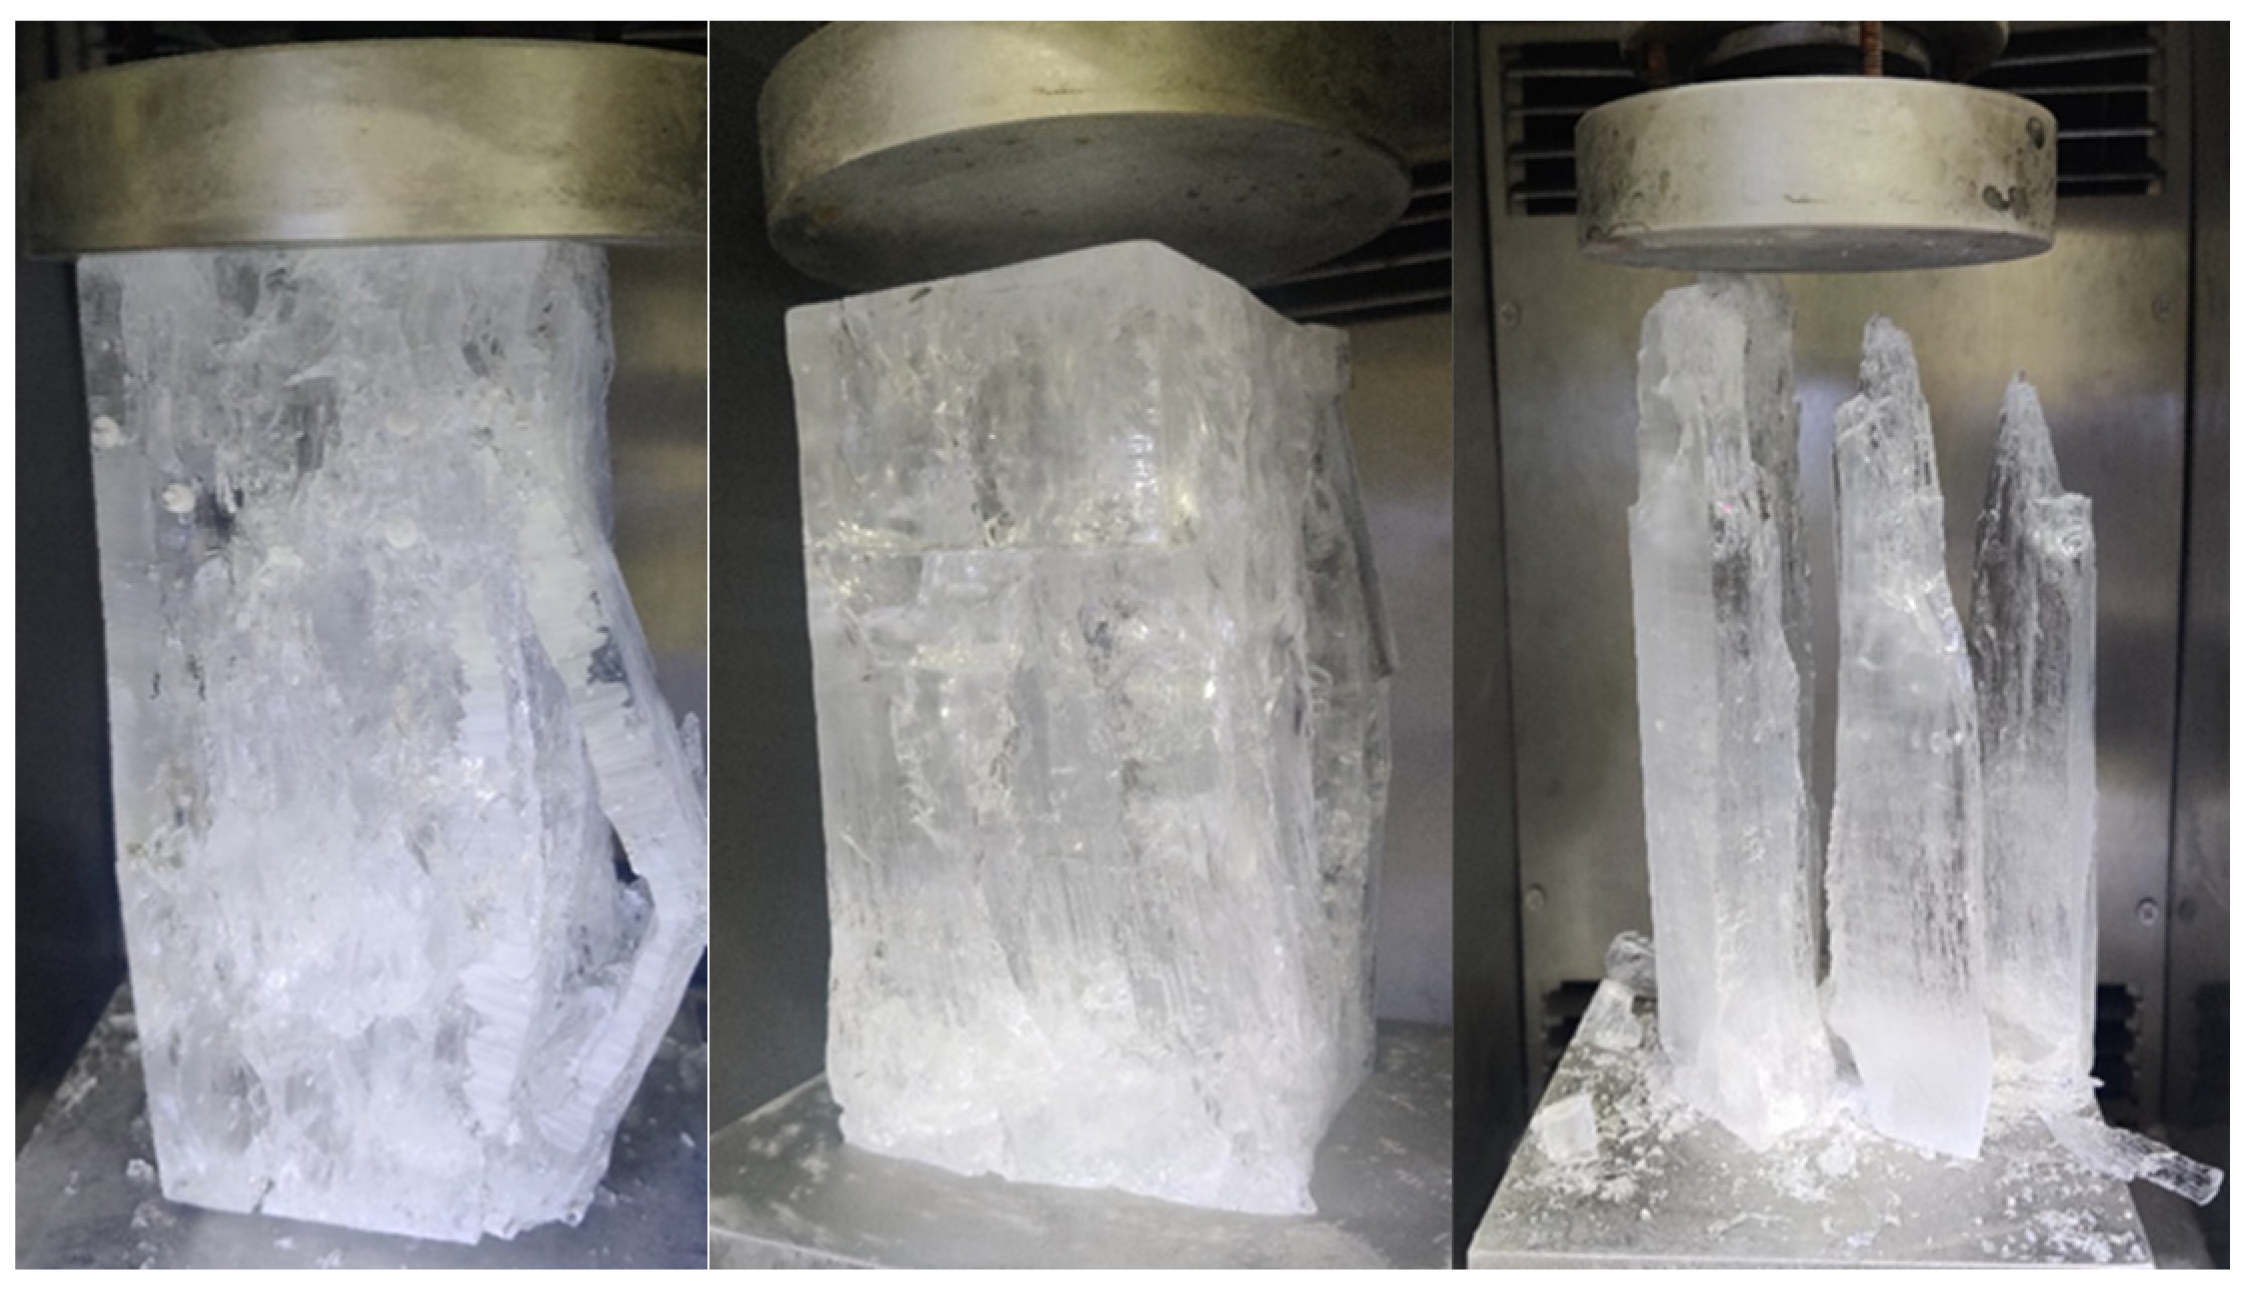
3.2.1. Failure Behavior of Ice
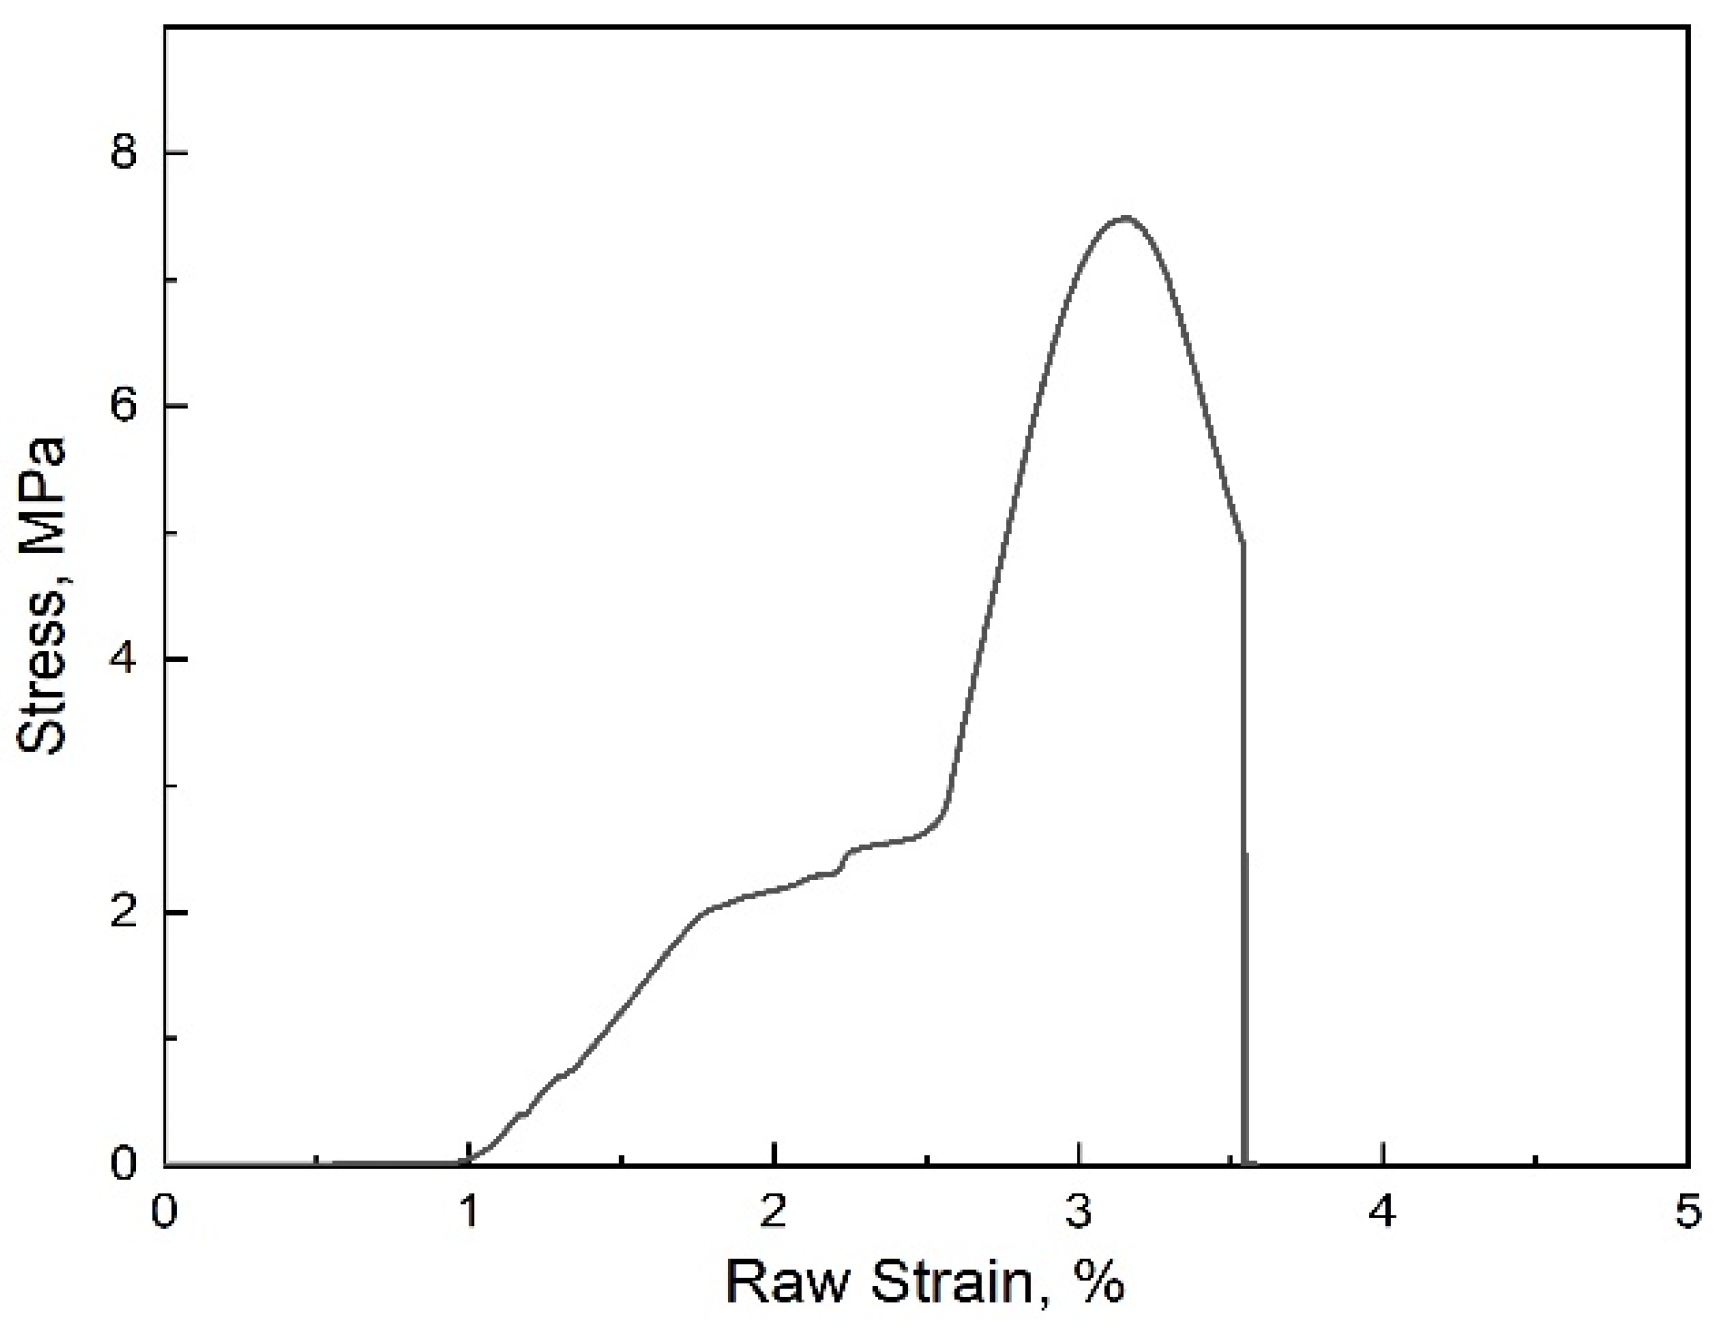
3.2.2. Stress-Strain Curve Correction
4. Discussion
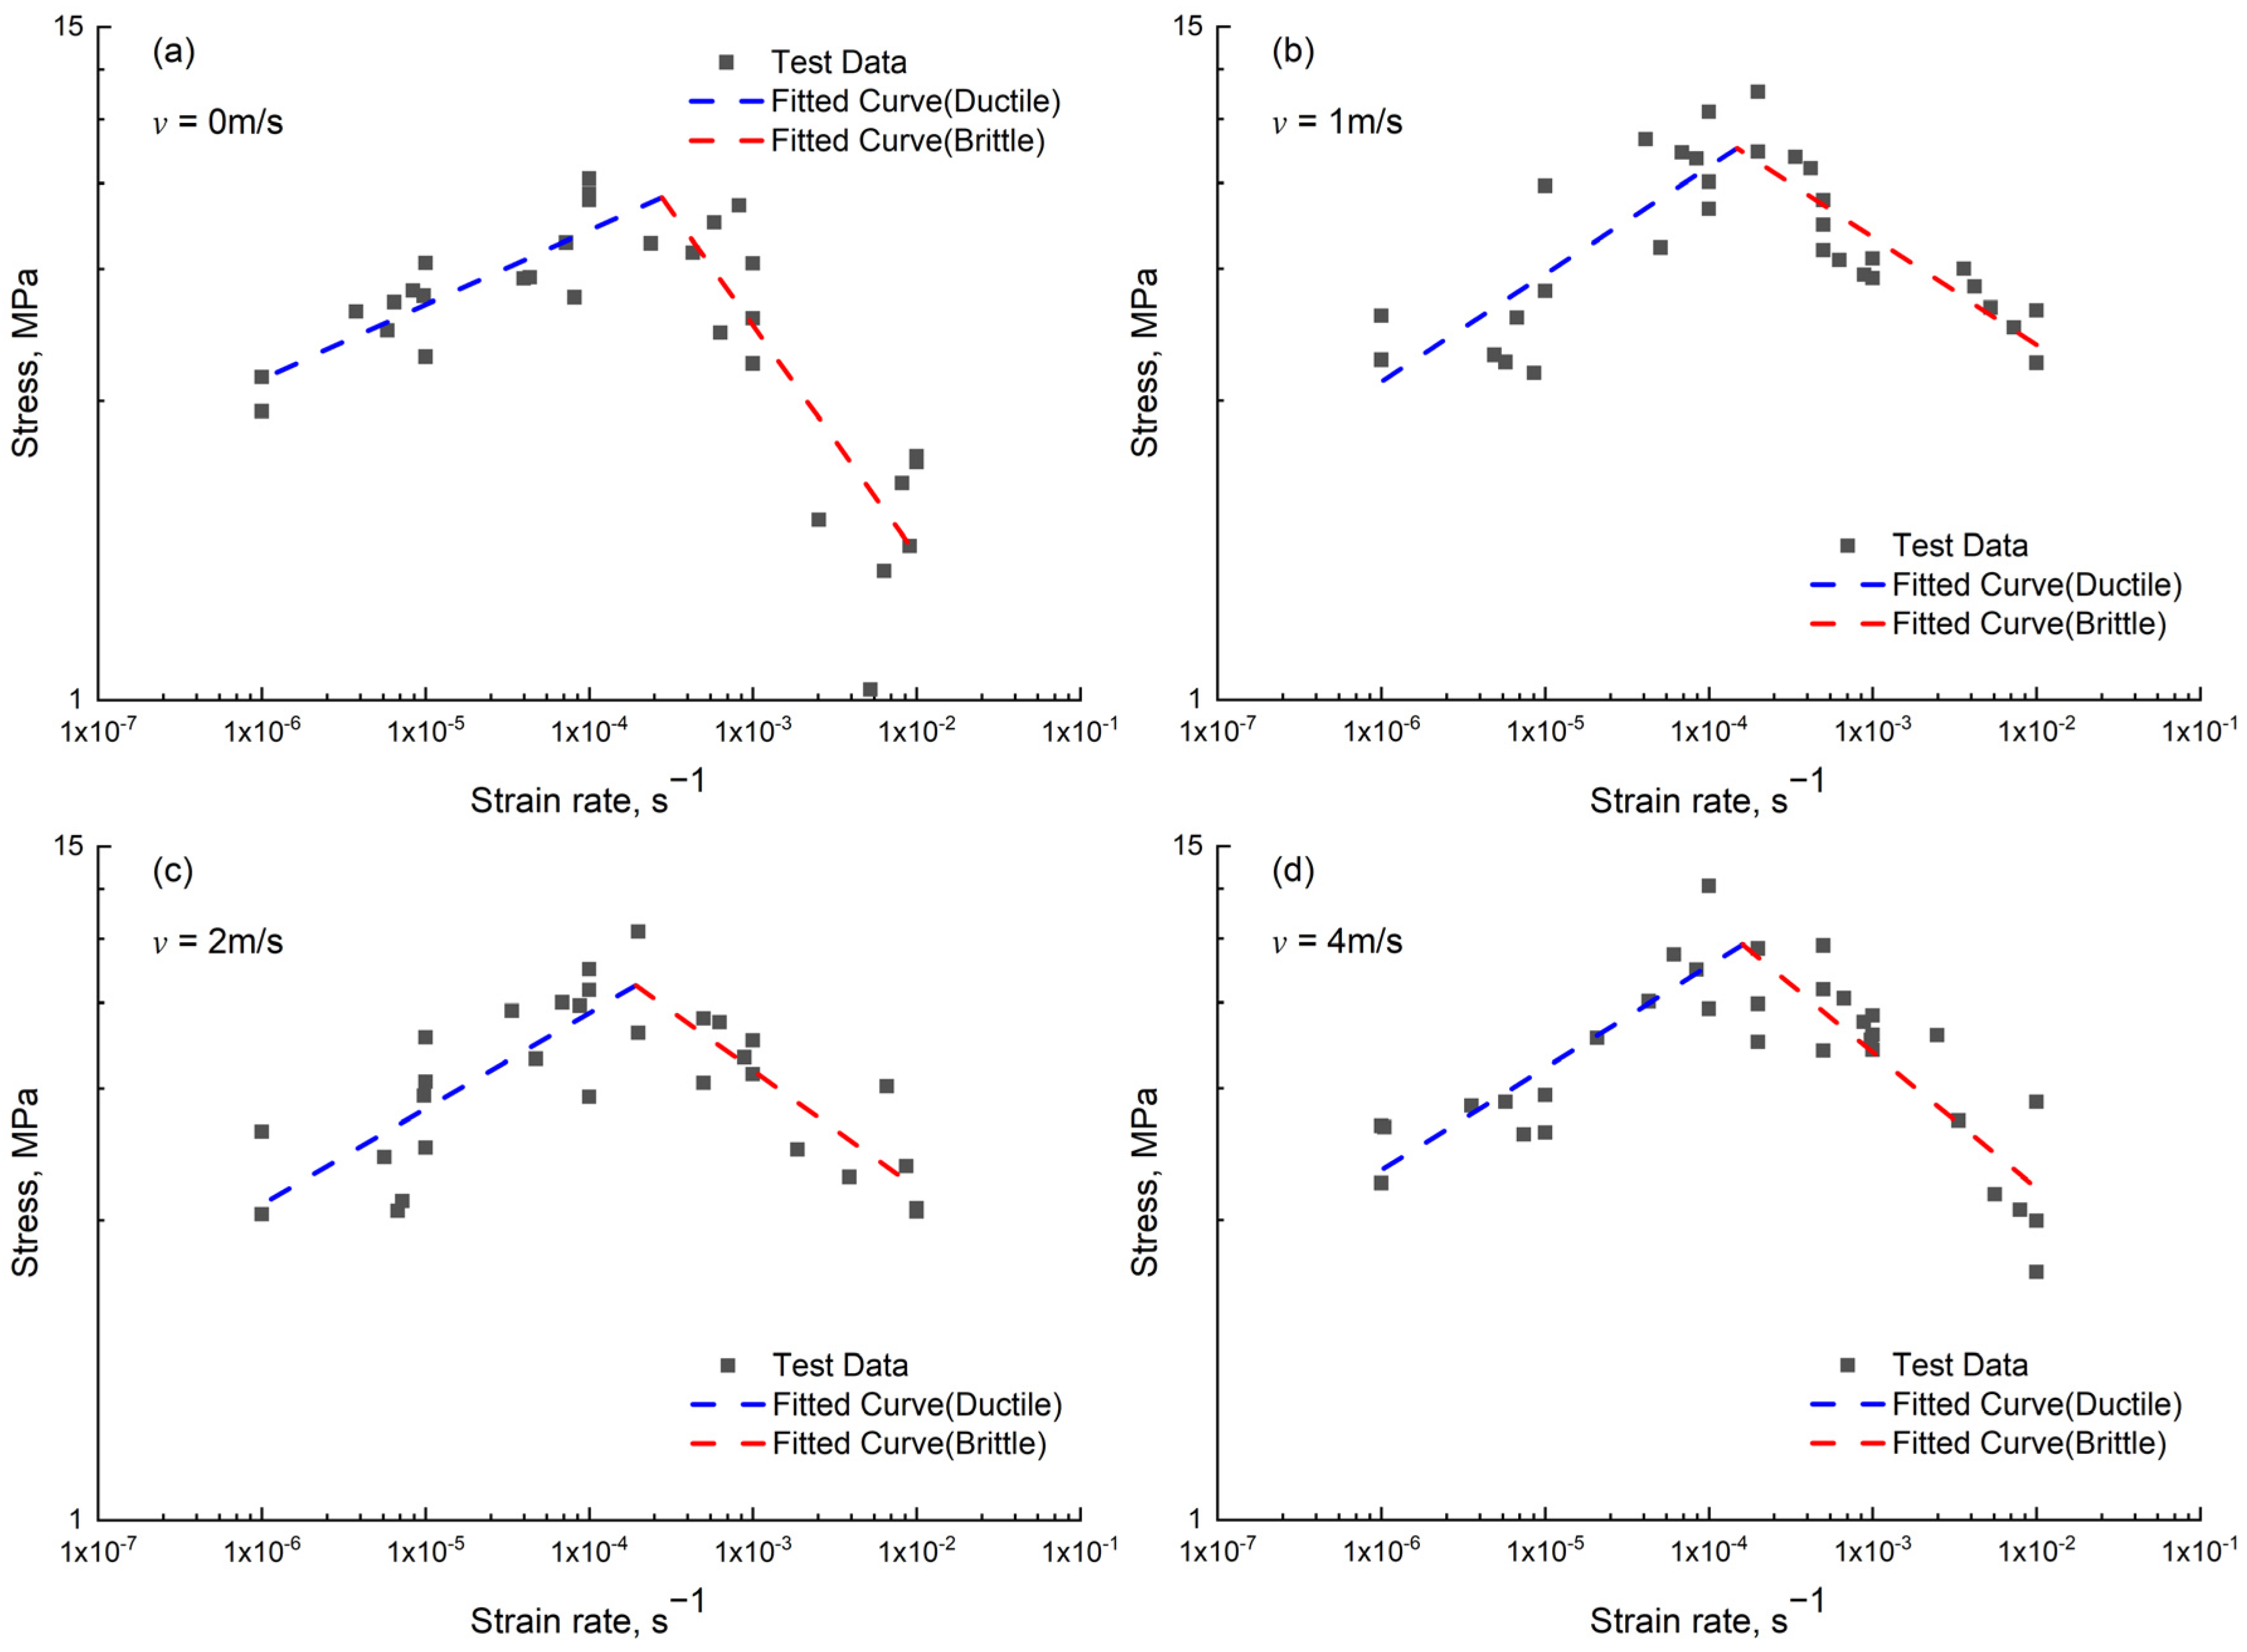
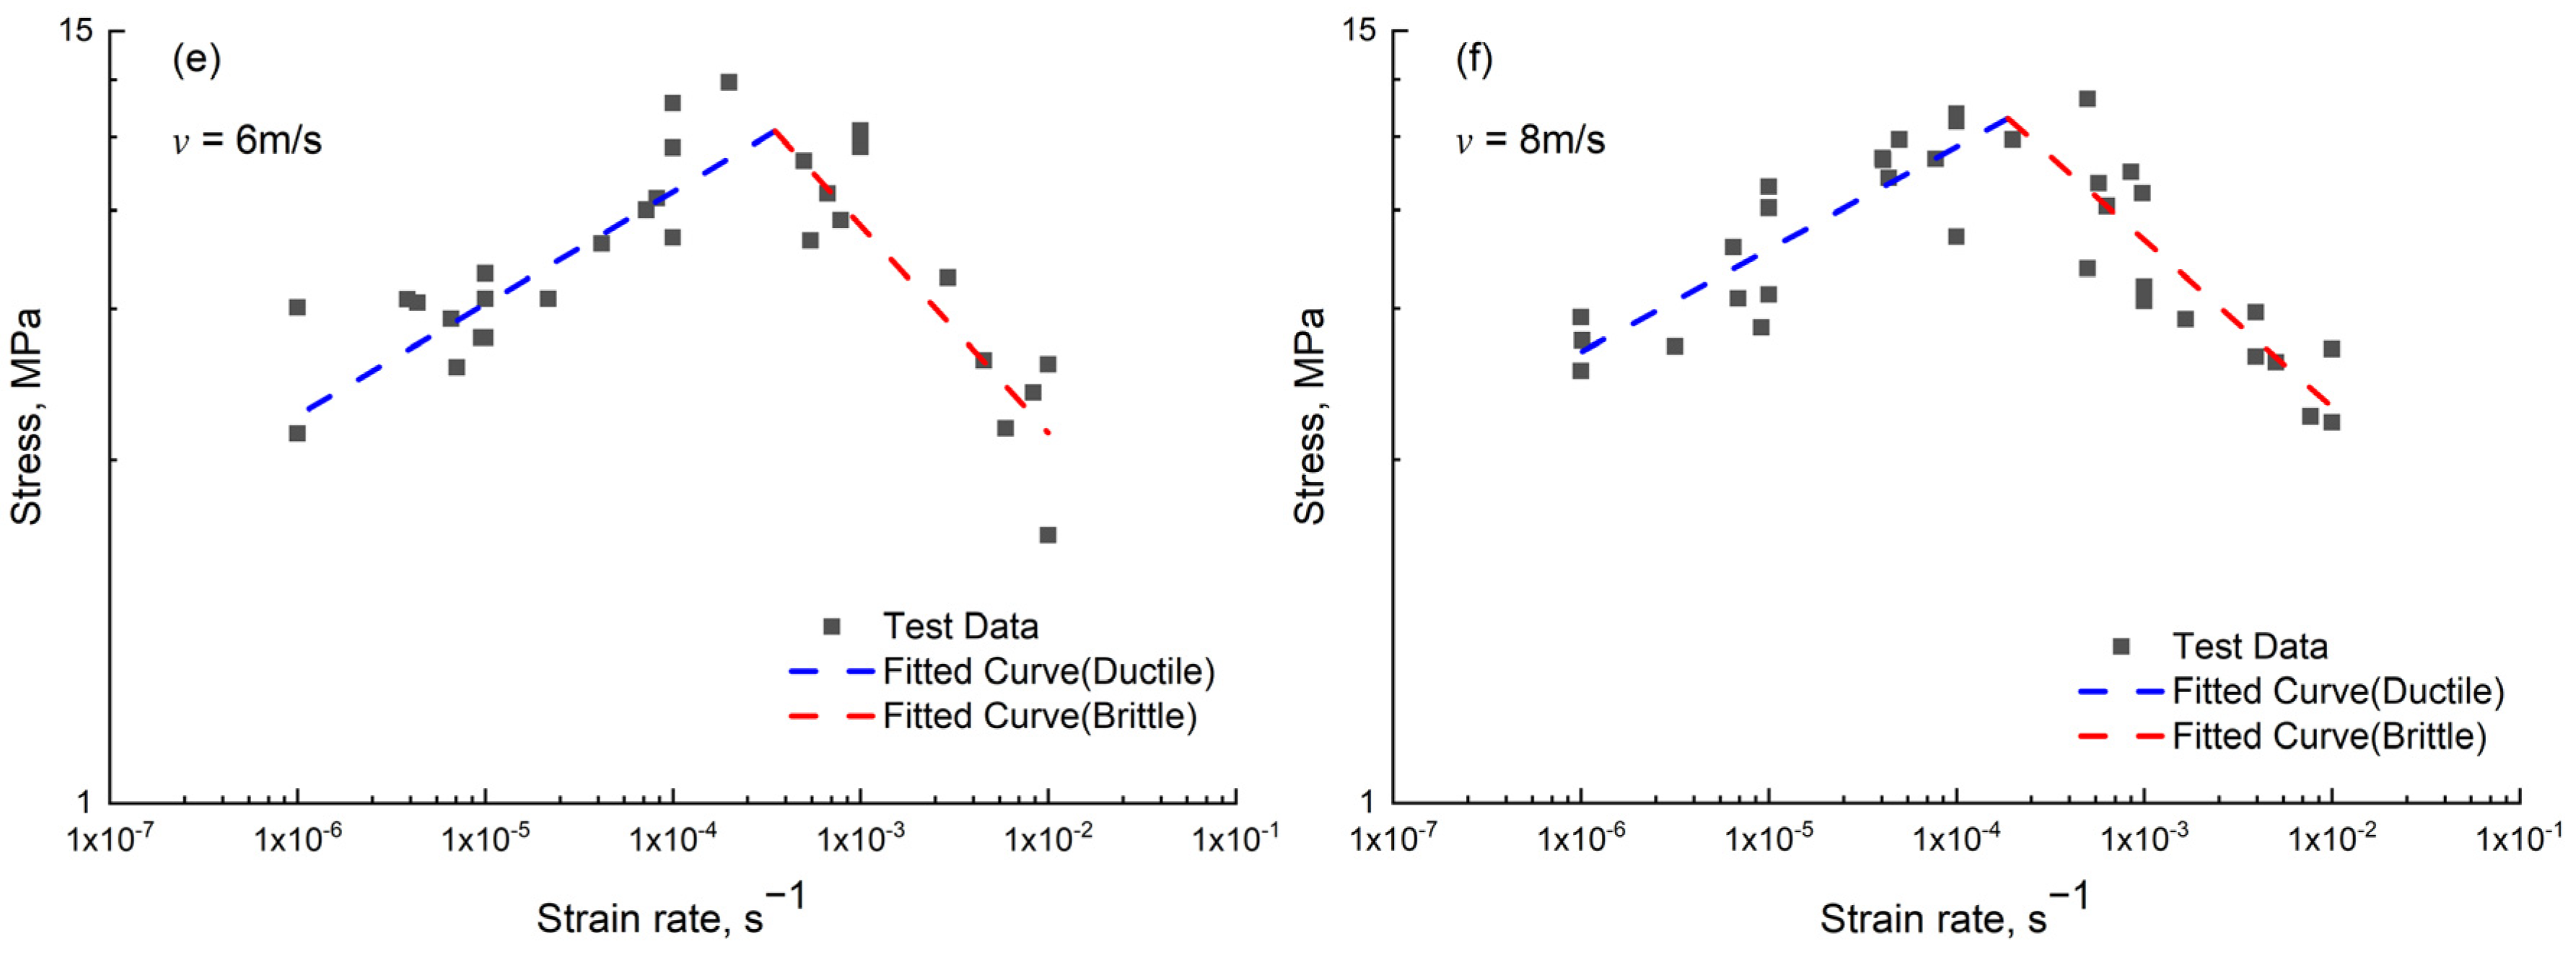
4.1. Stress Versus Strain Rate
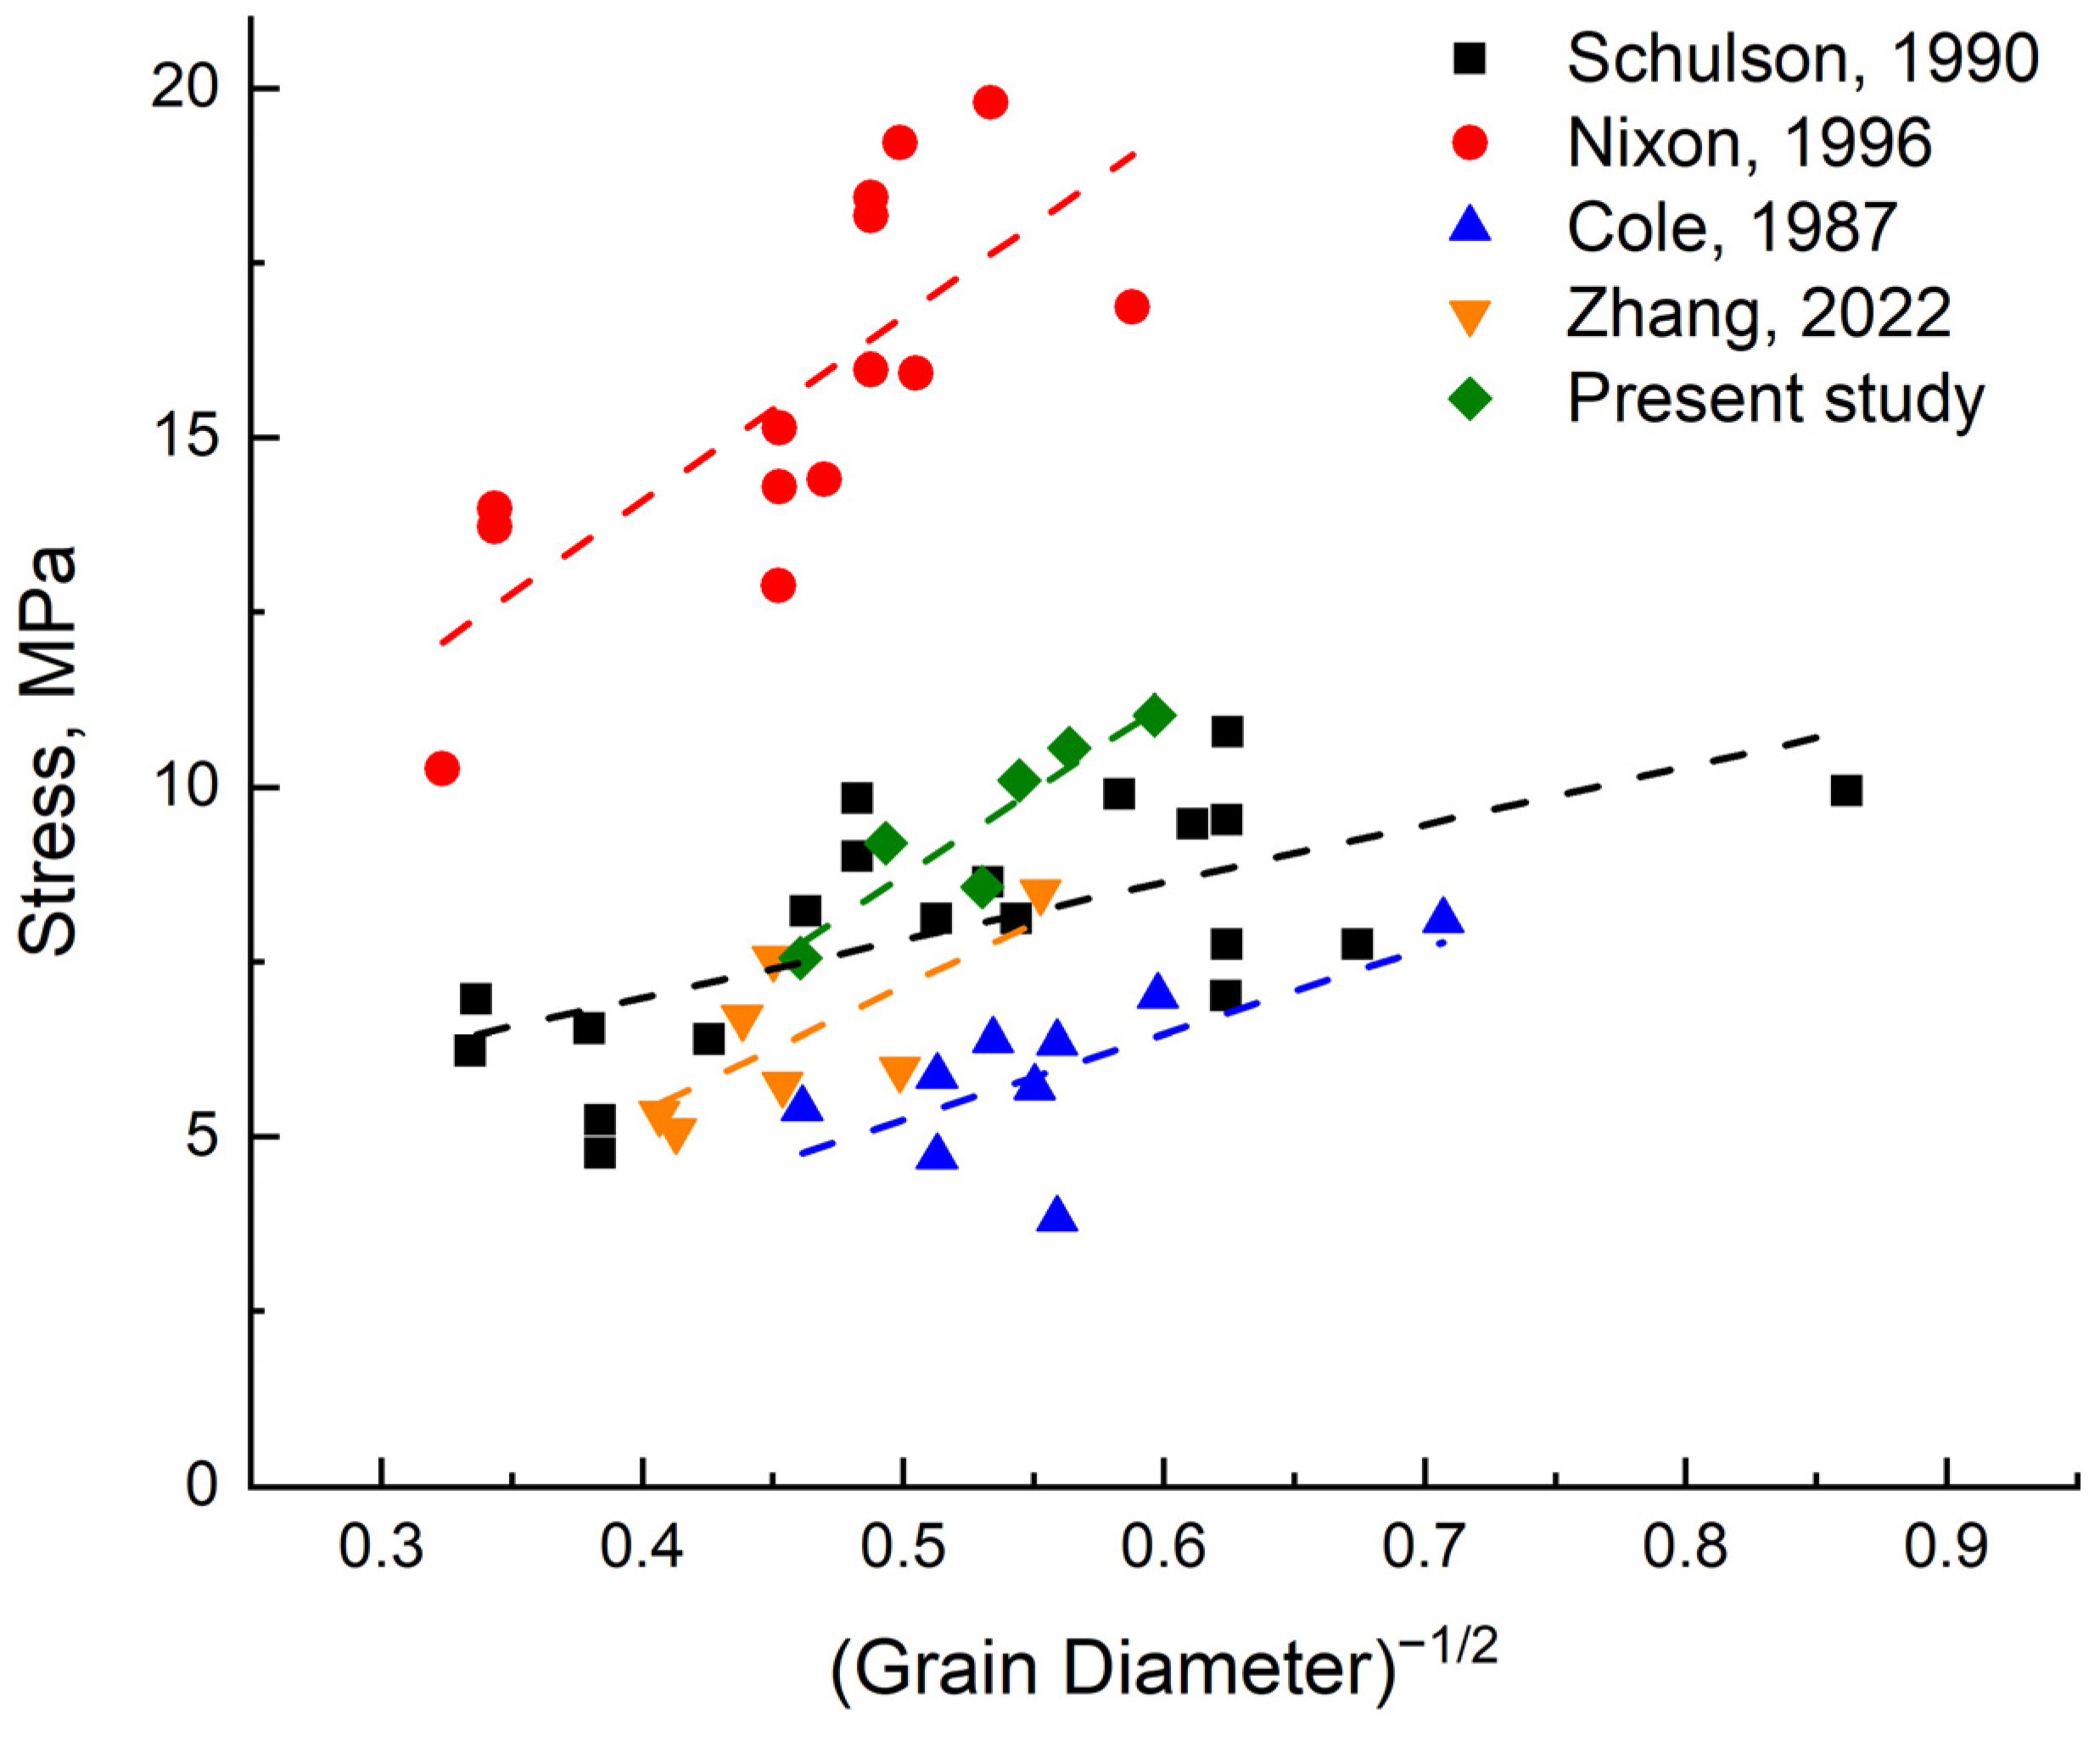
4.2. Stress Versus Grain Size
5. Conclusions
- Wind speeds selected for ice freezing were 0 m/s, 1 m/s, 2 m/s, 4 m/s, 6 m/s, and 8 m/s. Columnar ice crystal structures were observed in this study, with grain sizes increasing with ice depth and ranging from 2–7 mm on average. Grain size tended to decrease with increasing wind speed.
- Uniaxial compression tests were conducted on distilled water ice at strain rates ranging from 10−6 s−1 to 10−2 s−1. The results indicated that ice exhibited ductile behavior at low strain rates and brittle behavior at high strain rates. The uniaxial compressive strength of ice gradually increased with increasing strain rate, reaching a peak before decreasing with further increases in strain rate. A power function relationship between uniaxial compressive strength and strain rate was summarized through function fitting, and the peak compressive strength of ice was calculated.
- The peak compressive strength of distilled water ice grown at different wind speeds was obtained, and the relationship between peak compressive strength and ice crystal grain size was discussed. The results showed that the peak compressive strength of ice gradually increased with the decrease in grain size, and the mathematical relationship between the two was obtained by fitting; that is, the peak compressive strength was linear with the −1/2 power of grain size. This also indicates that the wind speed during the icing process affected the ice compressive strength by controlling the grain size.
Author Contributions
Funding
Data Availability Statement
Acknowledgments
Conflicts of Interest
References
- Dempsey, J.P. Research trends in ice mechanics. Int. J. Solids Struct. 2000, 37, 131–153. [Google Scholar] [CrossRef]
- Beltaos, S.; Burrell, B.C. Hydrotechnical advances in Canadian river ice science and engineering during the past 35 years. Can. J. Civ. Eng. 2015, 42, 583–591. [Google Scholar] [CrossRef]
- Richter, M.J.A. US Research in ice mechanics: 1987–1990. Cold Reg. Sci. Technol. 1992, 20, 231–246. [Google Scholar] [CrossRef]
- Sinha, N.K.; Timco, G.W.; Frederking, R. Recent advances in ice mechanics in Canada. Appl. Mech. Rev. 1987, 40, 1214–1231. [Google Scholar] [CrossRef]
- Maattanen, M. Advance in ice mechanics in Finland. Appl. Mech. Rev. 1987, 40, 1120–1127. [Google Scholar] [CrossRef]
- Schwarz, J. Advances in ice mechanics in West Germany. Appl. Mech. Rev. 1987, 40, 1208–1213. [Google Scholar] [CrossRef]
- Petrovic, J.J. Review mechanical properties of ice and snow. J. Mater. Sci. 2003, 38, 1–6. [Google Scholar] [CrossRef]
- Taranukha, N.A.; Koshkin, S.V. Review and research of physical and mechanical properties for sea ice. In Proceedings of the Twenty-fourth International Ocean and Polar Engineering Conference, Busan, Republic of Korea, 15–20 June 2014. [Google Scholar]
- Cole, D.M.; Shapiro, L.H.; Weeks, W.F.; Byers, C.; Dempsey, J.P.; Adamson, R.M.; Petrenko, V.F.; Gluschenkov, O.V. Overview of recent program on mechanical properties of sea ice. J. Cold Reg. Eng. 1995, 9, 219–234. [Google Scholar] [CrossRef]
- Jones, S.J.; Gagnon, R.E.; Derradji, A.; Bugden, A. Compressive strength of iceberg ice. Can. J. Phys. 2003, 81, 191–200. [Google Scholar] [CrossRef]
- Lu, W.; Lubbad, R.; Løset, S.; Kashafutdinov, M. Fracture of an ice floe: Local out-of-plane flexural failures versus global in-plane splitting failure. Cold Reg. Sci. Technol. 2016, 123, 1–13. [Google Scholar] [CrossRef]
- Paquette, E.; Brown, T.G. Ice crushing forces on offshore structures: Global effective pressures and the ISO 19906 design equation. Cold Reg. Sci. Technol. 2017, 142, 55–68. [Google Scholar] [CrossRef]
- Sinha, N.K. Uniaxial compressive strength of first-year and multi-year sea ice. Can. J. Civ. Eng. 1984, 11, 82–91. [Google Scholar] [CrossRef]
- Sinha, N.K. Rheology of columnar-grained ice. Exp. Mech. 1978, 18, 464–470. [Google Scholar] [CrossRef]
- Bonath, V.; Edeskär, T.; Lintzén, N.; Fransson, L.; Cwirzen, A. Properties of ice from first-year ridges in the Barents Sea and Fram Strait. Cold Reg. Sci. Technol. 2019, 168, 102890. [Google Scholar] [CrossRef]
- Moslet, P.O. Field testing of uniaxial compression strength of columnar sea ice. Cold Reg. Sci. Technol. 2007, 48, 1–14. [Google Scholar] [CrossRef]
- Deng, K.; Feng, X.; Tian, X.; Hu, Y. Experimental research on compressive mechanical properties of ice under low strain rates. Mater. Today Commun. 2020, 24, 101029. [Google Scholar] [CrossRef]
- Qi, C.; Lian, J.; Ouyang, Q.; Zhao, X. Dynamic compressive strength and failure of natural lake ice under moderate strain rates at near melting point temperature. Lat. Am. J. Solids struct. 2017, 14, 1669–1694. [Google Scholar] [CrossRef]
- Sain, T.; Narasimhan, R. Constitutive modeling of ice in the high strain rate regime. Int. J. Solids. Struct. 2011, 48, 817–827. [Google Scholar] [CrossRef]
- Jones, S.J. High strain-rate compression tests on ice. J. Phys. Chem. B 1997, 101, 6099–6101. [Google Scholar] [CrossRef]
- Batto, R.A.; Schulson, E.M. On the ductile-to-brittle transition in ice under compression. Acta Metall. Mater. 1993, 41, 2219–2225. [Google Scholar] [CrossRef]
- Snyder, S.A.; Schulson, E.M.; Renshaw, C.E. Effects of prestrain on the ductile-to-brittle transition of ice. Acta Mater. 2016, 108, 110–127. [Google Scholar] [CrossRef]
- Wu, Y.; Lou, X.; Liu, X.; Pronk, A. The property of fiber reinforced ice under uniaxial compression. Mater. Struct. 2020, 53, 29. [Google Scholar] [CrossRef]
- Wang, Q.; Li, Z.; Lu, P.; Xu, Y.; Li, Z. Flexural and compressive strength of the landfast sea ice in the Prydz Bay, East Antarctic. Cryosphere 2022, 16, 1941–1961. [Google Scholar] [CrossRef]
- Han, H.; Li, Z.; Huang, W.; Lu, P.; Lei, R. The uniaxial compressive strength of the Arctic summer sea ice. Acta. Oceanol. Sin. 2015, 34, 129–136. [Google Scholar] [CrossRef]
- Wu, X.; Prakash, V. Dynamic compressive behavior of ice at cryogenic temperatures. Cold Reg. Sci. Technol. 2015, 118, 1–13. [Google Scholar] [CrossRef]
- Barrette, P.D.; Jordaan, I.J. Pressure–temperature effects on the compressive behavior of laboratory-grown and iceberg ice. Cold Reg. Sci. Technol. 2003, 36, 25–36. [Google Scholar] [CrossRef]
- Kermani, M.; Farzaneh, M.; Gagnon, R. Compressive strength of atmospheric ice. Cold Reg. Sci. Technol. 2007, 49, 195–205. [Google Scholar] [CrossRef]
- Farid, H.; Saeidi, A.; Farzaneh, M. Prediction of failure in atmospheric ice under triaxial compressive stress. Cold Reg. Sci. Technol. 2017, 138, 46–56. [Google Scholar] [CrossRef]
- Zhang, Y.; Qian, Z.; Lv, S.; Huang, W.; Ren, J.; Fang, Z.; Chen, X. Experimental investigation of uniaxial compressive strength of distilled water ice at different growth temperatures. Water 2022, 14, 4079. [Google Scholar] [CrossRef]
- Kuehn, G.A.; Schulson, E.M.; Jones, D.E.; Zhang, J. The compressive strength of ice cubes of different sizes. J. Offshore Mech. Arct. Eng. 1993, 115, 142–148. [Google Scholar] [CrossRef]
- Litwin, K.L.; Zygielbaum, B.R.; Polito, P.J.; Sklar, L.S.; Collins, G.C. Influence of temperature, composition, and grain size on the tensile failure of water ice: Implications for erosion on Titan. J. Geophys. Res. 2012, 117, E08013. [Google Scholar] [CrossRef]
- Georges, D.; Saletti, D.; Montagnat, M.; Forquin, P.; Hagenmuller, P. Influence of porosity on ice dynamic tensile behavior as assessed by spalling tests. J. Dyn. Behav. Mater. 2021, 7, 575–590. [Google Scholar] [CrossRef]
- Cole, D.M. Grain size and the compressive strength of ice. J. Energy Resour. Technol. 1985, 107, 369–374. [Google Scholar] [CrossRef]
- Zhang, L.; Li, Z.; Jia, Q.; Huang, W. Experimental study on uniaxial compressive strength of reservoir ice. Trans. Tianjin Univ. 2012, 18, 112–116. [Google Scholar] [CrossRef]
- Jones, S.J.; Chew, H.A.M. Effect of sample and grain size on the compressive strength of ice. Ann. Glaciol. 1983, 4, 129–132. [Google Scholar] [CrossRef]
- Fujisaki, A.; Oey, L. Formation of ice bands by winds. J. Geophys. Res. 2011, 116, C10015. [Google Scholar] [CrossRef]
- Rallabandi, B.; Zheng, Z.; Winton, M.; Stone, H.A. Formation of sea ice bridges in narrow straits in response to wind and water stresses. J. Geophys. Res. Ocean. 2017, 122, 5588–5610. [Google Scholar] [CrossRef]
- Ashton, G.D. River and lake ice thickening, thinning, and snow ice formation. Cold Reg. Sci. Technol. 2011, 68, 3–19. [Google Scholar] [CrossRef]
- Liu, R.; Liu, Y.; Wang, Q.; Yi, X. Investigation of microstructure and density of atmospheric ice formed by high-wind-speed in-cloud icing. Crystals 2023, 13, 1015. [Google Scholar] [CrossRef]
- Timco, G.W.; Frederking, R.M.W. Comparative strengths of fresh water ice. Cold Reg. Sci. Technol. 1982, 6, 21–27. [Google Scholar] [CrossRef]
- Schwarz, J.; Frederking, R.; Gavrillo, V.; Petrov, I.G.; Hirayama, K.I.; Mellor, M.; Tryde, P.; Vaudrey, K.D. Standardized testing methods for measuring mechanical properties of ice. Cold Reg. Sci. Technol. 1981, 4, 245–253. [Google Scholar] [CrossRef]
- Jacka, T.H. Laboratory studies on relationships between ice crystal size and flow rate. Cold Reg. Sci. Technol. 1984, 10, 31–42. [Google Scholar] [CrossRef]
- Arakawa, M.; Maeno, N. Mechanical strength of polycrystalline ice under uniaxial compression. Cold Reg. Sci. Technol. 1997, 26, 215–229. [Google Scholar] [CrossRef]
- Michel, B.; Toussaint, N. Mechanisms and theory of indentation of ice plates. J. Glaciol. 1977, 19, 285–300. [Google Scholar] [CrossRef]
- Glen, J.W. The creep of polycrystalline ice. Proc. R. Soc. A-Math. Phy. 1955, 228, 519–538. [Google Scholar] [CrossRef]
- Lan, H.; Martin, C.D.; Hu, B. Effect of heterogeneity of brittle rock on micromechanical extensile behavior during compression loading. J. Geophys. Res. 2010, 115, B01202. [Google Scholar] [CrossRef]
- Hall, E.O. The deformation and ageing of mild steel: III discussion of results. Proc. Phys. Soc. Lond. B 1951, 64, 747–753. [Google Scholar] [CrossRef]
- Petch, N.J. The Cleavage Strength of Polycrystals. J. Iron Steel Inst. 1953, 174, 25–28. [Google Scholar]
- Schulson, E.M. The brittle compressive fracture of ice. Acta Metall. Mater. 1990, 38, 1963–1976. [Google Scholar] [CrossRef]
- Cole, D.M. Strain-rate and grain-size effects in ice. J. Glaciol. 1987, 33, 274–280. [Google Scholar] [CrossRef]
- Nixon, W.A. Wing crack models of the brittle compressive failure of ice. Cold Reg. Sci. Technol. 1996, 24, 41–55. [Google Scholar] [CrossRef]


| Wind Speed/Depth | 0 cm | 5 cm | 10 cm | 15 cm | Average |
|---|---|---|---|---|---|
| 0 m/s | 3.120 | 4.203 | 5.368 | 6.152 | 4.711 |
| 1 m/s | 3.137 | 3.664 | 4.547 | 5.089 | 4.110 |
| 2 m/s | 2.926 | 3.551 | 3.843 | 3.903 | 3.556 |
| 4 m/s | 2.604 | 3.527 | 3.649 | 3.710 | 3.373 |
| 6 m/s | 2.671 | 3.001 | 3.257 | 3.659 | 3.147 |
| 8 m/s | 2.123 | 2.939 | 3.081 | 3.103 | 2.812 |
(m/s) | Ductile Regime | Brittle Regime | (MPa) | ||||
|---|---|---|---|---|---|---|---|
| B | n | R2 | B | n | R2 | ||
| 0 | 21.822 | 0.130 | 0.67 | 0.283 | −0.401 | 0.73 | 7.552 |
| 1 | 47.950 | 0.187 | 0.66 | 1.754 | −0.188 | 0.76 | 9.193 |
| 2 | 35.278 | 0.167 | 0.64 | 1.461 | −0.207 | 0.74 | 8.574 |
| 4 | 48.058 | 0.177 | 0.76 | 1.274 | −0.237 | 0.67 | 10.096 |
| 6 | 40.811 | 0.170 | 0.75 | 0.765 | −0.33 | 0.72 | 10.560 |
| 8 | 42.134 | 0.156 | 0.74 | 1.237 | −0.255 | 0.67 | 11.025 |
Disclaimer/Publisher’s Note: The statements, opinions and data contained in all publications are solely those of the individual author(s) and contributor(s) and not of MDPI and/or the editor(s). MDPI and/or the editor(s) disclaim responsibility for any injury to people or property resulting from any ideas, methods, instructions or products referred to in the content. |
© 2024 by the authors. Licensee MDPI, Basel, Switzerland. This article is an open access article distributed under the terms and conditions of the Creative Commons Attribution (CC BY) license (https://creativecommons.org/licenses/by/4.0/).
Share and Cite
Zhang, Y.; Qian, Z.; Huang, W.; Chen, X.; Zhang, Z.; Ren, J. Effect of Grain Size on the Uniaxial Compressive Strength of Ice Forming with Different Wind Speeds in a Cold Laboratory. Water 2024, 16, 2049. https://doi.org/10.3390/w16142049
Zhang Y, Qian Z, Huang W, Chen X, Zhang Z, Ren J. Effect of Grain Size on the Uniaxial Compressive Strength of Ice Forming with Different Wind Speeds in a Cold Laboratory. Water. 2024; 16(14):2049. https://doi.org/10.3390/w16142049
Chicago/Turabian StyleZhang, Yujia, Zuoqin Qian, Weilong Huang, Xiaodong Chen, Zhen Zhang, and Jie Ren. 2024. "Effect of Grain Size on the Uniaxial Compressive Strength of Ice Forming with Different Wind Speeds in a Cold Laboratory" Water 16, no. 14: 2049. https://doi.org/10.3390/w16142049