Article

Multi-Source Remote Sensing Analysis of Yilong Lake’s Surface Water Dynamics (1965–2022): A Temporal and Spatial Investigation

1
College of Soil and Water Conservation, Southwest Forestry University, Kunming 650224, China
2
Yunnan Key Laboratory of Plateau Wetland Conservation, Restoration and Ecological Services, Kunming 650224, China
3
Dianchi Lake Ecosystem Observation and Research Station of Yunnan Province, Southwest Forestry University, Kunming 650224, China
*
Author to whom correspondence should be addressed.
Water 2024, 16(14), 2058; https://doi.org/10.3390/w16142058 (registering DOI)
Submission received: 17 May 2024 / Revised: 12 July 2024 / Accepted: 19 July 2024 / Published: 20 July 2024
(This article belongs to the Section Hydrology)

Abstract

:
With the acceleration of global warming and the intensification of anthropogenic activities, numerous lakes worldwide are experiencing reductions in their water surface areas. Yilong Lake, a typical shallow plateau lake located on the Yunnan–Guizhou Plateau in China, serves as a crucial water resource for local human production, daily life, and ecosystem services. Hence, long-term comprehensive monitoring of its dynamic changes is essential for its effective protection. However, previous studies have predominantly utilized remote sensing data with limited temporal resolution, thus failing to reflect the long-term variations in Yilong Lake’s water body. This study employs high temporal resolution monitoring, utilizing multi-source satellite data (e.g., KeyHole, Landsat, HJ-1 A/B) images spanning from 1965 to 2022 to investigate the changes in Yilong Lake’s surface area, analyzing the influencing factors and ecological impacts of these changes. The results indicate that from 1965 to 2022, Yilong Lake’s water surface area decreased by 8.33 km2, with a maximum surface area of 40.49 km2 on 7 January 1986, and a minimum surface area of 10.64 km2 on 20 April 2013. These changes are characterized by three significant phases: (1) a rapid shrinking phase (1965–1979); (2) a fluctuating shrinking period (1986–2016); and (3) an expanding recovery phase (2016–2022). Spatially, the most significant shrinkage was observed along the southern and southwestern shores of the lake. The driving factors varied across different periods: sunshine duration was the dominant influence during the rapid shrinking phase (1965–1979), accounting for 82% of the changes; population and cropland area were the main drive factors during the fluctuating shrinking period (1986–2016), accounting for 56% of the changes; and during the expanding recovery phase (2016–2022), the population accounted for 75% of the changes in the lake’s surface area. Currently, the protection of Yilong Lake depends on water supplementation and strict regulation of outflow, resulting in the lake exhibiting characteristics similar to a reservoir. This long-term investigation provides baseline information for future lake monitoring. Our research findings can also guide decision-makers in urban water resource management and environmental protection, ensuring the scientific and rational use of watershed water resources, effectively curbing the shrinkage of Yilong Lake, and achieving long-term sustainable restoration of the lake’s ecology.

1. Introduction

Lakes play a crucial role in terrestrial ecosystems, significantly influencing geochemical and ecological processes [1]. With over one million lakes globally, they account for 87% of Earth’s surface freshwater. These water bodies serve essential functions such as regulating regional climate, documenting local environmental variations, preserving the equilibrium of regional ecosystems, enhancing biodiversity, and offering valuable ecosystem services [2,3,4,5]. The reduction in the size of lakes will lead to a decrease in both the quality and quantity of water resources, resulting in ecological problems such as water salinization, land desertification, and a reduction in animal habitats [6,7,8]. Therefore, monitoring the spatial and temporal changes in lake areas is crucial and of significant importance for the protection of the regional ecology and effective water resource management, especially in the context of climate change and human activity disturbances.
Remote sensing technology has been extensively employed for monitoring alterations in inland lakes and coastal waters due to its high efficiency, broad coverage, and cost-effectiveness [9,10,11]. Remote sensing technology has enabled the examination of the continuous monitoring of lakes over the previous decades. The Landsat satellite program, initiated in 1972 through a collaboration between the National Aeronautics and Space Administration (NASA) and the United States Geological Survey (USGS), has remained operational to date. Therefore, Landsat has the most extensive monitoring data and a moderate spatial resolution. Consequently, several studies have employed Landsat for research on lake mapping [3,12,13,14,15]. However, a notable constraint of using Landsat images for research purposes is their unavailability of images prior to 1972. To address this limitation, researchers have extended the temporal scope of remote sensing studies on land surface changes by incorporating declassified KeyHole satellite images [16]. For example, Zhang et al. [17] measured the variations in lake sizes at various elevations in the Tianshan Mountains of Central Asia spanning from the 1960s to 2020 using both Landsat and KeyHole satellite images.
Yilong Lake, located in the Yunnan–Guizhou Plateau (YGP) lake region, one of China’s five major lake regions, stands as one of the nine principal plateau lakes in Yunnan Province. It plays a crucial role in maintaining the ecological balance of the watershed and its surrounding areas, as well as in promoting economic development [18,19,20]. However, as a typical shallow plateau lake, Yilong Lake is particularly susceptible to rapid changes driven by meteorological and anthropogenic factors [21]. Currently, researchers have used remote sensing technology to investigate the dynamic changes in the area of Yilong Lake and have made some progress. For instance, Xiao et al. [22] analyzed the area changes in Yilong Lake from 1985 to 2015 using Landsat images at 5-year intervals, concluding that the area of Yilong Lake rapidly decreased after 2010. Additionally, they identified the 2010 drought as the primary catalyst for the lake’s shrinkage. Similarly, Li et al. [23] believed that the continuous shrinkage of Yilong Lake since 1989 was predominantly due to decreased precipitation and increased water usage. Wu et al. [24] observed changes in Yilong Lake from 2000 to 2015 using images at 1-year intervals, noting that the rapid shrinkage commenced in 2011.
Previous studies related to the remote sensing monitoring of Yilong Lake’s area were conducted through sparse temporal dynamics analysis. Typically, a single image was employed to depict the surface of Yilong Lake for each year, with intervals ranging from one to ten years. Such methodologies might overlook critical information about the lake’s evolution and fail to fully capture its changes [4]. Furthermore, previous studies lacked observational data preceding 1985, which is crucial for determining the lake’s original state [12]. Additionally, previous studies presumed a continuous shrinkage trend for Yilong Lake, neglecting how the current dynamics of the lake area have evolved. Furthermore, these studies often overlooked the identification of change stages and the quantification of corresponding driving factors.
To address these issues, this study aims to enhance the understanding of the changes in Yilong Lake’s area and its driving factors from the following perspectives: (1) utilizing multi-source remote sensing images to obtain comprehensive coverage of the study area, thereby extending the length and density of the observation time series of Yilong Lake; (2) examining driving factors using continuous monitoring data, which can provide more representative results; and (3) both meteorological and anthropogenic factors in the analysis to quantify the corresponding dominant driving factors causing changes in Yilong Lake’s area. Therefore, our study fills the research gap concerning the temporal and spatial changes and driving factors of Yilong Lake’s water area over a 57-year time series.
In summary, this study aims to track the spatiotemporal dynamics of Yilong Lake from 1965 to 2022 using multi-source long-sequence remote sensing images. By identifying the attribution of driving factors of Yilong Lake variations during different periods through multiple linear regression analysis, it thoroughly explores the ecological impacts of changes in Yilong Lake’s area. The long-term monitoring results of this study will provide scientific evidence for the protection of Yilong Lake’s ecosystem and water resource management and may be applicable to other shallow lakes in the Yunnan–Guizhou Plateau.

2. Materials and Methods
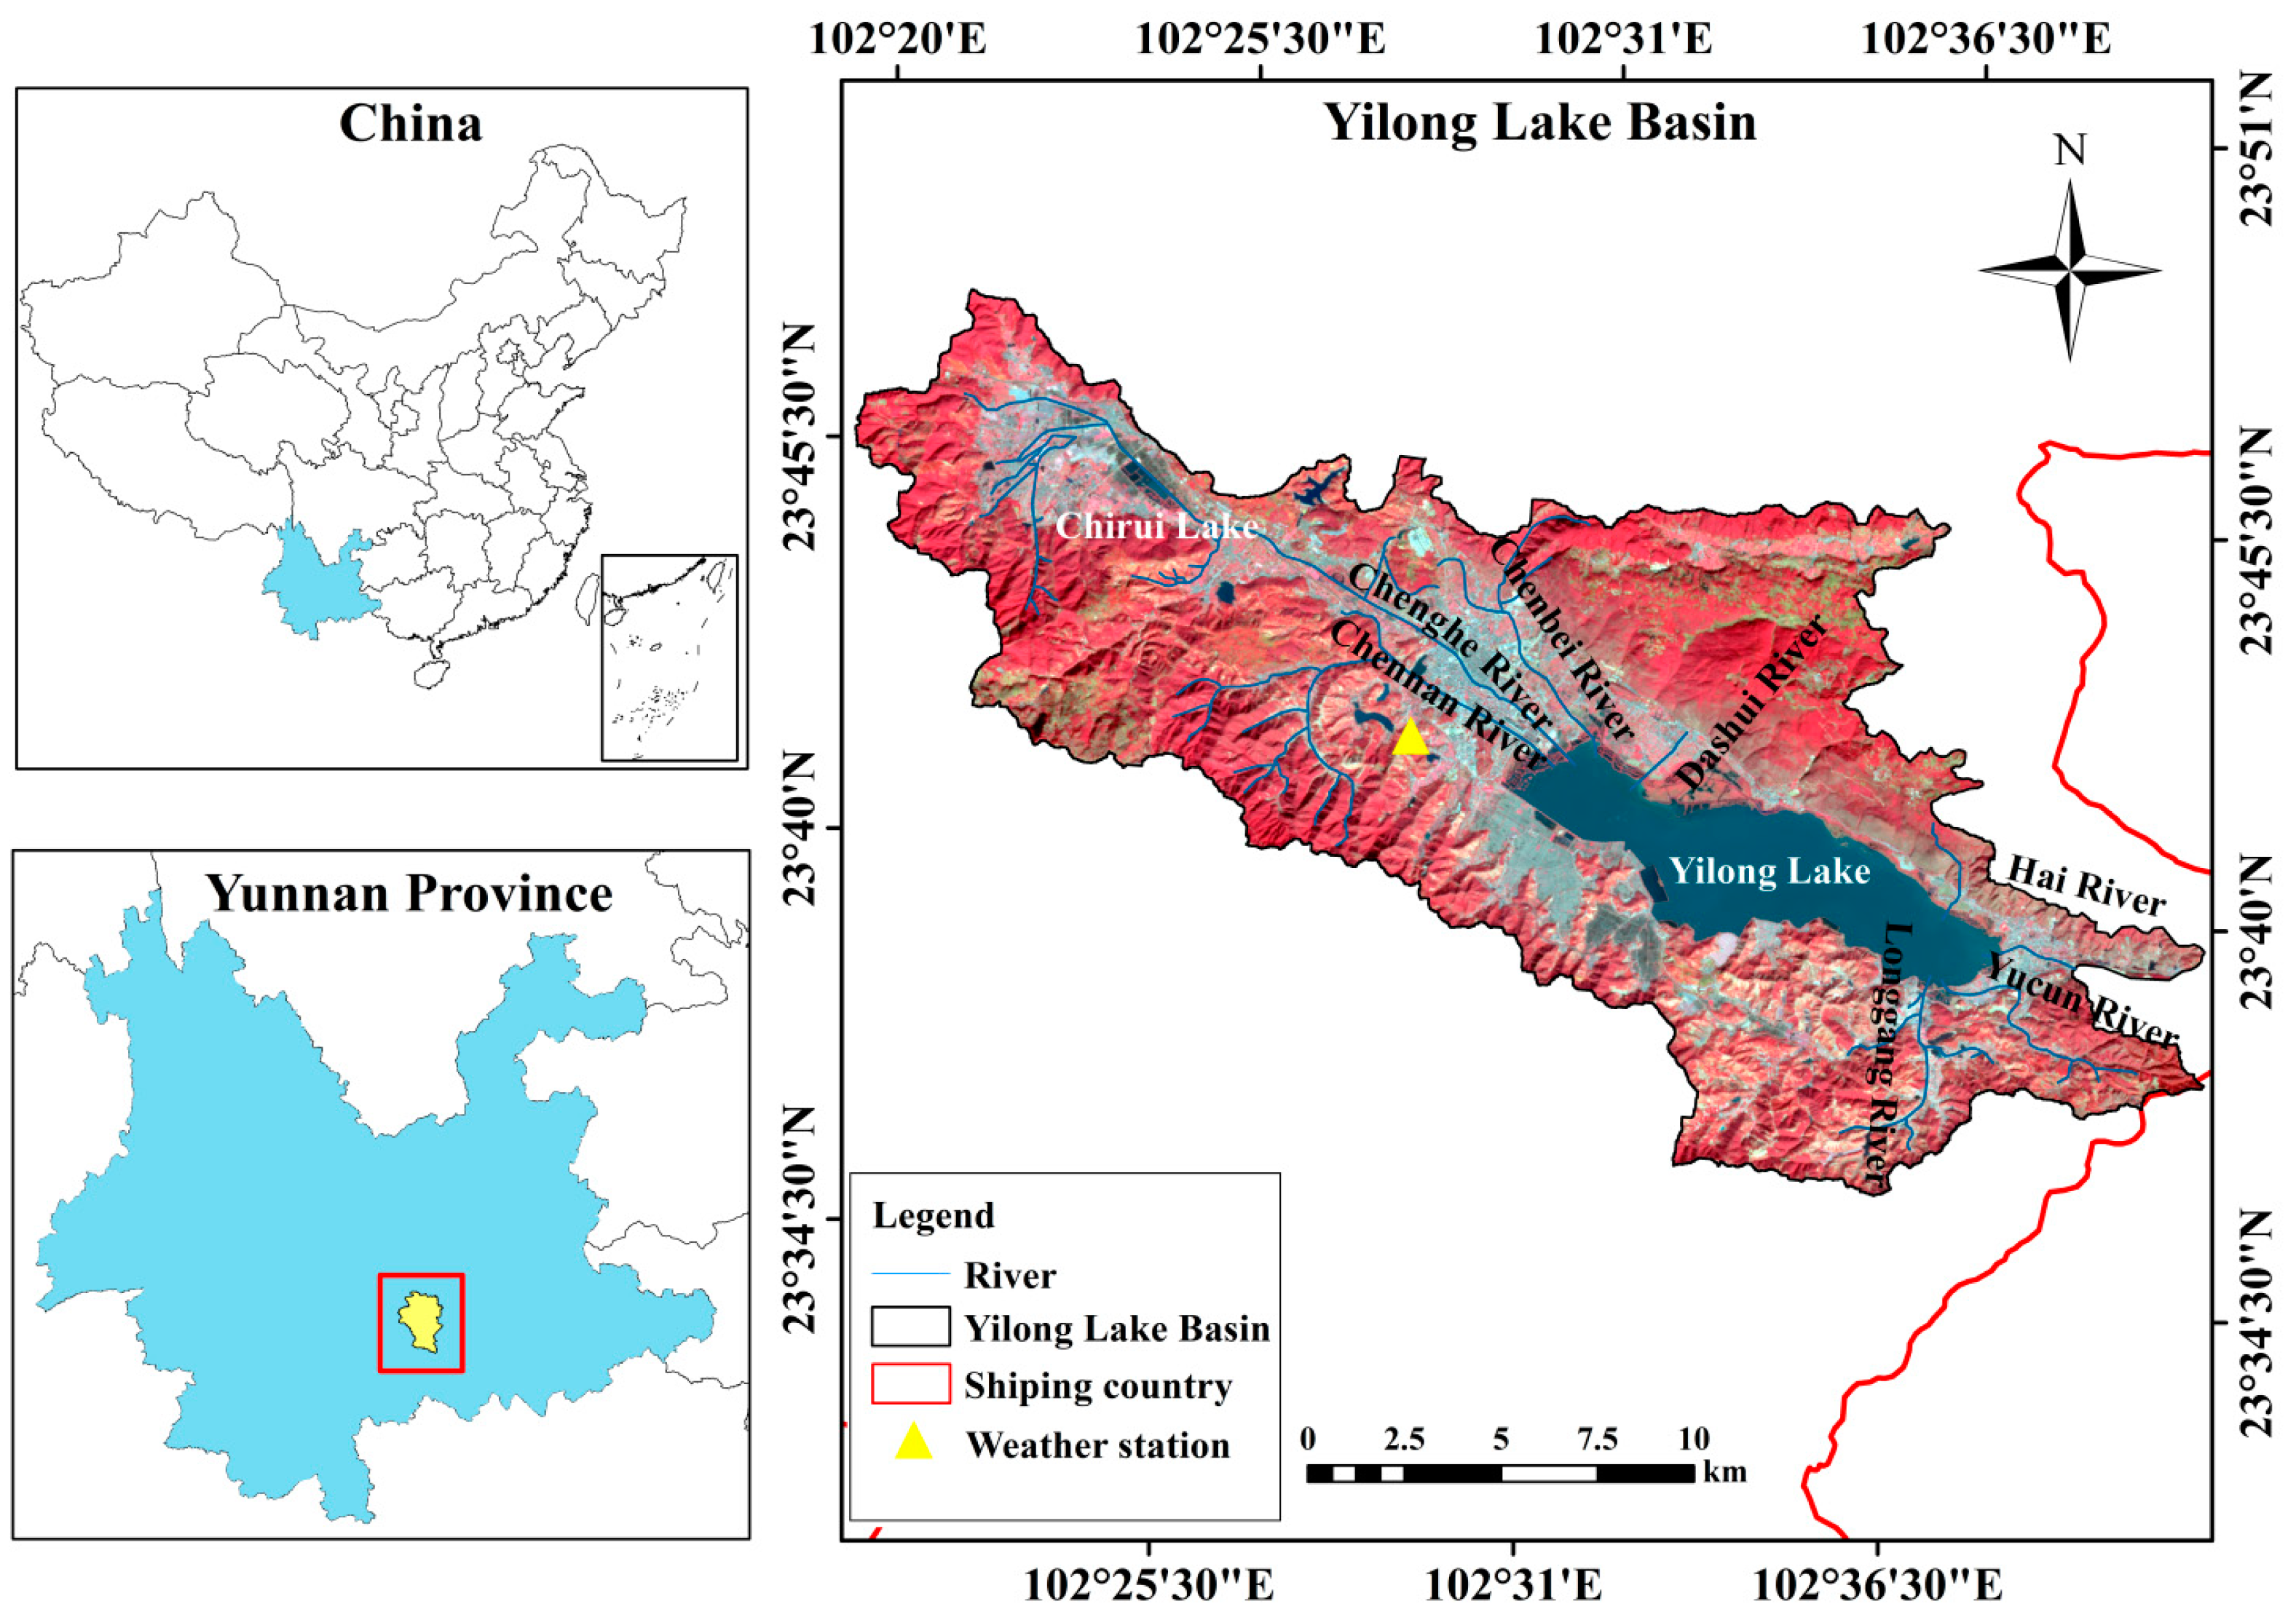
2.1. Study Area

The Yilong Lake Basin is situated in Shiping County (23°38′37″–23°42′05″ N, 102°28′52″–102°38′49″ E), Yunnan Province, Southwest China. Covering an area of 360.4 km2 and ranging in altitude from 1289 m to 2180 m, it stands as the most southern freshwater lake on the plateau of Southern China (Figure 1). The Yilong Lake Basin is situated in a region characterized by a north subtropical arid monsoon and mid-subtropical semi-humid monsoon climate. Precipitation levels exhibit significant seasonal variations, with the wet season occurring from May to October and the dry season from November to April of the following year. Yilong Lake is nourished by six rivers: the Chenghe River, the Chengbei River, the Chengnan River, the Longgang River, the Dashui River, and the Yucun River. The Hai River is situated on the eastern bank of the lake, serving as its outlet.

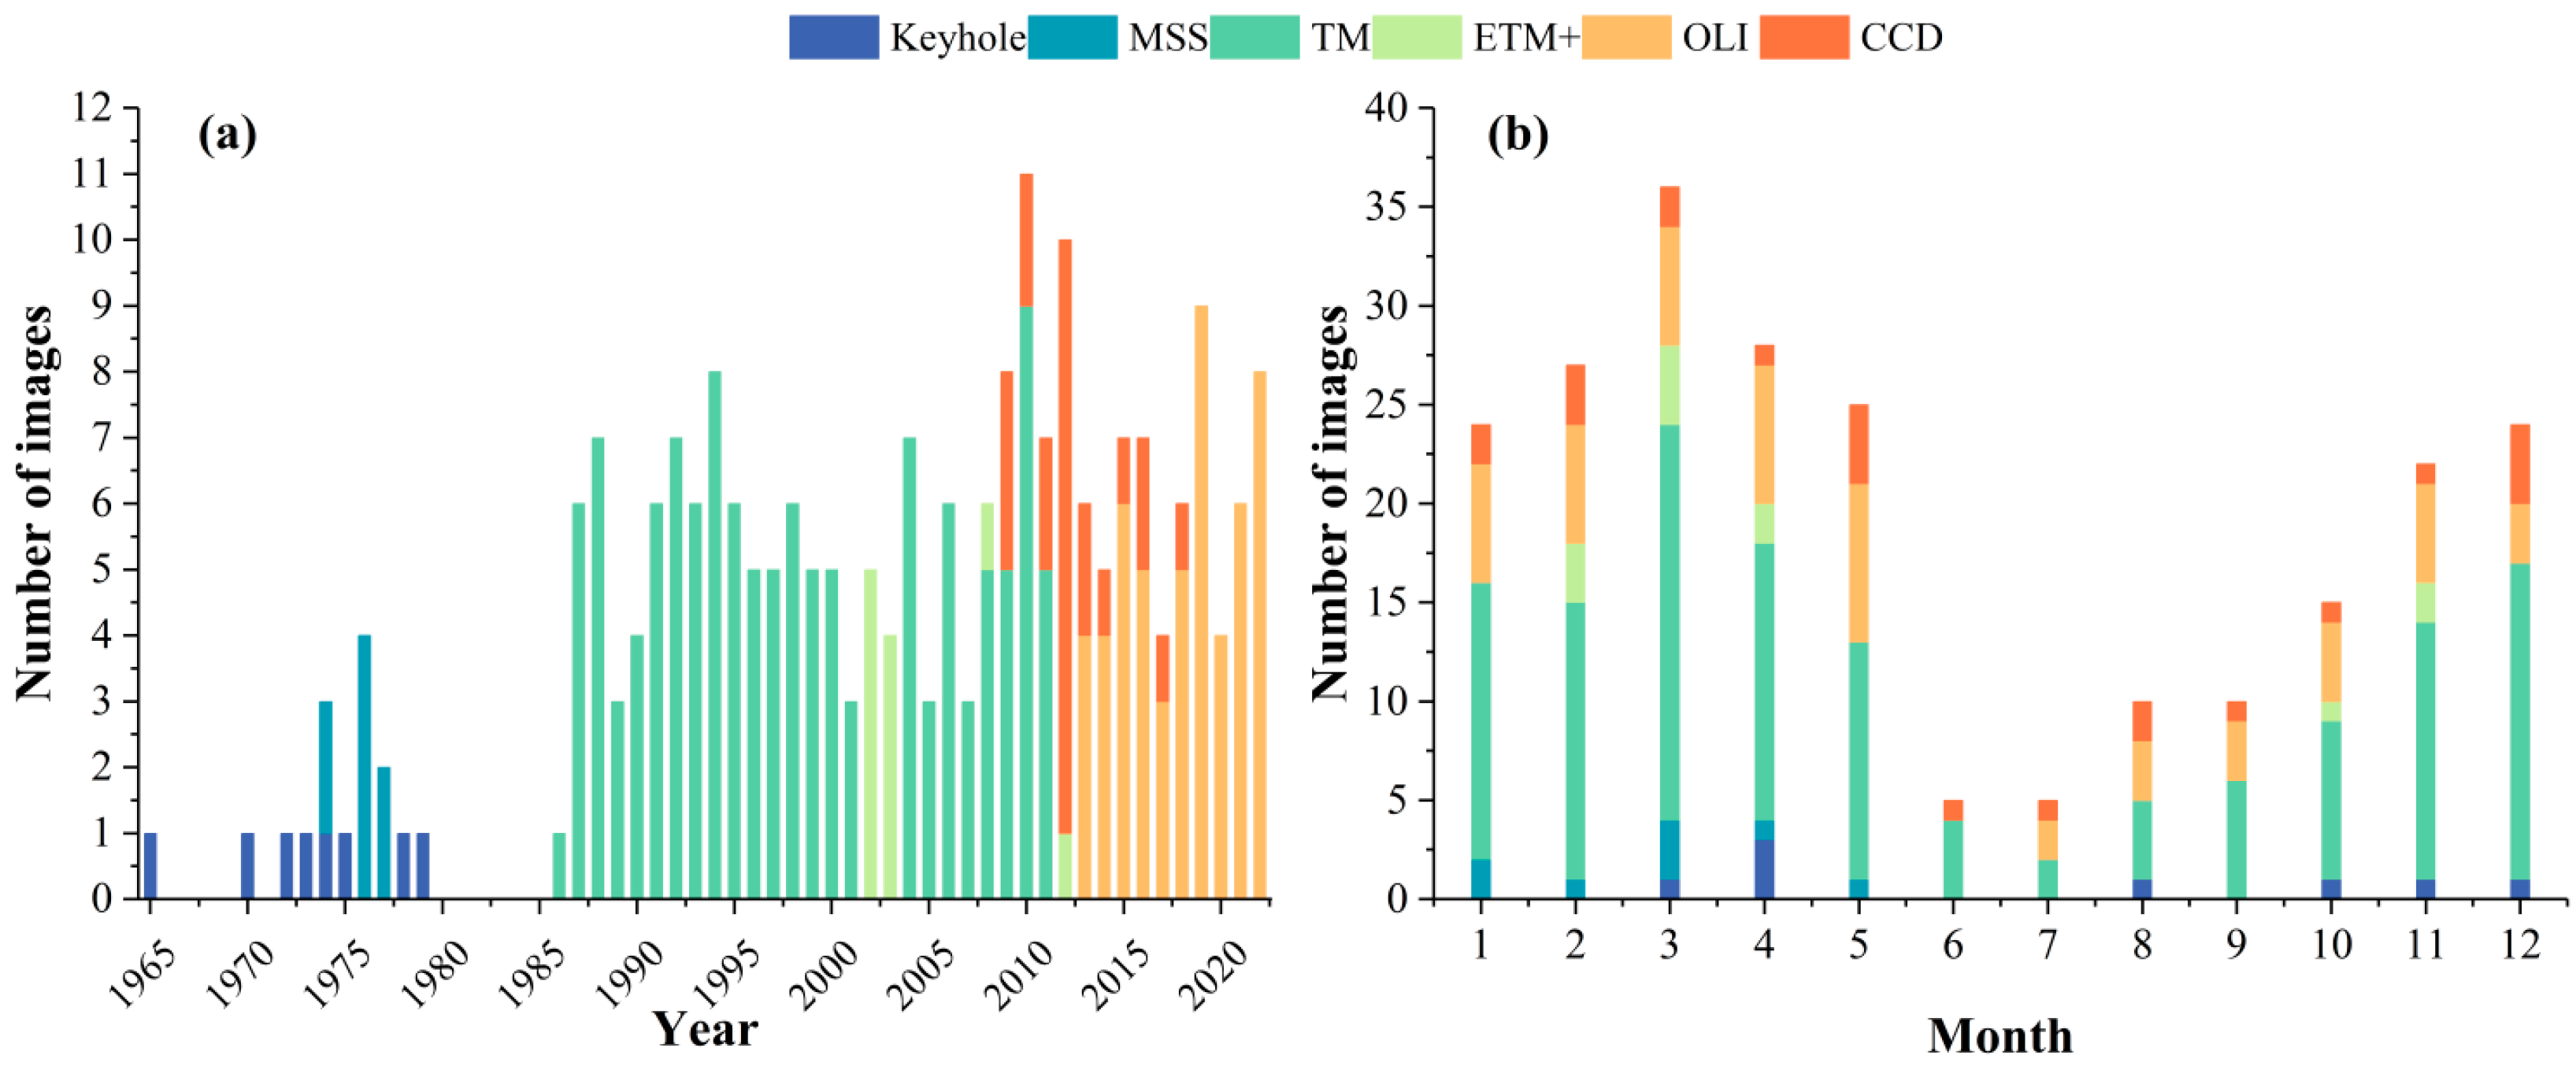
2.2. Data Collection

Remote sensing images were retrieved from USGS (http://www.usgs.gov/ (accessed on 7 February 2023)), Geospatial Data Cloud (http://www.gscloud.cn/ (accessed on 12 February 2023)), and the China Centre for Resources Satellite Data and Application (https://www.cresda.com/ (accessed on 20 February 2023)). A total of 223 remote sensing images captured between 1965 and 2022 were chosen for analysis (Figure 2). Specifically, 31 images exhibit cloud coverage of less than 30%, while the remaining 192 images show either no cloud coverage or only a minimal amount. These images consist of KeyHole (1965–1982, 9 images), Landsat MSS (1974–1976, 9 images), Landsat TM (1986–2011, 127 images), Landsat ETM+ (2012, 9 images), HJ-1 A/B CCD (2012–2017, 25 images), and Landsat OLI (2013–2022, 54 images). The technical specifications of each satellite sensor are outlined in Table 1.
To investigate the impact of meteorological factors and anthropogenic activities on the fluctuation of the lake’s surface areas, climate data such as air temperature, precipitation, average evaporation, and sunshine duration [25,26] were acquired from 1965 to 2022. These datasets were sourced from the monthly meteorological reanalysis dataset provided by the European Centre for Medium-range Weather Forecasts (https://cds.climate.copernicus.eu/ (accessed on 12 April 2023)) for the period of 1965 to 1979, and the monthly meteorological data monitored by Shiping County Weather Station from 1980 to 2022. Annual average air temperature, annual average precipitation, and annual average evaporation are derived from monthly statistical values calculated each year, while the annual value for sunshine duration is obtained by summing the monthly values from January to December of that year. The anthropogenic activity data pertaining to the population, Gross National Product (GDP), and cropland area [12] in the Yilong Lake Basin were gathered from the Shiping County Yearbook, the Honghe Prefecture Yearbook, and the Yunnan Yearbook.

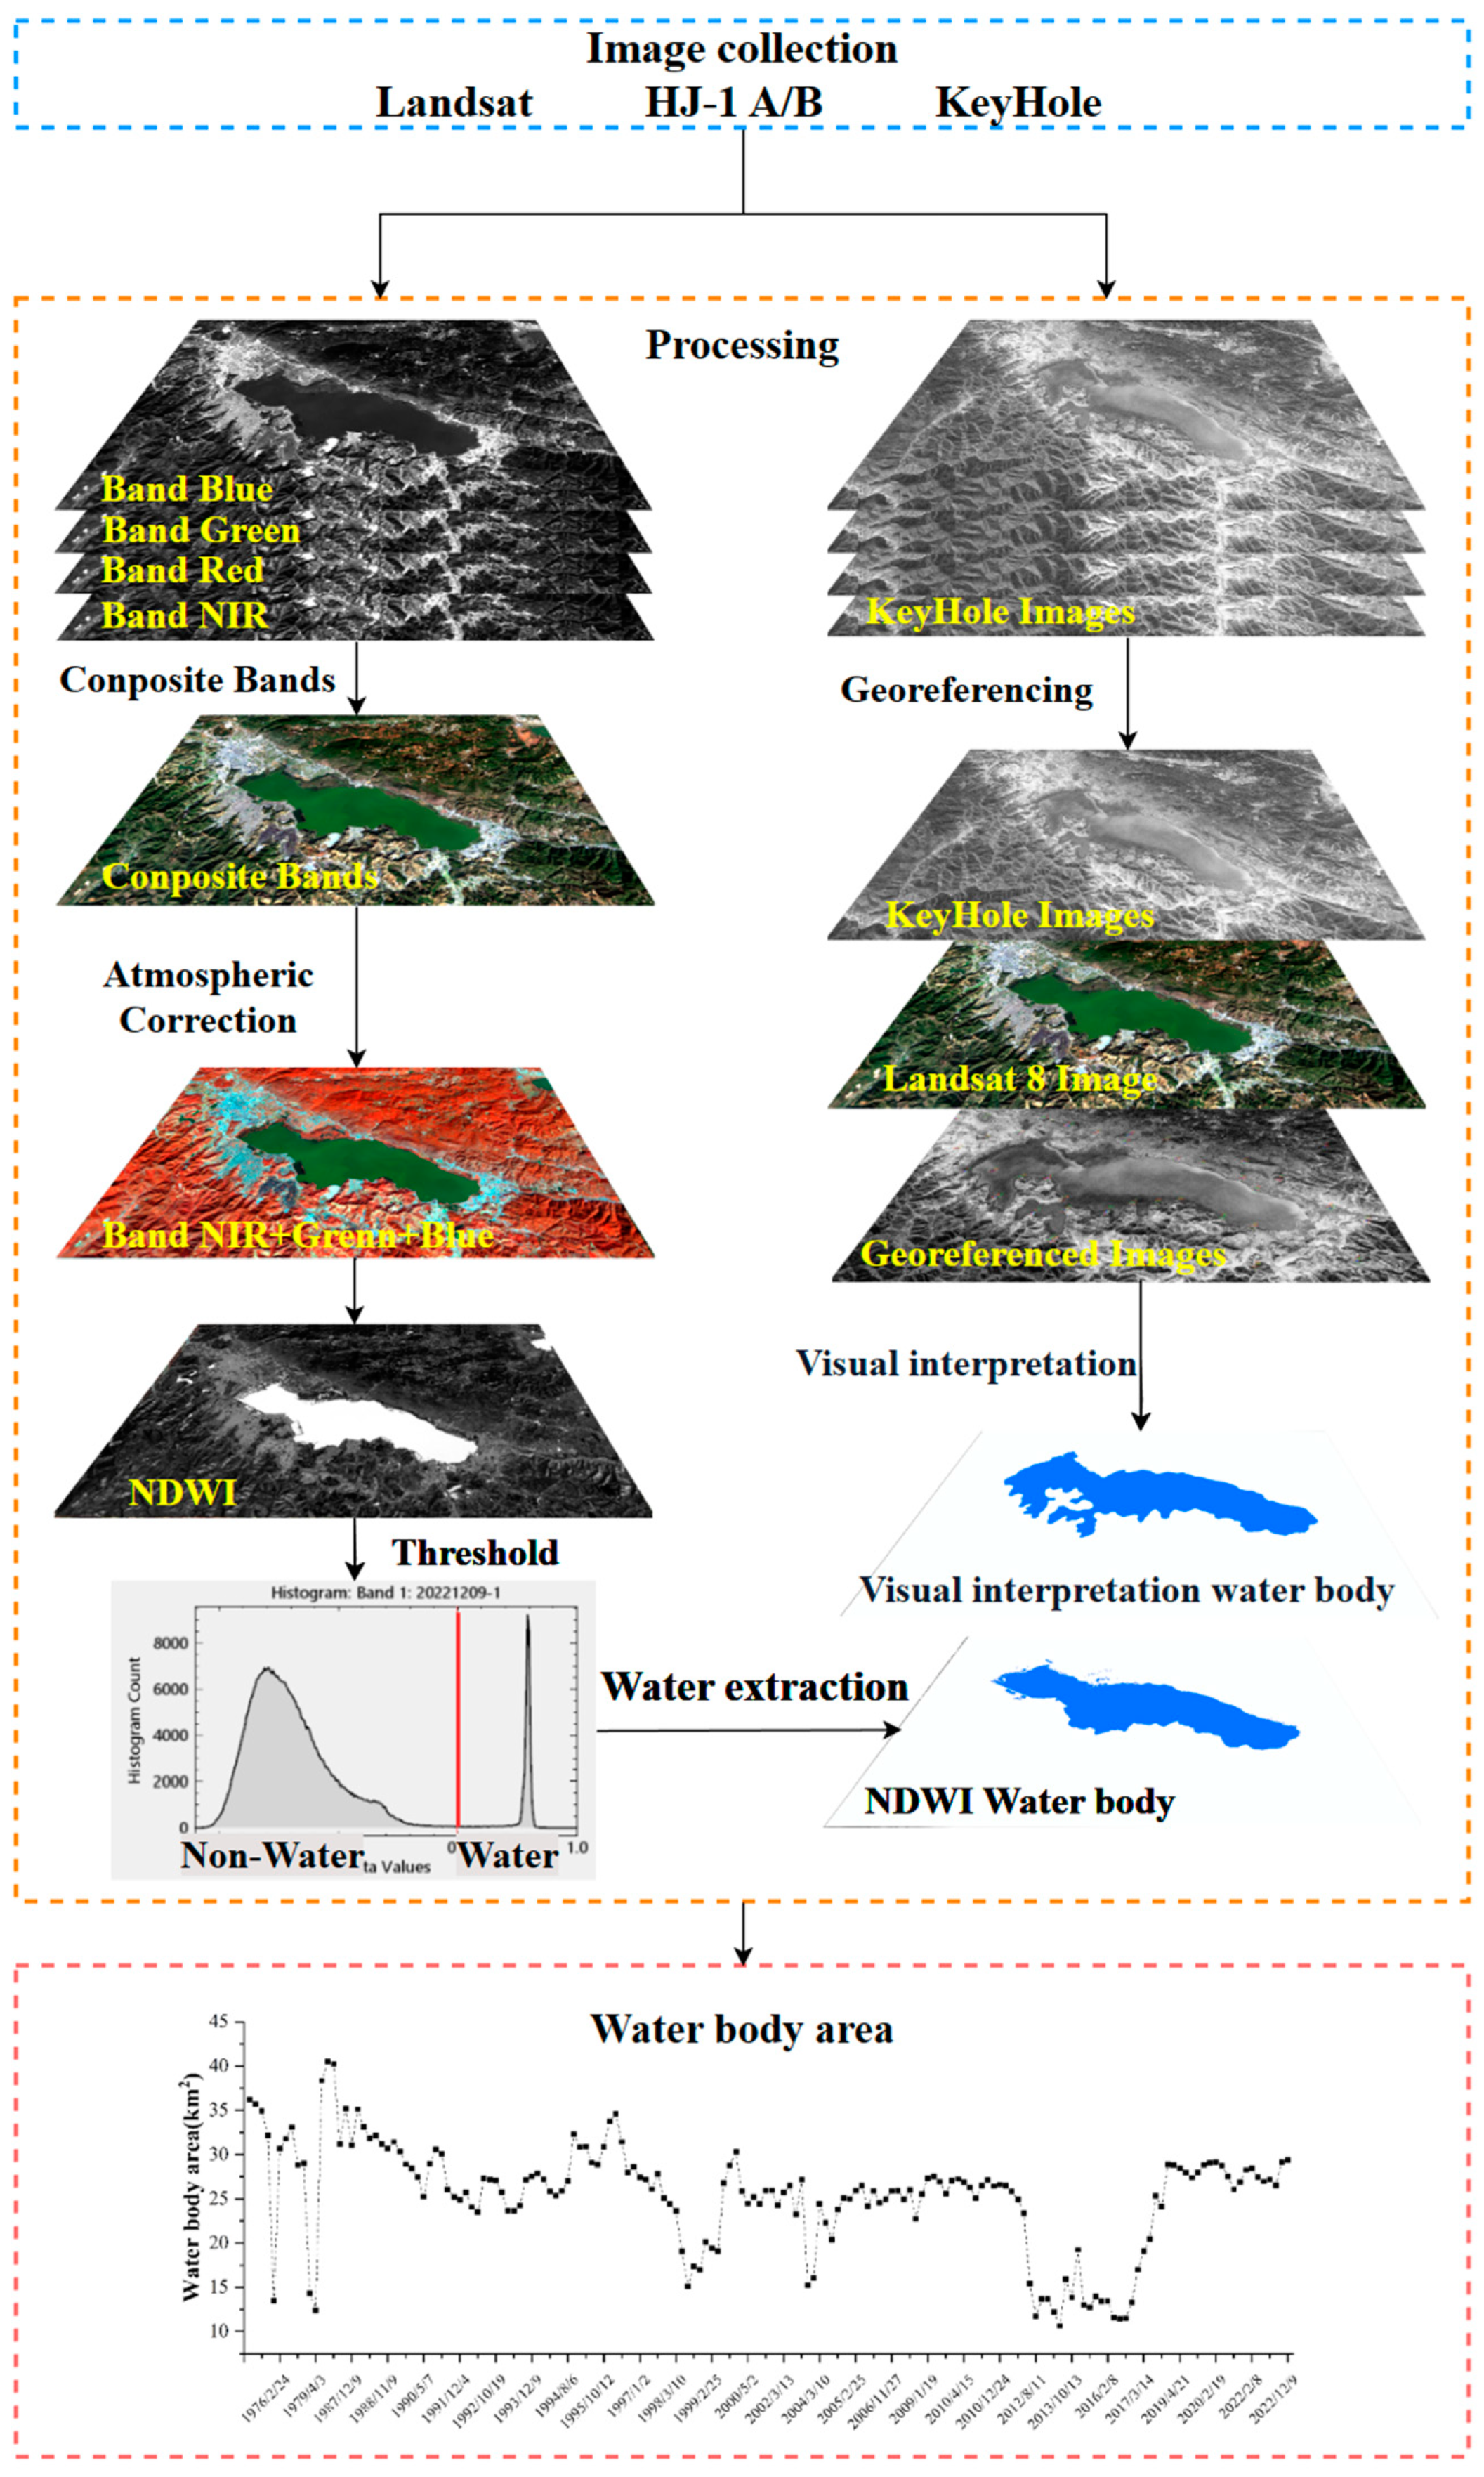
2.3. Data Processing

2.3.1. Preprocessing

The KeyHole series of satellite images is captured utilizing the panchromatic band. In this investigation, KeyHole images utilized exhibit a resolution ranging from 1.8 m to 2.7 m. These images lack coordinate parameters as they are derived from scanned films. Due to the geometric distortion present in KeyHole images, their accuracy fails to meet the necessary standards. Therefore, KeyHole images were considered aerial imagery and were georeferenced using ArcGIS 10.8. Landsat-8 OLI images are employed for the calibration of KeyHole raw images. The control point and overlay map post-correction are depicted in Figures S1 and S2.
Given that the acquired multi-spectral satellite images are subject to the absorption and scattering impacts of atmospheric particles, it is imperative to employ effective and dependable atmospheric correction techniques to mitigate atmospheric interference. This is essential for enhancing accuracy and ensuring consistency in deriving precise lake surface area characteristics. The Fast Line-of-View Sight Atmospheric Analysis of Spectral Hypercubes (FLAASH) model is utilized for conducting atmospheric corrections on each multi-spectral image. Before delineating the lake’s surface area, all images are resampled to a uniform sampling rate of 15 m to mitigate discrepancies arising from variations in spatial resolutions across the images.

2.3.2. Lake Surface Water Body Area Extraction and Validation

The KeyHole images were extracted through visual interpretation following correction. The application of NDWI has the potential to improve the visibility of water features in images by minimizing the presence of soil and land vegetation features. The images underwent radiometric and atmospheric corrections prior to the calculation of NDWI. A higher NDWI value indicates a greater probability of water presence within the pixel. Consequently, NDWI is frequently utilized for the extraction of the lake’s surface area information and the classification of pixels into water-related and non-water-related categories by establishing a threshold. The threshold selection for each sensor is detailed in Table S1. NDWI is computed using the following equation:
NDWI = ρ Green ρ NIR ρ Green + ρ NIR
where ρ Green is the green band (0.52–0.6 μm) of images and ρ NIR is the near-infrared band (0.77–0.9 μm). Additionally, the Multi-spectral Scanner (MSS) sensor incorporates two near-infrared (NIR) bands, with the selection of the NIR1 band (0.7–0.8 μm) for NDWI calculation. The lake’s surface area extraction is depicted in Figure 3.
Random sampling was employed through Google Earth to assess accuracy. A total of 400 random sampling points were selected within the basin. Subsequently, each sampling point was visually interpreted using very-high-resolution (VHR) images from Google Earth. Finally, this study computed the overall accuracy, kappa coefficient, producer accuracy, and user accuracy. The spatial distribution of sampling points is illustrated in Figure S3. Additionally, the National Tibetan Plateau Data Center (TPDC) was utilized to publish the Chinese Lake Dataset (https://data.tpdc.ac.cn (accessed on 14 April 2023)) for assessing the accuracy of the lake’s surface area extraction [27]. This dataset examines the fluctuations in the quantity and surface area of lakes (>1 km2) in China over the last six decades, with data collected at 10-year intervals (1960–1990) and 5-year intervals (1990–2020). The dataset was utilized to validate the precision of the lake’s surface area results extracted in previous studies [3].

2.3.3. Lake’s Surface Area Dynamic Analysis

The dynamic degree (∆a) of a lake’s surface area signifies the rate of change in the surface area of a lake during various observation periods [28]. This indicator quantifies the trend and rate of contraction and expansion of a specific lake’s surface area, which can be determined as follows:
a = S t 1 S t 2 S t 1 × 100 %
where a is the change rate of the lake’s surface area in a particular period, while St1 and St2 are the lake’s surface area at the beginning and end of the study, respectively.

2.3.4. Multiple Linear Regression (MLR) Analysis for Driving Factors

The MLR model is employed to examine the association between one or more independent variables and a dependent variable. In this instance, the dependent variable pertains to the dynamic changes in the lake, while the independent variables encompass factors that could potentially impact the lake’s dynamics, including climate variables and indicators of anthropogenic activity. The calculation is expressed as follows:
Y = β 0 + β 1 X 1 + β 2 X 2 + + β n X n + ε
where Y is the dependent variable; X1, X2, and X3 are the independent variables; β0 is the intercept; β1, β2βn are the coefficients of the independent variables, representing the impact of the independent variables on the dependent variable; and ε is the error term. Additionally, multicollinearity frequently arises as a challenge in the analysis of MLR, potentially compromising the stability and interpretability of the model. This study employed stepwise regression as a method to mitigate the problem of multicollinearity. MLR analysis is conducted utilizing MATLAB software (https://www.mathworks.com (accessed on 7 January 2023)).

3. Results

3.1. Accuracy of Lake’s Surface Area Extraction

To ensure the accuracy of extraction, all the lake’s surface areas were extracted by the same individual, and various accuracy assessment analyses were conducted. The random verification results indicated an overall accuracy of 96.45% and a kappa coefficient of 0.91 (Table S2). Additionally, this study conducted a comparison of the results with the corresponding temporal scales in the Chinese Lake Dataset (Table 2). The discrepancies between the two datasets are as follows: 3.36% (1970), 0.3% (1990), 0.1% (1995), 1.51% (2000), 3.43% (2005), 0.97% (2010), 0.89% (2015), and 0.97% (2020), resulting in an average deviation of 0.36%. In general, the error rate for the extracted lake’s surface area data is typically below 1.00%, with the exception of the errors observed in 1970 and 2005. This observation highlights the high precision of the surface area data in Yilong Lake.

3.2. Variations of Yilong Lake

3.2.1. Annual Variations in Surface Area of Yilong Lake

The surface of Yilong Lake was delineated using 223 remote sensing images captured between 1965 and 2022. The analysis indicates a consistent trend in the maximum, minimum, and average surface areas of Yilong Lake since 1965 (Figure 4). During this period, Yilong Lake exhibited a maximum surface area of 40.49 km2 on 7 January 1986, and a minimum surface area of 10.64 km2 on 20 April 2013 (Figure 4a,b and Table S3). The annual average surface area was recorded at 25.38 km2. Yilong Lake exhibits a fluctuation in its surface area, ranging from 40.49 km2 to 12.44 km2, representing a 59.54% increase and a 50.99% decrease compared to the average annual lake’s surface area.
The annual average lake’s surface area is most closely aligned with the variations in the lake’s surface area range (Figure 4c). Therefore, considering the fluctuation in the annual average surface area of Yilong Lake, two pivotal years, 1979 and 2016, have been identified to segment the changes in Yilong Lake into three periods for a detailed examination. The first period, from 1965 to 1979, witnessed a reduction in the surface area of Yilin Lake (R2 = 0.50, Slope= −1.618, p < 0.05). The surface area reached its peak average area of 36.26 km2 in 1965 and its lowest average area of 12.44 km2 in 1979, marking a 65.69% decrease compared to 1965, and equivalent to 23.82 km2 (Table 3). The absence of available images in 1974 and 1975 hindered the observation of the lake’s shrinkage and subsequent restoration during this period. The second period, spanning from 1986 to 2016, continued to show a decline in the surface area of Yilong Lake (R2 = 0.69, Slope= −0.495, p < 0.001) despite a few expansions that occurred in 1986–1987, 1991–1995, and 1998–2000. Especially, the period between 2011 and 2012 experienced a significant reduction in the lake’s surface area, with the lake’s surface area decreasing by 41.65% and the average area diminishing by 10.72 km2 (Table 3). Additionally, from 2016 to 2022, there was an expansion trend in the surface area of Yilong Lake (R2 = 0.71, Slope = 0.17, p < 0.05), leading to an increase in the average lake’s surface area from 12.25 km2 in 2016 to 27.93 km2 in 2022. The most substantial expansion of 6.66 km2 was observed during the period of 2016–2017, exhibiting a growth rate of 53.88% (Table 3). By 2022, the average surface area of Yilong Lake had reverted to the levels observed in the early 1990s.
The surface area of Yilong Lake underwent three periods of change between 1965 and 2022. These periods include the rapid shrinkage phase (1965–1979), the fluctuating shrinkage phase (1986–2011), and the expanding recovery phase (2016–2022). This study provides a detailed account of the evolving surface area of Yilong Lake since 1965, a phenomenon that has not been previously documented.

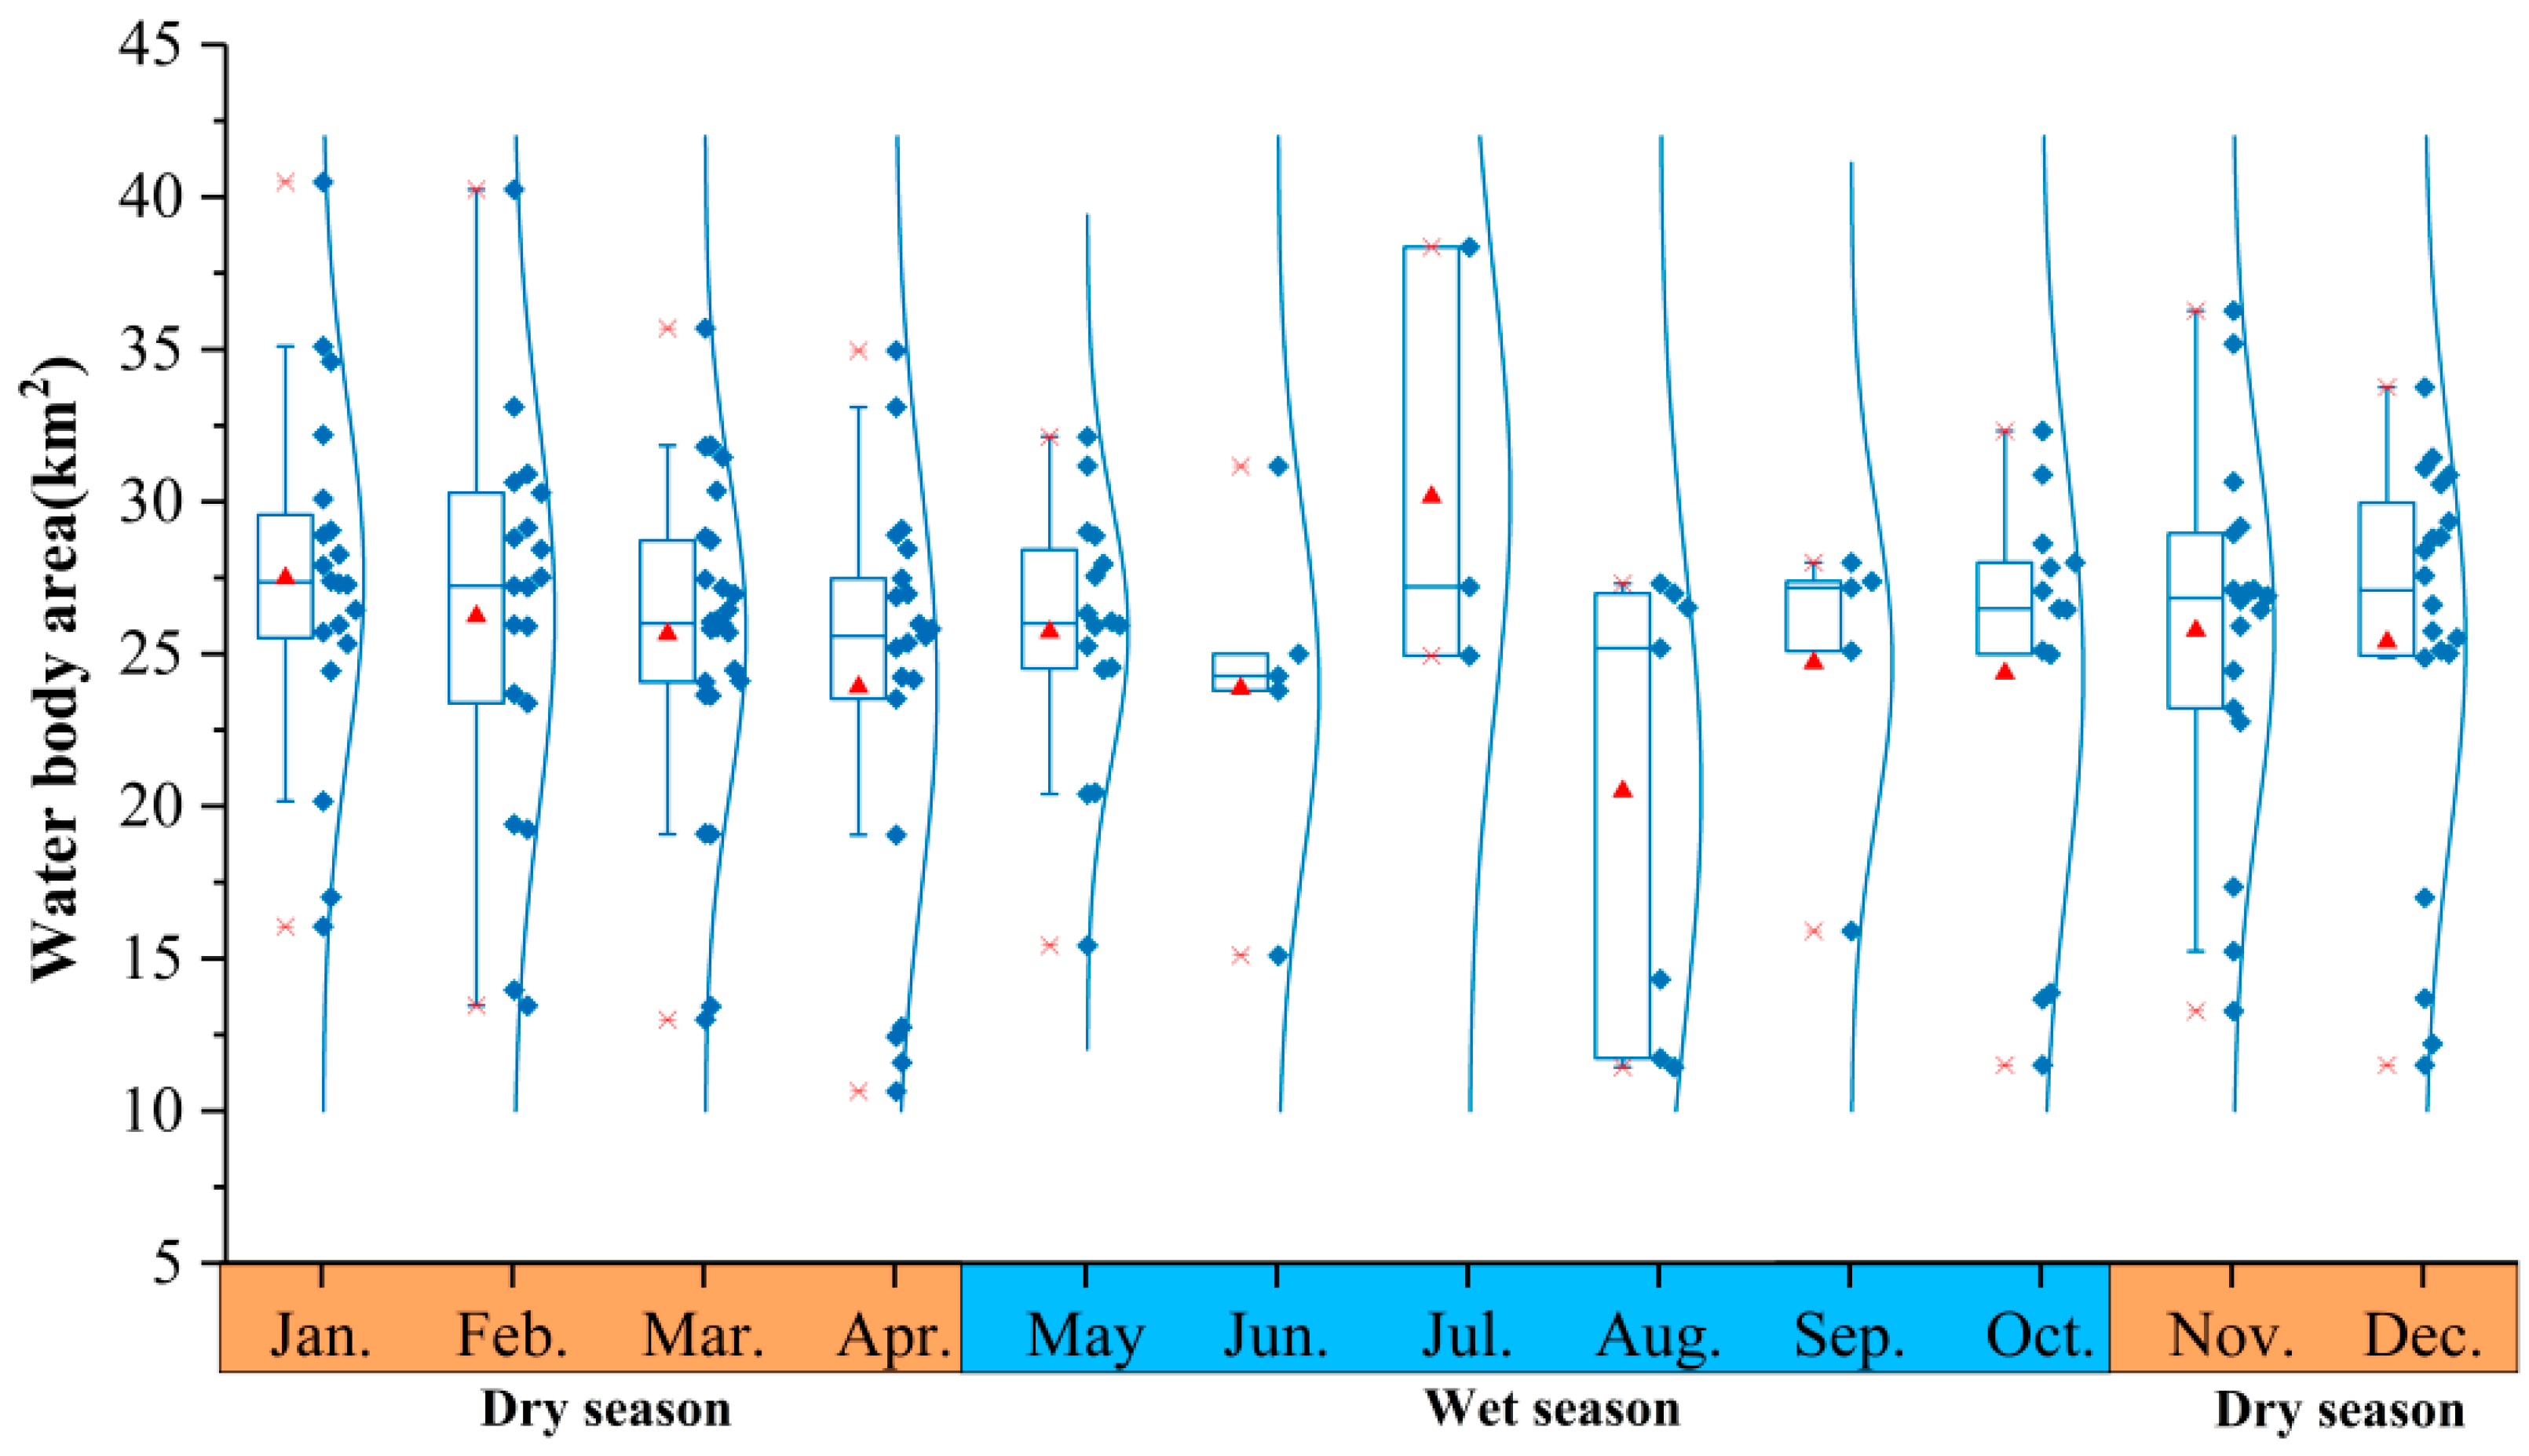
3.2.2. Seasonal Variations in Surface Area of Yilong Lake

To analyze the monthly variations in the surface area of Yilong Lake, box plots were constructed (Figure 5). A consistent observation across these plots is the widening gap between the upper and lower boundaries of the boxes. This phenomenon is attributed to the increased cloud cover during the wet season in the Yilong Lake Basin, particularly from June to August, resulting in a limited number of available images during this period (Figure 2). Consequently, the distinction between dry and wet seasons is not evident in terms of median values, indicating the presence of fluctuating and uncertain changes in the lake’s surface area. More anomalous small values are particularly observed in March, April, October, and December, suggesting that the surface area of Yilong Lake typically contracts during the dry season (from November to April of the following year). Yilong Lake exhibits a monthly average area ranging from 25 to 30 km2, with the highest and lowest values of the average lake’s surface area recorded in July and June, specifically, 30.16 km2 and 23.86 km2, respectively. Based on the remote sensing images, the smallest and largest surface extents of Yilong Lake were observed in April (20 April 2013, 10.64 km2) and January (7 January 1986, 40.49 km2), respectively. In general, the surface area of Yilong Lake does not exhibit significant seasonal variations.

3.2.3. Spatial Variations in Surface Area of Yilong Lake

Figure 6 illustrates the spatial variations of the surface area of Yilong Lake from 1965 to 2022. The lake’s surface area data extracted using NDWI and visual interpretation from dates as proximate as feasible were chosen. The analysis focuses on the original Yilong Lake in 1965 to examine the spatial variability of this water body. The results indicate a significant transformation in the spatial characteristics of Yilong Lake from 1965 to 2022. Significantly, the prominent lakes on the southwest and south banks have vanished, leading to a substantial transformation in the lake shoreline. During the period from 1965 to 1979, Yilong Lake underwent two reductions in its surface area, with the southern part of the lake completely disappearing after 1977. Between 1986 and 2016, there was a gradual expansion and stabilization of the surface area of Yilong Lake. The largest area was recorded in 1987, particularly on the north bank of the lake, surpassing the boundaries observed in 1965. After 1986, the water level on the southwest shore of Yilong Lake started to recede, eventually drying up completely by 1990. From 2012 to 2016, there was a reduction in the lake’s surface area, leading to the western and eastern parts becoming disconnected and exhibiting a fragmented spatial structure. Since 2017, there has been a reconnection and expansion of the lake’s surface area, leading to the maintenance of a stable spatial structure from 2019 to 2022. The shoreline of Yilong Lake experienced its most convoluted shape during the 1960s. Since that time, the shoreline has gradually become linear and has maintained this form to the present day. Spatially, the changes in Yilong Lake can be categorized into two types: the permanent disappearance of the water body and the reemergence of the water body following a period of shrinkage.

3.3. Variations of Meteorological Factors

In this study, meteorological factors such as air temperature, precipitation, evaporation, and sunshine duration have been selected. The changing trends of meteorological factors in the Yilong Lake Basin are illustrated in Figure 7. The air temperature in the Yilong Lake Basin has exhibited significant fluctuations since 1965 (Figure 7a), indicating an overall warming trend (R2 = 0.62, Slope = 0.03 °C/year, p < 0.001). The average air temperature between 1965 and 2022 was approximately 17.09 °C, with the highest and lowest annual average air temperatures recorded as 18.52 °C in 2019 and 15.15 °C in 1965, respectively. On a monthly basis (Figure 7b), fluctuations in air temperature within the Basin were observed to be significant, reaching peak values in June and the lowest values in January, corresponding to seasonal variations. Furthermore, the mean annual precipitation between 1965 and 2022 amounted to 1272.56 mm. The highest and lowest levels of precipitation, 1524.46 mm and 933.35 mm, were recorded in 1968 and 2019, respectively. Precipitation exhibited a significant decreasing trend (R2 = 0.21, Slope = −4.48 mm/year, p < 0.001). The precipitation in the Yilong Lake Basin exhibits a seasonal distribution impacted by the subtropical monsoon climate (Figure 7d). It typically rises steadily from February to August and declines from September to January of the following year. Evaporation in the Yilong Lake Basin exhibited a declining trend (R2 = 0.15, Slope = −1.35 mm/year, p < 0.05). It increased gradually from January, peaked in August, and subsequently decreased (Figure 7f). Between 1965 and 2022, there was an increasing trend in the average annual sunshine duration (R2 = 0.28, Slope = 1.83 h/year, p < 0.001). The longest sunshine duration was recorded in 2019 at 1795.35 h, while the shortest duration was observed in 1966 at 1505.53 h. The annual average sunshine duration amounted to 1609.82 h. When examined on a monthly basis, the period spanning from March to May exhibits the lengthiest sunshine duration, typically exceeding 160 h, followed by the period from June to August (Figure 7h). Over the last 57 years, there has been a gradual increase in air temperature and sunshine duration in the Yilong Lake Basin. Conversely, precipitation and evaporation have shown a decreasing trend annually, indicating a pattern of warming and drought.

3.4. Variations of Anthropogenic Factors

Gross Domestic Product (GDP), population, and cropland area within the Basin are regarded as anthropogenic activity factors. From 1965 to 2022, the average annual GDP in the Yilong Lake Basin amounted to CNY 2.197 billion. Prior to 1995, the growth rate was sluggish, characterized by an average annual increase of only CNY 22 million. After 2000, the average annual growth rate amounted to CNY 694 million (Figure 8a). The population in the Basin has shown a consistent growth trend (Figure 8b). Concurrently, the cropland area has been expanding from 1965 to 2020, peaking at 179.58 km2 in 1998, representing a 31.87% increase compared to the area in 1965. The complexity of cropland area change in the Basin surpasses that of population and GDP trends, which is noteworthy. Prior to 1986, the cropland area in the Basin exhibited fluctuating growth, increasing at a rate of 0.74 km2/year. Between 1986 and 1997, there was a significant increase in cropland area, with an annual growth rate reaching 3.86 km2. In 2018, there was a decrease in the cropland area, which decreased from 171.93 km2 to 142.14 km2 (Figure 8c).
Furthermore, the development of reclamation initiatives surrounding Yilong Lake warrants consideration. By conducting a comparative analysis of the annual remote sensing images, this study summarizes the dikes that exert a permanent impact on the surface area of Yilong Lake (Figure 9). Subsequently, the gathered data are subjected to further analysis to provide a more comprehensive understanding of the impact of anthropogenic activities on the lake. In 1965, there were no significant reclamation dikes constructed along the southwest and south banks of the lake (Figure 9b). In 1970, six reclamation dikes were primarily constructed in the bays located on the southwest bank, spanning a combined length of 2.55 km and covering 0.9 km2 of the lake’s surface area (Figure 9c and Table 4). The period between 1970 and 1975 saw the construction of the highest number of dikes. In 1975, a total of 12 new dikes were constructed, spanning a combined length of 6.19 km and occupying a lake’s surface area of 1.41 km2. The longest dike, which has the largest reclamation area in the lake, was constructed in 1977 (Figure 9e). It is situated along the southwest bank from Xiaoshui Village to Mamuzui Village, with a total length of 2.88 km and occupying a lake’s surface area of 4.41 km2. These regions experienced flooding once more during 1986–1987 as a result of intense precipitation (Figure 9f); however, they subsequently dried up entirely and transformed into land by 1990 (Figure 9g). During the 1980s and 1990s, there was a significant decline in the construction of dikes for permanent reclamation. Two dikes constructed in the 1980s had a combined length of 2.12 km, covering an area of 0.36 km2 on the lake surface. During the 1990s, a single dike measuring 0.56 km in length and covering an area of 0.08 km2 was constructed for permanent reclamation purposes. Between 1965 and 2022, a total of 25 dikes were constructed in the lake region to achieve the permanent disappearance of the lake surface. These dikes collectively spanned a length of 16.22 km and covered a lake’s surface area of 7.16 km2 (Figure 9a and Table 4). The average surface area of the lake in 2022 was 27.93 km2, which was 8.33 km2 less than the area in 1965. This suggests that 85.95% of the reduction in the lake’s surface area was due to lake reclamation.

3.5. Attribution Analysis of Yilong Lake Variations

In light of the temporal evolution across three periods and the overarching trend of dynamic alterations in Yilong Lake, an MLR analysis is conducted to examine the variations in the lake’s area during four specific intervals (1965–2022, 1965–1979, 1986–2016, and 2016–2022). According to the results, the driving factors influencing the changes in Yilong Lake vary over different time periods. The results of MLR analysis are presented in Table 5.
The results indicate that Yilong Lake’s area is impacted by various driving factors across the four different periods. During the timeframe spanning from 1965 to 2022, Yilong Lake’s area has been impacted by a combination of meteorological and anthropogenic factors, resulting in significant negative impacts. Sunshine duration is the predominant meteorological factor, whereas cropland area exerts dominance as an anthropogenic factor. During the period from 1965 to 1979, there was an adverse impact of sunshine duration on the area of Yilong Lake. In contrast, anthropogenic factors showed no significant correlation with the changes in the lake’s area over the same period. From 1986 to 2016, the population and cropland area exhibited significantly negative impacts on the area of Yilong Lake, whereas meteorological factors do not demonstrate a significant relationship with the lake’s dynamic changes. After 2016, the population has shown a positive correlation with the area of Yilong Lake, whereas climate factors have not demonstrated a significant impact on the lake’s area. Since 2016, anthropogenic factors have been the primary drivers influencing the restoration of the area of Yilong Lake.

4. Discussion

4.1. Dynamic Variations and the Driving Forces

In this study, multi-source remote sensing imagery was employed to extract and analyze the dynamic changes in the surface area of Yilong Lake from 1965 to 2022. Furthermore, the research utilized MLR analysis to elucidate the respective impacts of climate factors and anthropogenic factors on the alterations in Yilong Lake’s surface area. This approach can quantify the non-linear correlation between climate change and anthropogenic factors influencing changes in the lake surface. The results of the image analysis revealed a reduction in the surface area of Yilong Lake from 32.26 km2 in 1965 km2 to 27.93 km2 in 2022. The data show variations over time, with the most substantial decrease observed along the southwest shoreline of Yilong Lake. This discovery aligns with earlier research conducted by Wu and Li et al. [23,24] using Landsat and Satellite Pour l’Observation de la Terre (SPOT) imagery, respectively. These studies encompassed the timeframes from 2000 to 2016 and 1989 to 2014. However, their studies had longer intervals between images and did not provide a comprehensive description of the actual changes in the lake’s surface area. During the period of fluctuations in the lake’s surface area from 2012 to 2016, Wu et al. [24] did not address the low water levels in 2013, leading to a higher extraction of the lake’s surface area compared to the results of this study. Additionally, this study analyzed the seasonal variations in Yilong Lake’s surface area that have occurred since 1965, but the distinction between the rainy and dry seasons was not significant because the study area experiences considerable cloud interference during the rainy season, and the imagery from the rainy season does not adequately reflect the actual changes in the water area. Therefore, further monitoring of seasonal changes in the water surface is necessary. Overall, the results of this paper enhance the temporal resolution of Yilong Lake area observations, enabling better analysis of the spatial–temporal dynamics of Yilong Lake’s surface area (Figure 6 and Table S3).
This study revealed that both meteorological and anthropogenic factors influenced changes in the area of Yilong Lake during different phases, with different dominant factors at different stages. From 1965 to 2022, sunshine duration was the primary meteorological factor influencing changes in the area of Yilong Lake, while cropland area was the main anthropogenic factor driving the reduction in Yilong Lake’s surface area. Although temperature and precipitation are typically considered to have a more substantial impact on a lake’s surface area [29]. However, in the case of Yilong Lake, neither temperature nor precipitation showed a significant impact on the lake’s surface area. This phenomenon could be explained by the characteristics of Yilong Lake, which is a high-altitude shallow lake with a small watershed area. The prolonged sunshine in the region may result in the entire basin being exposed to direct evaporation of lake water, thereby restricting surface runoff [30,31]. On the other hand, croplands depend on surface water for irrigation, and the development of irrigation water conveyance systems has led to the expansion of the irrigated area. During transportation, extended exposure to sunlight can lead to moisture loss, subsequently decreasing watershed runoff and contributing to the contraction of the lake’s surface area. This is also the main reason why sunshine duration dominated the rapid shrinkage of the lake from 1965 to 1979.
After 1986, population and cropland area replaced sunshine duration as the dominant factors influencing the changes in Yilong Lake’s surface area, due to the rapid growth of population and cropland area during this period. Increased land reclamation and heightened industrial and agricultural water consumption contributed to the exacerbation of lake shrinkage [32]. Furthermore, long-term human interventions have resulted in a fragile and unstable lake ecosystem with reduced self-recovery capacity [33,34]. Yilong Lake is predominantly dependent on water supply from six inflowing rivers, with the Chenghe River being the primary source, connecting to the upstream Chirui Lake (Figure 1). During the 1960s, Chirui Lake was repurposed for agricultural and aquacultural activities as part of the policy known as “Take Grain as Key Link and Ensure an All-Round Development” [35]. The area of the land gradually diminished over time, and by the 1990s, it had been entirely repurposed for human activities (Figure S4). The volume of water flowing into Yilong Lake from Chenghe River has significantly decreased due to the reclamation of the upstream Chirui Lake and the high demand for irrigation and domestic water consumption.
Following the year 2016, there was a shift towards a positive correlation between population and the lake’s surface area. The designation of Yilong Lake as a national wetland park by Shiping County in May 2014, along with the approval of pilot construction in December of the same year, may account for this phenomenon. The establishment of the national wetland park has effectively curtailed destructive activities like reclamation and enclosure for aquaculture through efficient management of the wetland park and safeguarding the lake’s ecosystem. This has led to a reduction in adverse impacts on biodiversity. Furthermore, an artificial ecological water replenishment project (Figure S5) was initiated by the local government. This project involved a daily water replenishment of 4.5 × 10⁷ m3 from January to February and 7.4 × 10⁷ m3 from June to December in 2014 [36]. The project played a significant role in the restoration of the lake following the drought in 2011. The water replenishment project contributed 3.8 × 10⁷ m3 of clean water to the lake in 2019 during a period of reduced precipitation, thereby assisting in the preservation of a stabilized surface area throughout the year. Furthermore, following the year 2016, the introduction of stricter water management protocols and the escalation of investments in safeguarding the Yilong Lake Basin have demonstrated a positive impact on the population. This phenomenon also elucidates the lack of significant impact from meteorological elements on the lake after 2016 [37]. The anthropogenic changes can be attributed to shifts in government policy orientations over time [38]. Conversely, the government’s artificial ecological water replenishment projects have resulted in the development of substantial reservoir-like characteristics in Yilong Lake. Since reaching its lowest water level in 2013, Yilong Lake has been maintained in a reservoir state, with the outflow being meticulously regulated by human activities. Although large-scale water replenishment projects can sustain the lake’s typical water level, the discontinuation of current hydrological regulation measures may lead to the ongoing shrinkage of Yilong Lake until its extinction (Table 4). Consequently, the complete restoration of Yilong Lake to its natural state poses a significant challenge.

4.2. Variations of Water Surface Area and Its Eco-Environmental Impacts

Yilong Lake experienced profound shrinkage before 2016, leading to significant changes in the structure and function of the ecosystem, resulting in the deterioration of the lake’s water quality and a decline in the biodiversity of the aquatic ecosystem. After the water level of Yilong Lake shrank, oligotrophic species were gradually replaced by eutrophic species [36]. Especially during the period of water surface shrinkage from 2009 to 2016, Yilong Lake became one of the most eutrophic lakes in China, completely transforming into an algal lake [39]. In addition, Yilong Lake is an important source of drinking water in the region, the reduction in the lake surface has led to a decrease in the water volume and quality of the lake, posing a threat to the water supply in the area. As an important habitat for fish, the fluctuations in water levels that deviate from the optimal range reduce the living space for fish in the lake area [40]. On 28 April 1981, Yilong Lake completely dried up for 23 days, leading to the extinction of the endemic species in the lake, such as the Cyprus (Mesocrinus) Yilongensisi and Anabarilius macrolepis [41]. Although the water surface area of Yilong Lake continues to expand, the current surface water environment still faces threats. To address this issue and protect the fragile environment of Yilong Lake, it is necessary not only to continuously monitor changes in water surface area but also to monitor changes in water quality to develop a comprehensive ecological improvement plan.

4.3. Limitations of the Study

By compensating for the lack of continuous remote sensing images in previous studies, this research utilizes multi-source remote sensing images to establish a continuous monitoring dataset of long-time sequences for Yilong Lake. It systematically examines the annual dynamics of the lake, serving as a valuable supplement and extension to the existing literature. However, certain issues with the dataset still require resolution. While this study utilizes multi-source remote sensing images, it was not possible to acquire monitoring images for a full year due to the small size of Yilong Lake and frequent cloud cover during the wet season, rendering the entire lake surface invisible. Consequently, images captured between June and July spanning 57 years are seldom available (Figure 2), resulting in a variance between the annual average area and the true area. This variance also introduces uncertainty in monitoring seasonal fluctuations in the Yilong Lake through remote sensing techniques (Figure 5). Additionally, two temporal breakpoints are evident in remote sensing data: one from 1966 to 1969, during which KeyHole images were unavailable, and another from 1980 to 1985, when images of the Yilong Lake Basin could not be obtained due to limitations in the revisiting trajectory, despite Landsat being in orbit since 1974. Therefore, the integration of additional remote data sources (such as satellites and aerial imagery) and historical maps is essential to address the gaps in the dataset for future research endeavors.

5. Conclusions

In this study, the temporal and spatial variations in the surface area of Yilong Lake and the factors influencing these changes were monitored and analyzed. This was achieved by utilizing a variety of remote sensing images (KeyHole, Landsat, HJ-1 A/B) spanning the past 57 years. The analysis was complemented with local meteorological, economic, and demographic data, and integrated remote sensing techniques. This study has pioneered the creation of a high-temporal-resolution monitoring dataset for Yilong Lake. It specifically focuses on observing the lake dynamics prior to the operation of Landsat using KeyHole satellite images. This initiative addresses the research gaps that were previously identified in the field. The primary results can be summarized as follows:
(1)
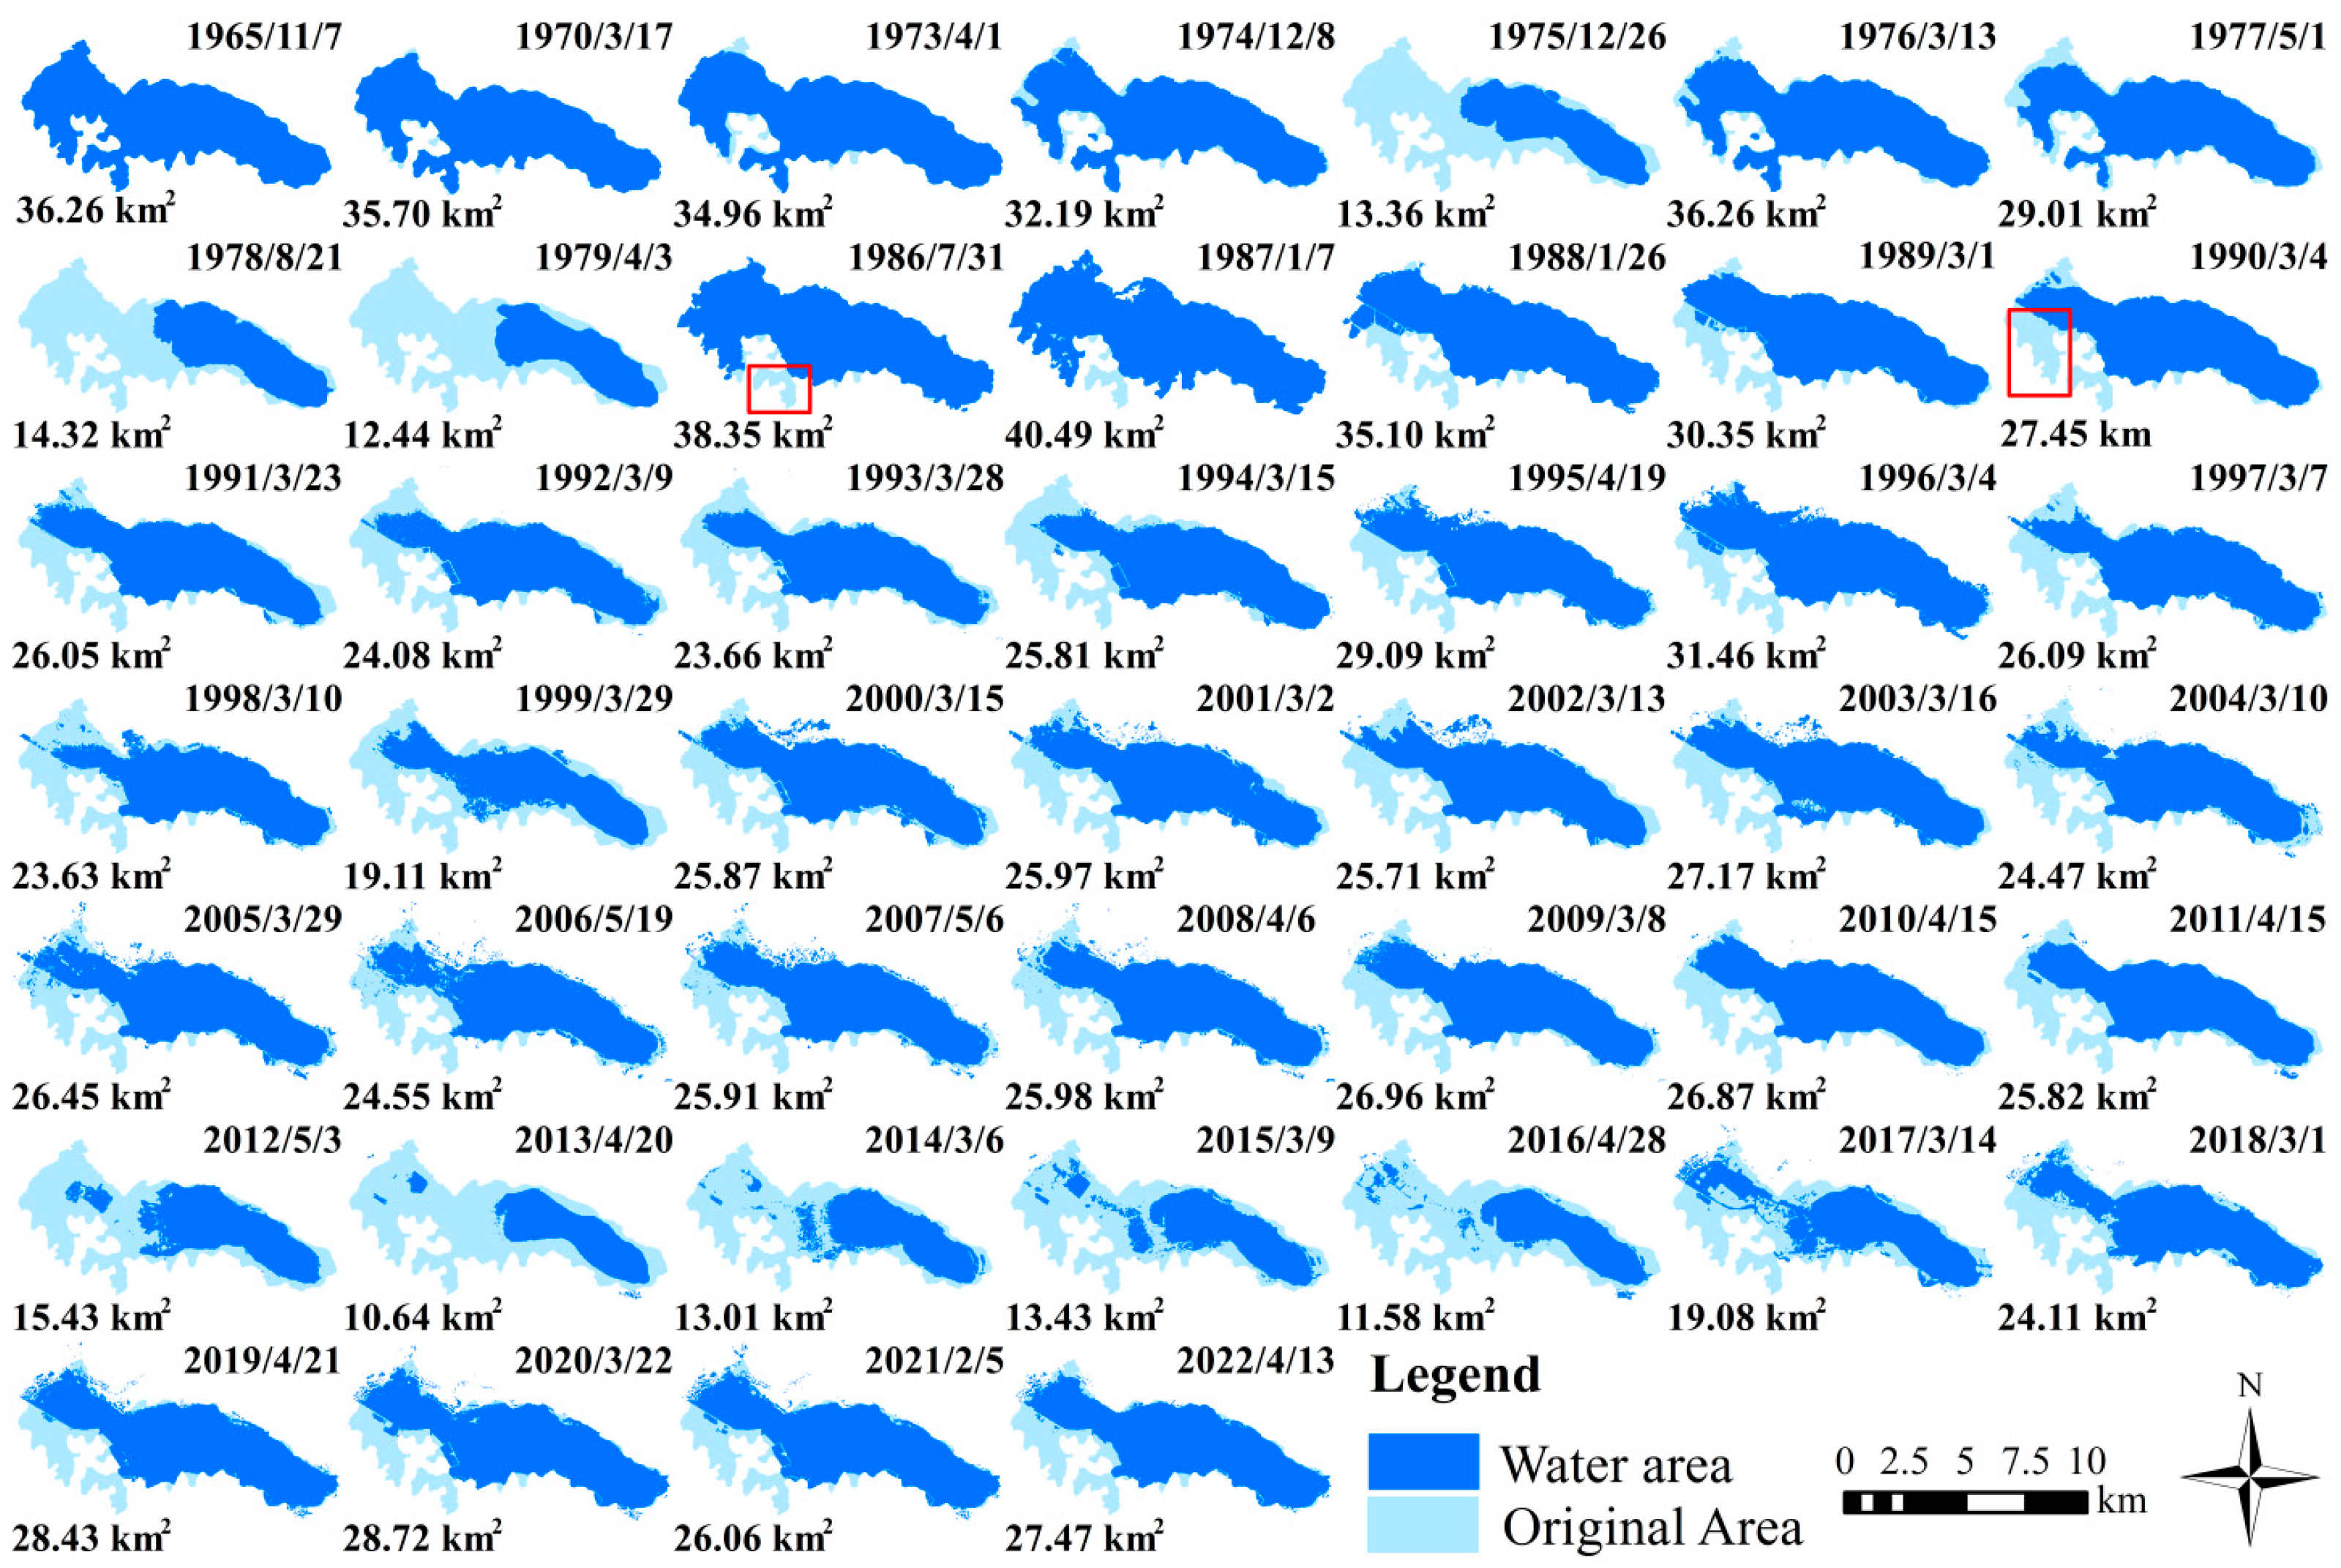
The surface area of Yilong Lake exhibited a decreasing trend from 1965 to 2022, delineated into three periods: (1) 1965–1979 (rapid shrinkage period, Slope = −1.62, p < 0.05); (2) 1986–2016 (fluctuating shrinkage period, Slope = −0.50, p < 0.001); and (3) 2016–2022 (expanding recovery period, Slope = 2.24, p < 0.05).
(2)
Yilong Lake has decreased in size by 8.33 km2 over the course of the last 57 years, with the most reduction occurring along the southern and southwestern shores of the lake. Spatial transformations of Yilong Lake encompass two categories: the permanent depletion of the lake’s surface area and the subsequent reconstitution of the lake’s surface area following a period of contraction. The permanent loss of the lake’s surface area, amounting to 85.95% (7.16 km2), is attributed to reclamation activities.
(3)
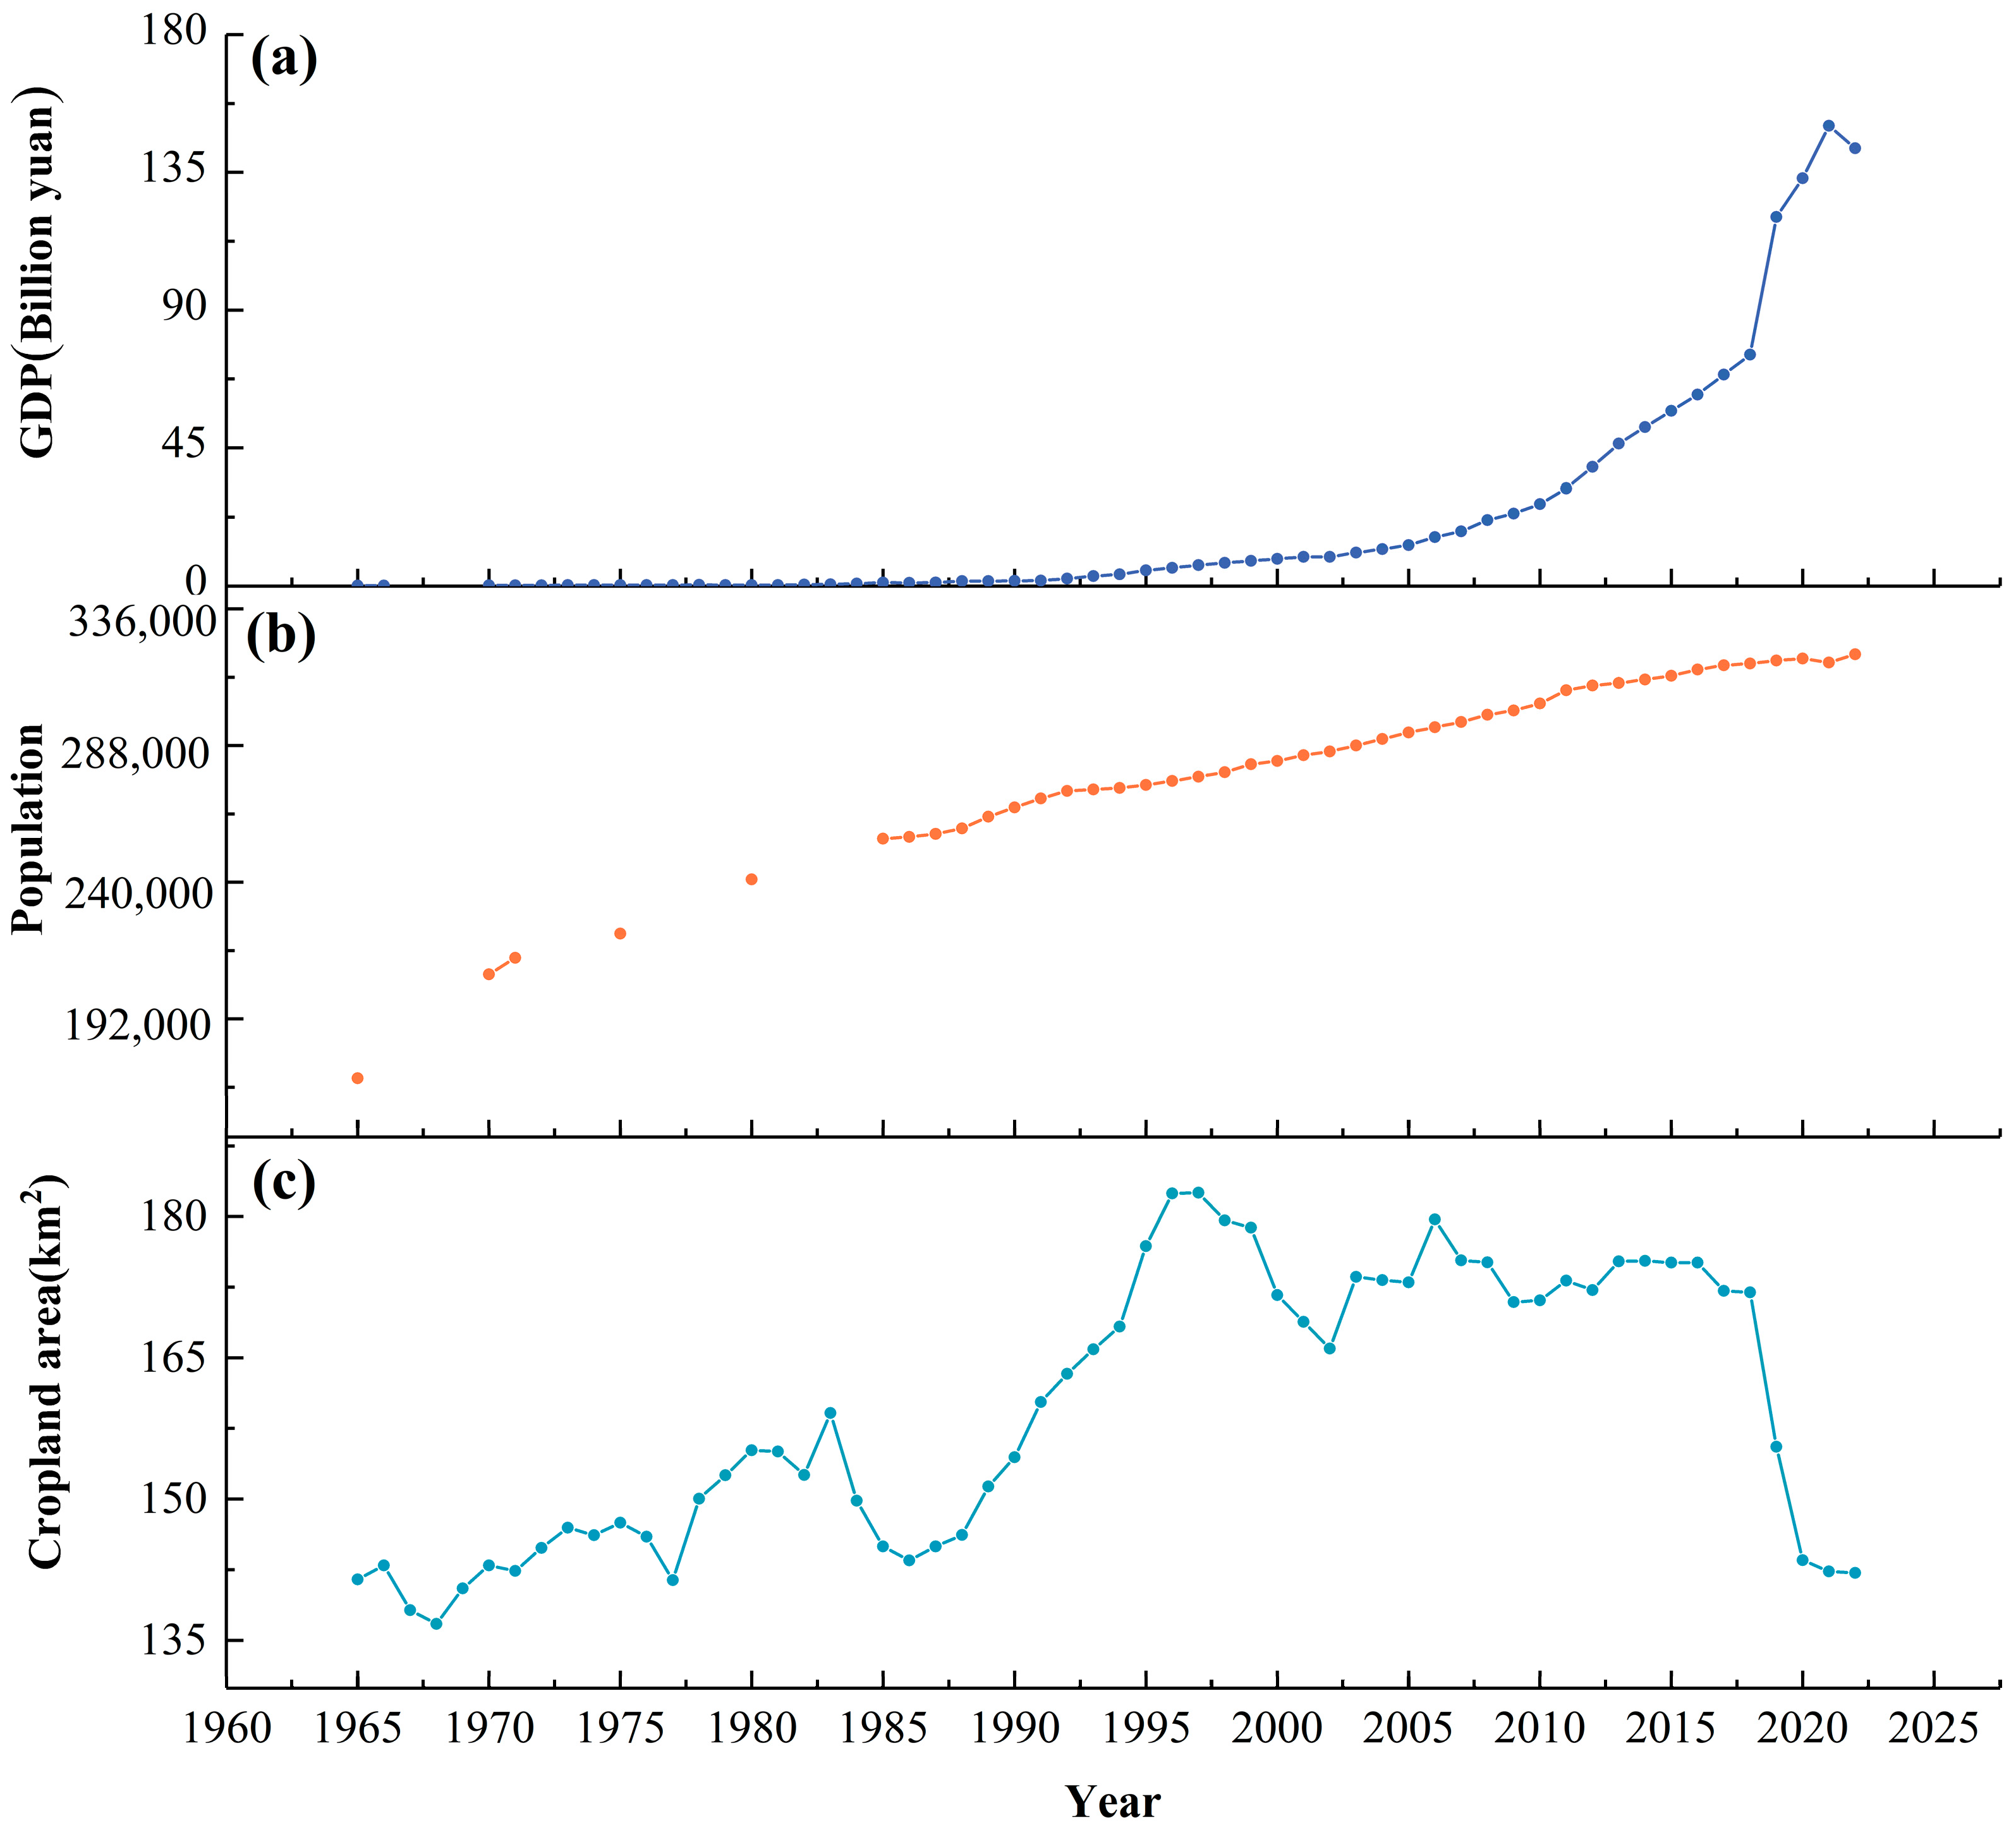
Attribution analysis revealed that fluctuations in the Yilong Lake’s surface area are impacted by a combination of climate and anthropogenic factors. However, the predominant factors driving these changes differ across various time periods. Between 1965 and 2022, the reduction in the lake’s size was primarily impacted by a decrease in sunshine duration (−0.35, p < 0.01) and a decline in cropland area (−0.37, p < 0.01). During the period from 1965 to 1979, a significant negative correlation was observed between sunshine duration and the shrinkage of the lake (−0.97, p< 0.001). Between 1986 and 2016, the reduction in population (−0.51, p < 0.001) and cropland area (−0.48, p < 0.001) were the primary factors contributing to the shrinkage of the lake. After 2016, the population increase (0.87, p < 0.05) contributed significantly to the lake’s recovery.
(4)
Presently, the preservation of Yilong Lake’s area relies on artificial ecological water replenishment initiatives and rigorous outflow regulation, resulting in reservoir-like characteristics within the lake.
While the protective measures aimed at preventing the shrinkage of Yilong Lake have demonstrated promising results, there remains a necessity for the adoption of comprehensive, long-term strategies and more efficient interventions to ensure the sustainable restoration of the lake. The results of this study hold substantial importance in elucidating the dynamic alterations occurring in the vicinity of Yilong Lake and the trajectory of its evolution. Furthermore, they offer valuable citations for safeguarding and overseeing other shallow plateau lakes.

Supplementary Materials

The following supporting information can be downloaded at: https://www.mdpi.com/article/10.3390/w16142058/s1, Figure S1: spatial distribution of control points; Figure S2: the KeyHole and Landsat8 OLI overlay map after correction; Figure S3: spatial distribution of sampling points, 200 points for water and 200 points for non-water; Figure S4: reclamation situation of Chirui Lake upstream of Yilong Lake. Figure S5: Yilong Lake water replenishment network diagram. Table S1: thresholds for each sensor; Table S2: confusion matrix for accuracy of water surface; Table S3: water body area of Yilong Lake and corresponding date.

Author Contributions

Conceptualization, N.B. and W.S.; methodology, N.B. and W.S.; software, N.B.; validation, N.B.; formal analysis, N.B.; investigation, N.B. and J.M.; resources, N.B.; data curation, N.B.; writing—original draft preparation, N.B.; writing—review and editing, N.B., W.S. and J.M.; visualization, J.M.; supervision, J.M.; project administration, W.S. and Y.C.; supervision, funding acquisition, W.S. All authors have read and agreed to the published version of the manuscript.

Funding

This research was funded by the Major Science and Technology Projects in Yunnan Province (Grant number 202203AC100002-03), the Dianchi Lake Ecosystem Observation and Research Station of Yunnan Province (Grant number 202305AM340008) and the Opening Foundation of Yunnan Key Laboratory of Plateau Wetland Conservation, Restoration and Ecological Services (Grant number 202105AG070002).

Data Availability Statement

The data that support the findings of this study are available from the corresponding author upon reasonable request.

Conflicts of Interest

The authors declare no conflicts of interest.

References

  1. Catalan, J.; Pla-Rabés, S.; Wolfe, A.P.; Smol, J.P.; Rühland, K.M.; Anderson, N.J.; Kopáček, J.; Stuchlík, E.; Schmidt, R.; Koinig, K.A. Global change revealed by palaeolimnological records from remote lakes: A review. J. Paleolimnol. 2013, 49, 513–535. [Google Scholar] [CrossRef]
  2. Pi, X.; Luo, Q.; Feng, L.; Xu, Y.; Tang, J.; Liang, X.; Ma, E.; Cheng, R.; Fensholt, R.; Brandt, M. Mapping global lake dynamics reveals the emerging roles of small lakes. Nat. Commun. 2022, 13, 5777. [Google Scholar] [CrossRef]
  3. Cao, H.; Han, L.; Liu, Z.; Li, L. Monitoring and driving force analysis of spatial and temporal change of water area of Hongjiannao Lake from 1973 to 2019. Ecol. Inform. 2021, 61, 101230. [Google Scholar] [CrossRef]
  4. Liu, H.; Zheng, L.; Jiang, L.; Liao, M. Forty-year water body changes in Poyang Lake and the ecological impacts based on Landsat and HJ-1 A/B observations. J. Hydrol. 2020, 589, 125161. [Google Scholar] [CrossRef]
  5. Woolway, R.I.; Kraemer, B.M.; Lenters, J.D.; Merchant, C.J.; O’Reilly, C.M.; Sharma, S. Global lake responses to climate change. Nat. Rev. Earth Environ. 2020, 1, 388–403. [Google Scholar] [CrossRef]
  6. Dervisoglu, A.; Yağmur, N.; Firatli, E.; Musaoğlu, N.; Tanik, A. Spatio-temporal assessment of the shrinking Lake Burdur, Turkey. Int. J. Environ. Geoinform. 2022, 9, 169–176. [Google Scholar] [CrossRef]
  7. Zhou, X.; Jin, F.; Lu, C.; Baoyin, T.; Jia, Z. Shifts in the community composition of methane-cycling microorganisms during lake shrinkage. Geoderma 2018, 311, 9–14. [Google Scholar] [CrossRef]
  8. Wang, Y.; Shen, Y.; Guo, Y.; Li, B.; Chen, X.; Guo, X.; Yan, H. Increasing shrinkage risk of endorheic lakes in the middle of farming-pastoral ecotone of Northern China. Ecol. Indic. 2022, 135, 108523. [Google Scholar] [CrossRef]
  9. Pekel, J.-F.; Cottam, A.; Gorelick, N.; Belward, A.S. High-resolution mapping of global surface water and its long-term changes. Nature 2016, 540, 418–422. [Google Scholar] [CrossRef]
  10. Muala, E.; Mohamed, Y.; Duan, Z.; Zaag, P.V.D. Estimation of Reservoir Discharges from Lake Nasser and Roseires Reservoir in the Nile Basin Using Satellite Altimetry and Imagery Data. Remote Sens. 2014, 6, 7522–7545. [Google Scholar] [CrossRef]
  11. Rogan, J.; Chen, D. Remote sensing technology for mapping and monitoring land-cover and land-use change. Prog. Plan. 2004, 61, 301–325. [Google Scholar] [CrossRef]
  12. Yang, S.; Wan, R.; Yang, G.; Li, B.; Dong, L. Combining historical maps and landsat images to delineate the centennial-scale changes of lake wetlands in Taihu Lake Basin, China. J. Environ. Manag. 2023, 329, 117110. [Google Scholar] [CrossRef] [PubMed]
  13. Wang, X.; Xiao, X.; Zou, Z.; Hou, L.; Qin, Y.; Dong, J.; Doughty, R.B.; Chen, B.; Zhang, X.; Chen, Y. Mapping coastal wetlands of China using time series Landsat images in 2018 and Google Earth Engine. ISPRS J. Photogramm. Remote Sens. 2020, 163, 312–326. [Google Scholar] [CrossRef] [PubMed]
  14. Gu, Z.; Zhang, Y.; Fan, H. Mapping inter-and intra-annual dynamics in water surface area of the Tonle Sap Lake with Landsat time-series and water level data. J. Hydrol. 2021, 601, 126644. [Google Scholar] [CrossRef]
  15. Zuo, J.; Jiang, W.; Li, Q.; Du, Y. Remote sensing dynamic monitoring of the flood season area of Poyang Lake over the past two decades. Nat. Hazards Res. 2024, 4, 8–19. [Google Scholar] [CrossRef]
  16. Xie, Y.; Gong, J.; Sun, P.; Gou, X. Oasis dynamics change and its influence on landscape pattern on Jinta oasis in arid China from 1963a to 2010a: Integration of multi-source satellite images. Int. J. Appl. Earth Obs. Geoinf. 2014, 33, 181–191. [Google Scholar] [CrossRef]
  17. Zhang, Y.; An, C.-B.; Zheng, L.-Y.; Liu, L.-Y.; Zhang, W.-S.; Lu, C.; Zhang, Y.-Z. Assessment of lake area in response to climate change at varying elevations: A case study of Mt. Tianshan, Central Asia. Sci. Total Environ. 2023, 869, 161665. [Google Scholar] [CrossRef] [PubMed]
  18. Zhuo, Y.; Zeng, W.; Ma, B.; Cui, D.; Xie, Y.; Wang, J. Spatiotemporal variation and influencing factors of nitrogen and phosphorus in lake sediments in China since 1850. J. Clean. Prod. 2022, 368, 133170. [Google Scholar] [CrossRef]
  19. Zhuo, Y.; Zeng, W. Using stable nitrogen isotopes to reproduce the process of the impact of human activities on the lakes in the Yunnan Guizhou Plateau in the past 150–200 years. Sci. Total Environ. 2020, 741, 140191. [Google Scholar] [CrossRef] [PubMed]
  20. Sui, Q.; Duan, L.; Zhang, Y.; Zhang, X.; Liu, Q.; Zhang, H. Seasonal Water Quality Changes and the Eutrophication of Lake Yilong in Southwest China. Water 2022, 14, 3385. [Google Scholar] [CrossRef]
  21. Zou, Z.; Dong, J.; Menarguez, M.A.; Xiao, X.; Qin, Y.; Doughty, R.B.; Hooker, K.V.; Hambright, K.D. Continued decrease of open surface water body area in Oklahoma during 1984–2015. Sci. Total Environ. 2017, 595, 451–460. [Google Scholar] [CrossRef]
  22. Qian, X.; Kun, Y.; Le, C.; Liang, H. Qi Lu Lake and Yilong Lake Water Extraction and Lake Area Change Dynamics Monitoring. Anhui Agric. Sci. Bull. 2017, 23, 123–141. [Google Scholar]
  23. Li, H.; Zhong, D.; Fan, S.; Zhang, S.; Wang, J. Remote sensing monitoring of the nine plateau lakes’s surface aera in Yunnan in recent thirty years. Resour. Environ. Yangtze Basin 2016, 25, 32–37. [Google Scholar]
  24. Wu, P.; Shen, H.; Cai, N.; Zeng, C.; Wu, Y.; Wang, B.; Wang, Y. Spatiotemporal analysis of water area annual variations using a Landsat time series: A case study of nine plateau lakes in Yunnan province, China. Int. J. Remote Sens. 2016, 37, 5826–5842. [Google Scholar] [CrossRef]
  25. Liao, J.; Shen, G.; Li, Y. Lake variations in response to climate change in the Tibetan Plateau in the past 40 years. Int. J. Digit. Earth 2013, 6, 534–549. [Google Scholar] [CrossRef]
  26. Dai, X.; Yang, X.; Wang, M.; Gao, Y.; Liu, S.; Zhang, J. The dynamic change of bosten lake area in response to climate in the past 30 years. Water 2019, 12, 4. [Google Scholar] [CrossRef]
  27. Zhang, G.; Yao, T.; Chen, W.; Zheng, G.; Shum, C.K.; Yang, K.; Piao, S.; Sheng, Y.; Yi, S.; Li, J.; et al. Regional differences of lake evolution across China during 1960s–2015 and its natural and anthropogenic causes. Remote Sens. Environ. 2019, 221, 386–404. [Google Scholar] [CrossRef]
  28. Wang, R.; Xia, H.; Qin, Y.; Niu, W.; Pan, L.; Li, R.; Zhao, X.; Bian, X.; Fu, P. Dynamic Monitoring of Surface Water Area during 1989–2019 in the Hetao Plain Using Landsat Data in Google Earth Engine. Water 2020, 12, 3010. [Google Scholar] [CrossRef]
  29. Fan, X.; Yang, K.; Yang, R.; Zhao, L. Changes in Meteorological Elements and Its Impacts on Yunnan Plateau Lakes. Appl. Sci. 2023, 13, 2881. [Google Scholar] [CrossRef]
  30. Duan, Z.; Wang, M.; Chang, X.; Gao, W. Response of river-lake hydrologic regimes to local climate change in the Yunnan-Guizhou Plateau region, China. Reg. Environ. Chang. 2020, 20, 122. [Google Scholar] [CrossRef]
  31. Wang, S.; Xu, C.; Zhang, W.; Chen, H.; Zhang, B. Human-Induced water loss from closed inland Lakes: Hydrological simulations in China’s Daihai lake. J. Hydrol. 2022, 607, 127552. [Google Scholar] [CrossRef]
  32. Li, X.; Li, A.; Liu, G.; Jiang, J. Spatial distribution pattern of the lakes in the Yunnan-Guizhou Plateau. Resour. Environ. Yangtze Basin 2010, 19, 90–96. [Google Scholar]
  33. Yuan, Z.; Wu, D.; Niu, L.; Ma, X.; Li, Y.; Hillman, A.L.; Abbott, M.B.; Zhou, A. Contrasting ecosystem responses to climatic events and human activity revealed by a sedimentary record from Lake Yilong, southwestern China. Sci. Total Environ. 2021, 783, 146922. [Google Scholar] [CrossRef] [PubMed]
  34. Wei, Q.; Xue, L.; Liao, S.; Yang, J.; Niu, B. Analysis of driving forces on ecohydrological regime and environmental flow changes in Hongze Lake, China. Ecol. Inform. 2024, 79, 102423. [Google Scholar] [CrossRef]
  35. Wang, S.-R.; Meng, W.; Jin, X.-C.; Zheng, B.-H.; Zhang, L.; Xi, H.-Y. Ecological security problems of the major key lakes in China. Environ. Earth Sci. 2015, 74, 3825–3837. [Google Scholar] [CrossRef]
  36. Huang, Y.; Ma, R.; Shi, H.; Li, J.; Tu, S. Centennial Lake Environmental Evolution Reflected by Diatoms in Yilong Lake, Yunnan Province, China. Appl. Sci. 2023, 13, 5288. [Google Scholar] [CrossRef]
  37. Ma, G.; Li, Q.; Yang, S.; Zhang, R.; Zhang, L.; Xiao, J.; Sun, G. Analysis of landscape pattern evolution and driving forces based on land-use changes: A case study of Yilong Lake watershed on Yunnan-Guizhou Plateau. Land 2022, 11, 1276. [Google Scholar] [CrossRef]
  38. Zhao, L.; Wang, M.; Liang, Z.; Zhou, Q. Identification of regime shifts and their potential drivers in the shallow eutrophic Lake Yilong, Southwest China. Sustainability 2020, 12, 3704. [Google Scholar] [CrossRef]
  39. Zhao, L.; Li, Y.; Zou, R.; He, B.; Zhu, X.; Liu, Y.; Wang, J.; Zhu, Y. A three-dimensional water quality modeling approach for exploring the eutrophication responses to load reduction scenarios in Lake Yilong (China). Environ. Pollut. 2013, 177, 13–21. [Google Scholar] [CrossRef]
  40. Langer, T.A.; Cooper, M.J.; Reisinger, L.S.; Reisinger, A.J.; Uzarski, D.G. Water depth and lake-wide water level fluctuation influence on α-and β-diversity of coastal wetland fish communities. J. Great Lakes Res. 2018, 44, 70–76. [Google Scholar] [CrossRef]
  41. Cao, L.; Zhang, E.; Zang, C.; Cao, W. Evaluating the status of China’s continental fish and analyzing their causes of endangerment through the red list assessment. Biodivers. Sci. 2016, 24, 598–609. [Google Scholar] [CrossRef]
Figure 1. Geographic location of Yilong Lake Basin in China.
Water 16 02058 g001
Figure 2. Temporal distributions of remote sensing images used in this study: (a) annual distributions of remote sensing images; (b) monthly distributions of remote sensing images.
Water 16 02058 g002
Figure 3. Method flowchart illustrating analytical process.
Water 16 02058 g003
Figure 4. Lake’s surface area changes (1965–2022): (a) annual maximum extent; (b) annual minimum extent; (c) annual average extent. (Note: The red dotted lines represents the linear trends).
Water 16 02058 g004
Figure 5. Seasonal changes in lake’s surface area.
Water 16 02058 g005
Figure 6. Inter-annual variations in the spatial extent of Yilong Lake (1965–2022). (Note: red rectangle represents the permanently disappearing lake’s surface area).
Water 16 02058 g006
Figure 7. Trends in meteorological factors influencing Yilong Lake (1965–2022): (a) annual average air temperature; (b) monthly average air temperature; (c) annual precipitation; (d) monthly average precipitation; (e) annual evaporation; (f) monthly average evaporation; (g) annual sunshine duration; (h) monthly average sunshine duration. (Note: The red dotted lines represents the linear trends).
Water 16 02058 g007
Figure 8. Anthropogenic impacts on the Yilong Lake Basin (1965–2022): (a) GDP trends; (b) population growth; (c) changes in cropland area.
Water 16 02058 g008
Figure 9. Distribution and temporal changes in dikes and tunnels in the Yilong Lake Basin: (a) spatial distribution of dikes; (b) original period; (c) dikes in 1970; (d) dikes in 1975; (e) dikes in 1977; (f) permanent drought areas in 1987; (g) permanent drought areas in 1990.
Water 16 02058 g009
Table 1. The technical specification for multi-source remote sensing data.
SatelliteKeyHoleLandsatLandsatLandsatLandsatHJ-1 A/B
Sensors-MSSTMETM+OLICCD
Resolution1.8–2.7 m79 m30 m30 m30 m30 m
Revisit Period-18 d16 d16 d16 d2 d
Swath Width-185 km185 km185 km185 km360 km
Operating Time1965–19791972–19921984–now1999–20032013–now2008–now
Table 2. Verification of data accuracy.
YearTPDC/km2NDWI and Visual
Interpretation Results/km2
Difference Rate
197034.5435.703.36%
199030.4930.580.30%
199533.7233.750.10%
200030.7530.29−1.51%
200527.3926.45−3.43%
201025.4925.690.79%
201512.5912.48−0.89%
202028.7329.041.07%
Table 3. Temporal variations in inter-annual average surface area of Yilong Lake (1965–2022).
YearAverage Area/km2 a /km2Annual Area Change RateYearAverage Area/km2 a / km 2 Annual Area Change Rate
196536.2600.00%200026.063.2114.05%
197035.7−0.56−1.54%200125.4−0.66−2.53%
197334.96−0.74−2.07%200225.14−0.26−1.02%
197432.2−2.76−7.89%200321.2−3.94−15.67%
197513.36−18.84−58.51%200422.451.255.90%
197631.8518.35135.93%200525.523.0713.67%
197728.92−2.93−9.20%200625.34−0.18−0.71%
197814.32−14.6−50.48%200725.470.130.51%
197912.44−1.88−13.13%200824.76−0.71−2.79%
198638.3525.91208.28%200926.892.138.60%
198735.64−2.71−7.07%201026.52-0.37−1.38%
198832.21−3.43−9.62%201125.74−0.78−2.94%
198929.22−2.99−9.28%201215.02−10.72−41.65%
199028.06−1.16−3.97%201313.47−1.55−10.32%
199126.55−1.51−5.38%2014151.5311.36%
199225.8−0.75−2.82%201513.7−1.3−8.67%
199325.25−0.55−2.13%201612.25−1.45−10.58%
199427.82.5510.10%201718.856.653.88%
199530.72.910.43%201824.735.8831.19%
199630.67−0.03−0.10%201928.333.614.56%
199726.73−3.94−12.85%202028.620.291.02%
199819.43−7.3−27.31%202126.49−2.13−7.44%
199922.853.4217.60%202227.931.445.44%
Table 4. Overview of dike construction in the Yilong Lake Basin.
TimeNumberLength/kmReclaimed Area/km2
1965000
197062.550.9
1975126.191.41
197744.804.41
1980s22.120.36
1990s10.560.08
Total2516.227.16
Table 5. MLR analysis results for the Yilong Lake Basin vs. meteorological and anthropogenic factors across four time periods: 1965–2022, 1965–1979, 1986–2016, and 2016–2022. (Note: R2 is the proportion of variance in the dependent variable that can be explained by the chosen explanatory variables; SEE is the standard error of the estimate; F and Sig. are F-statistic and p-value associated with it. Variables without statistical significance were excluded from the regression analysis for each time period.)
Variables1965–20221965–19791986–20162016–2022
Lake’s Surface AreaLake’s Surface AreaLake’s Surface AreaLake’s Surface Area
Coef.Coef.Coef.Coef.
Air temperature
Precipitation
Evaporation
Sunshine duration−0.35 *−0.97 ***
GDP
Population −0.51 ***0.87 *
Cropland area−0.37 ** −0.48 ***
Reclaimed area
Constant117.03334.65105.08−960.84
Model summary
R20.310.820.560.75
SEE5.784.613.963.38
F9.4932.4021.6414.87
Sig.0.000.000.000.01
Note(s): Significance for p-value: * p < 0.05; ** p < 0.01; *** p < 0.001.
Disclaimer/Publisher’s Note: The statements, opinions and data contained in all publications are solely those of the individual author(s) and contributor(s) and not of MDPI and/or the editor(s). MDPI and/or the editor(s) disclaim responsibility for any injury to people or property resulting from any ideas, methods, instructions or products referred to in the content.

