Multi-Source Remote Sensing Analysis of Yilong Lake’s Surface Water Dynamics (1965–2022): A Temporal and Spatial Investigation
Abstract
:1. Introduction
2. Materials and Methods
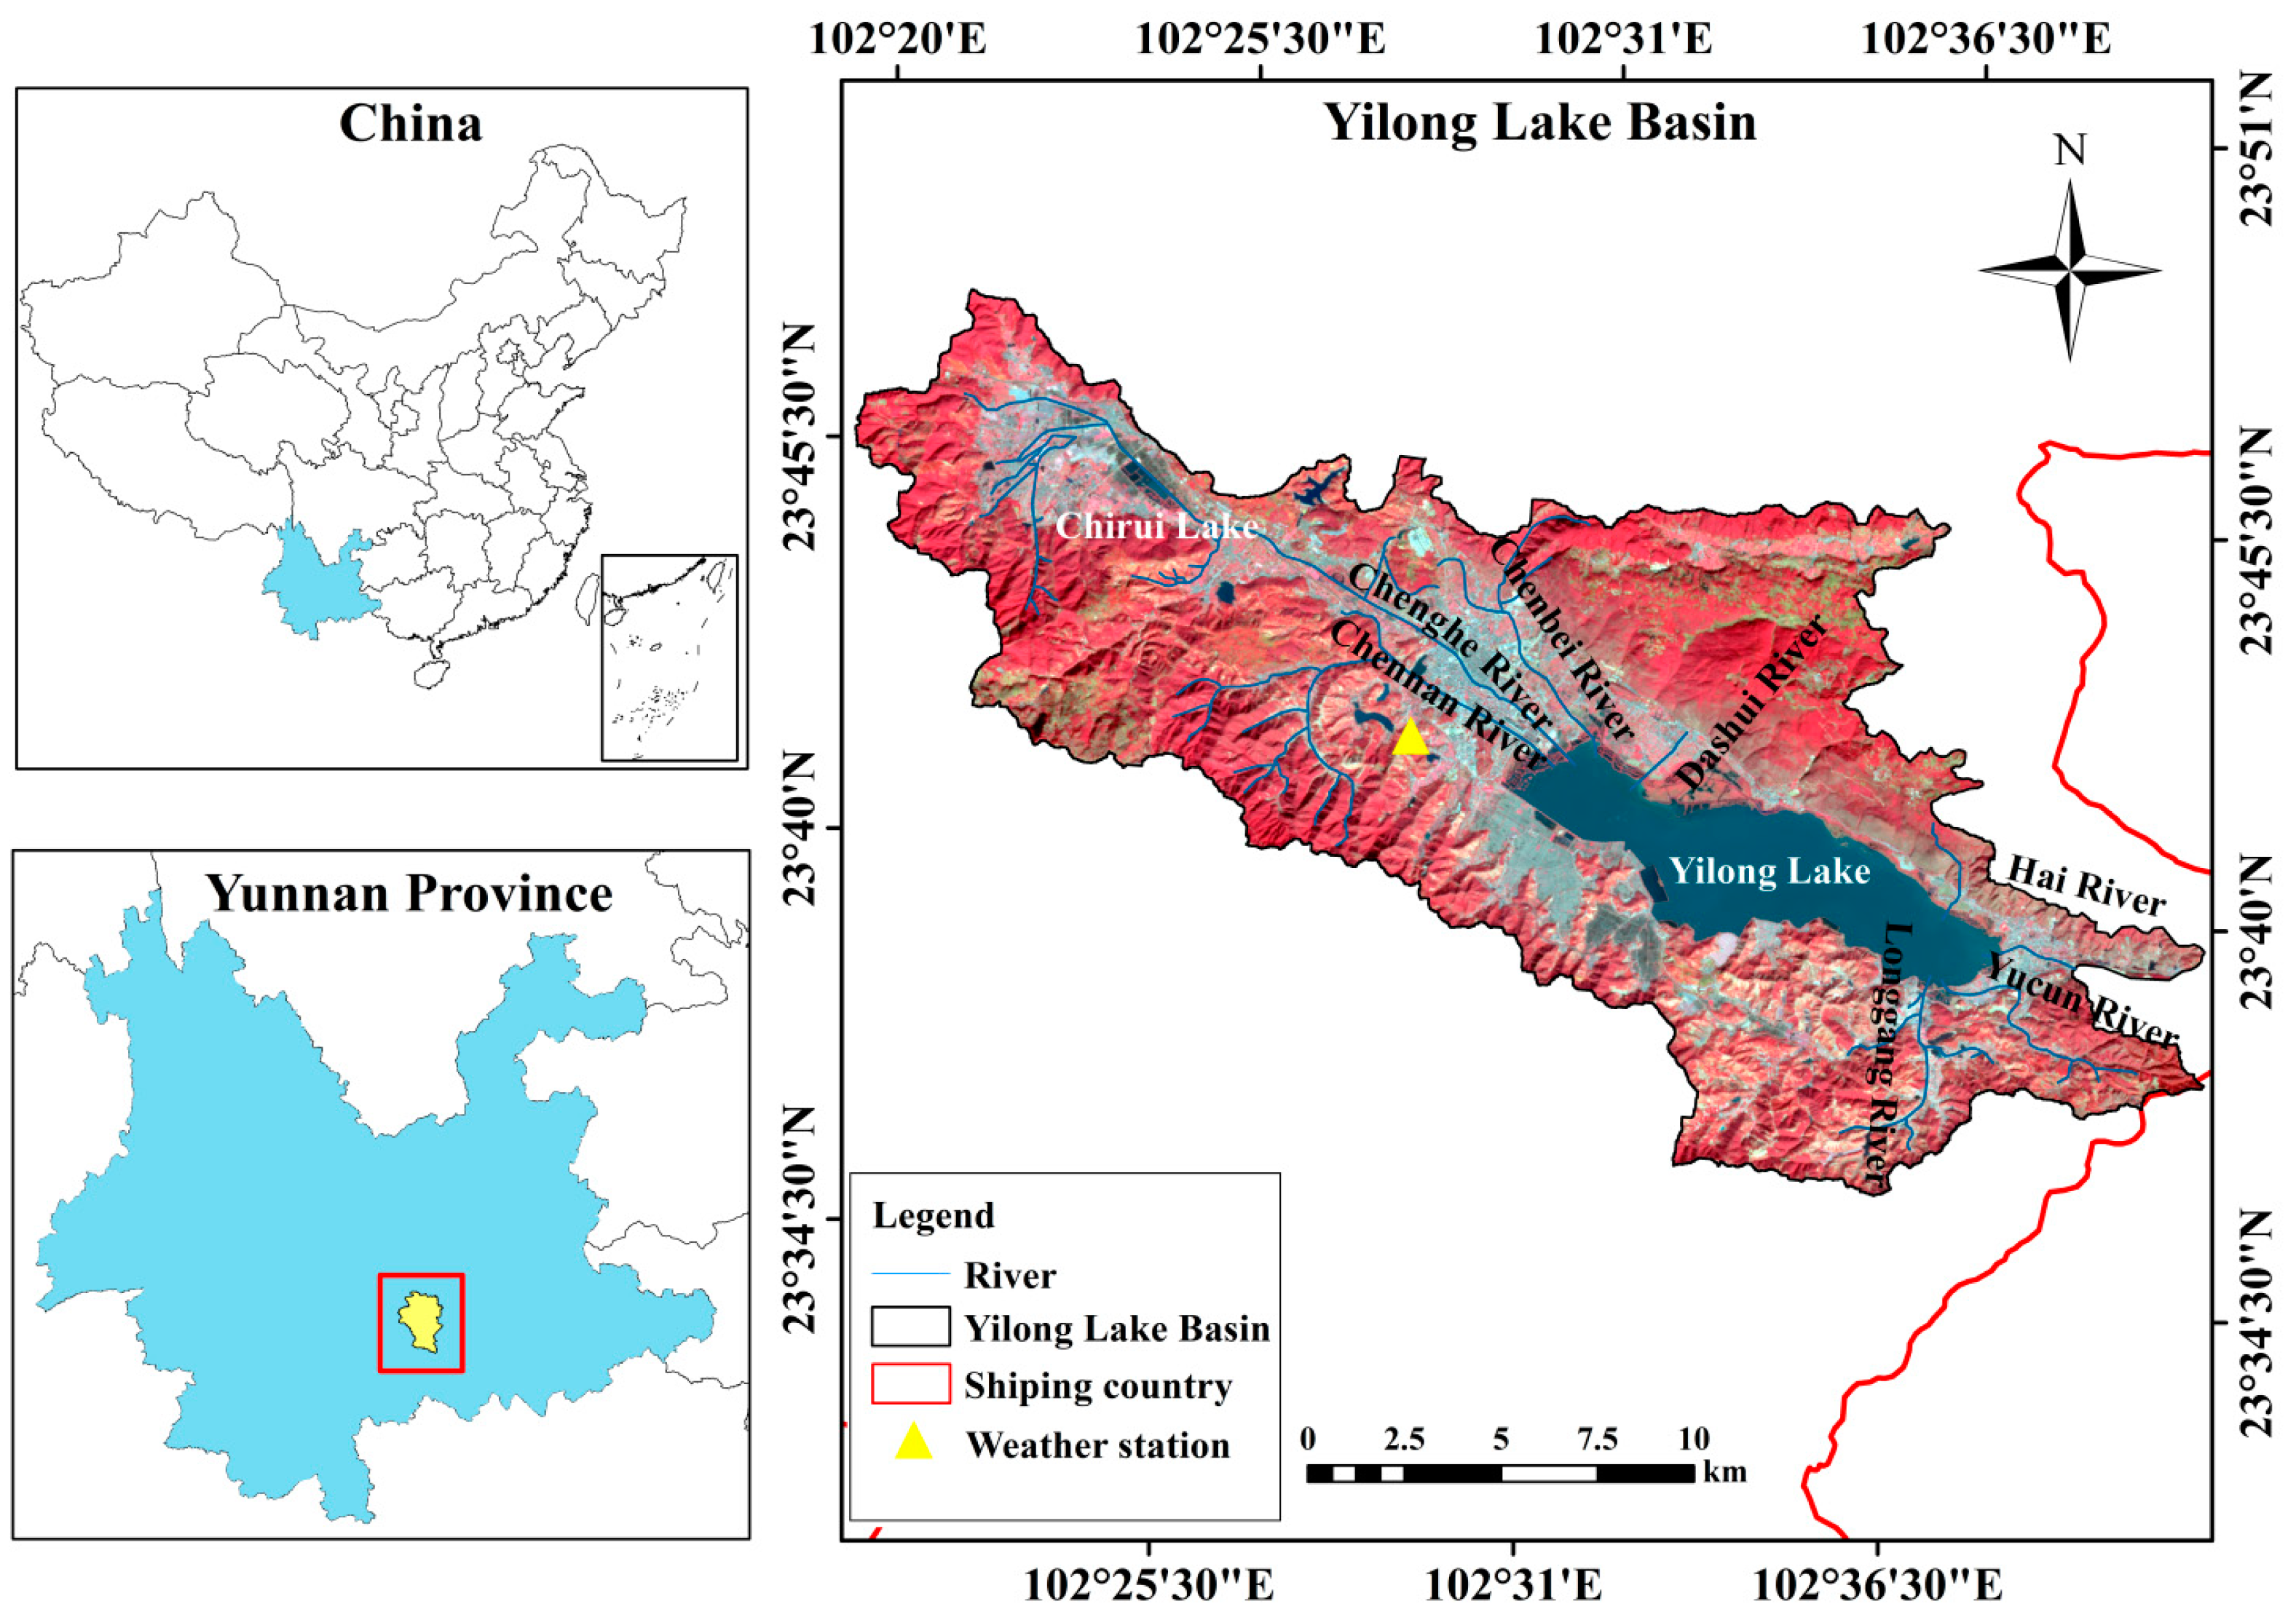
2.1. Study Area
2.2. Data Collection
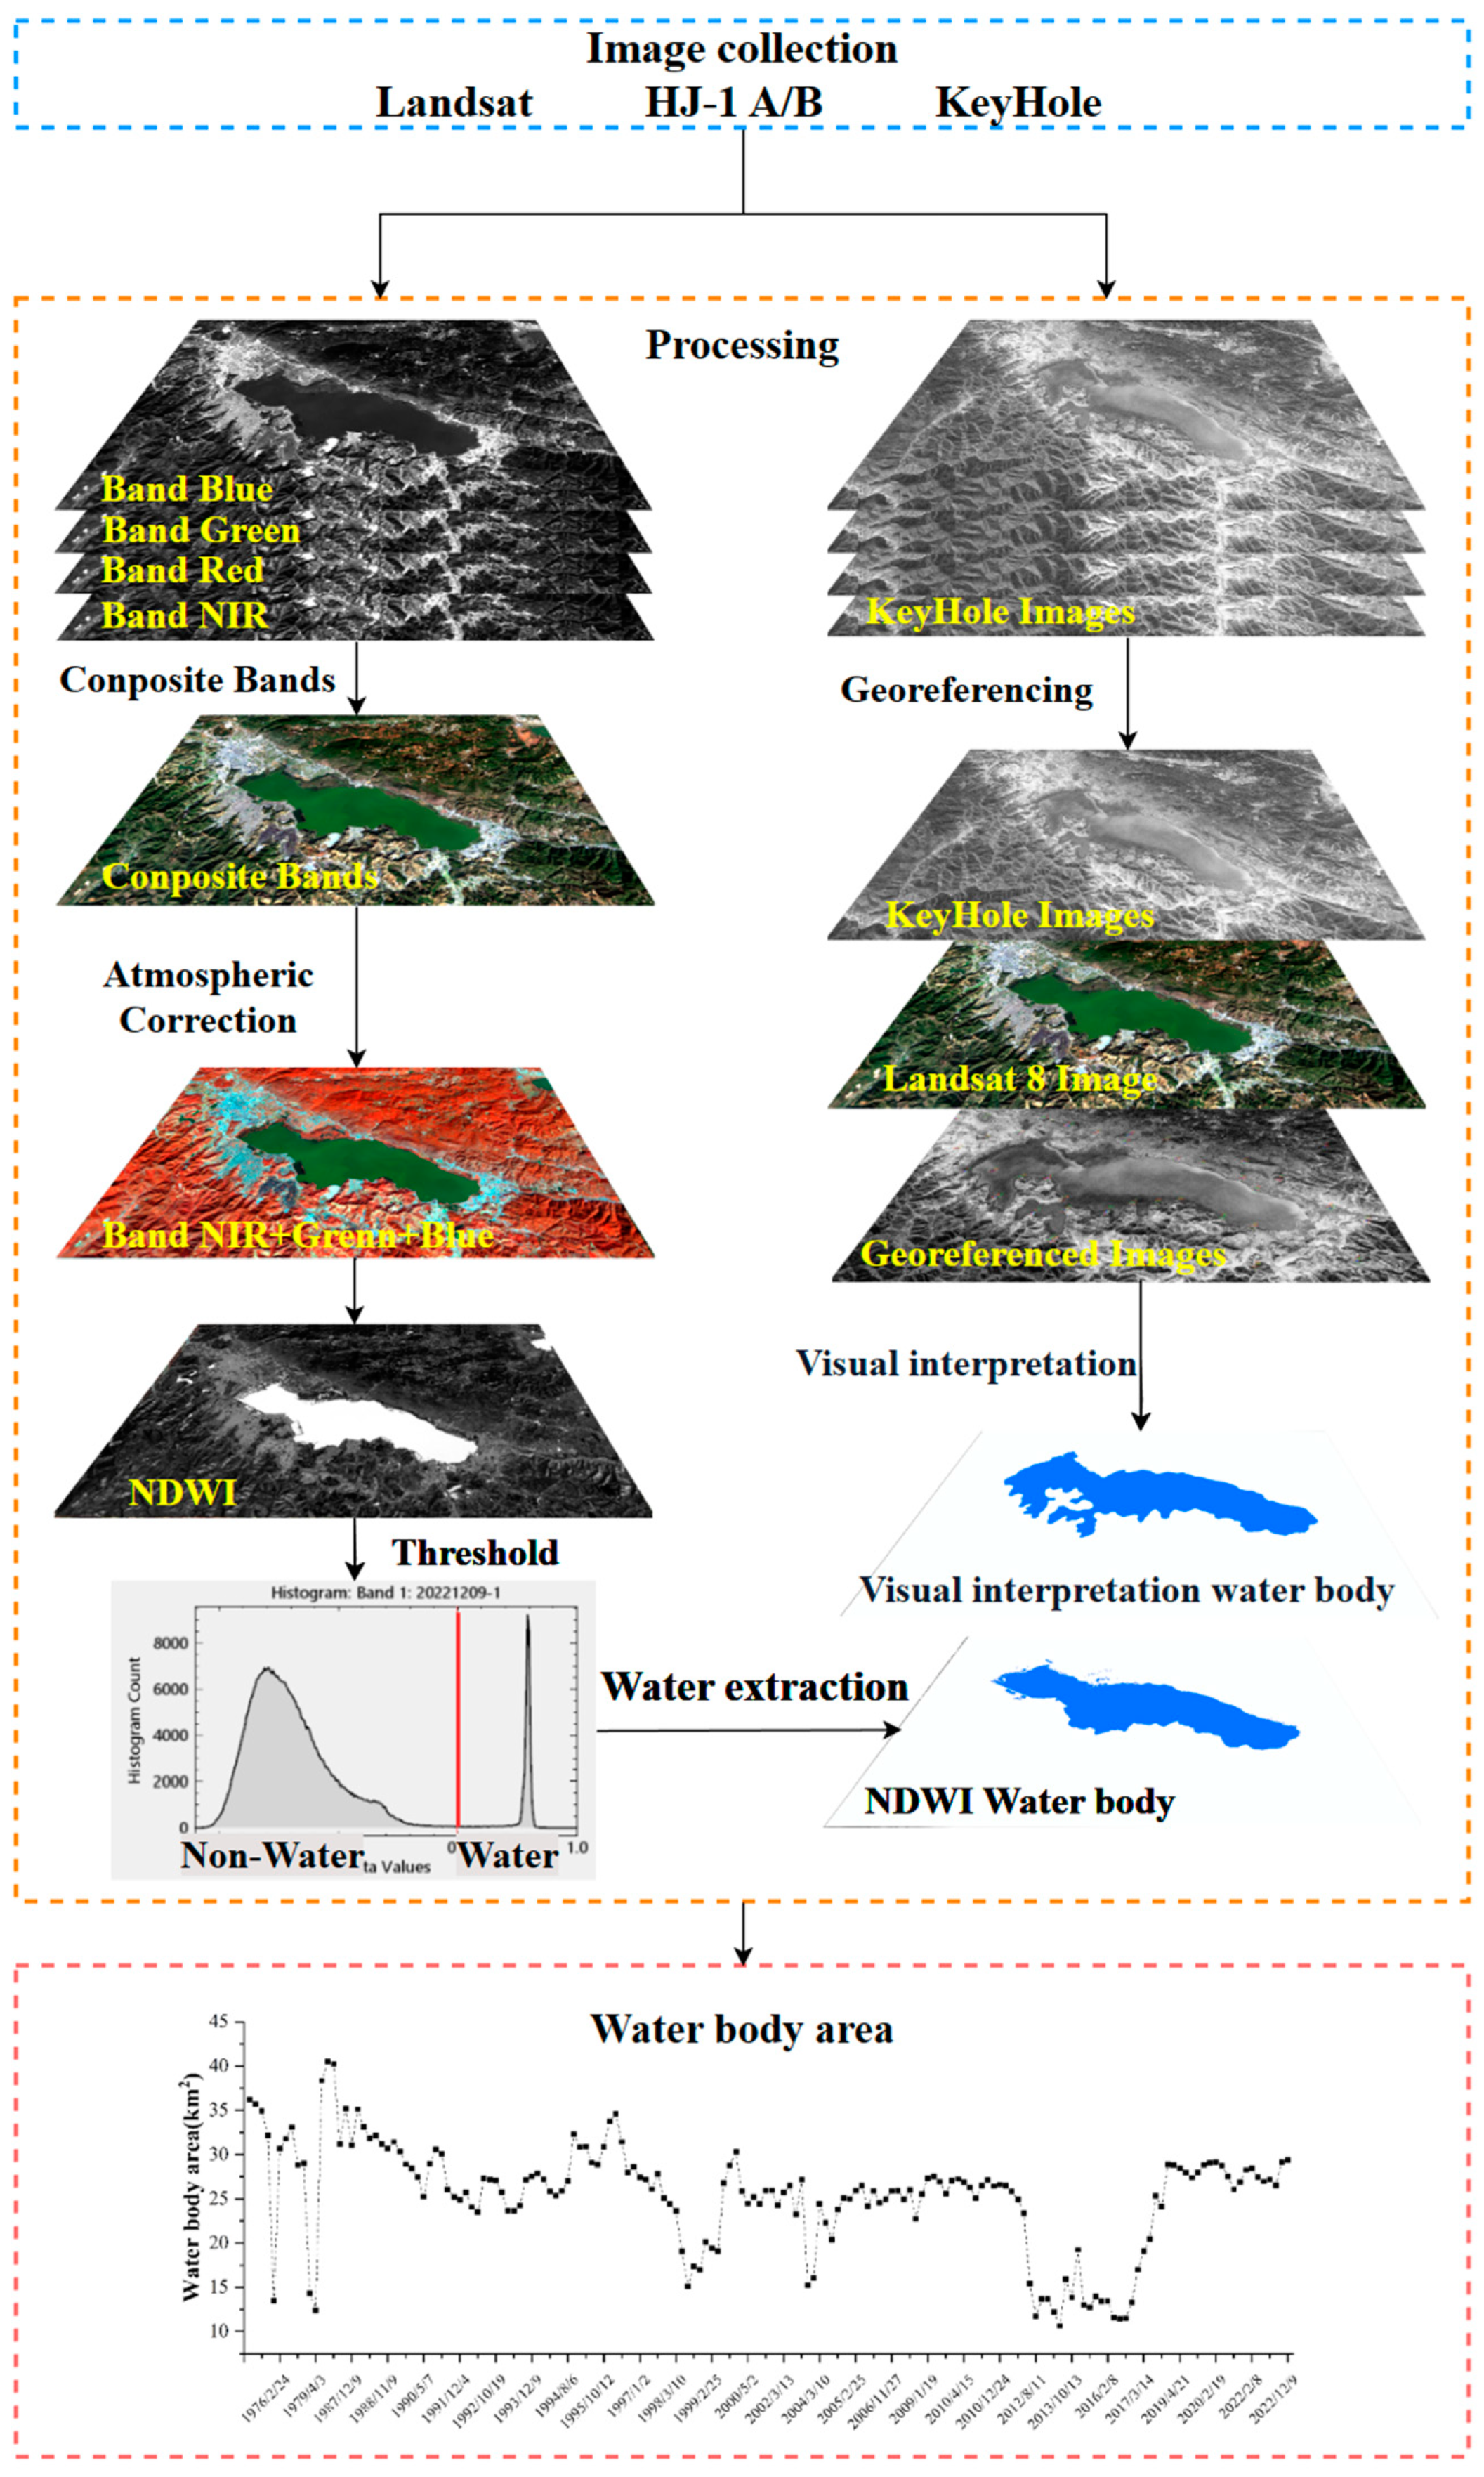
2.3. Data Processing
2.3.1. Preprocessing
2.3.2. Lake Surface Water Body Area Extraction and Validation
2.3.3. Lake’s Surface Area Dynamic Analysis
2.3.4. Multiple Linear Regression (MLR) Analysis for Driving Factors
3. Results
3.1. Accuracy of Lake’s Surface Area Extraction
3.2. Variations of Yilong Lake
3.2.1. Annual Variations in Surface Area of Yilong Lake
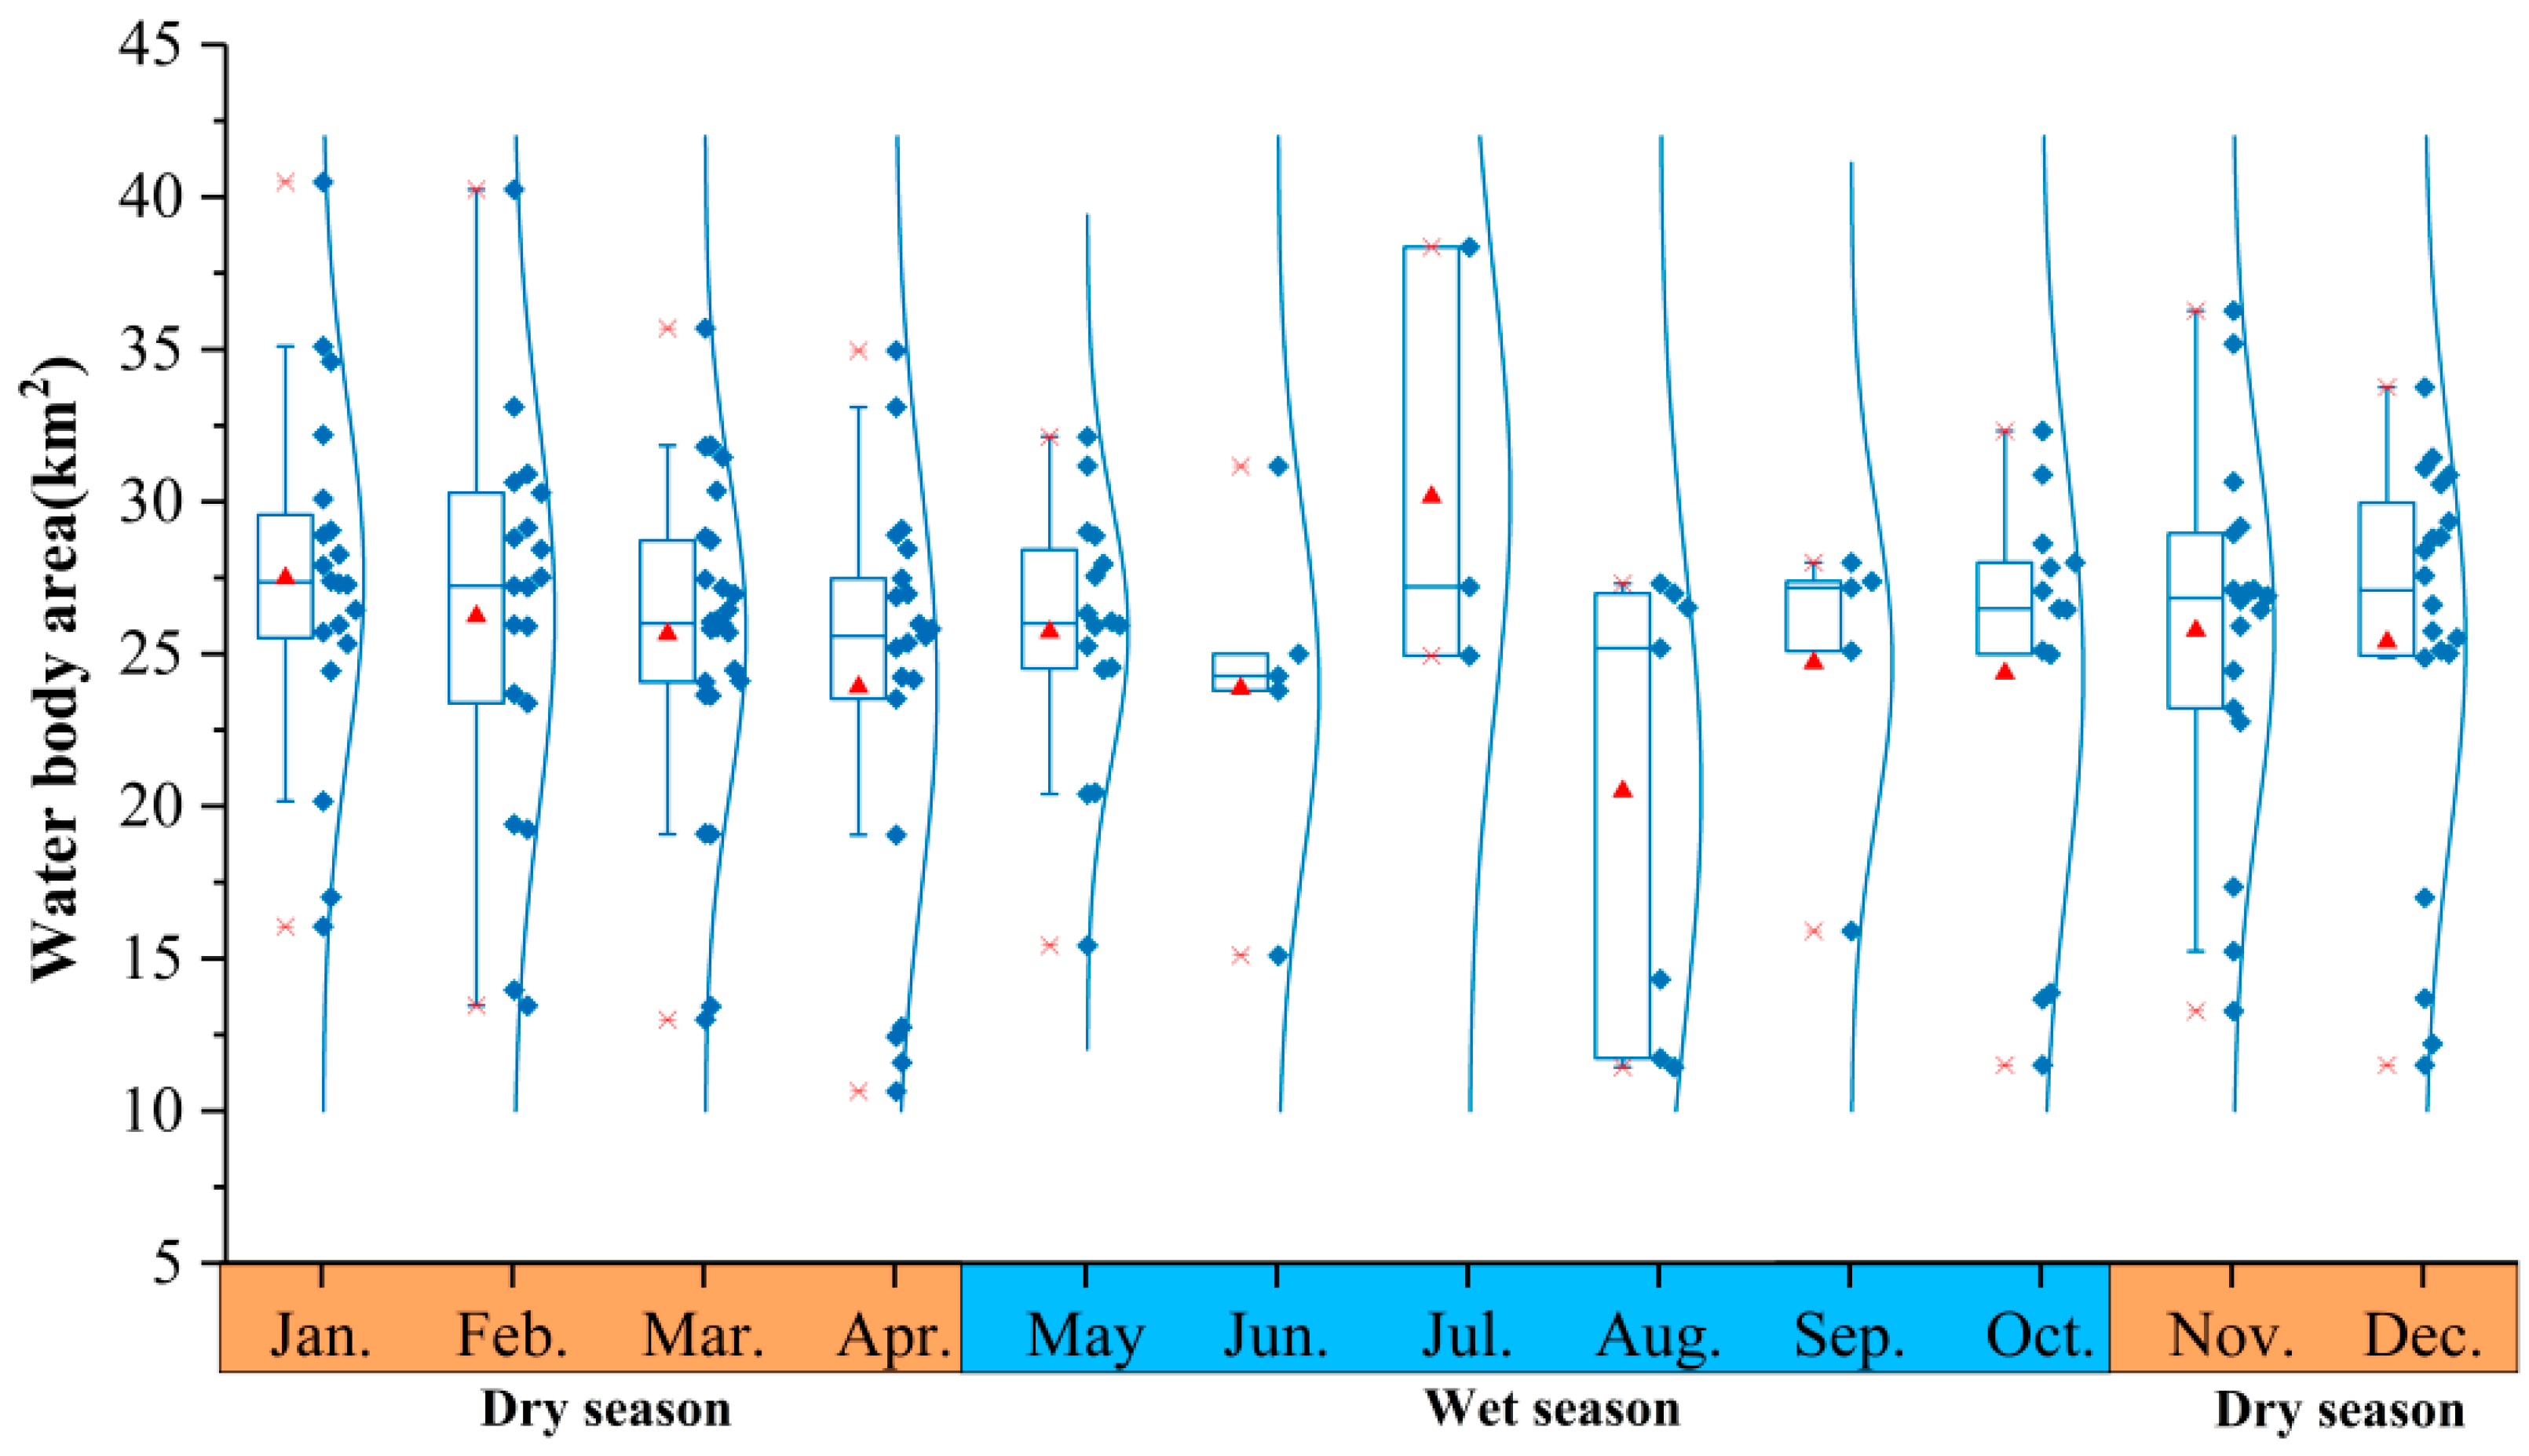
3.2.2. Seasonal Variations in Surface Area of Yilong Lake
3.2.3. Spatial Variations in Surface Area of Yilong Lake
3.3. Variations of Meteorological Factors
3.4. Variations of Anthropogenic Factors
3.5. Attribution Analysis of Yilong Lake Variations
4. Discussion
4.1. Dynamic Variations and the Driving Forces
4.2. Variations of Water Surface Area and Its Eco-Environmental Impacts
4.3. Limitations of the Study
5. Conclusions
- (1)
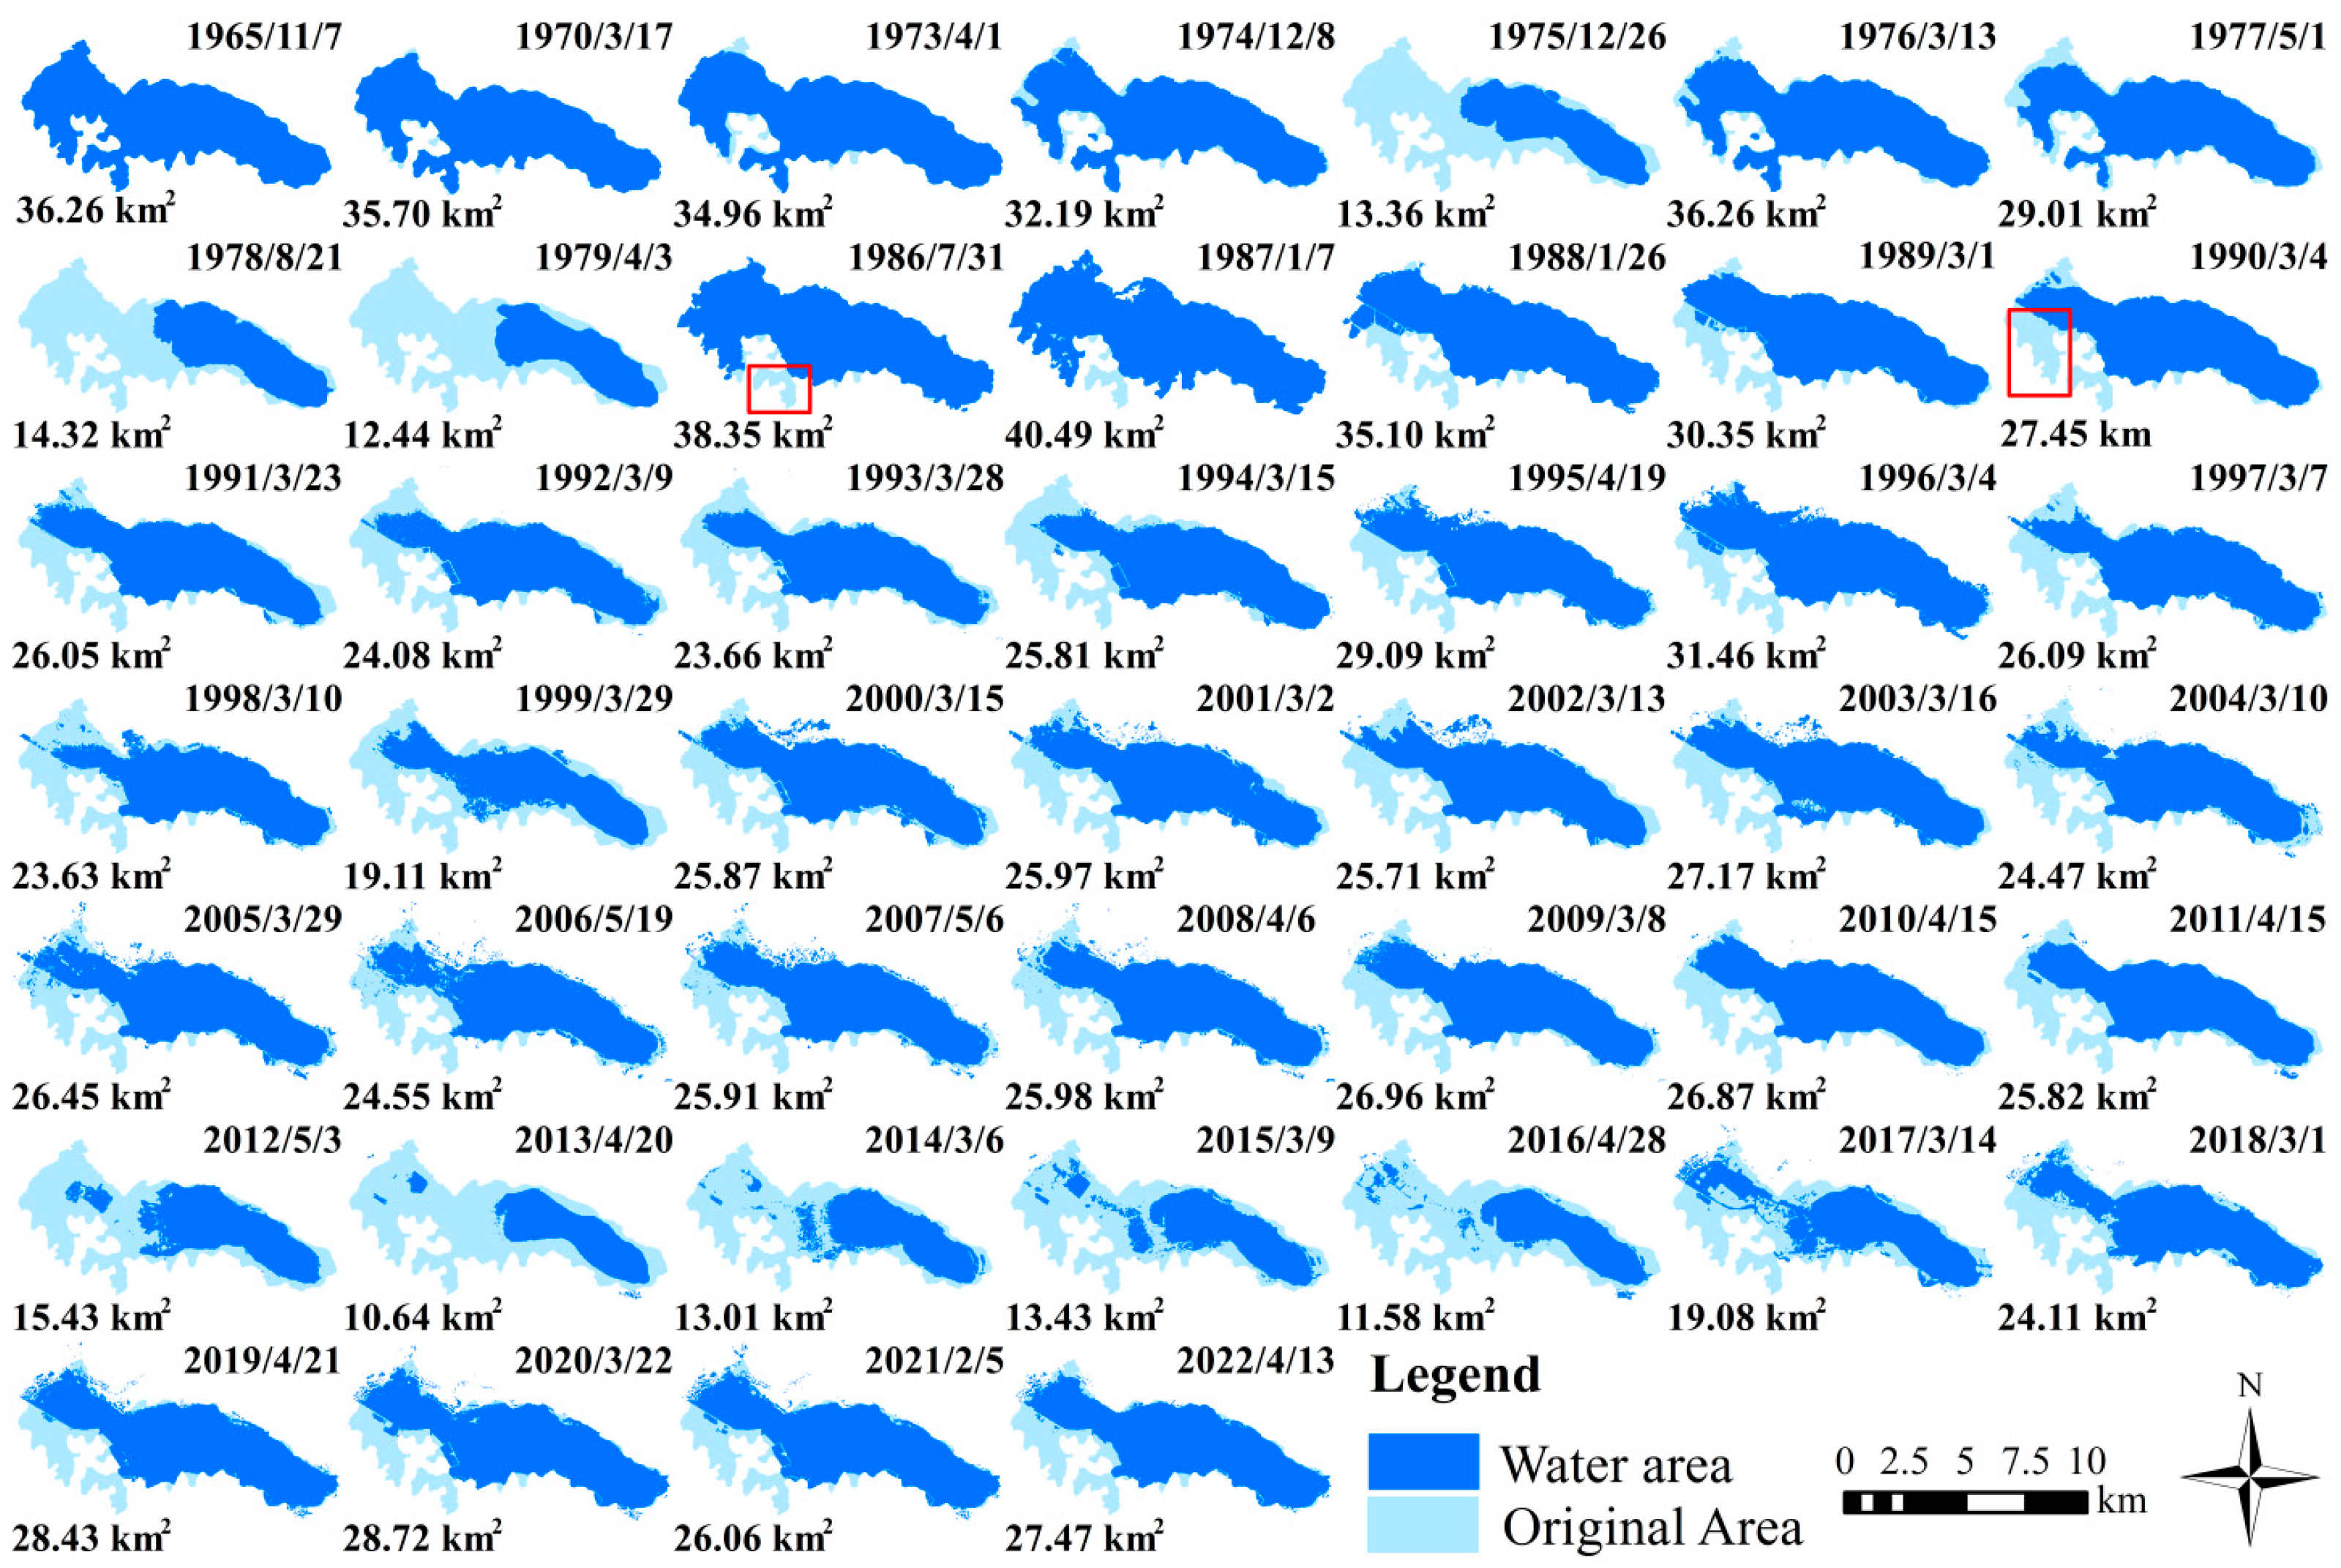
- The surface area of Yilong Lake exhibited a decreasing trend from 1965 to 2022, delineated into three periods: (1) 1965–1979 (rapid shrinkage period, Slope = −1.62, p < 0.05); (2) 1986–2016 (fluctuating shrinkage period, Slope = −0.50, p < 0.001); and (3) 2016–2022 (expanding recovery period, Slope = 2.24, p < 0.05).
- (2)
- Yilong Lake has decreased in size by 8.33 km2 over the course of the last 57 years, with the most reduction occurring along the southern and southwestern shores of the lake. Spatial transformations of Yilong Lake encompass two categories: the permanent depletion of the lake’s surface area and the subsequent reconstitution of the lake’s surface area following a period of contraction. The permanent loss of the lake’s surface area, amounting to 85.95% (7.16 km2), is attributed to reclamation activities.
- (3)
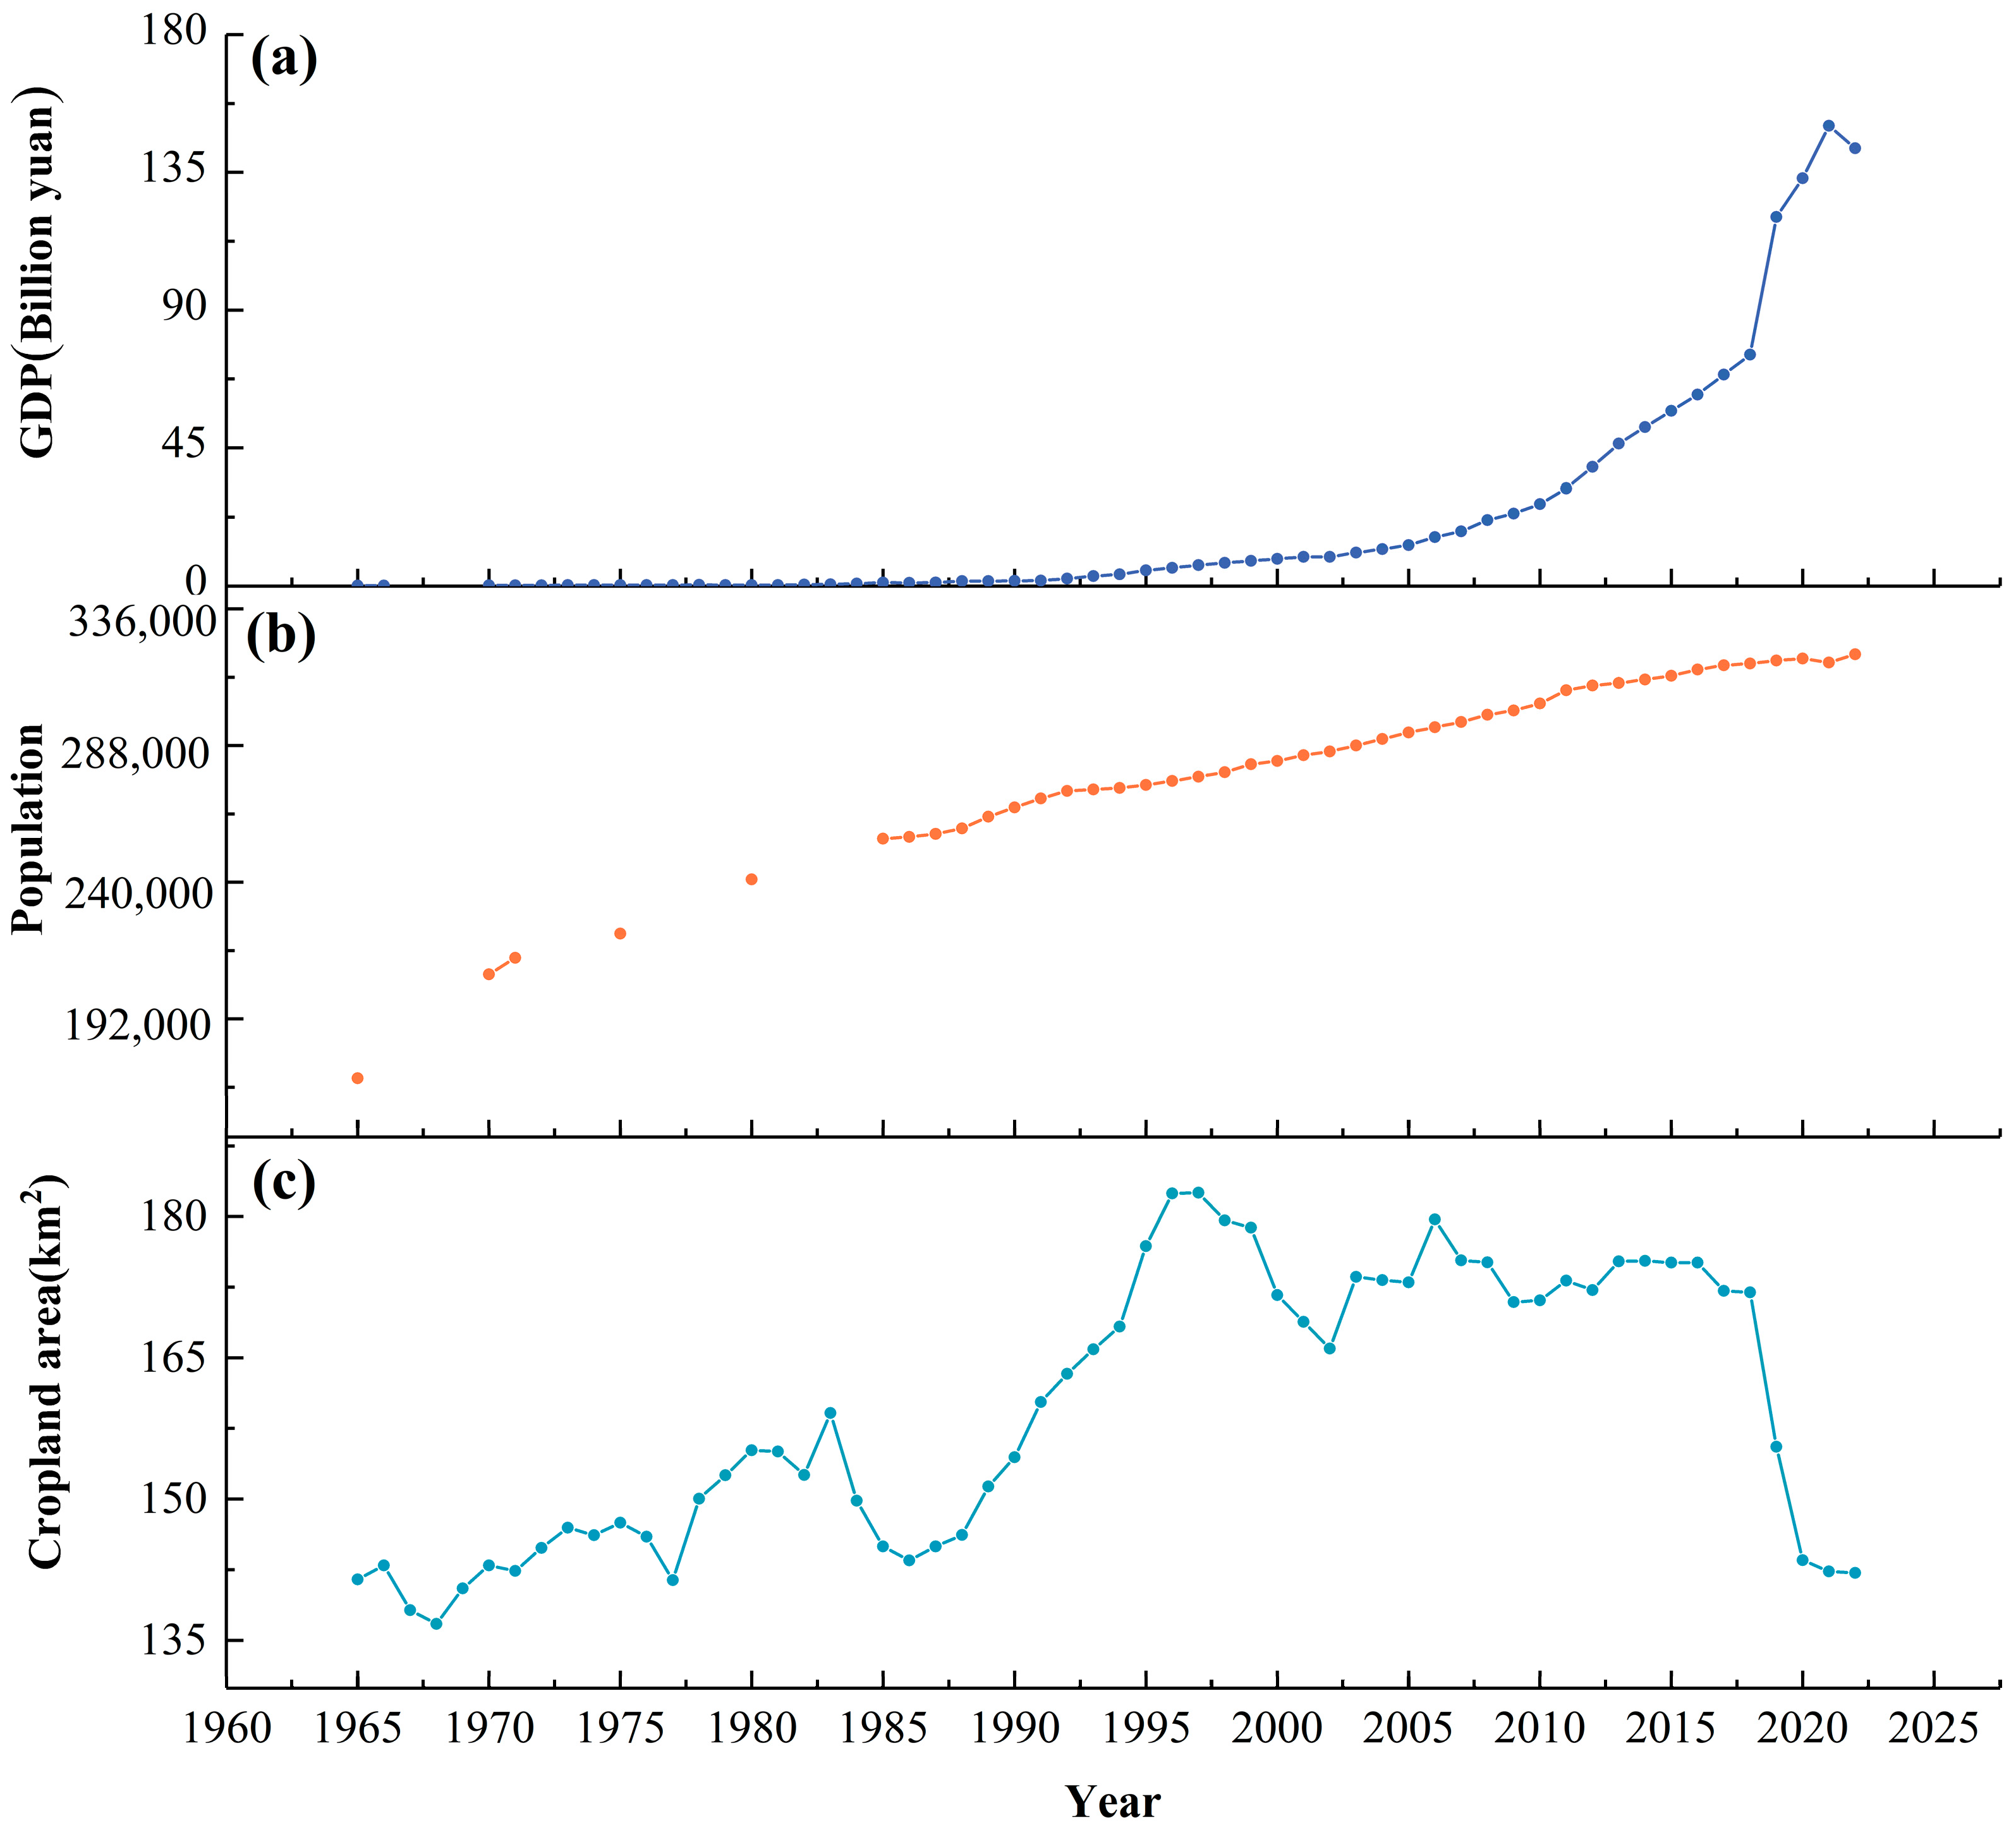
- Attribution analysis revealed that fluctuations in the Yilong Lake’s surface area are impacted by a combination of climate and anthropogenic factors. However, the predominant factors driving these changes differ across various time periods. Between 1965 and 2022, the reduction in the lake’s size was primarily impacted by a decrease in sunshine duration (−0.35, p < 0.01) and a decline in cropland area (−0.37, p < 0.01). During the period from 1965 to 1979, a significant negative correlation was observed between sunshine duration and the shrinkage of the lake (−0.97, p< 0.001). Between 1986 and 2016, the reduction in population (−0.51, p < 0.001) and cropland area (−0.48, p < 0.001) were the primary factors contributing to the shrinkage of the lake. After 2016, the population increase (0.87, p < 0.05) contributed significantly to the lake’s recovery.
- (4)
- Presently, the preservation of Yilong Lake’s area relies on artificial ecological water replenishment initiatives and rigorous outflow regulation, resulting in reservoir-like characteristics within the lake.
Supplementary Materials
Author Contributions
Funding
Data Availability Statement
Conflicts of Interest
References
- Catalan, J.; Pla-Rabés, S.; Wolfe, A.P.; Smol, J.P.; Rühland, K.M.; Anderson, N.J.; Kopáček, J.; Stuchlík, E.; Schmidt, R.; Koinig, K.A. Global change revealed by palaeolimnological records from remote lakes: A review. J. Paleolimnol. 2013, 49, 513–535. [Google Scholar] [CrossRef]
- Pi, X.; Luo, Q.; Feng, L.; Xu, Y.; Tang, J.; Liang, X.; Ma, E.; Cheng, R.; Fensholt, R.; Brandt, M. Mapping global lake dynamics reveals the emerging roles of small lakes. Nat. Commun. 2022, 13, 5777. [Google Scholar] [CrossRef]
- Cao, H.; Han, L.; Liu, Z.; Li, L. Monitoring and driving force analysis of spatial and temporal change of water area of Hongjiannao Lake from 1973 to 2019. Ecol. Inform. 2021, 61, 101230. [Google Scholar] [CrossRef]
- Liu, H.; Zheng, L.; Jiang, L.; Liao, M. Forty-year water body changes in Poyang Lake and the ecological impacts based on Landsat and HJ-1 A/B observations. J. Hydrol. 2020, 589, 125161. [Google Scholar] [CrossRef]
- Woolway, R.I.; Kraemer, B.M.; Lenters, J.D.; Merchant, C.J.; O’Reilly, C.M.; Sharma, S. Global lake responses to climate change. Nat. Rev. Earth Environ. 2020, 1, 388–403. [Google Scholar] [CrossRef]
- Dervisoglu, A.; Yağmur, N.; Firatli, E.; Musaoğlu, N.; Tanik, A. Spatio-temporal assessment of the shrinking Lake Burdur, Turkey. Int. J. Environ. Geoinform. 2022, 9, 169–176. [Google Scholar] [CrossRef]
- Zhou, X.; Jin, F.; Lu, C.; Baoyin, T.; Jia, Z. Shifts in the community composition of methane-cycling microorganisms during lake shrinkage. Geoderma 2018, 311, 9–14. [Google Scholar] [CrossRef]
- Wang, Y.; Shen, Y.; Guo, Y.; Li, B.; Chen, X.; Guo, X.; Yan, H. Increasing shrinkage risk of endorheic lakes in the middle of farming-pastoral ecotone of Northern China. Ecol. Indic. 2022, 135, 108523. [Google Scholar] [CrossRef]
- Pekel, J.-F.; Cottam, A.; Gorelick, N.; Belward, A.S. High-resolution mapping of global surface water and its long-term changes. Nature 2016, 540, 418–422. [Google Scholar] [CrossRef]
- Muala, E.; Mohamed, Y.; Duan, Z.; Zaag, P.V.D. Estimation of Reservoir Discharges from Lake Nasser and Roseires Reservoir in the Nile Basin Using Satellite Altimetry and Imagery Data. Remote Sens. 2014, 6, 7522–7545. [Google Scholar] [CrossRef]
- Rogan, J.; Chen, D. Remote sensing technology for mapping and monitoring land-cover and land-use change. Prog. Plan. 2004, 61, 301–325. [Google Scholar] [CrossRef]
- Yang, S.; Wan, R.; Yang, G.; Li, B.; Dong, L. Combining historical maps and landsat images to delineate the centennial-scale changes of lake wetlands in Taihu Lake Basin, China. J. Environ. Manag. 2023, 329, 117110. [Google Scholar] [CrossRef] [PubMed]
- Wang, X.; Xiao, X.; Zou, Z.; Hou, L.; Qin, Y.; Dong, J.; Doughty, R.B.; Chen, B.; Zhang, X.; Chen, Y. Mapping coastal wetlands of China using time series Landsat images in 2018 and Google Earth Engine. ISPRS J. Photogramm. Remote Sens. 2020, 163, 312–326. [Google Scholar] [CrossRef] [PubMed]
- Gu, Z.; Zhang, Y.; Fan, H. Mapping inter-and intra-annual dynamics in water surface area of the Tonle Sap Lake with Landsat time-series and water level data. J. Hydrol. 2021, 601, 126644. [Google Scholar] [CrossRef]
- Zuo, J.; Jiang, W.; Li, Q.; Du, Y. Remote sensing dynamic monitoring of the flood season area of Poyang Lake over the past two decades. Nat. Hazards Res. 2024, 4, 8–19. [Google Scholar] [CrossRef]
- Xie, Y.; Gong, J.; Sun, P.; Gou, X. Oasis dynamics change and its influence on landscape pattern on Jinta oasis in arid China from 1963a to 2010a: Integration of multi-source satellite images. Int. J. Appl. Earth Obs. Geoinf. 2014, 33, 181–191. [Google Scholar] [CrossRef]
- Zhang, Y.; An, C.-B.; Zheng, L.-Y.; Liu, L.-Y.; Zhang, W.-S.; Lu, C.; Zhang, Y.-Z. Assessment of lake area in response to climate change at varying elevations: A case study of Mt. Tianshan, Central Asia. Sci. Total Environ. 2023, 869, 161665. [Google Scholar] [CrossRef] [PubMed]
- Zhuo, Y.; Zeng, W.; Ma, B.; Cui, D.; Xie, Y.; Wang, J. Spatiotemporal variation and influencing factors of nitrogen and phosphorus in lake sediments in China since 1850. J. Clean. Prod. 2022, 368, 133170. [Google Scholar] [CrossRef]
- Zhuo, Y.; Zeng, W. Using stable nitrogen isotopes to reproduce the process of the impact of human activities on the lakes in the Yunnan Guizhou Plateau in the past 150–200 years. Sci. Total Environ. 2020, 741, 140191. [Google Scholar] [CrossRef] [PubMed]
- Sui, Q.; Duan, L.; Zhang, Y.; Zhang, X.; Liu, Q.; Zhang, H. Seasonal Water Quality Changes and the Eutrophication of Lake Yilong in Southwest China. Water 2022, 14, 3385. [Google Scholar] [CrossRef]
- Zou, Z.; Dong, J.; Menarguez, M.A.; Xiao, X.; Qin, Y.; Doughty, R.B.; Hooker, K.V.; Hambright, K.D. Continued decrease of open surface water body area in Oklahoma during 1984–2015. Sci. Total Environ. 2017, 595, 451–460. [Google Scholar] [CrossRef]
- Qian, X.; Kun, Y.; Le, C.; Liang, H. Qi Lu Lake and Yilong Lake Water Extraction and Lake Area Change Dynamics Monitoring. Anhui Agric. Sci. Bull. 2017, 23, 123–141. [Google Scholar]
- Li, H.; Zhong, D.; Fan, S.; Zhang, S.; Wang, J. Remote sensing monitoring of the nine plateau lakes’s surface aera in Yunnan in recent thirty years. Resour. Environ. Yangtze Basin 2016, 25, 32–37. [Google Scholar]
- Wu, P.; Shen, H.; Cai, N.; Zeng, C.; Wu, Y.; Wang, B.; Wang, Y. Spatiotemporal analysis of water area annual variations using a Landsat time series: A case study of nine plateau lakes in Yunnan province, China. Int. J. Remote Sens. 2016, 37, 5826–5842. [Google Scholar] [CrossRef]
- Liao, J.; Shen, G.; Li, Y. Lake variations in response to climate change in the Tibetan Plateau in the past 40 years. Int. J. Digit. Earth 2013, 6, 534–549. [Google Scholar] [CrossRef]
- Dai, X.; Yang, X.; Wang, M.; Gao, Y.; Liu, S.; Zhang, J. The dynamic change of bosten lake area in response to climate in the past 30 years. Water 2019, 12, 4. [Google Scholar] [CrossRef]
- Zhang, G.; Yao, T.; Chen, W.; Zheng, G.; Shum, C.K.; Yang, K.; Piao, S.; Sheng, Y.; Yi, S.; Li, J.; et al. Regional differences of lake evolution across China during 1960s–2015 and its natural and anthropogenic causes. Remote Sens. Environ. 2019, 221, 386–404. [Google Scholar] [CrossRef]
- Wang, R.; Xia, H.; Qin, Y.; Niu, W.; Pan, L.; Li, R.; Zhao, X.; Bian, X.; Fu, P. Dynamic Monitoring of Surface Water Area during 1989–2019 in the Hetao Plain Using Landsat Data in Google Earth Engine. Water 2020, 12, 3010. [Google Scholar] [CrossRef]
- Fan, X.; Yang, K.; Yang, R.; Zhao, L. Changes in Meteorological Elements and Its Impacts on Yunnan Plateau Lakes. Appl. Sci. 2023, 13, 2881. [Google Scholar] [CrossRef]
- Duan, Z.; Wang, M.; Chang, X.; Gao, W. Response of river-lake hydrologic regimes to local climate change in the Yunnan-Guizhou Plateau region, China. Reg. Environ. Chang. 2020, 20, 122. [Google Scholar] [CrossRef]
- Wang, S.; Xu, C.; Zhang, W.; Chen, H.; Zhang, B. Human-Induced water loss from closed inland Lakes: Hydrological simulations in China’s Daihai lake. J. Hydrol. 2022, 607, 127552. [Google Scholar] [CrossRef]
- Li, X.; Li, A.; Liu, G.; Jiang, J. Spatial distribution pattern of the lakes in the Yunnan-Guizhou Plateau. Resour. Environ. Yangtze Basin 2010, 19, 90–96. [Google Scholar]
- Yuan, Z.; Wu, D.; Niu, L.; Ma, X.; Li, Y.; Hillman, A.L.; Abbott, M.B.; Zhou, A. Contrasting ecosystem responses to climatic events and human activity revealed by a sedimentary record from Lake Yilong, southwestern China. Sci. Total Environ. 2021, 783, 146922. [Google Scholar] [CrossRef] [PubMed]
- Wei, Q.; Xue, L.; Liao, S.; Yang, J.; Niu, B. Analysis of driving forces on ecohydrological regime and environmental flow changes in Hongze Lake, China. Ecol. Inform. 2024, 79, 102423. [Google Scholar] [CrossRef]
- Wang, S.-R.; Meng, W.; Jin, X.-C.; Zheng, B.-H.; Zhang, L.; Xi, H.-Y. Ecological security problems of the major key lakes in China. Environ. Earth Sci. 2015, 74, 3825–3837. [Google Scholar] [CrossRef]
- Huang, Y.; Ma, R.; Shi, H.; Li, J.; Tu, S. Centennial Lake Environmental Evolution Reflected by Diatoms in Yilong Lake, Yunnan Province, China. Appl. Sci. 2023, 13, 5288. [Google Scholar] [CrossRef]
- Ma, G.; Li, Q.; Yang, S.; Zhang, R.; Zhang, L.; Xiao, J.; Sun, G. Analysis of landscape pattern evolution and driving forces based on land-use changes: A case study of Yilong Lake watershed on Yunnan-Guizhou Plateau. Land 2022, 11, 1276. [Google Scholar] [CrossRef]
- Zhao, L.; Wang, M.; Liang, Z.; Zhou, Q. Identification of regime shifts and their potential drivers in the shallow eutrophic Lake Yilong, Southwest China. Sustainability 2020, 12, 3704. [Google Scholar] [CrossRef]
- Zhao, L.; Li, Y.; Zou, R.; He, B.; Zhu, X.; Liu, Y.; Wang, J.; Zhu, Y. A three-dimensional water quality modeling approach for exploring the eutrophication responses to load reduction scenarios in Lake Yilong (China). Environ. Pollut. 2013, 177, 13–21. [Google Scholar] [CrossRef]
- Langer, T.A.; Cooper, M.J.; Reisinger, L.S.; Reisinger, A.J.; Uzarski, D.G. Water depth and lake-wide water level fluctuation influence on α-and β-diversity of coastal wetland fish communities. J. Great Lakes Res. 2018, 44, 70–76. [Google Scholar] [CrossRef]
- Cao, L.; Zhang, E.; Zang, C.; Cao, W. Evaluating the status of China’s continental fish and analyzing their causes of endangerment through the red list assessment. Biodivers. Sci. 2016, 24, 598–609. [Google Scholar] [CrossRef]
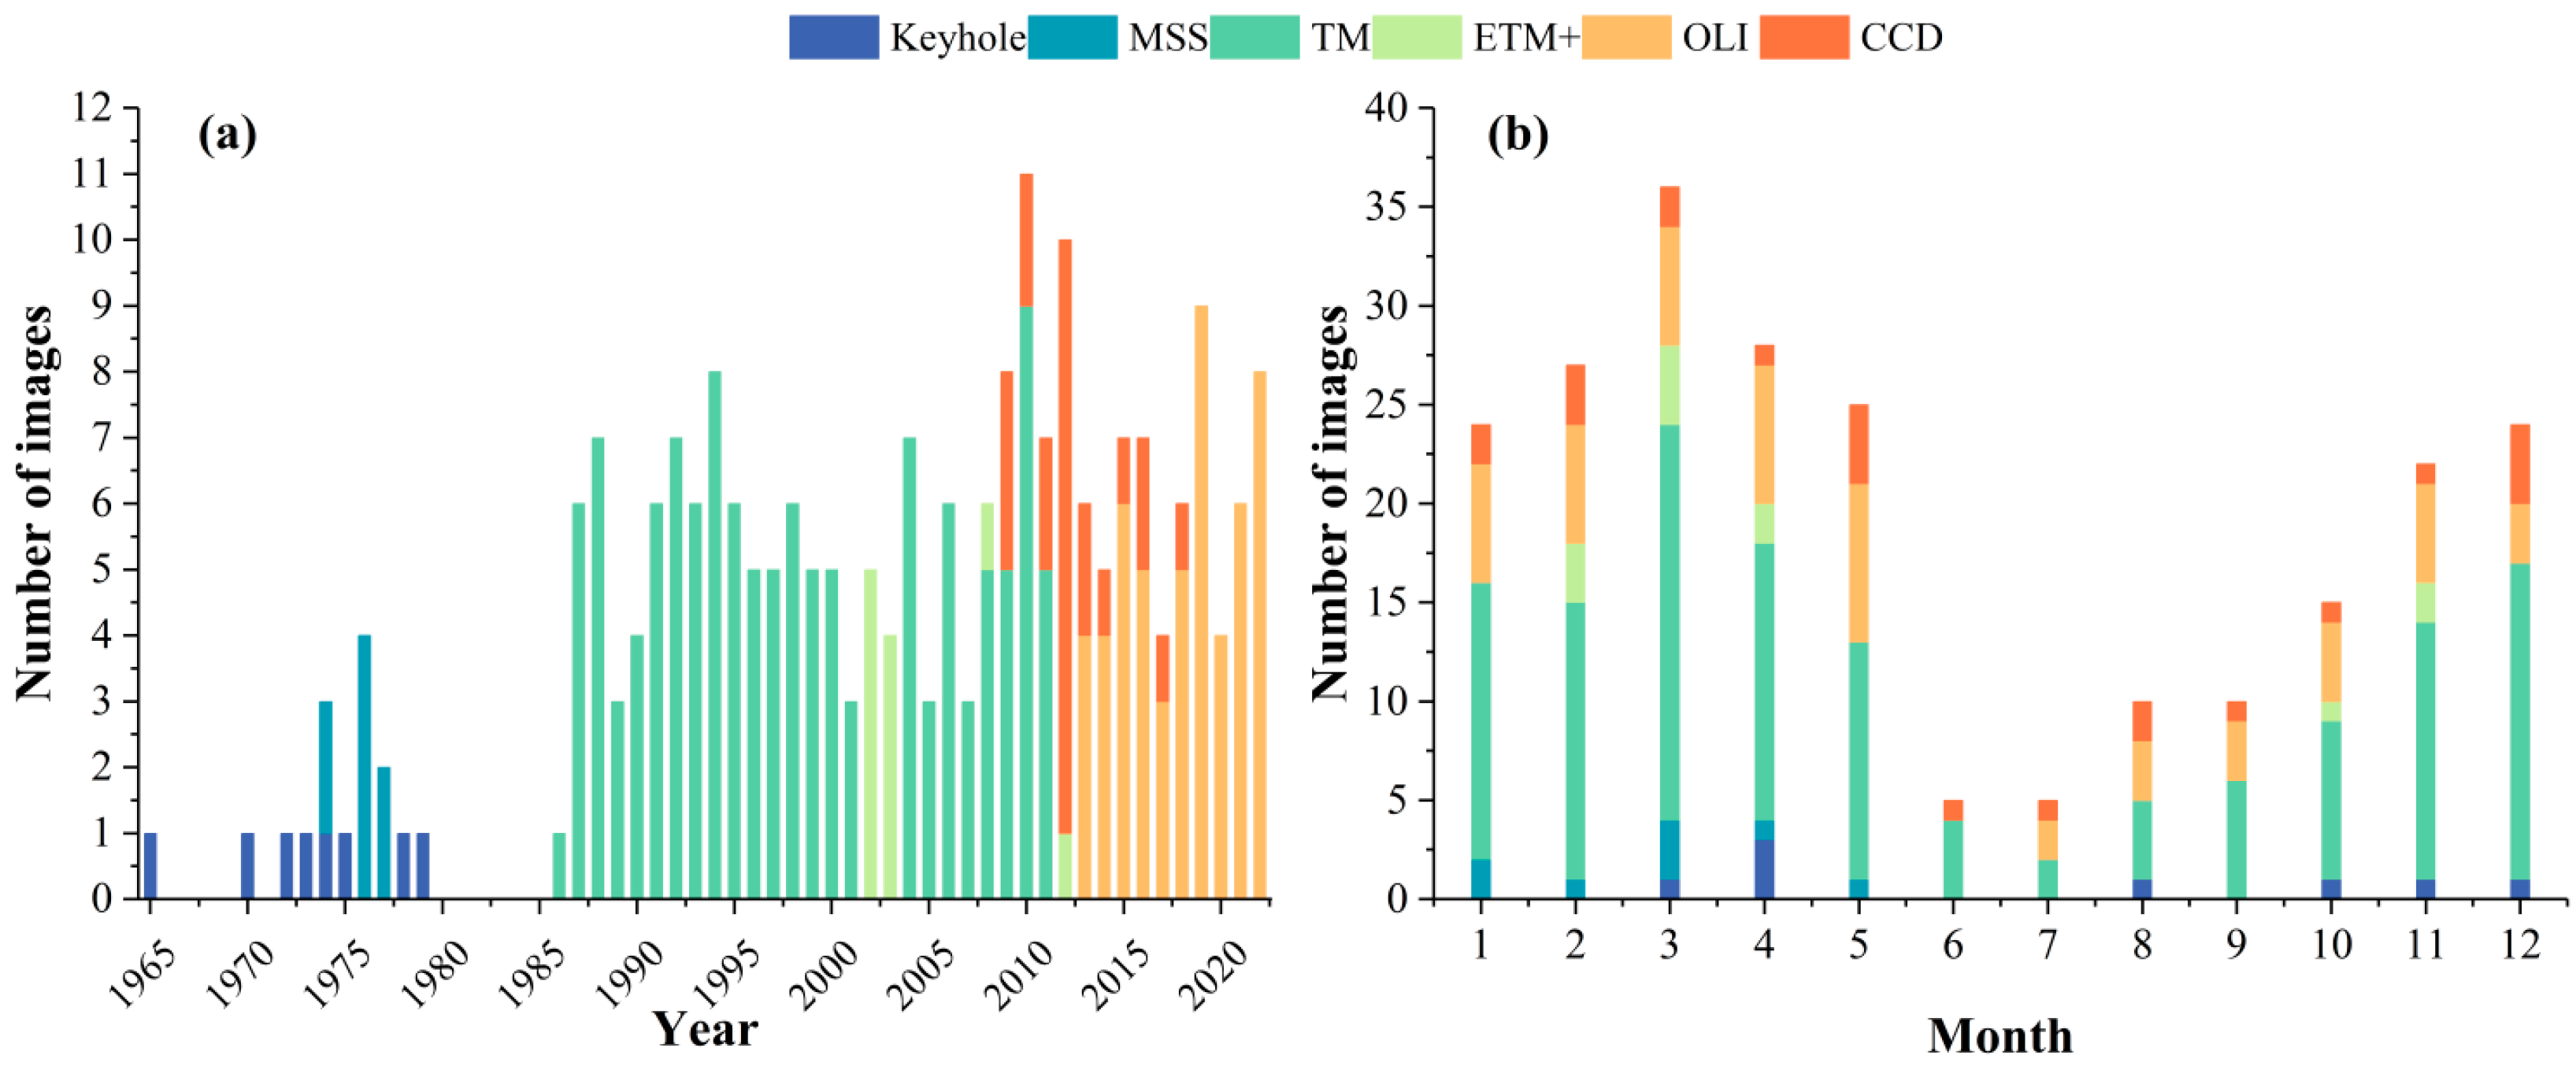



| Satellite | KeyHole | Landsat | Landsat | Landsat | Landsat | HJ-1 A/B |
|---|---|---|---|---|---|---|
| Sensors | - | MSS | TM | ETM+ | OLI | CCD |
| Resolution | 1.8–2.7 m | 79 m | 30 m | 30 m | 30 m | 30 m |
| Revisit Period | - | 18 d | 16 d | 16 d | 16 d | 2 d |
| Swath Width | - | 185 km | 185 km | 185 km | 185 km | 360 km |
| Operating Time | 1965–1979 | 1972–1992 | 1984–now | 1999–2003 | 2013–now | 2008–now |
| Year | TPDC/km2 | NDWI and Visual Interpretation Results/km2 | Difference Rate |
|---|---|---|---|
| 1970 | 34.54 | 35.70 | 3.36% |
| 1990 | 30.49 | 30.58 | 0.30% |
| 1995 | 33.72 | 33.75 | 0.10% |
| 2000 | 30.75 | 30.29 | −1.51% |
| 2005 | 27.39 | 26.45 | −3.43% |
| 2010 | 25.49 | 25.69 | 0.79% |
| 2015 | 12.59 | 12.48 | −0.89% |
| 2020 | 28.73 | 29.04 | 1.07% |
| Year | Average Area/km2 | /km2 | Annual Area Change Rate | Year | Average Area/km2 | Annual Area Change Rate | |
|---|---|---|---|---|---|---|---|
| 1965 | 36.26 | 0 | 0.00% | 2000 | 26.06 | 3.21 | 14.05% |
| 1970 | 35.7 | −0.56 | −1.54% | 2001 | 25.4 | −0.66 | −2.53% |
| 1973 | 34.96 | −0.74 | −2.07% | 2002 | 25.14 | −0.26 | −1.02% |
| 1974 | 32.2 | −2.76 | −7.89% | 2003 | 21.2 | −3.94 | −15.67% |
| 1975 | 13.36 | −18.84 | −58.51% | 2004 | 22.45 | 1.25 | 5.90% |
| 1976 | 31.85 | 18.35 | 135.93% | 2005 | 25.52 | 3.07 | 13.67% |
| 1977 | 28.92 | −2.93 | −9.20% | 2006 | 25.34 | −0.18 | −0.71% |
| 1978 | 14.32 | −14.6 | −50.48% | 2007 | 25.47 | 0.13 | 0.51% |
| 1979 | 12.44 | −1.88 | −13.13% | 2008 | 24.76 | −0.71 | −2.79% |
| 1986 | 38.35 | 25.91 | 208.28% | 2009 | 26.89 | 2.13 | 8.60% |
| 1987 | 35.64 | −2.71 | −7.07% | 2010 | 26.52 | -0.37 | −1.38% |
| 1988 | 32.21 | −3.43 | −9.62% | 2011 | 25.74 | −0.78 | −2.94% |
| 1989 | 29.22 | −2.99 | −9.28% | 2012 | 15.02 | −10.72 | −41.65% |
| 1990 | 28.06 | −1.16 | −3.97% | 2013 | 13.47 | −1.55 | −10.32% |
| 1991 | 26.55 | −1.51 | −5.38% | 2014 | 15 | 1.53 | 11.36% |
| 1992 | 25.8 | −0.75 | −2.82% | 2015 | 13.7 | −1.3 | −8.67% |
| 1993 | 25.25 | −0.55 | −2.13% | 2016 | 12.25 | −1.45 | −10.58% |
| 1994 | 27.8 | 2.55 | 10.10% | 2017 | 18.85 | 6.6 | 53.88% |
| 1995 | 30.7 | 2.9 | 10.43% | 2018 | 24.73 | 5.88 | 31.19% |
| 1996 | 30.67 | −0.03 | −0.10% | 2019 | 28.33 | 3.6 | 14.56% |
| 1997 | 26.73 | −3.94 | −12.85% | 2020 | 28.62 | 0.29 | 1.02% |
| 1998 | 19.43 | −7.3 | −27.31% | 2021 | 26.49 | −2.13 | −7.44% |
| 1999 | 22.85 | 3.42 | 17.60% | 2022 | 27.93 | 1.44 | 5.44% |
| Time | Number | Length/km | Reclaimed Area/km2 |
|---|---|---|---|
| 1965 | 0 | 0 | 0 |
| 1970 | 6 | 2.55 | 0.9 |
| 1975 | 12 | 6.19 | 1.41 |
| 1977 | 4 | 4.80 | 4.41 |
| 1980s | 2 | 2.12 | 0.36 |
| 1990s | 1 | 0.56 | 0.08 |
| Total | 25 | 16.22 | 7.16 |
| Variables | 1965–2022 | 1965–1979 | 1986–2016 | 2016–2022 |
|---|---|---|---|---|
| Lake’s Surface Area | Lake’s Surface Area | Lake’s Surface Area | Lake’s Surface Area | |
| Coef. | Coef. | Coef. | Coef. | |
| Air temperature | ||||
| Precipitation | ||||
| Evaporation | ||||
| Sunshine duration | −0.35 * | −0.97 *** | ||
| GDP | ||||
| Population | −0.51 *** | 0.87 * | ||
| Cropland area | −0.37 ** | −0.48 *** | ||
| Reclaimed area | ||||
| Constant | 117.03 | 334.65 | 105.08 | −960.84 |
| Model summary | ||||
| R2 | 0.31 | 0.82 | 0.56 | 0.75 |
| SEE | 5.78 | 4.61 | 3.96 | 3.38 |
| F | 9.49 | 32.40 | 21.64 | 14.87 |
| Sig. | 0.00 | 0.00 | 0.00 | 0.01 |
Disclaimer/Publisher’s Note: The statements, opinions and data contained in all publications are solely those of the individual author(s) and contributor(s) and not of MDPI and/or the editor(s). MDPI and/or the editor(s) disclaim responsibility for any injury to people or property resulting from any ideas, methods, instructions or products referred to in the content. |
© 2024 by the authors. Licensee MDPI, Basel, Switzerland. This article is an open access article distributed under the terms and conditions of the Creative Commons Attribution (CC BY) license (https://creativecommons.org/licenses/by/4.0/).
Share and Cite
Bao, N.; Song, W.; Ma, J.; Chu, Y. Multi-Source Remote Sensing Analysis of Yilong Lake’s Surface Water Dynamics (1965–2022): A Temporal and Spatial Investigation. Water 2024, 16, 2058. https://doi.org/10.3390/w16142058
Bao N, Song W, Ma J, Chu Y. Multi-Source Remote Sensing Analysis of Yilong Lake’s Surface Water Dynamics (1965–2022): A Temporal and Spatial Investigation. Water. 2024; 16(14):2058. https://doi.org/10.3390/w16142058
Chicago/Turabian StyleBao, Ningying, Weifeng Song, Jiangang Ma, and Ya Chu. 2024. "Multi-Source Remote Sensing Analysis of Yilong Lake’s Surface Water Dynamics (1965–2022): A Temporal and Spatial Investigation" Water 16, no. 14: 2058. https://doi.org/10.3390/w16142058
APA StyleBao, N., Song, W., Ma, J., & Chu, Y. (2024). Multi-Source Remote Sensing Analysis of Yilong Lake’s Surface Water Dynamics (1965–2022): A Temporal and Spatial Investigation. Water, 16(14), 2058. https://doi.org/10.3390/w16142058


