Article

Changes in Runoff and Sediment Loads in the Tuhai River Basin and the Factors Influencing These Changes

1
Shandong Key Laboratory of Eco-Environmental Science for the Yellow River Delta, Shandong University of Aeronautics, Binzhou 256603, China
2
Binzhou Hydrological Center, Binzhou 256609, China
3
Shandong Forestry Protection and Development Center, Jinan 250000, China
4
Shenzhen Water Planning and Design Institute Co., Ltd., Shenzhen 518022, China
*
Author to whom correspondence should be addressed.
Water 2024, 16(14), 2064; https://doi.org/10.3390/w16142064
Submission received: 20 June 2024 / Revised: 14 July 2024 / Accepted: 18 July 2024 / Published: 22 July 2024
(This article belongs to the Special Issue Research on Soil and Water Conservation and Vegetation Restoration)

Abstract

:
In this study, rainfall, runoff, and sediment load data were collected from the Tuhai River Basin from 1972 to 2021. The Mann–Kendall test, runoff–sediment curve, and double mass curve were used to identify the characteristics and factors influencing runoff and sediment loads in the Tuhai River Basin. The results showed that the average annual runoff and sediment loads in the river basin were 4.03 × 10⁸ m3 and 3.52 × 10⁸ kg, respectively; furthermore, the flood season (June–September) accounted for 79.9% and 99.4% of these values, respectively. There were no apparent runoff trends in the annual, flood, and non-flood (October–May) stages, and the annual and flood season sediment loads decreased significantly. The abrupt change points of annual and flood season runoff in the Tuhai River Basin mainly occurred from 2003 to 2004 and from 2013 to 2014. Moreover, the abrupt change points of annual and flood season sediment load only occurred from 1978 to 1979. The runoff–sediment curve showed a clear power function relationship between runoff and sediment loads. The runoff in the Tuhai River Basin from 2003 to 2013 was mainly affected by precipitation. Additionally, the contributions of human activities to runoff and sediment load reduction in the Tuhai River Basin were 57.7–88.9% and 63.1–86.0%, respectively. The increase in human water consumption was the main reason for the decrease in runoff in the Tuhai River Basin. Furthermore, the measures taken in soil and water conservation and reservoir construction were the main factors behind a reduction in sediment loads in the Tuhai River Basin.

1. Introduction

As the most active parts of a river basin system, river runoff and sediments are closely related to hydrological conditions and have a major impact on regional ecological environmental security and economic and social development [1,2,3]. Previous observations have shown that the variations in river runoff and sediment loads exhibit regularity; however, in recent years, studies have indicated that significant changes have occurred in runoff and sediments in 24% of the world’s rivers [4]. Thus, it is essential to identify runoff and sediment generation, change characteristics, and their underlying causes to improve water resource management [5,6,7,8]. Numerous studies have reported that climate change, especially rainfall, and human activities are the main factors influencing river runoff and sediment loads [9,10,11]. Further, global climate change and human activities have introduced great variability, leading to frequent river floods and sediment disasters [12,13]. Therefore, exploring the characteristics of runoff and sediment loads and their influencing factors is crucial in understanding the mechanism of runoff and sediment change, and it is helpful to formulate effective countermeasures to deal with severe river floods and deficit disasters.
Many scholars have studied the characteristics of runoff and sediment changes and their influencing factors in different basins. For example, Cui et al. [14] used the Mann–Kendall method to study the law of runoff and sediment changes in the Yellow River Basin and found a downward trend and a sudden change in runoff and sediment load changes in the basin. Moreover, Yang et al. [15] found that the runoff and sediment load in Dongting Lake showed a downward trend from 1951 to 2015, and there were sudden changes in runoff and sediment load based on the runoff–sediment curves. Moreover, Yang et al. [16] studied the effect of climate and human activities on runoff changes in 64 catchments located in mainland China and showed that vegetation restoration, urbanization expansion, and construction of reservoirs were the dominant driving factors influencing runoff changes in catchments. Further, Gao et al. [17], using the double cumulative curve, found that human activities were the main factors behind runoff reduction in the middle reaches of the Yellow River Basin. Additionally, Feng et al. [18] showed that large-scale revegetation programs weakened the correlation between river runoff and annual rainfall in the Chinese Loess Plateau. However, river runoff has decreased due to the decrease in rainfall in the Pacific Northwest United States [10].
The Haihe River Basin has narrow rivers and gentle slopes and precipitation is concentrated in June–September with great inter-annual variability; consequently, the basin experiences frequent floods, continuous droughts and floods, and intertwined droughts and floods [19,20,21]. The Tuhai River Basin is an important part of the Haihe River Basin [22]. The characteristics of hydrological change in the northern part of the Haihe River Basin are relatively well-known, but the hydrological change in the southern part needs further study [23,24]. Additionally, existing research focuses on the law of runoff changes in the Haihe River Basin [23,24]. Nevertheless, the relationship between runoff and sediment load and the influence of climate and human activities on runoff and sediment load in the Haihe River Basin need to be assessed. Further, due to global climate change and rapid socio-economic development, the risk of droughts and flood disasters in the Tuhai River Basin has increased [25]. Recently, a few studies have explored the seasonal variations in runoff in the Tuhai River [26,27]. However, there is a knowledge gap concerning the relationship between runoff and sediment loads in the flood and non-flood seasons along with their potential driving factors. Therefore, a deep understanding of the influence of climate change and human activities on runoff and sediment changes and a comprehension of the formation mechanism of runoff and sediment changes in the Tuhai River Basin will help prevent and alleviate regional drought and flood disasters and enhance the efficient utilization of water resources.
This study investigated monthly runoff, sediment load, and precipitation data from 1972 to 2021 at Pujizha hydrological station located in the main stream of the Tuhai River. Linear regression, the Mann–Kendall test, the runoff–sediment relationship curve, and the double accumulation curve were used to evaluate changes in runoff and sediment loads within the Tuhai River Basin and to identify the climate change aspects and human activities influencing these changes.

2. Materials and Methods
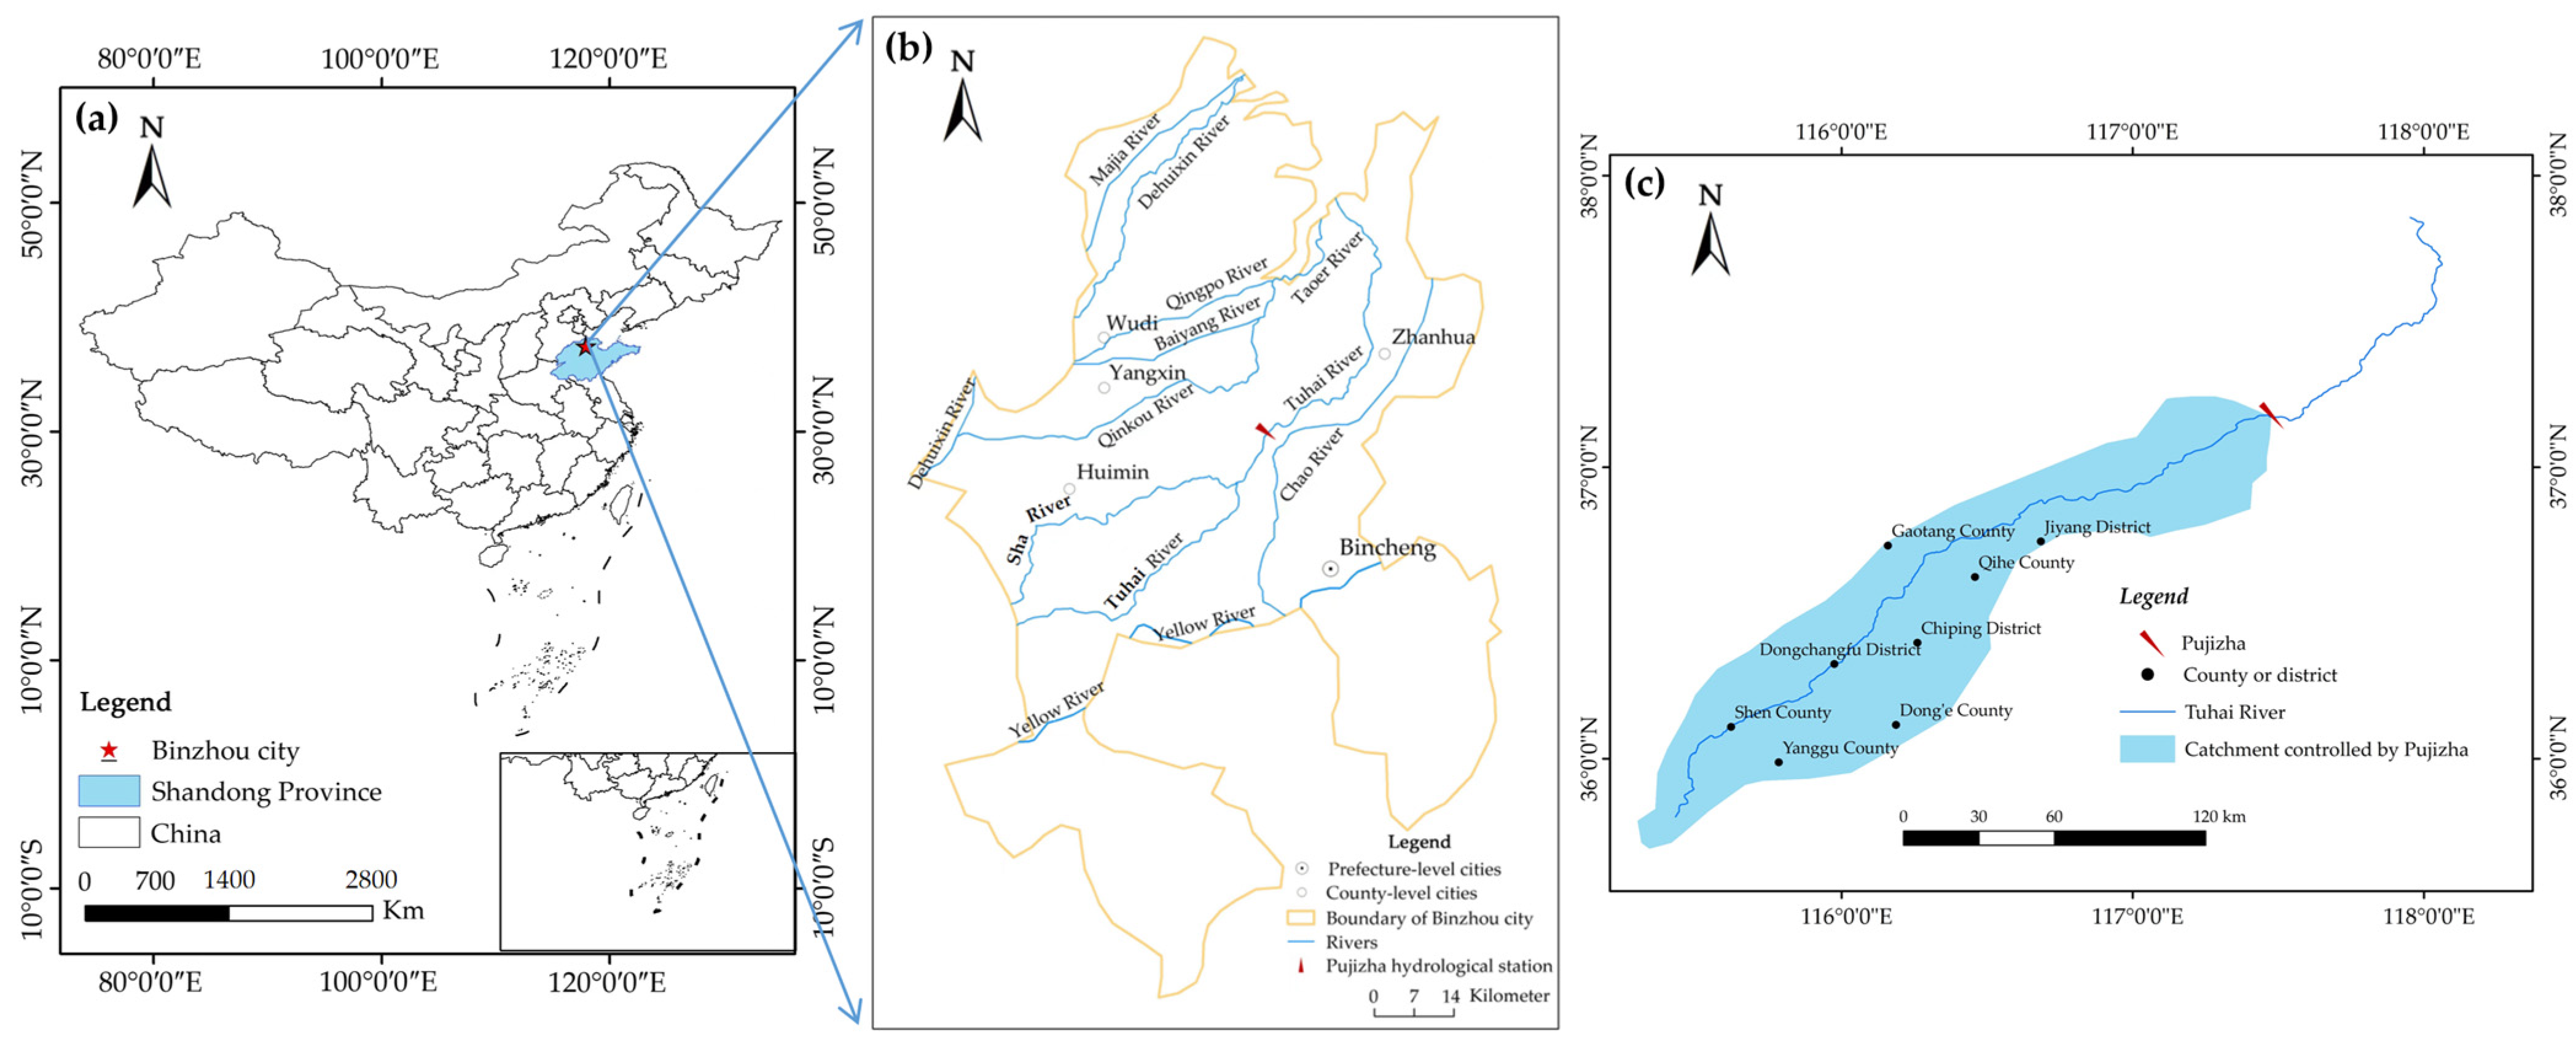
2.1. Study Area

The Tuhai River is the main flood discharge and drainage channel in the Haihe River Basin of Shandong Province, and Majia River is the second-most significant river in the basin [26]. The main stream of the Tuhai River starts from Shenxian County in Liaocheng City. The river then flows through Liaocheng City, Dezhou City, and Binzhou City and empties into the Bohai Sea at Storm Station in Wudi County of Binzhou City. The total length of the Tuhai River is 422 km. The river has a total drainage area of 13,902 km2, 95% of which is situated in Shandong Province.
The Tuhai River Basin belongs to the alluvial plain of the Yellow River and features a gentle topographic slope (1–20 m a.s.l.) and complex micro-geomorphological changes. The hills, slopes, and depressions in the middle and upper reaches of the Tuhai River Basin are alternately distributed, and the topography in the lower reaches is mainly beach retreat. The Tuhai River Basin belongs to the temperate continental monsoon climate zone, with an average precipitation of 600.7 mm from 1972 to 2021, 75.6% of which occurs in the flood season (June–September), and 53.9% in July–August. The Tuhai River Basin is an important grain production region and economic zone in Shandong Province, with a population of approximately 9.24 million and a population density of 530 people/km2.

2.2. Research Methods

2.2.1. Data Sources

The measured data of monthly runoff, sediment load, and precipitation from 1972 to 2021 at the Pujizha hydrological station in the main stream of the Tuhai River were provided by Binzhou hydrological center. Pujizha hydrological station is located in Bincheng District, Binzhou City (Figure 1a,b). The controlled watershed area of the station is 10,250 km2 (Figure 1c). This paper defines the flood season as occurring from June to September, while the non-flood season is from October to May of the following year.

2.2.2. Data Analyses

The annual, flood season, non-flood season runoff, and sediment load from 1972 to 2021 were analyzed for homogeneity (Pearson’s chi-squared test), stationarity (ADF test), and heteroscedasticity (ARCH-LM test). Except for the non-flood season runoff data from 1972 to 2021, which failed the stationarity test (p > 0.05), all the other data were homogeneous and stable but not heteroscedastic.
Linear regression and the Mann–Kendall test [28,29,30] are used to analyze the trend and abrupt change characteristics of runoff and sediment loads in the Tuhai River Basin. Statistic Z is obtained using the Mann–Kendall test. When Z > 0, the sequence shows an increasing trend; when Z < 0, the sequence shows a decreasing trend; when |Z| ≥ 1.96 and 2.32, the sequence variation trend reaches the significance level of p < 0.05 and p < 0.01, respectively.
In this paper, the trend change is analyzed using the UF curve. When the UF curve is outside the critical value line (|Z| = 1.96), it represents a significant change trend, and vice versa. The intersection of UF and UB curves represents the abrupt point of the index [31].
The power function expression below was used to calculate the relationship between runoff and sediment loads:
Qs = aQb
After logarithmic transformation, the linear expression of the power function is
ln Qs = ln a + bln Q
where Qs is the sediment transport rate (kg·s−1), Q is the flow rate (m3·s−1), and a and b are fitting coefficients. Moreover, a stands for the characteristics of runoff and sediment and is mainly influenced by external factors, while b represents the sediment transport characteristics of the river, which is closely related to river flow and sand grade ratio [32].
The double cumulative curve method was used to evaluate the contribution of human activities and rainfall to changes in runoff and sediment loads in the Tuhai River Basin. Further, the annual precipitation, runoff, and sediment loads of the Tuhai River were accumulated over the time series for regression analysis. Moreover, the contribution rate of human activities and rainfall to changes in runoff and sediment discharge of the Tuhai River was calculated [33].

3. Results

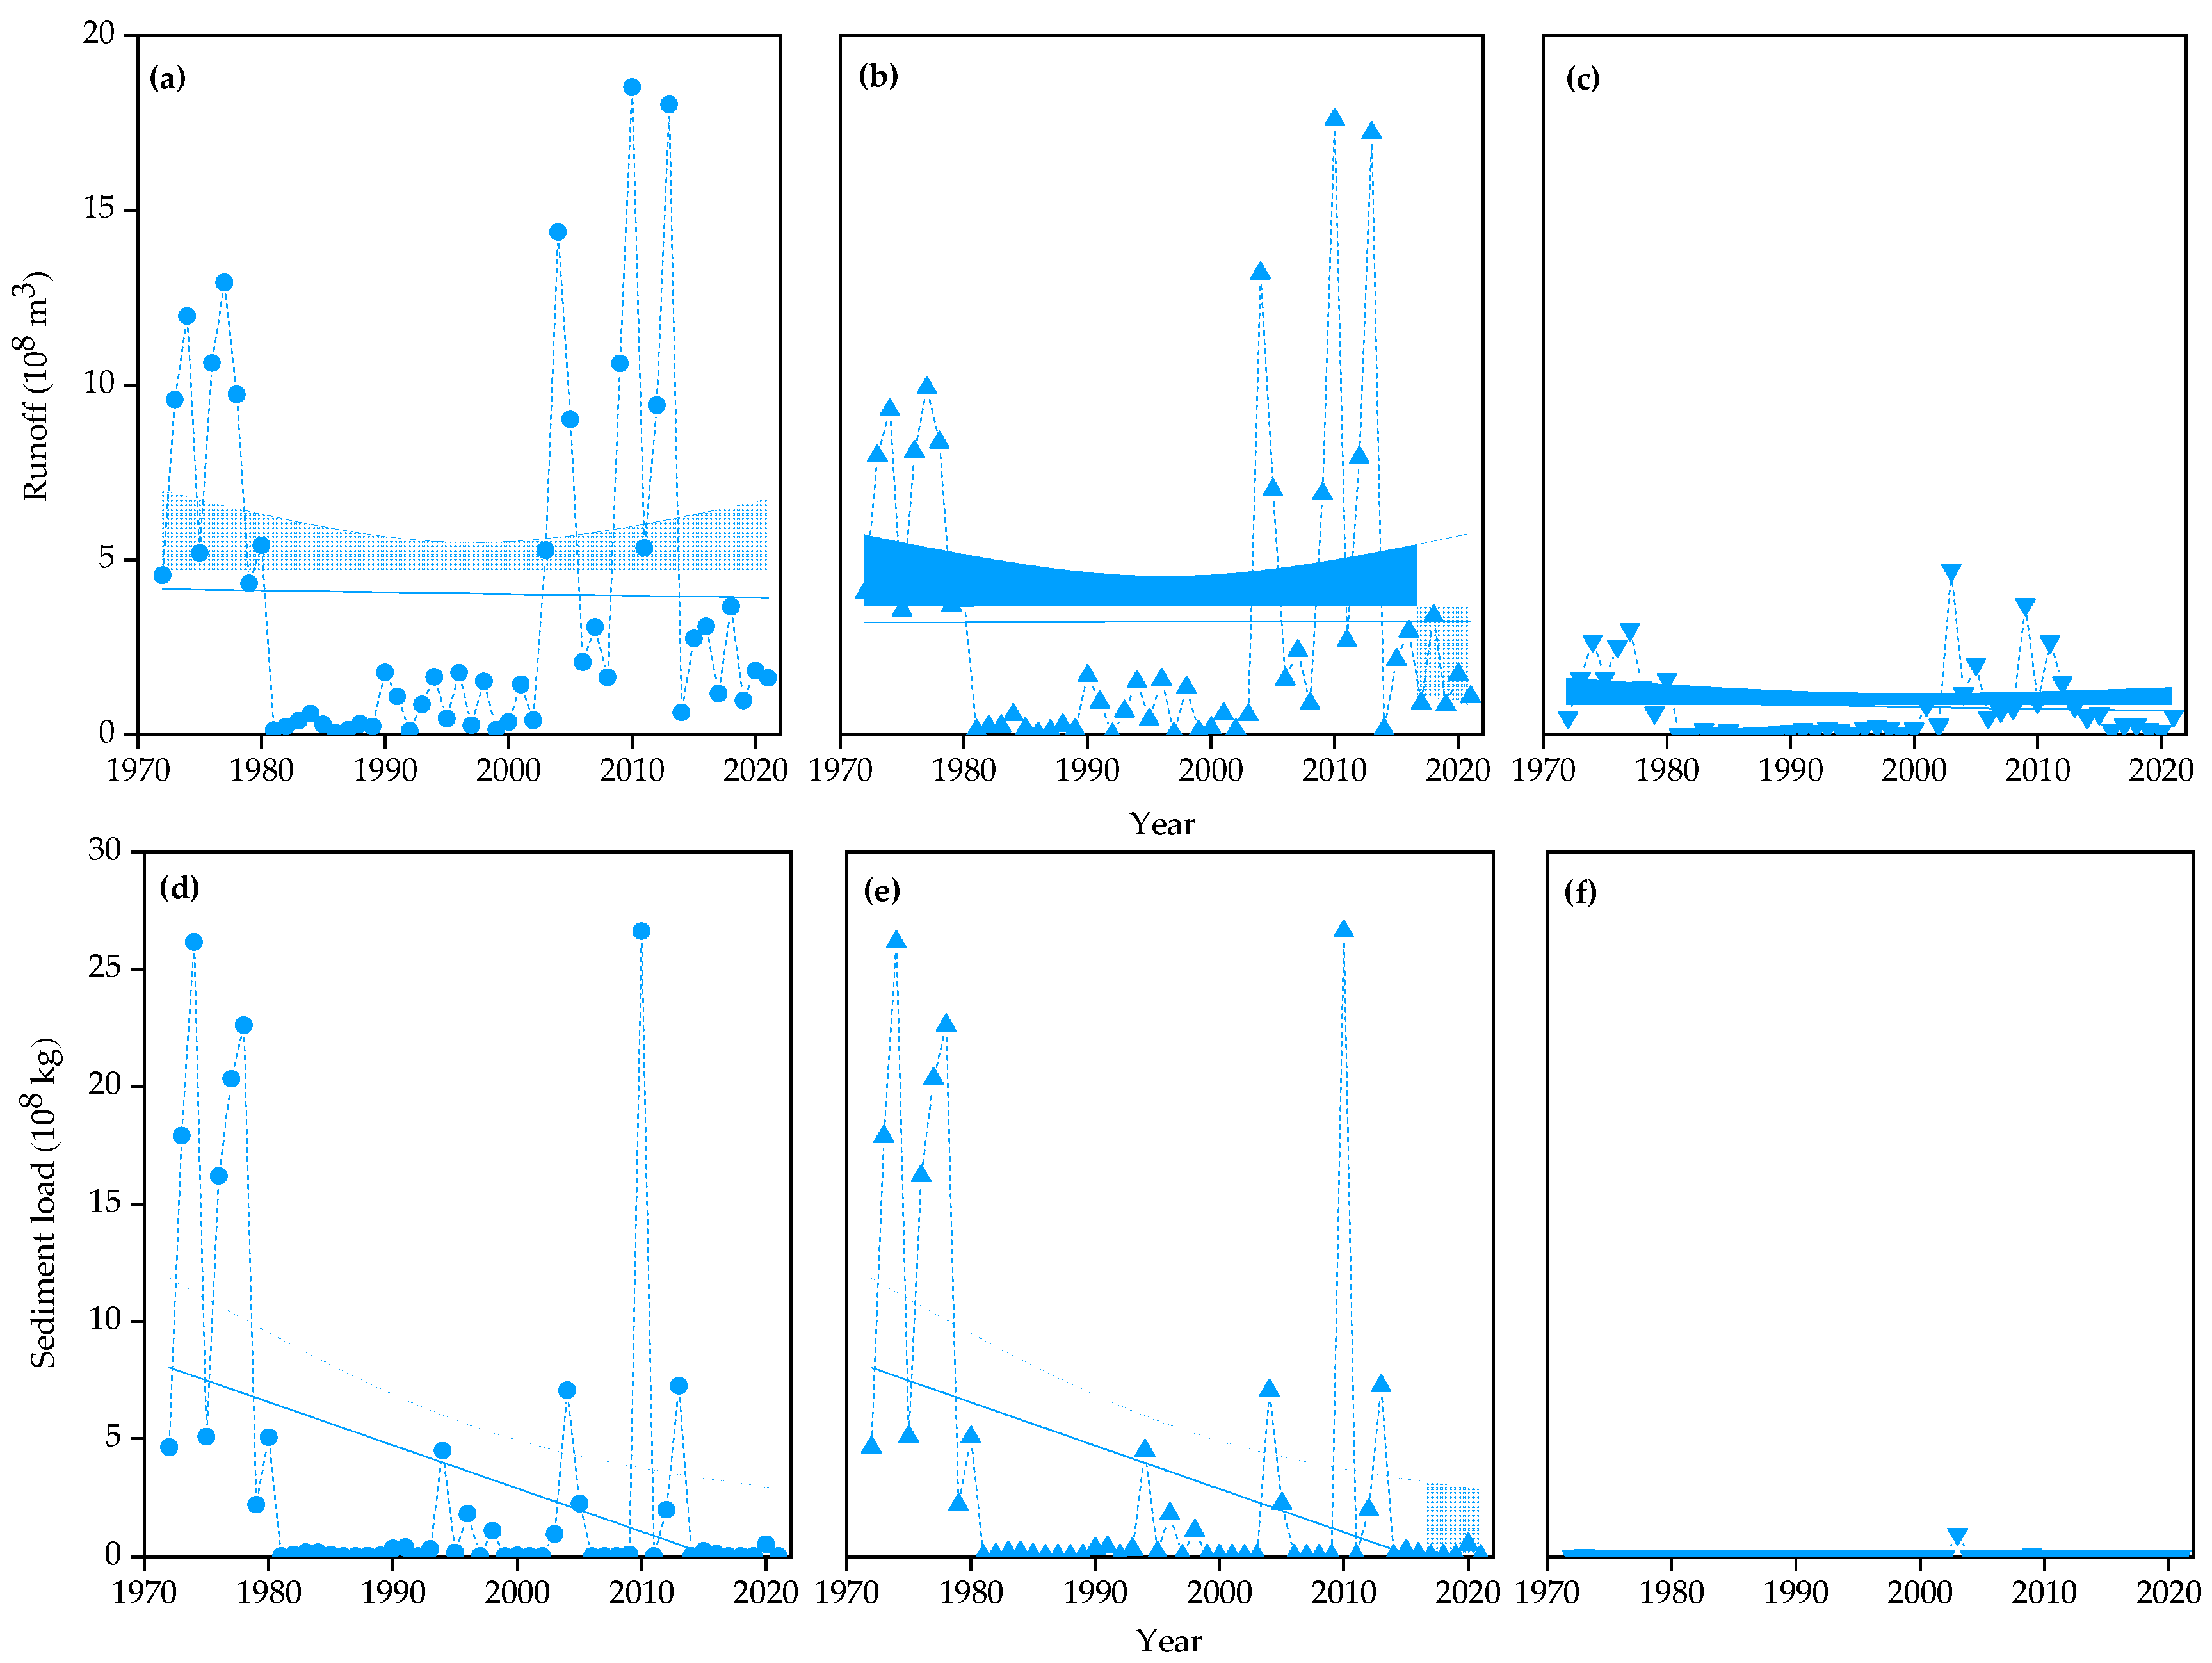
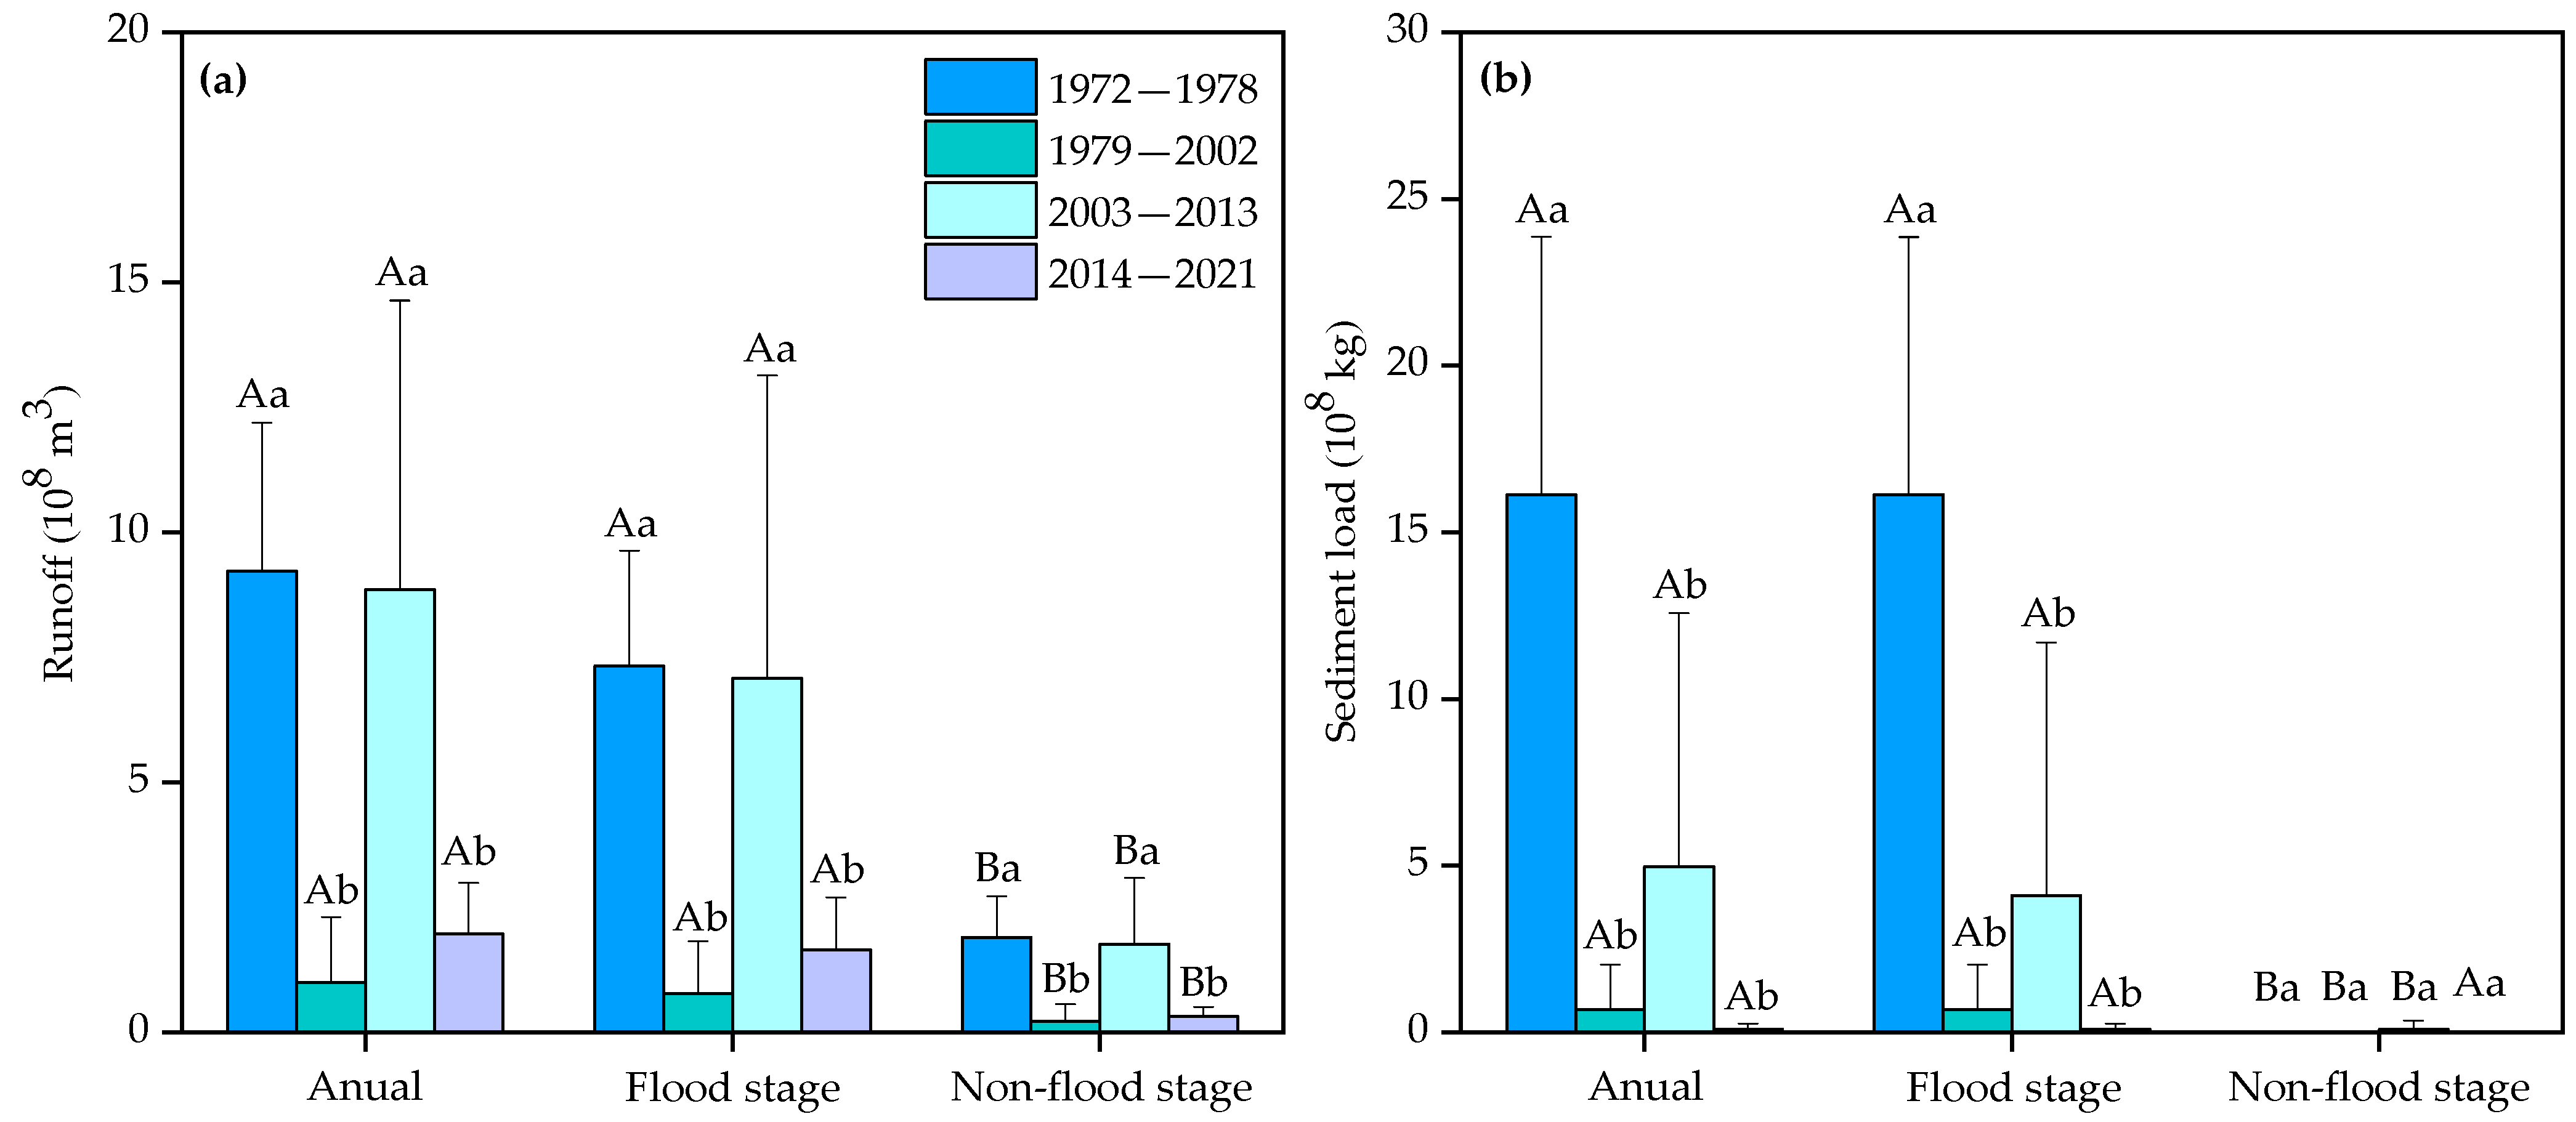
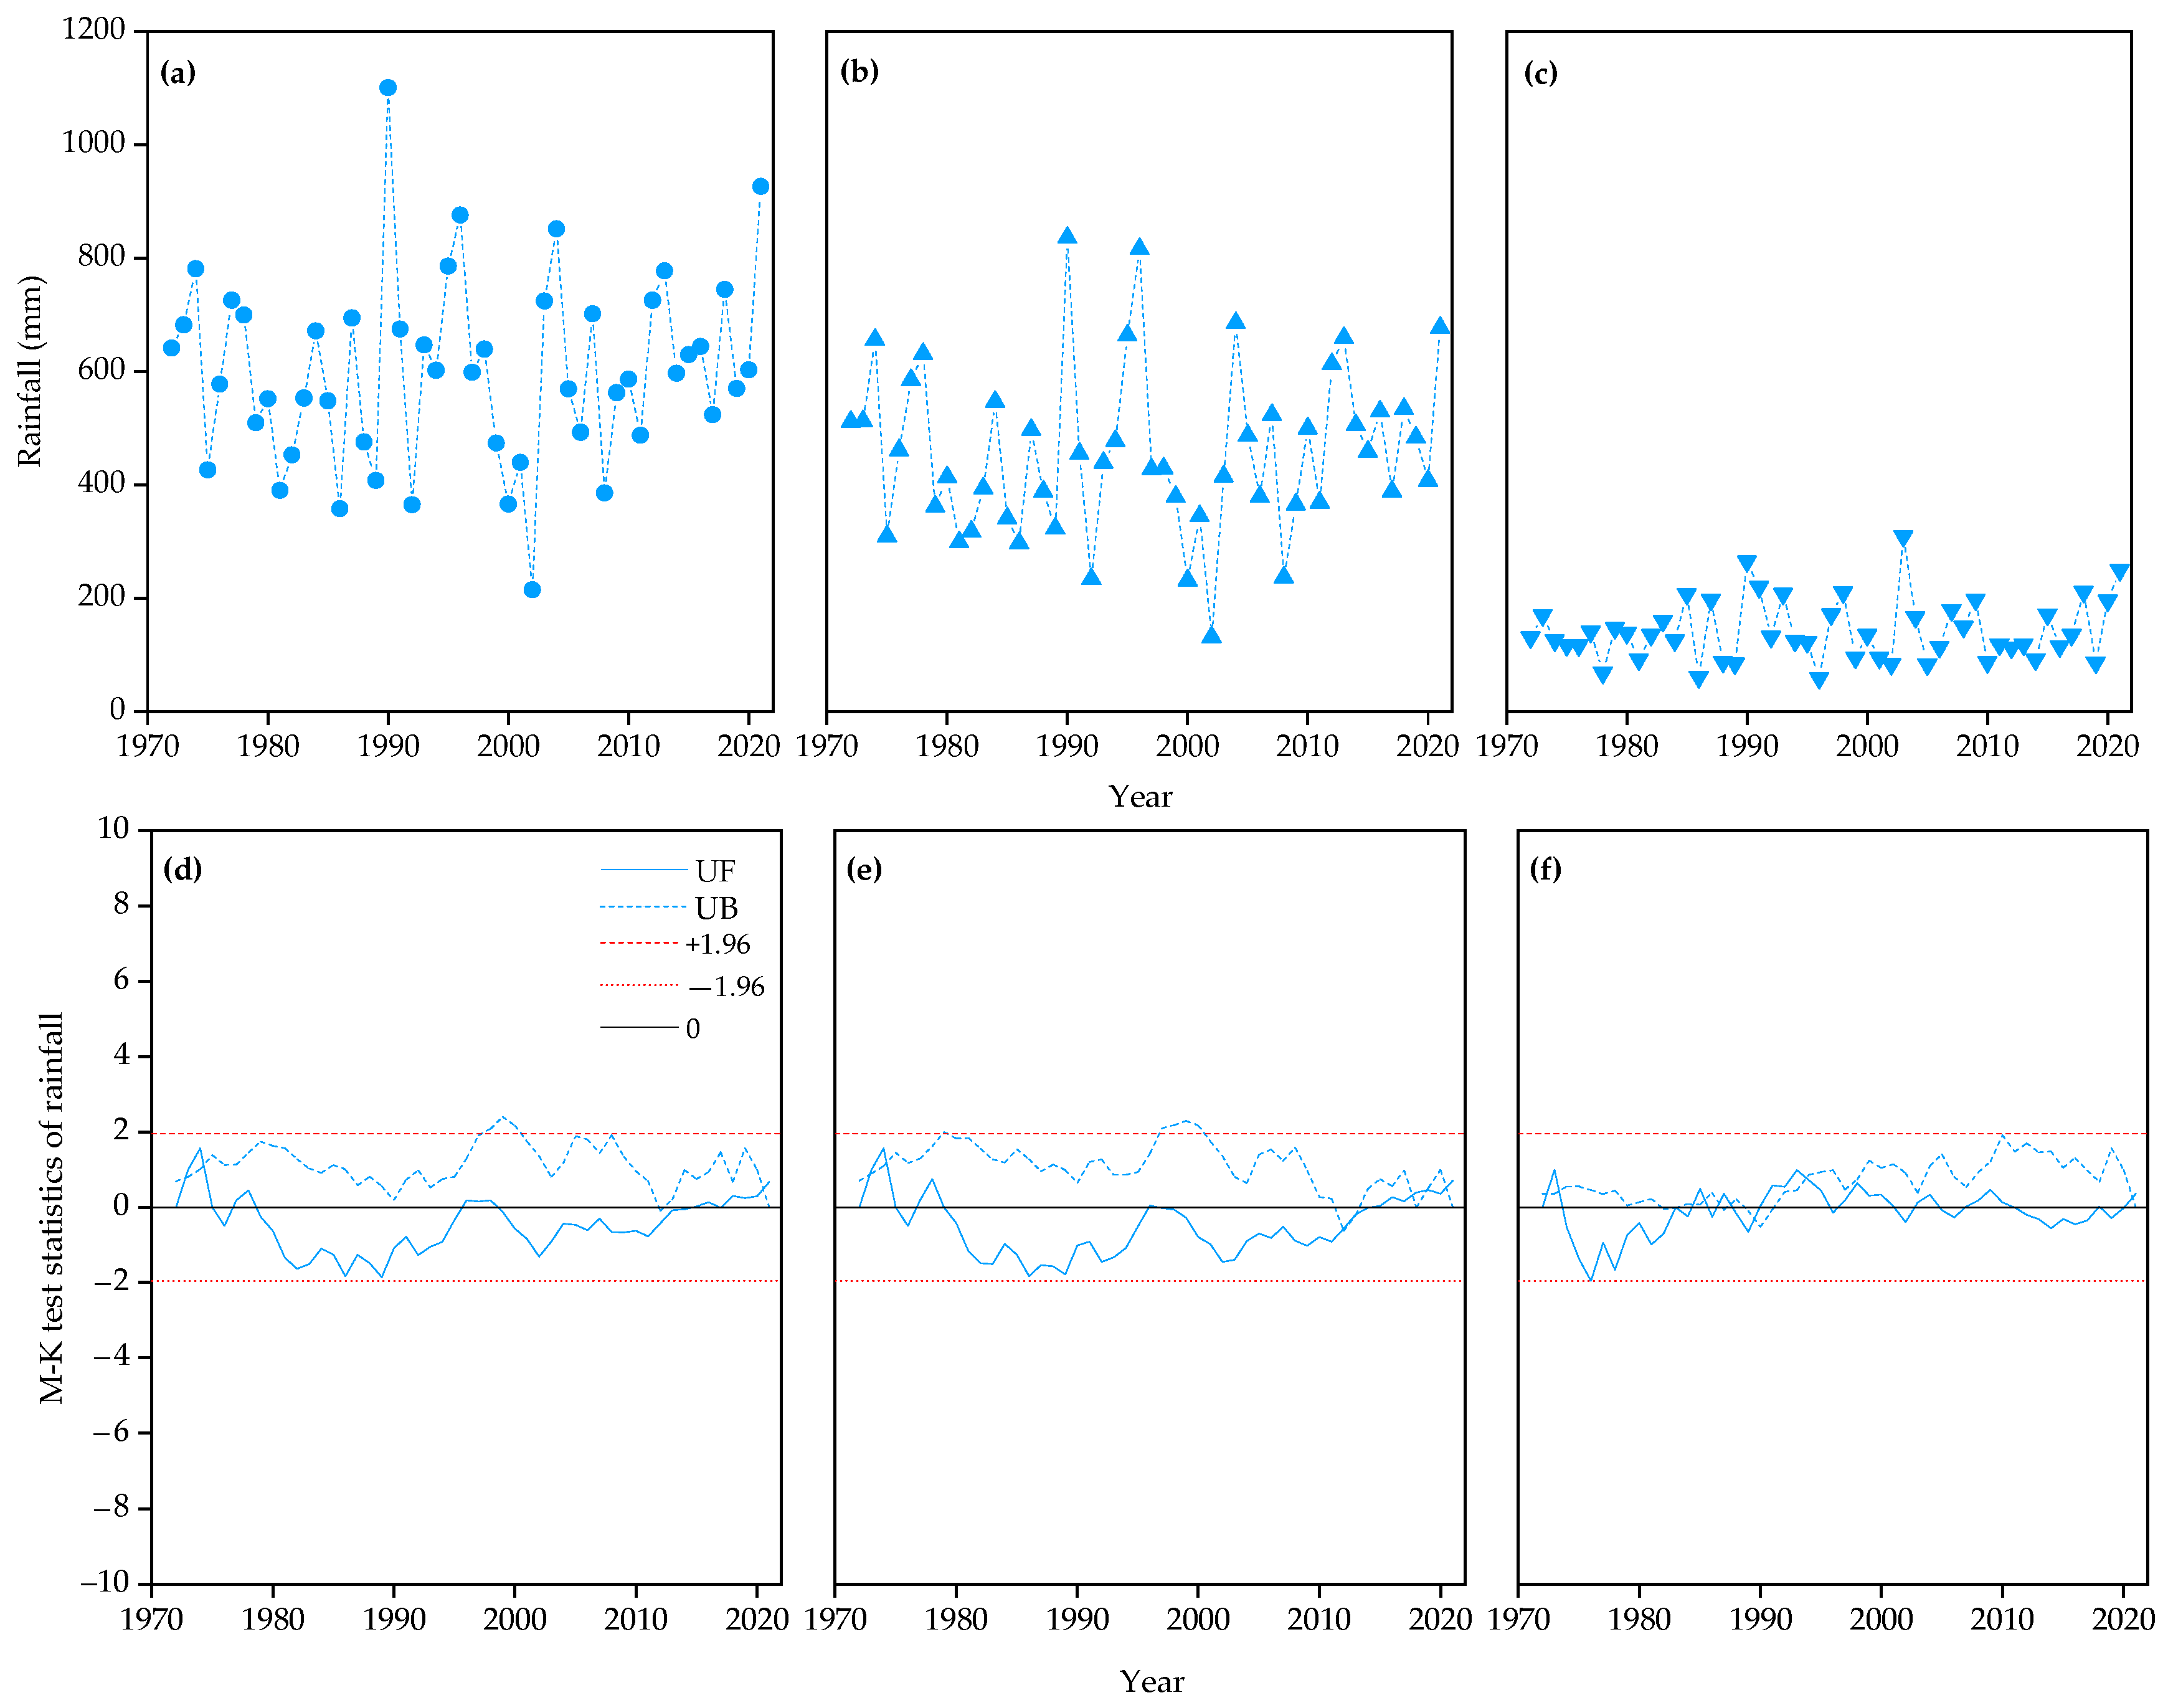
3.1. Inter-Annual Variations in Runoff and Sediment Load

The annual, flood season, and non-flood season runoff variation trends in the Tuhai River Basin were similar (Figure 2). From 1972 to 2021, the annual and flood season runoffs were 4.03 × 10⁸ m3 and 3.22 × 10⁸ m3, respectively (79.9% in the flood season). Moreover, the maximum annual runoff was 18.51 × 10⁸ m3 in 2010, followed by 18.01 × 10⁸ m3 in 2013. Further, the minimum annual runoff was 0.05 × 10⁸ m3 in 1986. Furthermore, from 1972 to 2021, there were no apparent linear trends in the annual, flood season, and non-flood season runoffs. Additionally, the annual, flood-season, and non-flood-season runoffs showed clear interdecadal variation characteristics. In the years 1972–1978 and 2003–2013, the runoff was abundant, with average values of 9.23 × 10⁸ and 8.85 × 10⁸ m3, respectively. Additionally, the runoff in these two periods was significantly higher than that in the years 1979–2002 and 2014–2021 (p < 0.05) (Figure 3). Moreover, runoff in the years 1979–2002 was the least, with average annual, flood season, and non-flood season values of 1.00 × 10⁸, 0.79 × 10⁸, and 0.22 × 10⁸ m3, respectively (Figure 3).
The trend of sediment load in the flood season is similar to that of annual total sediment discharge (Figure 2). From 1972 to 2021, the average annual total and flood season sediment loads were 3.52 × 10⁸ kg and 3.50 × 10⁸ kg, respectively (99.4% in the flood season). Moreover, the maximum and minimum annual total sediment loads were 26.62 × 10⁸ kg (2010) and 0, respectively. Except in 2003 (0.94 × 10⁸ kg), the sediment load in the non-flood season was very low (0–0.07 × 10⁸ kg), with no apparent linear trend. Furthermore, in the years 1979–2002, the sediment load was abundant, with average annual total and flood season sediment loads of 16.13 × 10⁸ kg. Additionally, in the years 2014–2021, the sediment load was the lowest, and the average annual total and flood season sediment loads was only 0.10 × 10⁸ kg.

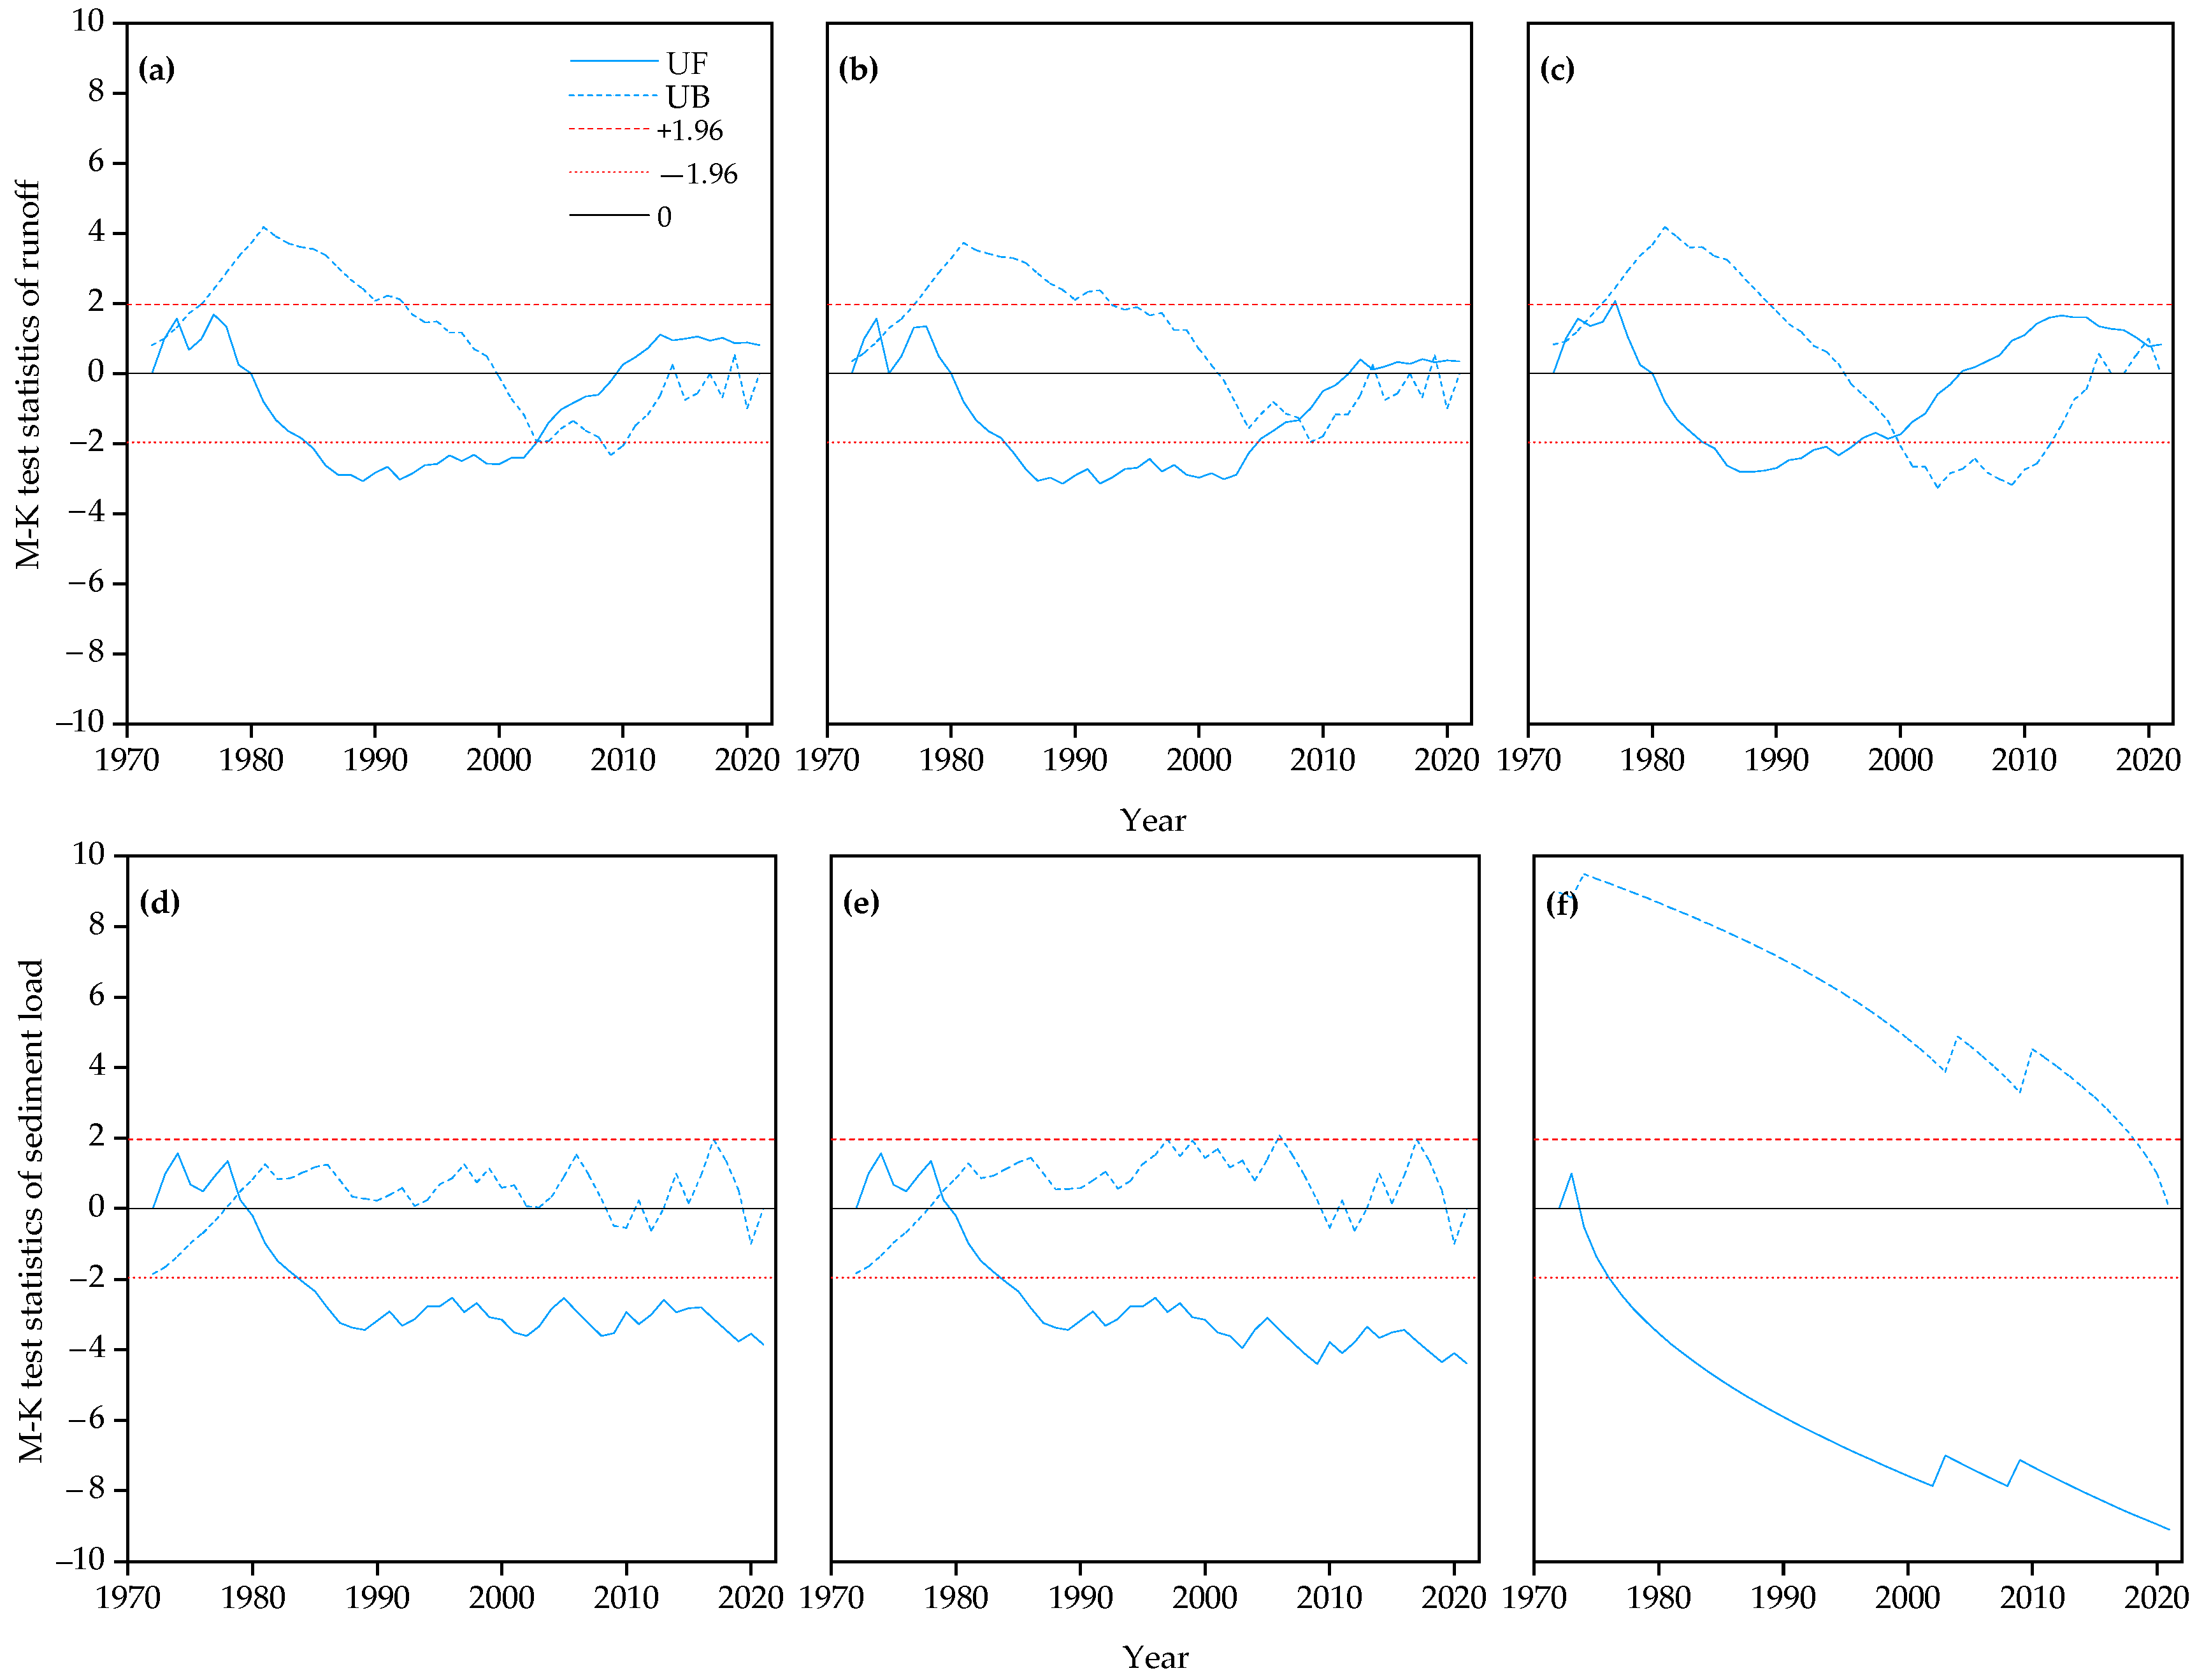
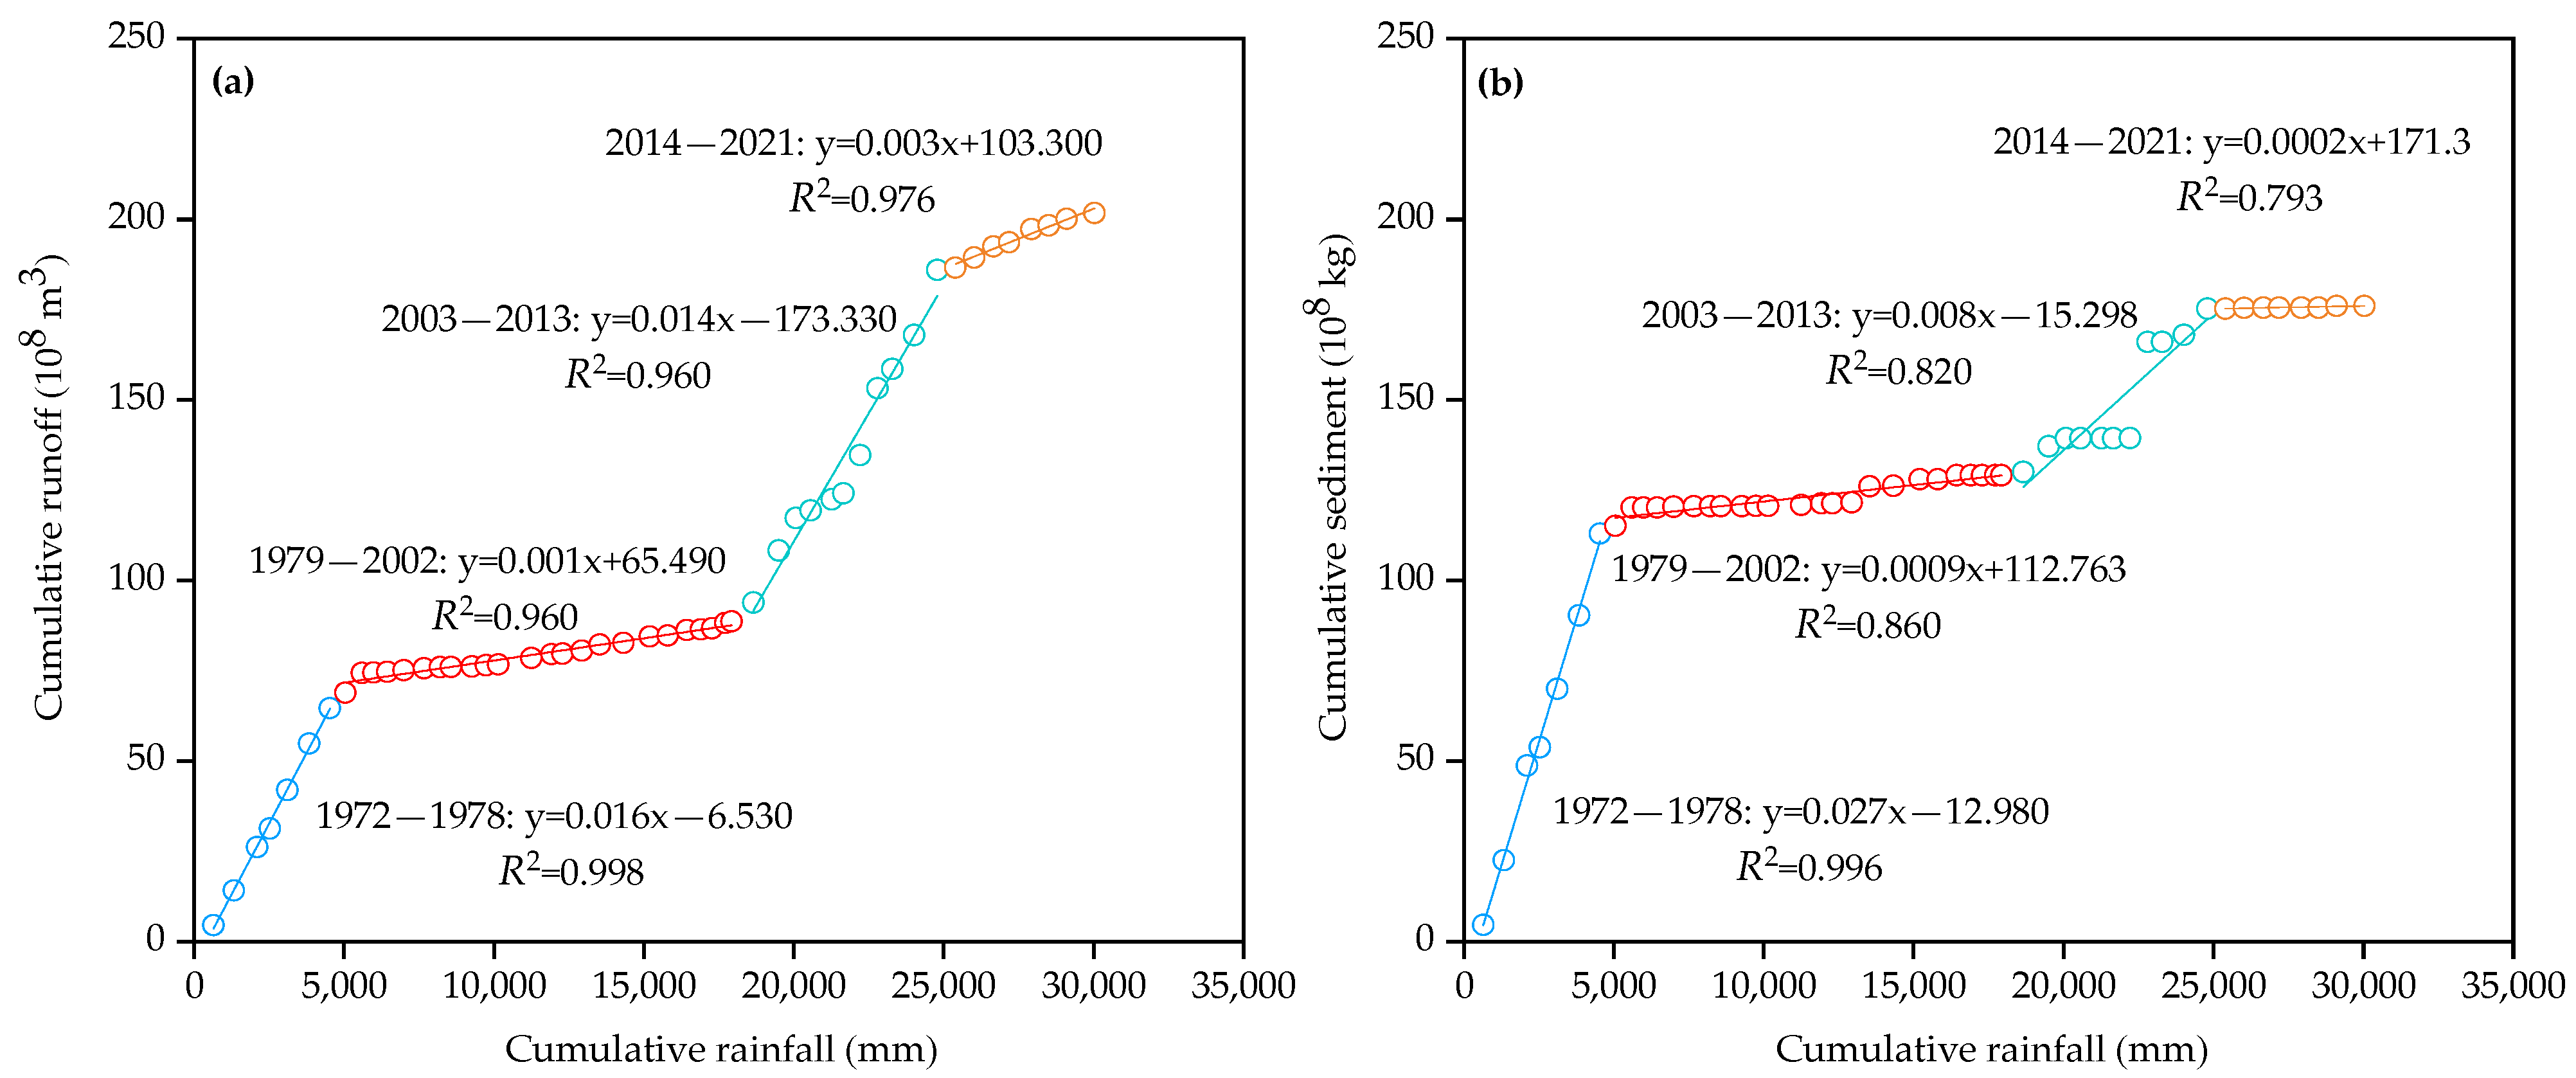
3.2. Inter-Annual Abrupt Points of Runoff and Sediment Load

From 1972 to 2021, the annual total runoff showed an increasing trend, but it did not reach a significant level (Z > 0; p > 0.05) (Table 1). Moreover, from 1972 to 1980, the trend of annual total runoff was the same as that in the flood season, with both showing a non-significant upward trend (0 < UF < 1.96). After 1980, the annual total runoff showed a downward trend. Furthermore, the runoff exhibited a significant downward trend from 1985 to 2003 (UF < −1.96) but showed an upward trend from 2010 to 2021 (0 < UF < 1.96). Further, intersections of UF and UB curves occurred in 1972–1973, 1974–1975, and 2003–2004, indicating that the annual total runoff changed suddenly during this period. Similarly, from 1980 to 2012, the runoff in the flood season showed a downward trend and reached a significant level from 1985 to 2004. Additionally, runoff suddenly changed several times in the flood season, mainly in 1972–1975, 2008–2009, 2013–2015, and 2018–2020. Furthermore, the non-flood season runoffs in 1972–1980 and 2005–2021 showed upward trends, a downward trend in 1981–2004, and a significant downward trend in 1985–1996.
Runoff abrupt change points during the non-flood season mainly occurred in 1972–1975, 1999–2000, and 2019–2021. The abrupt changes in annual total runoff and flood season runoff mainly occurred in 2003–2004 and 2013–2014 and were mainly related to the significant increase in runoff from 5.28 × 10⁸ m3 in 2003 to 14.37 × 10⁸ m3 in 2004 and from 0.57 × 10⁸ m3 in 2003 to 13.19 × 10⁸ m3 during the flood season.
From 1972 to 2021, the annual and flood season sediment load trends were similar: there was an upward trend in 1972–1979 and a decreasing trend after 1980. After 1984, the decreasing trend of annual and flood season sediment loads reached a significant level (UF < −1.96) (Figure 4). Moreover, from 1978 to 1979, both UF and UB exceeded the confidence interval (−1.96 < UF < 1.96), indicating that the sediment load changed suddenly during this period. Further, the annual sediment load and the flood season sediment load decreased from 22.61 × 10⁸ kg in 1978 to 2.18 × 10⁸ kg in 1979. Unlike the trend of annual and flood season sediment loads, the non-flood season sediment load only showed an upward trend in 1972–1973 and then a downward trend, reaching a significant level after 1976. Additionally, there was no sudden change point in the non-flood season sediment load from 1972 to 2021.

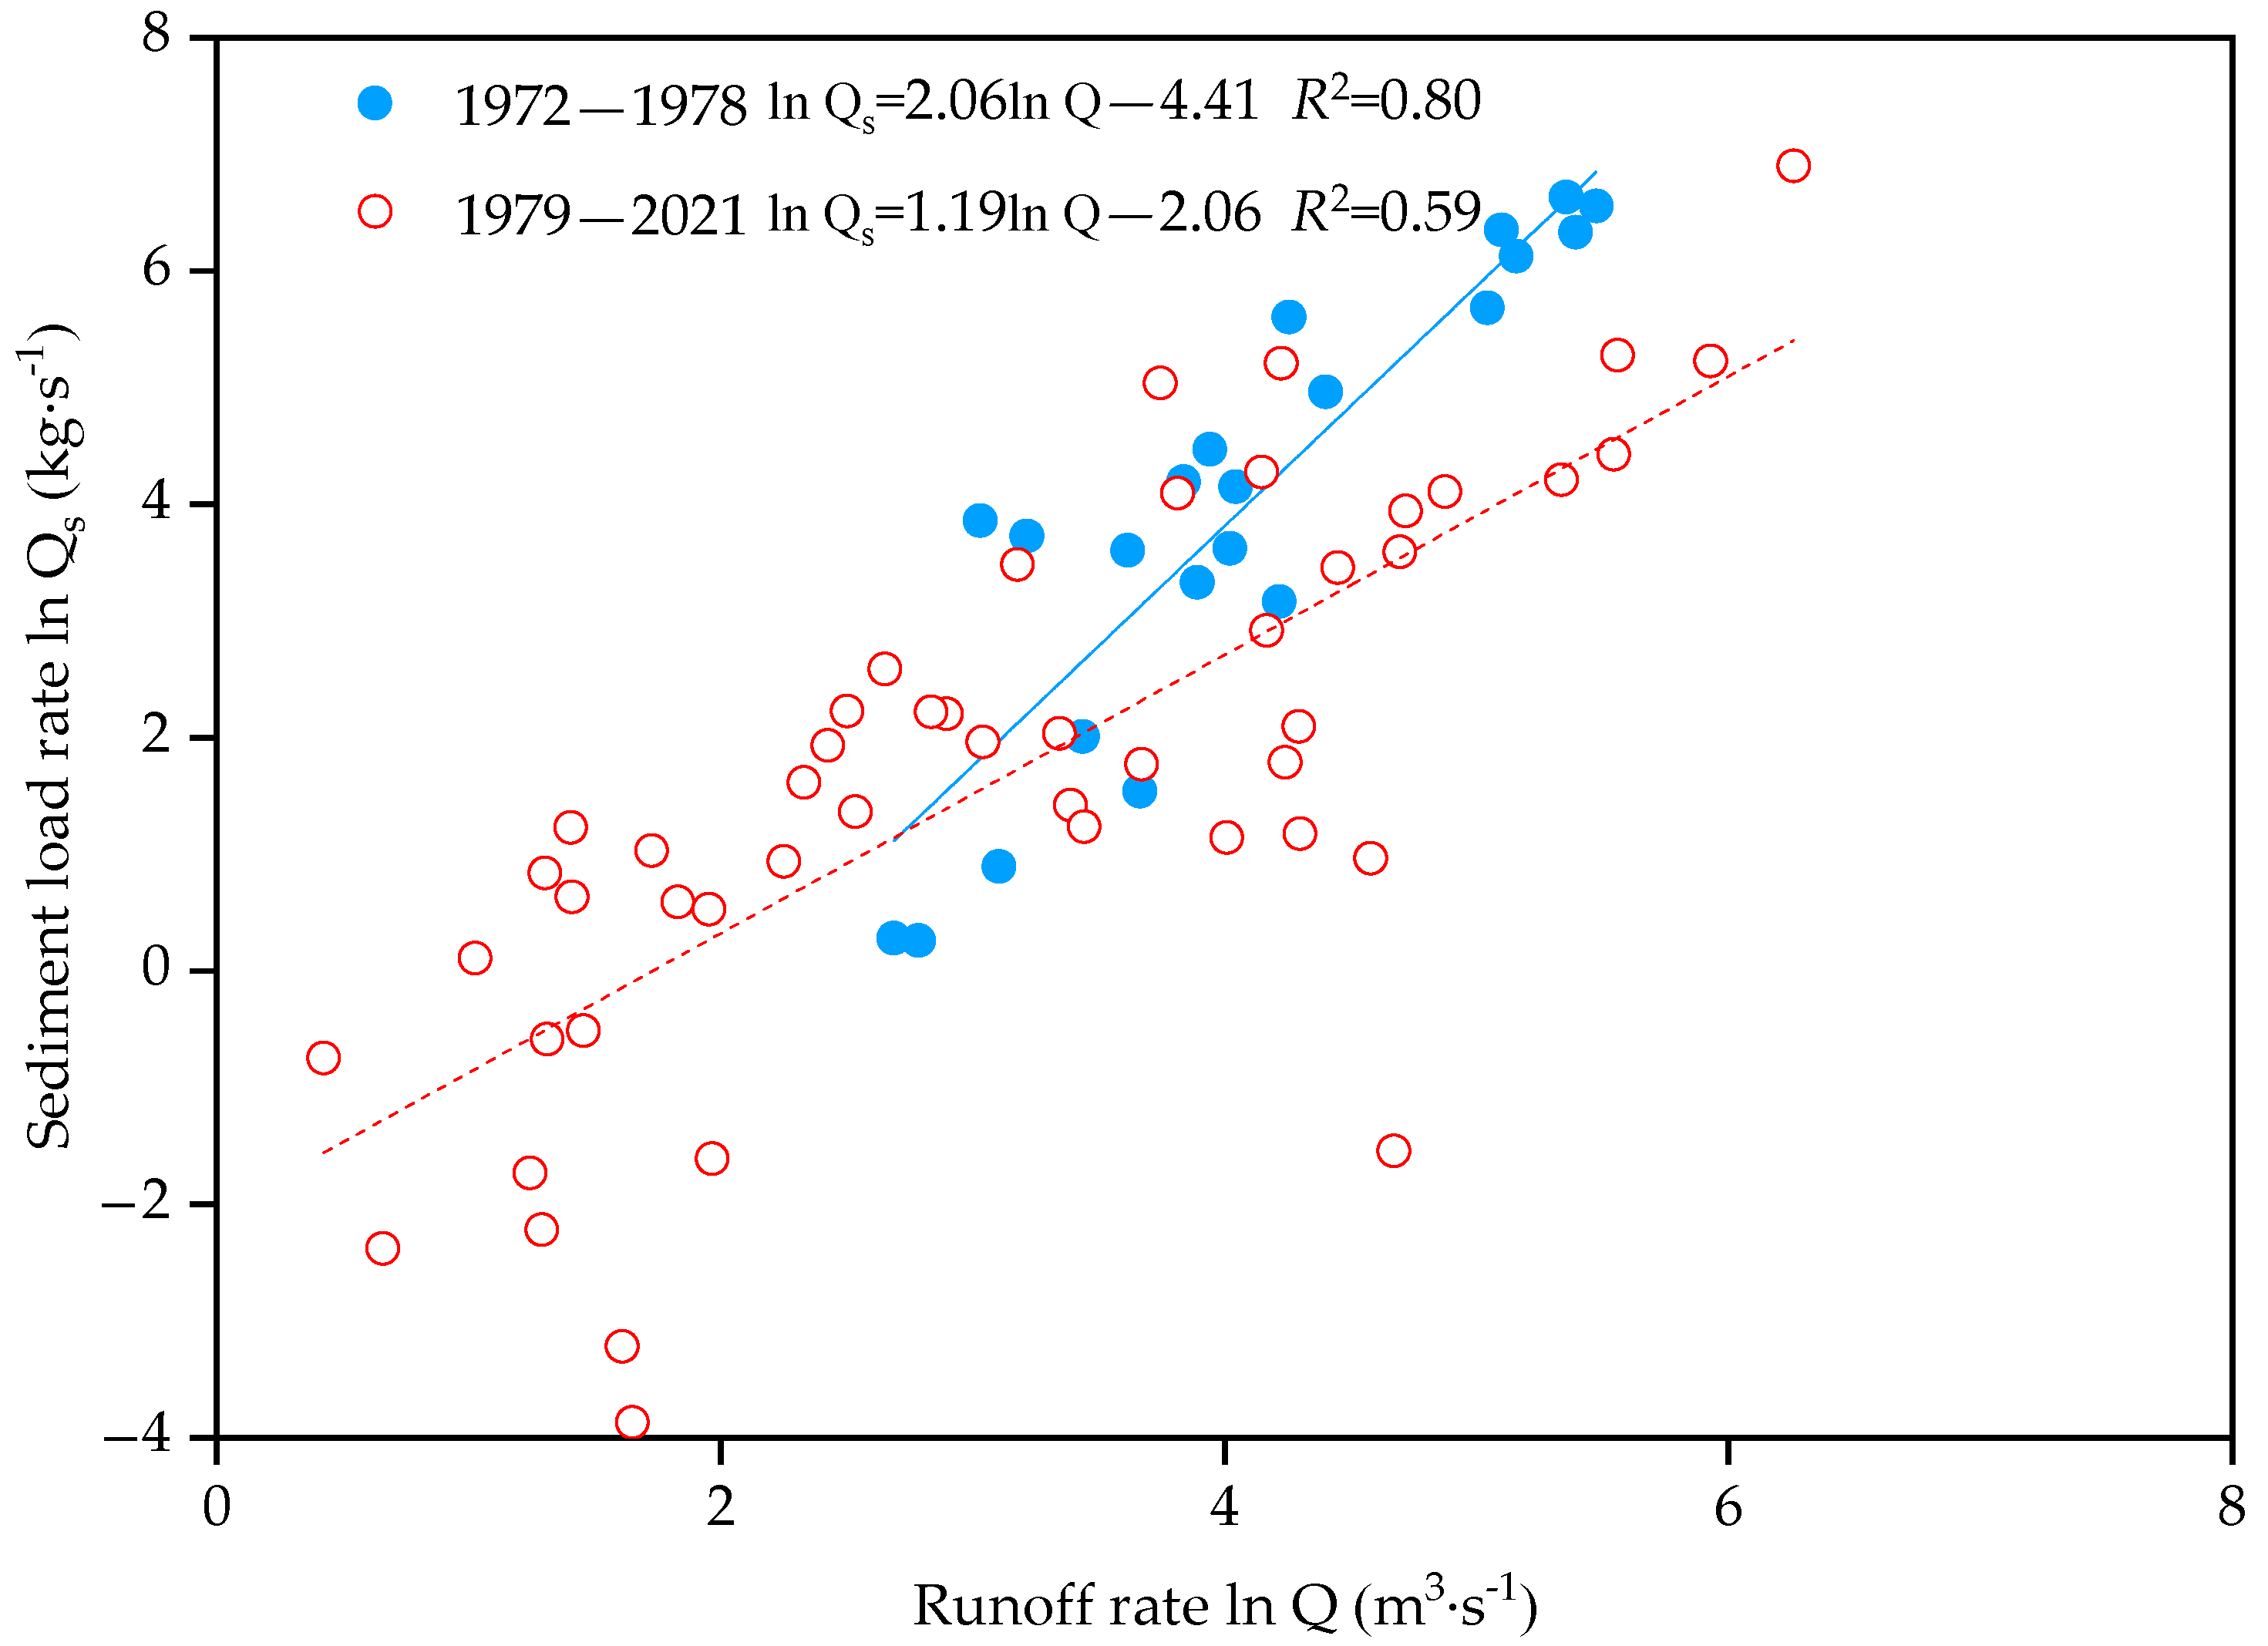
3.3. Relationship between Runoff and Sediment Load

To analyze the relationship between runoff and sediment load, the time series was divided into two periods, 1972–1978 and 1979–2021, based on the abrupt change year of sediment load (1978). The relationship between runoff and sediment discharge presents a distinct power function relationship in the two periods, with R2 values of 0.80 and 0.59, respectively (Figure 5). According to the regression analysis, the relationship between runoff and sediment load significantly changed during the two periods. The ln a value changed from −4.41 to −2.06, an increase of 53.3%, while the b value changed from 2.06 to 1.19, a decrease of 42.2%. The increase in ln a indicates that the characteristics of runoff and sediment load in the Tuhai River changed after 1978, and the influence of human activities (water resource development, soil and water conservation projects, etc.) gradually increased from 1978 to 2021 (Table 2). The decrease in b indicates that the changes in river discharge, sand grade ratio, and riverbed morphology in the Tuhai River have weakened the sediment load of the river.

3.4. Factors Influencing Runoff and Sediment Load

From 1972 to 2021, the annual total runoff and flood season runoff were significantly positively correlated with annual rainfall (p < 0.05) and flood season rainfall (p < 0.01), but non-flood season runoff was not significantly correlated with rainfall in each stage (p > 0.05) (Table 3). The annual and flood season sediment loads have positive correlations with flood season rainfall (p < 0.05), and the non-flood season sediment load has a high positive correlation with non-flood season rainfall (p < 0.01). Furthermore, during the flood season from 1972 to 1978, the runoff and sediment load were highly correlated with rainfall (p < 0.01). During the flood season from 1979 to 2021, sediment load was positively correlated with corresponding precipitation (p < 0.05), and during the non-flood season, runoff and corresponding precipitation were significantly positively correlated.
From 1972 to 1978, under conditions of minimal external disturbance, there was a linear relationship between runoff and sediment transport and precipitation in the double accumulation curve (Figure 6). After 1978, the slopes of the two double cumulative curves were different from those in 1972–1978, especially the double cumulative curve of rainfall and sediment load (Figure 6). This change may be related to the measures of runoff and sediment interception in the basin. The annual rainfall after 1978 was substituted into the regression equations of rainfall–runoff and rainfall–sediment load from 1972 to 1978, and the runoff and sediment load in each stage after 1978 were calculated (Figure 7, Table 4 and Table 5). Generally speaking, the contribution rate of human activities to the reduction of sediment load was greater than that of runoff reduction. Furthermore, except in 2003–2013, the contribution rates of human activities to the runoff reduction in 1979–2002 and 2014–2021 were 88.9% and 57.7%, respectively, and the contribution rates of rainfall and human activities to the reduction of sediment load in different stages from 1979 to 2021 were 14.0–36% and 63.1–86.0%, respectively.

4. Discussion

Previous studies have shown that among natural factors, runoff and sediment load are mainly affected by rainfall; furthermore, runoff and rainfall are positively correlated [34,35]. This study found that rainfall and human activities are the main factors that affect the change in runoff and sediment load in the Tuhai River Basin. In the last 50 years (1972–2021), the annual, flood season, and non-flood season runoff in the Tuhai River Basin showed a non-significant upward trend. Combined with the trend of runoff and rainfall in different periods (1972–1978, 1979–2002, 2003–2013, and 2014–2021) (Figure 2 and Figure 7), we conclude that the runoff in the Tuhai River in 1972–1978 and 2003–2013 was mainly affected by rainfall, and the results are similar to those of Han and Zhang [24], who reported that precipitation was the leading factor behind runoff variation in the Haihe River Basin between 1956 and 2000. Furthermore, the maximum annual runoff occurred in 2010 (18.51 × 10⁸ m3), followed by 2013 (18.01 × 10⁸ m3). Analysis of relevant data suggests that both extreme runoff values were caused by heavy rain. In August 2010 and July 2013, heavy rains occurred in the Tuhai River Basin, causing once-in-50-year and once-in-20-year floods, respectively [26,36].
Moreover, the contribution rate of human activities to the runoff reductions in the Tuhai River in 1979–2002 and 2014–2021 were 88.9% and 57.7%, respectively, indicating that the runoff change in Tuhai River in the two periods was mainly affected by human activities (Table 4). Since 1978, agricultural production in the Tuhai River Basin has developed rapidly, agricultural water demand has increased, and irrigation intensity using the Yellow River has heightened [26,36]. Nevertheless, the utilization rate of Yellow River water has remained low, which has increased water flow into the Tuhai River [26,36]. The acceleration of urban construction and the hardening of roads in the basin has increased surface runoff into the Tuhai River, but the increase in human water consumption has reduced runoff into the river [26,36]. Therefore, there is no clear change in trend in annual, flood season, and non-flood season runoff (Figure 2). The sudden change in runoff into the Tuhai River during the flood season was frequent after 2010, occurring suddenly in 2013–2014, 2014–2015, 2018–2019, and 2019–2020 (Figure 4). Therefore, there is a need for additional work involving river dredging during the flood season and increased flood control and disaster reduction efforts in the basins.
From 1979 to 2021, the annual total sediment load and the flood season sediment load decreased significantly (Figure 2). Notably, the maximum annual total sediment load was 26.62 × 10⁸ kg in 2010. Moreover, there was a sharp increase in runoff. The reason for this phenomenon was the once-in-50-year flood in 2010 [36]. Furthermore, the contribution rate of human sediment reduction in different stages (1979–2002, 2003–2013, and 2014–2021) was between 63.1% and 86.0% (Table 5), aligning with the results of studies of human impact on runoff change in other rivers, such as the Yellow River and Jing River [37,38,39]. Human activities, such as water conservation measures and water resource development projects, mainly reduce runoff and sediment load by improving the condition of a river [13,40,41]. Furthermore, this study found that since 1978, coastal governments have implemented large-scale measures such as dredging, dike reinforcement, and soil and water conservation. These measures have significantly reduced the level of sedimentation (Table 2) [26].

5. Conclusions

The average annual total runoff and sediment load in the Tuhai River Basin were 4.03 × 10⁸ m3 and 3.52 × 10⁸ kg, respectively, with the flood season accounting for 79.9% and 99.4% of these figures, respectively. Therefore, additional river dredging during the flood season is needed. In 1972–1978, there was no apparent trend in annual, flood season, and non-flood season runoff, and the annual and flood season sediment load showed significant reducing trends. Further, abrupt change points of annual and flood season runoff in the Tuhai River Basin mainly occurred in 2003–2004 and 2013–2014, while abrupt change points of annual and flood season sediment load only occurred in 1978–1979. Runoff and sediment transport in the Tuhai River Basin showed clear power function changes. After 1978, sediment supply and sediment load decreased in the Tuhai River. Moreover, runoff from 2003 to 2013 was mainly affected by rainfall. Further, human activities were the main factors affecting runoff and sediment load. From 1979 to 2021, the contribution rates of human activities to the decrease in runoff and sediment load in the Tuhai River Basin were 57.7–88.9% and 63.1–86.0%, respectively. Notably, an increase in human water consumption was an important factor in reducing runoff, and the control measures for the Tuhai River were the main reasons behind the reduction in sediment load. Finally, the results of this study are relevant in the rational utilization of water resources and disaster prevention and mitigation in the Tuhai River Basin as well as in providing an understanding of the mechanism of runoff and sediment change in rivers in China’s coastal plain areas.

Limitations of the Study

Our study focused on the changes and influencing factors of runoff and sediment loads in the Tuhai River Basin. The results indicate that human activities had a major impact on the runoff over two periods: 1979–2002 and 2014–2021. However, we can only qualitatively explain the possible impact of human activities on the runoff in the Tuhai River Basin by consulting the literature: we could not obtain relevant data, such as irrigation levels of cropland, human water consumption, and replenishment volume of Yellow River water to the basin. To address these limitations, additional studies that specifically consider water consumption and the increase in the above-mentioned human activities should be carried out to accurately explain the impact of human activities on the runoff in the Tuhai River.

Author Contributions

Conceptualization, Q.C. and J.X.; methodology, Q.C.; software, Q.C. and D.W.; validation, X.Z., C.Q. and C.Y.; formal analysis, J.G., J.S., S.W. and J.Z.; writing—review and editing, Q.C. and J.X.; project administration, J.X.; funding acquisition, J.X. All authors have read and agreed to the published version of the manuscript.

Funding

This study was funded by the Water Resources Evaluation Project of Binzhou Hydrological Center (BZSLZB 2021-06-A01, BZSLZB 2021-06-A02); College Student Innovation Training Program Plan (202310449381); Innovation Capability Improvement Project of Small and Medium-sized Sci-tech Enterprises in Shandong Province (2023TSGC0044); Special Project for the Central Government to Guide the Development of Local Science and Technology (YDZX2022101); Taishan Scholars Project (TSQN201909152); Start-up Funds for Doctoral Research in Shandong Institute of Aeronautics (2021Y27); The Youth Innovation Support Program of Shandong Universities (2023KJ273).

Data Availability Statement

The datasets used during the current study are available from the corresponding author on reasonable request.

Conflicts of Interest

Author Dong Wang was employed by the company Shenzhen Water Planning and Design Institute Co., Ltd. The remaining authors declare that the research was conducted in the absence of any commercial or financial relationships that could be construed as a potential conflict of interest.

References

  1. Vorosmarty, C.J.; Green, P.; Salisbury, J.; Lammers, R.B. Global water resources: Vulnerability from climate change and population growth. Science 2000, 289, 284–288. [Google Scholar] [CrossRef] [PubMed]
  2. Ghimire, S.; Singh, U.; Panthi, K.K.; Bhattarai, P.K. Suspended sediment source and transport mechanisms in a Himalayan River. Water 2024, 16, 1063. [Google Scholar] [CrossRef]
  3. Piao, S.; Ciais, P.; Huang, Y.; Shen, Z.; Peng, S.; Li, J.; Zhou, L.; Liu, H.; Ma, Y.; Ding, Y.; et al. The impacts of climate change on water resources and agriculture in China. Nature 2010, 467, 43–51. [Google Scholar] [CrossRef] [PubMed]
  4. Li, L.; Ni, J.; Chang, F.; Yue, Y.; Frolova, N.; Magritsky, D.; Borthwick, A.G.L.; Ciais, P.; Wang, Y.; Zheng, C.; et al. Global trends in water and sediment fluxes of the world’s large rivers. Sci. Bull. 2020, 65, 62–69. [Google Scholar] [CrossRef] [PubMed]
  5. Zhang, J.; Wang, J.; Zhao, N.; Shi, J.; Wang, Y. Analysis of changes in runoff and sediment load and their attribution in the Kuye River Basin of the middle Yellow River based on the slope change ratio of cumulative quantity method. Water 2024, 16, 944. [Google Scholar] [CrossRef]
  6. Dethier, E.N.; Sartain, S.L.; Renshaw, C.E.; Magilligan, F.J. Spatially coherent regional changes in seasonal extreme streamflow events in the United States and Canada since 1950. Sci. Adv. 2020, 6, eaba5939. [Google Scholar] [CrossRef] [PubMed]
  7. Liu, J.; Zhang, Q.; Singh, V.P.; Shi, P. Contribution of multiple climatic variables and human activities to streamflow changes across China. J. Hydrol. 2017, 545, 145–162. [Google Scholar] [CrossRef]
  8. Zhao, G.; Tian, P.; Mu, X.; Jiao, J.; Wang, F.; Gao, P. Quantifying the impact of climate variability and human activities on streamflow in the middle reaches of the Yellow River basin, China. J. Hydrol. 2014, 519, 387–398. [Google Scholar] [CrossRef]
  9. Liang, S.; Yan, T.; Gao, H.; Jing, C.; He, F.; Han, M. Evolution of the Pingluo Section of the upper Yellow River over the past 50 years: Responses to environmental change and human activity. Water 2024, 16, 911. [Google Scholar] [CrossRef]
  10. Luce, C.H.; Holden, Z.A. Declining annual streamflow distributions in the Pacific Northwest United States, 1948–2006. Geophys. Res. Lett. 2009, 36, L16401. [Google Scholar] [CrossRef]
  11. Lu, X. Vulnerability of water discharge of large Chinese rivers to environmental changes: An overview. Reg. Environ. Change 2004, 4, 182–191. [Google Scholar] [CrossRef]
  12. Li, T.; Wang, S.; Liu, Y.; Zhao, W. Driving forces and their contribution to the recent decrease in sediment flux to ocean of major rivers in China. Sci. Total Environ. 2018, 634, 534–541. [Google Scholar] [CrossRef]
  13. Alsharhan, A.S.; Rizk, Z.E. Overview on global water resources. In Water Resources and Integrated Management of the United Arab Emirates; Springer: Cham, Switzerland, 2020; pp. 17–61. [Google Scholar]
  14. Cui, B.; Chang, X.; Shi, W. Abrupt changes of runoff and sediment load in the lower reaches of the Yellow River, China. Water Resour. 2014, 41, 252–260. [Google Scholar] [CrossRef]
  15. Yang, M.; Mao, D.; Liu, P.; Liu, W. Analysis of Characteristics of annual runoff and sediment in Dongting Lake during 1951–2015. Eng. J. Wuhan Univ. 2018, 51, 1050–1062+1071, (In Chinese with English Abstract). [Google Scholar]
  16. Yang, L.; Zhao, G.; Tian, P.; Mu, X.; Tian, X.; Feng, J.; Bai, Y. Runoff changes in the major river basins of China and their responses to potential driving forces. J. Hydrol. 2022, 607, 127536. [Google Scholar] [CrossRef]
  17. Gao, P.; Mu, X.; Wang, F.; Li, R. Changes in streamflow and sediment discharge and the response to human activities in the middle reaches of the Yellow River. Hydrol. Earth Syst. Sci. 2011, 15, 1–10. [Google Scholar] [CrossRef]
  18. Feng, X.; Fu, B.; Piao, S.; Wang, S.; Ciais, P.; Zeng, Z.; Lü, Y.; Zeng, Y.; Li, Y.; Jiang, X.; et al. Revegetation in Chinese Loess Plateau is approaching sustainable water resource limits. Nat. Clim. Change 2016, 6, 1019–1022. [Google Scholar] [CrossRef]
  19. Xu, H.; Ren, Y.; Zheng, H.; Ouyang, Z.; Jiang, B. Analysis of runoff trends and drivers in the Haihe River basin, China. Int. J. Environ. Res. Public Health 2020, 17, 1577. [Google Scholar] [CrossRef]
  20. Yang, Y.; Tian, F. Abrupt change of runoff and its major driving factors in Haihe River catchment, China. J. Hydrol. 2009, 374, 373–383. [Google Scholar] [CrossRef]
  21. Yang, Y. Mechanisms resulting in sharp decrease of runoff in Haihe catchment of North China. In Proceedings of the General Assembly Conference Abstracts, Vienna, Austria, 22–27 April 2012; p. 1722. [Google Scholar]
  22. Wang, C.; Xu, L.; Fu, X. Studies on water resources carrying capacity in Tuhai river basin based on ecological footprint. IOP Conf. Ser. Earth Environ. Sci. 2017, 64, 012030. [Google Scholar] [CrossRef]
  23. Wang, J.; Ran, J.; Wu, W.; Shang, R.; Zhang, S.; Zhang, Z.; Zhang, M.; Liu, J. Scaling effects of anthropogenic and climate change impacts on runoff in the Haihe River Basin. J. Ecol. Rural Environ. 2024, 40, 757–765, (In Chinese with English Abstract). [Google Scholar]
  24. Han, Y.; Zhang, S. Characteristics of runoff variations and their influencing factor in Haihe River Basin. J. Water Resour. Water Eng. 2021, 32, 7–13, (In Chinese with English Abstract). [Google Scholar]
  25. Kong, K.; Wang, K.; Xu, Z.; Cong, X. Simulation and analysis of rain-flood routing under multi-stage sluices regulation in Tuhai River Basin. DEStech Trans. Soc. Sci. Educ. Hum. Sci. 2017. [Google Scholar] [CrossRef] [PubMed]
  26. Dong, L.; Li, D. Variation trend and mutation analysis of runoff in Tuhai River watershed. J. Binzhou Univ. 2016, 32, 79–85, (In Chinese with English Abstract). [Google Scholar]
  27. Zhuang, F. Variation trend and analysis of the runoff on the upstream of the Tuhai River in Haihe River Basin. J. Agric. Catastrophol. 2021, 11, 143–144+150, (In Chinese with English Abstract). [Google Scholar]
  28. Kendall, M.G. Rank Correlation Methods; Charles Griffin: London, UK, 1975. [Google Scholar]
  29. Mann, H.B. Non-parametric test against trend. Econometrica 1945, 13, 245–259. [Google Scholar] [CrossRef]
  30. de Oliveira, R.G.; Valle Júnior, L.C.G.; da Silva, J.B.; Espíndola, D.A.L.F.; Lopes, R.D.; Nogueira, J.S.; Curado, L.F.A.; Rodrigues, T.R. Temporal trend changes in reference evapotranspiration contrasting different land uses in southern Amazon basin. Agric. Water Manag. 2021, 250, 106815. [Google Scholar] [CrossRef]
  31. Ouellet-Proulx, S.; St-Hilaire, A.; Courtenay, S.C.; Haralampides, K.A. Estimation of suspended sediment concentration in the Saint John River using rating curves and a machine learning approach. Hydrolog. Sci. J. 2016, 61, 1847–1860. [Google Scholar] [CrossRef]
  32. Hu, B.; Wang, H.; Yang, Z.; Sun, X. Temporal and spatial variations of sediment rating curves in the Changjiang (Yangtze River) basin and their implications. Quat. Int. 2011, 230, 34. [Google Scholar] [CrossRef]
  33. Gao, P.; Li, P.; Zhao, B.; Xu, R.; Zhao, G.; Sun, W.; Mu, X. Use of double mass curves in hydrologic benefit evaluations. Hydrol. Process. 2017, 31, 4639. [Google Scholar] [CrossRef]
  34. Chang, J.; Zhang, H.; Wang, Y.; Zhu, Y. Assessing the impact of climate variability and human activities on streamflow variation. Hydrol. Earth Syst. Sci. 2016, 20, 1547–1560. [Google Scholar] [CrossRef]
  35. Ahn, K.; Merwade, V. Quantifying the relative impact of climate and human activities on streamflow. J. Hydrol. 2014, 515, 257–266. [Google Scholar] [CrossRef]
  36. Flood Prevention Scheme of Tuhai River in Shandong Province in 2023; Shandong Provincial Water Resources Department: Shandong, China, May 2023.
  37. Kong, D.; Miao, C.; Wu, J.; Duan, Q. Impact assessment of climate change and human activities on net runoff in the Yellow River Basin from 1951 to 2012. Ecol. Eng. 2016, 91, 566–573. [Google Scholar] [CrossRef]
  38. Feng, S.; Mu, X.; Gao, P.; Xie, Z. Trends of runoff and sediment loads in the Jinghe River basin and influencing factors. J. Arid Land Resour. Environ. 2022, 36, 151–157, (In Chinese with English Abstract). [Google Scholar]
  39. Liu, Y.; Guan, Z.; Tian, J.; Liu, R.; Guan, R. Runoff change and its driving factors in Jinghe River basin in recent 70 years. Arid land Geogr. 2022, 45, 17–26, (In Chinese with English Abstract). [Google Scholar]
  40. IPCC. Climate Change 2013: The Physical Science Basis; Cambridge University Press: Cambridge, UK, 2013. [Google Scholar]
  41. Li, Z.; Quiring, S.M. Investigating spatial heterogeneity of the controls of surface water balance in the contiguous United States by considering anthropogenic factors. J. Hydrol. 2021, 601, 126621. [Google Scholar] [CrossRef]
Figure 1. Positions of Binzhou City (a), Tuhai River, and the Pujizha hydrological station in Binzhou City (b), and the boundary of the catchment controlled by Pujizha hydrological station (c).
Water 16 02064 g001
Figure 2. Linear trends of annual (a), flood season (b), non-flood season (c) runoff, and annual (d), flood season (e), non-flood season (f) sediment load of the Tuhai River Basin.
Water 16 02064 g002
Figure 3. The four time series (1972–1978, 1979–2002, 2003–2013, and 2014–2021) of annual, flood season, non-flood season runoff (a), and sediment load (b) of the Tuhai River Basin. Different capital letters indicate significant differences in the same time series across different stages (p < 0.05); different lowercase letters indicate significant differences within the same stage across different time series (p < 0.05). Bars indicate standard deviation.
Water 16 02064 g003
Figure 4. Abrupt change points of annual (a), flood season (b), non-flood season runoff (c), and annual (d), flood season (e), non-flood season (f) sediment load of the Tuhai River Basin.
Water 16 02064 g004
Figure 5. Runoff–sediment curves of the Tuhai River Basin.
Water 16 02064 g005
Figure 6. Double accumulative curves of precipitation–runoff (a) and precipitation–sediment (b) in the Tuhai River Basin between 1972 and 2021.
Water 16 02064 g006
Figure 7. Changes in annual (a), flood season (b), non-flood season (c) rainfall, and abrupt change points of annual runoff (d), flood season runoff (e), non-flood season runoff (f) in the Tuhai River Basin.
Water 16 02064 g007
Table 1. Mann–Kendall (M–K) test of annual total runoff and sediment load of the Tuhai River Basin from 1972 to 2021.
IndicatorsRunoff Sediment
ZTrendZTrend
Annual 0.80−2.89 **
Flood stage 0.33−3.18 **
Non-flood stage 0.82−0.14
Note: ** p < 0.01.
Table 2. Regulation measures of the Tuhai River Basin across different time series from 1972 to 2021.
Time Series1979–2002 2003–20132014–2021
Human governance measures River regulation: 31.1 km; New dam: 18 km;
Waterlogging-prone area: 3.37 × 10⁵ ha
River regulation: 18.4 km; River dredging: 5.64 km; River channel protection: 3.54 kmRiver regulation: 84.24 km; River dredging: 207.53 km; River channel protection: 2.42 km; Dredging earthwork: 1.69 × 10⁷ m3; New drainage culverts: 5; Maintenance and renovation of 168 culverts and 47 bridges
Table 3. Pearson correlation analyses between runoff and sediment loads and rainfall in the Tuhai River Basin from 1972 to 2021.
IndicatorStages1972–2021 (n = 50)1972–1978 (n = 7)1979–2021 (n = 43)
AnnualFlood StageNon-Flood StageAnnualFlood StageNon-Flood StageAnnualFlood StageNon-Flood Stage
RunoffAnnual0.326 *0.394 **−0.0810.6760.6520.0730.1220.203−0.167
Flood stage0.333 *0.425 **−0.1390.765 *0.7490.0390.1180.204−0.182
Non-flood stage0.1420.0850.1960.2900.2480.1540.118−0.0410.457 **
Sediment loadAnnual0.2290.330 *−0.1980.783 *0.810 *−0.1250.2820.334 *−0.030
Flood stage0.2270.331 *−0.2060.783 *0.810 *−0.1260.2890.369 *−0.102
Non-flood stage0.109−0.0480.454 **0.130−0.0420.6570.087−0.0130.291
Notes: * p < 0.05; ** p < 0.01.
Table 4. Effects of rainfall and human activities at different stages on the annual runoff in the Tuhai River Basin.
StageAnnual Runoff (108 m3) RainfallHuman Activities
Measured ValueEstimated ValueTotal ReductionReduction
(108 m3)
RatioReduction
(108 m3)
Ratio
1972–19789.239.43
1979–20021.008.328.230.9111.1%7.3288.9%
2003–20138.858.340.380.89
2014–20211.976.167.263.0742.3%4.1957.7%
Table 5. Effects of rainfall and human intervention at different stages on the annual sediment load of the Tuhai River Basin.
StagesAnnual Sediment Load (108 kg)RainfallHuman Activities
Measured ValueEstimated ValueTotal ReductionReduction
(108 kg)
RatioReduction
(108 kg)
Ratio
1972–197816.1315.64
1979–20020.6713.9615.462.1714.0%13.2986.0%
2003–20134.1913.8911.942.2418.8%9.7081.2%
2014–20210.1010.2116.035.9236.9%10.1163.1%
Disclaimer/Publisher’s Note: The statements, opinions and data contained in all publications are solely those of the individual author(s) and contributor(s) and not of MDPI and/or the editor(s). MDPI and/or the editor(s) disclaim responsibility for any injury to people or property resulting from any ideas, methods, instructions or products referred to in the content.

