Abstract
This paper explores how participatory science helps address water supply challenges in developing countries suffering from water shortages. In the absence of technical capacity to monitor the water supply system, this participation constitutes an excellent alternative to involve citizens in data collection and evaluation of the quality of the water service. The paper presents the design and implementation of a participatory science platform that enables data about the quality of the water supply in the city of Kharas in Palestine to be collected. Thanks to significant citizen participation, the study demonstrates that participatory science enhances the management of the water supply system and public awareness and engagement. Temporal and spatial analysis of collected data helped us to better understand the water supply system and identify the causes of the water service degradation. The study shows that the success of citizen participation requires cooperation between the water staff and citizens, including continuous dialogue and training and the construction of a friendly citizen participation platform.
1. Introduction
This paper presents the use of citizen science to address water supply challenges in water-scarce developing regions. The significance of the paper is twofold. First, it deals with water challenges in water-scarce areas, which are subjected to increasing pressure in securing water supply for the population because of climate change, rapid demographic growth, and lack of funding to build, extend, and modernize the water supply infrastructure. Second, it uses the innovative citizen science approach to involve the population in addressing the water challenges. Indeed, this approach is increasingly employed to support and improve the management of complex urban and environmental systems and to support decision-makers in addressing the challenges of these systems [1,2,3,4,5].
Water scarcity in developing countries poses significant threats to public health and environmental sustainability [6,7]. In addition, the water supply system is complex and depends on physical, socioeconomic, environmental, and institutional factors [8,9,10]. The optimal management of this complex system requires a comprehensive approach that involves all the stakeholders, including end-users [11,12].
Recent technological advances have resulted in the creation of adequate water supply management methods, in particular those that use IoT and sensor-based systems [13,14,15]. However, these technologies are still expensive for developing countries and require advanced technical capacity for implementation [16]. In addition, they fall short of capturing users’ experiences and expectations and involving them in managing the water system [17]. Therefore, it is essential to evolve these methods to integrate end-users as human sensors and as major water stakeholders to improve the management of the water supply system [10,18,19]. End-users can provide continuous water-related spatial operating data, which is crucial for optimal water supply system management, particularly in data-poor regions. Scholars have addressed the lack of urban data by using innovative solutions. In [20], the authors used social media for data collection, while [21] employed citizen science to overcome data limitations about the sanitation system, and [22] collaborated with farmers to monitor and manage the irrigation system.
The application of participatory science in the hydrological context is increasing thanks to technological advances that provide opportunities to engage citizens in more robust, open, and democratic decision-making processes. In [23,24,25], the authors created polycentric systems and a data-gathering framework that allowed knowledge generation, institutional capacity building, and policy support [26,27,28]. This engagement is more valuable in data-poor regions lacking participatory governance and technology deployment [29]. Brouwer et al. [30] and Buytaert et al. [27] have underscored the effectiveness of community participation in water management. George et al. [31] and Cottam et al. [32] provided valuable insights into the practical applications of low-cost technologies in this field, which is of high concern to developing countries. Recent papers have advocated community involvement in urban planning [33,34]. In addition, to integrate participatory sciences with other technologies, recommendations [35,36,37,38] could be used for synthesizing multi-source data to construct multidimensional systems.
Based on the literature review, participatory science has yet to be used to address the water supply challenges in regions suffering from a deficit in the water supply. Indeed, in some areas, such as Jordan and the Palestinian territory, users can only access the water supply for a few hours each day. This shortage is related to several factors, such as water scarcity, poor infrastructure, poor management, colossal water leaks, and illegal connections [39]. Shortages in the water supply result in social and economic tensions, particularly for low-income families. In addition, the water supply authority has limited access to data that could help to detect operating deficiencies, illegal connections, and the gap between scheduled operations and the real ones on the ground. Without a monitoring system that allows water managers to follow the operating conditions and the quality of services, participation by end-users constitutes an efficient way to overcome this difficulty. This paper proposes to fill this gap by developing an innovative system based on participatory science to involve end-users in collecting data about the performance of the water supply system and in evaluating the performance of the water authority strategy. By involving citizens in data collection and evaluation, this study provides a cost-effective and inclusive alternative to high-tech solutions, enhancing water supply management in data-poor regions. The paper presents the development and implementation of this system and discusses the lessons learned from its implementations and limitations.
The paper is organized as follows: First, it describes the research methodology and materials, including the study area, data collection, and data analysis. Then, it presents the case study, the participatory hub development, and a discussion of data collection and how these data help improve understanding of the water supply system operation. Finally, the paper concludes by summarizing the main insights gained from the study, discussing its limitations, providing recommendations, and suggesting directions for future research.
2. Methodology and Materials
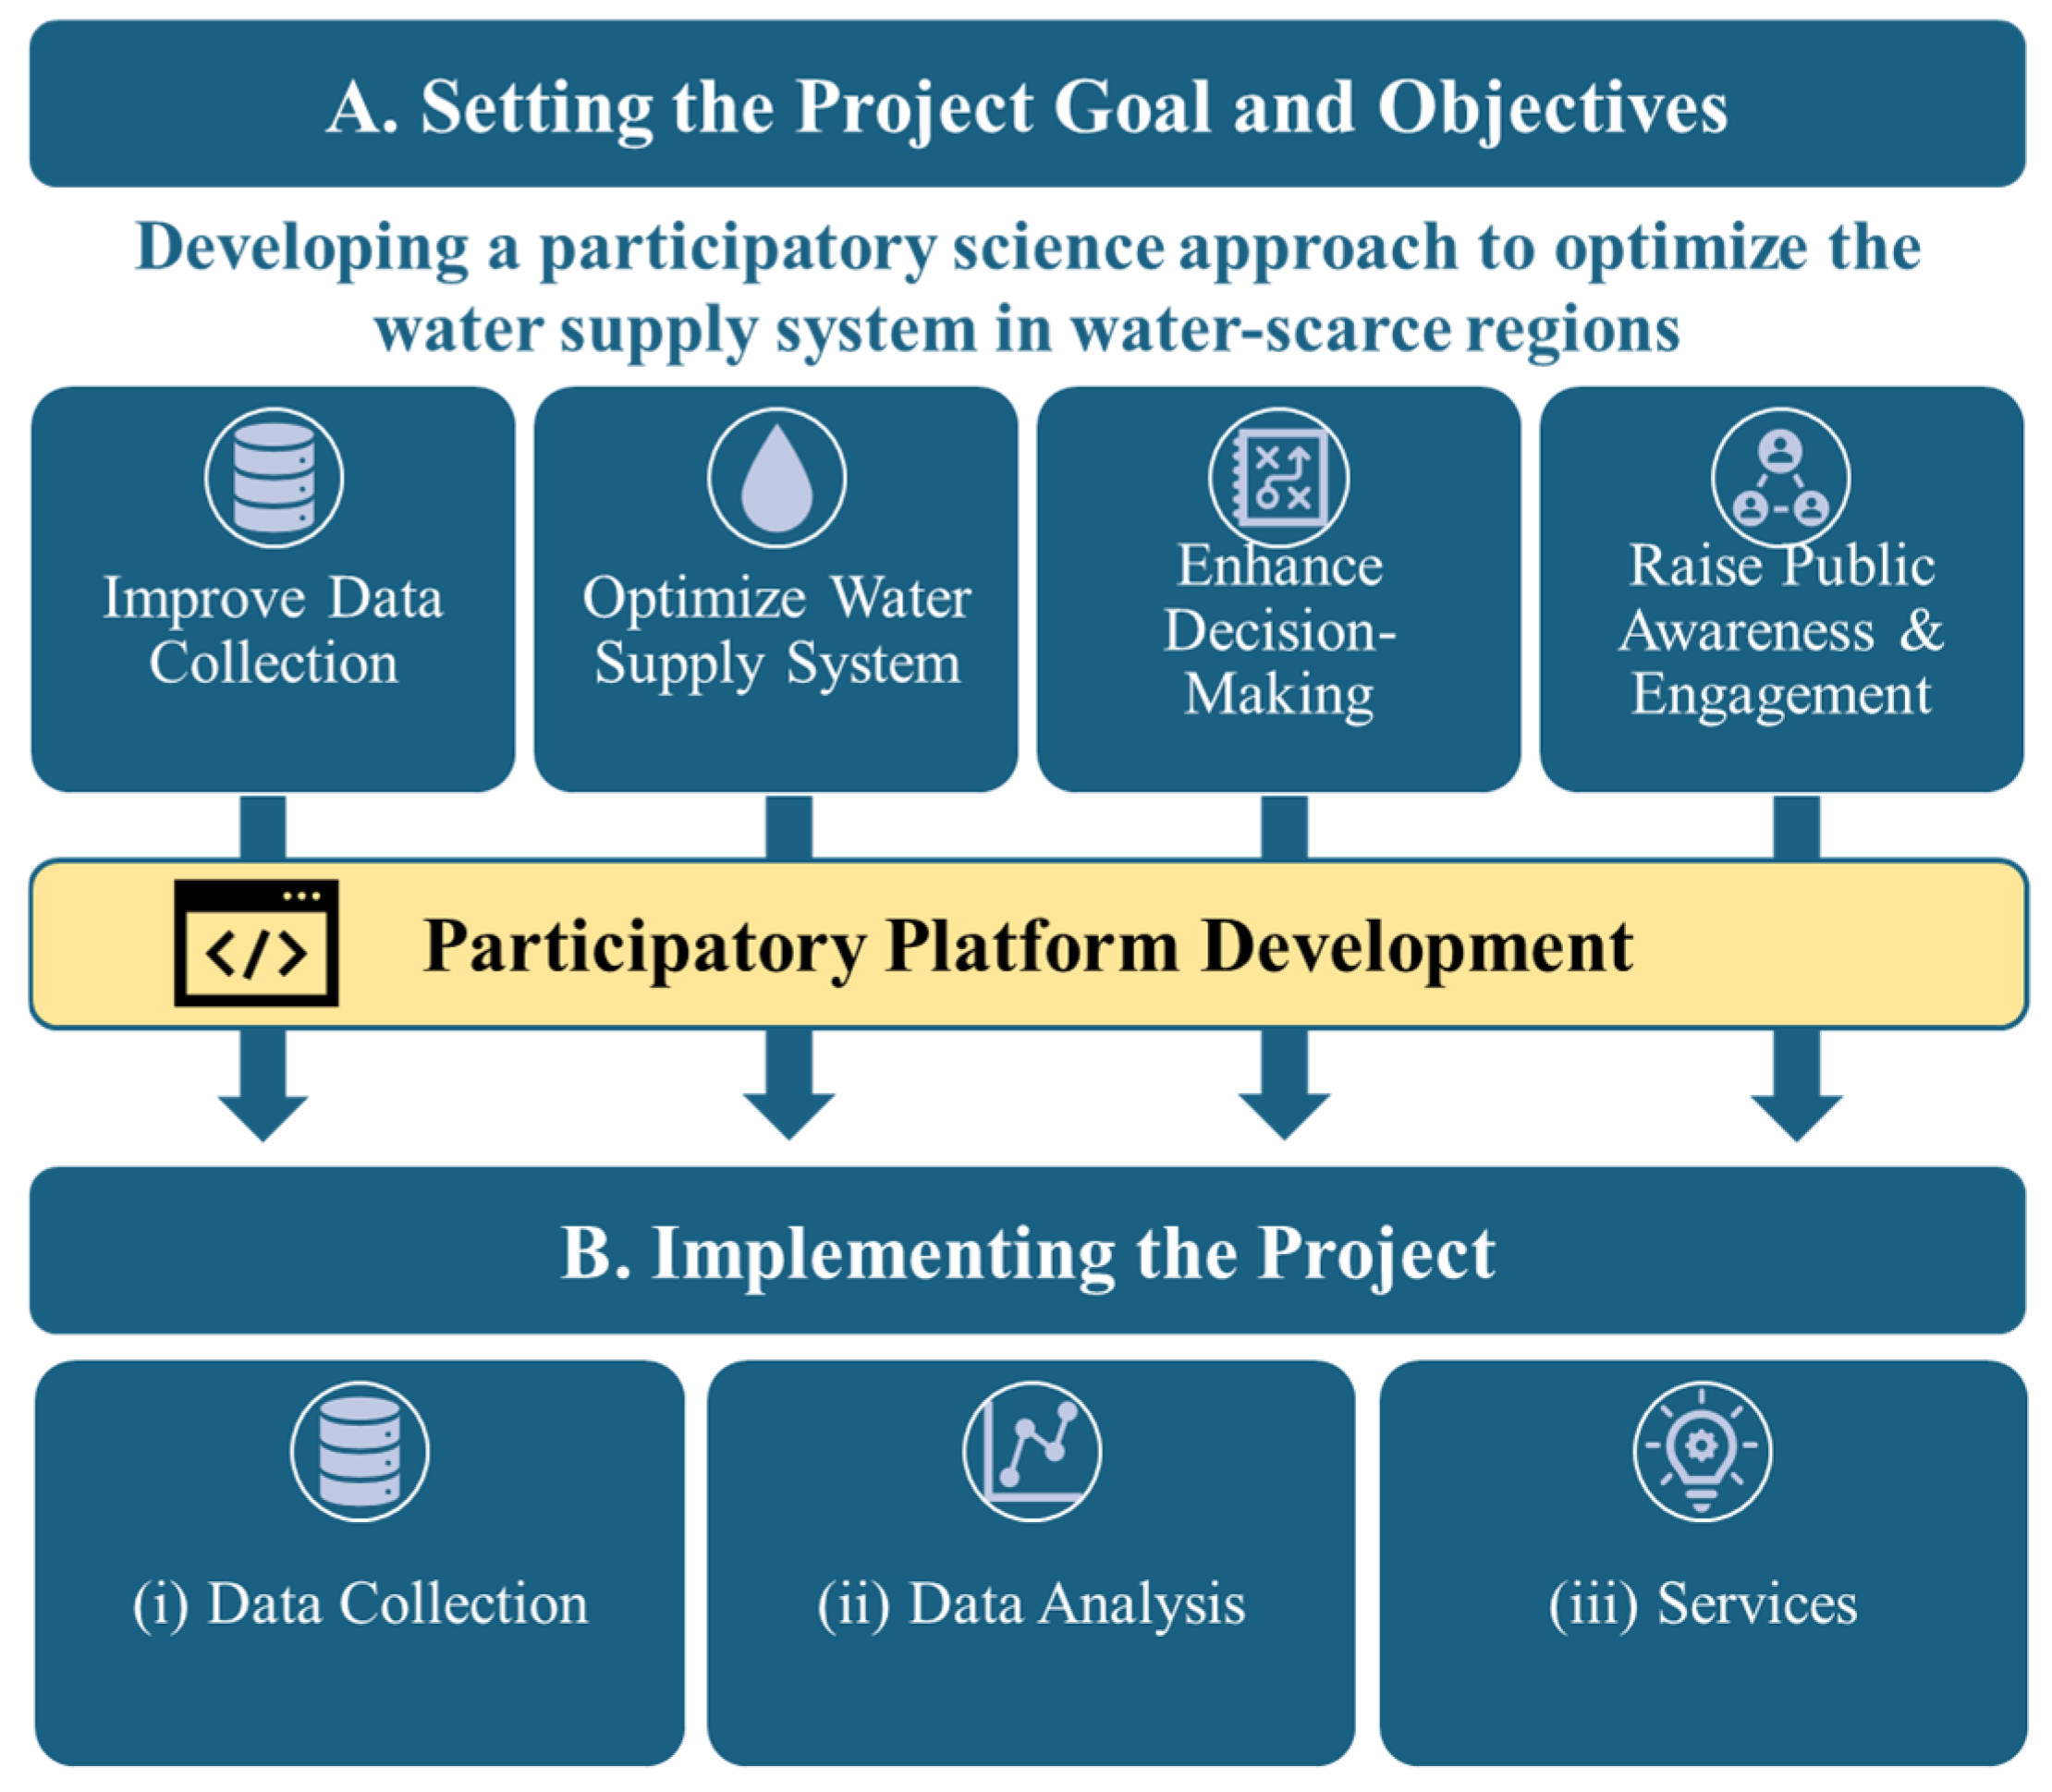
Figure 1 shows the research methodology, which leverages smart technology applications for smart cities and smart water systems, as discussed in works by Shahrour and Xie [19], Requier et al. [40], and Mashhadi et al. [41]. The methodology comprises two phases. The first phase concerns setting the goal and objectives of the water supply participatory project. The second phase consists of implementing the participatory science approach. The latter includes the following three components: (i) data collection, (ii) data analysis, and (iii) transforming data into services.
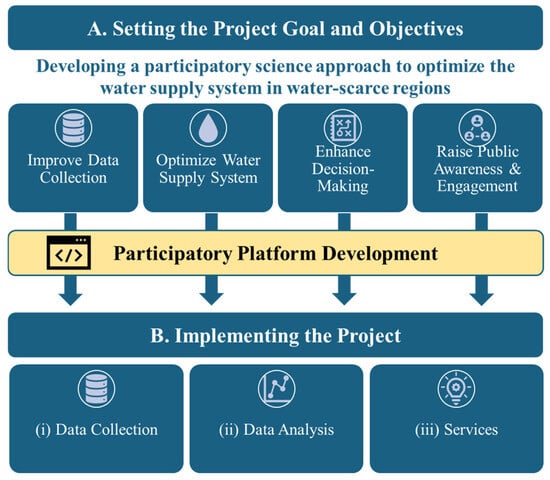
Figure 1.
Research Methodology.
2.1. Setting the Project Goal and Objectives
This initial stage focuses on clearly defining the goals of the participatory science project. This phase should be based on a discussion with the project’s stakeholders, including decision-makers, the administrative and technical teams, and citizens. It should ensure that all stakeholders have a shared understanding of the desired outcomes [42]. The project must have a clear purpose, with specific goals and objectives [43,44,45]. In water-scarce regions, participatory science aims to enhance the management and operation of the water supply system by (i) improving data collection through citizens’ participation in data collection, (ii) optimizing the water supply system by identifying operational issues and deficiencies and assessing service quality, (iii) enhancing decision-making by using collected data to inform and improve decision-making, and (iv) raising public awareness and engagement.
2.2. Constructing the Participatory Platform
Implementing the participatory approach requires creating a platform for collecting, analyzing, and transforming collected data into services for citizens, technical staff, and decision-makers. The primary objective is to ensure citizens’ active participation and support the municipality in managing the water supply system. The platform design should be user-friendly and informative.
2.3. Data Collection
The data used in this study include infrastructure and operational data as well as data on the quality of the water supply. The municipality provides data about (i) the water supply infrastructure, including the characteristics of tanks, pipes, valves, pumps, and water meters, and (ii) operational data, including pumping, water debit, pressure, and quality. Users provide data about the quality of the water supply, including information about the interruption of the water supply and anomalies in the supplied water, such as its color, smell, or taste.
2.4. Data Analysis
The analysis of the collected data aims to enhance our understanding of the actual operation of the water system. It includes a real-time analysis of the quality of the water supply service to detect anomalies in the water supply. It also consists of a temporal and spatial analysis to establish water supply service patterns and identify the causes of anomalies in the water services.
2.5. Platform Services
The platform provides several services, mainly including: (i) data collection through tools, including infrastructure, operational, and citizen-collected data; (ii) a dashboard service, including information about the water supply service and educational materials on water conservation and relevant topics, aiming to raise public awareness; and (iii) results and knowledge sharing through tools for sharing analysis results and disseminating knowledge. It provides regular updates and reports, offering insights into patterns and trends in the data and their implications for water supply management.
3. Case Study
3.1. Presentation of the Water System and Challenges
This research was applied to Kharas, a town northwest of Hebron City in the West Bank, Palestine. The city covers an area of 6.8 km2 with a population estimated at 10,000. Kharas has been suffering from a severe water shortage because of insufficient water supply and high degradation of the water network. The latter resulted in severe water losses, which reached up to 50% of the water supply.
Because of technical and financial issues, the city has not implemented a monitoring system to follow the water operation and detect leaks. The participatory science approach presented an excellent opportunity for the town to engage citizens in improving the water supply system. Through this engagement, the city wanted to (i) enhance citizens’ awareness about the value of water preservation, and (ii) collect data that help understand the water operation system and identify the issues with this system.
The Palestinian Water Authority (PWA) selected this city as the first pilot project in Palestine. The PWA will use the results of this experiment to extend participatory science to other Palestinian cities. The city was selected for its vast water shortage and small size, which facilitates the implementation of participatory science and the great interest of city decision-makers and technical staff in this approach.
3.2. Implementation of the Participatory Approach
The project started by working with the technical staff to adapt the participatory platform to Kharas City. This adaptation included creating a digital model of the water supply system, engaging volunteers, and collecting and analyzing users’ data.
3.2.1. Creation of the Digital Model of the Water System
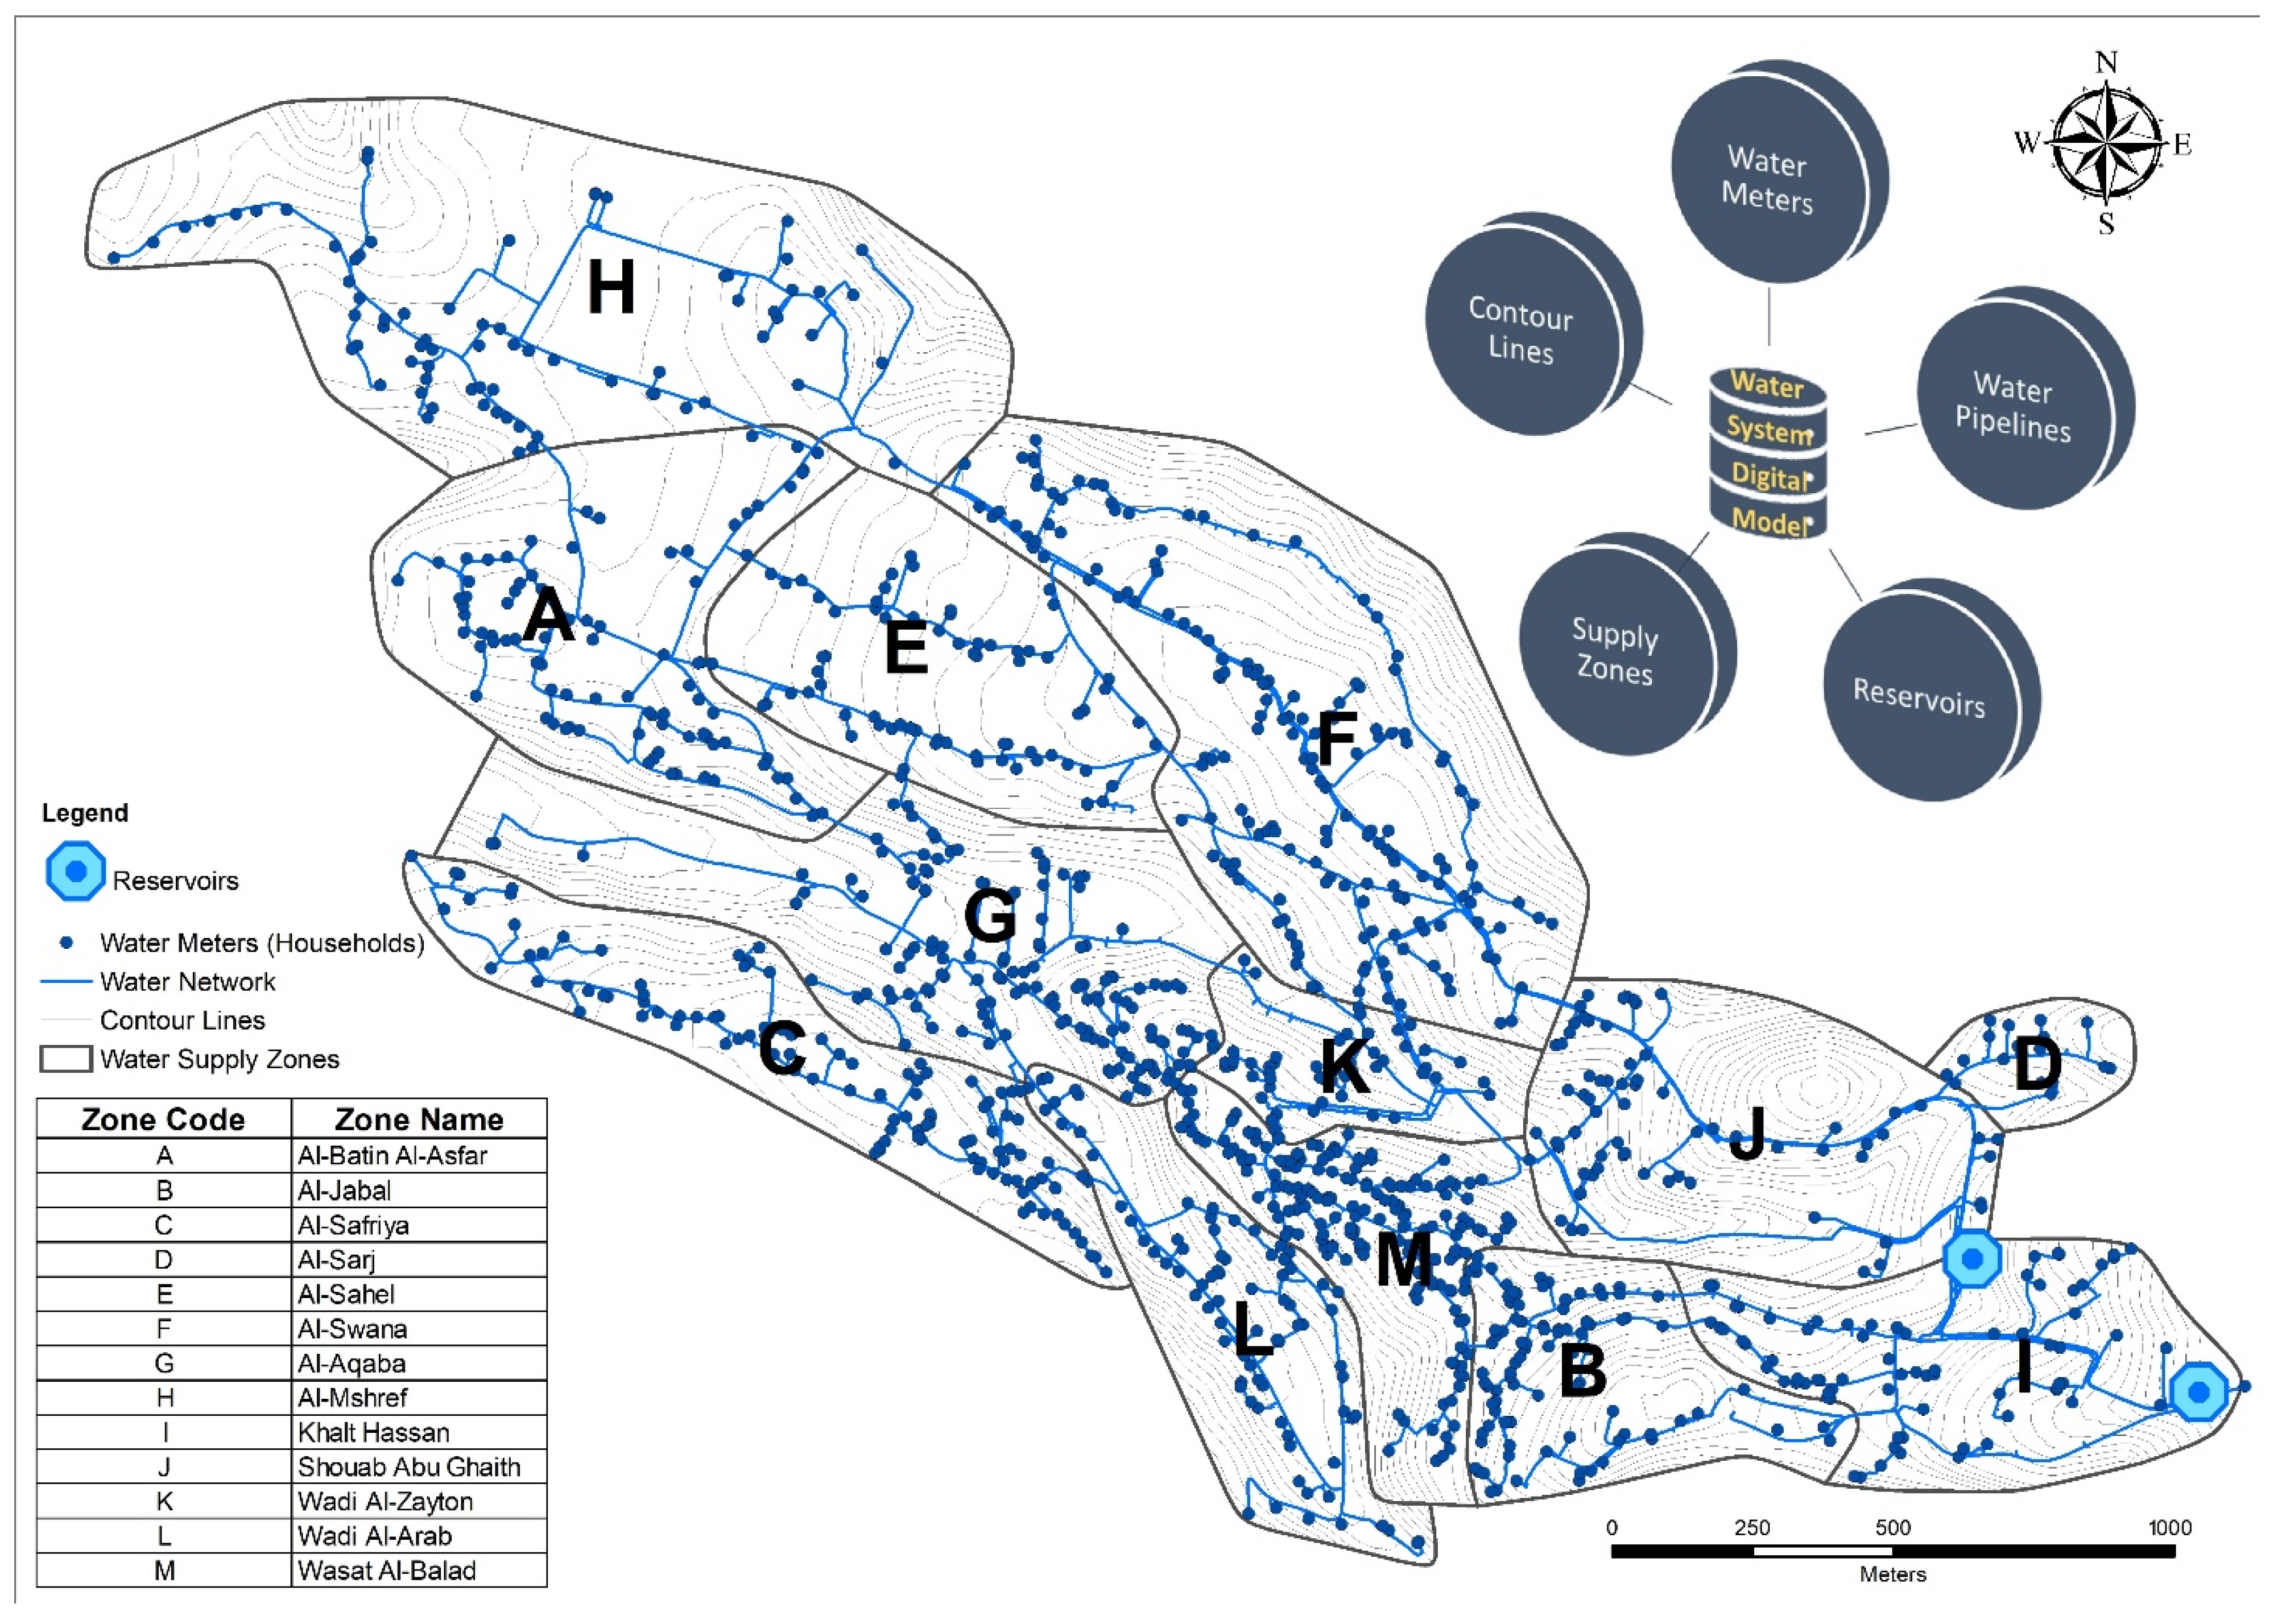
The research team worked with the technical staff to collect data about the water supply system, including the location and characteristics of water pipes, water distribution tanks, and end-user connections. The collected data were used to build a comprehensive GIS system that includes all the collected data (Figure 2). The water system includes 63.1 km of pipes, two distribution tanks, and 1200 user connections. The city is organized into 13 areas according to the water operation system.
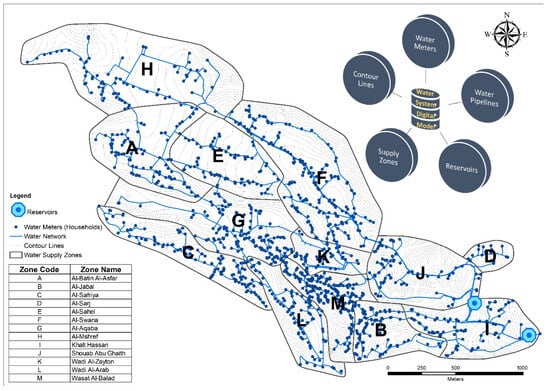
Figure 2.
GIS of the Water System.
Two reservoirs serve the study area. The main reservoir, located at the highest elevation of 721 m, has a capacity of 1000 cubic meters. It feeds a secondary reservoir, which holds 250 cubic meters and is situated at a lower elevation of 628 m.
The shortest distance was calculated using ArcMap 10.7 software to analyze the water pipeline network and establish the most direct path for water to flow from the closest reservoir to each meter involved in the case study. This detailed mapping aids in understanding how topographical and infrastructural factors may impact water distribution and quality across different town zones.
3.2.2. Citizens’ Engagement and Training
Given the expectations of the city and its users, the first application of the participatory platform targeted the quality of the water supply. This focus was chosen due to the critical nature of water shortages for residents and the city. To address this issue, citizens were asked to report the water supply quality using three qualitative statuses:
- Blue (★ ★ ★): Good water supply
- Yellow (★ ★): Degraded water supply
- Red (★): Interrupted water supply
To ensure user privacy, the project concentrated on water quality, which involves external factors and does not require personal data. Volunteers agreed to participate in this pilot project through a formal agreement with the city, stipulating that the data would be used solely for this project and subsequently deleted.
The following sections present the collected data and how it was utilized to understand the operation of the water system.
3.3. Data Collection
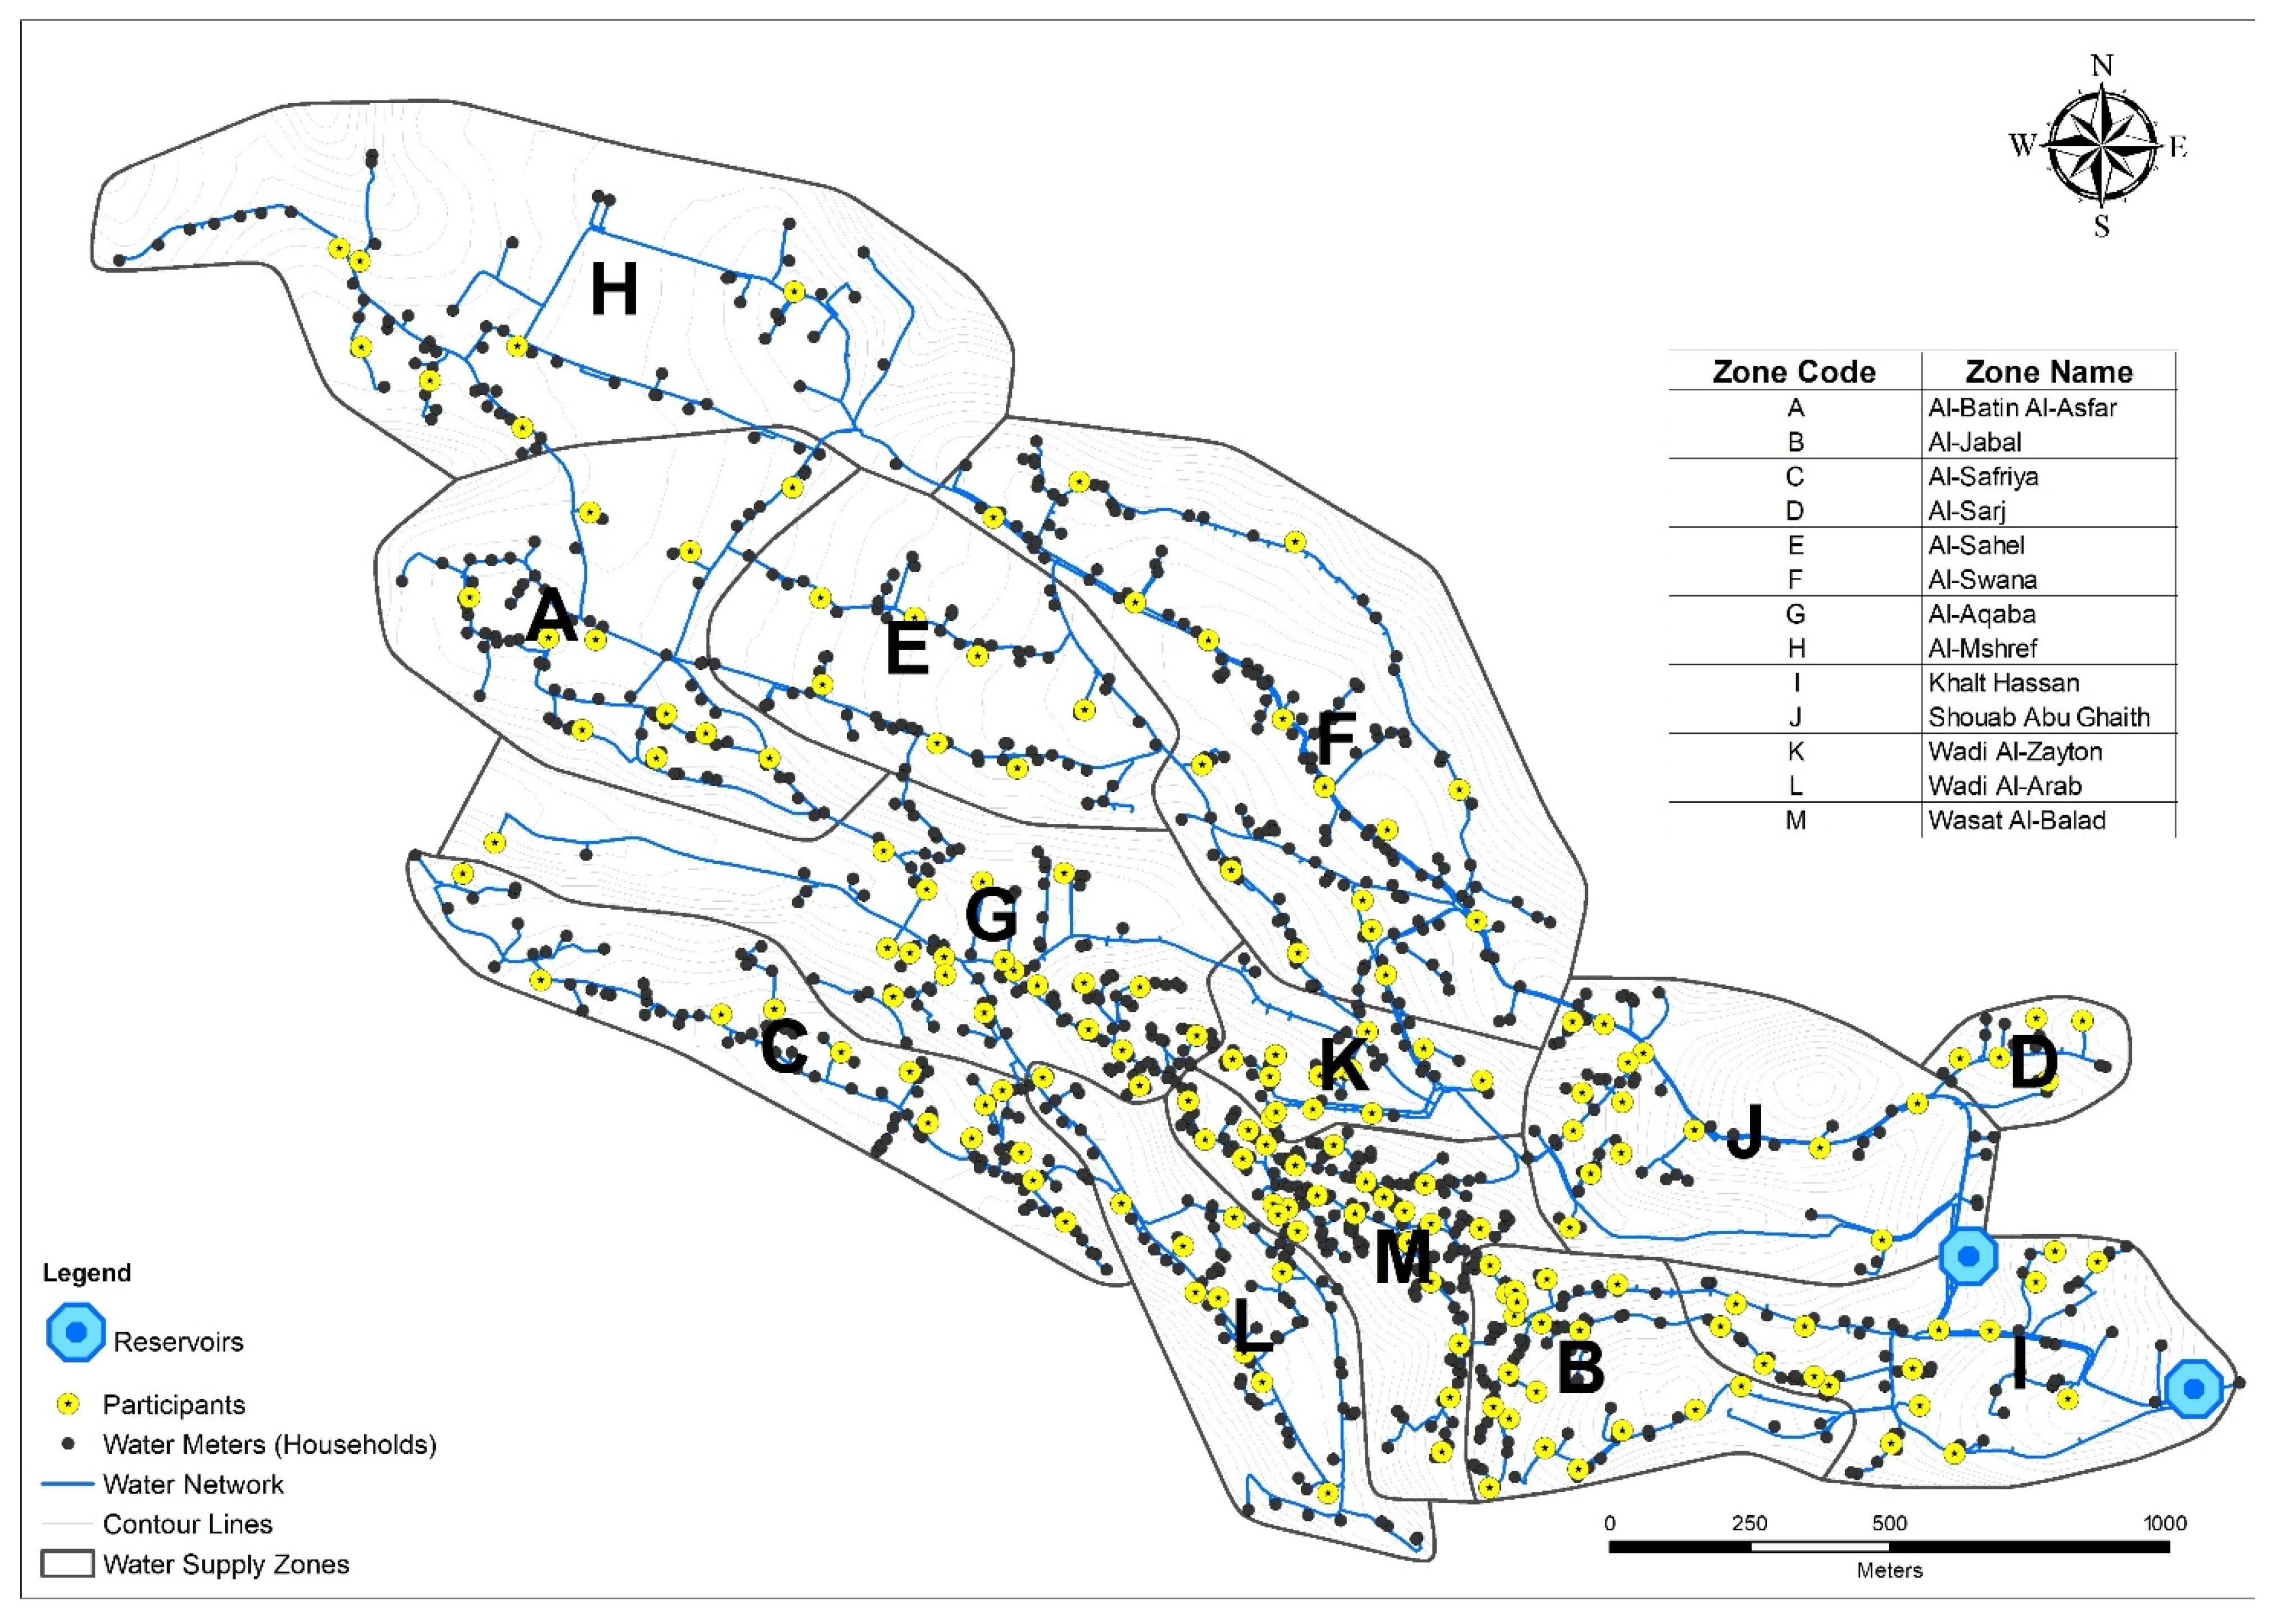
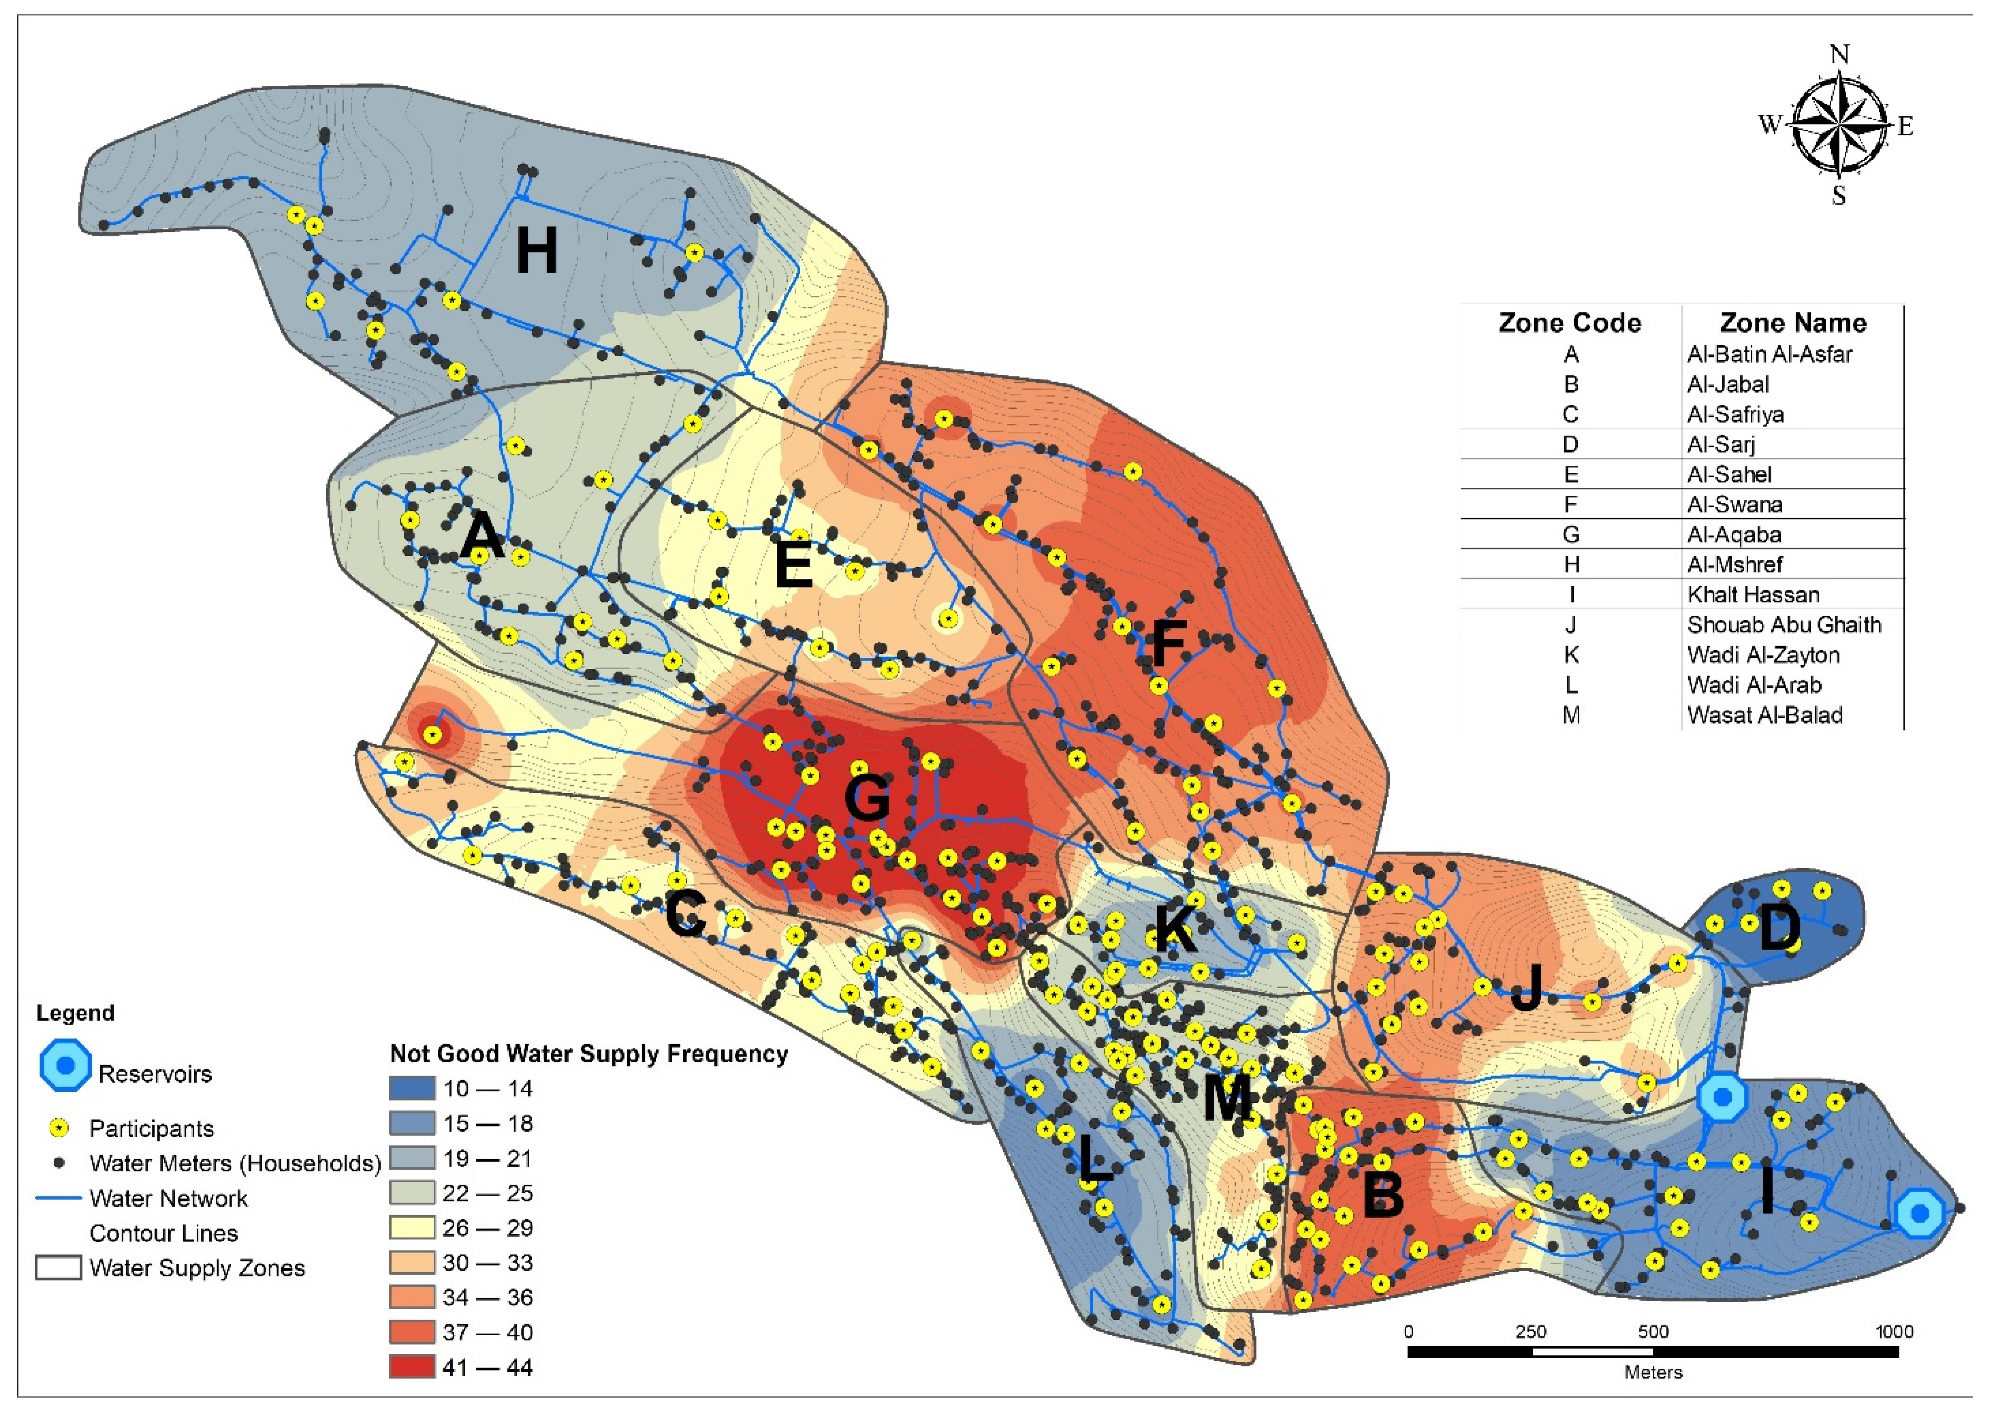
Data collection spanned six months, from June to December 2023, during which 175 citizens participated. Figure 3 shows the distribution of participants across different zones. Central zones such as B, K, and M, close to the municipality building where workshops took place, and zones I, J, and G, with high populations, attracted more participants.
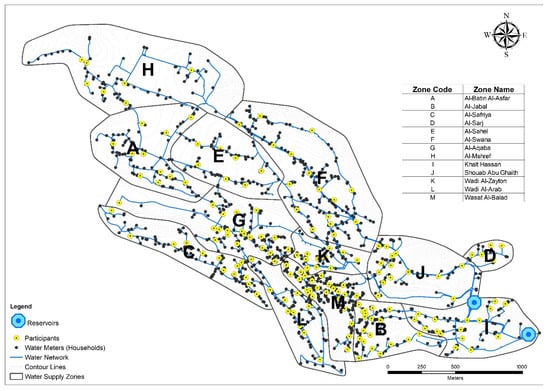
Figure 3.
Water Supply Zones and Participants Spatial Distribution.
A total of 596 Quality Supply (QS) reports were collected. They were classified into three categories: 260 reports (44%) were rated as ‘Bleu’, indicating good water supply conditions; 276 reports (46%) were marked as ‘Yellow’, signifying a degraded water supply; and 60 reports (10%) were considered ‘Red’, highlighting interrupted supply. With a confidence level of 85% and a margin of error of 5%, this data set is statistically significant.
Table 1 summarizes the population number and the total reports for each geographic zone. It shows that reporting covers all geographic zones. The ratio of the total report to the population number varies between 10.13% and 29.41%, with an average value of 14.58%. Highly reported zones, as earlier mentioned, are either central or high-population zones, except zone D, which consists of only 17 households, all belonging to the same family. This demonstrates how social factors, such as kinship, in zone D can influence participation.

Table 1.
Participants’ Distribution by Water Supply Zone.
To maintain high data accuracy and consistency standards, clear guidelines, definitions, and assumptions were provided during the workshops to the municipality and participating users to ensure the accuracy and consistency of the data. Table 2 presents the main assumptions and definitions related to the data collection process.
Table 2.
Data Collection Assumptions and Definitions.
3.4. Analysis and Results
This study uses a combination of methods to address the data collected, giving attention to temporal trends and spatial variations. These methods include (i) mathematical analysis to tackle users’ reports statistically and build regression models to quantify the relationship between the water supply parameters and observed quality issues, and (ii) spatial analysis to map the distribution of supply quality and identify geographic patterns.
Additionally, this paper emphasizes the critical need for quality testing of participatory data, which often needs to be added in many participatory science studies, particularly those needing readings from citizen-conducted experiments that can be evaluated against specific standards, as in the case of Steinke et al. [46]. While several frameworks discuss ensuring participatory data quality [47], adherence to these frameworks does not necessarily eliminate participation bias, particularly when contributions are based on opinions and experiences rather than measurement tools, as seen in this study. This study presents an example of how to test the quality of collected data to ensure it is unbiased.
3.4.1. Participatory Data Quality Test—Bias Testing
This analysis was prompted by the municipality’s concerns about potential bias in evaluations influenced by social factors. Such bias could undermine the quality and credibility of the analysis and results. Therefore, it was necessary to examine whether there was a bias in the individuals’ contributions related to their families (31 family affiliations vs. 3 categories of supply quality). Using a chi-square test, the results reveal that the participants’ reports are not significantly influenced by their family affiliations, indicating that the collected sample is unbiased (χ2(60) = 0.931).
3.4.2. Temporal Variations in Water Supply Quality
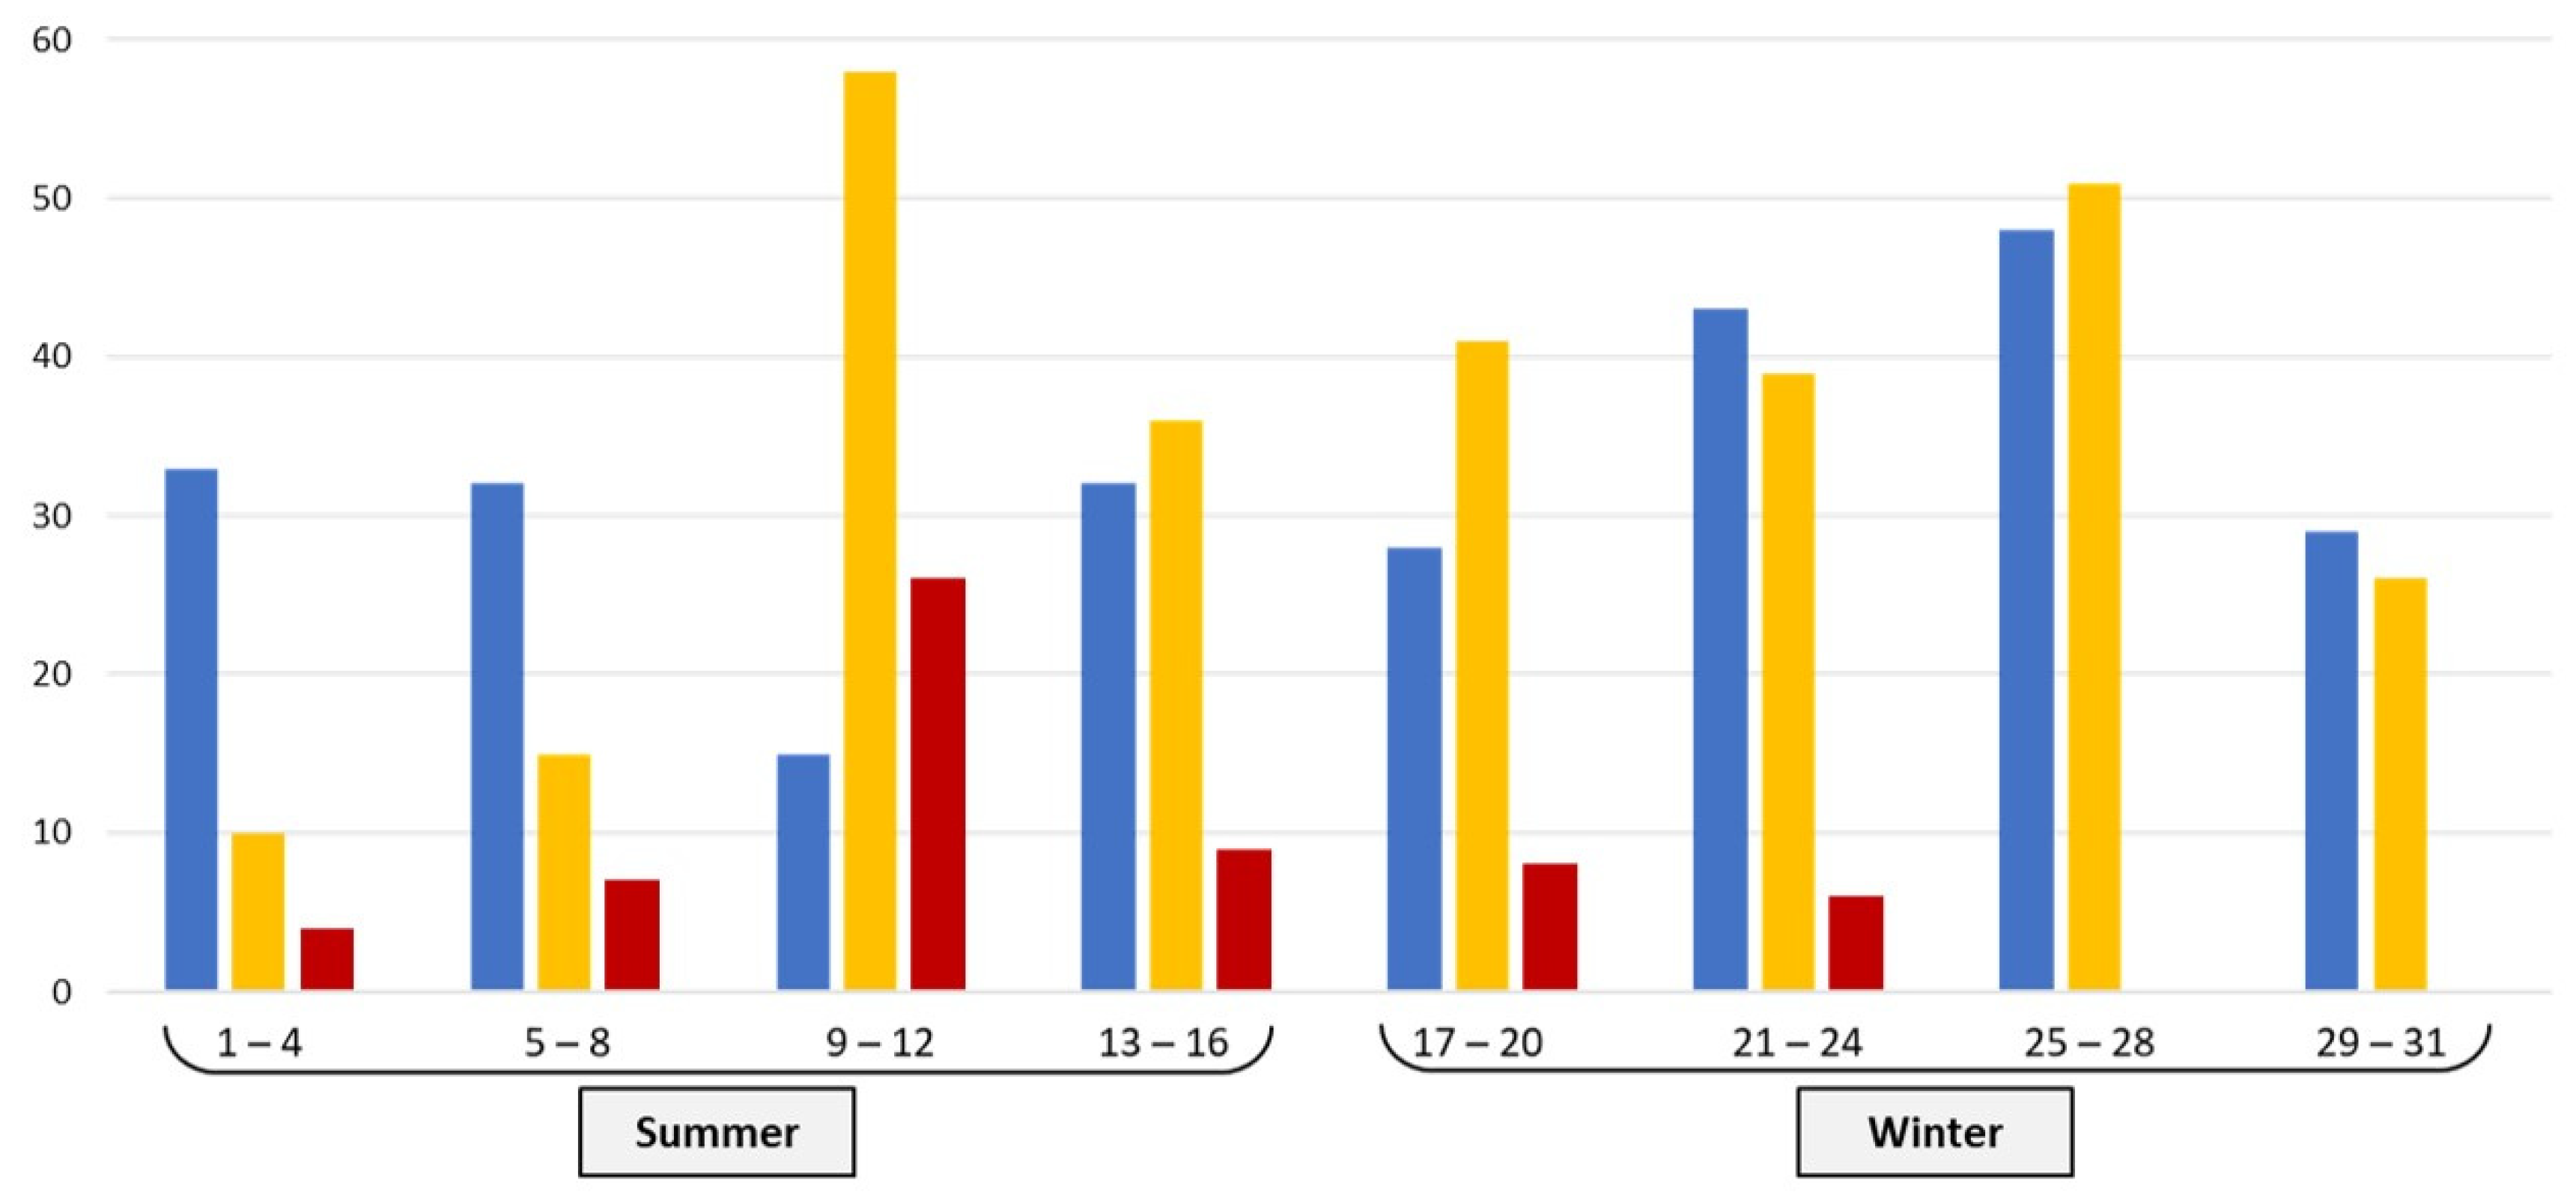
Figure 4 shows the variation in the water supply quality during the observation period. It indicates an increase in the “Good” reports in winter and a decrease in the “Degraded” and “Interrupted” reports. This result could be attributed to the low water consumption in winter, which reduces the pressure on the water supply system. This figure also shows an increase in the “Degraded” reports in summer, which results from the rise in water demand.
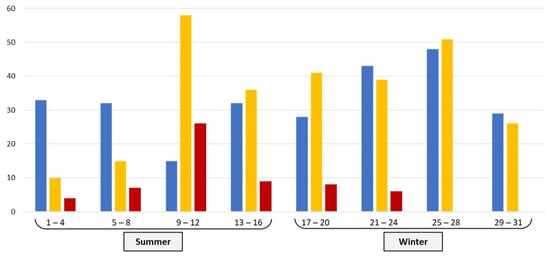
Figure 4.
Number of Supply Quality Reports (QR) per Week and Season.
From now on, both the “Degraded” and “Interrupted” reports will be considered ‘Not Good’ reports because users expect good water quality in such services. However, it is argued that users tend to report negative experiences more than positives.
Table 3 confirms an earlier observation that during summer (weeks 10 to 14), there was a notable increase in the frequency of ‘Not Good’ SQ reports. This is attributed to the higher seasonal water consumption during this period. However, some Not Good SQ re-ports were also identified in autumn (weeks 16 to 28). To better understand this relative increase in Not Good SQ reports, we will examine the spatial dimension of these reports.
Table 3.
Frequency of Not Good SQ Reports per Week.
3.4.3. Spatial Variations in Water Supply Quality
A chi-square test was conducted to determine if there is a relationship between the zones and the water supply quality. The results indicate a strong statistical relationship between the zones and the supply quality, reported by participants at an 80% confidence interval (χ2(24) = 0.166). The strength of the relationship is justified as certain zones significantly impact the supply quality.
Figure 5 and Table 4 illustrate the water quality reports per zone. They show a high degradation of the water quality service in zones B (Al-Jabal), F (Al-Swana), G (Al-Aqaba), and J (Shouab Abu Ghaith), regardless of the season. The poor water service in these zones could be attributable to the degradation of the water infrastructure or their geographical location. This issue will be discussed in the following section.
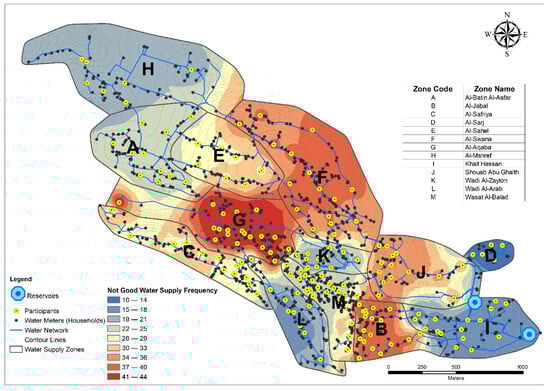
Figure 5.
Spatial Distribution of the Frequency of Not Good SQ.
Table 4.
Frequency of Not Good SQ Reports by Zone.
3.4.4. Analysis of Influencing Factors on the Water Supply Quality
This section analyses the impact of the following factors on the quality of the water supply: the number of connections preceding the user water service, the water pipe diameter, the distance from the water tank, and the altitude of the user water supply unit.
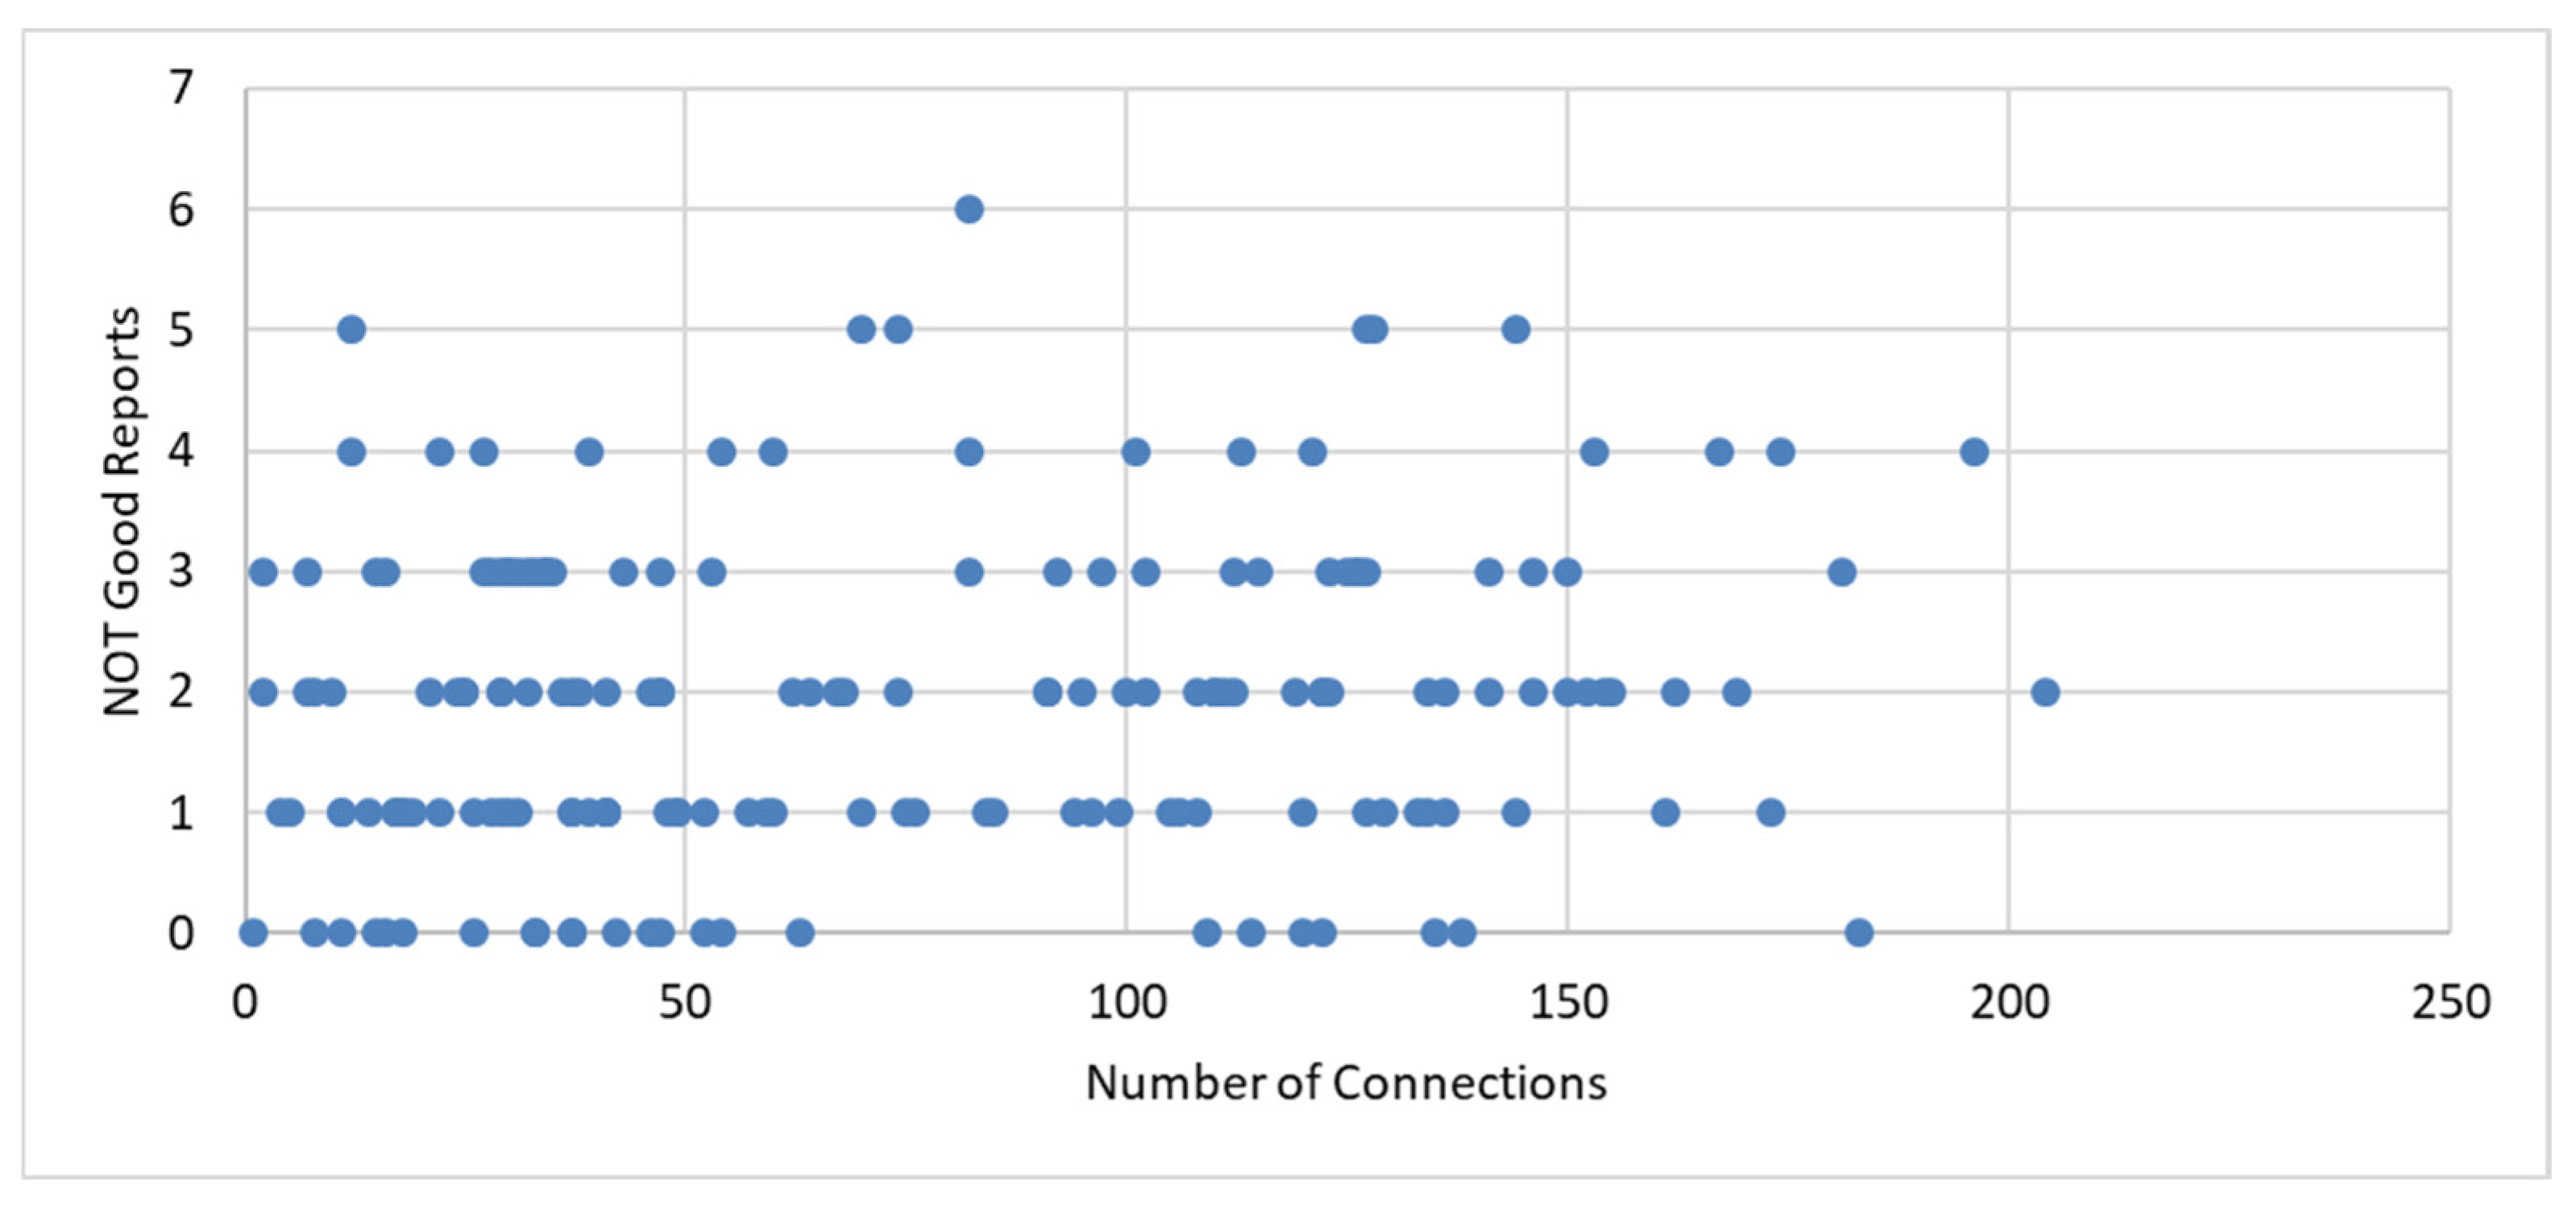
The number of connections before the meter was calculated using ArcMap network analysis. Figure 6 shows a poor correlation (Pearson’s correlation coefficient = 0.167) between this parameter and the water quality service.

Figure 6.
The Number of Connections before a Sampled Water Meter, a Residential Unit, and the Not Good Reports.
Table 5 shows the variation in the water quality parameter with the pipes’ diameter. It shows a net decrease in the poor water quality with the increase in the water diameter, with a negative Pearson’s correlation coefficient of 0.976.
Table 5.
The correlation between the diameter of pipes and the frequency of Not Good SQ reports.
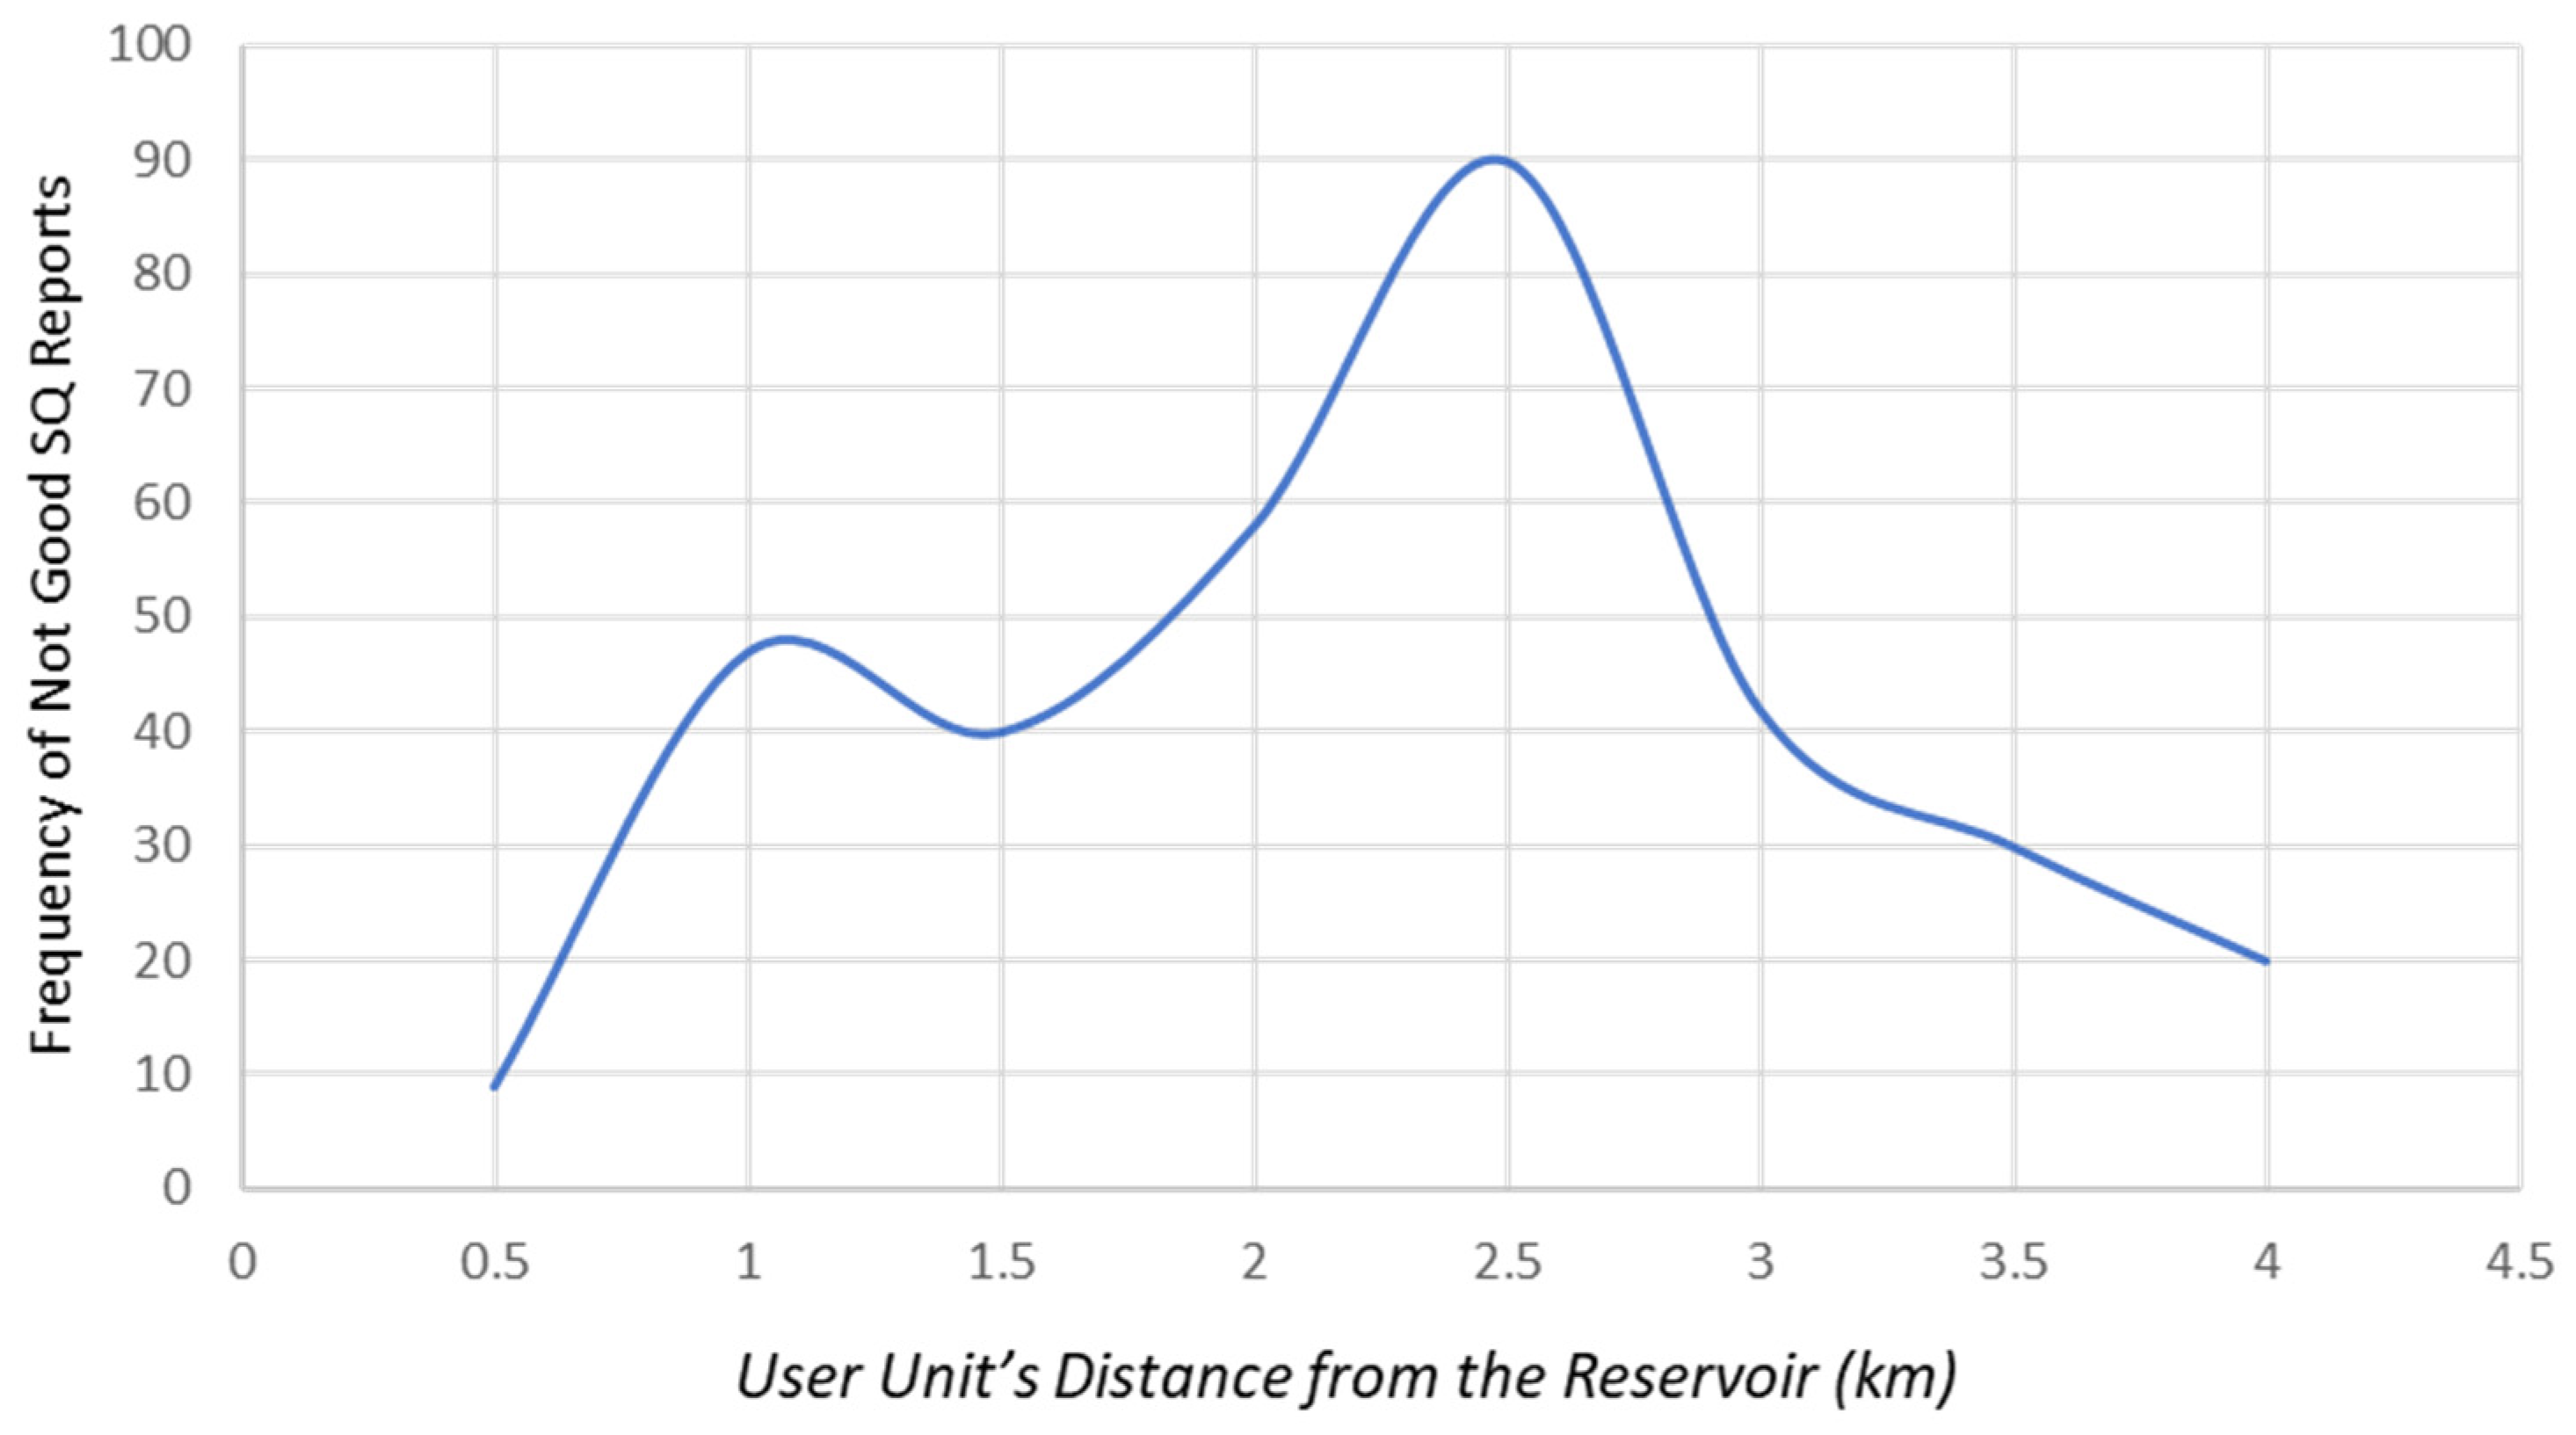
Figure 7 shows that the relationship between the frequency of “Not Good” SQ reports and the user unit’s distance is neither positively direct nor linear. It does not indicate a clear trend between these factors.
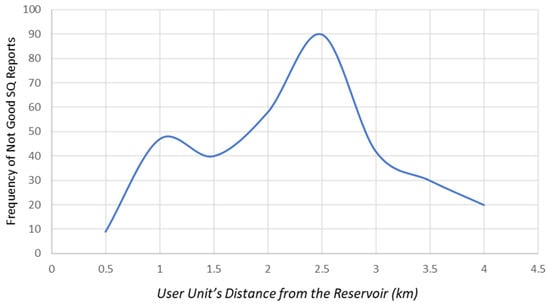
Figure 7.
Not Good SQ Frequency by User Unit’s Distance.
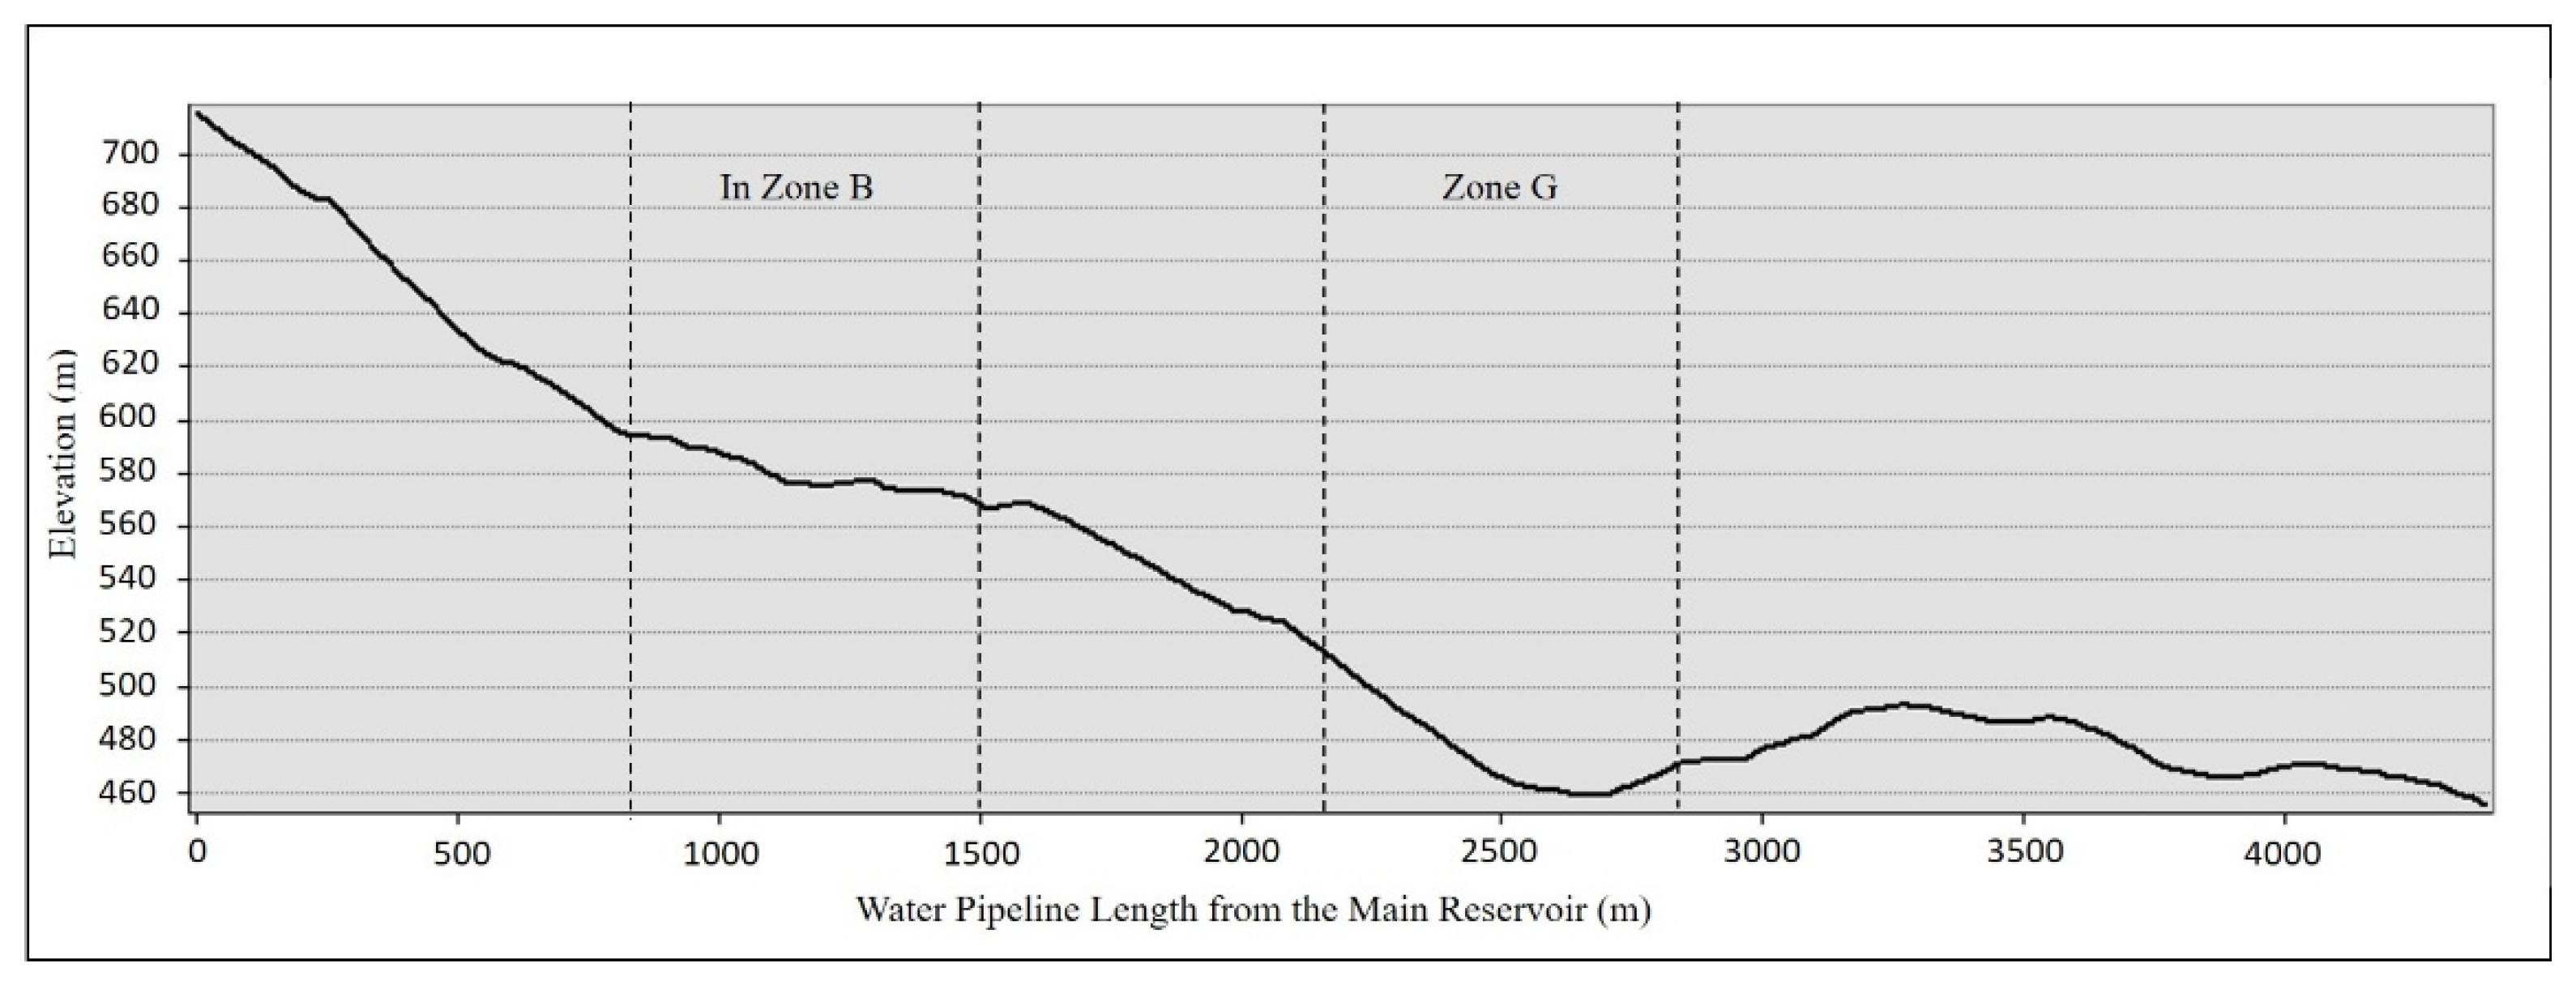
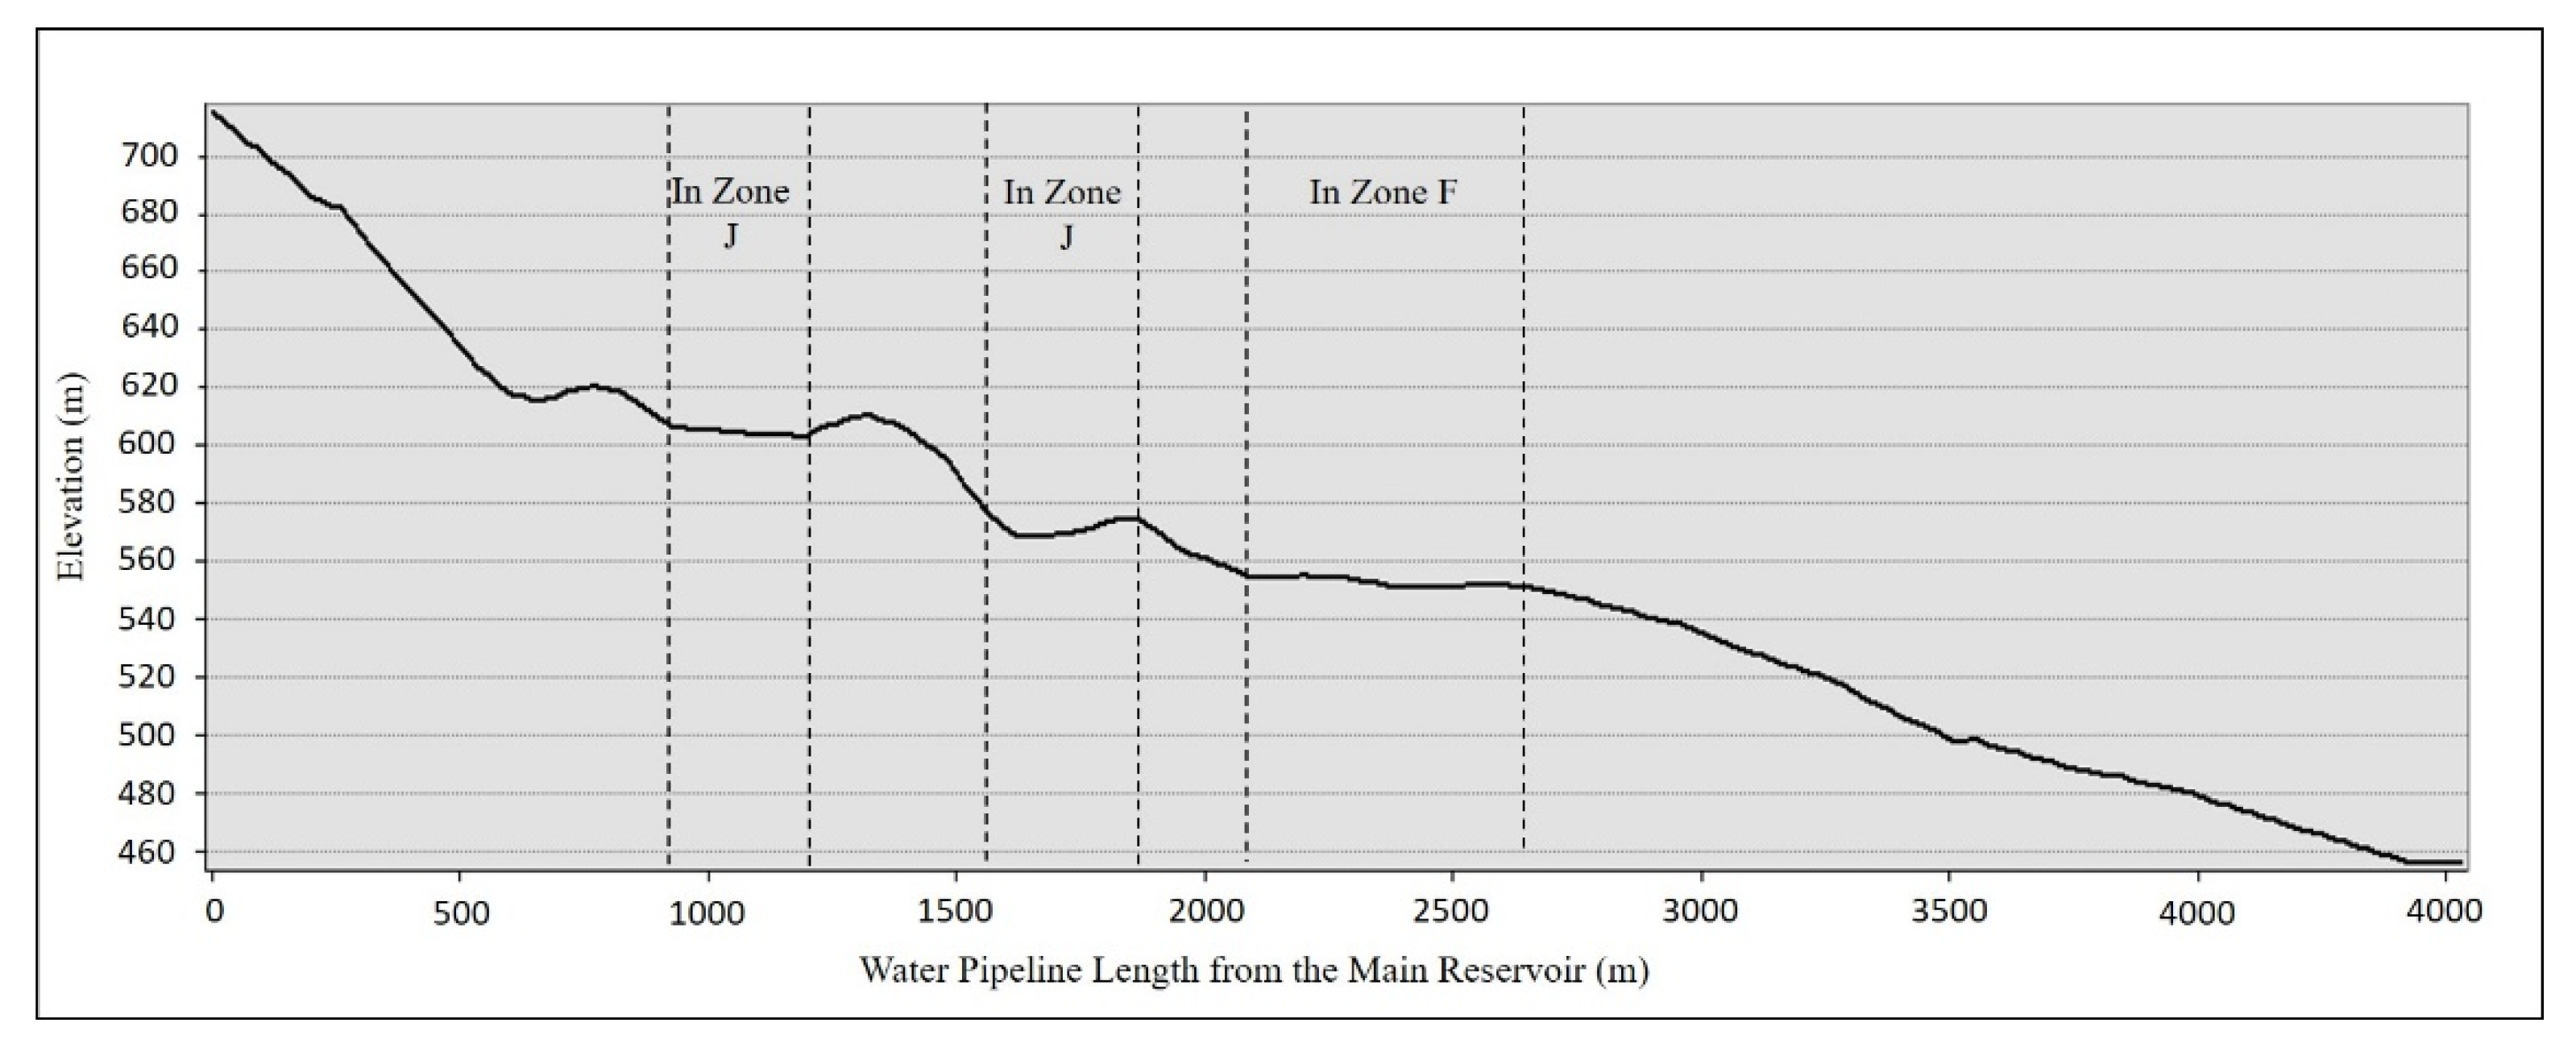
Figure 8 and Figure 9 show the variation in the elevation of the water supply unit with the distance from the water reservoirs. The graphs extend from the main reservoir in the east to the farthest water meter in the west, passing through different zones. All zones along either line are mainly fed by the main reservoir, which feeds the secondary reservoir.
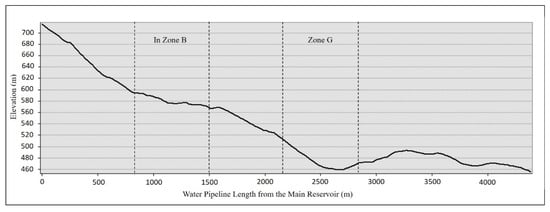
Figure 8.
First Main Water Line Profile.
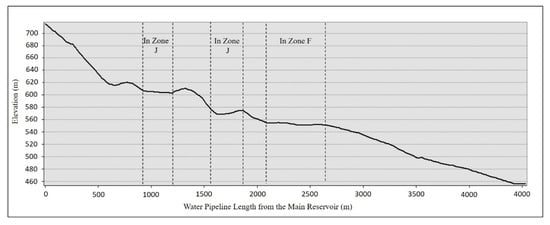
Figure 9.
Second Main Water Line Profile.
These figures indicate that each primary water line includes at least two nearly level segments of varying lengths, all with a maximum slope ratio of 0.02. This issue arises from constructing water lines beneath roads aligned with contour lines, reducing water flow pressure. This explains the high frequency of ‘Not Good’ reports in zones B (Al-Jabal), J (Shouab Abu Ghaith), and F (Al-Swana).
Although zone G (Al-Aqaba) has a high slope ratio, as shown in Figure 8, it also experiences a high frequency of ‘Not Good’ reports. It should be mentioned that the first prime water line in, as shown in Figure 10, has pipe diameters decreasing from 6 inches to only 2. Almost 88% of its length comprises pipes with diameters less than 4 inches. Contrary to this, 79% of the length of the second primary line has pipes with a diameter equal to or greater than 4 inches. However, Figure 10 shows two secondary water lines branching off from the first primary line toward lower elevation zones and before reaching zone G. This situation, with inadequate pipe diameters, elucidates the high frequency of Not Good SQ reports received from zone G. These reports indicate that sampled participants from zone G may experience insufficient water volumes in addition to lower water pressure.
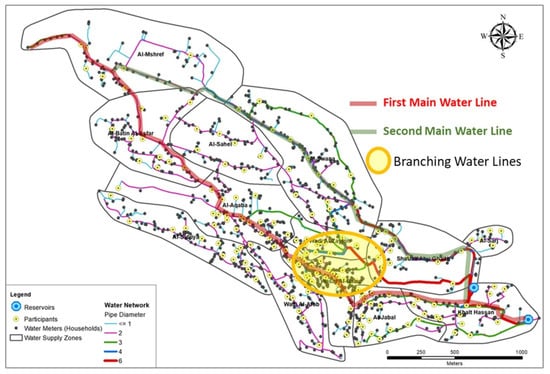
Figure 10.
Main Water Lines and Pipes Diameter.
It is worth highlighting that the findings, particularly those related to zone G, were discussed with the municipality. The municipality acknowledged that the water lines in this area require maintenance and upgrades. Existing pipes need to be replaced with larger-diameter ones, and the branching network needs to be reorganized. Additionally, the municipality has prioritized the maintenance of this line, recognizing its critical role in improving water service quality and ensuring the reliability of the supply network in zone G.
These secondary branches could address network layout deficiencies and improve efficiency. This could be achieved if they function as collector lines, connecting necessary zones with primary line segments with high slope ratios. To avoid adverse results such as those experienced in zone G, increasing the diameter of smaller pipelines in primary lines would be necessary for this enhancement.
This recommendation results from an analysis of data collected from citizens. However, it is worth noting that the goal of this project extends beyond simply deciding where to increase the diameter of pipes. As mentioned above, it aims to involve citizens in real-time monitoring of the water supply system, which is crucial for making rapid decisions in case anomalies appear in water systems lacking a monitoring system. In addition, this study revealed other key factors influencing the water supply quality in Kharas, including the distance from the water tank and the altitude of the user water supply unit. These findings align with those of Mashhadi et al. [41], who noted that infrastructure limitations, such as pipe diameters, critically impact water distribution efficiency.
Furthermore, the study identified that zones with complex topographical features, specifically steep slopes, experienced more frequent interruptions in water supply. Our findings correlate with Strobl et al. [48], Steinke et al. [46], and Maund et al. [47] on the importance of rigorous data quality testing in participatory applications, particularly concerning social factors [25]. Notably, our chi-square test revealed no significant bias based on family affiliations. This suggests that, in Kharas, the participatory approach is less influenced by social dynamics than previously assumed by the municipality.
4. Conclusions
This study underscores the efficacy of participatory science in addressing water supply challenges in water-scarce developing regions. By engaging citizens in data collection and evaluation, valuable ground-level insights into water supply conditions could be obtained, facilitating the identification of operational deficiencies and the optimization of the water distribution system.
This research showed that implementing a participatory platform in Kharas, Palestine, facilitated citizen engagement, overcame a lack of data, and enhanced our understanding of water system dynamics. Spatial and temporal analyses revealed critical determinants of water supply quality, including pipe diameter, water branching density, distance from reservoirs, and terrain characteristics. Areas with narrower pipe diameters exhibited higher incidences of degraded water supply. These findings prompted municipal authorities to prioritize infrastructure upgrades and maintenance in affected zones, illustrating the practical impact of participatory data on decision-making processes.
However, this research encountered the following limitations. First, while participants were engaged in the project conception and data collection stages, they needed more time and resources to discuss the results and analysis. Second, ensuring ongoing participation is a significant challenge in all participatory research.
Future research should focus on (i) investigating the long-term sustainability and scalability of participatory platforms in various socio-economic and geographic contexts, (ii) integrating advanced technologies such as IoT and AI with participatory platforms to enhance smart water management, and (iii) assessing the impact of participatory data on policy-making and water management strategies.
Author Contributions
Conceptualization, M.I., I.S., H.B. and S.S.; methodology, M.I., I.S. and S.S.; software, M.I. and A.D.; validation, I.S., S.S. and H.B.; formal analysis, M.I. and A.D.; writing—review and editing, M.I., I.S. and H.B.; visualization, M.I. and A.D.; supervision, I.S. and H.B. All authors have read and agreed to the published version of the manuscript.
Funding
This research received no external funding.
Data Availability Statement
Data are contained within the article.
Conflicts of Interest
The authors declare no conflicts of interest.
References
- Boretti, A.; Rosa, L. Reassessing the Projections of the World Water Development Report. NPJ Clean Water 2019, 2, 15. [Google Scholar] [CrossRef]
- Chari, R.; Matthews, L.; Blumenthal, M.; Edelman, A.; Jones, T. The Promise of Community Citizen Science; RAND Corporation: Santa Monica, CA, USA, 2017. [Google Scholar]
- Fraisl, D.; Hager, G.; Bedessem, B.; Gold, M.; Hsing, P.-Y.; Danielsen, F.; Hitchcock, C.B.; Hulbert, J.M.; Piera, J.; Spiers, H.; et al. Citizen Science in Environmental and Ecological Sciences. Nat. Rev. Methods Primer 2022, 2, 64. [Google Scholar] [CrossRef]
- Itair, M.; Shahrour, I.; Hijazi, I. The Use of the Smart Technology for Creating an Inclusive Urban Public Space. Smart Cities 2023, 6, 2484–2498. [Google Scholar] [CrossRef]
- Sauermann, H.; Vohland, K.; Antoniou, V.; Balázs, B.; Göbel, C.; Karatzas, K.; Mooney, P.; Perelló, J.; Ponti, M.; Samson, R.; et al. Citizen Science and Sustainability Transitions. Res. Policy 2020, 49, 103978. [Google Scholar] [CrossRef]
- Aboelnga, H.T.; El-Naser, H.; Ribbe, L.; Frechen, F.-B. Assessing Water Security in Water-Scarce Cities: Applying the Integrated Urban Water Security Index (IUWSI) in Madaba, Jordan. Water 2020, 12, 1299. [Google Scholar] [CrossRef]
- Biswas, A.; Tortajada, C. Assessing Global Water Megatrends; Springer: Singapore, 2018; pp. 1–26. ISBN 978-981-10-6694-8. [Google Scholar]
- Enqvist, J.P.; Ziervogel, G. Water Governance and Justice in Cape Town: An Overview. WIREs Water 2019, 6, e1354. [Google Scholar] [CrossRef]
- Imad, H.U.; Akhund, M.A.; Ali, M.; Pathan, A.A.; Ahmed, A. Non-Volumetric Pricing Is a Threat to Water Reserves. Civ. Eng. J. 2019, 5, 422–428. [Google Scholar] [CrossRef]
- Pallavi, S.; Yashas, S.R.; Anilkumar, K.M.; Shahmoradi, B.; Shivaraju, H.P. Comprehensive Understanding of Urban Water Supply Management: Towards Sustainable Water-Socio-Economic-Health-Environment Nexus. Water Resour. Manag. 2021, 35, 315–336. [Google Scholar] [CrossRef]
- Behzadian, K.; Kapelan, Z. Advantages of Integrated and Sustainability Based Assessment for Metabolism Based Strategic Planning of Urban Water Systems. Sci. Total Environ. 2015, 527–528, 220–231. [Google Scholar] [CrossRef] [PubMed]
- Yazdandoost, F.; Yazdani, S.A. A New Integrated Portfolio Based Water-Energy-Environment Nexus in Wetland Catchments. Water Resour. Manag. 2019, 33, 2991–3009. [Google Scholar] [CrossRef]
- Adu-Manu, K.; Tapparello, C.; Heinzelman, W.; Katsriku, F.; Abdulai, J.-D. Water Quality Monitoring Using Wireless Sensor Networks: Current Trends and Future Research Directions. ACM Trans. Sens. Netw. 2017, 13, 1–41. [Google Scholar] [CrossRef]
- Agarwal, R.; Dixit, A.; Karatangi, S.V. Application of IoT in Water Supply Management. In Predictive Analytics; CRC Press: Boca Raton, FL, USA, 2021; ISBN 978-1-00-308317-7. [Google Scholar]
- Wijayanti, Y.; Fittkow, M.; Budihardjo, K.; Purwadi; Setyandito, O. Sustainable Water Management: A Review Study on Integrated Water Supply (Case Study on Special District of Yogyakarta). IOP Conf. Ser. Earth Environ. Sci. 2020, 426, 012056. [Google Scholar] [CrossRef]
- Chan, K.; Schillereff, D.N.; Baas, A.C.; Chadwick, M.A.; Main, B.; Mulligan, M.; O’Shea, F.T.; Pearce, R.; Smith, T.E.; van Soesbergen, A.; et al. Low-Cost Electronic Sensors for Environmental Research: Pitfalls and Opportunities. Prog. Phys. Geogr. Earth Environ. 2021, 45, 305–338. [Google Scholar] [CrossRef]
- Jiménez, A.; LeDeunff, H.; Giné, R.; Sjödin, J.; Cronk, R.; Murad, S.; Takane, M.; Bartram, J. The Enabling Environment for Participation in Water and Sanitation: A Conceptual Framework. Water 2019, 11, 308. [Google Scholar] [CrossRef]
- Cosgrove, W.J.; Loucks, D.P. Water Management: Current and Future Challenges and Research Directions: Water Management Research Challenges. Water Resour. Res. 2015, 51, 4823–4839. [Google Scholar] [CrossRef]
- Shahrour, I.; Xie, X. Role of Internet of Things (IoT) and Crowdsourcing in Smart City Projects. Smart Cities 2021, 4, 1276–1292. [Google Scholar] [CrossRef]
- Freihardt, J. Can Citizen Science Using Social Media Inform Sanitation Planning? J. Environ. Manag. 2020, 259, 110053. [Google Scholar] [CrossRef] [PubMed]
- Herschan, J.; King, R.; Mkandawire, T.; Okurut, K.; Lapworth, D.J.; Malcolm, R.; Pond, K. The Potential for Citizen Science to Improve the Reach of Sanitary Inspections. Resources 2020, 9, 142. [Google Scholar] [CrossRef]
- Corbari, C.; Paciolla, N.; Ben Charfi, I.; Woods, M. Remote Sensing and Citizen Science Supporting Irrigation Monitoring in the Capitanata Irrigation Consortium (Italy). In EGU General Assembly Conference Abstracts; EGU General Assembly: Göttingen, Germany, 2021; pp. 388–408. [Google Scholar] [CrossRef]
- Kelly-Quinn, M.; Biggs, J.N.; Brooks, S.; Fortuño, P.; Hegarty, S.; Jones, J.I.; Regan, F. Opportunities, Approaches and Challenges to the Engagement of Citizens in Filling Small Water Body Data Gaps. Hydrobiologia 2022, 850, 3419–3439. [Google Scholar] [CrossRef]
- McKinley, D.C.; Miller-Rushing, A.J.; Ballard, H.L.; Bonney, R.; Brown, H.; Cook-Patton, S.C.; Evans, D.M.; French, R.A.; Parrish, J.K.; Phillips, T.B.; et al. Citizen Science Can Improve Conservation Science, Natural Resource Management, and Environmental Protection. Biol. Conserv. 2017, 208, 15–28. [Google Scholar] [CrossRef]
- Nardi, F.; Cudennec, C.; Abrate, T.; Allouch, C.; Annis, A.; Assumpção, T.; Aubert, A.H.; Bérod, D.; Braccini, A.M.; Buytaert, W.; et al. Citizens AND HYdrology (CANDHY): Conceptualizing a Transdisciplinary Framework for Citizen Science Addressing Hydrological Challenges. Hydrol. Sci. J. 2021, 67, 2534–2551. [Google Scholar] [CrossRef]
- Babiso, W.Z.; Ayano, K.K.; Haile, A.T.; Keche, D.D.; Acharya, K.; Werner, D. Citizen Science for Water Quality Monitoring in the Meki River, Ethiopia: Quality Assurance and Comparison with Conventional Methods. Water 2023, 15, 238. [Google Scholar] [CrossRef]
- Buytaert, W.; Dewulf, A.; De Bièvre, B.; Clark, J.; Hannah, D.M. Citizen Science for Water Resources Management: Toward Polycentric Monitoring and Governance? J. Water Resour. Plan. Manag. 2016, 142, 01816002. [Google Scholar] [CrossRef]
- Van Leeuwen, K.; Hofman, J.; Driessen, P.P.J.; Frijns, J. The Challenges of Water Management and Governance in Cities. Water 2019, 11, 1180. [Google Scholar] [CrossRef]
- Pandeya, B.; Uprety, M.; Paul, J.D.; Sharma, R.R.; Dugar, S.; Buytaert, W. Mitigating Flood Risk Using Low-Cost Sensors and Citizen Science: A Proof-of-Concept Study from Western Nepal. J. Flood Risk Manag. 2021, 14, e12675. [Google Scholar] [CrossRef]
- Brouwer, S.; Van der Wielen, P.W.J.J.; Schriks, M.; Claassen, M.; Frijns, J. Public Participation in Science: The Future and Value of Citizen Science in the Drinking Water Research. Water 2018, 10, 284. [Google Scholar] [CrossRef]
- George, G.; Menon, N.N.; Abdulaziz, A.; Brewin, R.J.W.; Pranav, P.; Gopalakrishnan, A.; Mini, K.G.; Kuriakose, S.; Sathyendranath, S.; Platt, T. Citizen Scientists Contribute to Real-Time Monitoring of Lake Water Quality Using 3D Printed Mini Secchi Disks. Front. Water 2021, 3, 662142. [Google Scholar] [CrossRef]
- Cottam, D.; McGuire, C.; Mossop, D.; Davis, G.; Donlen, J.; Friend, K.; Lewis, B.; Boucher, E.; Kirubakaran, H.; Goulding, R.; et al. Drain Detectives: Lessons Learned from Citizen Science Monitoring of Beach Drains. Citiz. Sci. Theory Pract. 2021, 6, 20. [Google Scholar] [CrossRef]
- Itair, M.; Hijazi, I.; Mansour, S.; Shahrour, I. Empowering Sustainability Advancement in Urban Public Spaces Through Low-Cost Technology and Citizen Engagement. In Proceedings of the Innovations in Smart Cities Applications Volume 7; Ben Ahmed, M., Boudhir, A.A., El Meouche, R., Karaș, İ.R., Eds.; Springer Nature: Cham, Switzerland, 2024; pp. 292–299. [Google Scholar]
- Pejovic, V.; Skarlatidou, A. Understanding Interaction Design Challenges in Mobile Extreme Citizen Science. Int. J. Hum. Comput. Interact. 2020, 36, 251–270. [Google Scholar] [CrossRef]
- Aljer, A.; Itair, M.; Akil, M.; Sharour, I. Knowledge Infrastructure Data Wizard (KIDW): A Cooperative Approach for Data Management and Knowledge Dissemination. In Proceedings of the Innovations in Smart Cities Applications Volume 7; Ben Ahmed, M., Boudhir, A.A., El Meouche, R., Karaș, İ.R., Eds.; Springer Nature: Cham, Switzerland, 2024; pp. 34–43. [Google Scholar]
- Beck, S.F.; Abualdenien, J.; Hijazi, I.H.; Borrmann, A.; Kolbe, T.H. Analyzing Contextual Linking of Heterogeneous Information Models from the Domains BIM and UIM. ISPRS Int. J. Geo-Inf. 2021, 10, 807. [Google Scholar] [CrossRef]
- Mansour, S.; Sassine, R.; Guibert, S. Leveraging Diverse Data Sources for ESTP Campus Digital Twin Development: Methodology and Implementation. In Proceedings of the Innovations in Smart Cities Applications Volume 7; Ben Ahmed, M., Boudhir, A.A., El Meouche, R., Karaș, İ.R., Eds.; Springer Nature: Cham, Switzerland, 2024; pp. 243–257. [Google Scholar]
- Zhang, Z.; Zeng, Y.; Huang, Z.; Liu, J.; Yang, L. Multi-Source Data Fusion and Hydrodynamics for Urban Waterlogging Risk Identification. Int. J. Environ. Res. Public Health 2023, 20, 2528. [Google Scholar] [CrossRef] [PubMed]
- Jabari, S.; Shahrour, I.; El Khattabi, J. Assessment of the Urban Water Security in a Severe Water Stress Area–Application to Palestinian Cities. Water 2020, 12, 2060. [Google Scholar] [CrossRef]
- Requier, F.; Andersson, G.; Oddi, F.; Garibaldi, L. Citizen Science in Developing Countries: How to Improve Volunteer Participation. Front. Ecol. Environ. 2020, 18, 101–108. [Google Scholar] [CrossRef]
- Mashhadi, N.; Shahrour, I.; Attoue, N.; El Khattabi, J.; Aljer, A. Use of Machine Learning for Leak Detection and Localization in Water Distribution Systems. Smart Cities 2021, 4, 1293–1315. [Google Scholar] [CrossRef]
- Cornish, F.; Breton, N.; Moreno-Tabarez, U.; Delgado, J.; Rua, M.; de-Graft Aikins, A.; Hodgetts, D. Participatory Action Research. Nat. Rev. Methods Primer 2023, 3, 1–14. [Google Scholar] [CrossRef]
- Pocock, M.J.O.; Chapman, D.S.; Sheppard, L.J.; Roy, H.E. Choosing and Using Citizen Science: A Guide to When and How to Use Citizen Science to Monitor Biodiversity and the Environment; NERC/Centre for Ecology & Hydrology: Oxford, UK, 2015; p. 24. [Google Scholar]
- Pocock, M.J.O.; Roy, H.E.; August, T.; Kuria, A.; Barasa, F.; Bett, J.; Githiru, M.; Kairo, J.; Kimani, J.; Kinuthia, W.; et al. Developing the Global Potential of Citizen Science: Assessing Opportunities That Benefit People, Society and the Environment in East Africa. J. Appl. Ecol. 2019, 56, 274–281. [Google Scholar] [CrossRef]
- Shirk, J.L.; Ballard, H.L.; Wilderman, C.C.; Phillips, T.; Wiggins, A.; Jordan, R.; McCallie, E.; Minarchek, M.; Lewenstein, B.V.; Krasny, M.E.; et al. Public Participation in Scientific Research: A Framework for Deliberate Design. Ecol. Soc. 2012, 17, 15–28. [Google Scholar] [CrossRef]
- Steinke, J.; van Etten, J.; Zelan, P.M. The Accuracy of Farmer-Generated Data in an Agricultural Citizen Science Methodology. Agron. Sustain. Dev. 2017, 37, 32. [Google Scholar] [CrossRef]
- Maund, P.R.; Bentley, J.W.; Austen, G.E.; Irvine, K.N.; Fish, R.; Dallimer, M.; Davies, Z.G. The Features and Processes Underpinning High-Quality Data Generation in Participatory Research and Engagement Activities. Methods Ecol. Evol. 2022, 13, 68–76. [Google Scholar] [CrossRef] [PubMed]
- Strobl, B.; Etter, S.; van Meerveld, I.; Seibert, J. Accuracy of Crowdsourced Streamflow and Stream Level Class Estimates. Hydrol. Sci. J. 2020, 65, 823–841. [Google Scholar] [CrossRef]

Disclaimer/Publisher’s Note: The statements, opinions and data contained in all publications are solely those of the individual author(s) and contributor(s) and not of MDPI and/or the editor(s). MDPI and/or the editor(s) disclaim responsibility for any injury to people or property resulting from any ideas, methods, instructions or products referred to in the content. |
© 2024 by the authors. Licensee MDPI, Basel, Switzerland. This article is an open access article distributed under the terms and conditions of the Creative Commons Attribution (CC BY) license (https://creativecommons.org/licenses/by/4.0/).