Abstract
In the context of global warming, the acceleration of the water cycle increases the risk of meteorological drought (MD) and hydrological drought (HD) in the arid region of Northwest China. The Manas River Basin is a typical agricultural oasis and the largest oasis farming area in Xinjiang, Northwest China. Droughts in this basin have significant implications for both agricultural production and the livelihoods of inhabitants. To evaluate the MD and HD and provide information for drought relief in the MRB, the standardized precipitation evapotranspiration index (SPEI) and standardized runoff index (SRI) were calculated using long-term rainfall and runoff data. Subsequently, combined with ArcGIS 10.3 software and the trend analysis method, the SPEI and SRI characteristics were evaluated at different time scales (1-, 3-, 6-, and 12-month). There were three main findings. First, both MD and HD were alleviated, with significantly more HD alleviation. MDs in spring and autumn exhibited a trend of aggravation. The SRIs in summer, autumn, and winter increased significantly at a confidence level of p < 0.01, with an insignificant decline in spring. In the 2010s, the frequency of light drought of MD was stable at 10% to 20%, while severe and extreme droughts increased. The frequency of HDs has decreased since the 1990s. Second, on annual and seasonal scales, MDs occurred mainly as light and moderate droughts. The highest frequency of MD was 24% of moderate droughts in winter. Spatially, the northern region of the MRB was characterized by more frequent light and extreme droughts. Third, runoff in the Manas River Basin increased significantly during the 1990s, which may have been related to the acceleration of glacial retreat in the Tianshan Mountains. This study can effectively reveal the changes in meteorological and hydrological drought in NWC and provide the basis for risk decision-making and management for watershed managers.
1. Introduction
Drought is a disaster with far-reaching effects and prolonged durations worldwide. Accurately monitoring a drought is challenging because of its repetitive nature [1,2]. This calamity damages the natural environment, including vegetation loss, land desertification, and oasis shrinkage, and affects the development of human societies due to a lack of water resources, crop reduction, and resulting sandstorms [3,4]. A highlight of the sixth report of the Intergovernmental Panel on Climate Change [5] was that global warming has led to an increased atmospheric evaporation demand and intensity of drought events. As the temperature on land increases more than that of the ocean, the relative humidity near the surface decreases, resulting in regional drought. Water resources are indispensable for sustainable economic development [6]. Recent studies have emphasized that extreme drought events caused by climate change threaten the water balance in various regions, resulting in the drying of rivers, declines in lake water levels, restriction of water use, and destruction of ecosystems [7,8]. In California, the worst drought in a millennium [9] has resulted in the death of large areas of coniferous forest. Water shortages in the arid and semi-arid areas of Northwest China have resulted in vegetation degradation and severe desertification [10]. Tropical plateau glaciers in East Africa have receded [11], and hydropower generation in West African rivers has decreased. Droughts have unpredictable consequences for both humans and nature. Therefore, to mitigate the consequences of drought, it is necessary to investigate the temporal and spatial variations in drought conditions. This knowledge can provide guidance for drought relief efforts and significantly impact agricultural production, social life, and the environment [12,13].
Drought is a serious problem that affects many global regions. Three types of droughts have been studied: meteorological, agricultural, and hydrological [14]. Meteorological drought is the cause of almost all droughts. This drought occurs when precipitation is below the normal threshold for an extended period. Agricultural drought occurs when soil water and rainfall are insufficient to maintain crop growth during the growing season. The occurrence of hydrological drought is related to surface water and groundwater and is caused by a lack of effluent, which is closely linked to the water cycle [15,16]. Generally, meteorological droughts have a significant impact on large regional scales [17]. As rainfall deficits and evaporation rates increase, river runoff and groundwater recharge decrease, leading to hydrological droughts. Several scholars have conducted extensive research on meteorological and hydrological droughts. These studies include the use of Pearson’s linear or copula function-based conditional probability nonlinear methods [18] to calculate the drought propagation time, trigger the threshold of meteorological drought to hydrological drought propagation in water-limited areas [19], and determine the relationship between meteorological and hydrological droughts based on wavelet analysis [20].
Data obtained from meteorological stations are characterized by long time series and high accuracy. Numerous researchers have utilized meteorological station data to calculate meteorological drought indices such as the standardized precipitation index (SPI), Palmer drought severity index (PDSI), and standardized precipitation evapotranspiration index (SPEI). Among these indices, the SPEI is widely used in drought assessment because it incorporates the advantages of the multiple time scales of the SPI and the sensitivity to evapotranspiration of the PDSI [21]. The SPEI is particularly useful in arid and semi-arid regions. The standardized runoff index (SRI), which is based on runoff volume, can be used to monitor and evaluate hydrological droughts and determine the drought status in a basin. To ensure efficient use and management of water resources, it is essential to study the characteristics of meteorological and hydrological droughts. Muhammad et al. (2020) used the SPEI and SRI to predict the impact of climate change on the propagation of meteorological to hydrological drought [22]. The authors found that the propagation probability of meteorological to hydrological drought in Korea has increased significantly under the influence of climate change. Using the SPEI and SRI, Li et al. (2023) analyzed the spatiotemporal variations of meteorological and hydrological droughts in various regions, including the upper reaches of the Yangtze River, over the past 120 years [23]. The authors reported that the two indices are effective in identifying relatively continuous dry and wet periods. The collective findings indicate the reliability of SPEI and SRI for assessing meteorological and hydrological drought conditions.
The Manas River Basin (MRB) is the largest oasis farming area in Xinjiang [24], the fourth largest irrigated agricultural region in China, and an essential part of the local economic belt. However, in recent years, the basin has been affected by the increased frequency of drought events due to global warming. This has restricted water resource usage, created ecological security barriers, and hindered socioeconomic development in the region. Water resources are the foundation of production and life in the MRB. In this context, it is essential to understand how drought conditions in the MRB are changing. Meteorological and hydrological droughts in the MRB have not been investigated. This study aimed to analyze the drought situation in the MRB using the SPEI and SRI, with the ultimate goal of guiding production and life in the river basin. The study objectives were to clarify the temporal and spatial evolution characteristics of meteorological and hydrological droughts, periodic characteristics of the meteorological and hydrological droughts, and runoff trends in the MRB. By gaining a better understanding of the drought situation in the MRB, it will be possible to enhance the region’s ability to prevent and manage drought disasters.
2. Materials and Methods
2.1. Study Area
The MRB is located in the Xinjiang territory of China between 43°27′~45°21′ N and 85°01′~86°32′ E (Figure 1). This is an arid region of Northwest China on the southern edge of the Junggar Basin. The landscape of the basin inclines from southeast to northwest, with the highest elevation at 5145 m and the lowest at 241 m. Its mountainous oasis plains and desert areas constitute a “mountain-oasis-desert” topographical structure. Rainfall in the basin is minimal, occurs mainly during summer, and is unevenly distributed in both time and space. Evaporation is high, and evapotranspiration is much greater than rainfall. The study area has a typical continental temperate climate.

Figure 1.
The Manas River Basin study area.
2.2. Data Sources and Processing
Meteorological data from 1970 to 2019, including the monthly average temperature and rainfall, were from 13 meteorological stations in and around the MRB from 1970 to 2019. The data were obtained from the Resources and Environment Science and Data Center (https://www.resdc.cn/ accessed on 29 November 2022). Hydrological data were obtained from the Kenswat Station, a control hydrological station for the drainage pass. Because the construction of the reservoir began in 2013, the discharge volume was not the natural discharge volume [25] but rather an artificially controlled discharge volume, which was unsuitable for analysis. Therefore, the monthly runoff volume from 1970 to 2012 was selected for the analyses. Meteorological and hydrological data were processed using the SPEI package in R to obtain the SPEI and SRI, which represent the meteorological and hydrological droughts, respectively. In this study, Origin2021 and ArcMap10.3 were used to visualize all the processed data. This study used the data processed in this manner to examine the meteorological and hydrological drought conditions in the region.
2.3. Drought Indices
The Thornthwaite equation [26] was used to calculate the SPEI with multi-time scale characteristics after the standardization of precipitation and evapotranspiration. First, the TH equation calculates the potential evapotranspiration (PET) of the basin using three general methods: the Penman–Monteith (PM), Thornthwaite (TW), and Hargreaves–Samani (HS) equations. However, the PM equation requires many parameters, such as temperature, wind speed, relative humidity, and net radiation, which are not readily available because of the limited number of meteorological stations in Xinjiang and their uneven spatial distribution. The HS equation only requires the highest and lowest temperatures. However, it has limitations under certain weather conditions, such as low humidity or strong winds (u > 3 m/s), which can result in inaccurate evapotranspiration (ET0) estimates. In contrast, under conditions of high relative humidity or a low evapotranspiration rate, the ET0 estimate can be relatively high, which can cause errors in the calculation results. Previous researchers have calibrated HS models. However, these calibrations were site-specific and could not be extrapolated to locations with completely different weather conditions [27,28]. Therefore, the TH equation was chosen to calculate the PET in this study. Precipitation data were standardized to represent the water deficit or surplus and were then accumulated into precipitation states at different time scales. Finally, a logarithmic logistic probability distribution was used to fit the sequence data, and the SPEI values at the different time scales were calculated. A negative SPEI value represents a water deficit, whereas a positive value represents a water surplus. The calculation method for the SRI was similar to that for the SPI [29]. Precipitation data replaced the runoff data, and the runoff probability distribution model was selected for normal standardized calculations, which showed short- and long-term drought characteristics. A negative SRI value indicates a lower runoff level, whereas a positive value indicates higher runoff levels. The drought classifications of both the SPEI and SRI are listed in Table 1.

Table 1.
Classification schemes of drought intensity.
2.4. Trend and Mutation Analyses
Domestic and foreign scholars have extensively researched the trend changes in hydrometeorological time series data. The research methods are mainly divided into parametric and non-parametric test methods. Although parametric methods are typically more efficient than non-parametric techniques, they are usually strict with data that should be distributed, continuous, and independent. Conversely, if the hydrological or meteorological time series do not conform to the normality, independence, and linearity assumptions of the parametric test, non-parametric techniques are employed.
This study utilized the Mann–Kendall non-parametric trend analysis method [30,31] to investigate the meteorological and hydrological drought conditions in the MRB. This method, recommended by the World Meteorological Organization for meteorological research, is widely used to statistically analyze and assess hydrological series trends without requiring adherence to a specific distribution. The Mann–Kendall test features a high level of quantization and is highly effective in determining the direction of sequence changes. Under the observation background of long-term meteorological data, the Mann–Kendall test can also determine whether there is an abrupt climate change in the climate series. If such a change is apparent, the mutation occurrence time is determined. When the UF and UB crossing points appear, and the crossing points are between the critical lines, the corresponding moment of the crossing point is the mutation start time. If the value of the UF or UB statistic is >0, the series exhibits an upward trend. If the value is <0, it indicates a downward trend.
2.5. ArcGIS Spatial Interpolation
The inverse distance weight interpolation (IDW) is based on the basic assumption of “close similarity” in the first law of geography [32]. IDW estimates the pixel value by calculating the average value of sample data points near the pixels to be processed. The closer the data point is to the center of the pixel being estimated, the greater its influence or weight in the average calculation, resulting in a higher degree of similarity as the distance between the points decreases. As a reliable method, IDW combines the advantages of the Tyson polygon adjacent-point method and the trend analysis gradient method while simultaneously accounting for the spatial distribution of regional connections between various factors [33]. This straightforward approach has proven useful in data processing and is well-suited for addressing spatial distribution challenges. In this study, we employed IDW to interpolate the frequency of meteorological drought and investigate the spatial distribution characteristics of drought.
2.6. Run Theory
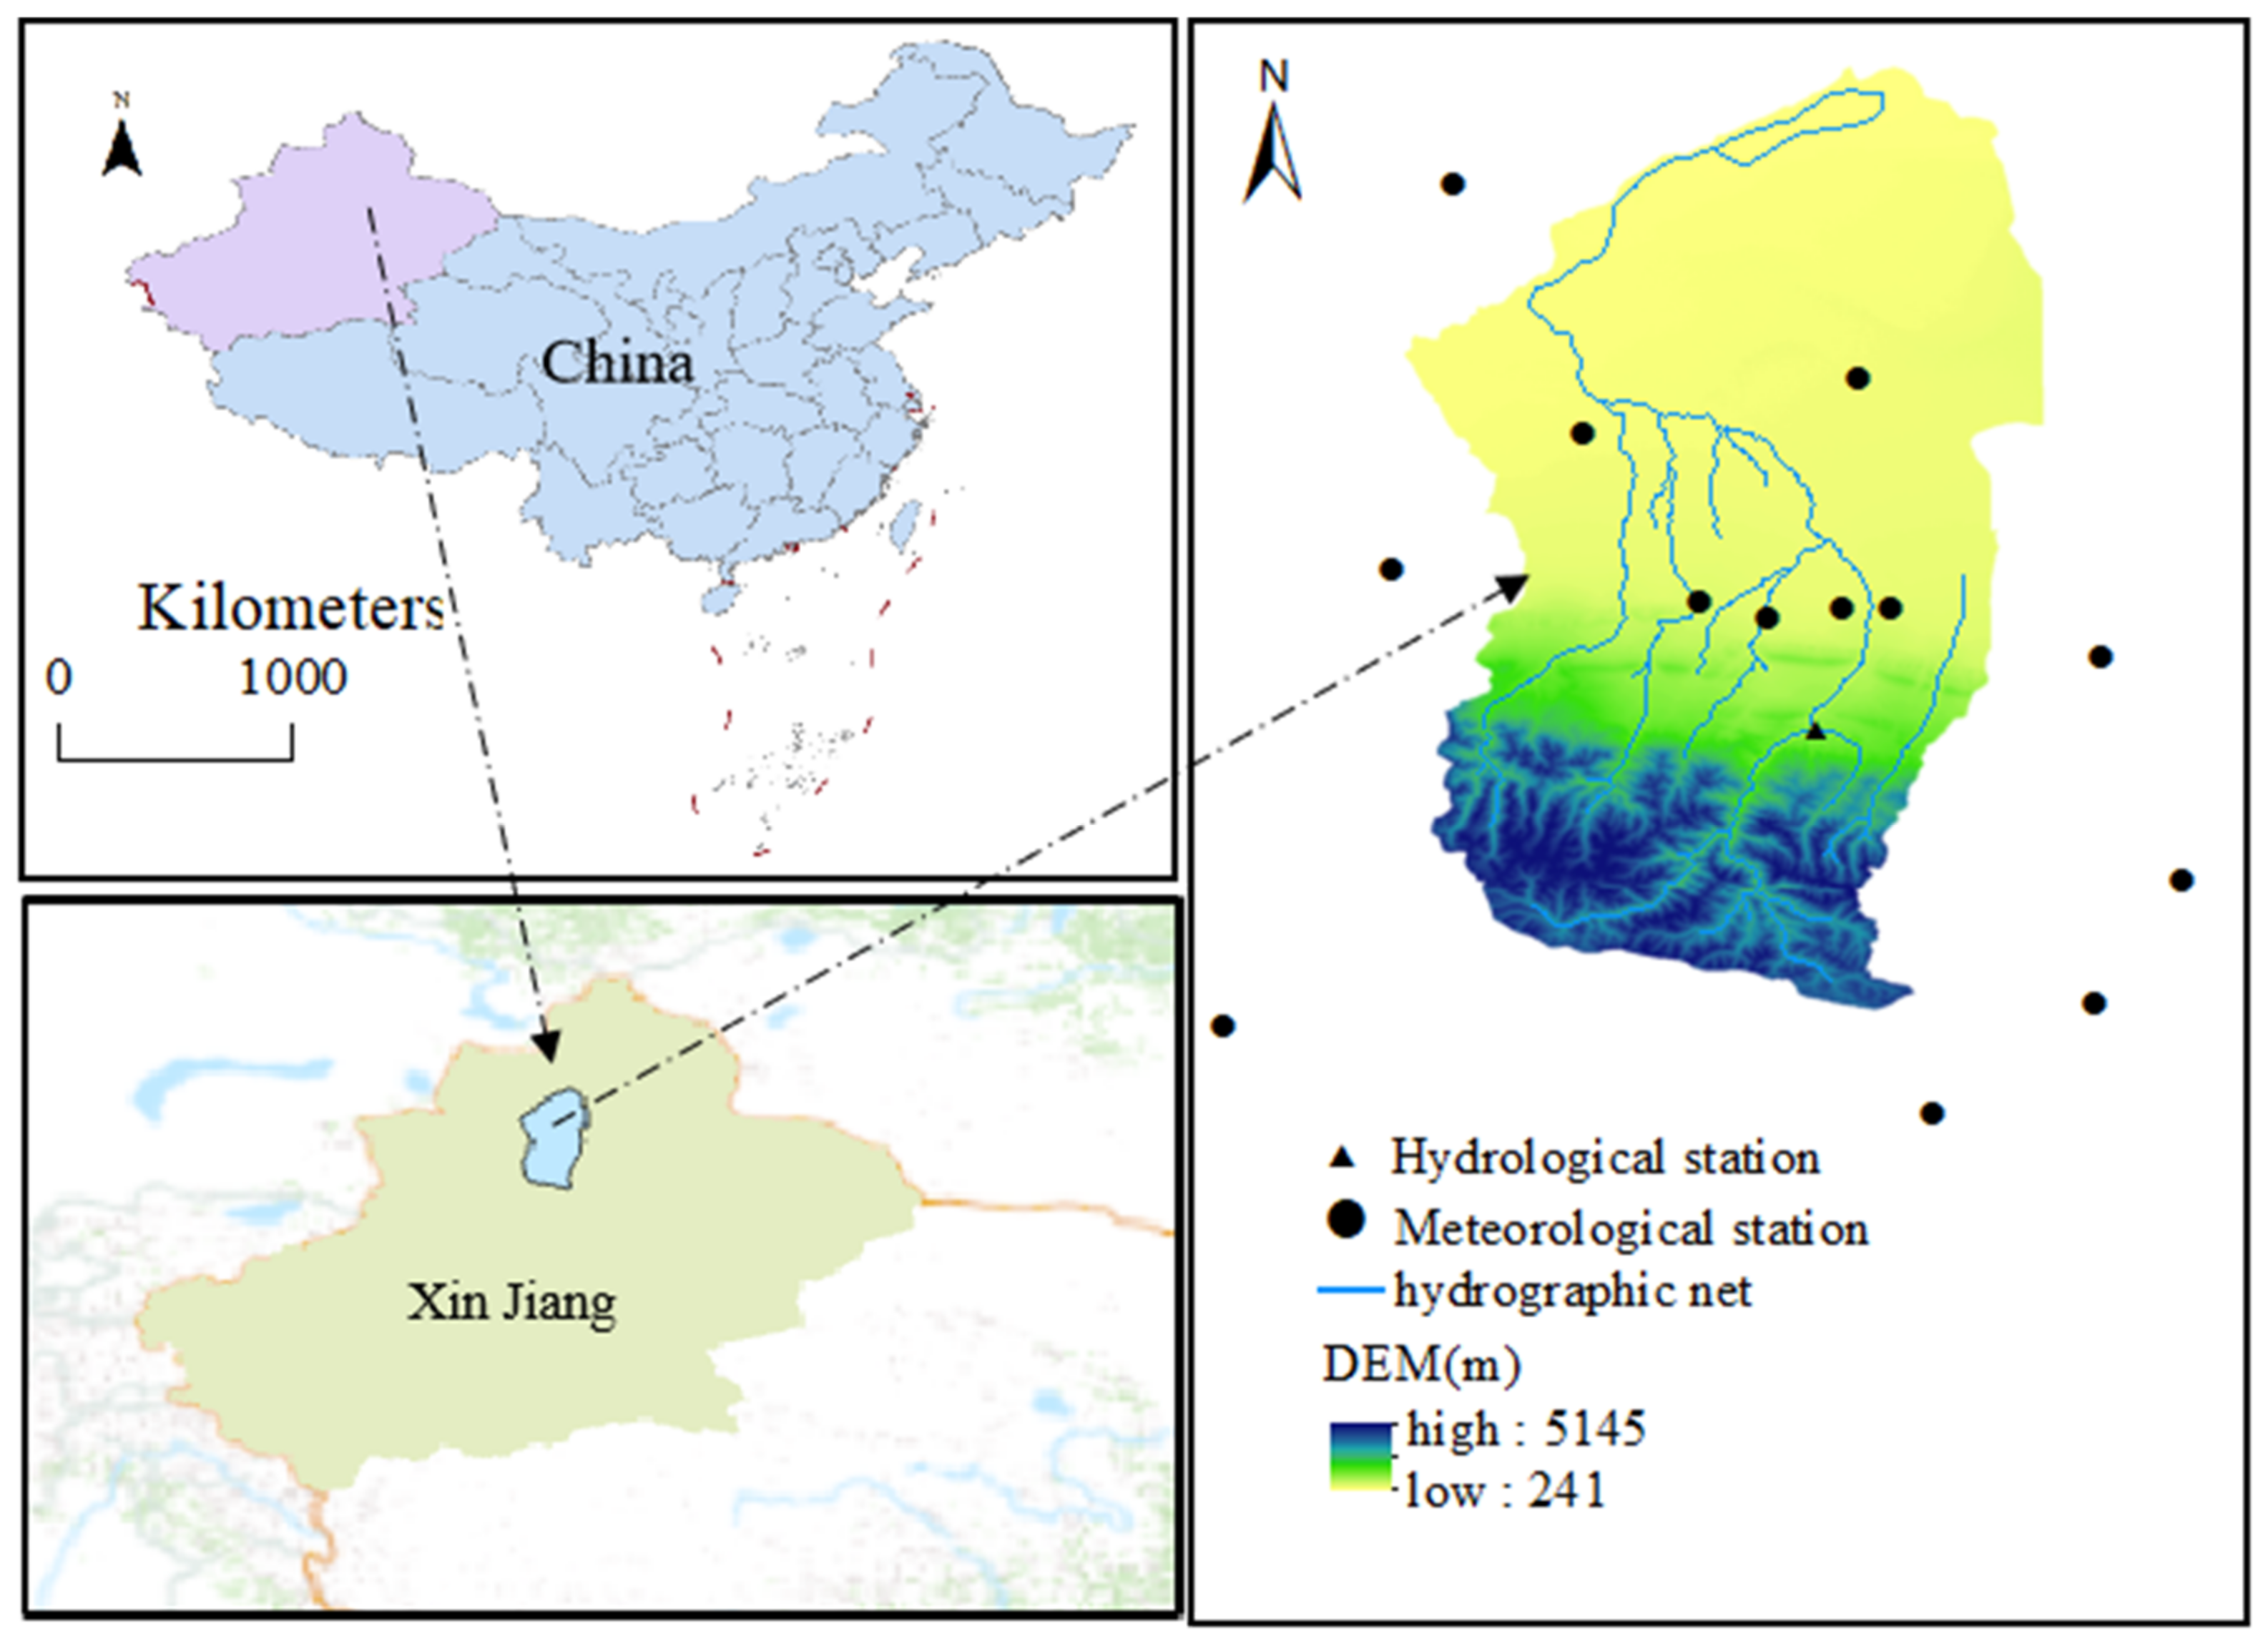
To identify the meteorological and hydrological droughts, we used the run-course theory [34]. The identification method is shown in Figure 2. An appropriate drought index was selected as the threshold values, R0, R1, and R2, based on the type of drought. A drought event was initially identified when the drought index was below R1 for a specified period. Drought events lasting only one month and with a drought index above R2 were excluded from the identified drought events. When the interval between two drought events was one month and the drought index for that month was below R0, the two drought events were combined. The duration of the drought event identified by the run-course theory is the length of the drought. The intensity of the drought event was represented by the absolute value of the sum of the drought index values below the threshold R1 for each month of the drought event. In this study, the values at which the drought index fell below 0, indicating light drought and moderate drought, were selected as the threshold values. Therefore, R0, R1, and R2 were equivalent to 0, −0.5, and −1, respectively.
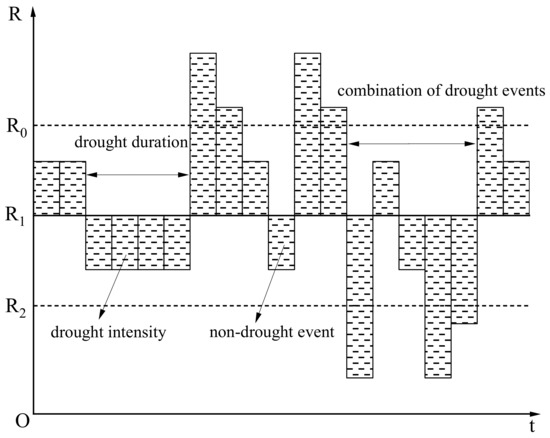
Figure 2.
Schematic diagram of drought events identification, pooling, and exclusion.
3. Results
3.1. Temporal Evolution Characteristics of Meteorological and Hydrological Elements
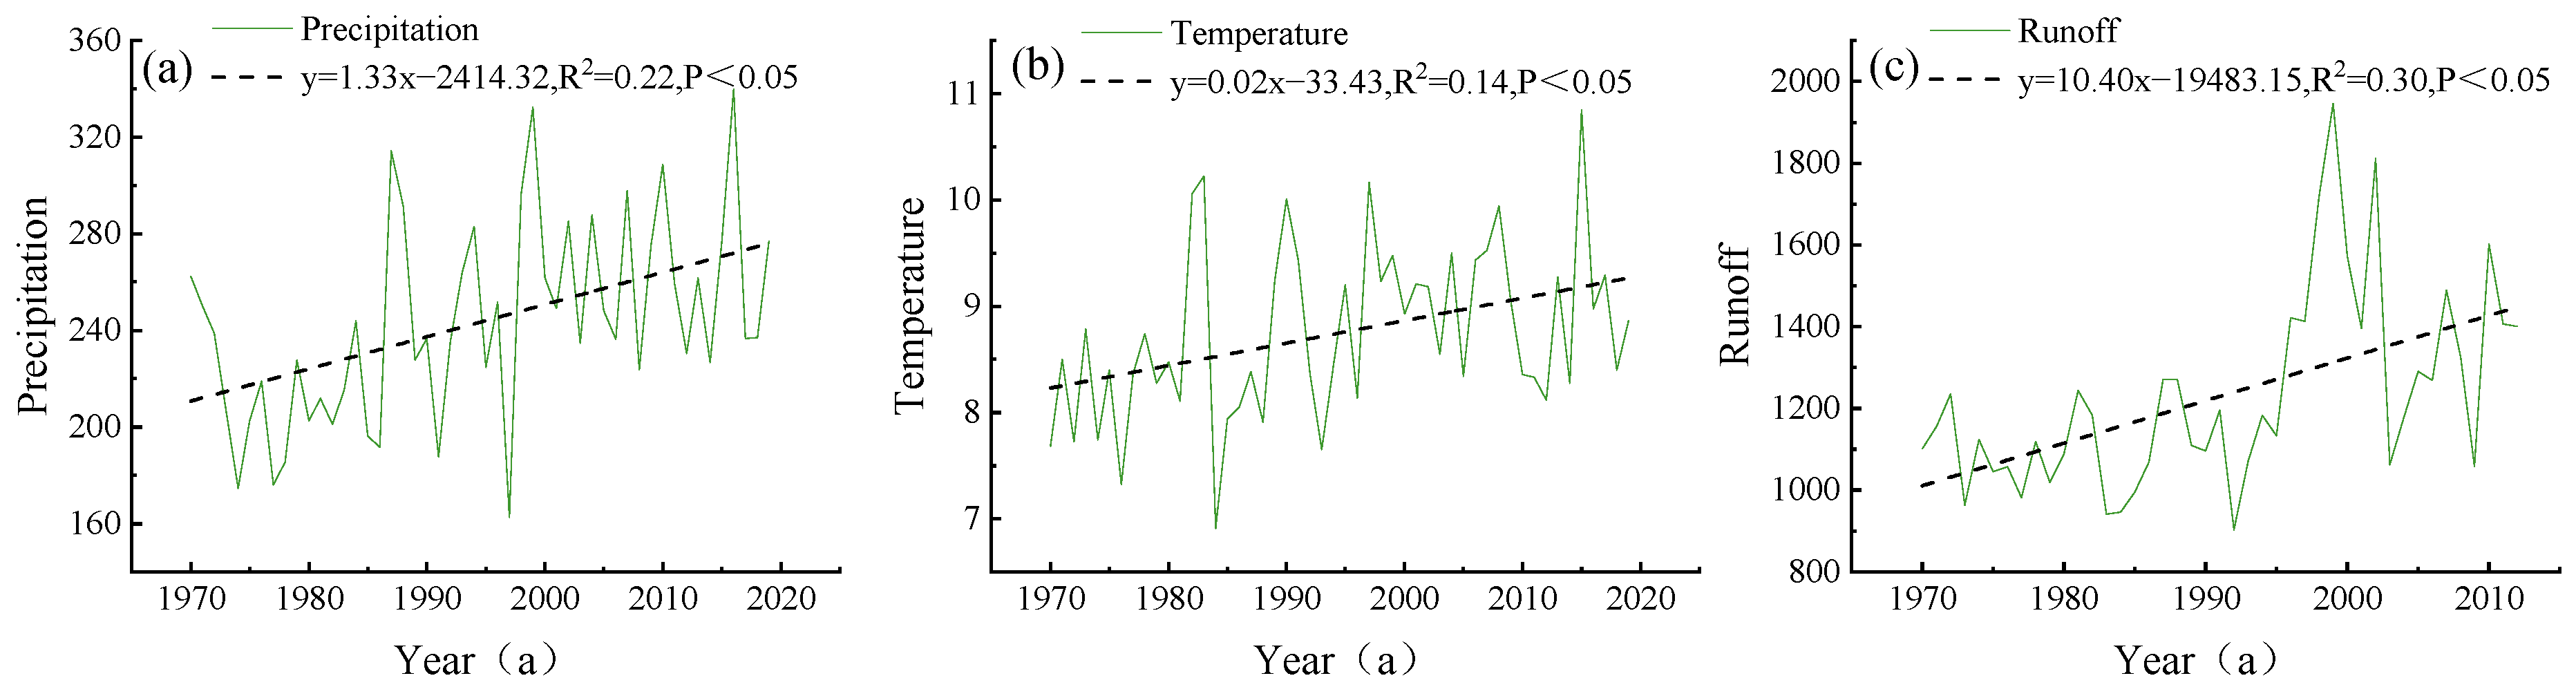
To analyze the interannual variation trends of precipitation, as well as the average temperature in the MRB and discharge of the Kenswart Hydrological Station, meteorological and hydrological elements were selected for linear fitting (Figure 3). The figure illustrates the multiyear values of the three factors. According to the results, both temperature and rainfall passed the significance test of 0.05, whereas rainfall and runoff passed the significance test of 0.01. In the past 50 years, the rainfall in the MRB has increased significantly (Zs = 3.16, p < 0.01), with an average of 243.35 mm—increasing by approximately 13.3 mm every 10a—while the average temperature also exhibited a significant rise (Zs = 2.19, p = 0.02), with an average temperature of 8.75 °C and growing by about 0.2 °C every 10a. The consistent rainfall and temperature trends are indicative of warmer and wetter climates. The overall fluctuation of the flow of 43a Kenswart Hydrological Station increased significantly (Zs = 3.62, p < 0.01), reaching a maximum value of 1946.07 m3/s in 1999. This increase in flow reduced the occurrence and intensity of hydrological drought events. Although the runoff decreased in the 21st century, the overall growth trend remained the same. These results indicate that the climatic and hydrological conditions in the study area are changing.
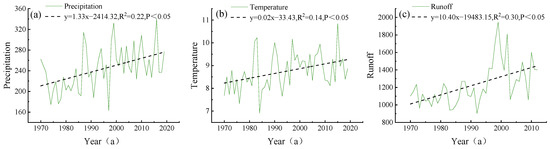
Figure 3.
Interannual variation characteristics of precipitation (a), mean temperature (b), and runoff (c) in the MRB.
3.2. Temporal and Spatial Characteristics of Meteorological Drought
3.2.1. Interannual Evolution Trend of Meteorological Drought
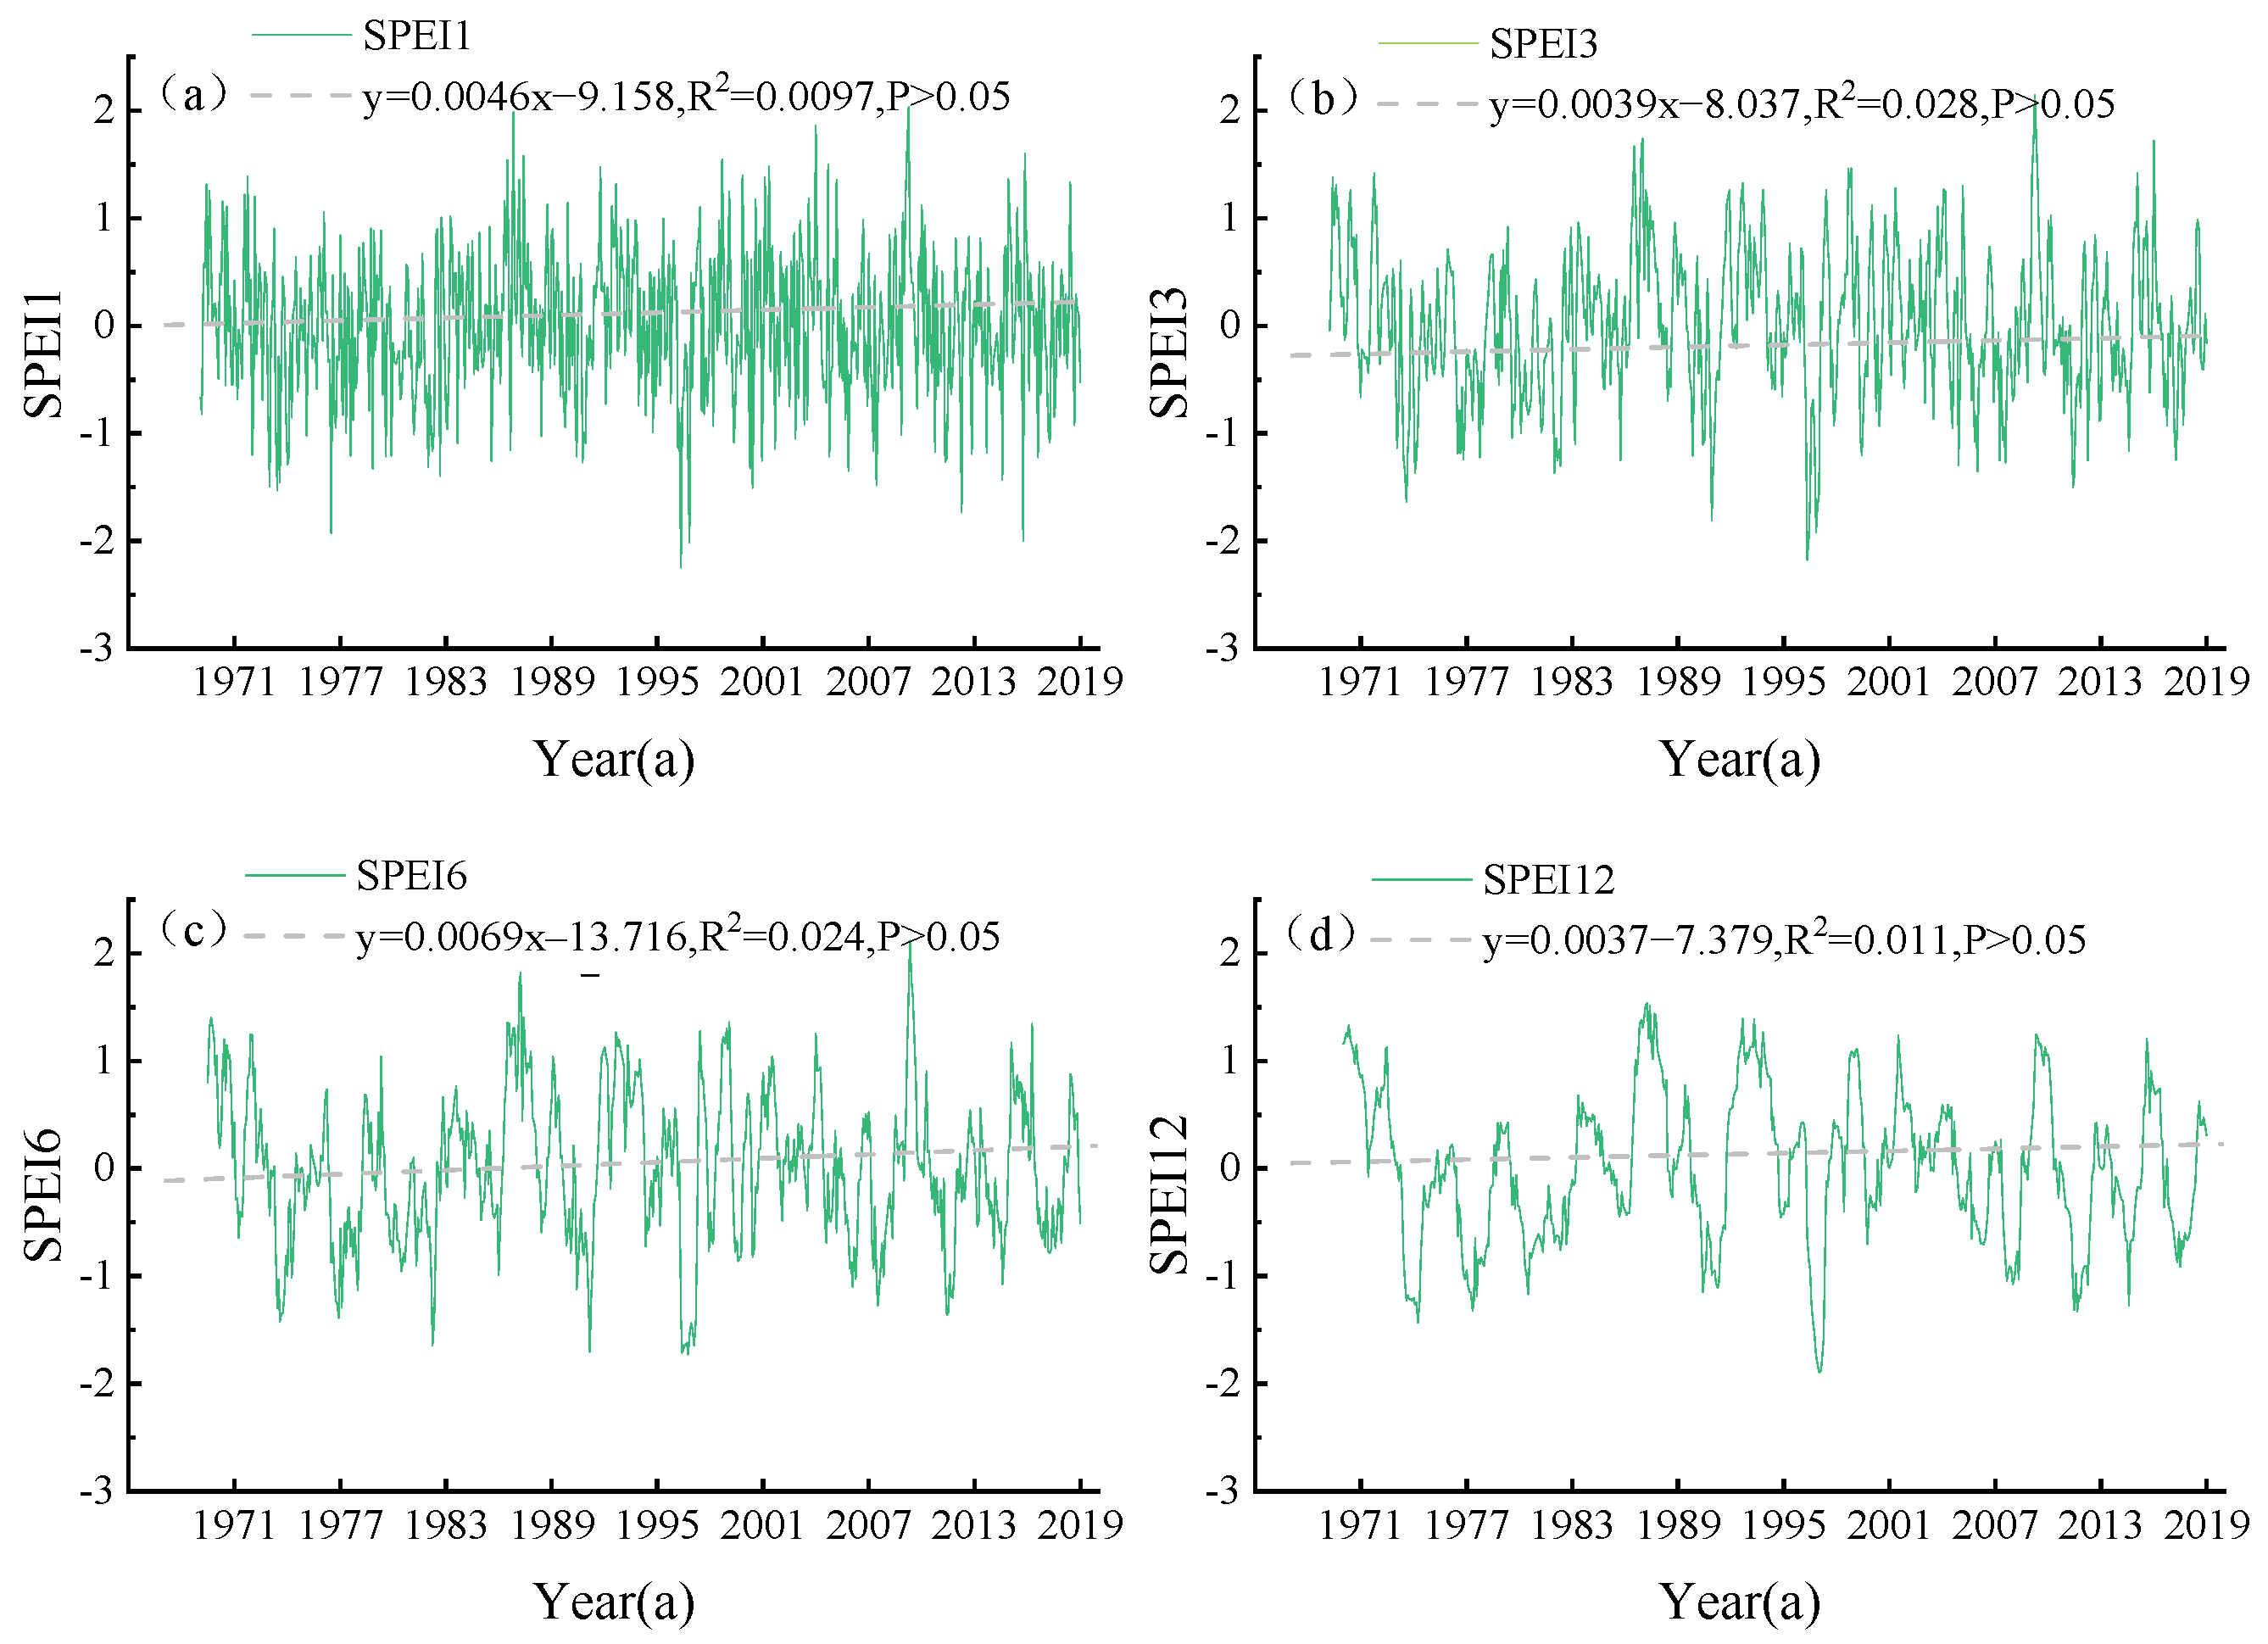
Monthly SPEI values on the 1, 3, 6, and 12 scales in the MRB from 1970 to 2019 were calculated to characterize meteorological drought (Figure 4). The figure shows that with the increase in the SPEI time scale, the fluctuation gradually decreases and the continuity becomes stronger. This is mainly due to the high sensitivity of the SPEI to the precipitation of the current month, and the change in meteorological drought is greatly affected by short-term precipitation, resulting in obvious SPEI fluctuations between months. However, with the accumulation of precipitation, the sensitivity of the SPEI to precipitation decreases with the increase in the time scale and demonstrates less randomness and less volatility. The SPEI has a positive linear slope on both short- and long-term scales, and the annual SPEI scale increases at a rate of 0.0037 a−1, demonstrating that meteorological droughts in the MRB have been alleviated in the last 50 years. Notably, in 1997, the SPEI1, SPEI3, SPEI6, and SPEI12 values were all <−1.4, with the minimum value reaching −2.24, indicating severe and extreme droughts. As shown in Figure 4b, the drought events occurred primarily in the 1970s, 2000s, and 2010s, with fewer events occurring in the 1990s. However, drought severity was high during this period, and the SPEI value was the lowest, indicating that relatively serious drought events occurred in the MRB during this period. The interannual variations in drought events are evident in Figure 4d. From 1970 to 2019, there were ten prominent low peaks in the SPEI value, and the average drought duration was 12 months. The longest drought duration lasted 19 months, from November 1977to March 1979, with an average SPEI value of −0.95, which corresponds to a moderate drought. Conversely, the shortest drought duration was two months, from August 1983 to September 1983. The average SPEI value from April 1997 to April 1998 was −1.39, indicating severe drought.
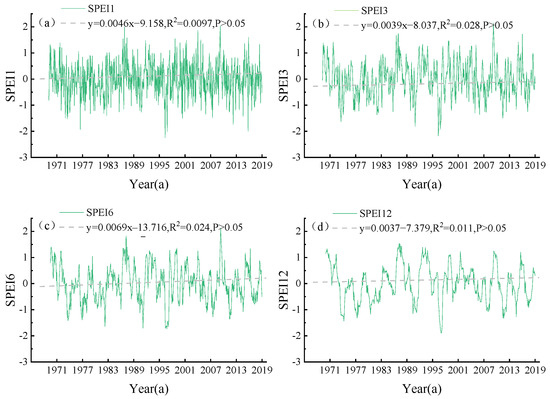
Figure 4.
Change rules of the SPEI1 (a), SPEI3 (b), SPEI6 (c), and SPEI12 (d) time scales.
3.2.2. Seasonal Variation Trends of Meteorological Drought
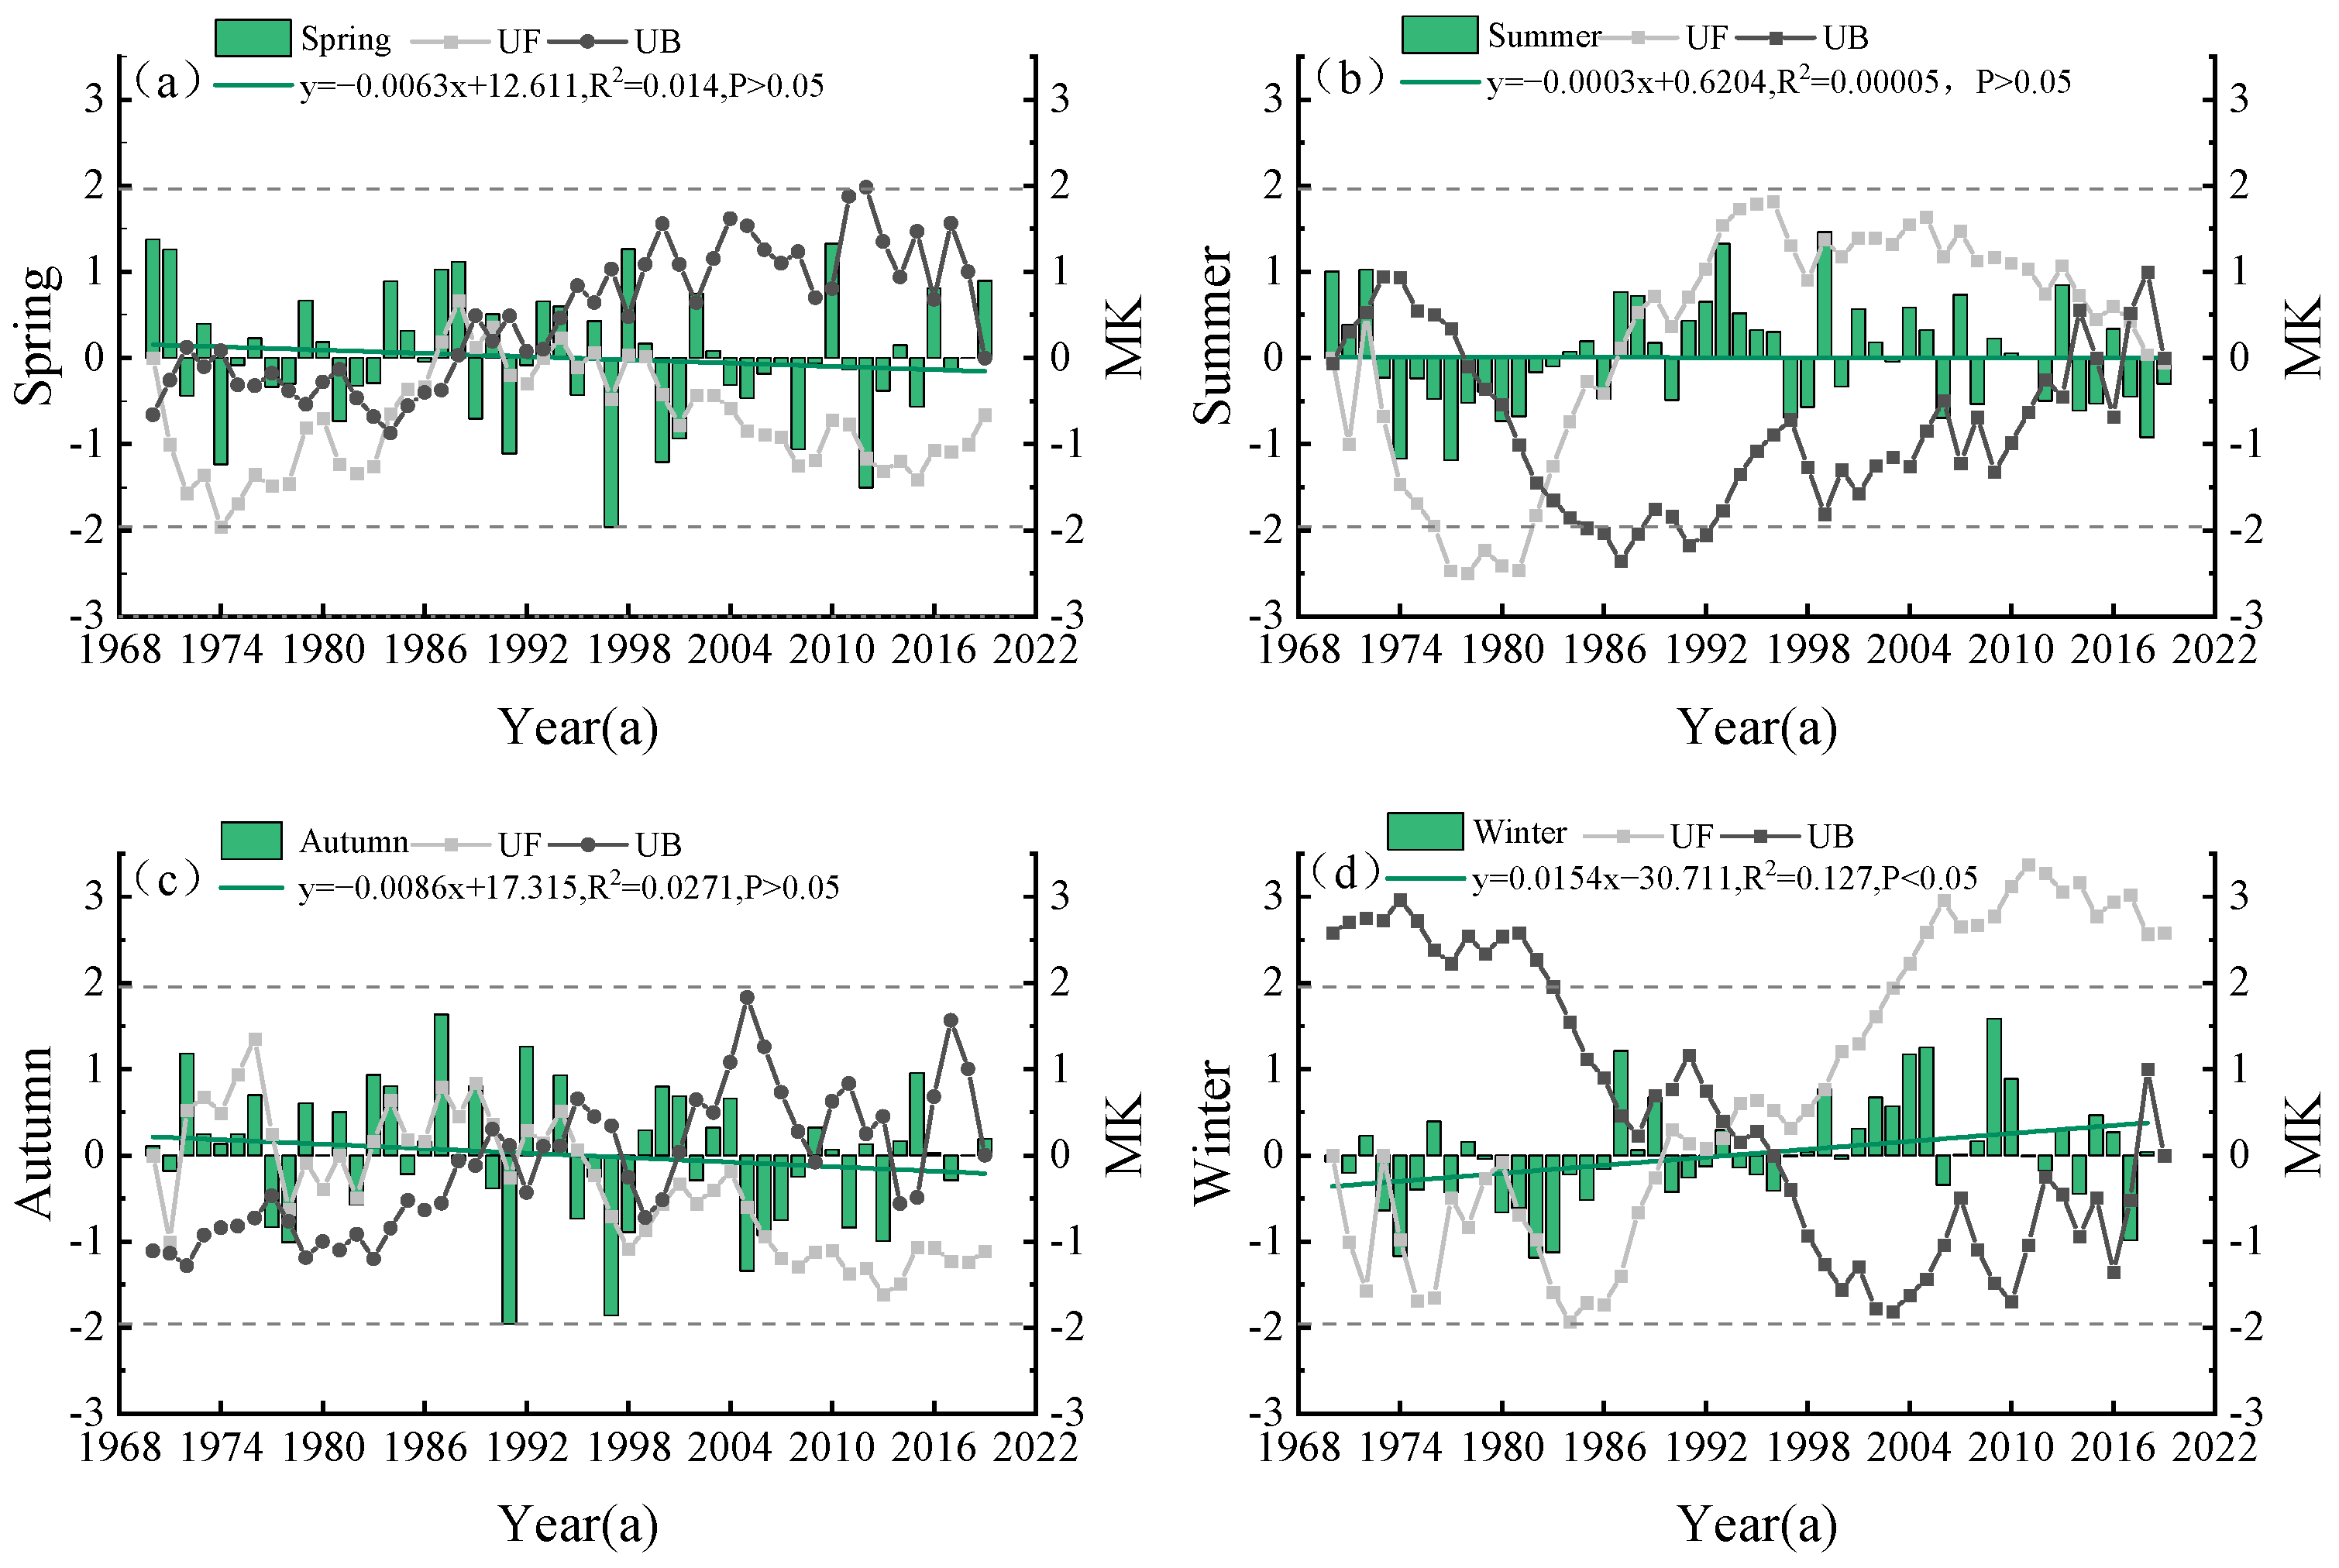
To investigate the seasonal variations in meteorological drought in the basin, the seasonal scale SPEI indices of May, August, November, and February of the following year were chosen to represent spring (March–May), summer (June–August), autumn (September–November), and winter (December–February), respectively. The SPEI indices for spring, summer, and autumn decreased at a rate of −0.063 × 10 a−1, −0.003 × 10 a−1, and −0.086 × 10 a−1, respectively, indicating that drought in these three seasons is insignificant (Figure 5a–c). In contrast, the SPEI in winter increased at a rate of 0.154 × 10 a−1. The Z-values for spring, summer, autumn, and winter were −0.652, −0.05, −1.104, and 2.576, respectively. The results indicate that the drought conditions in spring and autumn were characterized by frequent dry and wet alterations and significantly negative SPEI values after 1997. The summer SPEI values were negative from 1973 to 1983 and were generally >0 after 1984. Severe and extreme drought events in winter were infrequent, with a low degree of drought. The UF statistics in spring and autumn did not exceed the critical line with a significance level of 0.05 (−1.96 < UF < 1.96), indicating that there is no abrupt point in the variation curve of the drought index. The UF and UB curves intersected in approximately 1983 in the summer, indicating that 1983 was a sudden change year. Since 1977, summer droughts in the MRB have significantly intensified. The UF and UB curves intersected in approximately 1993 in winter. Thus, 1993 was a sudden change year, and after 2003, the winter-wetting state was significant.
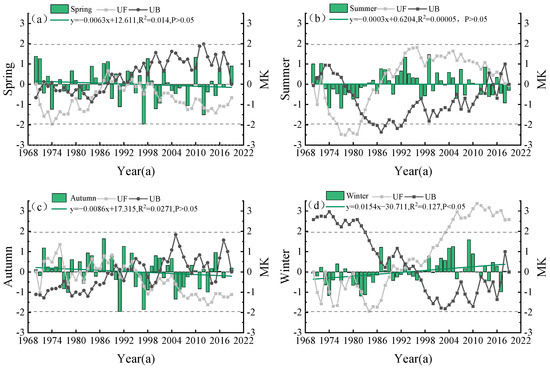
Figure 5.
Meteorological drought change characteristics in spring (a), summer (b), autumn (c), and winter (d).
3.2.3. Analysis of Annual Scale Meteorological Drought Frequency
Table 2 shows the annual drought frequency in the MRB. TD, LD, MD, SD, and ED represent the total annual scales of drought, light drought, moderate drought, severe drought, and extreme drought, respectively. The total drought frequency ranges from 28% to 32%. Further analyses of the drought conditions of different grades showed that the annual frequency of LD was between 11% and 16%, and the frequency of LD was higher at Shihezi station. The frequency of MDs was between 8% and 12%, and drought was more evident at the Shawan and Wulan Wusu stations. The frequency of SDs was between 4% and 6%, mainly in the Manas. The frequency of EDs was between 1% and 3% and was concentrated in Ulan Usu. In general, LD and MD occurred easily in the MRB. However, the frequencies of SD and ED were low, showing the characteristics of a high frequency of LD and MD and a low frequency of SD and ED.
Table 2.
Year-scale meteorological drought frequency characteristics.
3.2.4. Analysis of Annual Scale Meteorological Drought Frequency
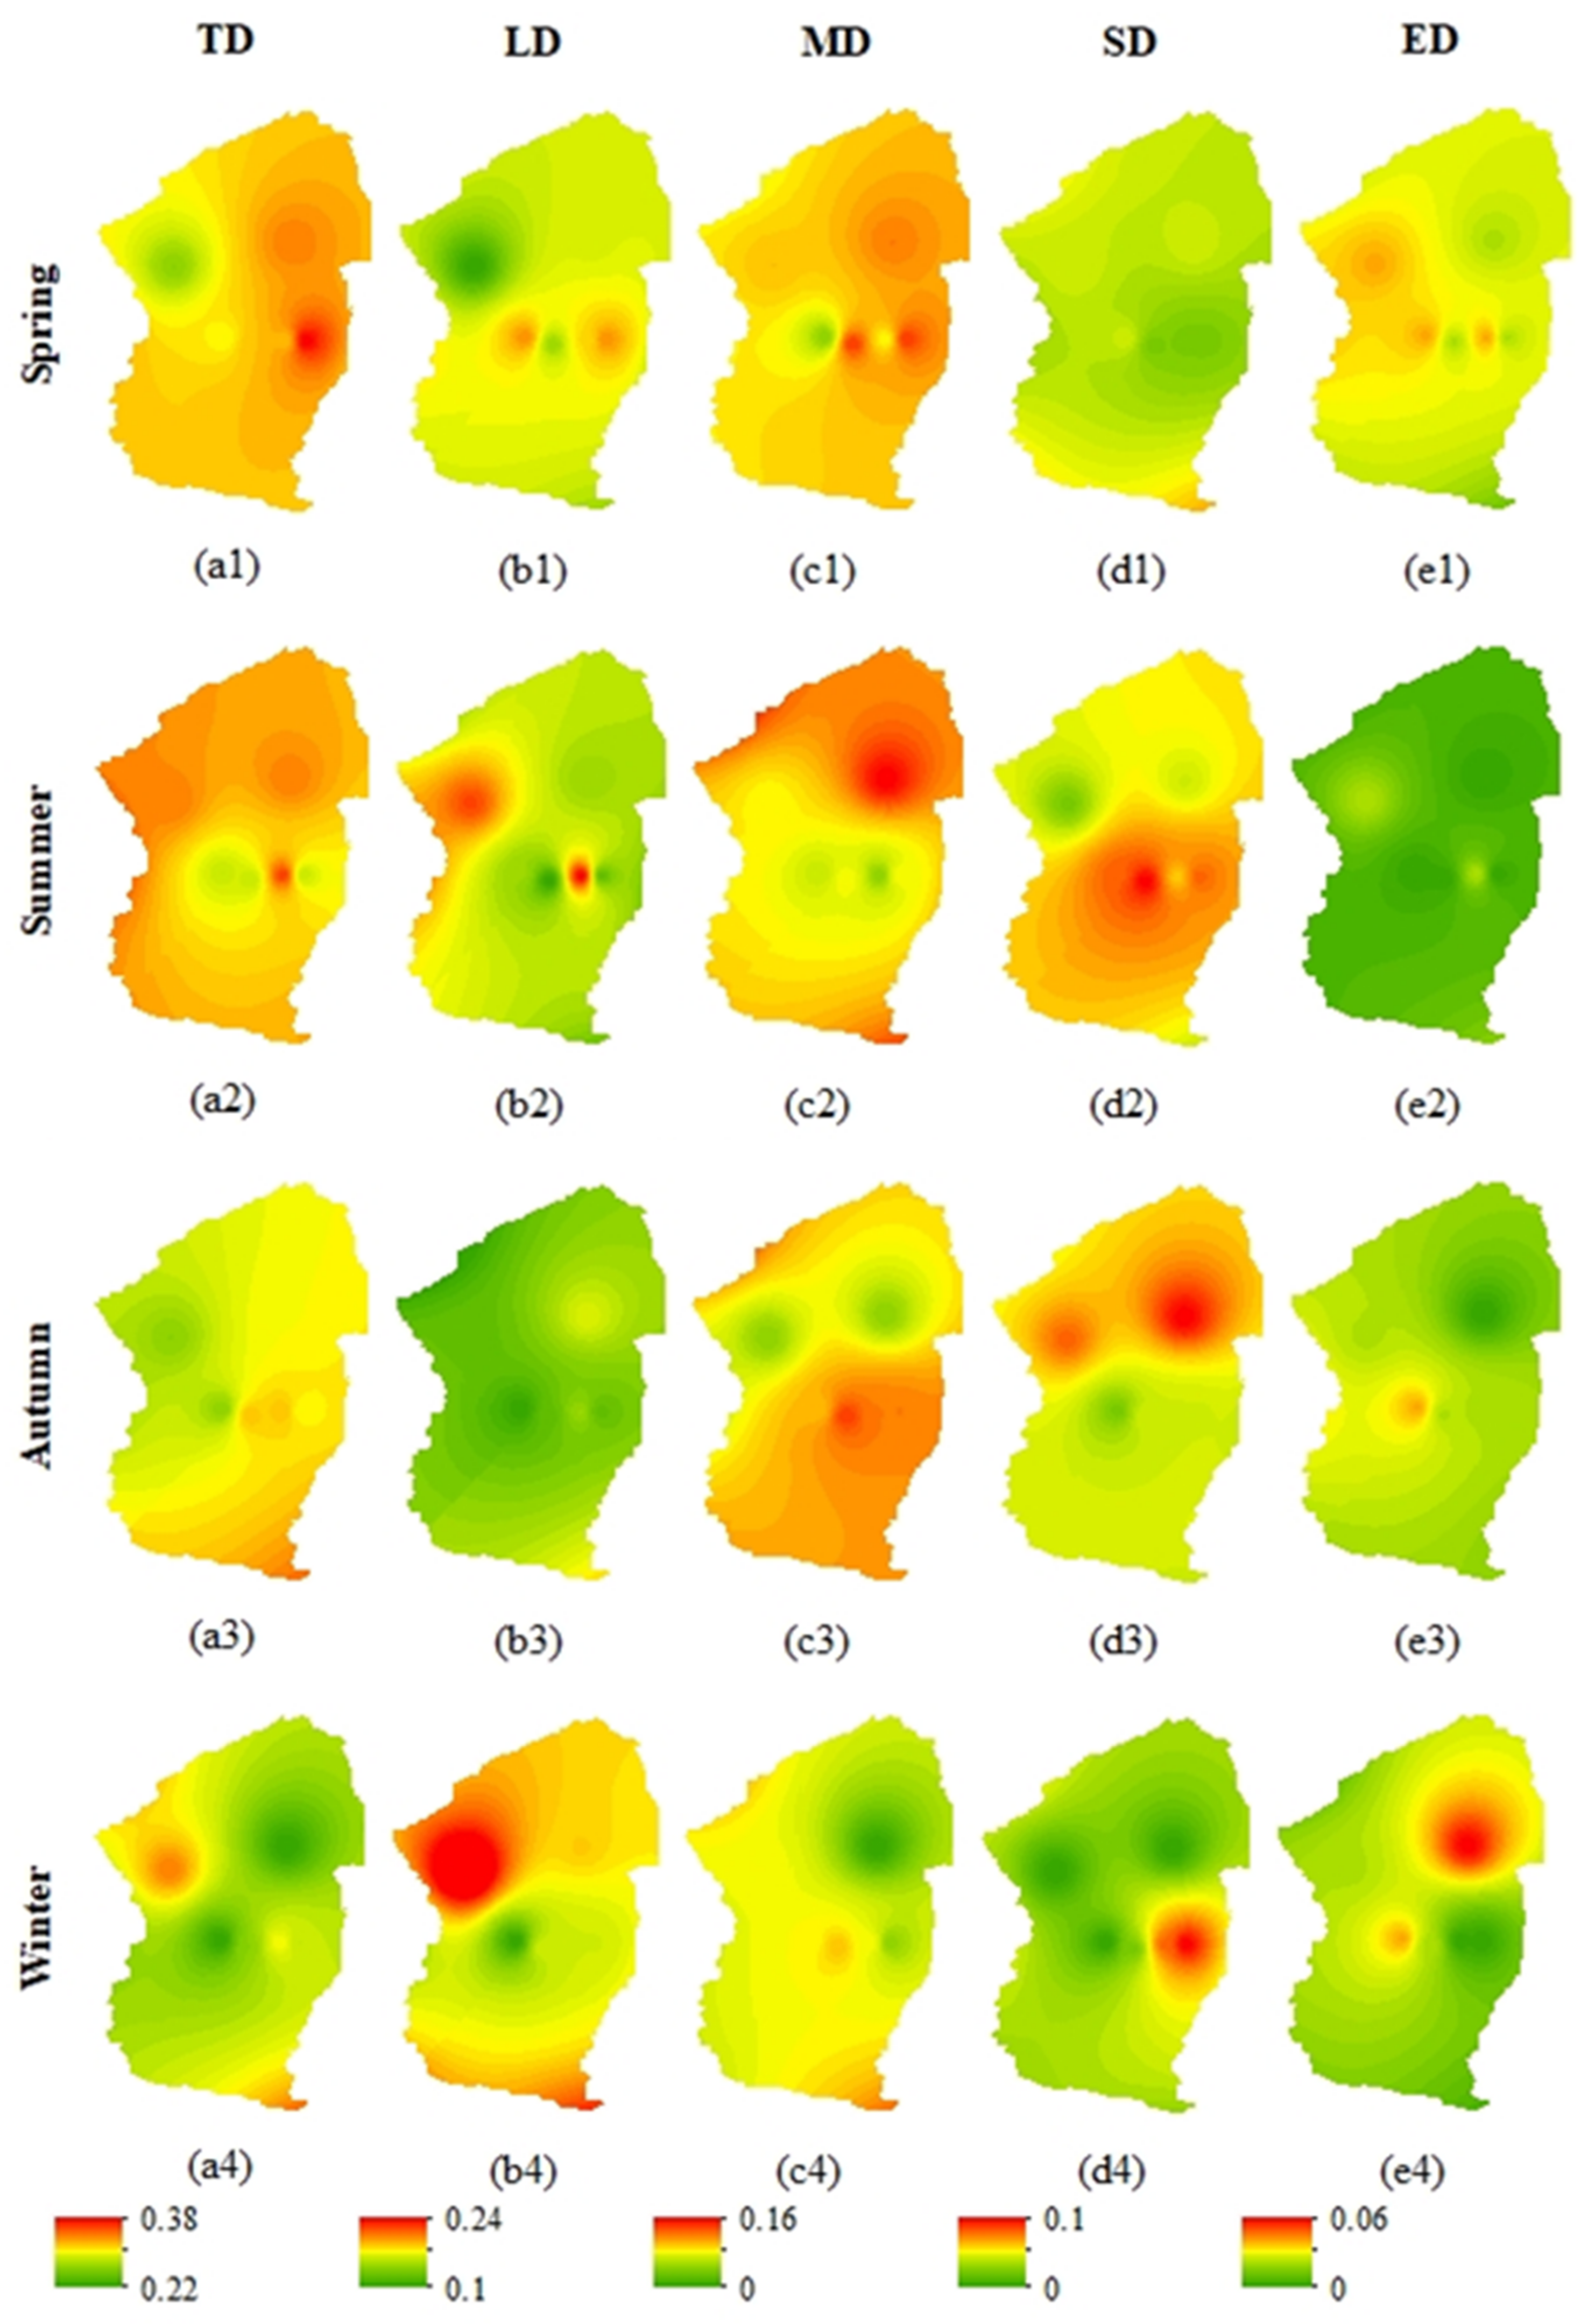
The IDW method in ArcGIS software was used to analyze the spatial distribution characteristics of drought frequency at different seasonal scales. Figure 6 shows that spring droughts ranged from 26% to 38%, with an average of approximately 31.69%. Among the three stations, Manas experienced the highest frequency of drought (38%), whereas Shihezi and Ulan Wusu experienced 32%. In spring, the frequency of LDs ranged from 10% to 20%, and all three stations were prone to this phenomenon. The frequency of MDs was between 4% and 14% and was mainly concentrated in the eastern part of the river basin. The frequency of summer droughts varied between 28% and 36%, with a maximum value of 36% in Shihezi and a minimum value of 28% in Shawan, Ulan Wusu, and Manas. Summer droughts were more frequent in the basin, and the LD frequency ranged from 10% to 24%. The frequency of MDs ranged from 4% to 16%, revealing a declining trend from north to south. The frequency of autumn droughts ranged between 26% and 34%, with a higher frequency in the east and a lower frequency in the west. The LD and SD frequencies gradually decreased from north to south. In winter, LDs were concentrated in Paotai, whereas MDs were mainly concentrated in Mossos Bay. SDs and EDs occurred less frequently during this season. The frequency of drought in spring and summer was higher than that in autumn and winter (Figure 6(a1–a4)); The frequency of LDs in autumn was lower than that in other seasons, and the frequency of LDs in winter was more severe (Figure 6(b1,b2)). EDs in the summer season were uncommon but occasionally occurred in the spring and winter months (Figure 6(e1–e4)). In summary, the study area was particularly susceptible to LDs and MDs throughout the year. It is crucial to pay close attention to the Shawan and Mosso Bay regions because they are vulnerable to severe and extreme droughts.
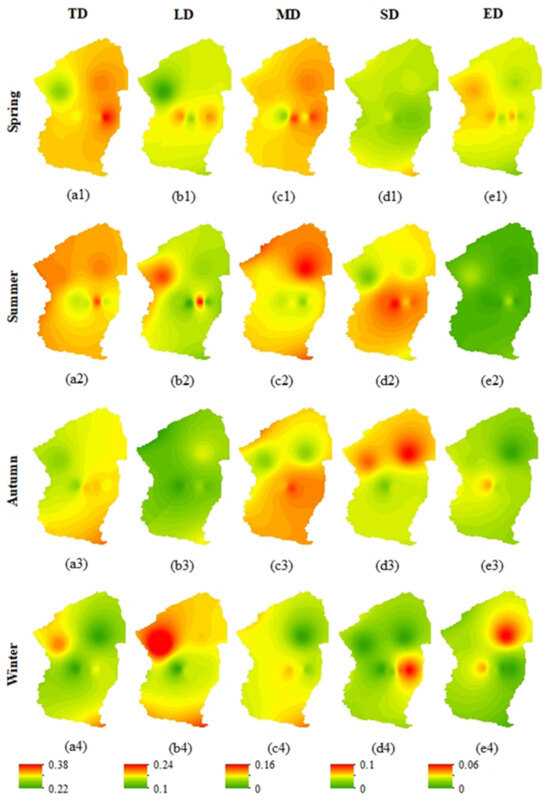
Figure 6.
Spatial distribution characteristics of drought frequencies on a seasonal scale. (a1–a4) represents the frequency of drought in different seasons of the whole basin, (b1–b4,c1–c4,d1–d4,e1–e4) represent the frequency of light drought, medium drought, severe drought and extreme drought in spring, summer, autumn and winter of the basin, respectively.
3.2.5. Annual Variation Characteristics of Groundwater Table
The study area showed similar drought frequency evolution characteristics on an annual scale. From highest to lowest, it was LD > MD > SD > ED. On a seasonal scale, the frequency of LDs was more prominent in spring and did not change significantly throughout the year. As can be seen from (Figure 7a–c), the MD frequency in spring was lower than that in other seasons from 1970 to 1999 and increased from 2000 to 2019 as shown in (Figure 7d). In summer, MD events occurred easily in the 1970s, but the frequency of SDs decreased from 1970 to 1999 and increased from 2000 to 2019. The probability of SDs in autumn was low from 2000 to 2019. In (Figure 7e) the number of winter MD events decreased between 1970 and 2019. Overall, the frequencies of LDs and MDs did not change significantly, but SDs and EDs increased in this decade compared with the 2000s.
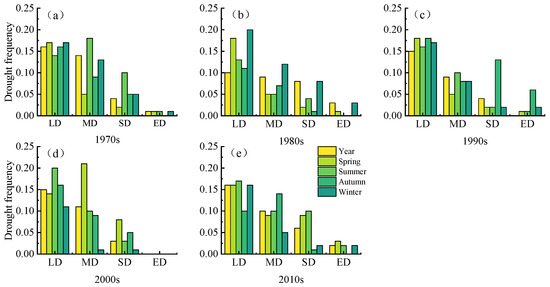
Figure 7.
Temporal variation characteristics of meteorological drought frequency. (a–e) represents the frequency of meteorological drought of different seasons and degrees in five decades.
3.3. Time Variation Characteristics of Hydrological Drought
3.3.1. Interannual Evolution Trend of Hydrological Drought
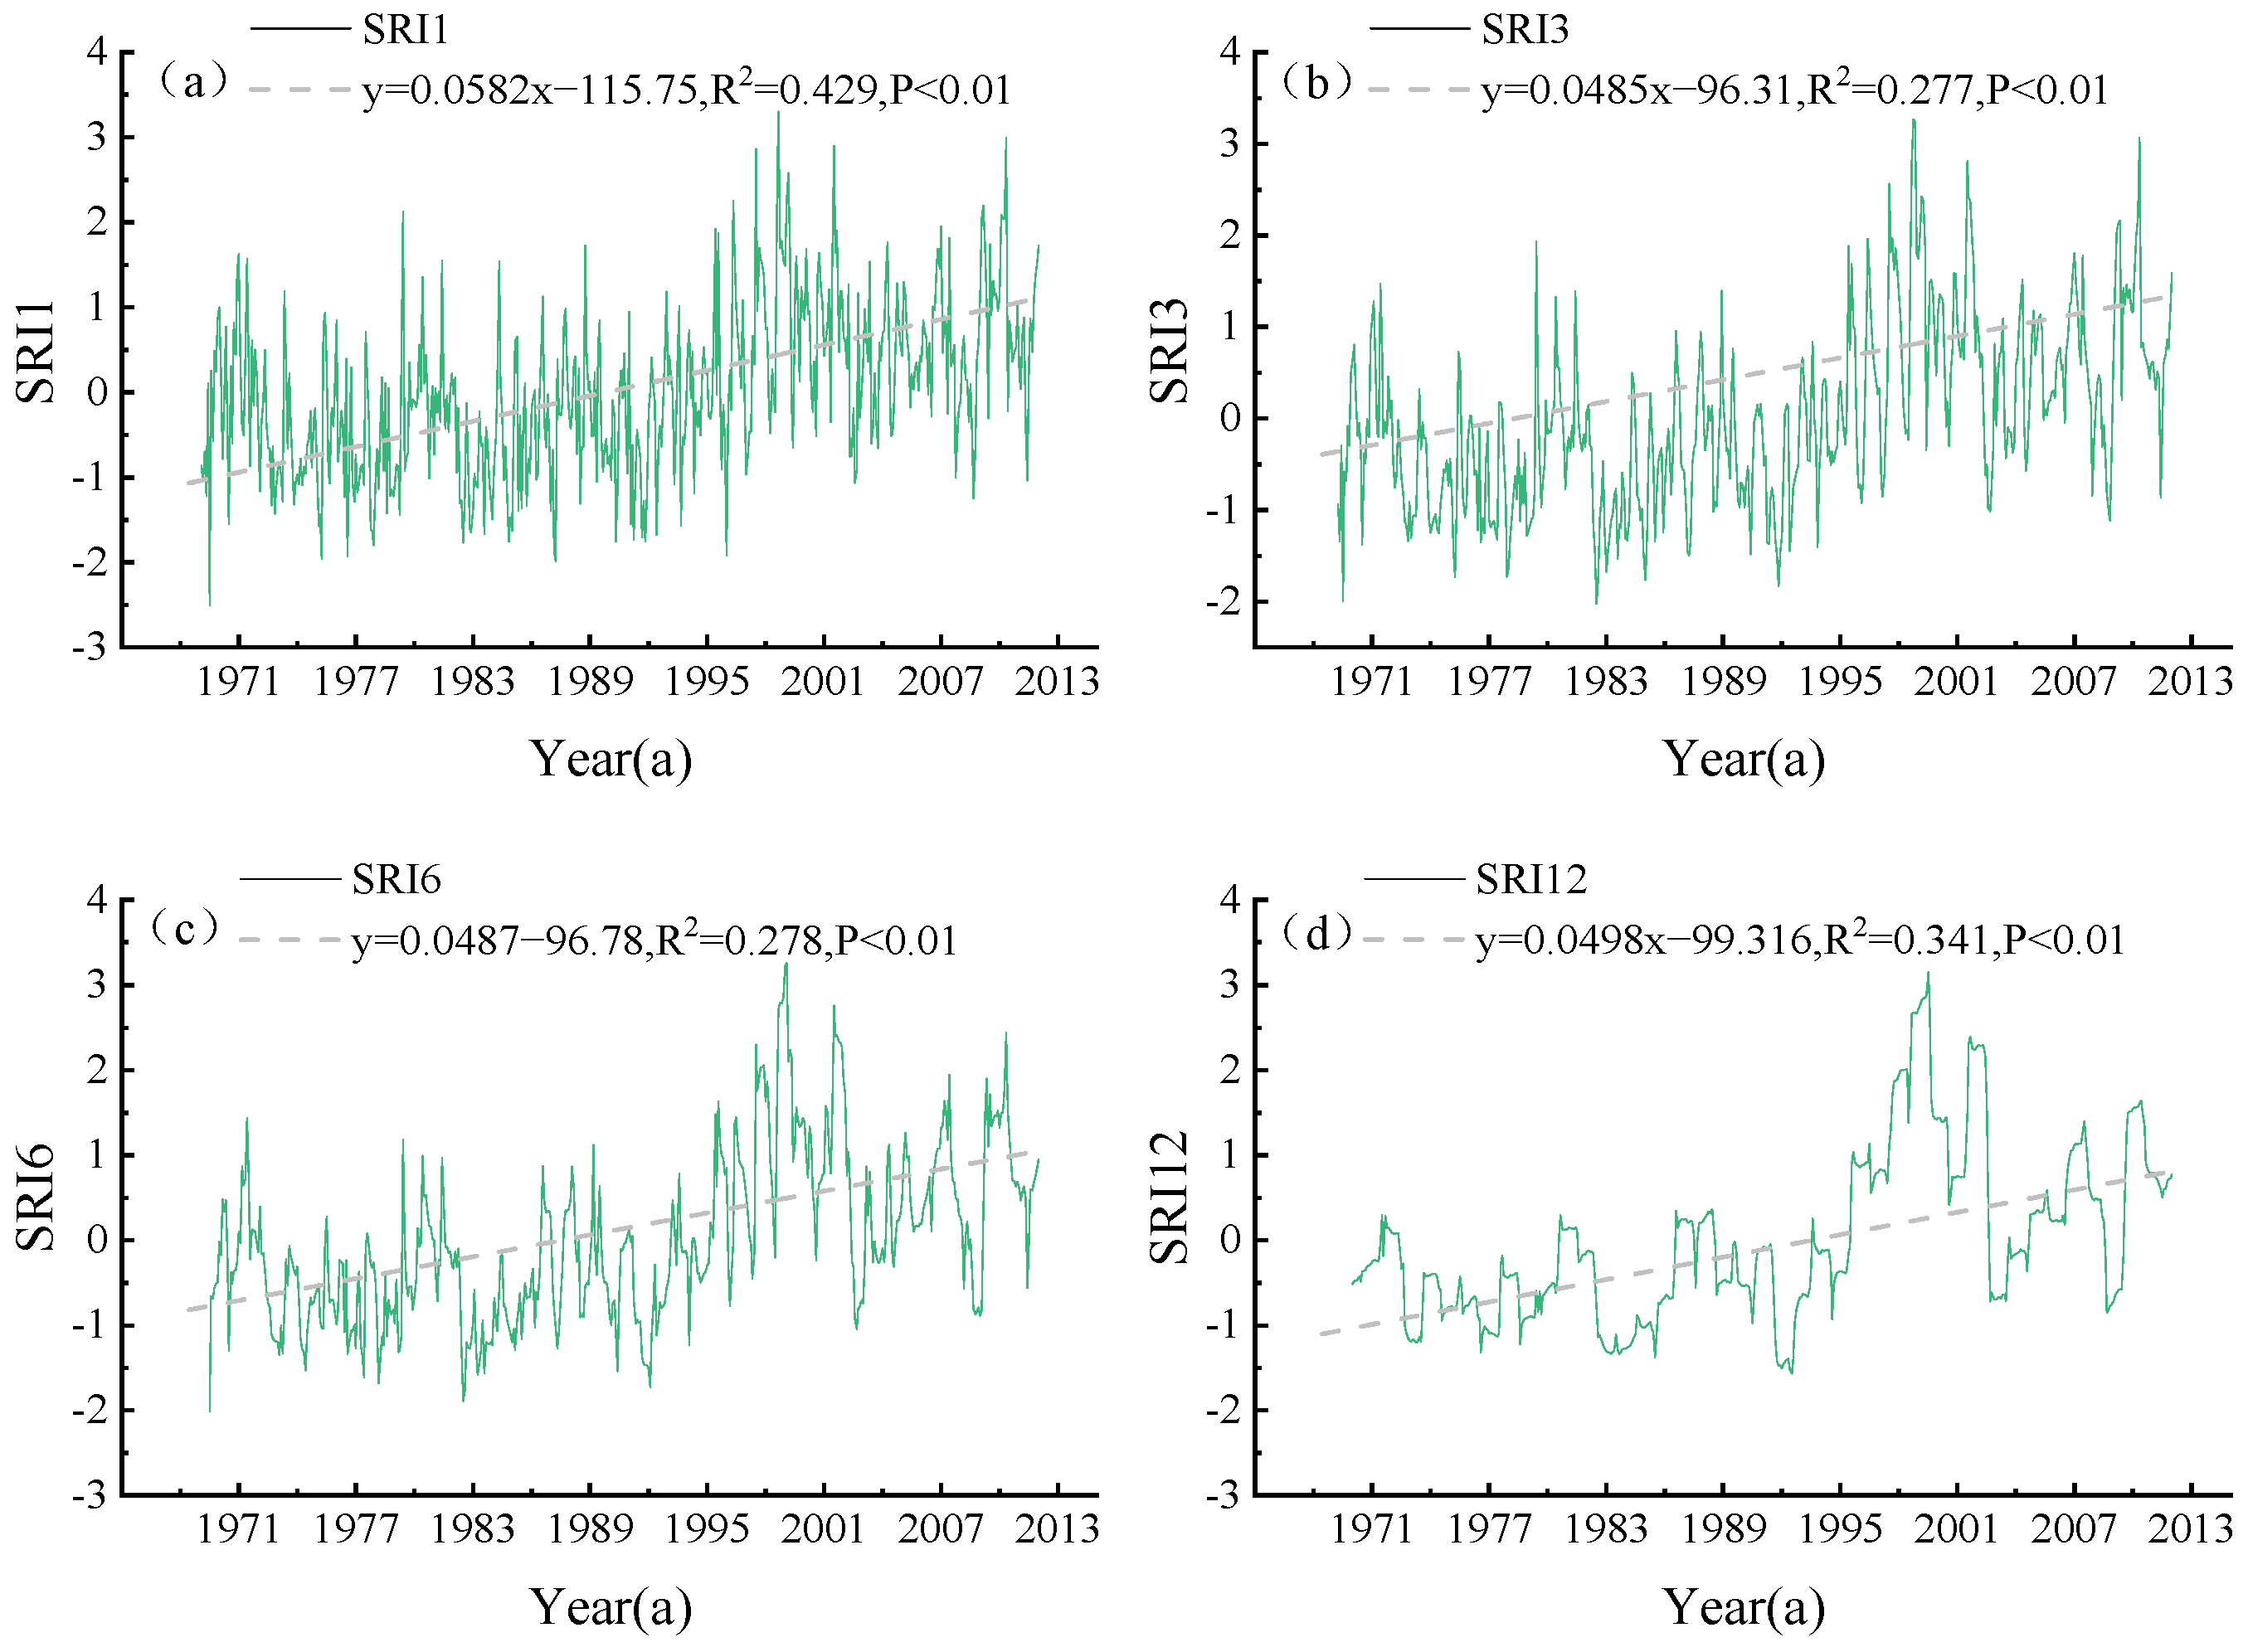
Hydrological drought was assessed using SRI1, SRI3, SRI6, and SRI12. (Figure 8a–d) shows that at a significance level of p < 0.01, all of the time scales demonstrated a significant increase at rates of 0.0582, 0.0485, 0.0487, and 0.498 a−1, respectively. The values indicate that hydrological droughts have been markedly alleviated over the last 43 years. SD and ED events mainly occurred from 1970 to 2000, with the lowest SRI values of the four scales being −2.05, −2.02, −1.89, and −1.56, respectively. After 2000, the basin mostly experienced LD events. In the short time scales of one and three months, the frequency of drought was higher in the 1970s, 1980s, and 1990s, among which SRI1 (Figure 8a) lasted the longest from September 1974 to July 1975, totaling 11 months with an average of −1.34, indicating a moderate drought level. In SRI3 (Figure 8b), the longest drought lasted from November 1983 to March 1985, reaching 17 months with an average value of −1.11.
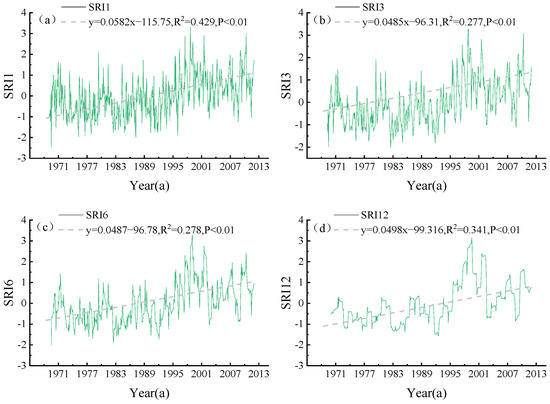
Figure 8.
The change rules of the four time scales, SRI1 (a), SRI3 (b), SRI6 (c), and SR12 (d).
3.3.2. Seasonal Variation Trends of Hydrological Drought
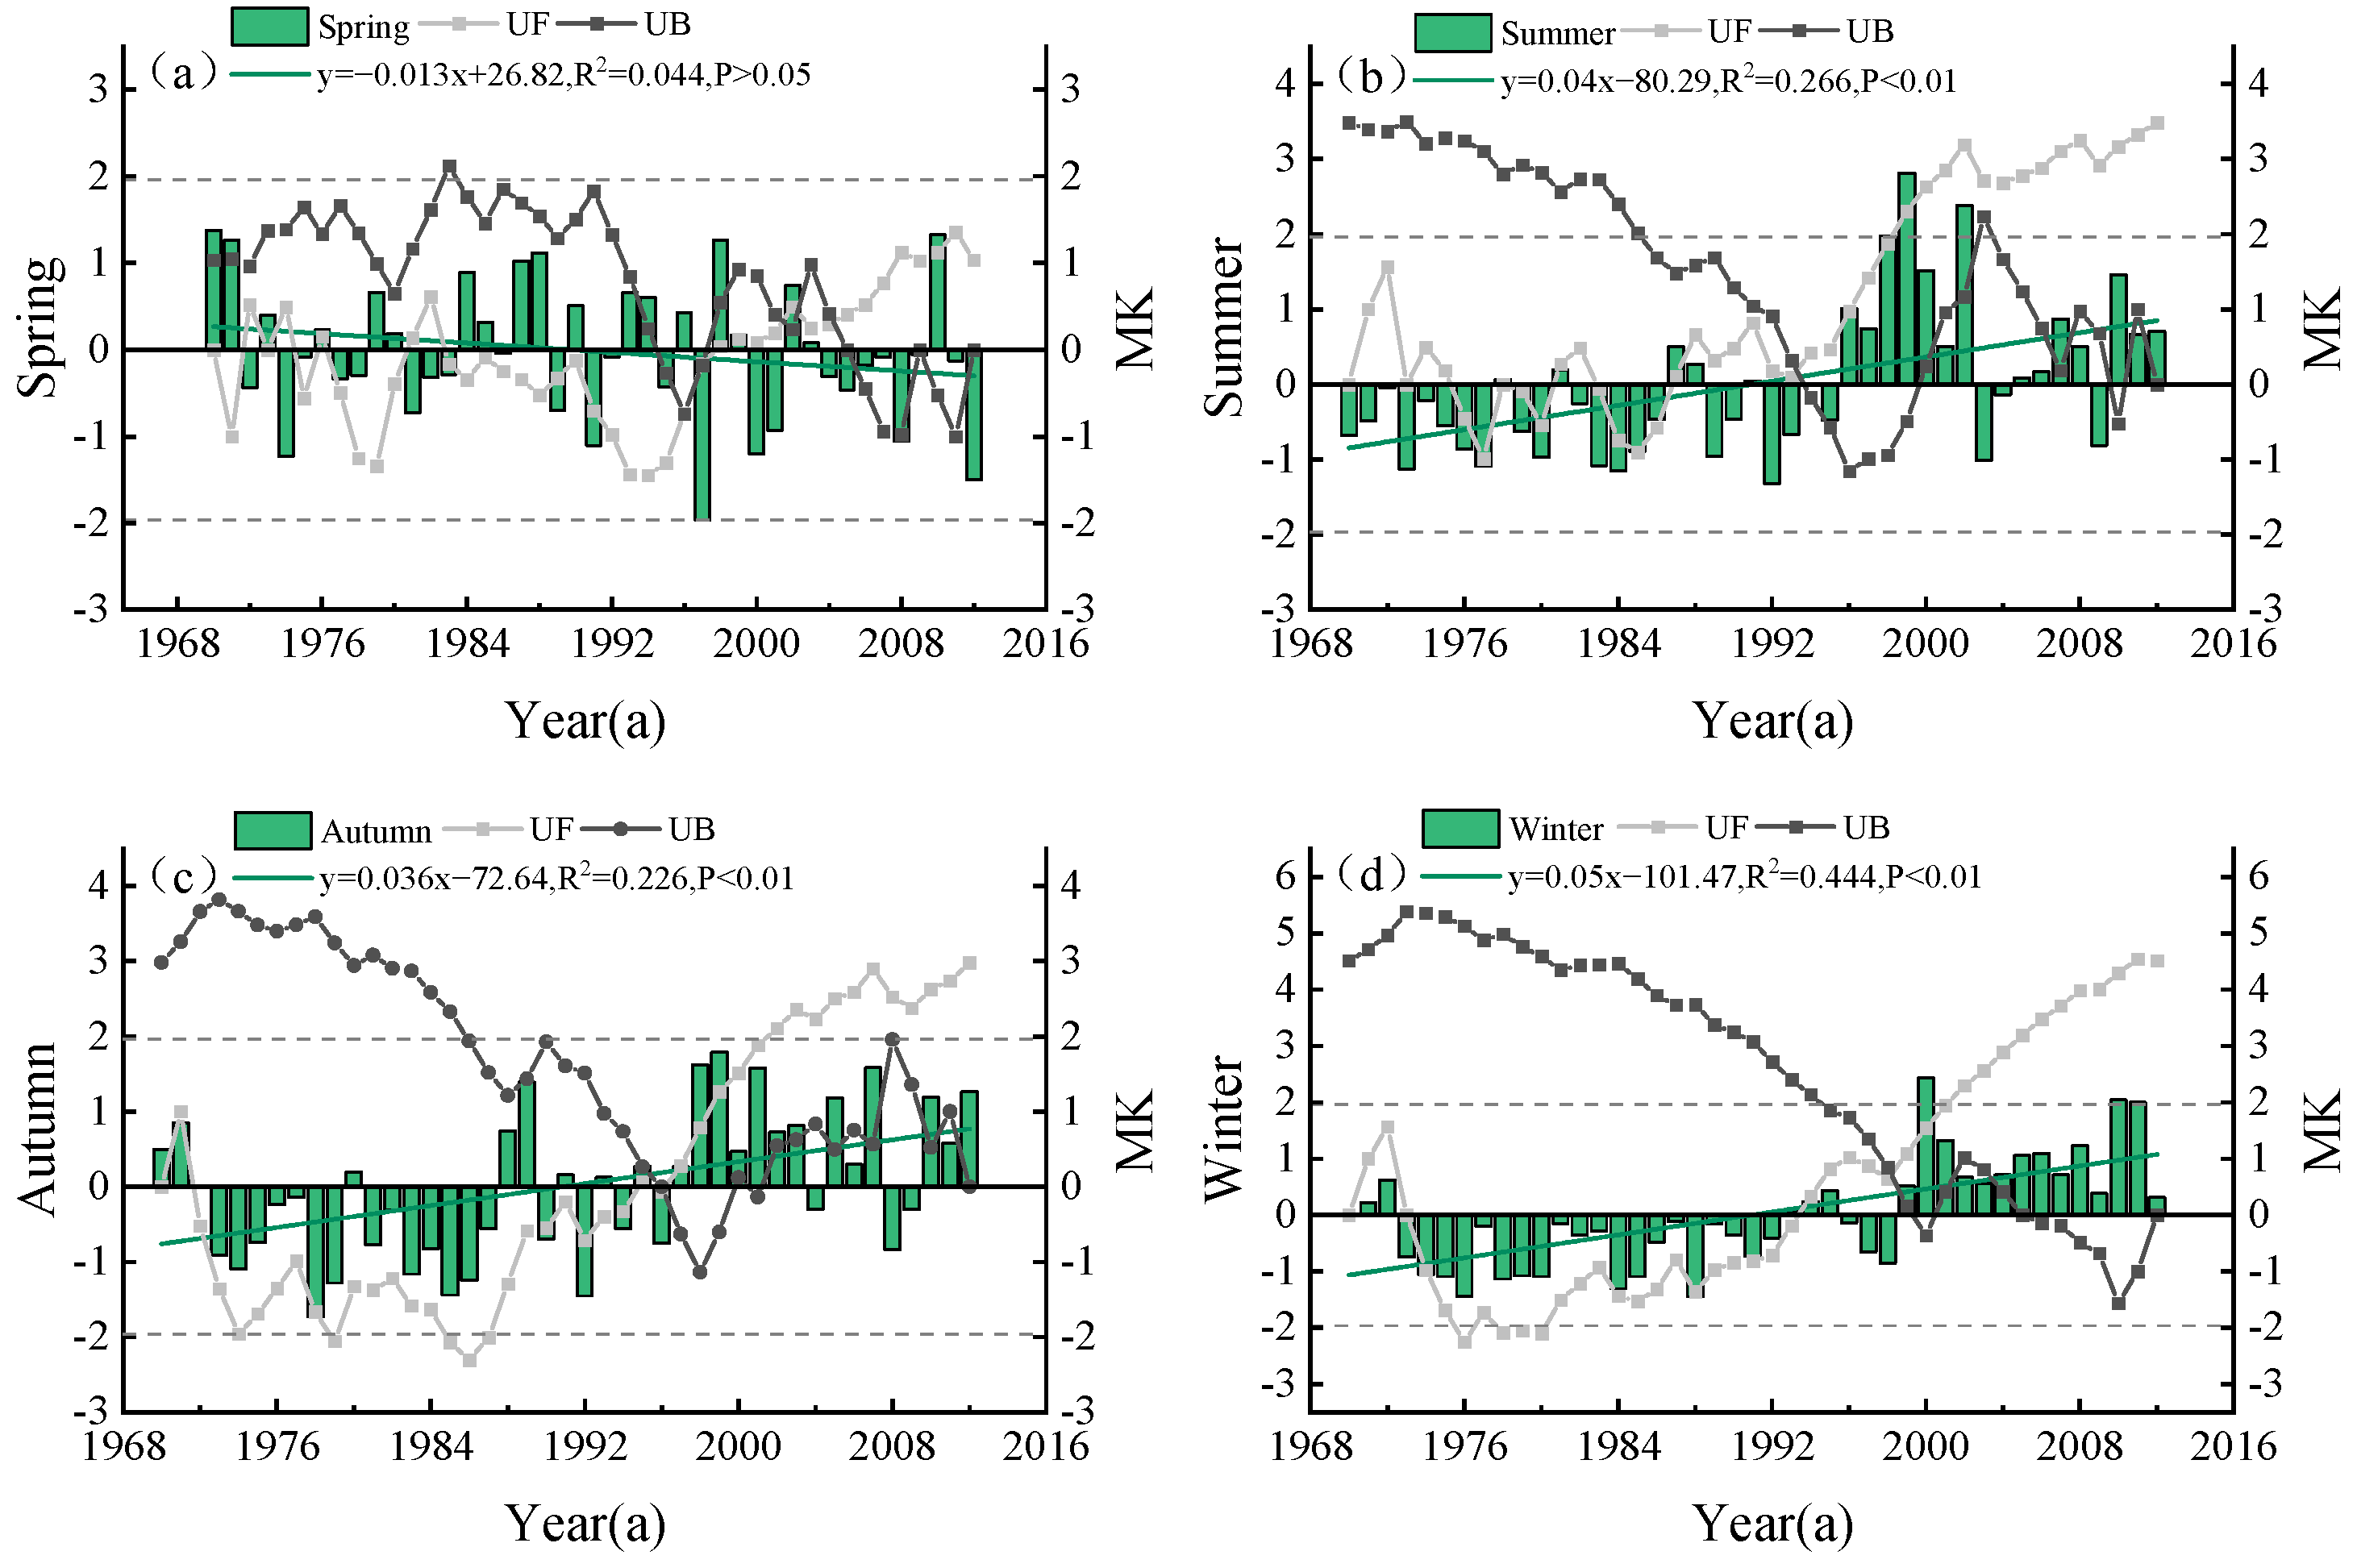
The seasonal variation trends of hydrological drought were analyzed. A non-significant downward trend was evident in spring SRI (Figure 9a) at the rate of −0.013a−1. In contrast, summer (Figure 9b), autumn (Figure 9c), and winter (Figure 9d) showed significant upward trends at confidence levels of 0.04, 0.036, and 0.05a−1, respectively. The Mann–Kendall trend analysis showed that the Z-values of the four seasons were 1.02, 3.47, 2.97, and 4.5, and all seasons except spring passed the significance test. The hydrological drought-weakening trend was evident in summer, autumn, and winter, whereas the spring SRI values alternated between the dry and wet conditions. The summer SRI was almost negative from 1970 to 1995, with light and moderate droughts. After 1995, the SRI was generally greater than zero, indicating a wet state. MDs easily occur in autumn and winter, and dry and wet states change significantly throughout the year. The UF statistics in spring did not exceed the critical threshold of 0.05 (−1.96 < UF < 1.96), indicating no abrupt point in the drought index change curve. In summer, the UF and UB curves intersect around 1993, and abrupt changes occur. Since 1998, summer HDs have decreased significantly. The UF and UB curves in autumn intersected around 1996, indicating that 1996 was a sudden change year and that the wetting state of the fall season was significant after 2001.
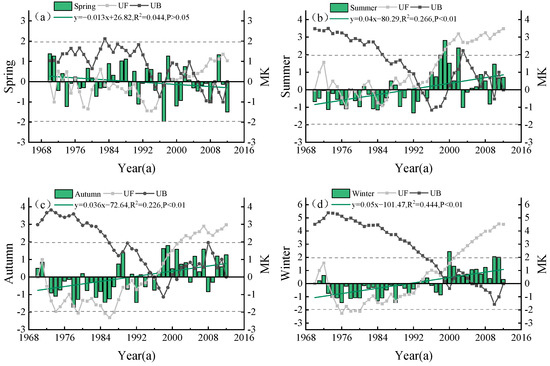
Figure 9.
Hydrological drought change characteristics in spring (a), summer (b), autumn (c), and winter (d).
3.3.3. Temporal Variation Characteristics of Hydrological Drought Frequency
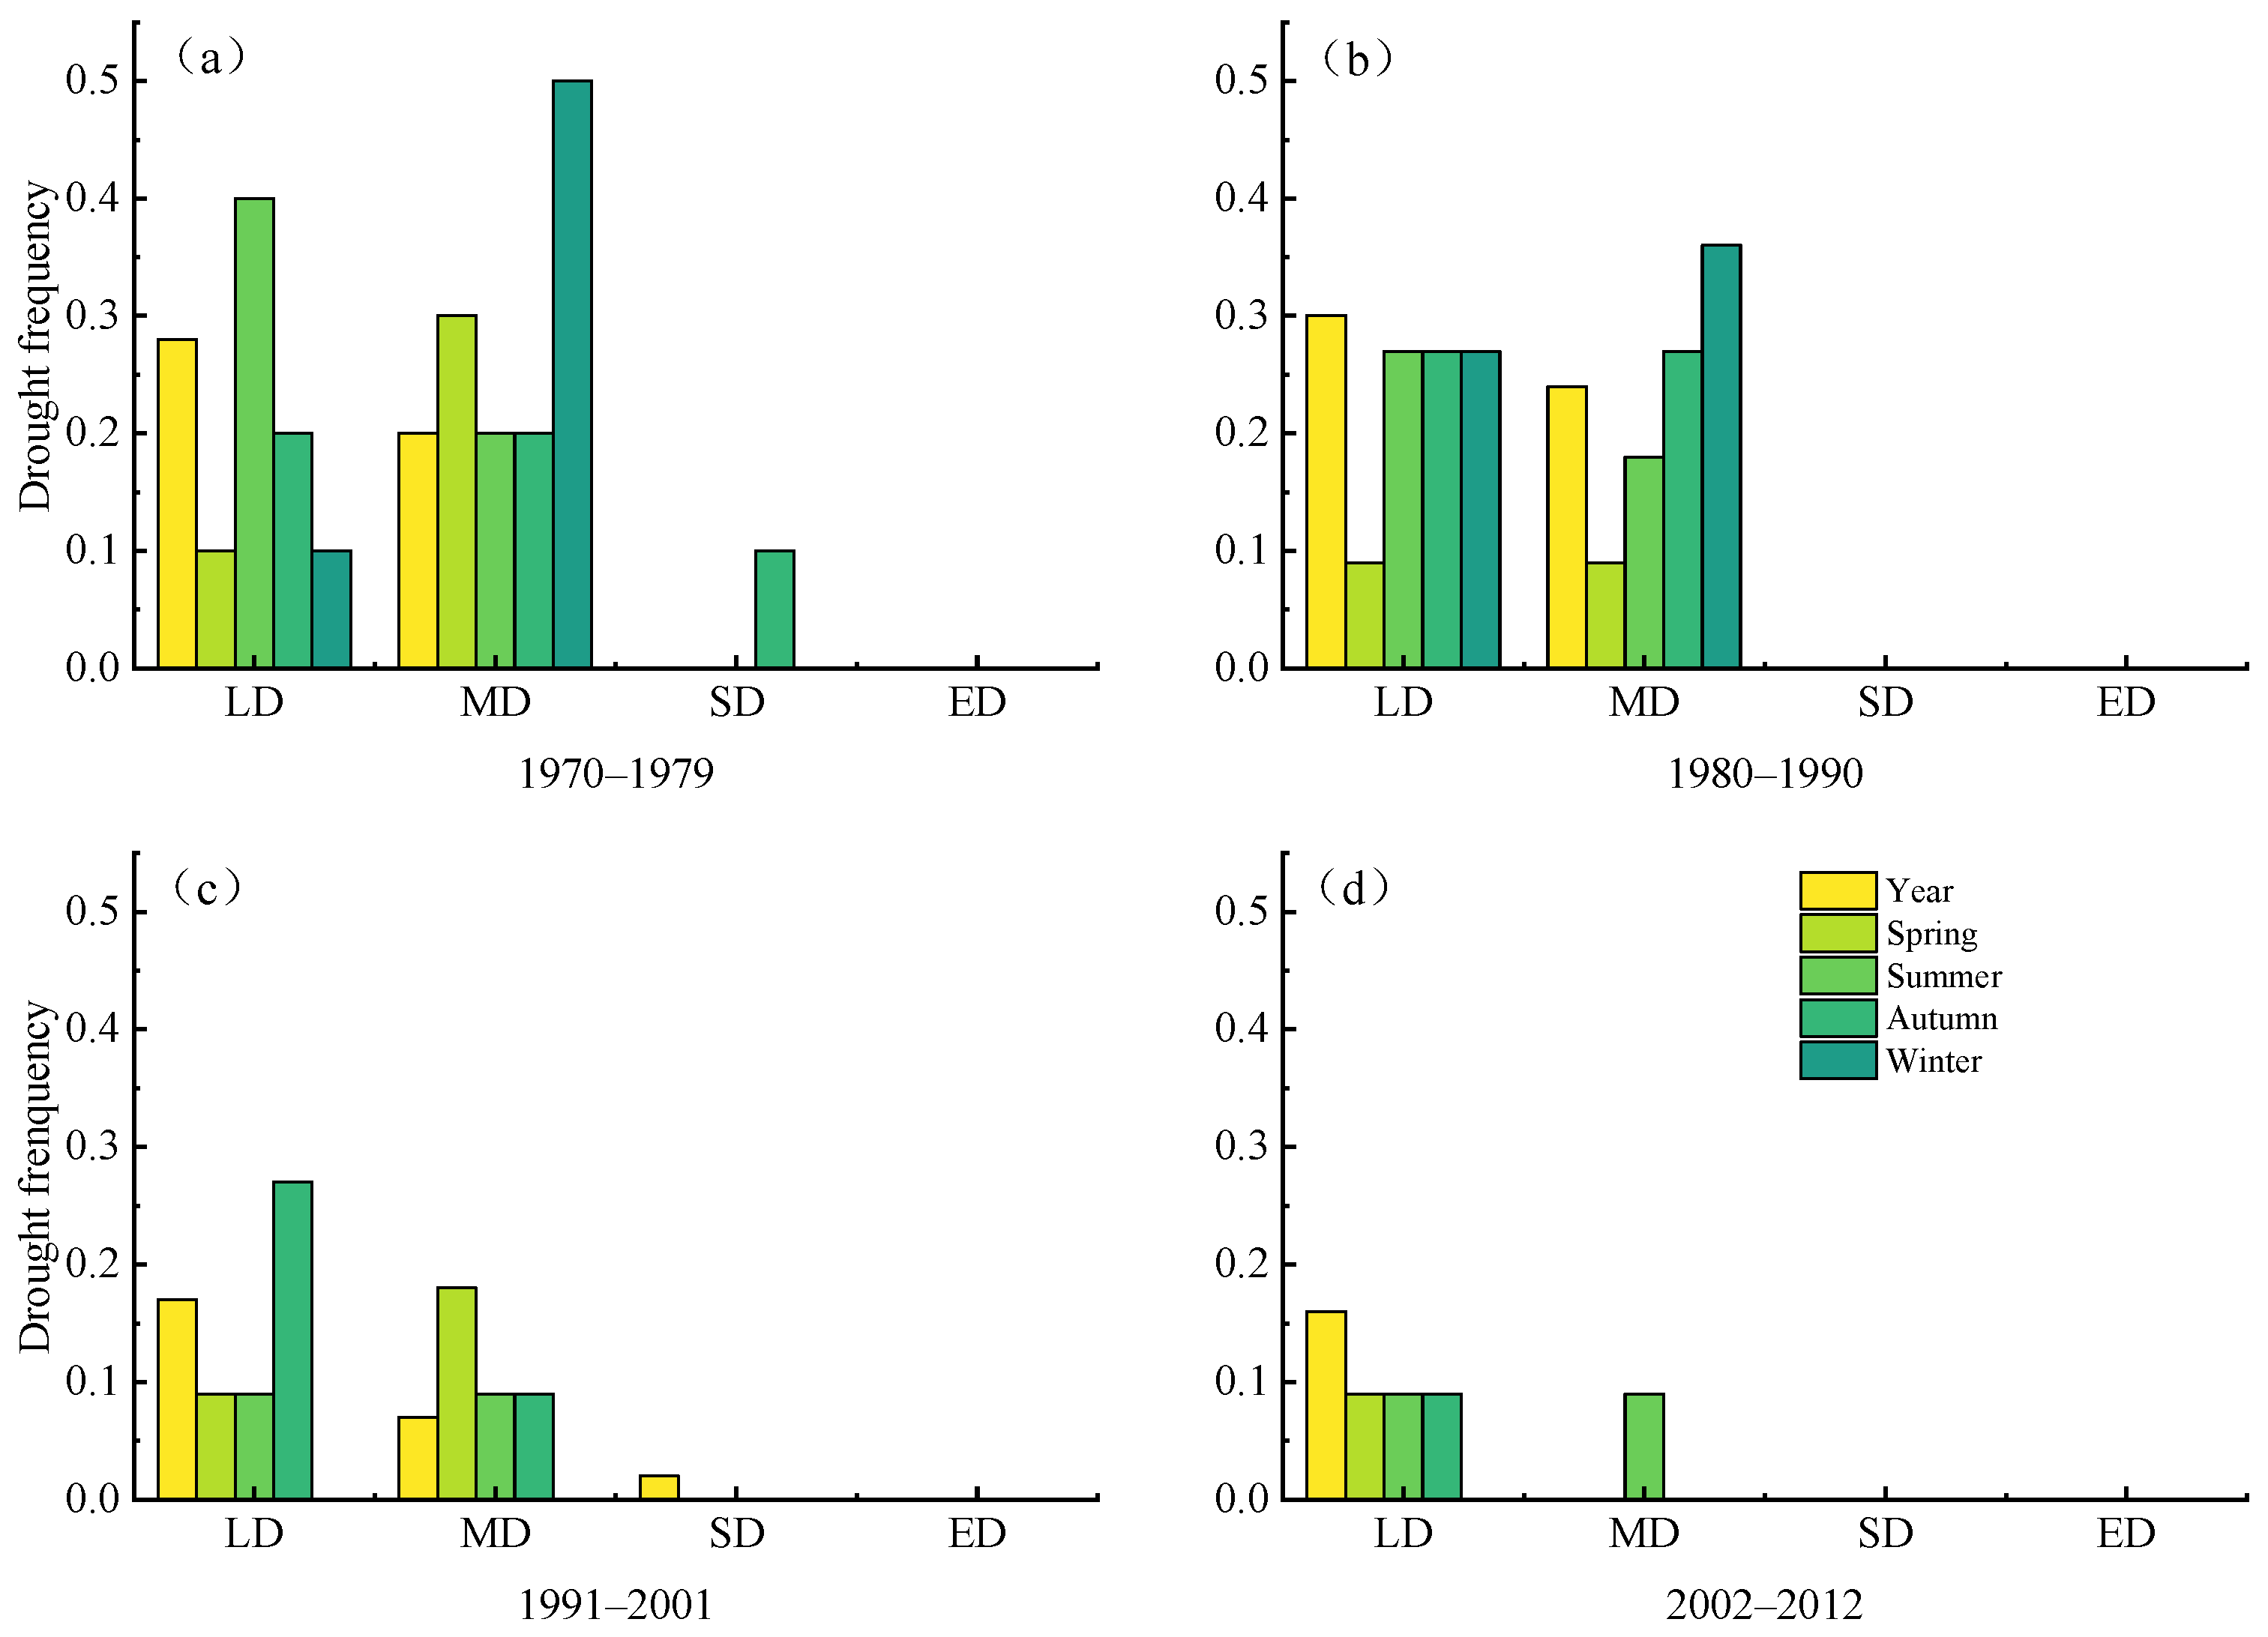
(Figure 10a–d) shows that from the annual scale, SDs rarely occurred, EDs never occurred, and the frequencies of LDs and MDs decreased each passing year. The change in LDs during spring was negligible, whereas the frequency of LDs decreased during summer. In winter, MDs occurred frequently from 1970 to 1990 (Figure 10a,b) but not after 1991. Notably, the drought frequency of all grades decreased significantly, indicating that hydrological drought was alleviated.
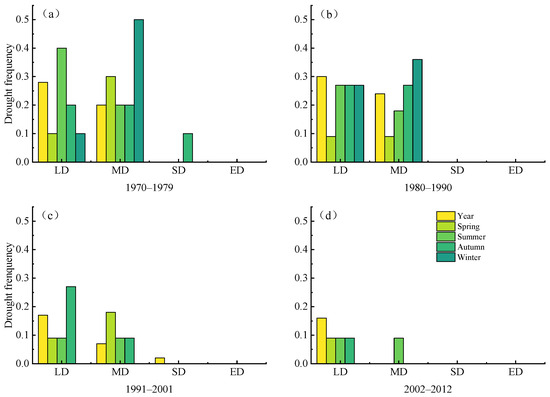
Figure 10.
Temporal variation characteristics of hydrological drought frequency. (a–d) represents the frequency of hydrological drought of different seasons and degrees in recent 43 years.
3.3.4. Drought Characteristic Analysis
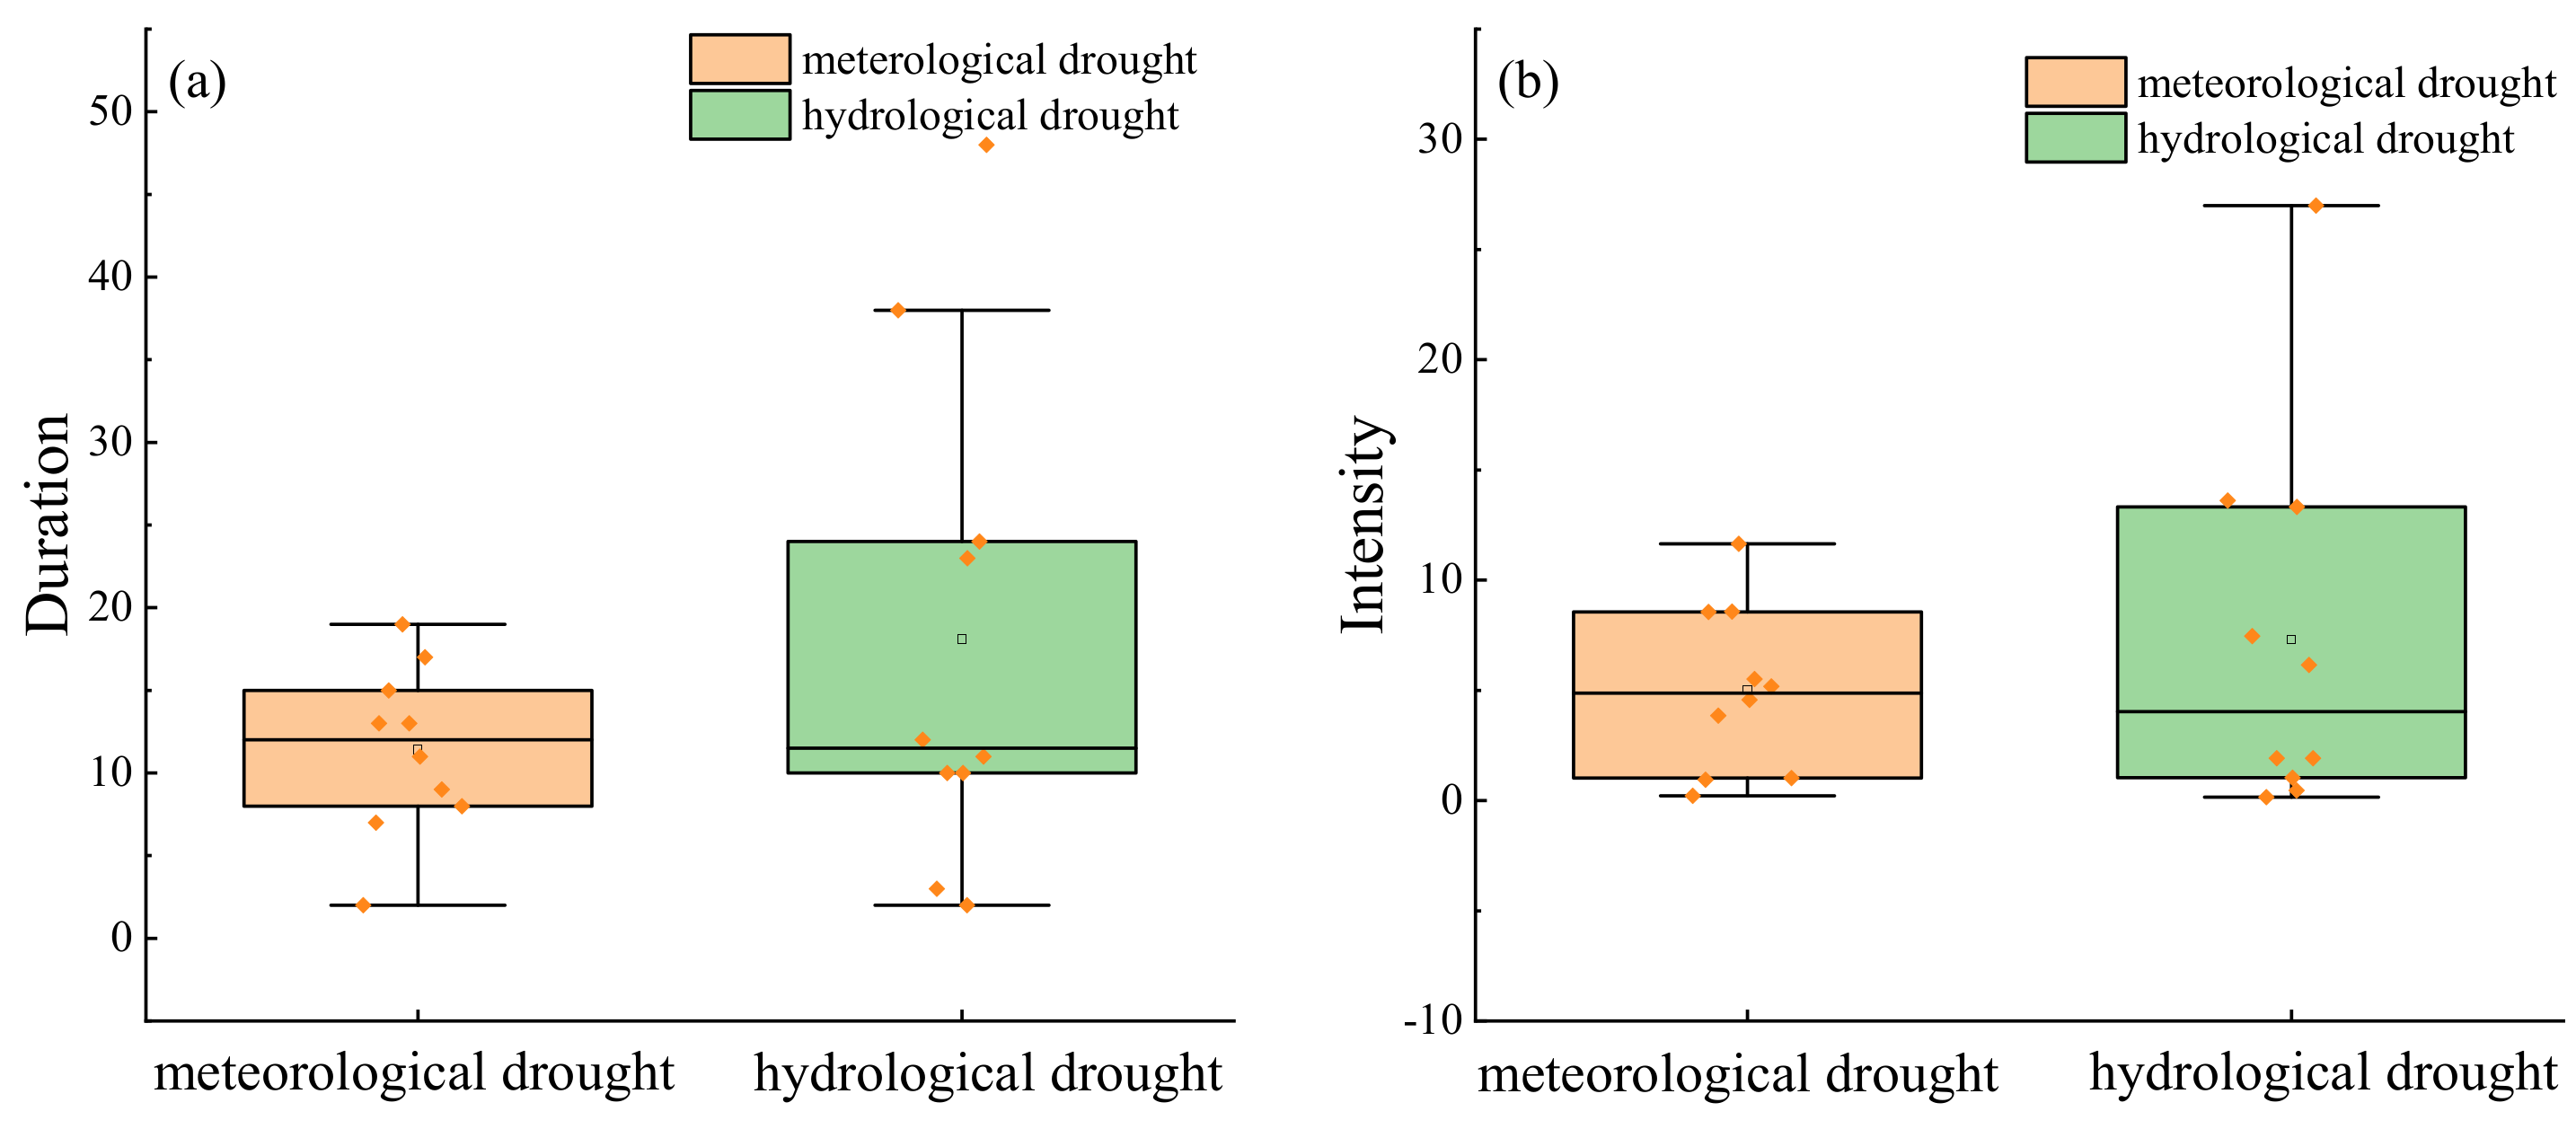
The box plot in Figure 11 shows the annual characteristics of the meteorological and hydrological droughts. The duration of the meteorological drought events was relatively short, concentrated within approximately 11 months. The duration of the hydrological drought events was longer, concentrated within approximately 18 months. The average intensity of the meteorological drought events was 5, whereas that of the hydrological drought events was 7. The values indicate that meteorological droughts are characterized by shorter and more concentrated durations and intensities, whereas hydrological droughts have longer and more scattered durations and intensities with greater severity.

Figure 11.
Box chart of annual drought characteristics in the MRB. Figure (a) shows the duration months of meteorological and hydrological drought events. Figure (b) shows the cumulative index values of meteorological and hydrological drought events from their onset to their end. The orange-yellow dots represent the characteristic values of drought events.
3.3.5. Evolution Trend of Multi-Scale Drought at Different Stations
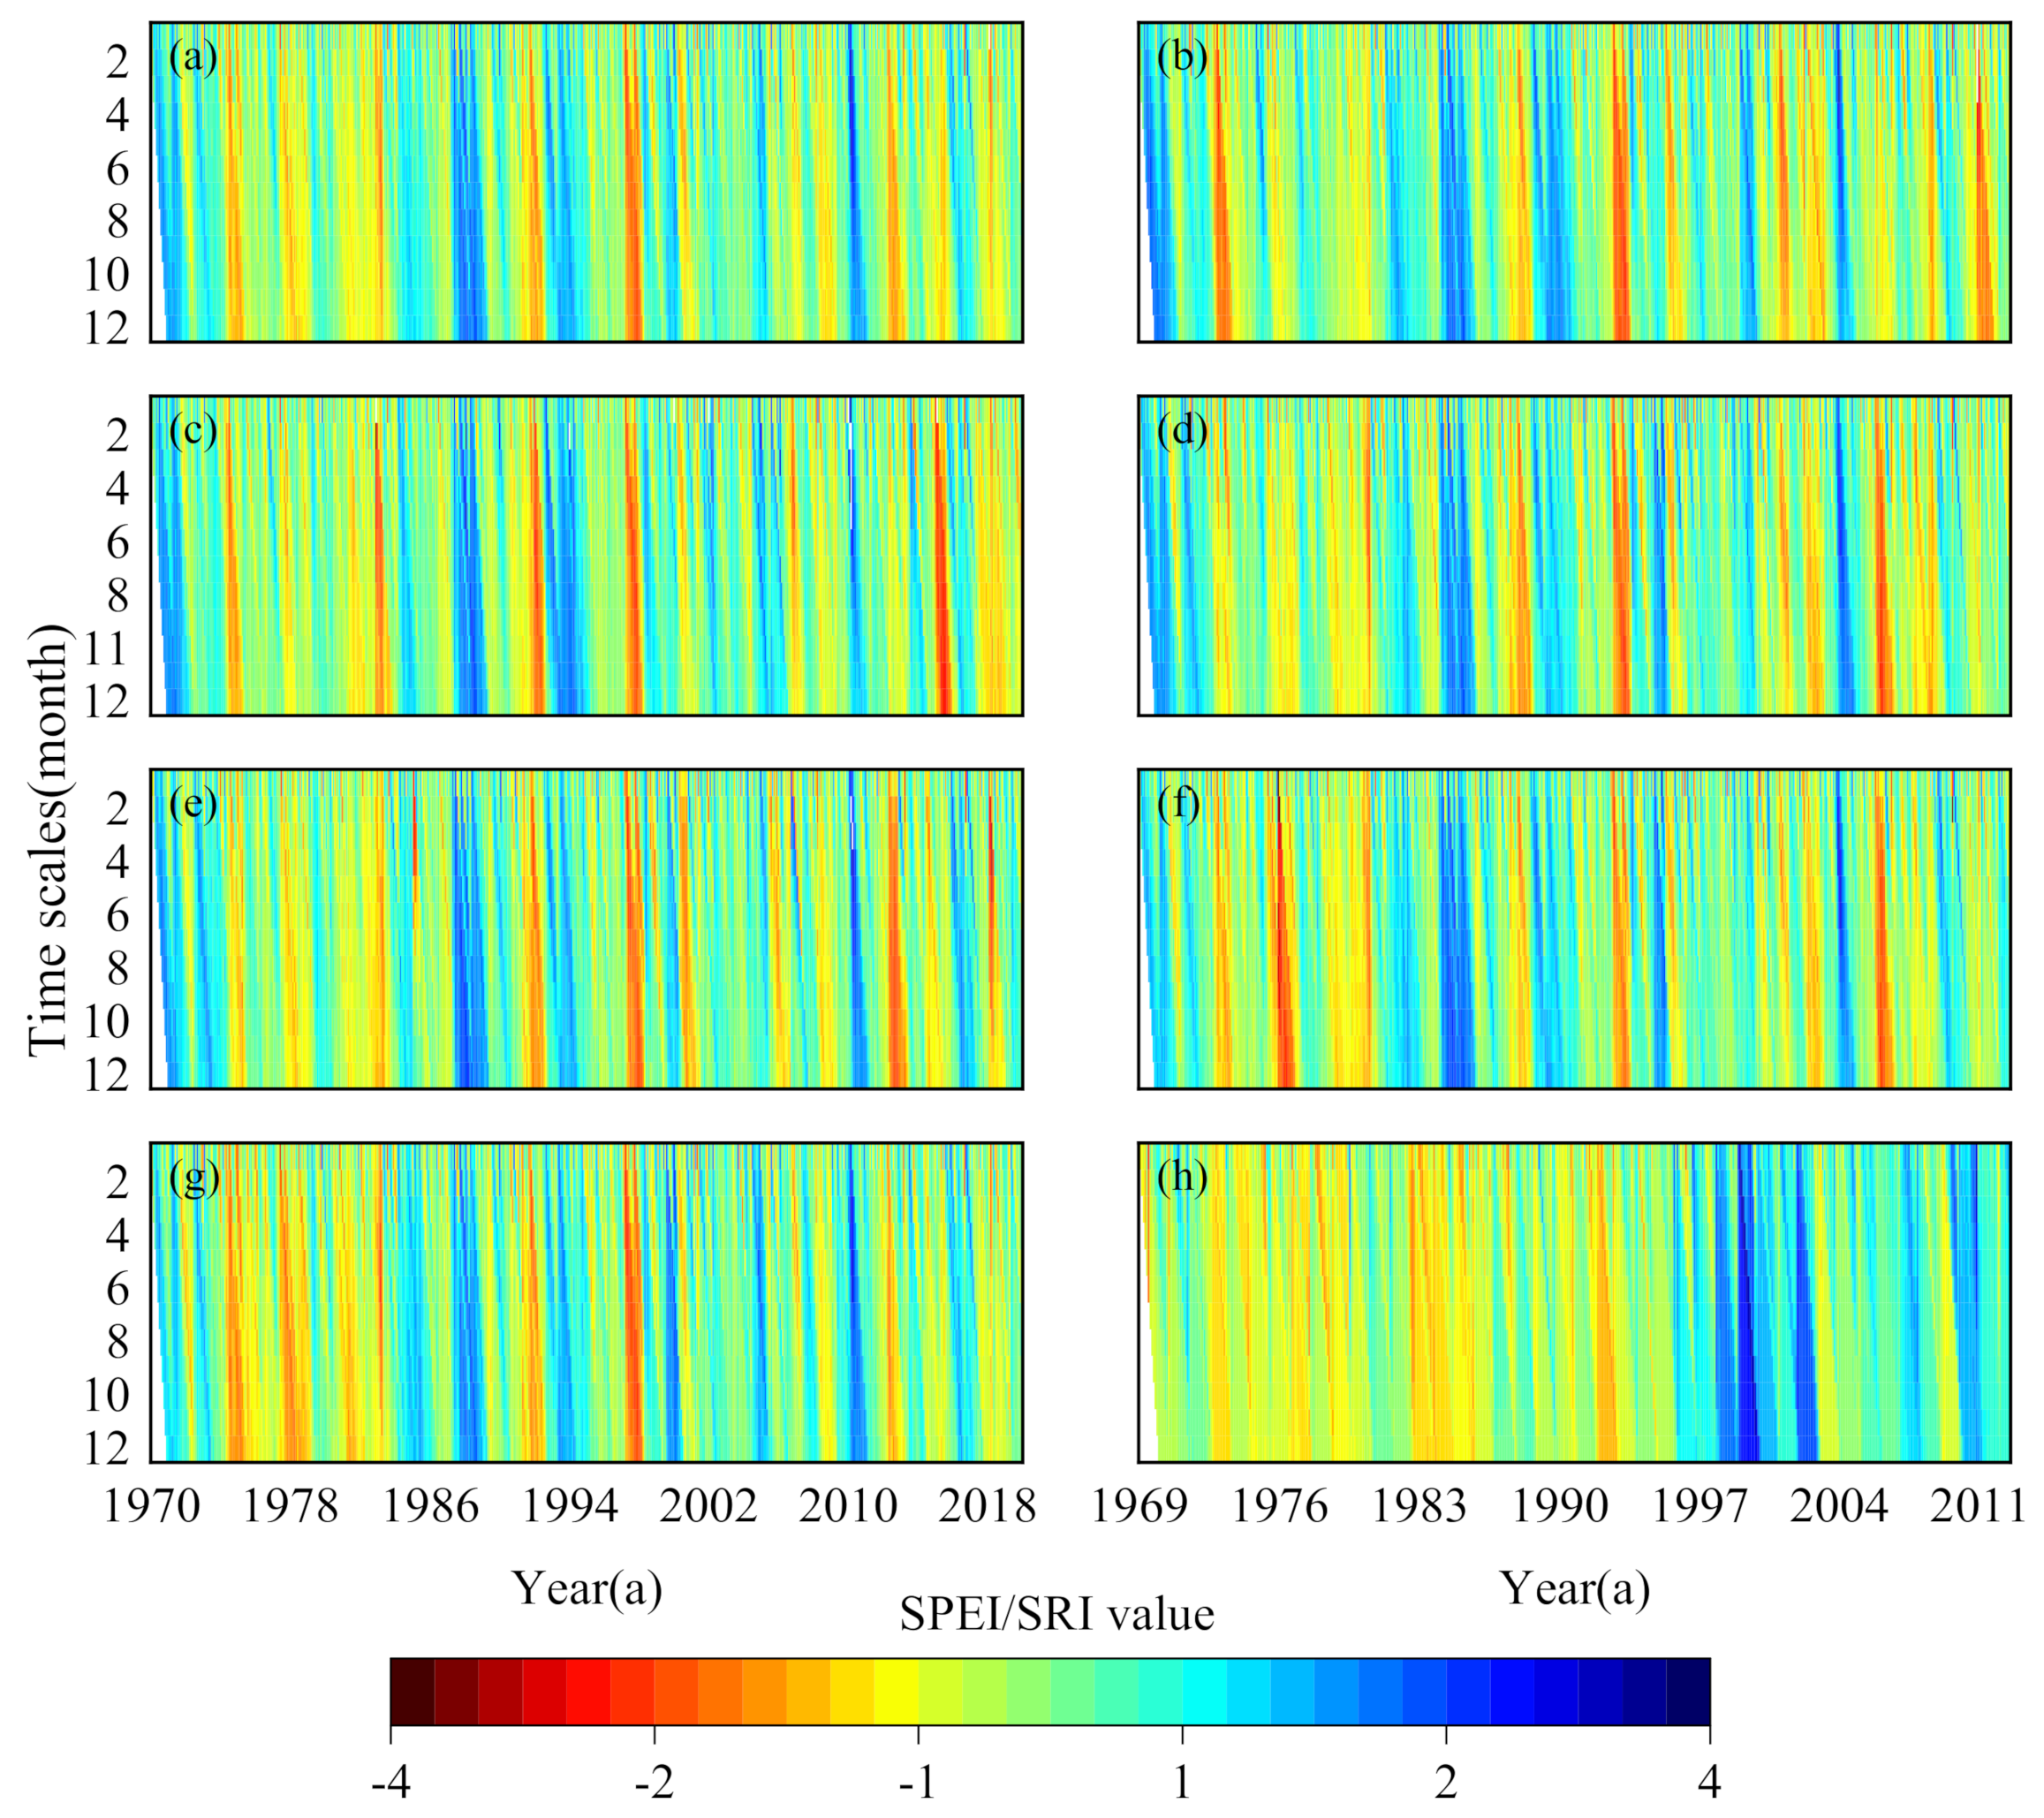
To comprehensively analyze the multi-timescale evolution of drought in the MRB, data from six meteorological stations and one hydrological station in the basin were selected to calculate the SPEI and SRI values. Over the past 50 years, the frequency of meteorological droughts across the entire river basin (Figure 12a) has been high, with drought events of varying severity occurring in more than half of the years. Yellow and red bands appeared in 1974, 1977, 1992, and 1997, indicating that relatively severe droughts occurred during this period. In these four years, SD, MD, MD, and ED occurred. The Paotai station (Figure 12b) generally exhibits a characteristic drought–humid–drought pattern, with MD events occurring in 1996 and 1997 and ED events occurring in 1974 and 1997, which is consistent with the historical data. Mosso Bay (Figure 12c) experienced five relatively severe droughts, characterized by frequent alternating dry and wet years after 1984. The Shihezi, Shawan, Ulan Wusu, and Manas stations (Figure 12d–g) experienced long drought durations before 1984 and relatively short drought durations after 1984. Among these years, 1987, 1988, and 1993 were wet years. In general, the drought evolution characteristics over multiple time scales at the six meteorological stations were consistent, with droughts occurring relatively easily. From 1970 to 1996, hydrological drought occurred more frequently, except for 1972, 1982, and 1994, when the watershed was wet and the remaining years were dry. After 1996, the watershed changed from dry to wet, with a noticeable increase in moisture content. Overall, the hydrological dry–wet state from 1970 to 2012 showed a trend characteristic of drought–wet–drought.
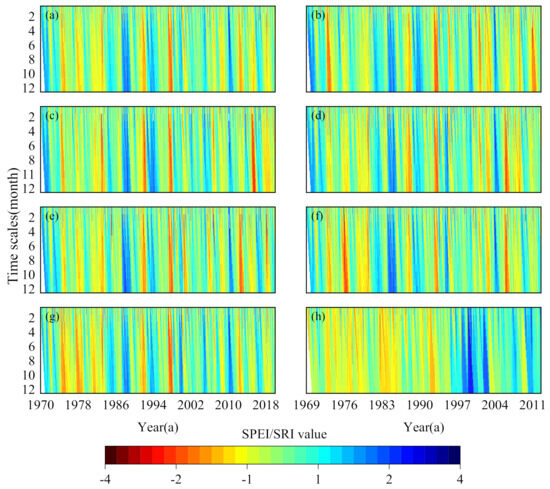
Figure 12.
Hovmoller-type maps of the meteorological drought and hydrological drought at different time scales (1–12 months) in the MRB. Subfigures (a–h) represent the 50–year evolution characteristics of meteorological drought in the whole basin, the 50–year evolution characteristics of meteorological drought at all stations in the basin, and the 50–year evolution characteristics of hydrological drought, respectively.
4. Discussion
4.1. Characteristics of Drought and Runoff Changes
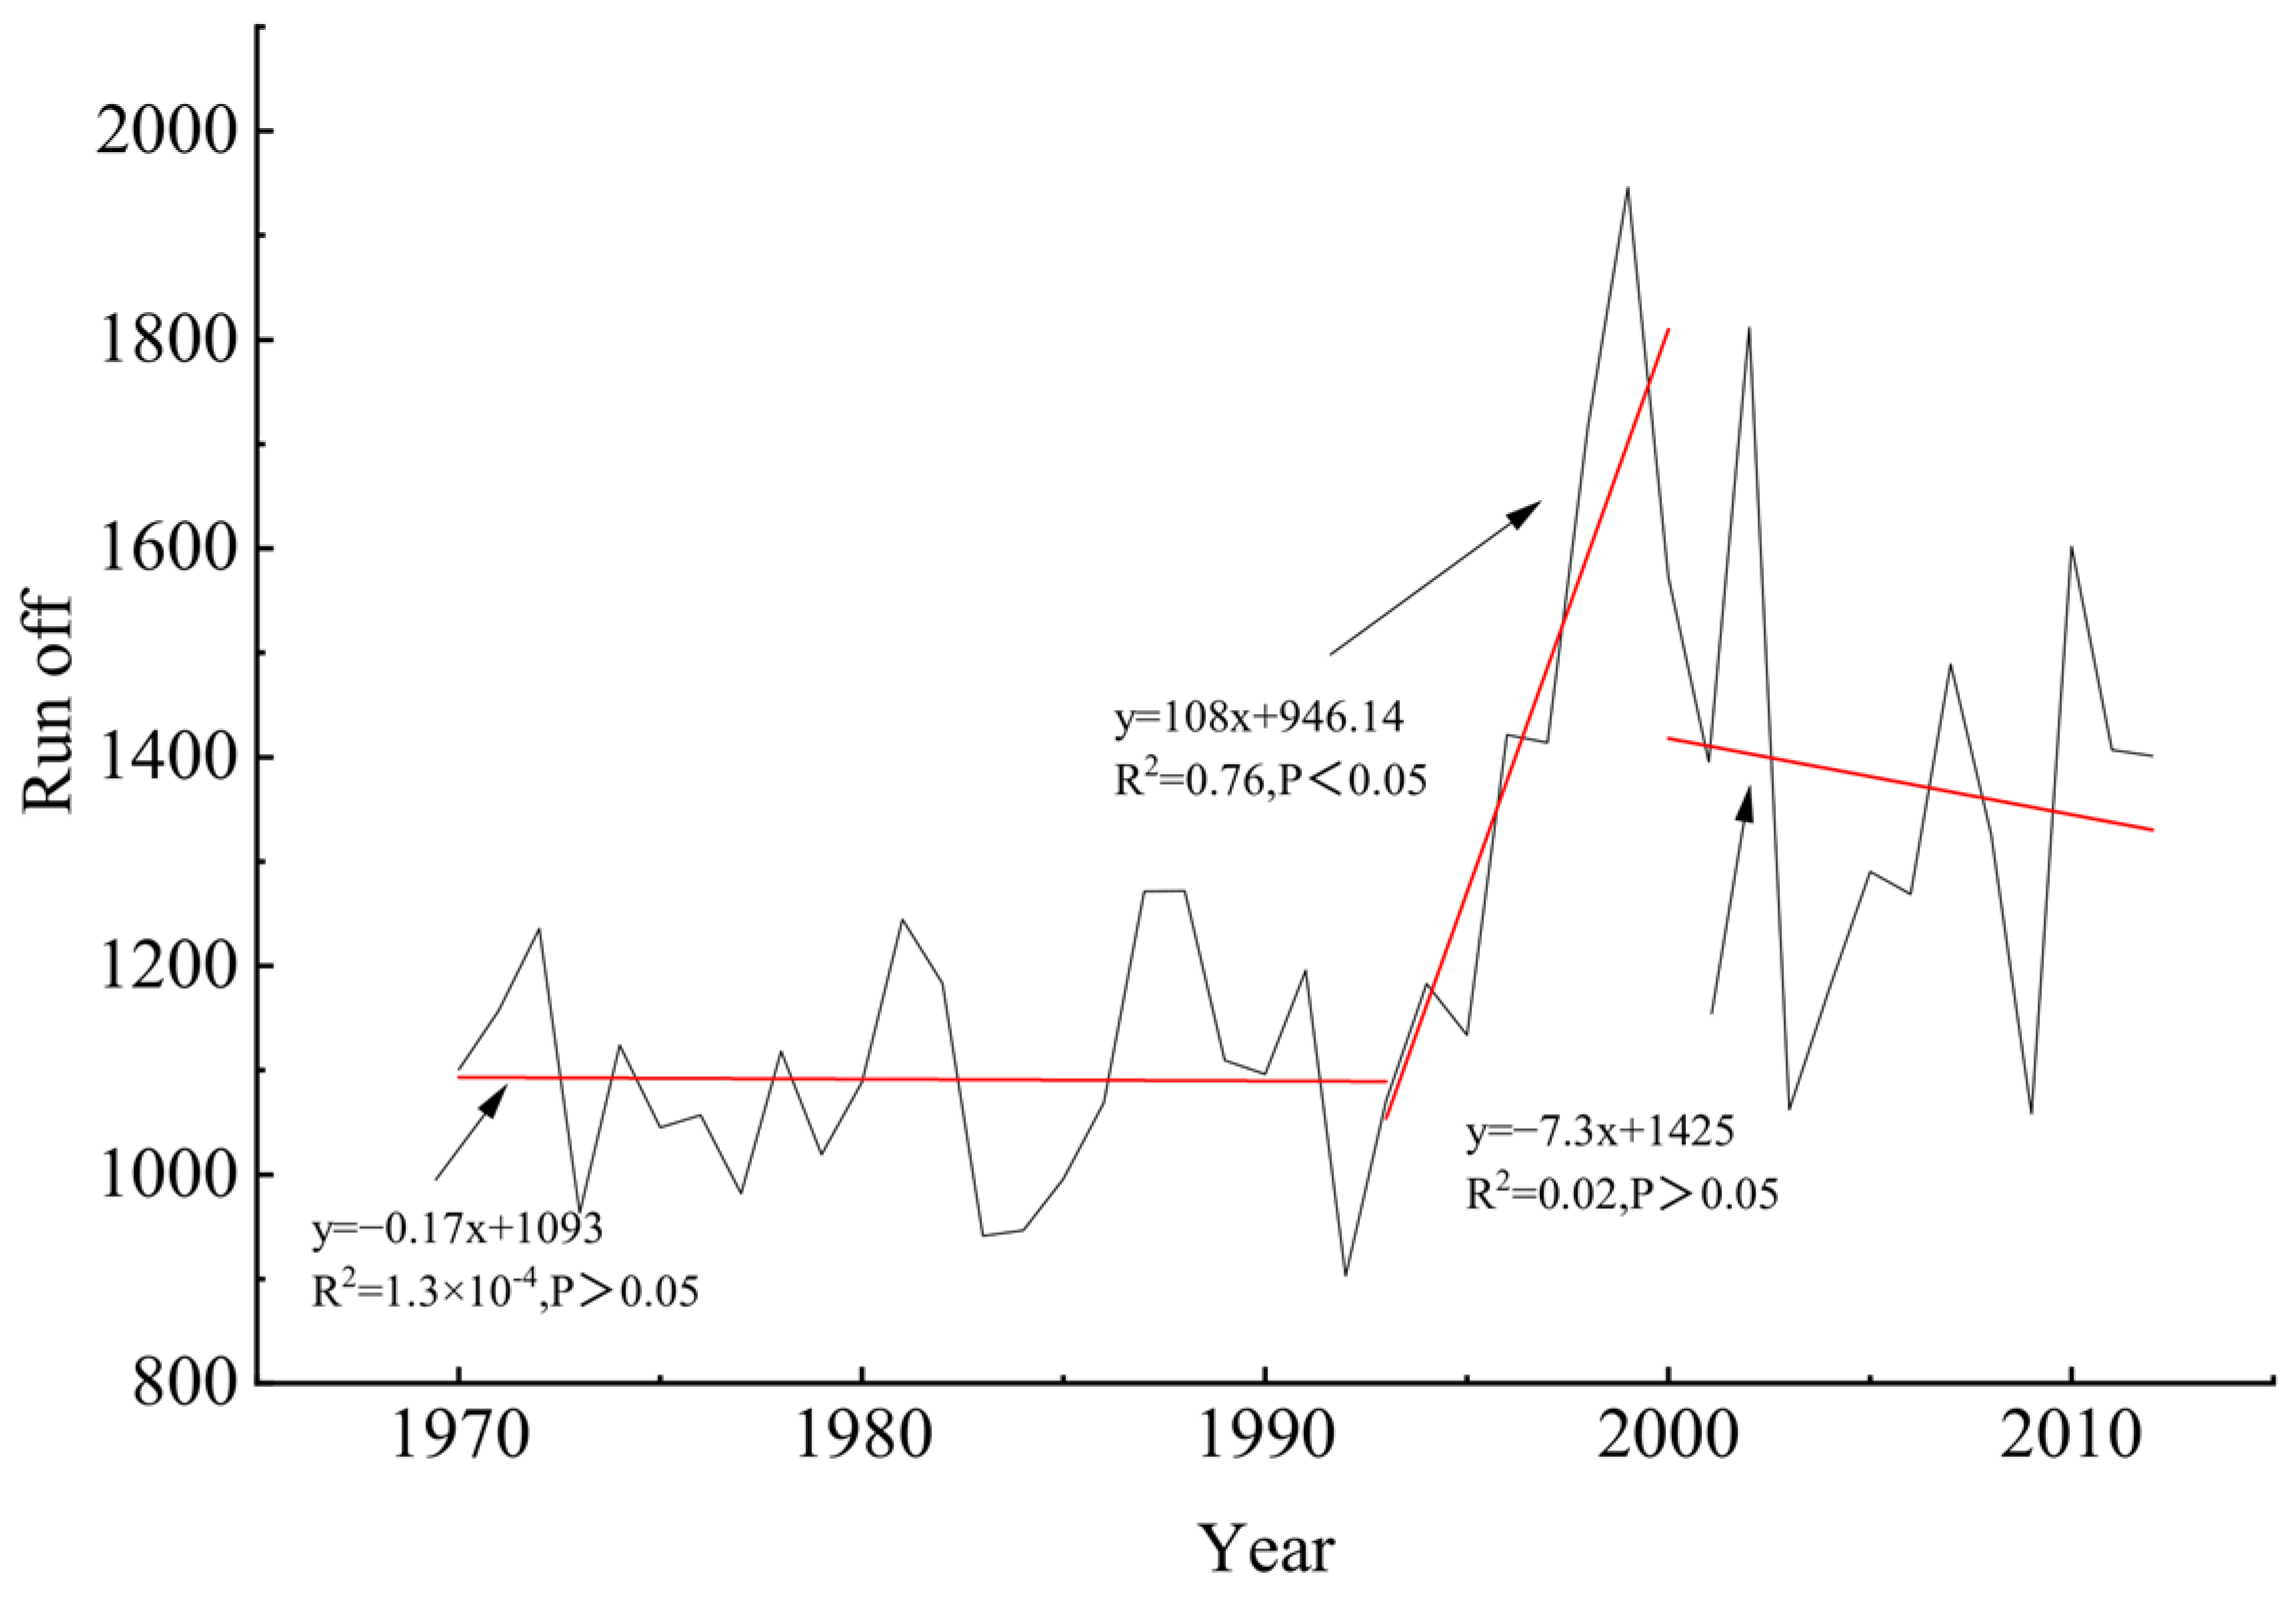
This study found that the precipitation and temperature in the study area showed increasing trends, which aligns with the conclusion of [35] that the northwestern climate would transition to warm and wet conditions. The meteorological drought in the MRB has a weakening trend, but the trend is not obvious, and it maintains a relatively stable state. Seasonally, winter droughts have decreased significantly in recent years, which is related to the increase in rainfall. The weakening trend of hydrological drought is very significant and is closely related to runoff. The MRB, located in the middle of the northern foot of the Tianshan Mountains in Xinjiang, is a typical arid inland area with limited rainfall and intense evaporation. Its river runoff is mainly supplied by mountainous and glacial snowmelt. Some studies have found that with global warming, rising temperatures are causing snowline shifts and mountain snowmelt. Consequently, the overall snow cover area in the MRB showed a downward trend, and the melting of snow and ice significantly increased the recharge of the water inflow of the river, which weakened hydrological droughts and transitioned from drought to wetting [36,37]. Figure 13 shows that the UF and UB runoff curves in the MRB intersected in 1993 and experienced abrupt changes, resulting in a significant increase in runoff after 1993. This finding is consistent with the conclusion of Zhang Zhengyong [38] that the runoff cycle experienced a sudden change in the early 1990s. In Figure 14, the slope of the fitting trend line for runoff from 1993 to 2000 increased significantly, and the slope of the fitting trend line changed from positive to negative from 2000 to 2012; it showed that runoff experienced characteristics of first an increase and then a decrease. Additionally, the drought index SRI in Figure 12h also experienced a period of change from significant wetness to a decreasing wetting degree. The reasons for the significant increase in runoff during the 1990s and the subsequent slight decrease in the 21st century were further analyzed. This increase was primarily attributed to the acceleration of glacier retreat in the Tianshan Mountains during the 1990s. However, glacier retreat slowed or stabilized after the 21st century [39]. Runoff from the Manas River is closely related to the reduction in glacier area and thinning of glacier thickness. Because meltwater is the primary source of runoff in the MRB, its hydrological processes and characteristics are primarily determined by the water stored in ice and snow during winter [40].
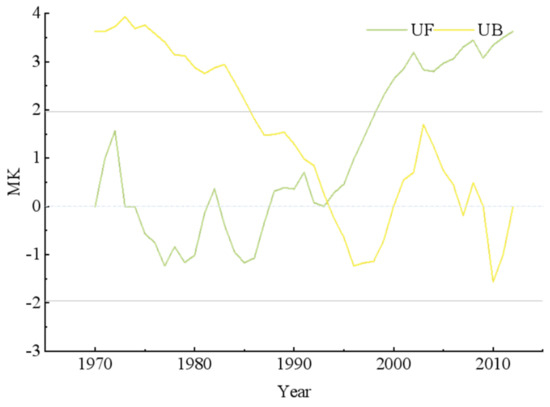
Figure 13.
Mann–Kendall mutation detection of runoff sequence in MRB.
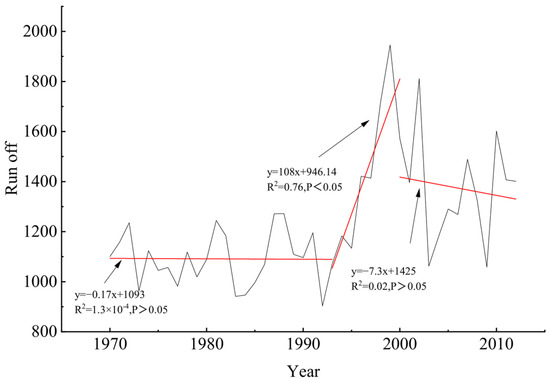
Figure 14.
Fractional fitting trend of runoff series in MRB.
4.2. Relationship between Meteorological and Hydrological Droughts
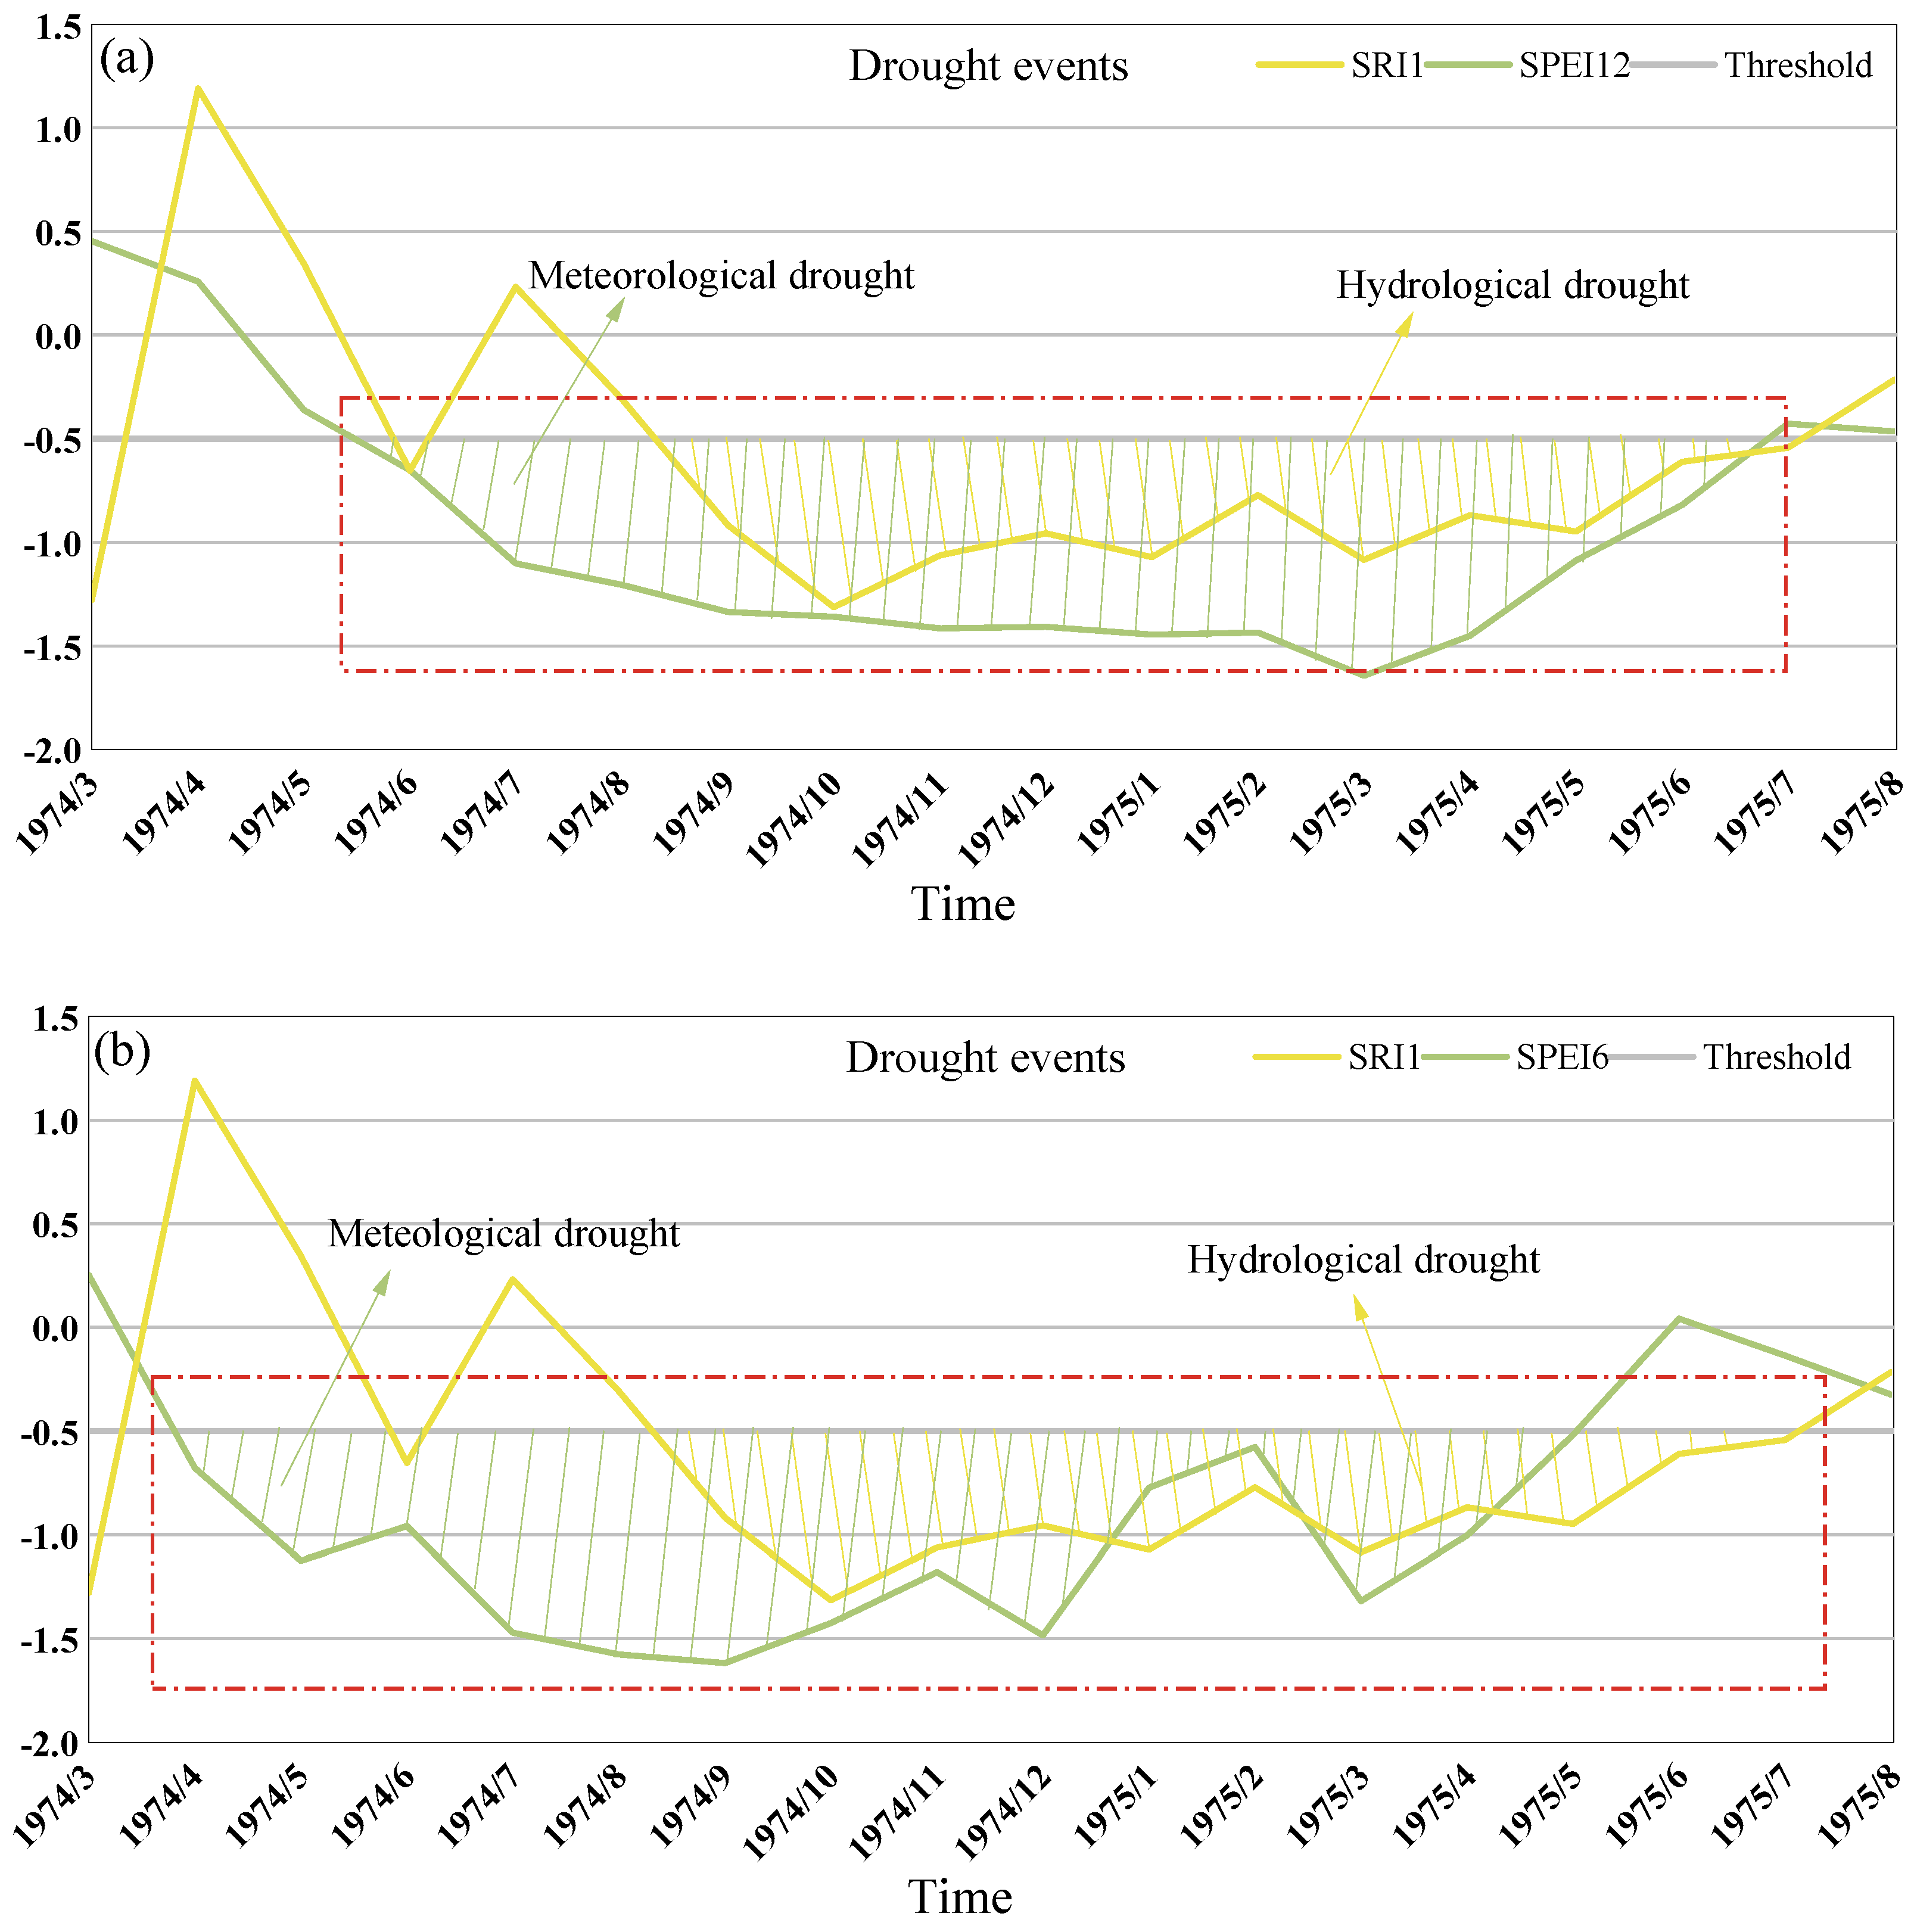
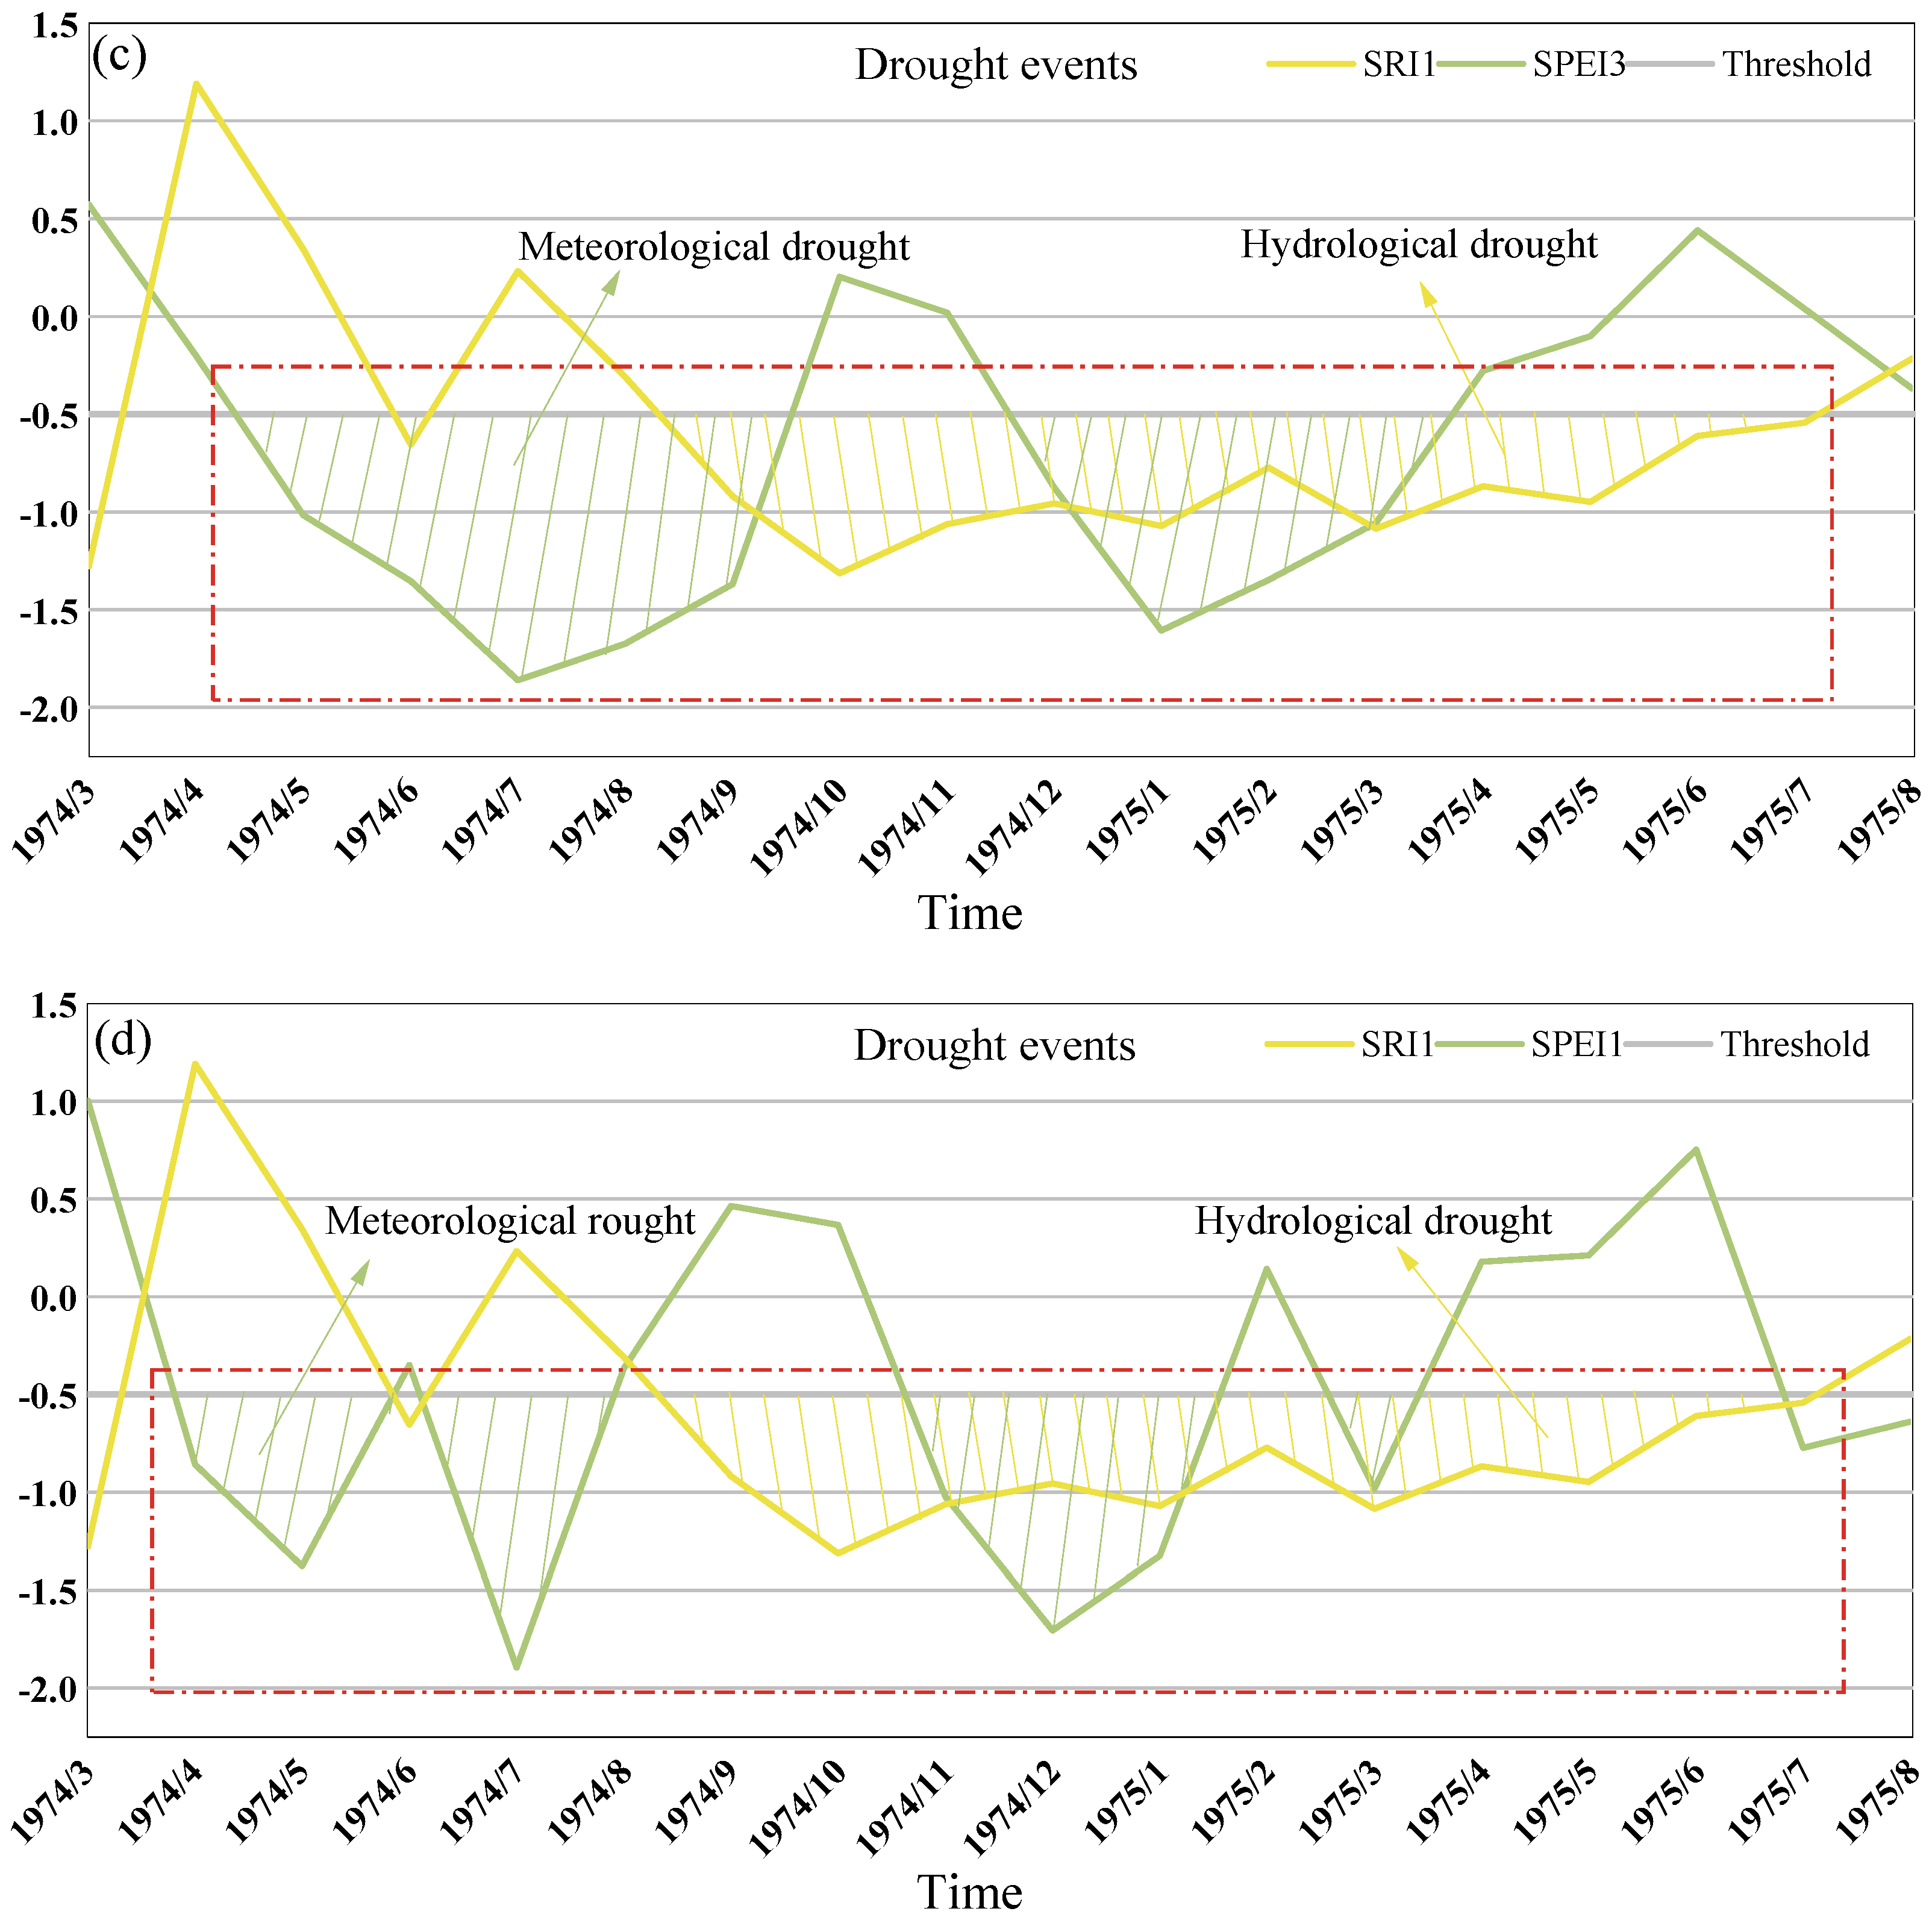
Generally, hydrological drought occurs later than meteorological drought, with a noticeable delay between the two phenomena. According to [41], hydrological drought in the Pearl River Basin lags behind meteorological drought by 2–6 months. The authors of [42] found that hydrological drought in the source region of the Yellow River lags meteorological drought by 3–6 months, and other studies [43] have also demonstrated a lag effect in the propagation of meteorological and hydrological droughts. To examine drought propagation in the MRB, the SPEI and SRI at the 1-, 3-, 6, and 12-month scales of typical drought events from March 1974 to August 1975 were selected for analyses. The yellow- and green-shaded areas represent hydrological drought and meteorological drought, respectively. Drought occurrence is typically defined as a period when the drought index falls below −0.5 for two consecutive months. As shown in Figure 15a, the annual meteorological drought events began in June 1974 and ended in July 1975. Hydrological drought events began in September 1974 and ended in August 1975. Notably, the hydrological drought event occurred three months after the onset of the meteorological drought event and ended one month later. On a seasonal scale, the hydrological drought started five months after the meteorological drought and ended three months after the meteorological drought. In general, the duration of a drought event increases over time. However, except on the annual scale, the peak hydrological drought lagged behind the peak meteorological drought. These findings indicate a time lag between meteorological and hydrological droughts, which are consistent with the previous research results.
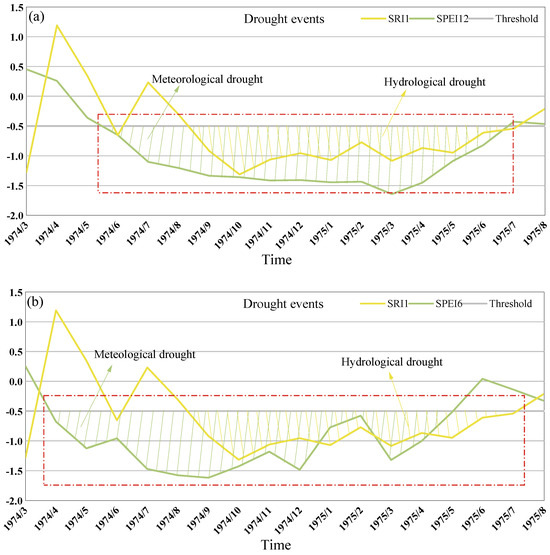
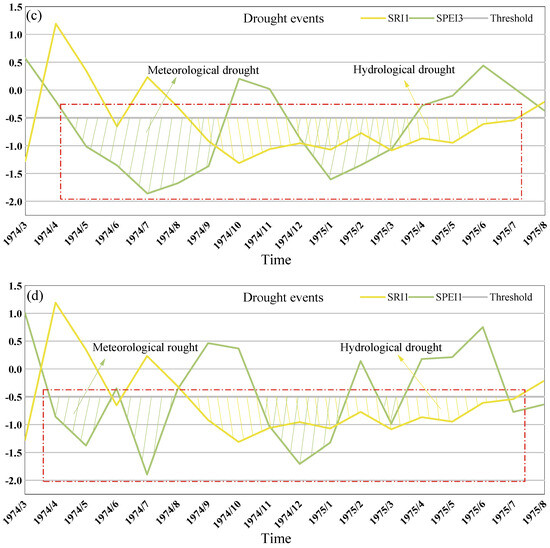
Figure 15.
Spatial distribution of the variance of the groundwater table contrast coefficient. (a–d) represents the lag relationship between meteorological drought at four time scales and monthly scale hydrological drought in typical drought events. The red dotted frame represent the beginning to the end of the drought.
5. Conclusions
- (1)
- Both meteorological and hydrological droughts decreased, and hydrological droughts decreased significantly. Meteorological droughts tended to increase in spring and autumn, whereas the basin became wetter during winter. The dry and wet conditions in spring and autumn remained relatively stable, with no abrupt changes. Abrupt changes in summer and winter occurred around 1983 and 1993, respectively, from drought to humidity. Except in spring, the SRI did not decrease significantly, and the SRIs in summer, autumn, and winter increased significantly (p < 0.01), indicating a shift from drought to humidity and a weakening of seasonal drought.
- (2)
- Meteorological droughts at different time scales and intensities exhibited similar characteristics. Light and moderate droughts are commonly observed at the annual and seasonal scales, whereas severe and extreme droughts are relatively infrequent. In terms of geographic distribution, the northern part of the study region has experienced frequent light and extreme droughts, whereas the southern part has tended to experience more severe droughts during the summer months. Conversely, severe droughts in autumn were more likely to occur in the north. Basin managers can make appropriate water resource allocation plans based on this to effectively reduce the probability of drought. In addition, in this study, Shawan and Mosso Bay are prone to severe and extreme droughts, so it is important for watershed managers to pay more attention to prevention. From the perspective of meteorological drought frequency, there were no significant changes in the occurrence of light or moderate droughts during the 2010s. However, the frequency of severe and extreme droughts increased during the same period. Hydrological droughts have become less common since the 1990s. Overall, these findings suggest that the frequency of severe and extreme droughts has increased, whereas the frequency of light and moderate droughts has remained relatively stable.
- (3)
- The significant increase in runoff in the MRB during the 1990s could be related to the accelerated glacier retreat that occurred at the same time in the central and western Tianshan Mountains. Hydrological drought, which follows meteorological drought, is inevitably delayed and occurs after meteorological drought.
Author Contributions
Y.D.: Conceptualization, Methodology, Investigation, and Writing the original draft. H.T.: Validation, Data curation, Visualization, and Writing—review and editing. M.A.F.: Validation, Data curation, Visualization, and Writing—review and editing. G.Y.: Visualization and Formal analysis. Y.L. and X.L.: Resources, Supervision and Writing—review and editing. P.L.: Visualization and Formal analysis. Y.G.: wrote, reviewed, and edited the manuscript. X.H.: writing, reviewing, and editing. F.L.: Resources, Supervision, and Writing—reviewing and editing. B.L.: Writing—review and editing. All authors have read and agreed to the published version of the manuscript.
Funding
This research was supported by the National Natural Science Foundation of China (52269006), Projects of Xinjiang Production and Construction Corps (2022BC001, 2023TSYCCX0114, 2022DB023, 2023AB059), Project of Shihezi (2023NY01), and The Third Xinjiang Scientific Expedition Program (2021xjkk0804).
Data Availability Statement
The original contributions presented in this study are included in the article. Further inquiries can be directed to the corresponding authors.
Acknowledgments
We acknowledge the Key Laboratory of Cold and Arid Regions Eco-Hydraulic Engineering of Xinjiang Production and Construction Corps.
Conflicts of Interest
The authors declare no conflicts of interest.
References
- Wang, R.; Zhang, X.; Guo, E.; Cong, L.; Wang, Y. Characteristics of the Spatial and Temporal Distribution of Drought in Northeast China, 1961–2020. Water 2024, 16, 234. [Google Scholar] [CrossRef]
- Chen, W.H.; Xu, J.; Li, S.C. Study on meteorological and hydrological drought characteristics in the lower reaches of Nujiang River Basin. Acta Sci. Nat. Univ. Pekin. 2019, 55, 764–772. [Google Scholar]
- Xue, H.Z.; Li, Y.Y.; Dong, G.T. Analysis of spatiotemporal variation of meteorological drought in Hexi Corridor based on SPEI index. Chin. J. Agrometeorol. 2022, 43, 923–934. [Google Scholar]
- Zhang, L.; Zhang, Z.; Peng, Z.; Xu, Y.; Zhang, Y.; Mao, J. Linkages between Meteorological and Hydrological Drought in the Jinsha River Basin under a Changing Environment. Water 2023, 15, 3644. [Google Scholar] [CrossRef]
- Jiang, D.B.; Wang, X.X. Interpretation of drought change in IPCC Sixth Assessment Report. Trans. Atmos. Sci. 2019, 44, 650–653. [Google Scholar]
- Zhang, X.; Huang, S.Z.; Guan, Y.H. Research progress, challenges and prospects of drought propagation. Adv. Earth Sci. 2023, 38, 563–579. [Google Scholar]
- Mo, C.; Tang, P.; Huang, K.; Lei, X.; Lai, S.; Deng, J.; Bao, M.; Sun, G.; Xing, Z. Evolution of Drought Trends under Climate Change Scenarios in Karst Basin. Water 2023, 15, 1934. [Google Scholar] [CrossRef]
- Gao, F.; Liu, J.; Chen, W.; Yang, S.K.; Feng, H. Study on meteorological and hydrological drought propagation characteristics and response probability in the upper reaches of Huaihe River Basin. Res. Soil Water Conserv. 2023, 30, 257–265. [Google Scholar] [CrossRef]
- Mukti, R.S.; Wei, M.X.; Christopher, B.E.; Sandra, R.H.; Ming, Y. Tree mortality and biomass loss in drought-affected forests of East Texas, USA. J. For. Res. 2021, 32, 67–80. [Google Scholar]
- Chen, Y.N.; Li, Z.Q.; Xu, J.H.; Shen, Y.J.; Xing, X.X.; Xie, T.; Li, Z.; Yang, L.S.; Xi, H.Y.; Zhu, C.G.; et al. Changes of water resources and ecological environment in arid area of Northwest China and their protection suggestions. Bull. Chin. Acad. Sci. 2023, 38, 385–393. [Google Scholar]
- Yang, D.; Xiong, W.; Xu, Y.L. Impacts of climate change on water resources and agriculture in Africa. Chin. J. Agrometeorol. 2016, 37, 259–269. [Google Scholar]
- Yang, S.K.; Liu, J.; Zhang, T.; Peng, T.; Chang, W.J. Study on the probability of meteorological and hydrological drought characteristic variables response in the upper reaches of Hanjiang River. Water Resour. Prot. 2023, 39, 143–151. [Google Scholar] [CrossRef]
- Li, X.; Jiao, Y.; Liu, J. Changes in Drought Characteristics in the Yellow River Basin during the Carbon-Neutral Period under Low-Emission Scenarios. Water 2024, 16, 1045. [Google Scholar] [CrossRef]
- Cao, S.P.; Zhang, L.F.; He, Y.; Zhang, Y.L.; Chen, Y.Y.; Sheng, Y.; Wang, S.Q. Effects and contributions of meteorological drought on agricultural drought under different climatic zones and vegetation types in Northwest China. Sci. Total Environ. 2022, 821, 153270. [Google Scholar] [CrossRef] [PubMed]
- Liu, Q.; Huo, A.; Zhao, Z.; Zhao, X.; Rebouh, N.Y.; Luo, C. Spatial Differentiation and Influencing Factors Analysis of Drought Characteristics Based on the Standardized Precipitation Index: A Case Study of the Yellow River Basin. Water 2024, 16, 1337. [Google Scholar] [CrossRef]
- Xu, Y.R.; Lu, F.; Xie, Z.B.; Zhu, K.; Song, X.Y. Meteorological and hydrological drought characteristics and their response relationship in Chaobai River Basin. Agric. Res. Arid. Areas 2019, 37, 220–228. [Google Scholar]
- Xue, L.Q.; Bai, Q.Y.; Liu, Y.H. The propagation of meteorological drought to hydrological drought in Tarim River Basin under the influence of human activities. Water Resour. Prot. 2019, 39, 57–72. [Google Scholar]
- Meng, D.; Huang, S.Z.; Huang, Q.; Zheng, X.D.; Su, X.L.; Leng, G.Y.; Li, Z.Y.; Fang, W.; Liu, Y.J. Propagation characteristics and mechanism from meteorological to agricultural drought in various seasons. J. Hydrol. 2022, 610, 127897. [Google Scholar]
- Liu, Q.; Yang, Y.T.; Liang, L.Q.; Jun, H.; Yan, D.H.; Wang, X.; Li, C.H.; Sun, T. Thresholds for triggering the propagation of meteorological drought to hydrological drought in water-limited regions of China. Sci. Total Environ. 2023, 876, 162771. [Google Scholar] [CrossRef]
- Qiong, F.L.; Peng, F.H.; Yong, C.H.; Xing, Y.H.; Tian, S.Z.; Guo, B.L.; Hong, J.W. Investigation to the relation between meteorological drought and hydrological drought in the upper Shaying River Basin using wavelet analysis. Atmos. Res. 2020, 234, 104743. [Google Scholar]
- Gao, Q.; Sun, J.W.; Zhao, X.X.; Wu, L.F.; Zhao, J. Multi-scale spatiotemporal characteristics of drought in China based on SPEI. Water. Saving. Irrig. 2024, 6, 111–120+127. [Google Scholar]
- Muhammad, J.; Muhammad, N.S.; Joo-Heon, L.; Tae-Woong, K. Investigating effect of climate change on drought propagation from meteorological to hydrological drought using multi-model ensemble projections. Stoch. Environ. Res. Risk Assess. 2020, 34, 7–21. [Google Scholar]
- Li, S.; Zeng, L.; Zhang, C.J.; Xiao, Q.; Zhang, Q.; Gong, W.T. Temporal and spatial variations of meteorological drought and hydrological drought in the upper reaches of the Yangtze River in recent 120 years and their transmission characteristics. Clim. Chang. Res. 2023, 19, 263–277. [Google Scholar]
- Qin, J.L.; Xue, L.Q. Spatial and temporal variation of vegetation and its relationship with topographic factors in Manas River Basin, arid region of Northwest China. Ecol. Environ. Sci. 2019, 29, 2179–2188. [Google Scholar]
- Chen, F.L.; Yang, K.; Cai, W.J. Research on hydrological drought index based on GAMLSS model: A case study of Manas River Basin. Geogr. Res. 2021, 40, 2670–2683. [Google Scholar]
- Thornthwaite, C.W. An approach toward a rational classification of climate. Geogr. Rev. 1948, 38, 55–94. [Google Scholar] [CrossRef]
- Fu, Y.H.; Shen, X.J.; Li, W.C.; Wu, X.; Zhang, Q.Q. Applicability of crop reference evapotranspiration calculation based on Hargreaves-Samani regression modification. Arid. Land Geogr. 2022, 45, 1752–1760. [Google Scholar]
- Wu, Z.J.; Cui, N.B.; Xu, J.Z.; Cui, Y.L.; Liang, J. Prediction of reference crop evapotranspiration in Guangxi Basin by improved Hargreaves-Samani model. J. Drain. Irrig. Mach. Eng. 2022, 40, 404–410. [Google Scholar]
- Shi, P.; Zhan, H.J.; Qu, S.M.; Feng, J.; Guan, X.X. Correlation analysis of meteorological drought and hydrological drought in the source region of the Yellow Rive. Water Resour. Prot. 2022, 38, 80–86. [Google Scholar]
- Chen, Y.; Shen, H.; Wang, X.H.; Zhao, W.K.; Pan, Z.J.; Wang, J.Y.; Li, S.Y.; Han, D. Urban energy carbon peak assessment method based on Mann-Kendall trend test. J. Shanghai Jiaotong Univ. 2023, 57, 928–938. [Google Scholar]
- Li, C.Y.; Cui, P.; Hao, J.S.; Zhang, G.T.; Wang, J. Variation characteristics of temperature and precipitation in southeast Tibet since 1960. Plateau Meteorol. 2019, 42, 344–358. [Google Scholar]
- Jia, Y.; Cui, N.B.; Wei, X.P.; Gong, D.Z.; Hu, X.T. Applicability evaluation of reference crop evapotranspiration algorithm in Yangtze River Basin based on inverse distance weighting method. Trans. Chin. Soc. Agric. Eng. 2016, 32, 130–138. [Google Scholar]
- Beshr Ashraf, A.A.; Kaloop, M.R. Using modified inverse distance weight and principal component analysis for spatial in-terpolation of foundation settlement based on geodetic observations. Open Geosci. 2022, 14, 1310–1323. [Google Scholar] [CrossRef]
- Shi, P.; Tang, H.; Qu, S.M. Characteristics of meteorological drought to hydrological drought propagation in Southwest China. Water Resour. Prot. 2019, 39, 49–56. [Google Scholar]
- Yao, J.Q.; Li, M.Y.; Dilinur, T.; Chen, J.; Mao, W.Y. Characteristics of climate warming and humidification at dif-ferent time scales in Xinjiang. Arid. Zone Res. 2022, 39, 333–346. [Google Scholar]
- Zhang, Z.Y.; Li, Z.Q.; He, X.L.; Liu, L.; Wang, P.Y. Research progress of glacier change and water resources in Manas River Basin. Res. Soil Water Conserv. 2014, 21, 332–337. [Google Scholar]
- Wang, Y.J.; Xu, L.P.; Guo, P.; Li, H.T. Trend analysis of ice and snow cover in Mahe River Basin from 1977 to 2013. Res. Soil Water Conserv. 2015, 22, 208–218. [Google Scholar]
- Zhang, Z.Y.; Liu, L.; Tang, X.L. Regional variation and abrupt change of precipitation in the Tianshan Mountains of China in recent 50 years. J. Arid. Land Resour. Environ. 2013, 27, 85–90. [Google Scholar]
- Yao, J.Q.; Li, M.Y.; Dilinur, T. The signal and influence of “wet-dry transition” in Xinjiang. Acta Geogr. Sin. 2021, 76, 57–72. [Google Scholar]
- Zhou, Z.Q.; Shi, H.Y.; Fu, Q.; Ding, Y.B.; Li, T.X.; Wang, Y.; Liu, S.N. Characteristics of Propagation from Mete-orological Drought to Hydrological Drought in the Pearl River Basin. J. Geophys. Res. Atmos. 2021, 126, e2020JD033959. [Google Scholar] [CrossRef]
- Han, R. Impact of Climate Change on Snow Melt in Manas River Basin. Master’s Thesis, Shihezi University, Shihezi, China, 2017. [Google Scholar]
- Zheng, L.H.; Liu, Y.; Ren, L.L.; Zhu, H.; Yi, H. Temporal and spatial characteristics of meteorological drought and hydrological drought in the Yellow River Basin. Water Resour. Prot. 2022, 38, 87–95+146. [Google Scholar]
- Zhi, X.F.; Tian, Y.T.; Chen, C.C. Research progress and prospects of drought transmission II: Influencing factors and prospects of drought transmission research. South-North Water Divers. Water Conserv. Sci. Technol. 2023, 21, 654–668. [Google Scholar]


Disclaimer/Publisher’s Note: The statements, opinions and data contained in all publications are solely those of the individual author(s) and contributor(s) and not of MDPI and/or the editor(s). MDPI and/or the editor(s) disclaim responsibility for any injury to people or property resulting from any ideas, methods, instructions or products referred to in the content. |
© 2024 by the authors. Licensee MDPI, Basel, Switzerland. This article is an open access article distributed under the terms and conditions of the Creative Commons Attribution (CC BY) license (https://creativecommons.org/licenses/by/4.0/).