Article

Strategy for Adapting Environmental Flow Proposals to Situations with High Agricultural Demands

1
Department of Ecology, Universidad Autónoma de Madrid, 28049 Madrid, Spain
2
Centro de Investigación en Biodiversidad y Cambio Climático Global (CIBC-UAM), Universidad Autónoma de Madrid, 28049 Madrid, Spain
*
Author to whom correspondence should be addressed.
Water 2024, 16(15), 2106; https://doi.org/10.3390/w16152106
Submission received: 19 May 2024 / Revised: 21 July 2024 / Accepted: 23 July 2024 / Published: 25 July 2024
(This article belongs to the Topic Hydrology and Water Resources Management)

Abstract

:
Managing water in catchments with high agricultural demands, particularly during periods of low natural flows, is a challenging task. Environmental flow regimes, which are based on monthly minimum values, may not be adequate to address issues associated with rivers that have complex hydrological alteration patterns. The technical solution that provides values to create a flow regime can often be impractical for addressing large problems that planners need to solve, especially when demands are high and resources are limited. This work proposes a new approach to the problem by recognising established agricultural uses and demands that reduce river flow. The focus is on reducing the changes in the hydrological regime by proposing an alternative environmental flow regime that is compatible with agriculture. Deviation from the natural flow of these rivers has been minimized through various processes. Initially, this was achieved by reducing irrigation flows through more efficient demand calculations. The results provide solutions for various hydrological alteration problems, in three rivers, Riaza, Duratón, and Eresma; the inverted regime was corrected, in Cega, Tormes, and Adaja, whose main problem was the reduction of peak flows; controlled peak flows that are compatible with the available water and demands are proposed; and finally in the Agueda river, the reduction in monthly flows was increased on a monthly basis. A new strategy is proposed for considering environmental aspects in the management of rivers with high demands, which improves the fixed schemes for determining environmental flows used in Mediterranean basins.

1. Introduction

Human activity has caused profound and sustained hydrological changes in a considerable part of our planet’s river network [1,2]. One of the most frequent alterations is the reduction in circulating flows [3] especially in countries where water demand from agriculture is very high. Associated alterations include changes in flow magnitude, as well as its frequency, duration, and timing. Modifications to the functioning and physical structure of fluvial systems affect habitats, biotic composition, and the sustainability of aquatic ecosystems in general [4,5]. A comprehensive understanding of these impacts will facilitate more effective remediation strategies.
To address these problems, environmental flow (e-flow) regimes started to be implemented, setting a minimum flow in rivers as the most widespread solution in many situations of hydrological alteration. Extensive experience exists in both the methods and the determination of e-flow regimes.
Attention was initially focused on developing a method to estimate a single flow rate, a minimum limit to ensure river conservation. This was calculated using two main types of methodologies: hydrological [6] and habitat simulation [7]. By the 1990s, a paradigm shift had taken place, with the introduction of the concept of an e-flow regime and the consideration not of a single flow rate but a group of flow values with a similar seasonal variation to the natural regime [4,8].
As the number of available methods increased, the first compilations attempting to rate and assess them appeared [9]. At the same time, new studies sought to calibrate hydrological alterations using sets of indices that measured deviations from natural river regimes in terms of not only the magnitude but also the frequency, duration, and timing of extreme, minimum, and maximum flows. The definition of admissible intervals for alterations of flow regime components was also used to set or propose e-flow regimes. This is the strategy used, for instance, in RVA [10].
The more complex methods that subsequently emerged could be classified as holistic, including BBM [11,12], the ELOHA method [13,14], and the DRIFT method [15]. Holistic methods are a combination of hydrological, hydraulic, and habitat simulation methods plus expert knowledge. For a more complete and up-to-date review of these methods and the improvements they bring, see the work of Pastor, et al., 2014, and Acreman et al., 2014 [16,17].
From the above, it is possible to infer some initial conclusions that will inform the methodology presented in this work. First, it is important to consider the minimum flow and seasonal changes within natural limits. Second, the hydrological alteration should be used to define how far the proposed values of the different regime components can be modified. Acceptable differences in deviation from the natural regime will be derived from the planning objectives it is aimed to achieve. In order to measure these alteration limits, it is necessary to know the relationships established between the flow regime components and the functioning of the system in order to know the severity of the consequences when they are altered.
It is crucial to recognise that all methods can be effective, contingent on the intended use. This work does not aim to select or criticise methods; rather, it focuses on defining the objectives to be achieved when they are applied to a particular river. This brings us to the field of planning. If the objective is to achieve the highest degree of river conservation, the e-flow will maintain a close alignment with the natural flow regime. If the objective is to reconcile conservation with human uses—and these are of high importance—it will be necessary to consider a scenario of flow reduction, always within an acceptable range.
E-flow as a planning tool has been included in many legal texts in some European countries, particularly those in the Mediterranean region, such as Spain, Italy, France, and Portugal, which have been actively addressing this issue [18,19,20]. However, there are variations in the depth and the legal terminology used in these efforts [21,22,23,24]. The Water Framework Directive [25] introduced changes in the way the ecological status of river ecosystems is perceived, and includes the evaluation and improvement of hydrological and morphological aspects, where e-flow has a place. The goal of maintaining healthy river ecosystems justifies seeking solutions even in rivers that have heavily altered flow regimes [26].
Although the Water Framework Directive is a legislative text of enormous importance, the criteria related to the conservation of the natural flow regime in order to achieve a “good” status are not as standardised as those relating to physico-chemical or biological quality elements, and leave room for biased interpretations of how to address and solve it [27]. E-flow has become an essential tool to solve this deficiency. The incomplete consideration of hydrological alteration in the WFD methods for defining ecological status may be the reason why no detailed work has been carried out to incorporate an ecological flow proposal into the planning numbers. This has resulted in considerable tensions among users, who perceive that e-flows will reduce their concessions. In the case of agricultural demands, this aspect is very slightly advanced compared with other users such as hydroelectric use [28,29,30].
In many countries, the lack of perspective to view e-flows as a solution to planning problems has led to the design of procedures or schemes for e-flow regime development that are not very flexible and are not grounded on a study of hydrological alteration [31,32]. These schemes are typically inflexible and are based on a minimum flow and monthly oscillations from this minimum flow. Such is the scheme applied by the Spanish water administration in the Douro basin [33]. These simple schemes cannot be adapted to stressful or highly problematic situations, where the application of an e-flow regime is incompatible with the water uses in the basin or does not resolve the changes caused by those uses [28,34].
The main aim of this work is to breach the gap between unrealistic e-flow proposals and the real needs of human societies by improving the design scheme for e-flow regimes. To achieve this objective, we set out to define a flow regime that is compatible with the management and water irrigation demands of heavily affected rivers.
For this purpose, it is necessary to consider the different schemes of river water use on an irrigated farmland. For instance, in some cases, water from a dam is directly released into a riverbed for use in irrigation, whereas other riverbeds only receive excess flow from irrigation canals. Our aim is to ensure that river flows deviate as little as possible from the optimum interval in order to maintain the functionality and structure of environmental systems.
The contribution of this work is improving the proposal of e-flow regimes by following a methodological scheme that starts with the regime change, considers the demands that put pressure on the water balance, and is based on the principles of enhancing environmental aspects, such as improving the habitability of river reaches for wildlife [35,36]. The proposed methodology seeks to address three different types of disturbances with acceptable solutions and to consolidate its possible use in basins where hydrological alterations due to irrigation are significant.

2. Materials and Methods

2.1. Study Area

Figure 1 shows the location of the selected water bodies with high agricultural pressure in Duero Basin (Central Spain) and the gauging stations from which the data for the hydrological study were obtained. The flow of these rivers has been greatly modified; most of them have regulation reservoirs (Figure 1). For a more complete description of the dams on these rivers, see Supplementary S1.
Table 1 shows the gauging stations used to obtain the hydrological data, for both the natural and the altered regime.
The climate of the area studied is a continental (or inland) Mediterranean climate, with cold winters and warm summers with a strong low water level in the river systems. For more information on crops, cultivation patterns, main population centres, and dominant land use types, refer to Supplementary S1.
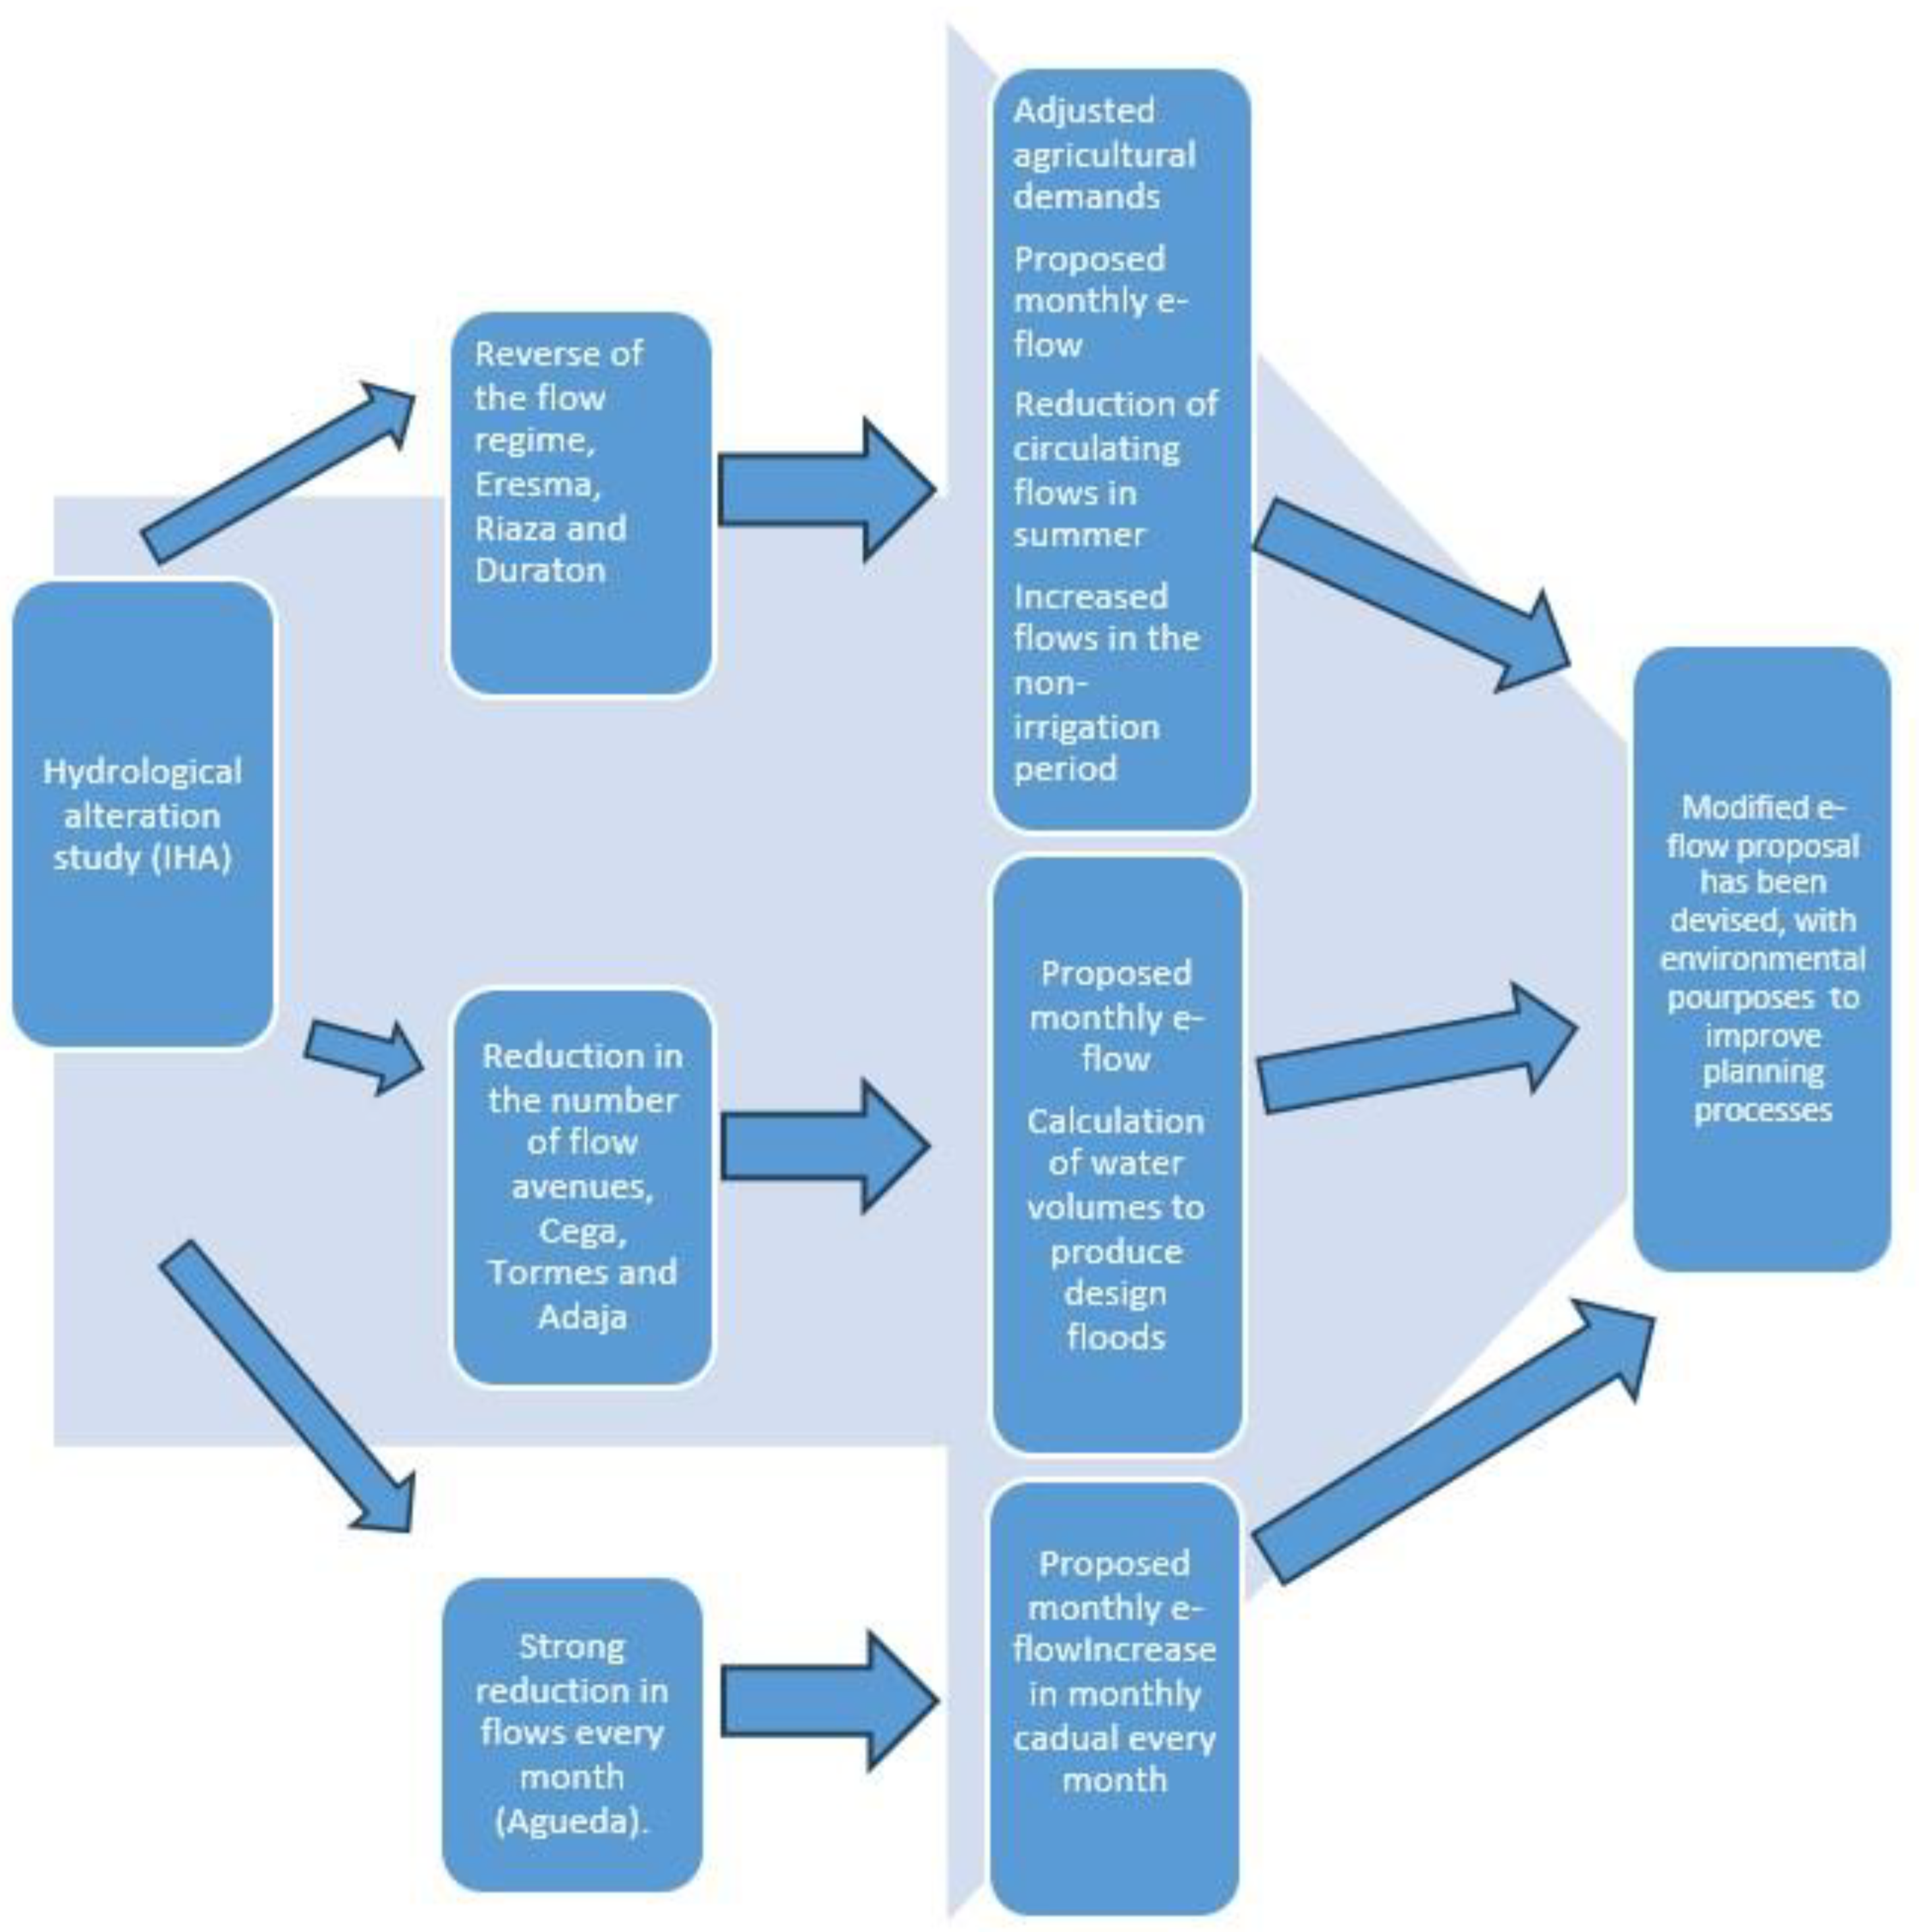
Three distinct studies were conducted to establish a flow regime that aligns with the proposed social and environmental objectives. The entire methodological process is summarized in the flowchart presented in Figure 2.

2.2. Study of the Hydrological Alteration

Data have been collected from nearby gauging stations (Table 1) of seven rivers in the Duero Basin. To the extent possible, periods of 20 years have been evaluated. The natural regime was derived from data collected at a gauging station with minimal flow alterations and enhanced using the SIMPA rainfall-runoff model developed by CEDEX [37] for the specified years and area.
The altered regime of most stations was based on data from the period 1998–2019. The reference conditions were different depending on the date of construction of the different dams, but in most cases in the series from the period 1942–1963.
These different flow regimes (natural and altered) of each water body were compared following indices of a hydrological alteration methodology (IHA) [10,38]. We used an application called Dundee Hydrological Regime Alteration Method (DHRAM) software (v.1) [39], which includes the same parameters described by Richter et al., 1996 [40].

2.3. Water Demand Calculation

The water demands of each river were obtained from the database of the Hydrographic Confederation of Duero (OPH-CHD, 2022 [33]). The information collected includes the following:
  • Main crop groups:
  • Area occupied by each type of crop;
  • Monthly water demand per surface area;
  • List of demands associated with a specific water body [27].
Agricultural demands will be the focus of this study as they account for most of the water taken from these rivers. All the data are available at https://mirame.chduero.es/chduero/viewer (Accessed on 15 July 2024).
The water demand for each water body was analysed to determine the amount of water required to meet all agricultural demands.
Monthly distribution was also considered to estimate the modifications that the agricultural demand introduces to the monthly flow regime.
We created hypothetical or ‘adjusted’ water demands to accurately reflect the specific needs of each crop type.
These adjusted demands reflect accurate necessities of each crop type calculated by modifying the irrigable area, irrigation technology, or efficiency. In order to calculate adjusted demands, we used an irrigation program developed by the regional department of agriculture [41].
The calculation of adjusted demands is based on the monthly net water demand (ND) for each crop. The net irrigation needs were calculated using a standard method that considers evaporation and the crop coefficient (Kc), as follows:
ND = ETc − Pe
ETc = ETo × Kc
where ND is the net water demand for each crop, ETc is the crop evapotranspiration, Pe is the effective precipitation, and ETo is the reference evapotranspiration.
The net water requirements (ND) are increased by a coefficient that measures the efficiency of the irrigation system, which finally calculates the total gross demand (NG) [42], which is necessary for the calculations in this paper.
The official average monthly demands of each unit will be compared with our “adjusted demands”. These adjusted demands symbolize the amount of water that should be necessary for each type of crop if the most effective means of irrigation was used.
With the calculation of the adjusted demands, a new improved monthly demand regime is constructed, which covers the months of the irrigation season, different from that of the official planning agency.

2.4. Simulation Habitat Needs of Fish Species

A hydrobiological approach was employed to estimate habitat quality based on flow variations that meet the needs of indigenous fish species [43].
In this methodology, the proposed minimum environmental flows are obtained on the basis of the amount of habitat they produce. To carry out this analysis, we used a conventional methodology that allows us to determine the variations of the habitat as flow changes [44].
Fieldwork was carried out in representative sections that contain a variety of mesohabitats present in the entire water body. In these sections, the necessary physical data were taken to use the hydraulic simulation program. Habitat preference curves for fish species present in these rivers were sourced from the existing literature [45].
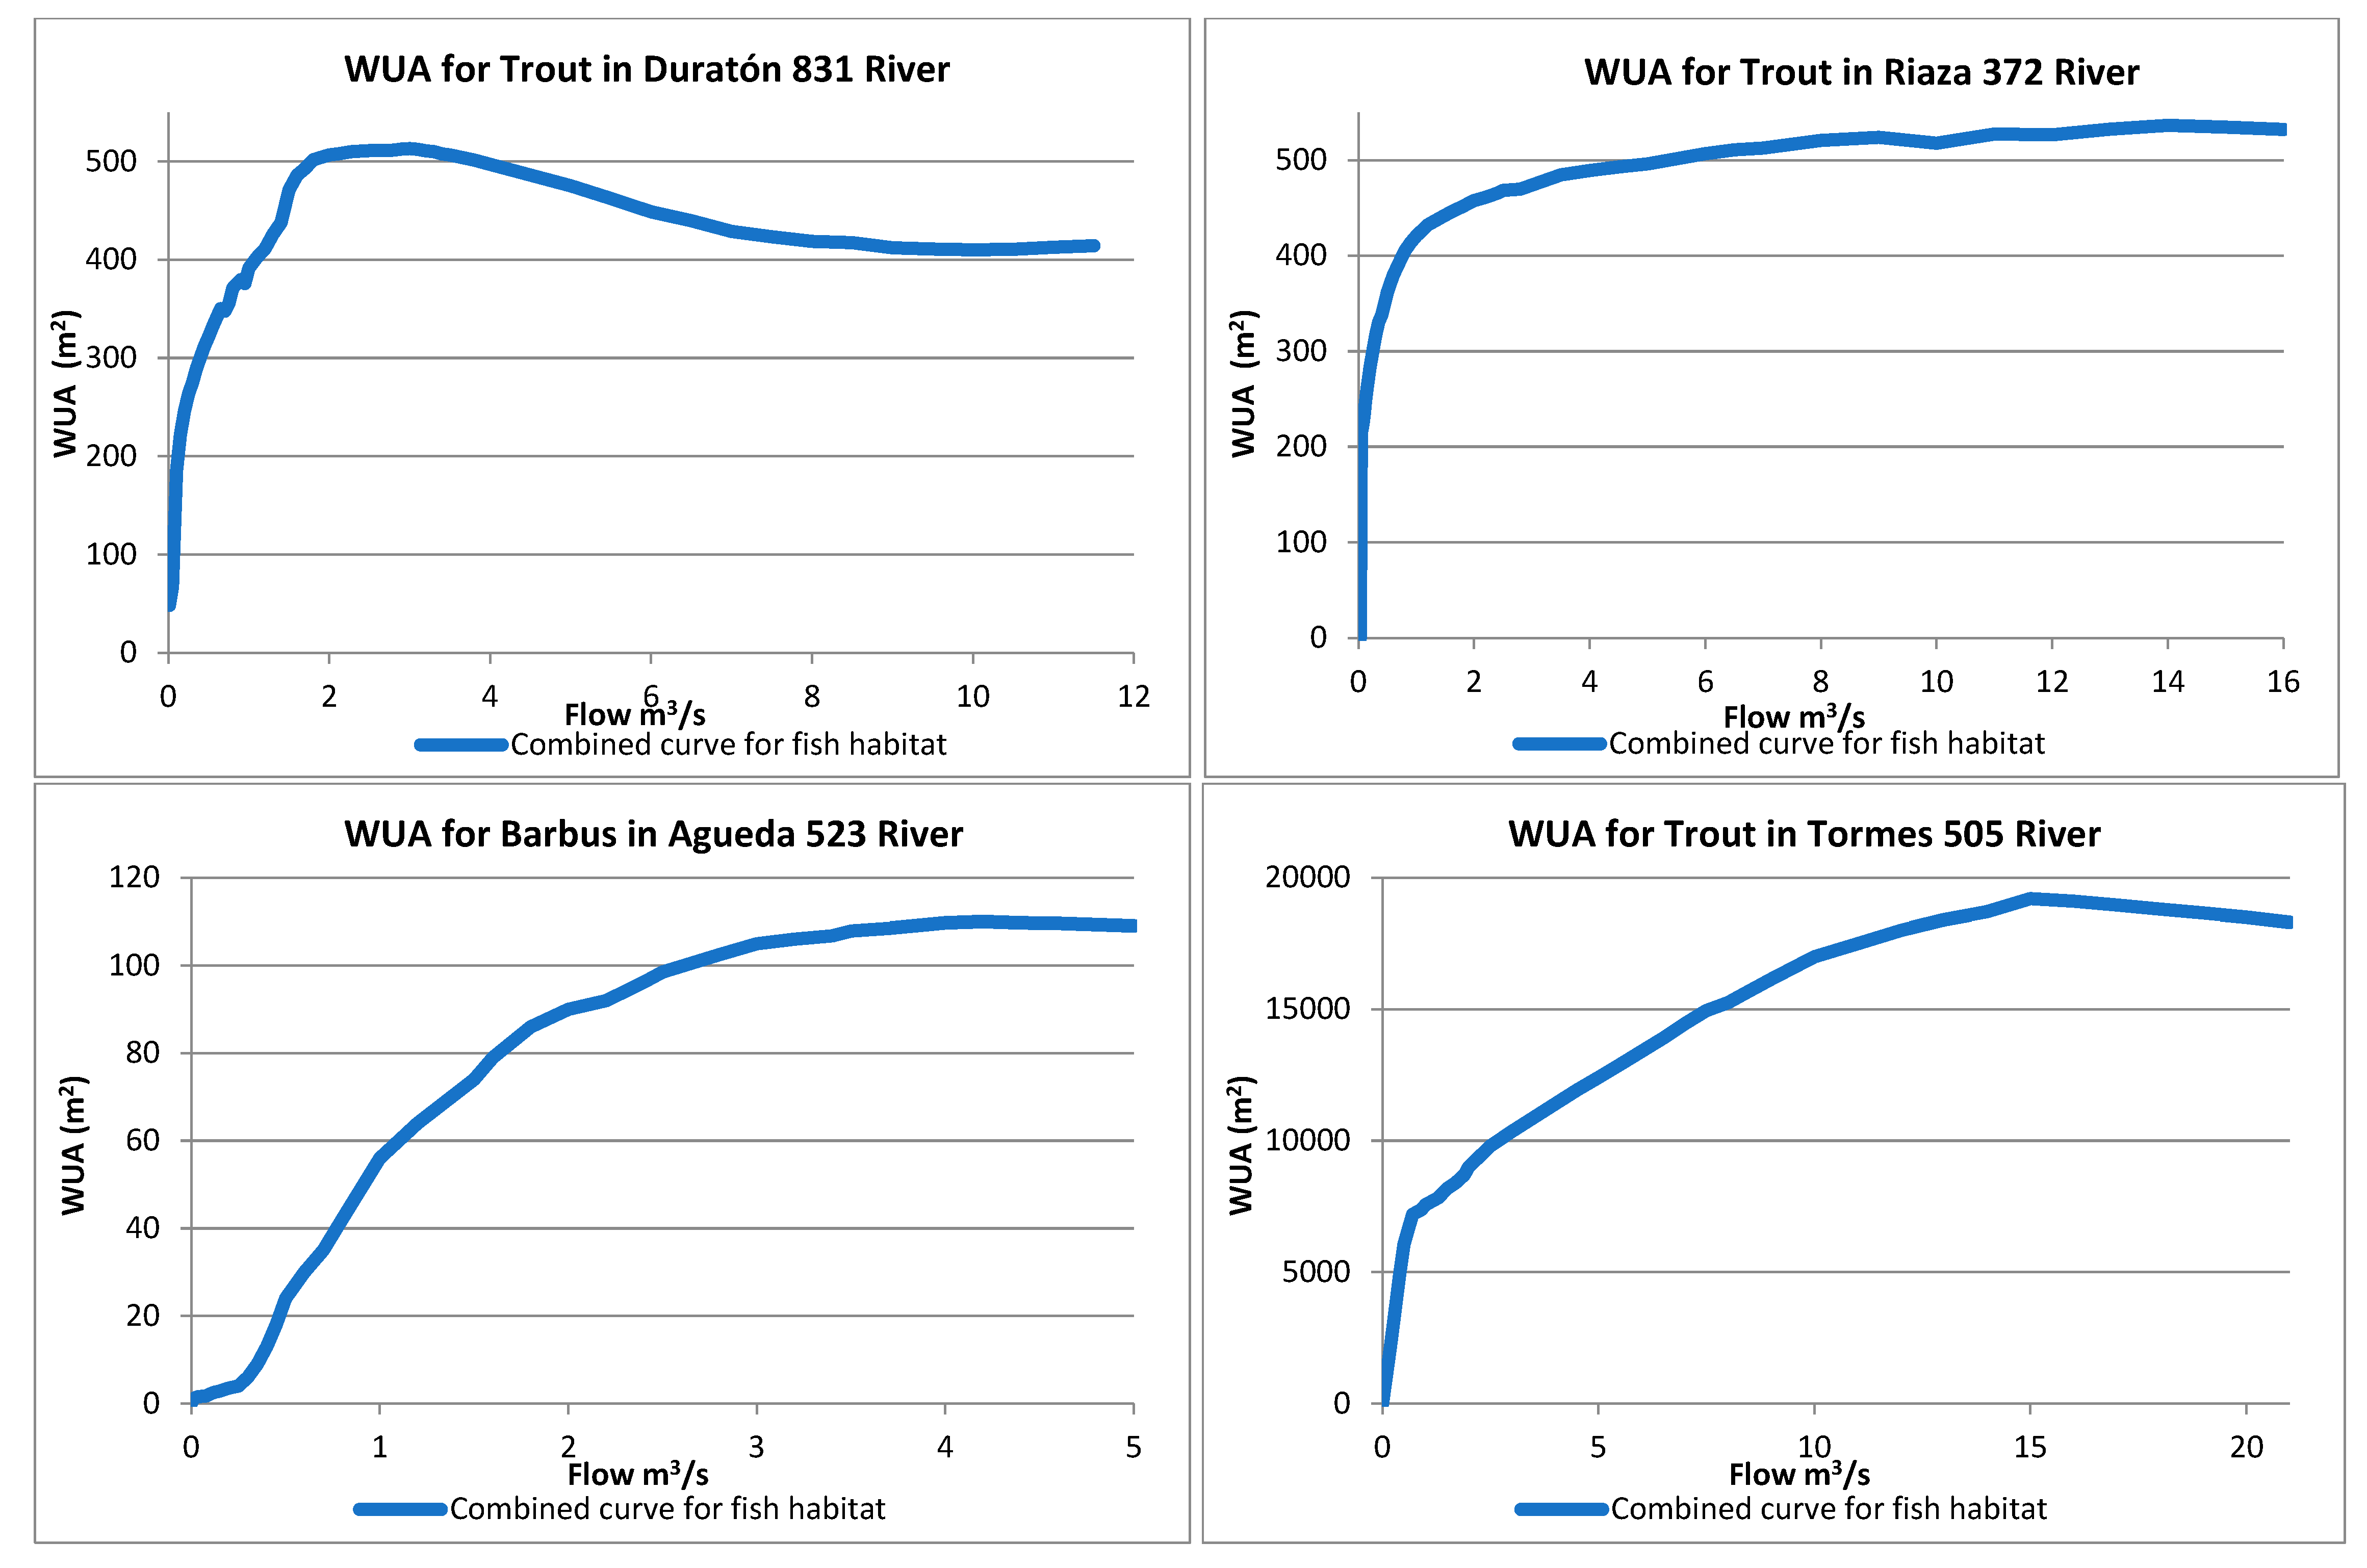
The hydraulic simulation was carried out using the two-dimensional program River 2D [46]. The River 2D program allows us to observe the variations in habitat when the flow changes while simulating a wide range of potential flows; in order to carry out the simulation, a range of flows were selected that are historically observed in these rivers. Finally, a curve relating potential habitat to flow variations was obtained. The amount of habitat is expressed by the WUA (weighted usable area) index, expressed in m2/km of river length of the stream for the specific fish species [7]. Normally, the amount of habitat expressed as WUA, obtained at each flow rate, is plotted on a graph. This graph, called a WUA-Q curve, allows decisions to be made on the advisable flow rate. As an example, the graphs obtained in this work can be seen in Section 3.3.
By observing the habitat evolution relative to flow changes, we can estimate a range of valid habitats, defined between two key values, such as the optimum and minimum environmental flows.
This minimum flow will be the lowest value in the series of analysed flows that does not induce a significant loss of habitat in a section of a river. Following the most used approximations, this value can be reached in one of two ways [8,47]: by locating a point of change in the slope of the WUA-Q curve or by obtaining the maximum habitat and estimating fixed percentages from it.
After the water volume calculations, which can meet irrigation demands efficiently, were designed, a flow regime was constructed based on two hydroperiods, one for the irrigation period and another for the wet period. The started hydroperiod was an alternative monthly flow regime for the irrigation season, and the second was a complementary period for the rest of the months. We propose values that can meet the environmental objectives of the wet period of no irrigation. Considering the range of valid habitats and the flow intervals that create these habitats, a monthly regime of flows is built based on it, and it imitates the monthly pattern of change of the natural regime. The monthly flow will be designed for the rest of the seasons in congruence with the natural flow variations.
The habitat–flow relationship was used also to evaluate, in terms of habitat, the loss or gain of areas potentially usable by fauna under different regimes, such as the actual modified regime, the official environmental flow regime, or the proposed alternative regime.

2.5. Alternative Flow Regime Building

The construction of an alternative regime will depend on the type of alteration present in the river. In general, we will first describe the solution for regimes that have a significant difference between irrigation and non-irrigation months, and then we will develop a strategy to solve other types of alterations.

2.5.1. Rivers Where the Main Problem Is Seasonal Inversion Flow

Initially, we describe how to construct the basic architecture of the e-flow regime. This will then be modified to solve the specific problem and be useful for planning purposes. The initial structure of the flow scheme involves three steps.
  • First, select the minimum flow for the driest month.
  • Second, calculate the regime values for the remaining months by finding monthly variation rates that mimic the natural pattern.
  • Third, modify the monthly variation indices with an exponent to adjust them according to the environmental criteria desired.
The minimum flow rate was selected from the WUA-Q curve, as indicated above (point 2.4) and in Section 3.3. After locating the flow rate that produces the maximum habitat, the selected minimum flow value is the one that produces 80% of the maximum habitat.
The monthly regime is calculated by assigning the minimum flow value to the driest month of the year. The remaining values for the rest of the months are obtained by means of indices (Im), which are the quotient between the natural flow of that month and the natural monthly minimum and multiplied by the minimum flow (Equation (1)).
The flow rate for each month is obtained as follows:
Q e m = Q min e f l o w   ×   I m
where Qe-m is the monthly flow value for each month, Qmin e-flow is the minimum environmental flow, and Im are the indices of monthly variation.
The indices of monthly variation are obtained by dividing the natural mean flow of each month by the flow of the driest month (Equation (2)) [6], as follows:
I m = Q m Q m i n e x p
where Im is the monthly index, Qm is the average natural flow for each month, Qmin is the natural mean flow of the driest month, and exp is an exponent ranging from 0.5 to 1 (as proposed by Alcazar and Palau, 2010) [6].
The monthly regime can be modified by varying the exponent that affects the monthly indices (Equation (2)).
With the basic structure, two problems need to be addressed: the first is if the flow we leave in the river during the irrigation months meets the environmental and crop needs, and the second is to increase flows in the non-irrigation months (usually winter) so that they are higher than in the summer months.
Modifications to the general basic structure described above are made by modifying the exponent of Equation (2). The corrections must ensure two conditions: sufficient water during the irrigation season and an increase in flows during the periods of the year with the highest natural flows. These modifications made to obtain the alternative flow regime follow the following steps:
  • The e-flow month rate is increased in months when a greater amount of water is required for irrigation.
  • We calculate the amount of water that can be saved by implementing the alternative irrigation plan as compared with the current one. The saved water volume is transferred to non-irrigation months to augment the flow values in the winter months.
  • In the months with the highest natural flow, the monthly coefficient (Im) was modified to exceed the flow rate values of the summer months; the winter months’ flow values must, as a condition, provide at least 80% of the WUA in the river.
This alternative environmental regime will be analysed by generating habitat time series. The generation of habitat time series consists in analysing the habitat obtained by a flow time series by using the Q-WUA curves. In this process, we will evaluate the quantity of a suitable habitat that is reached with the flow values of each hydroperiod (dry and wet period), considering the range of valid habitats for each stretch of a river. Analysing the cumulative amount of habitat series obtained in any modified regime and in the alternative environmental regime, we will evaluate the improvement obtained in biological terms, comparing the optional environmental regime with the others in terms of habitat. For a more precise description of the method for determining the minimum flow and the monthly variation factors for the construction of the environmental flow regime, see Supplementary S2.

2.5.2. Rivers Where There Has Been a Loss of Peak Flows

For rivers where the natural pattern of peak flows has been lost, the volumes of water required to produce design floods have been calculated. The procedure to be followed to correct the alteration is as follows:
  • The magnitude, duration, and frequency of peak natural flows are based on the hydrological analysis.
  • Enough peak flows, replicating the natural flood occurrences in the river, will be formulated.
  • To achieve this, the volume of water utilized during a normal flood has to be calculated. Timely points will be identified to discharge these peak flows from the regulation structures in the basin.
Peak flow characteristics were determined using the results from the DHRAM program, specifying the magnitude of the flow rate based on the maximum 30-day moving average [37,39].
The average duration of floods and the frequency of these floods have also been defined in the hydrological alteration study. Due to the complexity of the management systems and the availability of resources, it is difficult to restore the number of floods equal to those that occur naturally in the river; for that reason, these are normally limited to 2 or 3, which are necessary to fulfil certain environmental functions [48]. The amount of water needed to create a 5-day flood was calculated, and it was also checked whether the water saved in the irrigation process could be used to create these floods.

2.5.3. Rivers with Minor Problems

If the hydrological alteration analysis showed that the only alteration to the river was a reduction in flow, it was proposed to define an alternative e-flow regime by increasing the monthly flow values so that the circulating flows would be closer to the values of the natural flow regime and maximize the creation of a habitat for fish fauna in the river.

3. Results

The regulation produced in the rivers studied presents different models. In some cases, the water is stored and transported by canals to the irrigation farms; in other cases, the river is used as a channel to carry irrigation water to points located several kilometres downstream. These different models of irrigation water management produce different alterations in the hydrological regime of the rivers.
Solutions designed to reduce hydrological disturbance should be based on a classification of the observed hydrological alterations. Attempts have been made to apply these solutions in groups of rivers that present similar problems. Subsequently, each group develops a strategy for constructing alternative flow regimes that allow the maintenance of uses and slightly deviate from the natural one.

3.1. Hydrological Alteration

Table 2 presents the results of the hydrological alteration study. It describes the primary changes in the studied river reach and their potential causes, along with the indicators that show the highest disturbance, calculated using the IHA method. For the characterization of the alteration, the DHRAM program was used, which, in addition to detecting the main impacts, scores and qualifies the total alteration. Four of the rivers show a high level of alteration, and three of them moderate hydrological alteration.
As a consequence of irrigation demands, as well as other alterations, the main components of the flow regime that is altered are the average flow, the date and frequency of the maximum flows, and the duration of the minimum flow’s events.
The group of indicators of hydrological alteration together with the analysis of the alterations has allowed us to establish the following three groups of river regime modifications:
  • Reverse of the flow regime (Eresma, Riaza, and Duratón); in the latter two rivers, hydropeaking is also present.
  • Reduction in the number of flow avenues and general flow reduction (Cega, Tormes, and Adaja).
  • Strong reduction in flows every month (Agueda).
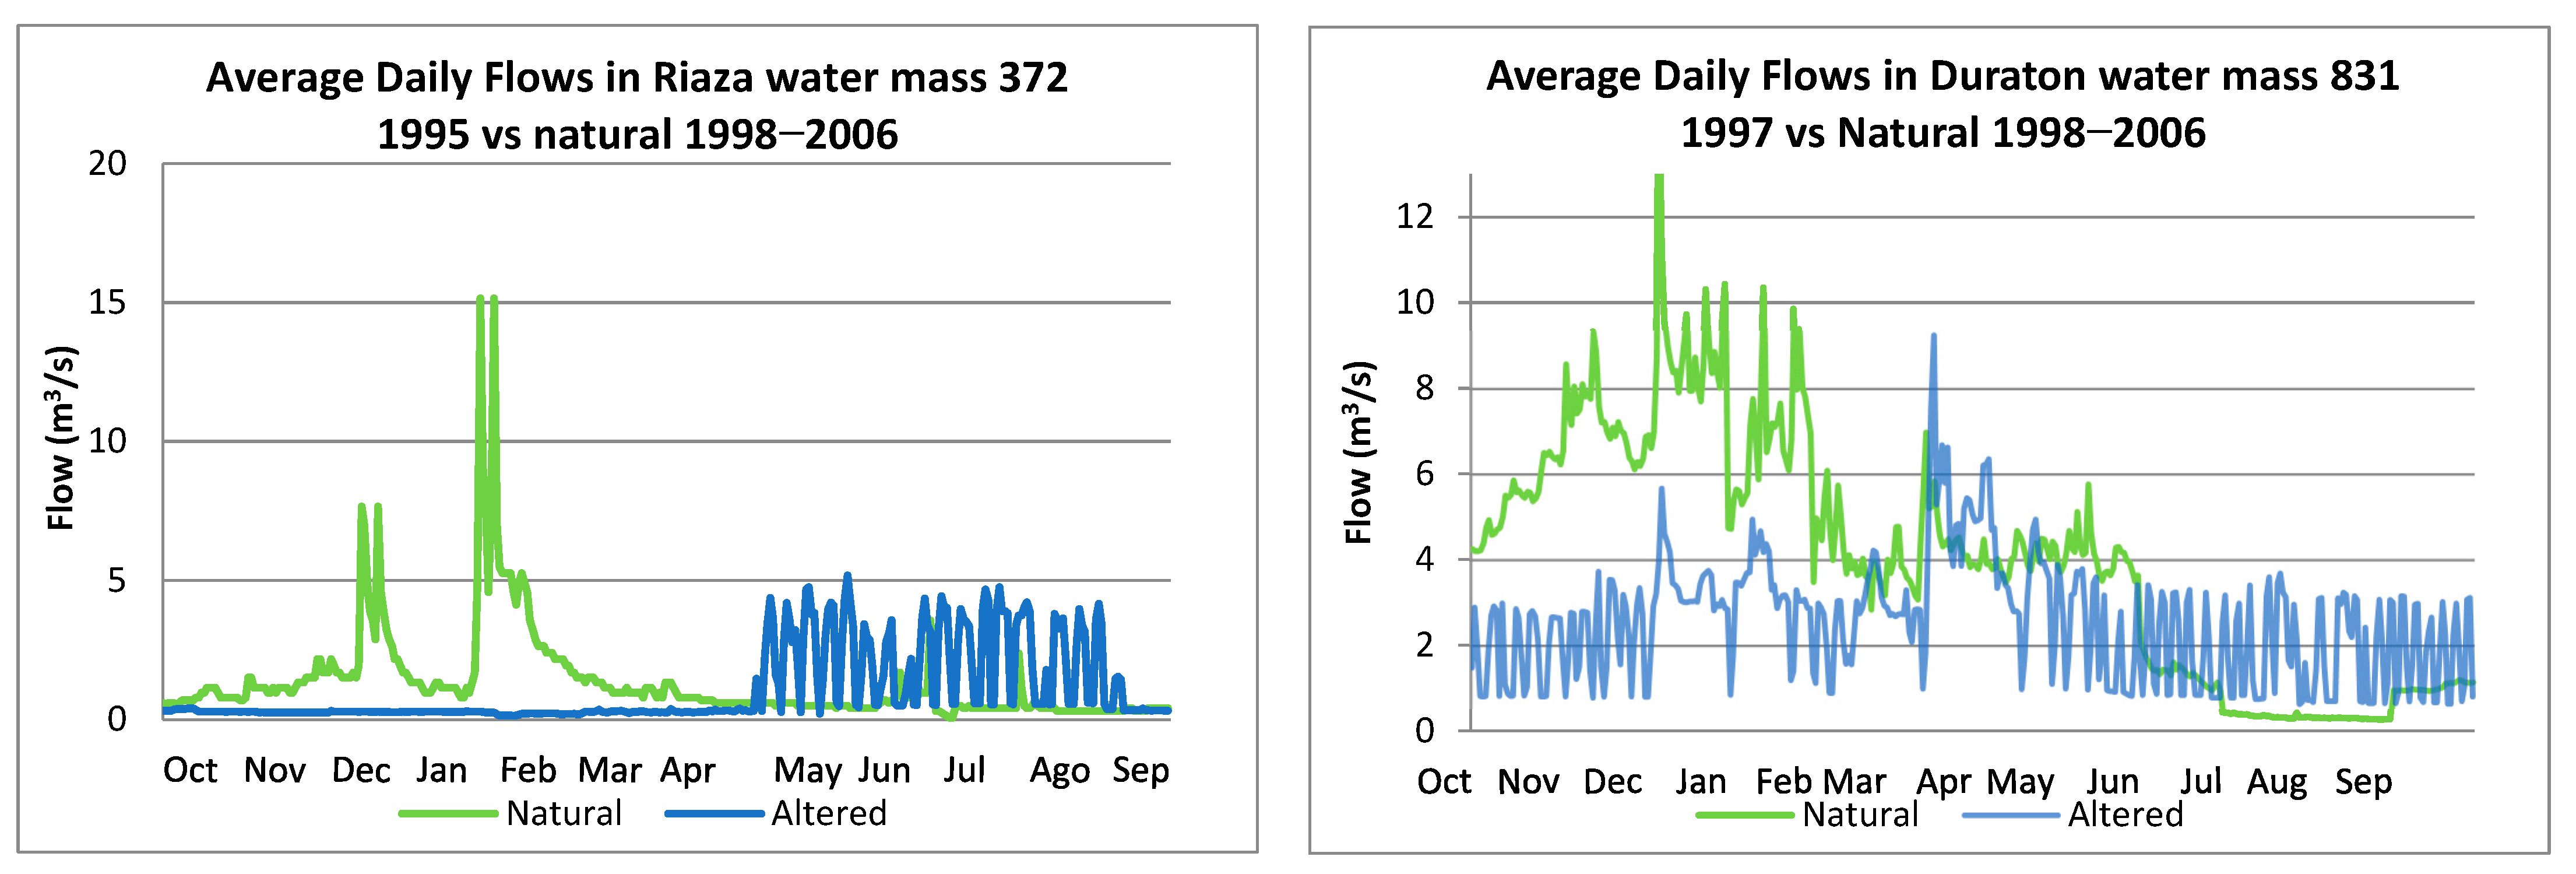
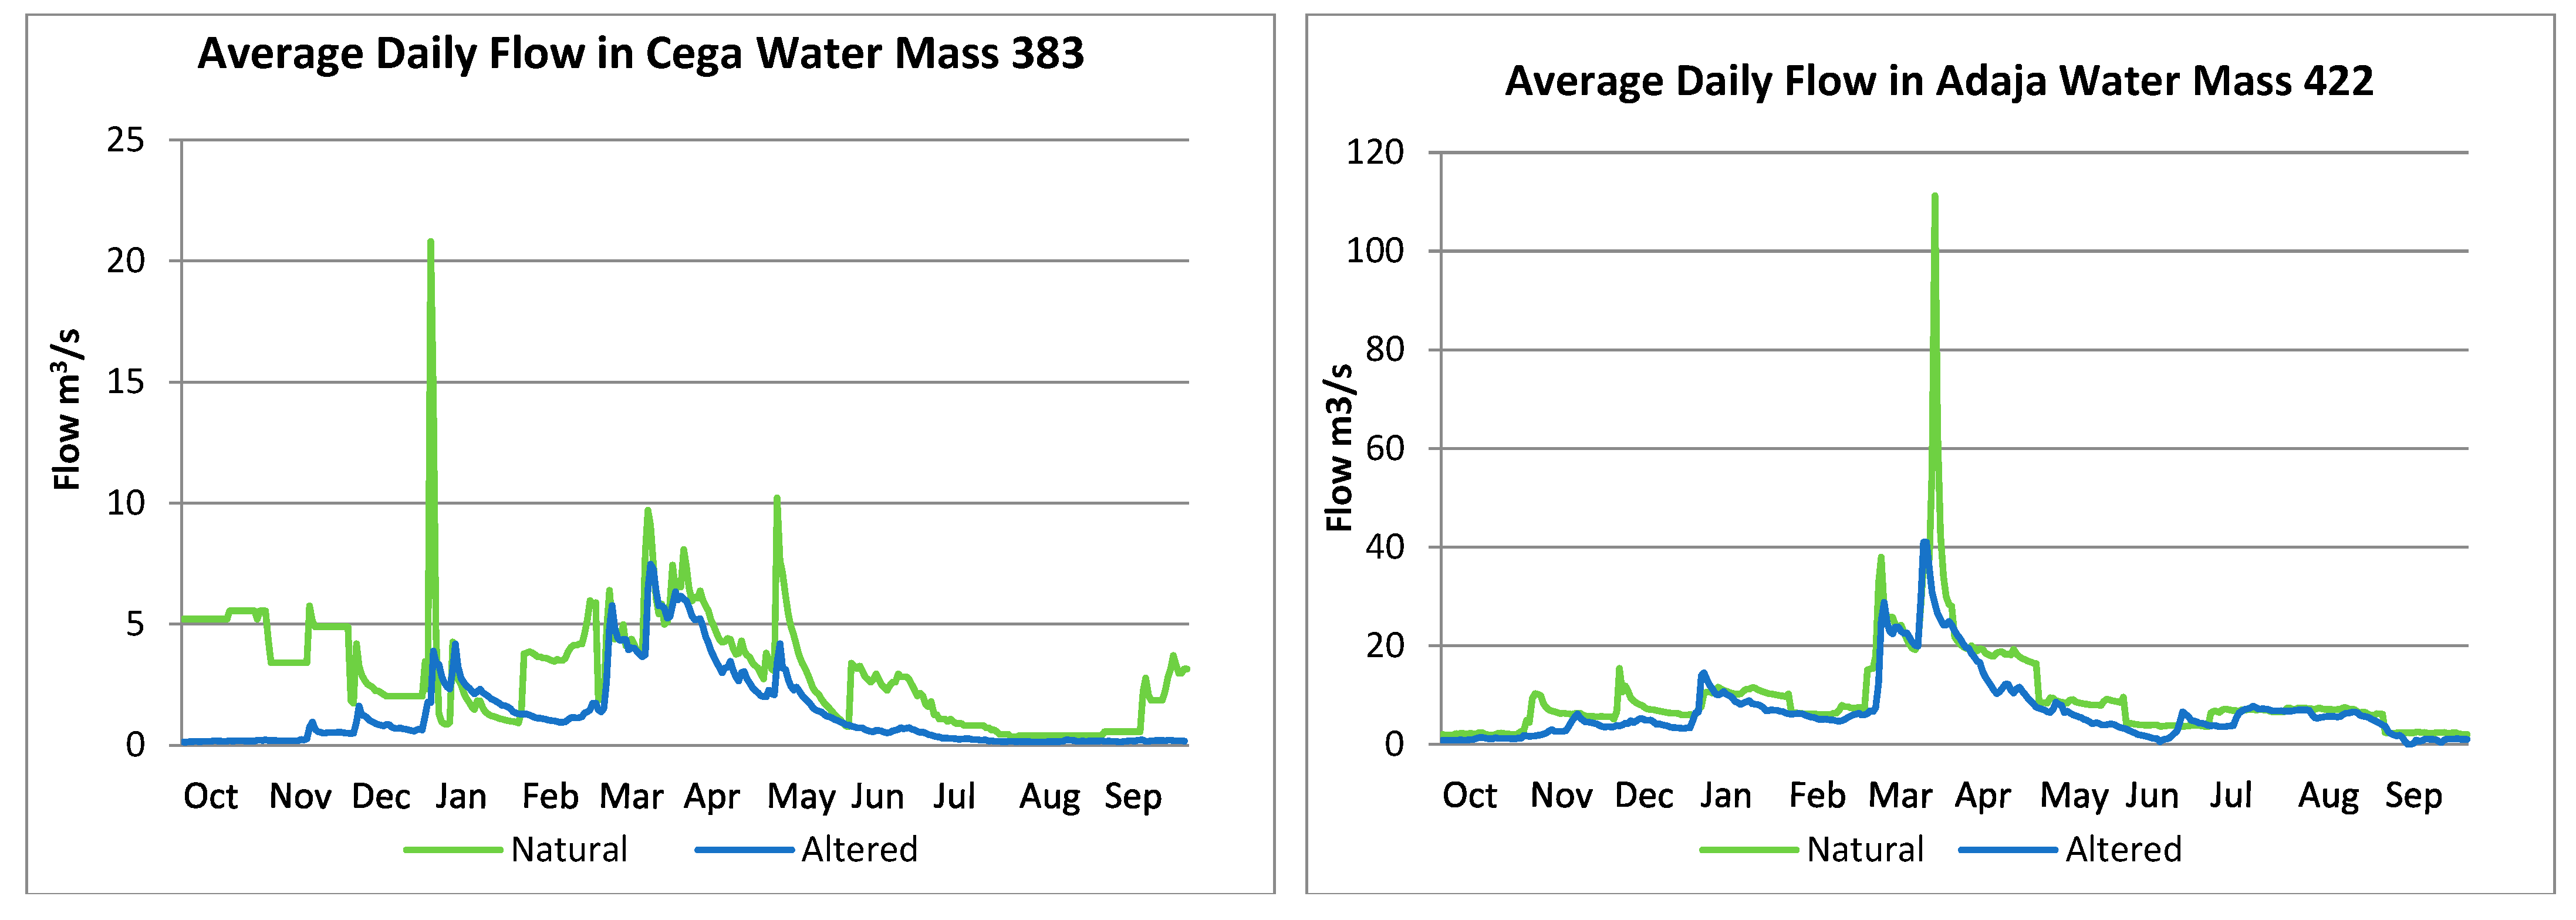
The following figures (Figure 2, Figure 3, Figure 4 and Figure 5) show a representative year showing the main alterations compared with the natural mean flow. A year has been selected from the altered series flow, which clearly shows the main observed disturbances.
Riaza and Duratón are the most hydrologically impacted rivers (Figure 3). These rivers present seasonal inversion of the flow regime, a reduction in the total circulating flow, and an increase in the number of high pulses, although the duration of these events decreases, which can be explained by hydroelectric use.
In the Agueda rivers (Figure 4), there is a strong reduction in flows every month, as well as a reduction in the number of flow avenues, which are also of a longer duration. In the Eresma river (Figure 4), the most notable change is in the duration and frequency of extreme flows; water management in the basin of this river has led to a reduction in the number of avenues, and in terms of low flows, it has been observed that periods of drought or low flows are becoming longer. There is also a slight seasonal inversion of the flow regime.
In the Cega and Adaja rivers (Figure 5), the duration of the periods of drought has increased with respect to the natural conditions.
The Tormes river (Figure 6) has a moderate hydrological impact. There is no strong reduction in monthly flow, and the number of avenues decreases. There is no flow inversion. In the Tormes river, the number of periods of low flows increases but not their duration. The principal alteration of the regime produced by agricultural demands is the elimination of avenue flows.
The Adaja and Tormes rivers have the lowest impact patterns on the flow regime.
All the rivers show a reduction in total flow, but with a different distribution throughout the year. The reduction is very pronounced in the Agueda river and quite small in the Tormes river due to the reduction in the agricultural area compared with the high water levels of this river. In addition to this general effect, there are two other effects that occur in groups: the shifting of flows towards the summer months and the reduction in the number and size of floods.

3.2. Assessment of Agricultural Demands

This section summarizes the main characteristics of the water demands for agriculture in each of the river sections studied. Table 3 shows a summary data of the current agricultural demands. Additionally, the demands are compared with the total available resource in each river section.
The ratio of water used for agriculture to total resources is high in two rivers: Riaza, at 45%, and Cega, at around 26%. In contrast, the Agueda and Tormes rivers have lower percentages of water used for irrigation. Despite having the largest agricultural surface area of all the rivers analysed, the Tormes river’s demand for irrigation is not high, as it receives high average annual contributions.
Regarding the reduction in demand achieved by calculating irrigation volumes more precisely, Riaza is worth highlighting. It is possible to reduce it by up to 13 hm3.
Looking in detail into the analysis of the demands in each river, we highlight that the Tormes river has the largest irrigable surface area and the highest number of agricultural units and has the highest total water resources. Approximately 12% of the water from this river is used for irrigation. The Riaza river has the highest demand for water, using almost 46% of the available resources in the basin for irrigation. In contrast, the Agueda river uses only 4% of the total resources for irrigation. Regarding the reduction in demand by adjusting the irrigation technique, in the Riaza river, the greatest reduction in resources is achieved: 13.42 Hm3 could be saved annually. Meanwhile, in the Adaja river, only 2 Hm3 could be saved, and in the Eresma river, barely 1 Hm3.
Figure 7 shows, for each river, the difference in the irrigation period of the agricultural water requirements between the water demand reported by the authorities and those obtained in this work. Two different patterns of change are observed: In four rivers, Cega, Eresma, Adaja, and Agueda, there is not only a reduction in total demands, but also a slight shift of irrigation volumes towards the final months of the dry season. In the rest of the rivers, the irrigation dates coincide, but with a very strong reduction in the Riaza river and the smallest reduction of all in the Tormes river.

3.3. Potential Habitat of Indigenous Fish Species versus Flow

The habitat simulation work has resulted in curves that represent the variation in the fish habitat with respect to changes in flow rate (WUA-Q curves). To simplify the results and decision making, only the changes that occur in the combined curve, taking into account the habitat of adults and juveniles, have been considered.

Basic e-Flow Structure Estimation

The habitat–flow curves are shown in Figure 8, representing 60% of the adult habitat and 40% of the juvenile habitat for the main species in the fish community in each case. The curves of the Riaza, Agueda, and Eresma rivers show a pattern of reaching a maximum and stabilising in habitat, even with increased flow. It is important to note that all measurements were taken with strict adherence to metrics and units. In contrast, the other rivers experience a clear reduction in habitat after reaching a maximum value. For rivers such as Agueda and Riaza, which have an almost constant value from a certain point on the curve, it is preferable to take into account the change in slope to select the minimum flow.
There appears to be no relationship between the type of bend and the species used to define the habitat, so the different patterns must be more related to the morphology of the channel rather than the preferences of the fish.
For all rivers, a basic e-flow regime structure with 12 values is constructed with the ecological minimum flow for the driest month (80% WUA or change in slope as described in the methodology), as well as 11 other monthly values starting from this and following the natural pattern of monthly flow values, forming the first environmental regime that we will vary to adjust it to the needs of the correction of the disturbances.

3.4. Strategy to Offer an Alternative Environmental Regime

The main idea of the correction of the initial environmental regime in these rivers is to get as close as possible to the natural regime and to take into account the demands. Three rivers have an inverted seasonal regime, where the summer flow is higher than the winter flow: Riaza, Duratón, and Eresma.
The river that presents the greatest difficulties in redirecting the flow regime towards one or more natural flows is Riaza. Here, we find that the flows for irrigation increase in the summer, and the dam releases very little water in the winter to maintain reserves so that the flows in the non-irrigation months are lower than those in the summer. In addition, agricultural demand is very high, at levels very close to the river’s total reserves. On the other hand, hydroelectric power generation causes hydropeaking.
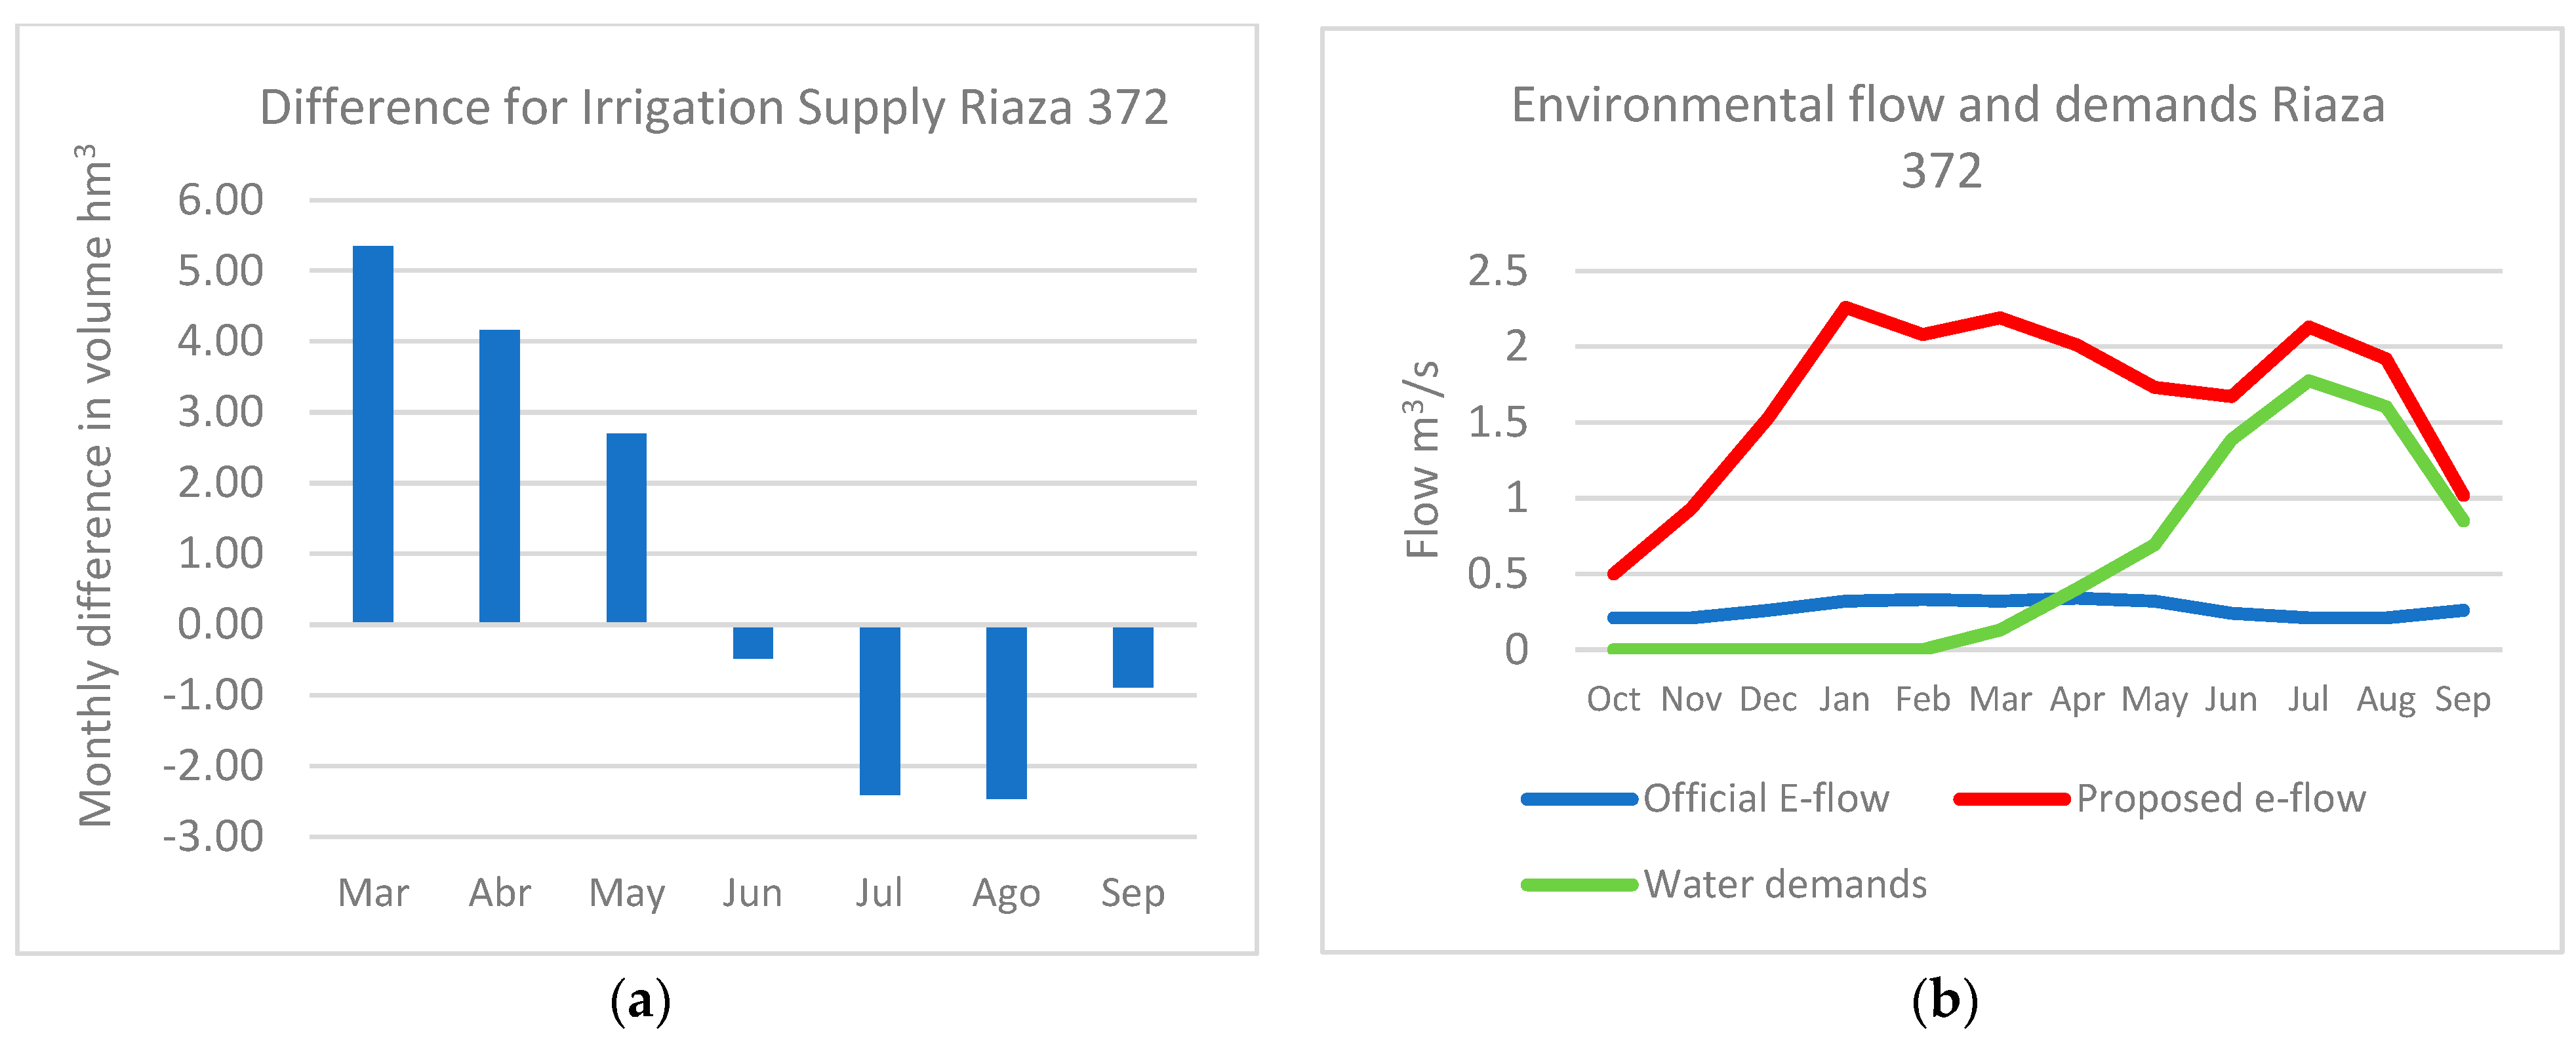
Observing the WUA-Q curve, it was decided to propose a minimum flow of 0.5 m3/s (Table 4). Based on this value, a monthly ecological flow regime was constructed (Table 5). This regime was modified in 4 months so that the flows circulating in the river could carry enough water to meet all the demands (Figure 9). The monthly coefficient was modified so that, in the months with the highest flow (January to March), the flow values proposed for the summer were exceeded and at least a flow was reached that would provide 80% of the WUA in the river (Figure 9). Finally, an alternative environmental flow regime was established, which is significantly better than the one proposed by the water authorities (Figure 9), takes into account agricultural needs, and is compatible with the available resources. From these results, it is concluded that there is a need to correct the initial regime from June to September. The historical average release from the Linares reservoir is 52.9 Hm3, and the volume of water required to maintain the alternative environmental flow in this river is 42.6 Hm3.
Having the WUA-Q curve available allows us to measure the improvement obtained with the alternative regime presented, with respect to another flow regime. For this river, the increase in habitat availability for fish between the official proposal for the ecological flow regime and the alternative was measured in terms of habitat (valued with WUA, Table 7). The new e-flow regime increases the available habitat by more than 45% of the area available with respect to the official ecological flow proposal. In some months, the increase is close to 50%.
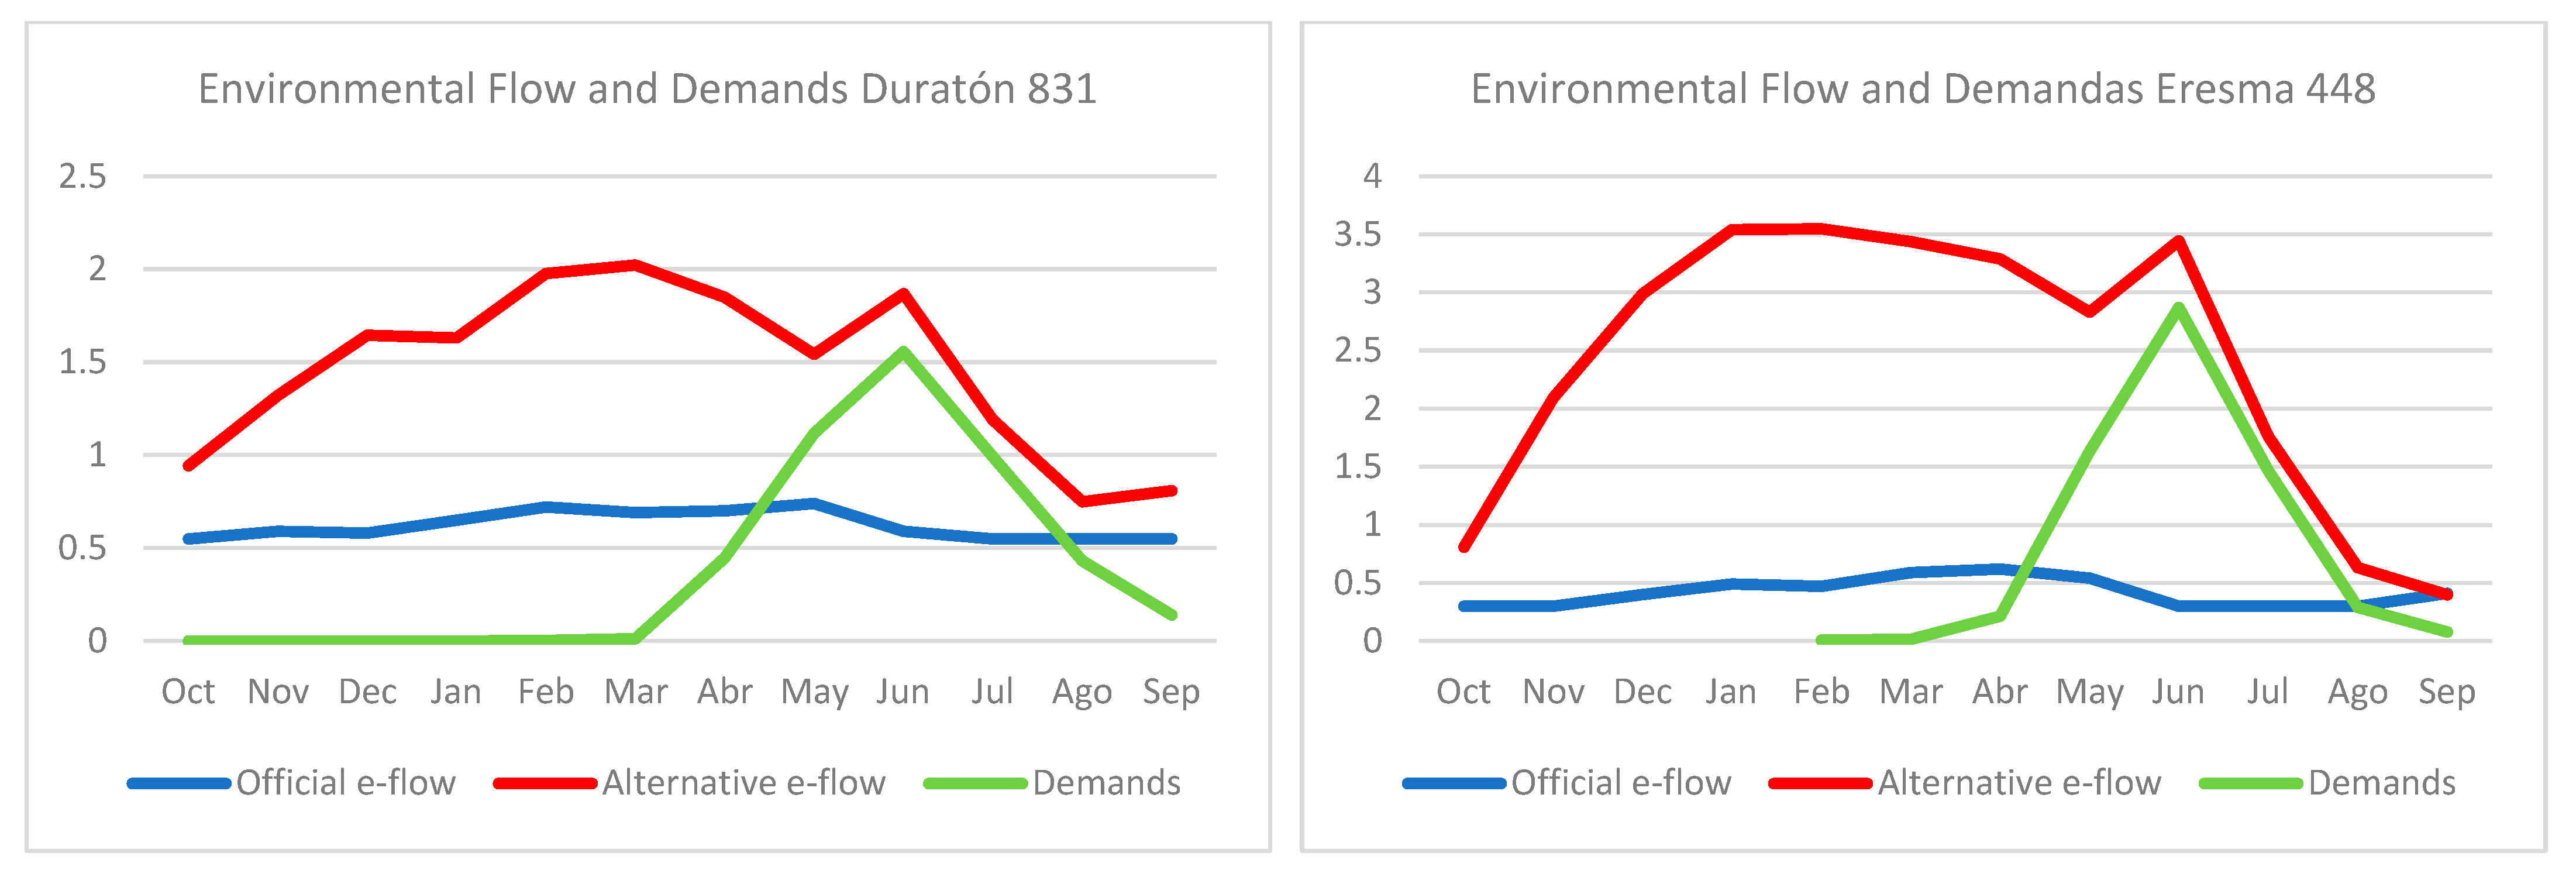
A comparable approach to that taken for the Riaza river was implemented to determine the alternative environmental flow regime for the Duratón and Eresma rivers. It should be noted that these two rivers have significantly more available resources than what required to meet agricultural demands, compared to the Riaza River. Initially, an environmental flow regime was established for both rivers. Subsequently, modifications were made during irrigation periods to ensure that demand was met and guaranteed. Furthermore, in the winter months, the water flow was increased to ensure that 80% of the maximum WUA was achieved and guarantee a water supply greater than that during the summer months (see Table 4 and Figure 10).
For rivers where the natural pattern of bankfull flows has been lost (Cega, Adaja, and Tormes), a high flow was defined with the magnitudes obtained in the IHA analysis (DHRAM application results). The average duration of these floods and the frequency of floods were also defined (Table 6). The water needs to generate flood events are, in general, high, up to 8 hm3 in the Tormes river. The number of floods in these rivers are between 4 and 5 per year. It is necessary to synchronize these generating floods in critical moments of the functioning of the ecosystem, where the use of large volumes of water can be optimized in order to obtain high environmental benefits.
Given the high water requirement to generate these floods, the calculations have simplified the number of floods to 2 and the duration of the floods to 6 days [48]. Finally, in these rivers, it has been checked whether the water saved in the irrigating process is sufficient to generate these floods.
Table 6 presents an estimate of the volumes of water needed to cover each of the events. It is found that, only in the Cega river, the water saved by adjusting the irrigation demand is sufficient to generate these floods.
The amount of water needed to create these floods in the other rivers far exceeds the amount saved by improving irrigation efficiency. Artificial floods in these regulated rivers depend on the storage and discharge capacity of the dams, the time of year they occur, and their magnitude, which must find their place in the overall annual planning process of the basin. From an environmental point of view, they are usually associated with facilitating certain functions, such as fish migration or flooding the banks to facilitate vegetation colonization.
Finally, in the Agueda river, it was considered that it would be sufficient to establish an environmental flow regime that would increase the flow for environmental purposes so that the circulating flows would be closer to the values of the natural flow regime. Table 7 shows the values of the environmental flow regimes for the seven rivers; for the Riaza, Duratón, and Eresma rivers, the original proposed regime and the corrected alternative are presented.

4. Discussion

The modification of the natural flow pattern in rivers can be attributed to various factors. In Spain, the predominant factor is the use of water for agriculture [49]. This demand also leads to modifications in the flow pattern in other countries where agriculture holds a crucial position and water is utilised for irrigation purposes [50]. This scenario is notably significant in Mediterranean basins, where precipitation levels are low in comparison with the areas under cultivation water demands [27,51,52,53]. The impact of these modifications largely depends on the type of water storage and irrigation systems utilized. Typically, water is stored in reservoirs during non-irrigation periods and transported to irrigable areas during dry seasons. The transport of water to the cultivation area by the riverbed itself is an additional factor that affects the form of alteration, giving rise to a very specific hydrological alteration, the seasonal inversion of the regime.
Solving the problems associated with systems where the river itself is used during the summer to transport water to downstream irrigation areas is very complicated. This inverted regime creates a high flow regime for a very long period of days, at times that do not occur naturally, and is usually not corrected by simple e-flow regime schemes that set a minimum value ecological flow for the summer [54] in a river where the problem is high flows for several months.
Several studies have defined and measured this problem, even proposing indicators that detect the inversion of the natural flow regime by an irrigation regime [55,56].
The negative effects of this regime on the functioning of ecosystems and the maintenance of animal populations are well known [57,58,59,60], but there are no specific proposals for its elimination. The conventional approaches to most e-flow plans are inadequate to address this issue, and from the perspective of water resource planning, these e-flow proposals often fail to provide any solutions at all [61].
One of the reasons for this may be that the water authority responsible for compliance with e-flow regimes is mainly concerned with compliance with minimum values and does not establish control mechanisms and sanctions as long as these minimum values are met, and therefore, situations where the flow value is above the set value are not detected and corrected. Once a flow regime has been constructed, it should be tested to ensure that it meets its objectives. The water administration must define a monitoring method that serves to test not only whether the values of the proposed regime are achieved, but also whether the environmental objectives that the regime is intended to achieve are met.
The negative effects of an excessively high regime, when there is usually a low flow in the river, can be substantial [54,62], especially on fish recruitment, when the smallest specimens of fish populations, which are more easily dragged by the flow, are subjected to strong currents. This permanent stress also affects the colonisation by different propagules of riparian vegetation that have colonised the banks in the spring and are now subjected to excessive stress [63,64].
Coordination between the management of storage infrastructures, particularly dam releases, and environmental considerations must be carried out to minimise these impacts, in coordination with a proposal for an e-flow regime adapted to the problems of each river section [58,61,65]. This adjustment involves recognising the need to maintain the main characteristics of the natural flow regime and measuring the alteration that occurs in each case [66,67] so that the identification of the most altered characteristics can be corrected with the appropriate corrective measure.
This work provides an initial solution that can resolve the difficulty of adapting an e-flow regime to the reality of planning, where complex problems have to be solved due to the high power of the pressures generated to achieve greater farm productivity. This strategy aims to reconcile the dilemma between conservation and productivity, which is already more advanced in other systems such as hydroelectricity.
The use of high volumes of water for irrigation and the use of the river as a channel for transporting water in the summer are frequent in these basins, and their solution has been addressed with proposals that produce solutions for two different year periods. During the irrigation period, reduce demands; during the no-irrigation period, increase the river flows, which, in principle, should naturally be higher than those of the summer.
The solution of reducing demand to ensure minimum instream flows is not new [29,68,69], but when working in a basin with high demand pressures, it is necessary to look for where this water can be saved and the appropriate technology to do so. This is already being done in many Spanish river basins (for example, work on the modernisation of irrigation and the occupation of cultivated land with remote sensing [70] and Guadiana Hydrological Planning Office, personal communication).
Reducing circulating flows during low flows in the summer, using part of these volumes to improve other characteristics of the flow regime, such as winter flows or flood generation, is a simple proposal that requires understanding between users, managers, and experts in the river system. Knowledge of the relationship between peak flows and some environmental considerations, such as habitat evolution [71], makes it possible to balance the regimes in the winter. This involves understanding the need to increase flows in the winter so that they are higher than those in the summer and understanding the environmental effects, such as the creation of a new habitat for fauna that these flows create in the river.
Two of the rivers studied, Riaza and Duratón, have been identified as presenting a significant challenge. This is due to the simultaneous occurrence of two synergistic effects: seasonal flow inversion and hydropeaking. During the irrigation period, the volume of water flowing through the river increases, and the hydroelectricity production results in sudden changes in flow. These fluctuations have a detrimental impact and make it challenging to implement corrective measures (Figure 9). The approach proposed in this paper can serve as a starting point.
The strategy starts with the review of agricultural water concessions and has been found to be functional in the rivers where it has been applied in this work. A detailed study of agricultural demand and the adjustment of this demand, thanks to greater efficiency in irrigation, has made it possible to reduce the high volumes of water in summer the in the three rivers with an inverted flow regime. In addition, an increase in winter flows has been proposed, based on environmental considerations, to obtain at least 80% of the maximum habitat, which, without greatly increasing the magnitude of the flows in these months, achieves a more appropriate regime to keep these rivers in good ecological condition.
While increasing the amount of river habitat may appear beneficial for the proper functioning of these systems, it is essential to assess the adequacy of an environmental flow regime and its components through a well-defined monitoring program. One simple alternative is to compare the values resulting from the environmental flow regime with the hydrological variables derived from the natural regime [72]. A second, more complex assessment would involve clearly defining the objectives and how to measure whether the proposed flows are contributing to achieving them. This would require the design of a robust monitoring strategy [73,74]. This would involve carrying out morphological or habitat creation inventories and monitoring the populations of fauna to be conserved [75,76].
The consideration of another group of alterations, including the reduction in flows throughout the year, with the disappearance or reduction in peak flows, as occurs in the Adaja and Tormes rivers, must be approached based on the understanding of the ecosystemic functions produced by these flows [48]. The complex functions that these flows produce in the river system must be conserved and maintained. The proposal to generate high flows in these rivers requires sufficient volumes of water, which cannot be achieved by reducing irrigation allocations, and must come from the commitment to balance water demands in the hydrological planning of these sub-basins as a whole.

5. Conclusions

The study of hydrological alterations in the seven rivers under consideration has enabled us to identify three distinct types of alteration. The most complex is the one produced by a high release of water in the summer for irrigation and electricity generation and, therefore, with rivers that suffer a seasonal reversal flow. The other two alteration models are the reduction in the number of peak flows and the general reduction in monthly flows.
By identifying the main hydrological problems, we have been able to propose e-flows that, in addition to improving the functional and habitat conservation aspects of the system, allow it to be made compatible with the demands.
In the three rivers where the regime has been reversed, the summer flow has been reduced as a result of the adjustments to irrigation allocations. This has enabled an increase in winter flows. In rivers where peak flows have reduced in frequency or disappeared, peak flows have been designed, whose water needs are compatible with the total contributions and crop allocations. Finally, in the Agueda river, where there has been a generalised reduction in monthly flows, a monthly e-flow regime has been proposed to produce greater fish habitat.
A basic strategy for incorporating a modified e-flow proposal has been devised, which may be useful as correction measures for environmental purposes and improve planning processes.

Supplementary Materials

The following supporting information can be downloaded at https://www.mdpi.com/article/10.3390/w16152106/s1, Supplementary S1: Table S1: Main reservoirs and storage characteristics in the studied river basins; Table S2: Distribution by river of the main populations and land uses in the studied river basins; Table S3: Types of crops grown in the agricultural area of the river basins studied in this work. Supplementary S2: Additional methodological details or the construction of the minimum flow regime.

Author Contributions

P.C. carried out the field work, data collection, and processing of the hydraulic models. D.B. carried out the data collection, was in charge of the elaboration of the figures, and participated in the drafting of the text. E.R. participated in the drafting of the text. All authors (D.B., P.C. and E.R.) have reviewed the work. All authors have read and agreed to the published version of the manuscript.

Funding

This research received no external funding.

Data Availability Statement

The data that support the findings of this study are openly available. The water demands of each river were obtained from the database of the Hydrographic Confederation of Duero (OPH-CHD, 2022 [33]; https://www.chduero.es/documents/20126/1883851/PHD22-27_050_00_Demandas-v04.pdf/718553a3-9c41-2888-bd65-fecf2105d6a9?t=1666614077725 accessed on 15 July 2024). Natural flows restored with the hydrological model were obtained from https://www.chduero.es/web/guest/apendice-3-series-de-aportaciones-por-masa. The official ecological flow proposal was obtained from https://www.chduero.es/documents/20126/1883851/PHD22-27_040_00_CauEco-v08.pdf/4e232833-e0d0-478e-338b-c0bc65722bf5?t=1666076010009. The Confederación del Duero is accessible at https://mirame.chduero.es/chduero/viewer. Crop demands were obtained from an irrigation program developed by the regional department of agriculture (Instituto Tecnológico Agrario de Castilla y León, 2019 [41]; https://www.inforiego.org/opencms/opencms). The rest of the data, models, or codes that support the findings of this study are available from the corresponding author upon reasonable request.

Conflicts of Interest

The authors declare no conflicts of interest.

References

  1. UNEP (United Nations Environment Programme). Global Environment Outlook 3: Past, Present and Future Perspectives; Earthscan: London, UK, 2002. [Google Scholar]
  2. Arévalo-Mejía, R.; Leblois, E.; Mastachi-Loza, C.A.; Salinas-Tapia, H.; Khalidou, M.B.; Yadira, A.; Vilchis-Francés, A.Y.; Becerril-Piña, R.; Díaz-Delgado, C. Integrated hydro informatics tool to assess hydrological alteration on gauged sites: Hydra-Eflow. Environ. Model. Softw. 2023, 160, 105592. [Google Scholar] [CrossRef]
  3. Poff, N.L.; Zimmerman, J.K.H. Ecological responses to altered flow regimes: A literature review to inform the science and management of environmental flows. Freshw. Biol. 2010, 55, 194–205. [Google Scholar] [CrossRef]
  4. Poff, N.; Tharme, R.; Arthington, A. Evolution of Environmental Flows Assessment Science, Principles, and Methodologies. In Water for the Environment; Elsevier: London, UK, 2017; pp. 203–236. [Google Scholar]
  5. Meitzen, K.M.; Martin, W.D.; Martin, C.T.; Burns, C.E. Geomorphology within the interdisciplinary science of environmental flows. Geomorphology 2013, 200, 143–154. [Google Scholar] [CrossRef]
  6. Alcázar, J.; Palau, A. Establishing environmental flow regimes in a Mediterranean watershed based on a regional classification. J. Hydrol. 2010, 388, 41–51. [Google Scholar] [CrossRef]
  7. Bovee, K.D. A Guide to Stream Habitat Analysis Using the Instream Flow Incremental Methodology; US Fish and Wildlife Service: Fort Collins, CO, USA, 1982; 248p. [Google Scholar]
  8. García de Jalón, D. The Spanish Experience in Determining Minimum Flow regimes in Regulated Streams. Can. Water Resour. J. 2003, 28, 185–198. [Google Scholar] [CrossRef]
  9. Acreman, M.C.; Dunbar, M.J. Defining environmental river flow requirements—A review. Hydrol. Earth Syst. Sci. 2004, 8, 861–876. [Google Scholar] [CrossRef]
  10. Richter, B.D.; Baumgartner, J.V.; Wigington, R.; Braun, D.P. How much water does a river need? Freshw. Biol. 1997, 37, 231–249. [Google Scholar] [CrossRef]
  11. Tharme, R.E.; King, J.M. Development of the Building Block Methodology for Instream Flow Assessments, and Supporting Research on the Effects of Different Magnitude Flows on Riverine Ecosystems; Water Research Commission Report No. 576/1/98; Water Research Commission: Pretoria, South Africa, 1998. [Google Scholar]
  12. King, J.M.; Tharme, R.E.; De Villiers, M. (Eds.) Environmental Flow Assessments for Rivers: Manual for the Building Block Methodology; Water Research Commission Technology Transfer Report No. TT131/00; Water Research Commission: Pretoria, South Africa, 2000. [Google Scholar]
  13. Poff, N.L.; Richter, B.D.; Arthington, A.H.; Bunn, S.E.; Naiman, R.J.; Kendy, E.; Acreman, M.; Apse, C.; Bledsoe, B.P.; Freeman, M.C. The ecological limits of hydrologic alteration (ELOHA): A new framework for developing regional environmental flow standards. Freshw. Biol. 2009, 55, 147–170. [Google Scholar] [CrossRef]
  14. McManamay, R.A.; Orth, D.J.; Dolloff, C.A.; Mathews, D.C. Application of the ELOHA framework to regulated rivers in the upper Tennessee River Basin: A case study. Environ. Manag. 2013, 51, 1–26. [Google Scholar] [CrossRef]
  15. Arthington, A.H.; Rall, J.L.; Kennard, M.J.; Pusey, B.J. Environmental flow requirements of fish in Lesotho rivers using the DRIFT methodology. River Res. Appl. 2003, 19, 641–666. [Google Scholar] [CrossRef]
  16. Pastor, A.V.; Ludwig, F.; Biemans, H.; Hoff, H.; Kabat, P. Accounting for environmental flow requirements in global water assessments. Hydrol. Earth Syst. Sci. 2014, 18, 5041–5059. [Google Scholar] [CrossRef]
  17. Acreman, M.C.; Overton, I.C.; King, J.; Wood, P.J.; Cowx, I.G.; Dunbar, M.J.; Kendy, E.; Young, W.J. The changing role of ecohydrological science in guiding environmental flows. Hydrol. Sci. J. 2014, 59, 433–450. [Google Scholar] [CrossRef]
  18. Alves, M.H.; Bernardo, J.M. Caudais Ecológicos em Portugal; INAG, Ministério das Cidades, Ordenamento do Território e Ambiente: Lisboa, Portugal, 2002. [Google Scholar]
  19. Alcácer, C.; Ballester, A.; De Stefano, L.; Hernández, J.M.; Lacalle, A.; Magdaleno, F.; Schmidt, G. Recomendaciones Para la Concertación de Regímenes Ecológicos de Caudales en el Marco de la Planificación Hidrológica Española; Contributions from experts of the Working Group on Environmental Flows (GTCA); Ministerio de Medio Ambiente: Madrid, Spain, 2011. [Google Scholar]
  20. Hirji, R.; Davis, R. Recommendations Environmental Flows in Water Resources Policies, Plans, and Projects. Case Studies; The International Bank for Reconstruction and Development: Washington, DC, USA, 2009. [Google Scholar]
  21. Kampa, E.; Schmidt, G. Implementation of e-flows in the EU. Developed under the Framework Contract ‘Water for the Green Deal’. In EU Strategy on Adaptation to Climate Change and Common Implementation Strategy Work Programme for the Water Directives (2022–2024); European Commission Report 2023; European Commission: Brussels, Belgium, 2023. [Google Scholar]
  22. Snelder, T.; Booker, D.; Lamouroux, N. A Method to Assess and Define Environmental Flow Rules for Large Jurisdictional Regions. J. Am. Water Resour. As. 2011, 47, 828–840. [Google Scholar] [CrossRef]
  23. Godinho, F.; Costa, C.; Pinheiro, P.; Reis, F.; Pinheiro, A. Integrated Procedure for Environmental Flow Assessment in Rivers. Environ. Process. 2014, 1, 137–147. [Google Scholar] [CrossRef]
  24. Benítez, C.; Schmidt, G. Analysis of the Implementation of Environmental Flows in the Wider Context of the River Basin Management Plans (Report Drafted in the Framework of the Comparative Study of Pressures and Measures in the Major River Basin Management Plans. Task 3d: Water Abstraction and Water Use); European Commission Report 2012; European Commission: Brussels, Belgium, 2012. [Google Scholar]
  25. WFD. Directive 2000/60/EC of the European Parliament and of the Council of 23 October 2000 Establishing a Framework for Community Action in the Field of Water Policy; WFD, European Parliament and of the Council: Luxemburg, 2000.
  26. González del Tánago, M.; García de Jalón, D.G.; Román, M. River restoration in Spain: Theoretical and practical approach in the context of the European Water Framework Directive. Environ. Manag. 2012, 50, 123–139. [Google Scholar] [CrossRef] [PubMed]
  27. Paredes-Arquiola, J.; Martinez-Capel, F.; Solera, A.; Aguilella, V. Implementing environmental flows in complex water resources systems—Case study: The Duero river basin, Spain. River Res. Appl. 2013, 29, 451–468. [Google Scholar] [CrossRef]
  28. Bonsch, M.; Popp, A.; Biewald, A.; Rolinski, S.; Schmitz, C.; Weindl, I.; Stevanovic, M.; Högner, K.; Heinke, J.; Ostber, S.; et al. Environmental flow provision: Implications for agricultural water and land-use at the global scale. Global Environ. Chang. 2015, 30, 113–132. [Google Scholar] [CrossRef]
  29. Dunna, S.M.; Stalham, M.; Chalmers, N.; Crabtree, B. Adjusting irrigation abstraction to minimise the impact on stream flow in the East of Scotland. J. Environ. Manag. 2003, 68, 95–107. [Google Scholar] [CrossRef] [PubMed]
  30. Pang, A.; Li, C.; Sun, T. Trade-Off Analysis to Determine Environmental Flows in a Highly Regulated Watershed. Sci. Rep. 2018, 8, 14130. [Google Scholar] [CrossRef]
  31. García Bautista, A.; Baeza, D.; Herrera, T.; La Calle, A.; Martínez, J. Los caudales ecológicos, en el olvido en la Red Natura 2000. Quercus 2021, 427, 34. [Google Scholar]
  32. Tharme, R.E. A global perspective on environmental flow assessment: Emerging trends in the development and application of environmental flow methodologies for rivers. River Res. Appl. 2003, 19, 397–441. [Google Scholar] [CrossRef]
  33. OPH-CHD (Confederación Hidrográfica del Duero). Plan hidrológico de la parte española de la Demarcación Hidrográfica del Duero. In Plan Hidrológico de Cuenca; Anejo 4. Caudales ecológicos; Ministerio de Medio Ambiente Rural y Marino: Madrid, Spain, 2022. [Google Scholar]
  34. Belmar, O.; Velasco, J.; Martínez-Capel, F. Hydrological classification of natural flow regimes to support environmental flow assessments in intensively regulated Mediterranean rivers, Segura River Basin (Spain). Environ. Manag. 2011, 47, 992–1004. [Google Scholar] [CrossRef] [PubMed]
  35. Jowett, I.G.; Hayes, J.W.; Duncan, M.J. A Guide to Instream Habitat Survey Methods and Analysis; NIWA Science and Technology Series No. 54; NIWA: Wellington, New Zealand, 2008. [Google Scholar]
  36. Parasiewicz, P. The mesoHABSIM model revisited. River Res. Appl. 2007, 23, 893–903. [Google Scholar] [CrossRef]
  37. Ruiz-García, J.M. Modelo Distribuido Para la Evaluación de Recursos Hídricos; Ministry of Public Works, Monografía del CEDEX n° M-67; Ministerio de Fomento: Madrid, Spain, 1999. [Google Scholar]
  38. Martínez Santa-María, C.; Fernández Yuste, J.A. IAHRIS Índices de Alteración Hidrológica en Ríos. Manual de Referencia Metodológica; Versión 1; Dirección General del Agua (MITECORD): Madrid, Spain, 2008. [Google Scholar]
  39. Black, A.R.; Rowan, J.S.; Duck, R.W.; Bragg, O.M.; Clelland, B.E. DHRAM: A method for classifying river flow regime alterations for the EC Water Framework Directive. Aquat. Conserv. 2005, 15, 427–446. [Google Scholar] [CrossRef]
  40. Richter, B.D.; Baumgartner, J.V.; Powell, J.; Braun, D.P. A method for assessing hydrologic alteration within ecosystems. Conserv. Biol. 1996, 10, 1163–1174. [Google Scholar] [CrossRef]
  41. Instituto Tecnológico Agrario de Castilla y León. Inforiego. 2019. Available online: https://www.inforiego.org/opencms/opencms/index.html (accessed on 13 July 2023).
  42. Brouwer, C.; Prins, K.; Heibloem, M. Irrigation Water Management: Irrigation Scheduling; Training Manual No. 4; Food and Agriculture Organization: Rome, Italy, 1989; 43p. [Google Scholar]
  43. García de Jalón, D.; Gutierrez, B.; Morillo, M.; Martínez, F.; Baselga, S.; Baeza, D. Realización del Cálculo de Aportaciones Ambientales y Caudales Ecológicos Mínimos en la Cuenca Hidrográfica del Río Tajo; Departamento de Ingeniería Forestal E.T.S.I. Montes; Universidad Politécnica de Madrid. CEDEX: Madrid, Spain, 1997. [Google Scholar]
  44. Bovee, K.D.; Cochnauer, T. Development and Evaluation of Weighted Criteria: Probability-of-Use Curves for Instream Flow Assessments: Fisheries; United States Fish and Wildlife Service, Instream Flow Information Paper 3, FWS/OBS-77; U.S. Geological Survey: Fort Collins, CO, USA, 1977.
  45. Martínez-Capel, F.; García de Jalón, D.; Werentzky, D.; Baeza Sanz, D.; Rodilla-Alamá, M. Microhabitat use by three endemic Iberian cyprinids in Mediterranean rivers (Tagus river basin, Spain). Fish. Manag. Ecol. 2009, 16, 52–60. [Google Scholar] [CrossRef]
  46. Steffler, P.; Blackburn, J. River2D: Two-Dimensional Depth Averaged Model of River Hydrodynamics and Fish Habitat. Introduction to Depth Averaged Modeling and User’s Manual; University of Alberta: Edmonton, AB, Canada, 2002. [Google Scholar]
  47. HPR. The Instruction for Hydrologic Planning in B.O.E. Orden ARM/2656/2008, de 10 de Septiembre, Por la Que se Aprueba la Instrucción de Planificación Hidrológica; Spanish Ministerio de Medio Ambiente, y Medio Rural y Marino: Madrid, Spain, 2008.
  48. King, J.; Brown, C.; Sabet, H. A scenario-based holistic approach to environmental flow assessments for rivers. River Res. Appl. 2003, 19, 619–639. [Google Scholar] [CrossRef]
  49. Velasco-Muñoz, J.F.; Aznar-Sánchez, J.A.; Batlles-de la Fuente, A.; Fidelibus, M.D. Sustainable Irrigation in Agriculture: An Analysis of Global Research. Water 2019, 11, 1758. [Google Scholar] [CrossRef]
  50. Collier, M.; Webb, R.H.; Schmidt, J.C. Dams and Rivers: Primer on the Downstream Effects of Dams; US Geological Survey Circular nr 1126; United States Geological Survey: Reston, VA, USA, 1996.
  51. Kondolf, G.M.; Batalla, R.J. Hydrological effects of dams and water diversions on rivers of Mediterranean-climate regions: Examples from California. In Catchment Dynamics and River Processes: Mediterranean and Other Climate Regions; Garcia, C., Batalla, R.J., Eds.; Elsevier: Amsterdam, The Netherlands, 2005; pp. 197–211. [Google Scholar]
  52. Growns, I. The implementation of an environmental flow regime results in ecological recovery of regulated rivers. Restor. Ecol. 2016, 24, 406–414. [Google Scholar] [CrossRef]
  53. Vicente-Serrano, S.M.; Peña-Gallardo, M.; Hannaford, J.; Murphy, C.; Lorenzo-Lacruz, J.; Dominguez-Castro, F.; López-Moreno, J.I.; Beguería, S.; Noguera, I.; Harrigan, S.; et al. Climate, Irrigation, and Land Cover Change Explain Streamflow Trends in Countries Bordering the Northeast Atlantic. Geophys. Res. Lett. 2019, 46, 10821–10833. [Google Scholar] [CrossRef]
  54. González del Tánago, M.; Martínez-Fernández, V.; García de Jalón, D. Diagnosing problems produced by flow regulation and other disturbances in Southern European Rivers: The Porma and Curueño Rivers (Duero Basin, NW Spain). Aquat. Sci. 2016, 78, 121–133. [Google Scholar] [CrossRef]
  55. Batalla, R.J.; Gomez, C.M.; Kondolf, G.M. Reservoir-induced hydrological changes in the Ebro River basin (NE Spain). J. Hydrol. 2004, 290, 117–136. [Google Scholar] [CrossRef]
  56. Fornaroli, R.; Muñoz-Mas, R.; Martínez-Capel, F. Fish community responses to antecedent hydrological conditions based on long-term data in Mediterranean river basins (Iberian Peninsula). Sci. Total Environ. 2020, 728, 138052. [Google Scholar] [CrossRef] [PubMed]
  57. Benejam, L.; Angermeier, P.L.; Munné, A.; García Berthou, E. Assessing effects of water abstraction on fish assemblages in Mediterranean streams. Freshw. Biol. 2010, 55, 628–642. [Google Scholar] [CrossRef]
  58. Grantham, T.E.; Viers, J.H.; Moyle, P.B. Systematic Screening of Dams for Environmental Flow Assessment and Implementation. BioScience 2014, 64, 1006–1018. [Google Scholar] [CrossRef]
  59. Sánchez Navarro, R.; Stewardson, M.; Breil, P.; García de Jalón, D.; Eisele, M. Hydrological impacts affecting endangered fish species: A Spanish case study. River Res. Appl. 2007, 23, 511–523. [Google Scholar] [CrossRef]
  60. Alonso-González, C.; Gortázar, J.; Baeza Sanz, D.; García de Jalón, D. Dam function rules based on brown trout flow requirements: Design of environmental flow regimes in regulated streams. Hydrobiologia 2008, 609, 253–262. [Google Scholar] [CrossRef]
  61. Owusu, A.; Mul, M.; van der Zaag, P.; Slinger, J. Re-operating dams for environmental flows: From recommendation to practice. River Res. Appl. 2020, 37, 176–186. [Google Scholar] [CrossRef]
  62. Poff, N.L.; Allan, J.D.; Bain, M.B.; Karr, J.R.; Prestegaard, K.L.; Richter, B.D.; Sparks, R.E.; Stromberg, J.C. The natural flow regime. BioScience 1997, 47, 769–784. [Google Scholar] [CrossRef]
  63. Rivaes, R.; Boavida, I.; Santos, J.M.; Pinheiro, A.N.; Ferreira, T. Importance of considering riparian vegetation requirements for the long-term efficiency of environmental flows in aquatic microhabitats. Hydrol. Earth Syst. Sci. 2017, 21, 5763–5780. [Google Scholar] [CrossRef]
  64. Merritt, D.M.; Scott, M.L.; Poff, N.L.; Auble, G.T.; Lytle, D.A. Theory, methods and tools for determining environmental flows for riparian vegetation: Riparian vegetation-flow response guilds. Freshw. Biol. 2010, 55, 206–225. [Google Scholar] [CrossRef]
  65. Piqué, G.; Batalla, R.J.; Sabater, S. Hydrological characterization of dammed rivers in the NW Mediterranean region. Hydrol. Process. 2016, 30, 1691–1707. [Google Scholar] [CrossRef]
  66. Solans, M.A.; Mellado-Díaz, A. A Landscape-based Regionalization of Natural Flow Regimes in the Ebro River Basin and its Biological Validation. River Res. Appl. 2015, 31, 457–469. [Google Scholar] [CrossRef]
  67. Peñas, F.J.; Barquín, J.; Snelder, T.H.; Booker, D.J.; Álvarez, C. The influence of methodological procedures on hydrological classification performance. Hydrol. Earth Syst. Sci. 2014, 18, 3393–3409. [Google Scholar] [CrossRef]
  68. O’Keeffe, J.; Quesne, T.L. Cómo Conservar Los Ríos Vivos; WWF—World Wildlife Fund, Serie Seguridad Hídrica de WWF: Washington, DC, USA, 2010; Volume 2. [Google Scholar]
  69. Khan, S.; Ahmad, A.; Malano, H.M. Managing irrigation demand to improve seasonality of river flows. Irrig. Drain. 2009, 58, 157–170. [Google Scholar] [CrossRef]
  70. Confederación Hidrográfica del Duero. Resumen de los resultados Cuantitativos del Estudio Sobre Tenencia de Recursos Hídricos Para FAO: Caso de Estudio de la Modernización de la Comunidad de Regantes de Cabecera del río Riaza; Confederación Hidrográfica del Duero: Valladolid, Spain, 2012. [Google Scholar]
  71. Kennard, M.; Arthington, A.H.; Thompson, C. Flow requirements of freshwater fish. In Environmental Flow Requirements of the Brisbane River Downstream from Wivenhoe Dam; South East Queensland Water Corporation and Centre for Catchment and In-Stream Research: Brisbane, Australia, 2000; pp. 265–330. [Google Scholar]
  72. King, A.J.; Gawne, B.; Beesley, L.; Koehn, J.D.; Nielsen, D.L.; Amina Price. Improving ecological response monitoring of environmental flows. Environ. Manag. 2015, 55, 991–1005. [Google Scholar] [CrossRef] [PubMed]
  73. Bêche, L.; Loire, R.; Barillier, A.; Archambaud, G.; Morel, A. Flow restoration of the Durance River: Implementation and monitoring of targeted water releases to reduce clogging and improve river function. In Proceedings of the REFORM International Conference on River and Stream Restoration D7.5 “Novel Approaches to Assess and Rehabilitate Modified Rivers”, Wageningen, The Netherlands, 29 June–2 July 2015; pp. 215–221. [Google Scholar]
  74. Capra, H.; Sabaton, C.; Gouraud, V.; Souchon, Y.; Lim, P. A Population Dynamics Model and Habitat Simulation as a Tool to Predict Brown Trout Demography in Natural and Bypassed Stream Reaches. River Res. Appl. 2003, 19, 551–568. [Google Scholar] [CrossRef]
  75. Jowett, I.G.; Biggs, B.J.F. Flow regime requirements and the biological effectiveness of habitat-based minimum flow assessments for six rivers. Intl. J. River Basin Manag. 2006, 4, 179–189. [Google Scholar] [CrossRef]
  76. Poff, N.L.; Brown, N.; Grantham, C.M.; Matthews, T.E.; Palmer, J.H.; Wilby, M.A.; Spence, R.L.; Haasnoot, C.M.; Mendoza, M.; Dominique, G.F.; et al. Sustainable water management under future uncertainty with eco-engineering decision scaling. Nat. Clim. Chang. 2016, 6, 25–34. [Google Scholar] [CrossRef]
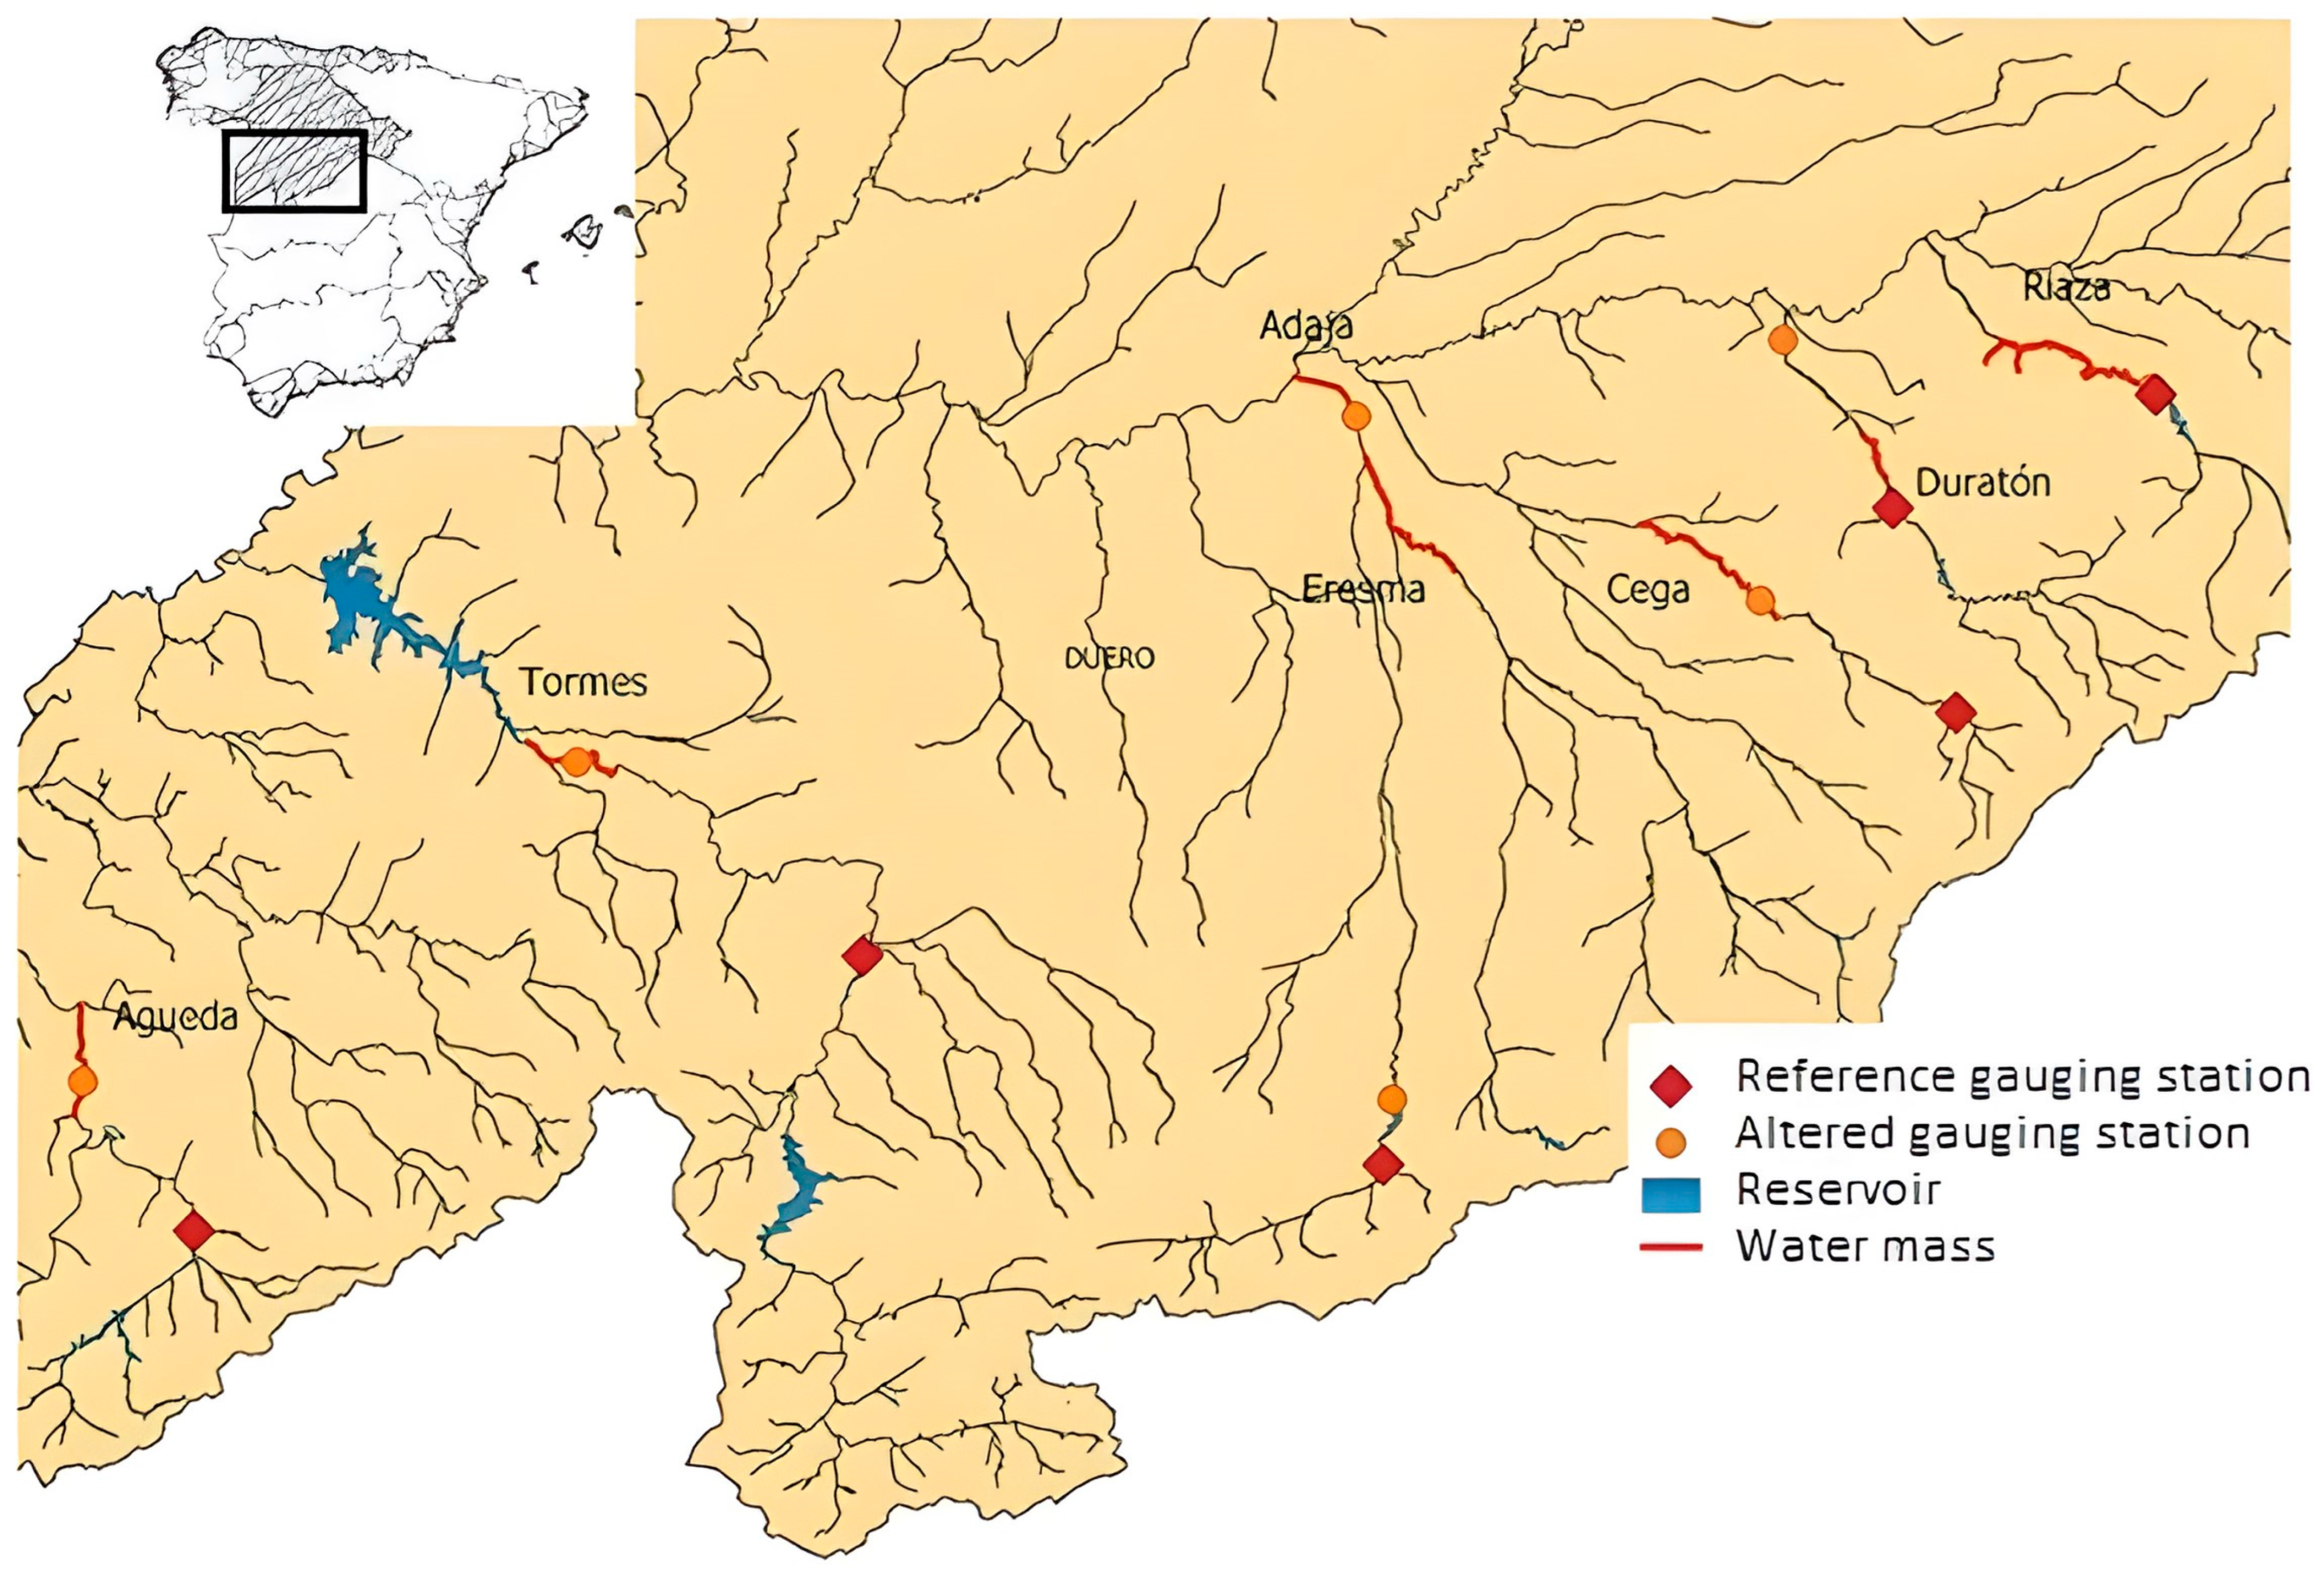
Figure 1. Location of the water mass in the Duero River basin where the research has been carried out. Reservoirs, a gauging station used as the reference flow, and gauging stations used to obtain the data of the altered regime are also included. The coordinates of the corners of the rectangle that includes all the basins are UTMX 169343-474438 and UTMY 4468577-4638832. The projection used is EPSG 25830.
Water 16 02106 g001
Figure 2. The flow diagram shows the methodological process of the whole work. the IHA has detected three types of problems, which have been solved by means of different processes, in order to introduce the e-flow proposals in the hydrological planning objectives.
Water 16 02106 g002
Figure 3. Daily flow data taken from a gauging station selected a representative year against the average daily natural flow reconstructed with a gauging reference station and the SIMPA model in Riaza and Duraton rivers. These rivers present hydropeaking and seasonal inversion flow.
Water 16 02106 g003
Figure 4. Daily flow data taken from a gauging station selected a representative year against the average daily natural flow reconstructed with a gauging reference station and the SIMPA model in the Agueda and Eresma rivers. In this group of rivers, the main alteration is the general reduction in flow rates.
Water 16 02106 g004
Figure 5. Reconstructed average daily flows in the Cega and Adaja rivers using a gauging reference station and the SIMPA model of masses 383 and 422 against a representative year’s daily flows of the main alteration collected from a gauging station located in each river. There is a reduction in the number of avenues and in total flow.
Water 16 02106 g005
Figure 6. Daily flow data taken from a gauging station in Tormes water mass 505 selected a representative year, 2015, against the average daily natural flow reconstructed with a gauging reference station and the SIMPA model. The principal regime alteration in this river produced by agricultural demands is the elimination of avenue flows.
Water 16 02106 g006
Figure 7. Agricultural demand regime. The monthly regime in seven Duero rivers constructed with the irrigation demands is represented. The graph expresses the difference in irrigation period between the demands reported by the water administration and those obtained in this work.
Water 16 02106 g007
Figure 8. Combined curves of variation in WUA (weighted fish habitat) as a function of flow. For each river, the fish considered to be the most demanding in terms of flow requirements was used.
Water 16 02106 g008aWater 16 02106 g008b
Figure 9. (a) On the left, the difference between the monthly inflows in the irrigation season that would be obtained from the Riaza river if the initial environmental flow is maintained and the agricultural demands. (b) On the right, representation flow regimes on the Riaza river, in red, the alternative environmental flow proposed, taking into account trout preference and water demand. In green, the adjusted water demand. In blue, the environmental flow proposed by the CHD (Hydrographic Duero Confederation). Flows between June and September have been increased to meet the demands and to obtain at least a flow that provides 80% of the WUA.
Water 16 02106 g009
Figure 10. Representation of environmental flow regimes and water demand in the Duratón and Eresma rivers. In red, the alternative environmental flow proposed, taking into account fish preference and water demand. In green, the adjusted water demand. In blue, the environmental flow proposed by the CHD.
Water 16 02106 g010
Table 1. Rivers studied with reference to their official water mass code according to the hydraulic administration (C.H. Duero) and gauging stations from which data have been taken. The data of the gauging station can be obtained from the following link: https://sig.mapama.gob.es/redes-seguimiento/index.html?herramienta=Aforos (Accessed on 15 July 2024).
RiverWater Body Code According to the Water AdministrationGauging Station for Natural FlowGauging Station for Altered Flow
Duratón 83121102161
Riaza 37220102010
Eresma 44820162048
Adaja 42220732056
Agueda 52320462091
Cega 38320162714
Tormes 50520862088
Table 2. Main hydrological alteration present in the water bodies of the studied river along with its possible causes. Results of the IHA analysis with the principal hydrological factors affected. Column 4 shows the score obtained with the program used (DHRAM) and its interpretation.
River and Water Mass Code Main AlterationsPossible Causes of the AlterationIHA Result (DHRAM Value)Principal Modified Hydrological Characters
Duratón 831 The peak flows disappear, as well as the river flow regime has many fluctuations.Hydroelectric production, conditioned by irrigation.17, high risk of impactTiming of annual extremes. Frequency and duration of high and low pulses.
Riaza 372 Inverted river flow regime.Agricultural demand and electricity production. One reservoir for electrical production.17, high risk of impactMagnitude of monthly water conditions.
Timing of annual extremes. Frequency and duration of high and low pulses.
Eresma 448 River flow inverted regime, lower annual flow than natural.High irrigation demands, altered flow reduction compared with natural, almost dried in summer. It has five reservoirs. 10, moderate risk of impactMagnitude of monthly water conditions.
Frequency and duration of high and low pulses.
Adaja 422 Not very intense, reduction of the annual flow, smaller number of peak flows. Demand is not high compared with the total water contribution; the regime differs a little from natural. Receives the Eresma river, and it has one more reservoir than that river.6, moderate risk of impactFrequency and duration of high and low pulses.
Agueda 523 Severe reduction in the annual flow.Agriculture does not explain the reduction in river flow; the agricultural demands are very low. It has two dams for urban supply.15, high risk of impactMagnitude of monthly water conditions.
Timing of annual extremes. Frequency and duration of high and low pulses.
Cega 383 Small annual flow reduction. The period of more alteration and lower flow is autumn.Relatively low agricultural demand; there are no dams upstream.11, high risk of impactMagnitude of monthly water conditions.
Timing of annual extremes. Frequency and duration of high and low pulses.
Tormes 505 Moderate flow reduction, severe loss of peak flow.It has two reservoirs upstream.
High agricultural demands.
9, moderate risk of impactTiming of annual extremes. Frequency and duration of high and low.
Table 3. Data on the water demand that affects the resources of each water mass, official and adjusted agricultural demands. The last column shows the percentage of agricultural demand in relation to the total available resources.
River and Water Mass CodeWater Volume Demanded (Hm3)Actual Irrigated Area (ha)Adjusted Agrarian Demands (Hm3)Percentage of Agricultural Demands against Total Resources
Duratón
831
16290012.216.00
Riaza 37231.52676718.145.9
Eresma 44817.04246516.476.14
Adaja 42236.9700034.58.61
Agueda 52330.27203023.15.53
Cega 38324.9456418.525.78
Tormes 505125.0120,462121.812.72
Table 4. Habitat increment obtained with the alternative e-flow regime in the Riaza river with respect to the official one, measured with the monthly WUA (weighted usable area) values.
Official e-Flow m3/sWUA (m2) OfficialProposed e-Flow m3/sWUA (m2) Proposed
October0.21282.940.50361.96
November0.21282.940.93413.66
December0.26301.811.53442.42
January0.32317.722.26461.12
February0.33317.722.08457.54
March0.32317.722.19457.54
April0.34317.722.01457.54
May0.32317.721.73445.66
June0.24282.941.67445.66
July0.21282.942.13457.54
August0.21282.941.92451.53
September0.26301.811.02420.89
Total3606.924 5273.058
Table 5. Characteristic parameters of the alternative flow regime for each of the water bodies in this work, minimum flow for the driest month, exponent applied to the monthly index, and flow value of 80% of the maximum WUA.
Official River Water BodyMin Flow (m3/s)Exponent in Monthly Index80% WUA Flow
(m3/s)
Duratón 831 0.70.81.1
Riaza 372 0.50.750.7
Eresma 448 0.40.71.05
Adaja 422 0.80.50.8
Agueda 523 0.60.51.8
Cega 383 0.50.50.5
Tormes 505 70.58
Table 6. Parameters for defining river floods in the Cega, Tormes, and Adaja rivers; the magnitude of the peak flow duration in m3/s; and the frequency of high flow events. The last two columns present the total volume of water needed to produce each flood and the total number of annual floods.
River Water Body Mass Magnitude of the High Flow (m3/s)Duration DaysNumber of Events per YearVolume Required to Generate 6-Day Flood (Hm3)Volume Required for the Season (Hm3)
Adaja 422 27.96.656.00 11.99
Cega 383 10.512.842.33 4.66
Tormes 505 7412416.43 32.87
Table 7. Environmental flow regimes for the seven rivers; for the Riaza, Duratón, and Eresma rivers, the original proposed regime and the corrected alternative flow, modified to meet irrigation demand and increase winter flows, are presented. For the rest of the rivers, the final monthly environmental flow regime is shown.
e-Flow in m3/sRiazaDuratónEresma
Monthse-Flow Initiale-Flow Modifiede-Flow Initiale-Flow Modifiede-Flow Initiale-Flow Modified
October 0.500.500.860.940.660.81
November 0.750.931.071.321.302.09
December 1.051.531.221.641.682.99
January 1.372.261.221.631.903.54
February 1.292.081.371.981.903.55
March 1.342.191.392.021.863.44
April 1.262.011.321.851.803.29
May 1.151.731.181.541.622.83
June 0.901.670.981.871.223.44
July 0.712.130.791.190.821.76
August 0.601.920.750.750.550.63
September 0.501.020.790.810.400.40
Adaja 422Agueda 523Cega 383Tormes 505
October 1.182.061.299.47
November 2.033.261.4613.07
December 2.523.871.4814.31
January 2.964.051.4313.88
February 3.223.251.2814.49
March 3.202.861.3515.10
April 3.042.591.3715.37
May 2.672.361.5014.75
June 1.981.581.0311.56
July 1.321.000.618.43
August 0.920.600.507.00
September 0.800.790.867.57
Disclaimer/Publisher’s Note: The statements, opinions and data contained in all publications are solely those of the individual author(s) and contributor(s) and not of MDPI and/or the editor(s). MDPI and/or the editor(s) disclaim responsibility for any injury to people or property resulting from any ideas, methods, instructions or products referred to in the content.