Article

Geochemical Characterization and Prediction of Water Accumulation in the Goaf under Extra-Thick Fully Mechanized Top-Coal-Caving Mining

1
Ordos Huaxing Energy Co., Ltd., Ordos 017000, China
2
National Research Institute of Engineering Technology in Coal Mining, Huainan 232001, China
3
School of Earth and Environment, Anhui University of Science and Technology, Huainan 232001, China
*
Author to whom correspondence should be addressed.
Water 2024, 16(15), 2110; https://doi.org/10.3390/w16152110 (registering DOI)
Submission received: 24 June 2024 / Revised: 24 July 2024 / Accepted: 24 July 2024 / Published: 26 July 2024

Abstract

:
In multi-seam coal mining, the water accumulation in the goaf of the upper coal seam will seriously threaten the safety of the lower coal-seam recovery. How to accurately determine the water charging source in the goaf and predict the amount of water accumulation in the goaf after a certain time interval has become a major challenge that urgently needs to be solved in coal production. In this study, we consider the water-discharging goaf of the Tangjiahui Coal Mine as the object of research to investigate the problem of water accumulation in the goaf during the fully mechanized caving mining of extra-thick seams of top coal. We used geochemical methods, water-accumulation space methods, and large-well methods to analyze the hydraulic connections between goaf water and other aquifers, predict the amount of water accumulation in the goaf, and explore the characteristics of water level changes over time. We then used the results to discuss the relationship between the elevation of the accumulated water and the time taken for it to fill the goaf. The results showed that there is a hydraulic connection between the water in the airspace and the goaf water (GW), roof water (RW), floor water (FW) and Ordovician limestone water (OW); the volume of water in the goaf of the working face after mining was 2,106,838.496 m3. The average rate of water accumulation was 65.407 m3/h, and the goaf was expected to have been filled in 32,211.208 h. The derived relationship between the water level and time was H 0 = 10 12 t 3 + 10 7 t 2 0.0042 t + 814.61   ( R 2 = 0.9837 ) . This study is of great significance for the sustainable development of the safety evaluation of water blocking coal pillars at the mine boundary.

1. Introduction

Coal is the major source of energy in China, and thus plays a crucial role in the country’s socioeconomic development [1]. However, the inappropriate extraction of coal resources adversely affects the groundwater system and the ecological environment [2,3,4,5]. Coal mining leads to the formation of goafs in several areas. Water gradually accumulates in these goafs from other aquifers to threaten adjacent working faces, and this reduces the productivity of coal seam mining. Such scenarios can also lead to the accumulation of acidic goaf water [6,7,8]. A sound understanding of the process of the accumulation of water in the goaf is thus necessary for accurately predicting its volume and preventing damage to the coal mine.
Researchers across the world have extensively investigated the process of water accumulation in goafs [9]. Currently available methods to predict the accumulation of water in goafs can be divided into techniques to determine the structure of water storage, estimate the volume of the goaf, calculate the inflow of water into the mine, and form inferences based on the geophysical interpretation of the given area [10,11,12]. The method used to determine the structure of water storage is generally applied to identify the locations of goafs in which water has accumulated in regions featuring prominent geological folds and large dip angles. However, this method can determine only the location of water storage in the goafs, and struggles to predict the volume of accumulated water [13,14]. A method for estimating the volume of the goaf, rate of recovery, and roof management during coal mining has also been proposed. Researchers have also developed techniques to estimate the accumulation of water in near-horizontal coal seams as well as that of old kiln water in closed pit mines [15]. For example, studies have used the mining space method and the waterlogging space method to calculate the extent of waterlogging in closed pit mines, fully enclosed areas of goafs, and drainage goafs, to predict the volume of waterlogging in the goaf over time [16]. Because water accumulates in the goaf due to the recharging of other aquifers, the process of its accumulation is a dynamic process of recharge. The large-well method is typically used to calculate the inflow of water into mines. It uses the rate of accumulation of water in the goaf to preliminarily estimate its volume. Examining the electrical characteristics of the strata and the goaf during the geophysical exploration of the ground can help explain the approximate location, range, and water content of the goaf. This technique is currently used to determine the distribution and accumulation of water in goafs in mining areas, and is most commonly applied in the form of the transient electromagnetic method [17,18]. However, due to interference by complex hydrogeological conditions, errors by workers, and the sensitivity of the instruments used, the results of the interpretation deviate from the facts on the ground [19]. Therefore, the method of geophysical interpretation is mainly suitable for scenarios involving a limited amount of data on coal mining, a lack of clarity on the area of the goaf and the accumulation of water in it, multiple small kilns in the mining area, and areas with a long history of coal seam mining.
In recent years, the research on groundwater hydrochemical facies based on conventional ionic parameters has been relatively extensive. The hydrochemical facies reflects the genesis of groundwater and is used to distinguish different aquifers and their mixing situations. Usually, the Piper diagram and Durov diagram are used to visually express the hydrochemical facies, which can initially characterize the water quality-category characteristics of groundwater and the complex situation of the hydrogeological environment, so as to further reveal the groundwater evolution mechanism [20,21,22]. When studying the spatial distribution pattern of groundwater quality in the study area, many scholars successfully determined the distribution characteristics of the hydrochemical facies in space by combining the Shukalev classification and the GIS spatial analysis function [23,24,25]. To study the natural processes that control the chemical evolution of the main ions in groundwater, the Gibbs scatter diagram better shows these phenomena, mainly including water-rock interaction, evaporation concentration and atmospheric precipitation [26]. The ion-combination-ratio scatter diagram method can quantitatively reveal the groundwater water–rock interaction and chemical reaction processes, and it is a relatively classic hydrogeochemical analysis method [27].
In this study, we consider goaf water of the Tangjiahui Coal Mine in China as the object of research. On the basis of an in-depth study of the geochemical characteristics of groundwater by using Durov diagrams and Piper trilinear diagrams, we combine data on the hydrogeological conditions of the working faces, the results of exploration of water resources affecting them, and the accumulation space method and large-well method for water filling the drainage goaf, to predict its volume. We also explore the relationship between the elevation of water in the goaf and the time required to fill it. The work here is important for preventing and controlling water hazards during mining in areas containing goafs. There are three highlights of this article, as follows:
(1) The degree of hydraulic connection between goaf water and other aquifers has been determined.
(2) It can predict the time required for the water accumulation in the goaf of the mine to be full.
(3) It explored the relationship between water-level elevation and the time when the goaf is filled with water, providing a scientific basis for water hazard prevention.

2. Materials and Methods

2.1. Study Area

The Tangjiahui Coal Mine is located in the northeast of the Ordos Plateau, in the central part of the Zhungeer Coalfield in China (Figure 1). The terrain is generally high in the north and low in the south. The highest point is located in the northeast of Jingtian, at an elevation of 1356.87 m, while the lowest point is at the bottom of the Banglangse Taigou Gully in the south of the Jingtian, with an elevation of 1161.30 m, and a difference of 195.57 m at the highest sea level [28]. The well field in the area forms an irregular polygon, with a maximum length of about 8.5 km from north to south, and a maximum width of about 5.1 km from east to west. It covers an area of approximately 28.57 km2. The coal-bearing strata in the well field are the Taiyuan Formation (C2t) from the Upper Carboniferous and the Shanxi Formation (P1s) from the Lower Permian [29]. There are five minable coal seams in this area: namely, the upper coal seams 4, 5, 6, and 9, and the lower coal seam 9 [30]. Coal seam 6 is the major site for mining, and is located in the upper part of the third rock segment of the Taiyuan Formation from the Upper Carboniferous. It has a thickness in the range of 8.35–24.52 m, with an average thickness of 16 m. It has been mined by using fully mechanized Top-Coal-Caving mining.
The direct sources of water for filling the roof of coal seam 6 were atmospheric precipitation, pore water from rocks from the Quaternary, water in the pores and fissures of rocks from the Cretaceous Zhidan Group, and water in fissures in Permian sandstone. The latter was also the direct source of water for other parts of the study area. Moreover, water filling the bottom plate of coal seam 6 was directly provided by fractures in sandstone in the Taiyuan Formation and indirectly by Ordovician limestone. The latter was generally transmitted through the fracture zones of the faults. As of July 2023, working faces 61,101, 61,102, 61,103, 61,201, 61,202, 61,207, 61,208, 61,302, 61303, and 61,304 of the mine had been backfilled, and water had accumulated in each working face (Figure 1c).

2.2. Sampling and Testing

To study the chemical characteristics of groundwater, we obtained a total of 132 groups of groundwater hydrochemical data through on-site sampling and testing (Figure 1c), including 60 groups of goaf water (GW), 30 groups of roof water (RW), 23 groups of floor water (FW), and 19 groups of Ordovician limestone water (OW). The samples were collected in pre-cleaned and sterilized 5L high-density polyethylene bottles, which were rinsed 2–3 times with the water samples to be taken before sampling, and were sealed, labeled with the sampling information, and then sent to the School of Earth and Environment for testing.
The major detected parameters were Na++K+, Ca2+, Mg2+, Cl, SO42− and HCO3. Among them, anions such as Cl and SO42− were determined by ion chromatography (ICS2000, Dionex, Sunnyvale, CA, USA); cations such as Na++K+, Ca2+ and Mg2+ were determined by inductively coupled plasma emission spectrometry (iCAP6000, Thermoand, Waltham, MA, USA), HCO3 was determined by titration. All water samples maintained a charge balance, with error < 5%. The measurement results are shown in Table S1.
The Piper diagram and Stiff diagram are mainly determined based on the Origin 2024 software. The hydrochemical types are mainly determined based on the Shukalev classification of the Piper diagram [20]. A Stiff diagram is a specialized graph type for displaying the major ion composition of a water sample [21].

2.3. Calculation Method of Accumulated Water in Goaf

(1) Space of water accumulation in goaf.
A goaf can generally be classified into two types: a fully enclosed goaf (without drainage holes), and a drainage goaf (with drainage holes) [31]. Each goaf of the working faces of the Tangjiahui Coal Mine contained drainage holes, because of which our calculations were based on the method used to determine the space of accumulation of water in the drainage goaf. The position of the drainage holes, area of the goaf, and porosity of the overlying rock mass in the caving zone generally influence the space for water accumulation in the goaf that can be drained, and are positively correlated with it:
V = h × a × b × n c o s α
where V is the space for the accumulation of water in the goaf (m3), h is the height of the drainage holes with respect to the coal seam floor (m), a and b are the length and width of the goaf in the working face (m), respectively, n is the porosity of the rock in the overlying caving zone in the goaf, and α is the of the coal seam floor.
(2) Speed of water accumulation in goaf.
Water from the aquifer around the fracture zone that was not affected by mining continuously flowed laterally into the working face along the boundary of the fracture [32]. This part of the water primarily originated from vertical infiltration from the aquifer at the top of the fracture zone and its lateral runoff supply around the fracture zone, and was considered to be dynamic, due to its source [33]. The speed of accumulation of water in the goaf was defined as the volume of water flowing into it per unit time, and was approximately equal to the inflow of water to the goaf. The volume of water was estimated by using the large-well method:
Q = 1.366 K ( 2 H M ) M l g R r 0
R 0 = 10 S K
R = R 0 + r 0
where Q is the predicted inflow of water into the goaf (m3/h), K is the coefficient of permeability (m/d), S is the drawdown in the level of water (m), M is the thickness of the aquifer (m), R0 is its reference radius of influence (m), r0 is the predicted radius of area conversion (m), and R is the predicted radius of the area of influence (m).
(3) Calculation of time taken for water accumulation in goaf.
When water flows into the drainage goaf at a certain rate and fills it, the total time required for this is called the time needed for the accumulation of water into the goaf t (h):
t = V Q
(4) Water accumulation in goaf and space for water accumulation in goaf.
When the accumulated water space is full of water, the amount of accumulated water in the goaf is the volume of the accumulated water space in the goaf. The space for water accumulation in the goaf that can be drained is the product of its height and the area of the goaf:
V = H 0 A
The parameters in the equations are mainly determined based on the actual parameters of the on-site engineering coal mining face, and these collected parameters will be listed in the calculation content below. The coefficient of permeability (K), reference radius of influence, drawdown, predicted radius of area conversion, and thickness of the aquifer were determined based on the drilling and pumping test of the roof water.

3. Results

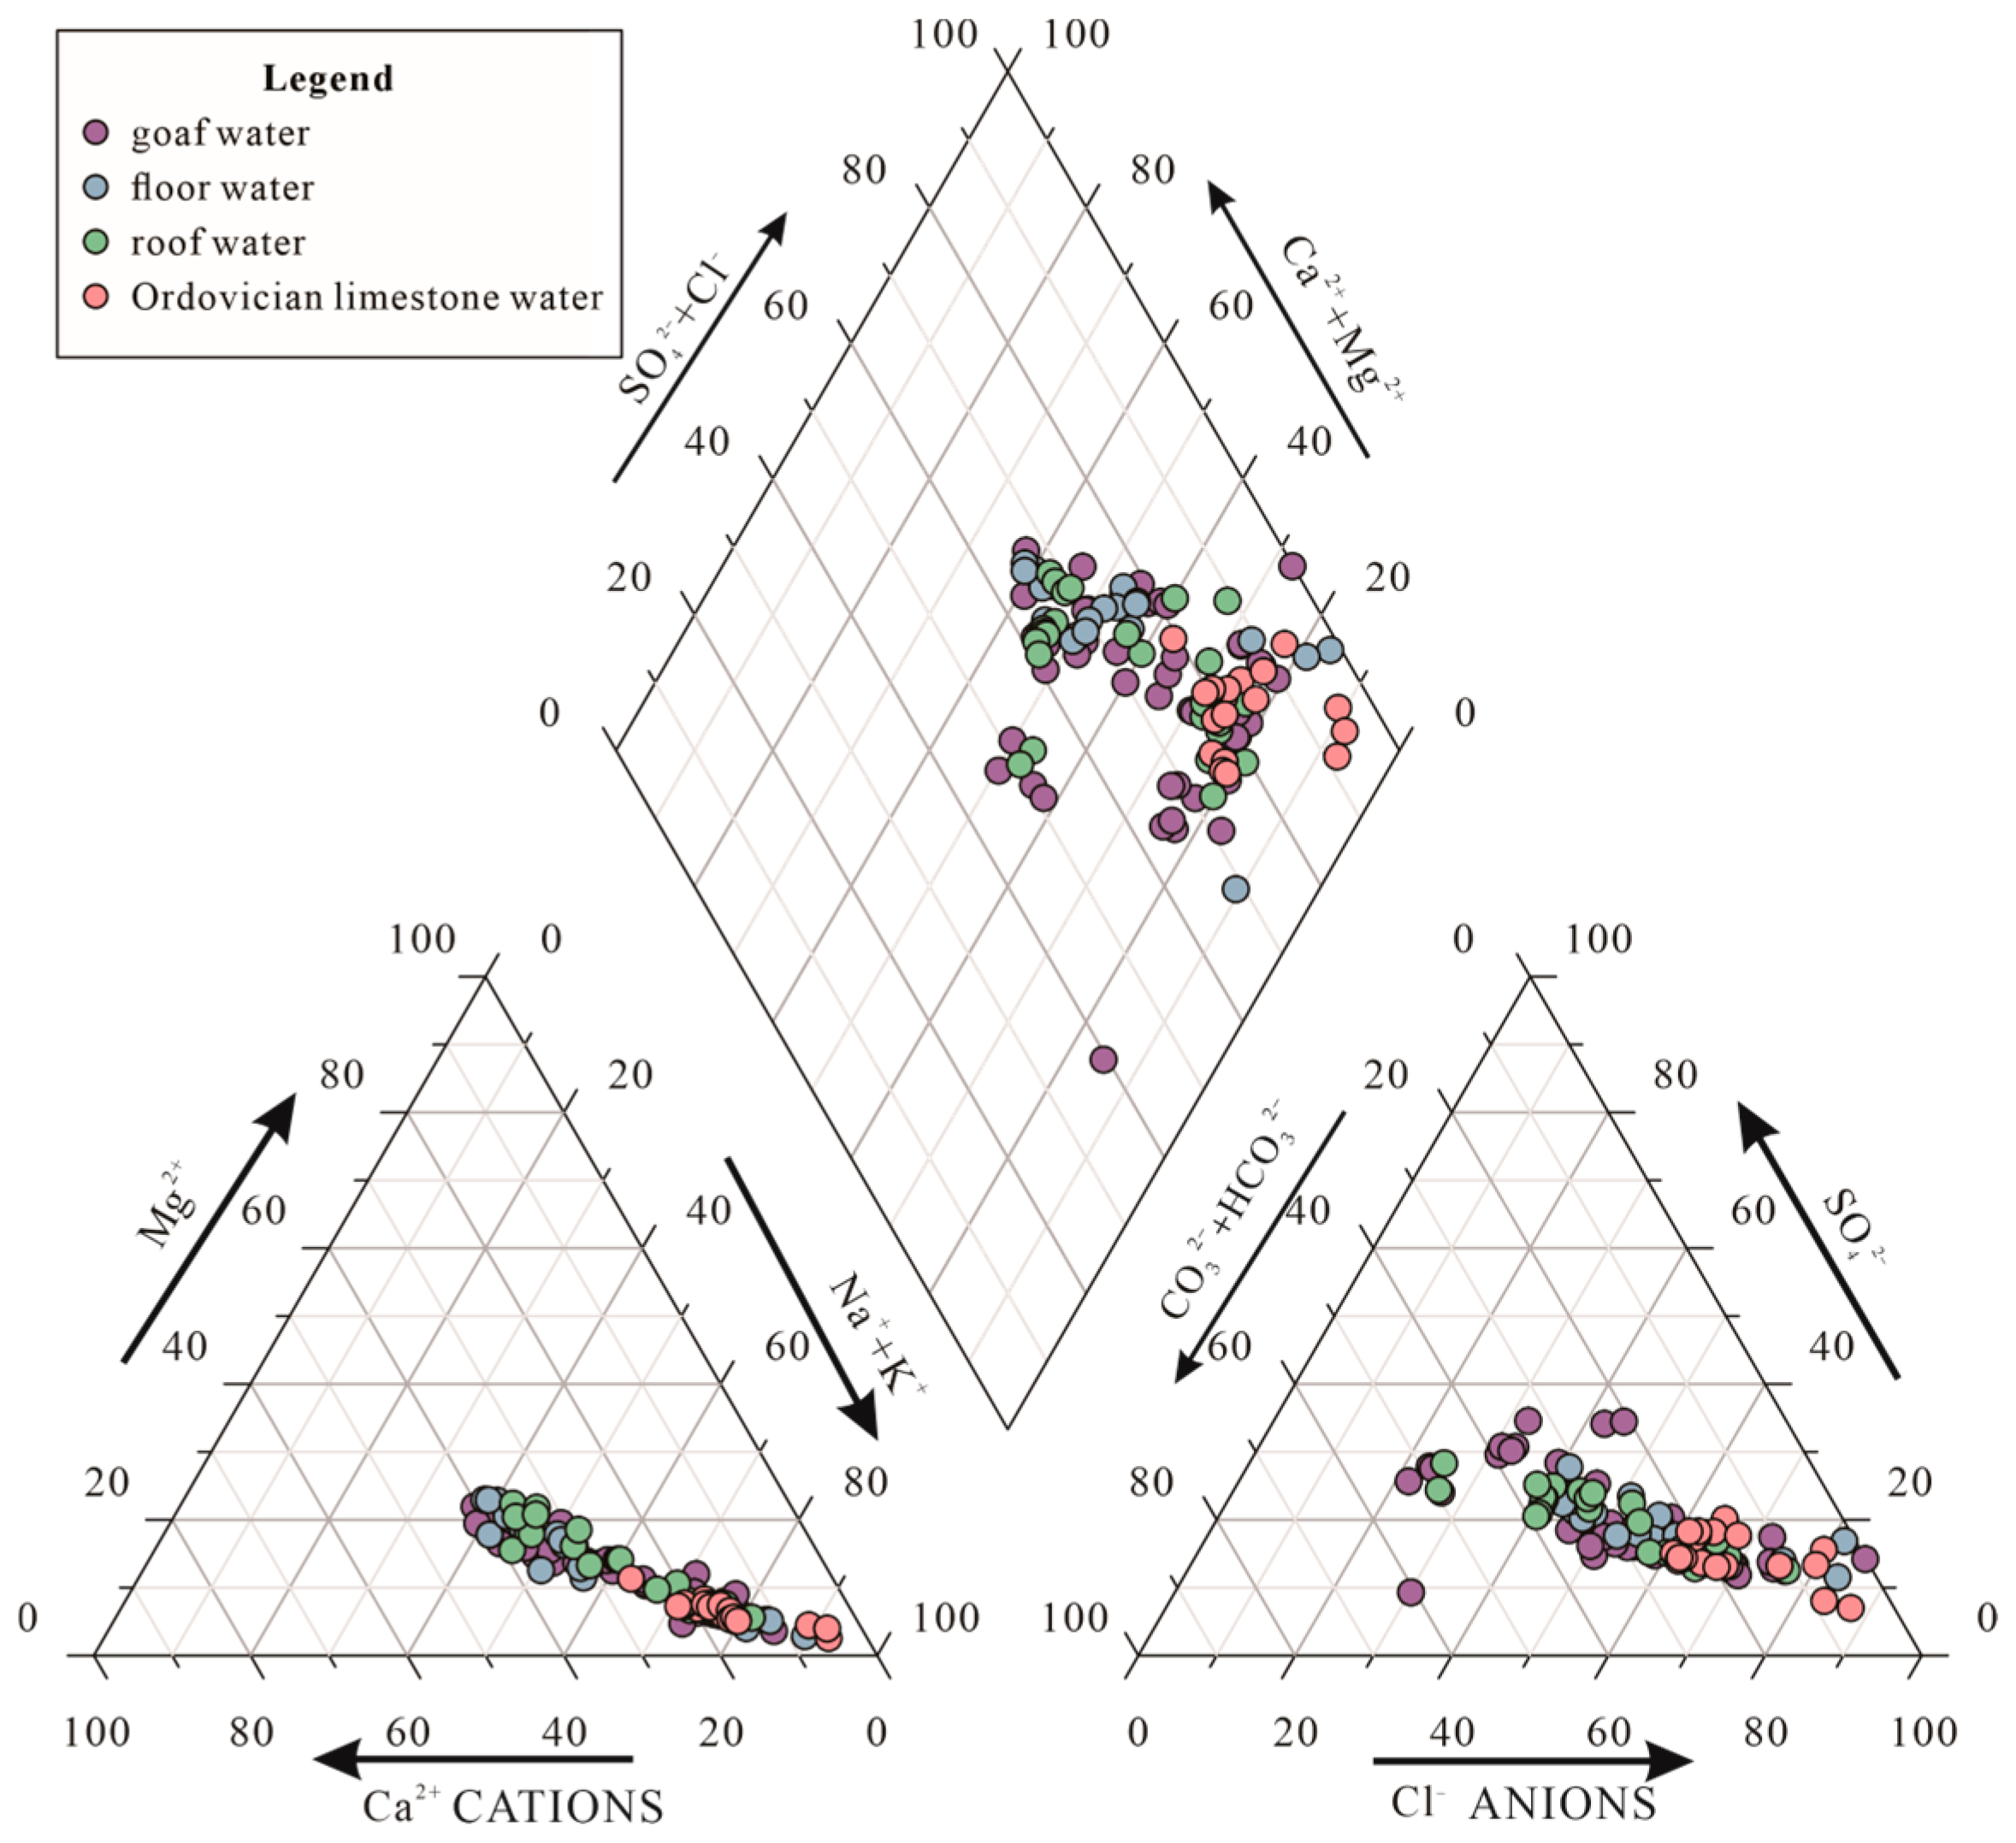
3.1. General Hydrochemical Analysis

Table 1 shows the statistical results of water samples from GW, RW, FW, and OW. In this environment, the CO32− levels are far lower than 5% of the total CO32− and HCO3 levels when combined. Therefore, CO32− is not included in the component analysis. The average concentration of cations in the GW is greatest for K++Na+, followed in descending order by Ca2+ and then Mg2+. The average concentration of anions is greatest for Cl, followed by HCO3 and SO42−. In the RW, FW, and OW, the average concentration of cations in the GW is greatest for Ca2+, followed in descending order by Mg2+ and then K++Na+. The order of the average anion concentrations is the same as with GW. The coefficients of variation of variable concentrations in all aquifers are less than 1, indicating low variability and possible hydraulic connections between aquifers.
The hydrochemical type in the study area is more complex in the mining area. As shown in Figure 2, anions are all close to the Cl and SO42− end members; cations are all close to the Na and Ca end members; most of the groundwater samples are distributed in the right corner of the rhombus, with more than 50% of sulfate and chloride ions, and more than 50% of non-carbonate alkali metals. The hydrochemical type of goaf water is dominated by the Cl-Na type, followed by the SO4-Ca type, and a few are the HCO3-Na type. The hydrochemical type of roof water is mainly dominated by the Cl-Na type and SO4-Ca type, and that of the Ordovician limestone water is mainly dominated by the Cl-Na type, while the water floor water is mainly dominated by the Cl-Na type and SO4-Ca type. It can be seen that the chemical types between the goaf water and other aquifers are relatively similar, indicating that there may be some hydraulic connection between goaf water and other aquifers.

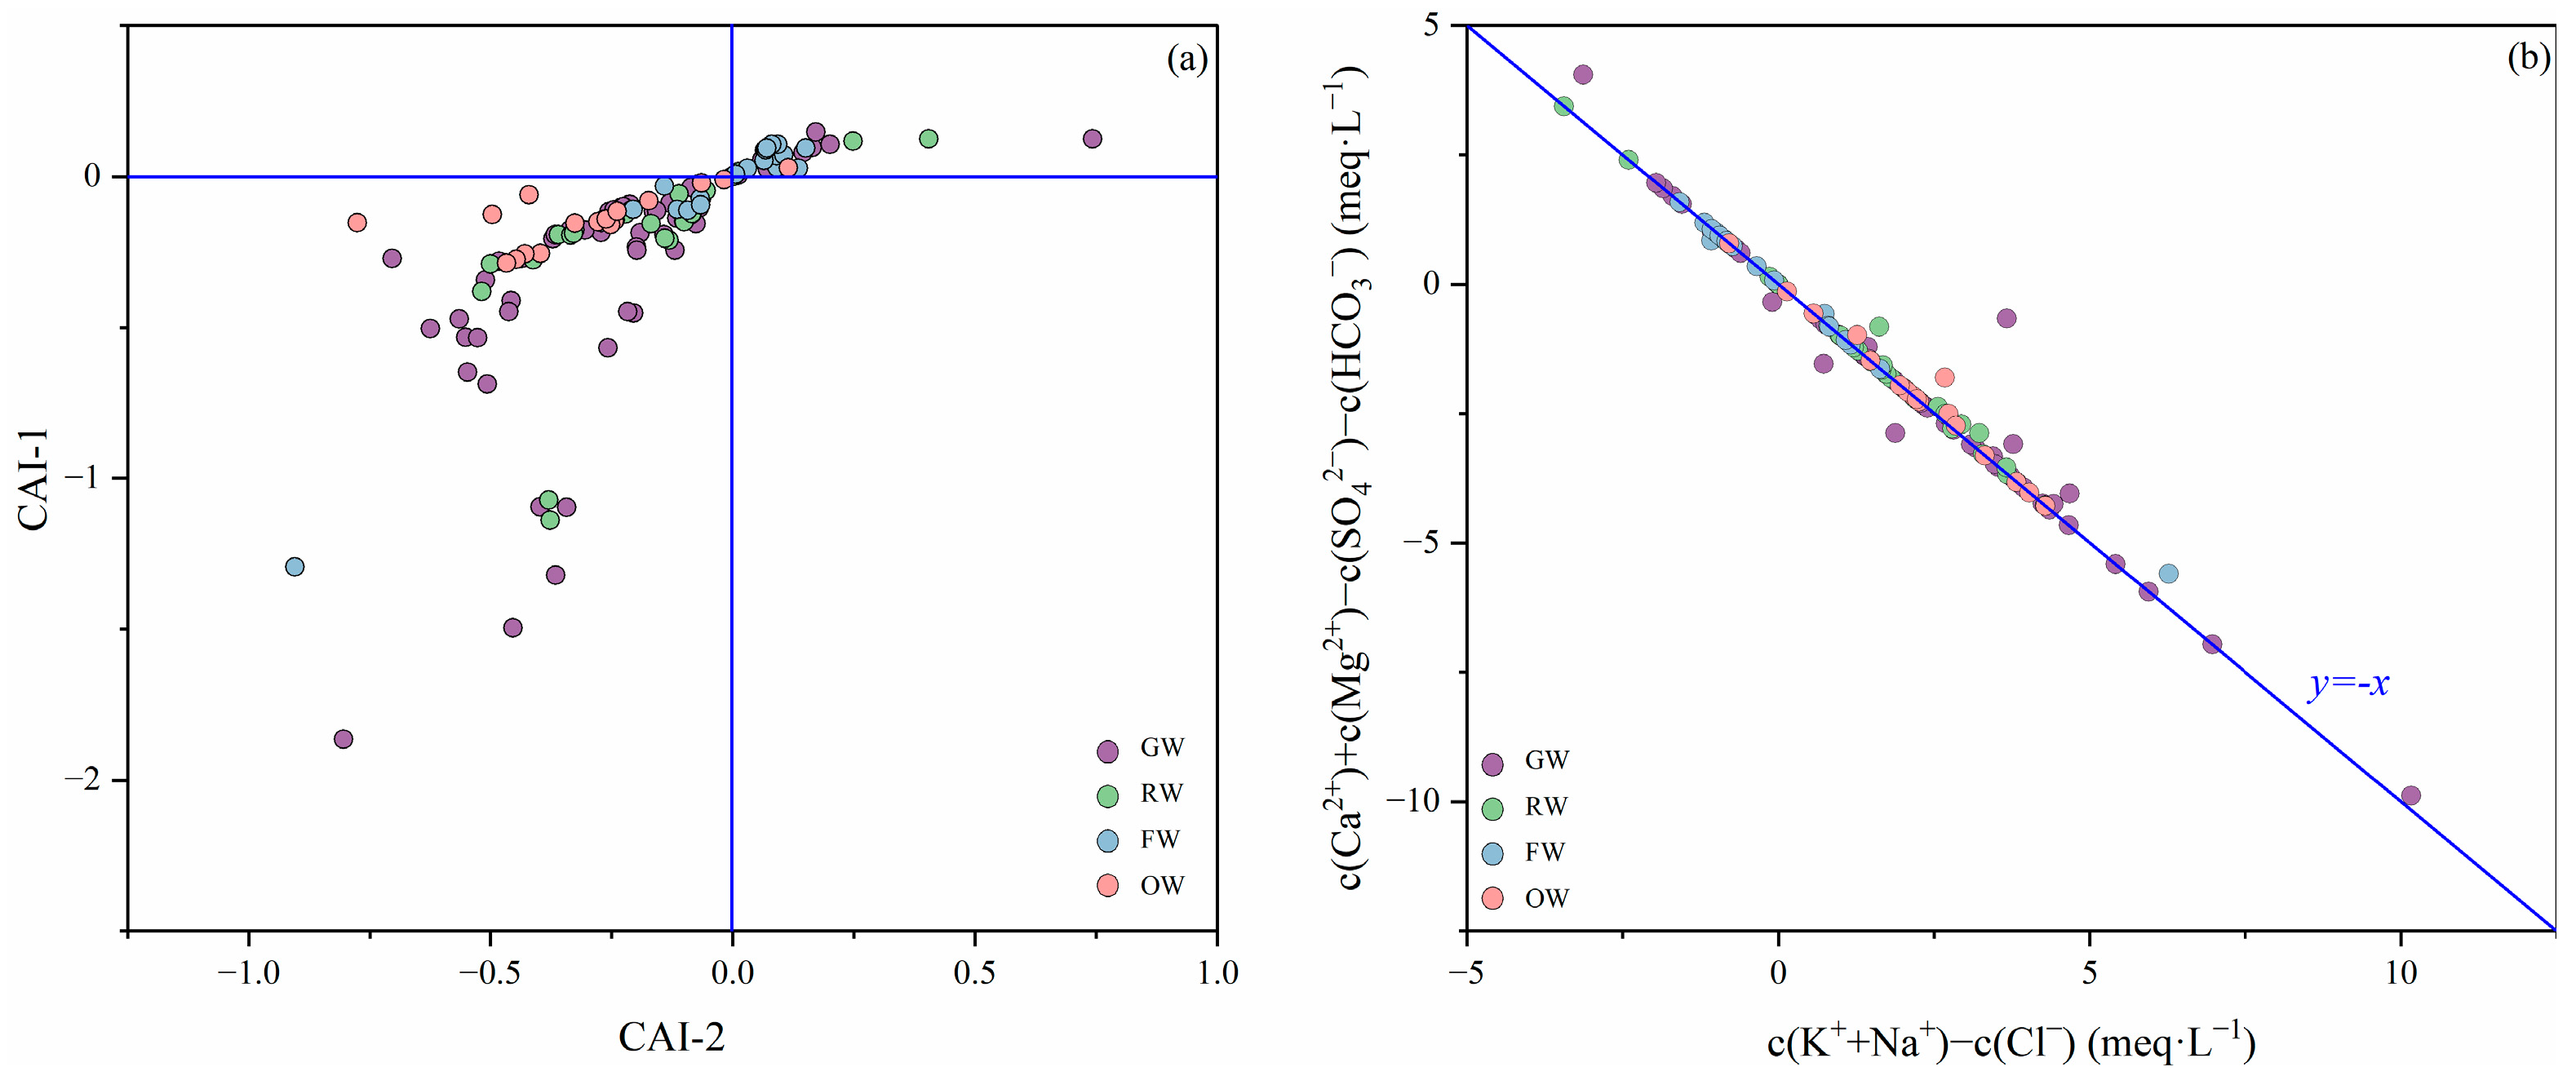
3.2. The Hydraulic Connection between Goaf Water and Aquifers

To study the hydraulic connection between goaf water and the other aquifers, GW, RW, FW and OW groundwater stratified-sampling borehole W1 was selected (Figure 1). The Stiff diagram can reflect the groundwater characteristics intuitively, which is convenient for the comparison of the groundwater types, and it can provide the evidence for the identification of the hydraulic connection of the various aquifers. The groundwater Stiff diagrams of GW, RW, FW and OW are similar in morphology, with anions dominated by Cl and cations dominated by Na++K+. This suggests that there is a strong hydraulic connection between the water in the extraction zone and the groundwater in other aquifers, and that there is a recharge relationship.
As shown in Figure 3, it can be seen that the Stiff diagrams of RF water and GW are extremely similar, and the Stiff diagrams of OW and FW are extremely similar. Therefore, the hydraulic connection between GW and RF is strong, and the hydraulic connection between OW and FW is strong. Overall, the degree of hydraulic connection between GW and RF, OW, and FW is RF > FW > OW. Therefore, the GW is recharged by RW, FW and OW, and we need to further study the process of water accumulation in the goaf.

3.3. Groundwater-Hydrochemistry Formation Mechanisms

3.3.1. Cation Exchange Action

During the prolonged interaction process between rocks and groundwater, the negative charges present on the surface of the rocks can adsorb the cations within the groundwater, consequently releasing the cations originally carried into the groundwater, which means that the cation exchange action takes place [20]. Schoeller proposed two indicators (CAI-1 and CAI-2) to determine what kind of cation exchange occurs in groundwater, which are calculated in Equations (7) and (8) [21]. The chlor-alkali index diagram is plotted, with milligram equivalents as the unit. As shown in Figure 4a, only a small portion of the weathered bedrock water samples have positive values for the two indicators, and all the others are negative values, indicating that the main cation reverse-exchange action has occurred in the groundwater of the study area. In particular, the values of the two indicators of normal bedrock groundwater are all relatively negative, indicating that the reverse-exchange action is relatively strong, that is, the Ca2+ and Mg2+ in the groundwater have exchanged with K++Na+ in the surrounding rock, resulting in an increase in the concentration of K++Na+ in the water body.
C A I 1 = c C l c N a + + K + c C l
C A I 2 = c C l c N a + + K + c S O 4 2 + c H C O 3
The milligram-equivalent concentration relationship between K++Na+ − Cl and Ca2++Mg2+ − SO42− − HCO3 is often used to determine whether cation exchange is occurring in groundwater; Most of the water samples in Figure 4b are located near the −1 ratio line, indicating that cations are alternately adsorbed in the groundwater in the study area.

3.3.2. Desulfurization Action

Desulfation is the process by which SO42− in groundwater is reduced, resulting in a decrease in the SO42− content of the water and a concomitant increase in HCO3, whose main chemical formula is the following:
S O 4 2 + 2 C + 2 H 2 O H 2 S + 2 H C O 3
The desulfation coefficient c(SO42−)/c(Cl) is a good measure of the intensity of the desulfation effect of the groundwater in the mining area [24]; as shown in Figure 5, the desulfation coefficient of the water samples correlates well with the HCO3 content, and with the increase in the desulfation coefficient, the desulfation effect is gradually strengthened, and the milligram equivalents of HCO3 gradually increase, which indicates that the HCO3 in the groundwater mainly comes from desulfation action.

3.3.3. Leaching Action

From the above analysis, it is clear that the groundwater in the study area is mainly affected by ion exchange and desulfation. Based on the ion concentration of groundwater in each aquifer in the study area, the relationship between different ions is plotted, and the sources of major ions can be further analyzed.
Cl is a stabilizing ion in groundwater, so the content of Cl was used as an entry point to explore other sources of cations associated with it [25,26]. As can be seen from Figure 6a, the c(Na+)/c(Cl) of the majority of the water samples in each group is basically greater than 1, which means that the concentration of K++Na+ is higher than that of Cl. It can be speculated that the source of K++Na+ exists from other sources besides the dissolution of rock salts, such as the exchange and adsorption of cations, and, as shown in the previous results of analysis of the alternating adsorption effect in the groundwater, there is a strong cationic back-exchange in the groundwater of the study area, which results in a higher content of K++Na+.
The major mineral sources in water can be analyzed using the ratio [c(Ca2+)+c(Mg2+)]/[c(HCO3)+c(SO42−)]. As can be seen from Figure 6b, most of the water sample points from all aquifers fall below the 1:1 straight line, and some of the FW ratios are closer to 1:1, which indicates that the hydrochemical formation of both groundwaters is similar, with the presence of carbonate and silicate dissolution. GW, RW and OW deviated from the 1:1 line by a large margin, indicating that the content of HCO3+SO42− in the water was larger than the content of Ca2++Mg2+, which was mainly originated from the dissolution of silicate. In addition, the concentration of Ca2+ and Mg2+ in the groundwater decreased due to the ion exchange between Ca2+, Mg2+ and Na++K+ adsorbed on the surface of the water-containing medium, which further confirmed the analytical results of the alternate adsorption effect.
From Figure 6c,d, it can be seen that the groundwater samples in the study area basically fall in the range of [c(Ca2+)+c(Mg2+)]/c(SO42−) > 1, which indicates that the dissolution of sulfate is not the only source of Ca2+, Mg2+ and SO42− in the groundwater of the mining area, and that there is a carbonate dissolution in Ca2+ and Mg2+, among others. In carbonate dissolution, the theoretical value of [c(Ca2+)+c(Mg2+)]/c(HCO3) is equal to 1/2, and all of the groundwater samples [c(Ca2+)+c(Mg2+)]/c(HCO3) in this study area are greater than 1/2, which suggests that there is a source of Ca2+ and Mg2+, such as cation exchange.

3.4. Calculation of Accumulated Water in the Goaf That Can Be Drained from Each Working Face

The drainage holes were installed in the goaf of each working face of the mine, and the average distance between them and the coal seam floor was 0.8 m [34]; the resulting parameters of each working face and the angles of inclination of the coal seam are shown in Table 1. We set the porosity of the caving zone in the goaf to 0.3, based on the results of past research. According to Formula (1), the accumulated water in the goaf that could be drained from each working face was calculated as shown in Table 2. Our results showed that the volume of accumulated water in the goaf of each working face ranged from 124,594.4831 to 298,140.9183 m3, with a total volume of 2,106,838.4963 m3.

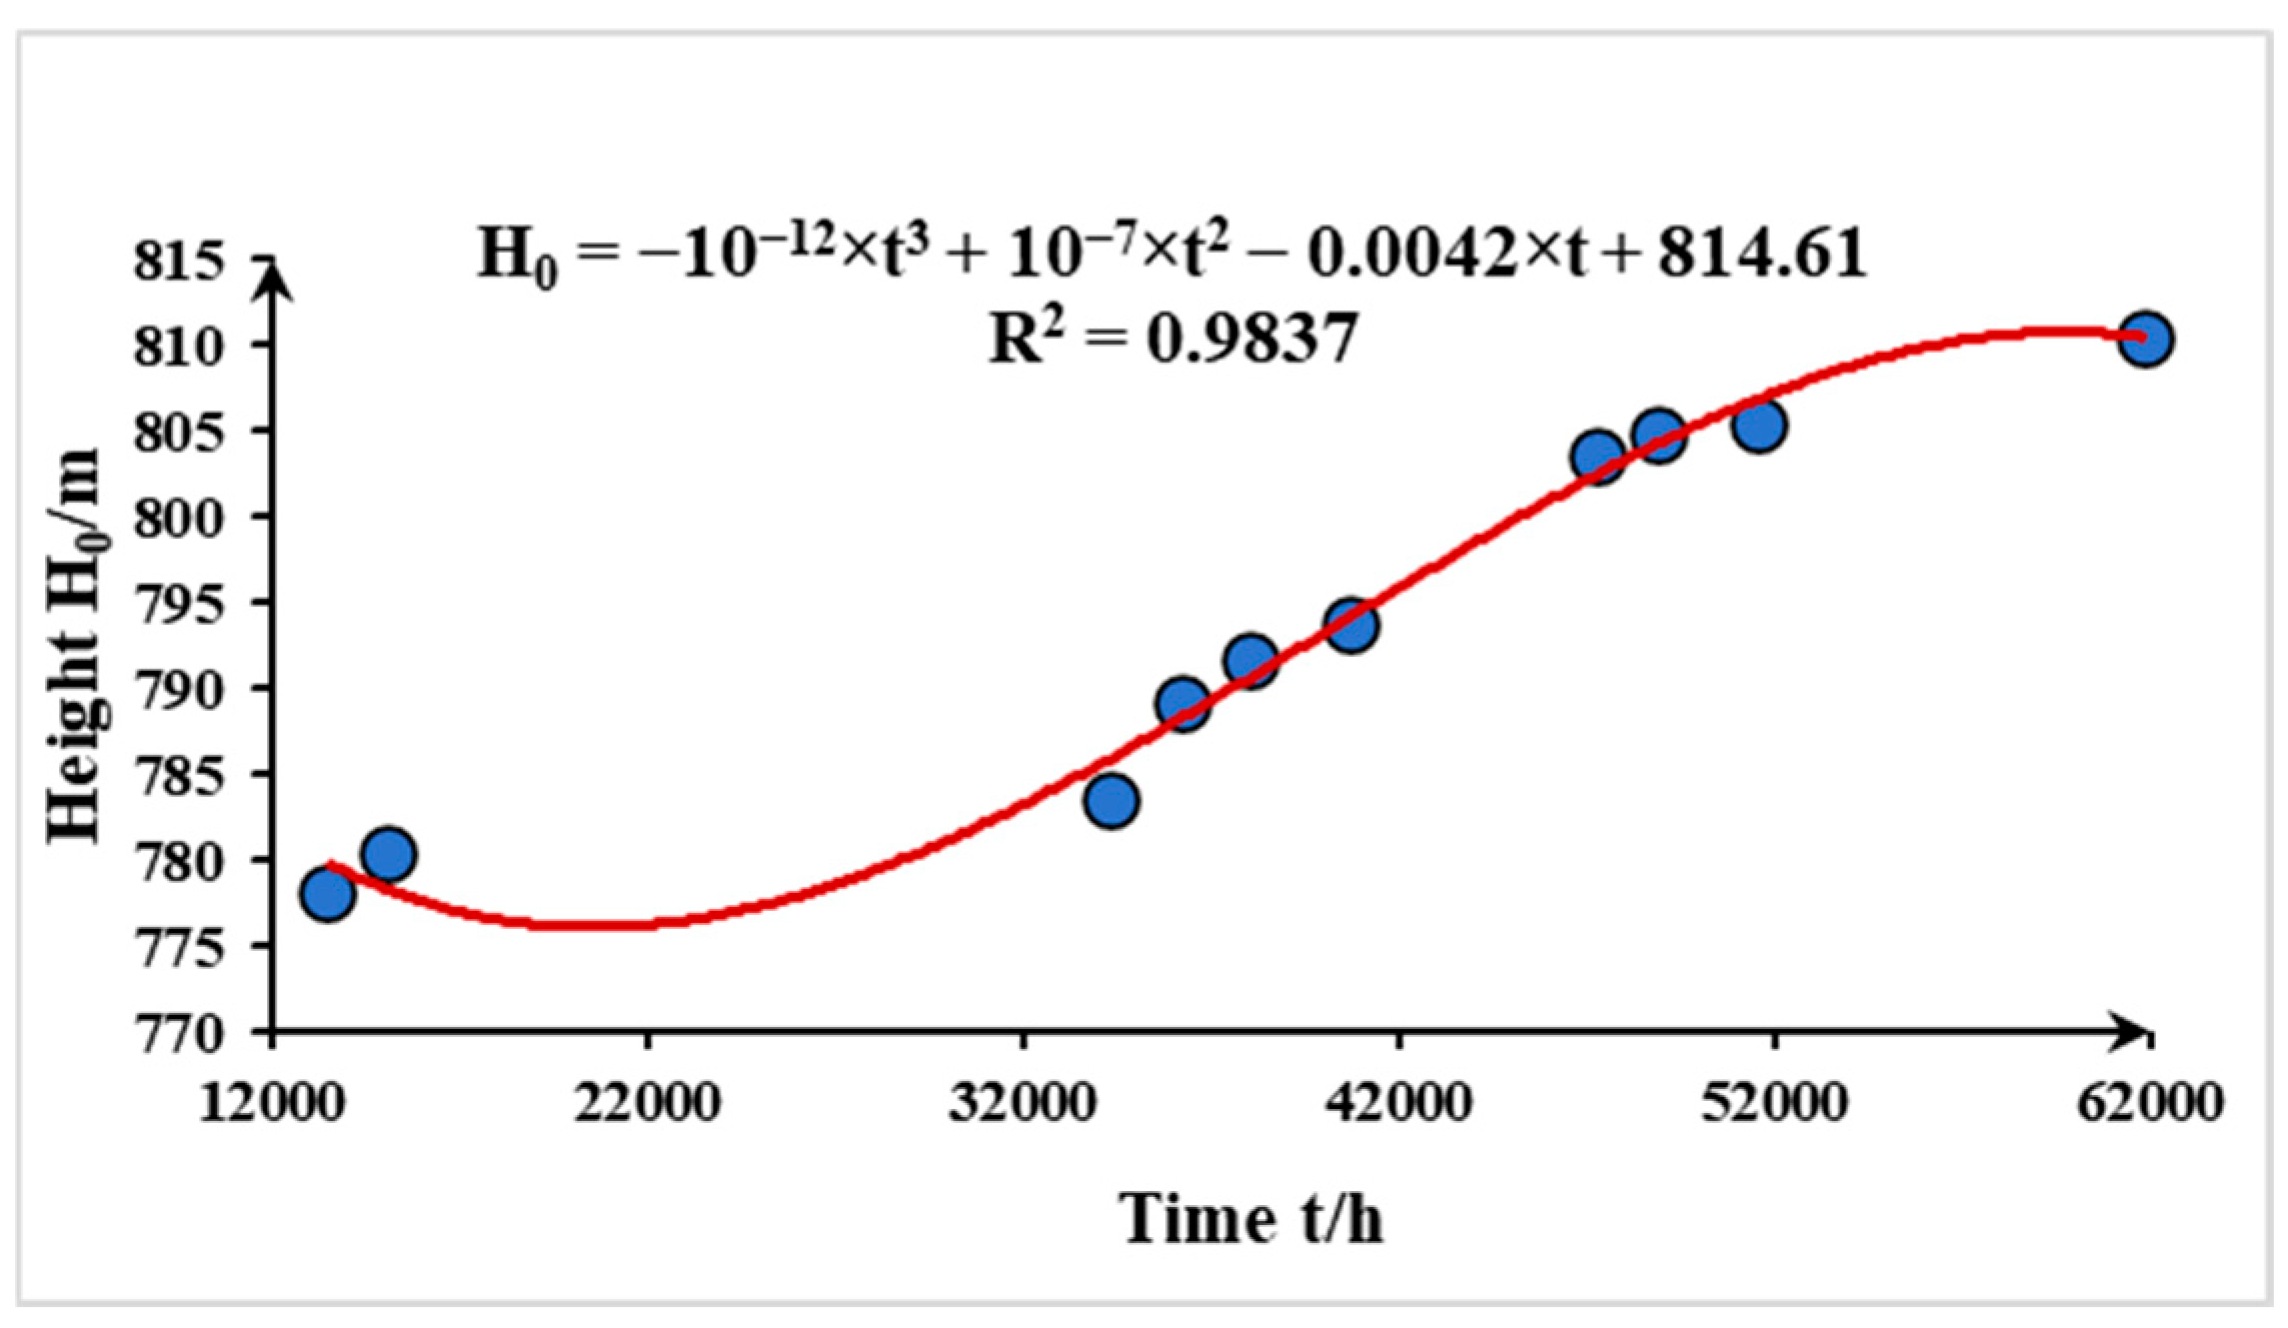
3.5. Calculation Results of Speed of Water Accumulation in Goaf

The large-well method is most commonly used to calculate the inflow of water into the goaf. It treats the goaf of the working face as having a radius equivalent to that of a large well. We assumed that the inflow of water from the sandstone roof of coal seams 4, 5, and 6 into the goaf of the working face was equivalent to its inflow into a large well. The values of the relevant parameters and the results of calculations of water inflow for each working face according to Formulae (2)–(4) are shown in Table 3. We found that the range of variations in the velocity of water in each working face was 15.5~138.67 m3/h, while the average velocity was 65.407 m3/h.

3.6. Prediction of Water Accumulation in Goaf

We used Formulae (5) and (6), in conjunction with data on the elevation of coal seam floor 6 provided in Table 2 to calculate the elevation of accumulated water and the time taken for this for each working face, as shown in Table 4. If the average speed of water accumulation was 65.407 m3/h, the goaf would have been filled with water in 3221.208 h, according to Formula (5).
Based on the data in Table 4, Figure 7 depicts the curve of the relationship between the elevation of accumulated water in the goaf and time after mining in the Tangjiahui Coal Mine. It is clear from this that the height of water in the goaf first quickly increased, then rose relatively gently, then gradually rose once again, and finally tended to stabilize. The relationship between the height of water and the time taken is as follows:
H 0 = 10 12 t 3 + 10 7 t 2 0.0042 t + 814.61 R 2 = 0.9837
where H0 is the elevation of accumulated water in the goaf (m), t is the time required for this (h), and R is a correlation coefficient.
After coal mining, the water level of accumulated water gradually decreases. Due to the fragmentation and expansion of rocks, adjacent aquifers gradually supply water to the goaf of the coal seam, causing it to gradually rise again. When it reaches a certain level, it returns to the natural state of groundwater level [35]. This is consistent with the relationship between water level and time in this article.

4. Discussion

Based on the analysis of hydrochemical types and Stiff diagrams, RW, FW, and OW have been identified as the main water sources for the goaf. Through the analysis of the chemical formation mechanism of groundwater, it was found that cation exchange action, desulfurization, and leaching occurred in all aquifers. Therefore, geochemical analysis further confirmed the hydraulic connection between GW, RW, FW, and OW. In addition, we also need to predict the water accumulation situation of GW by collecting geological data of the mine working face and pumping-test data to determine the calculation parameters. Based on the water-accumulation-space method and the large-well method, we can calculate the amount of water accumulation in the goaf of the mine and the time required to fill it up. We have also fitted the relationship curve between water-accumulation elevation and time, providing a scientific basis for the prevention and control of water hazards in the goaf of the mine.
The main feature of this study is to estimate the amount of accumulated water in the drainage goaf, and also to consider the crushing expansion. At present, the relevant scholars mainly focus on the hydraulic connection and water-accumulation prediction of fully enclosed goaf, without considering the location of drainage holes and crushing expansion in the goaf [11,12,13,14]. Therefore, the predicted water accumulation in this study is closer to the actual value.

5. Conclusions

In this study, on the basis of an in-depth study of the geochemical characteristics of groundwater by using Durov diagrams and Piper trilinear diagrams, we used data on the hydrogeological conditions of drainage goafs for the working faces of the Tangjiahui Coal Mine to predict the accumulation of water in them by using the method to determine the space of water accumulation in the drainage goaf and the large-well method. We also discussed the relationship between the height of accumulated water and the time required for this. The main conclusions are as follows.
(1) Typical borehole-groundwater chemical ion concentrations and groundwater hydrochemical characterization indicate that the goaf water in the study area is hydraulically connected to the RW, FW, and OW, and that a recharge relationship exists. Therefore, the RF water is the main source of goaf water.
(2) The locations of the drainage boreholes cannot be ignored when calculating the volume of accumulated water in the goaf. We found that the total volume of accumulated water in goafs of the Tangjiahui Coal Mine after mining was 2,106,838.496 m3, while its average speed of accumulation was 65.407 m3/h. At this rate, we expected that the goaf would have been filled with water after 3221.208 h. Therefore, we need to take some blocking measures to prevent the continuous rise in water level and further prevent cross contamination between aquifers caused by heavy-metal elements contained in the goaf water.
(3) The relationship between the height of accumulated water level and time for the Tangjiahui Coal Mine was H 0 = 10 12 t 3 + 10 7 t 2 0.0042 t + 814.61   ( R 2 = 0.9837 ) . The trend in changes in water level and time can be used to determine the specific time of water level rise, so as to take timely and effective measures to prevent and control water during this period.
Accurately calculating the volume of accumulated water in the goaf and analyzing the spatiotemporal process of water level rise after mine closure provide a reliable basis for the safety evaluation of water blocking coal pillars at the mine boundary.

Supplementary Materials

The following supporting information can be downloaded at: https://www.mdpi.com/article/10.3390/w16152110/s1, Table S1: Measured values of major ions of the water samples in the study area.

Author Contributions

J.W.: Conceptualization, methodology, writing—review and editing. H.W.: Writing—original draft, investigation, data curation, writing—review and editing. S.Y.: Project administration, supervision. Q.L.: Methodology, writing—review and editing. K.C.: Validation. Q.J.: Writing—review and editing. All authors have read and agreed to the published version of the manuscript.

Funding

This work was supported by the Scientific Research Foundation for High-level Talents of Anhui University of Science and Technology (2023yjrc41).

Data Availability Statement

Data are contained within the article.

Conflicts of Interest

Authors Jianghong Wang, Hongwei Wang and Shaobo Yin were employed by the company Ordos Huaxing Energy Co., Ltd. The remaining authors declare that the research was conducted in the absence of any commercial or financial relationships that could be construed as a potential conflict of interest.

References

  1. Yuan, S.; Sui, W.; Han, G.; Duan, W. An Optimized Combination of Mine Water Control, Treatment, Utilization, and Reinjection for Environmentally Sustainable Mining: A Case Study. Mine Water Environ. 2022, 41, 828–839. [Google Scholar] [CrossRef]
  2. Acharya, B.S.; Kharel, G. Acid Mine Drainage from Coal Mining in the United States—An Overview. J. Hydrol. 2020, 588, 125061. [Google Scholar] [CrossRef]
  3. Bundschuh, J.; Schneider, J.; Alam, M.A.; Niazi, N.K.; Herath, I.; Parvez, F.; Tomaszewska, B.; Guilherme, L.R.G.; Maity, J.P.; López, D.L.; et al. Seven Potential Sources of Arsenic Pollution in Latin America and Their Environmental and Health Impacts. Sci. Total Environ. 2021, 780, 146274. [Google Scholar] [CrossRef] [PubMed]
  4. Jiang, C.; Gao, X.; Hou, B.; Zhang, S.; Zhang, J.; Li, C.; Wang, W. Occurrence and Environmental Impact of Coal Mine Goaf Water in Karst Areas in China. J. Clean. Prod. 2020, 275, 123813. [Google Scholar] [CrossRef]
  5. Raj, D.; Kumar, A.; Maiti, S.K. Evaluation of Toxic Metal(Loid)s Concentration in Soils around an Open-Cast Coal Mine (Eastern India). Environ. Earth Sci. 2019, 78, 645. [Google Scholar] [CrossRef]
  6. Gui, H.; Qiu, H.; Qiu, W.; Tong, S.; Zhang, H. Overview of Goaf Water Hazards Control in China Coalmines. Arab. J. Geosci. 2018, 11, 49. [Google Scholar] [CrossRef]
  7. Li, P.; Ma, L.; Wu, Y.; Zhang, L.; Hao, Y. Concurrent Mining During Construction and Water-Filling of a Goaf Groundwater Reservoir in a Coal Mine. Mine Water Environ. 2018, 37, 763–773. [Google Scholar] [CrossRef]
  8. Niu, X.; Feng, G.; Liu, Q.; Han, Y.; Qian, R. Numerical Investigation on Mechanism and Fluid Flow Behavior of Goaf Water Inrush: A Case Study of Dongyu Coal Mine. Nat. Hazards 2022, 113, 1783–1802. [Google Scholar] [CrossRef]
  9. Wang, N.; Wang, Z.; Sun, Q.; Hui, J. Coal Mine Goaf Interpretation: Survey, Passive Electromagnetic Methods and Case Study. Minerals 2023, 13, 422. [Google Scholar] [CrossRef]
  10. Zhang, S.; Jiang, P.; Lu, L.; Wang, S.; Wang, H. Evaluation of Compressive Geophysical Prospecting Method for the Identification of the Abandoned Goaf at the Tengzhou Section of China’s Mu Shi Expressway. Sustainability 2022, 14, 13785. [Google Scholar] [CrossRef]
  11. Zhao, X.; Yang, Y.; Wang, Y.; Li, P.; Zhang, Y.; Shen, C. Study on the Law and Risk of Spontaneous Combustion of Residual Coal during Water Drainage in Goaf. Energies 2022, 15, 8896. [Google Scholar] [CrossRef]
  12. Zhu, L.; Gu, W.; Ouyang, Y.; Qiu, F. Grouting Mechanism and Experimental Study of Goaf Considering Filtration Effect. PLoS ONE 2023, 18, e0282190. [Google Scholar] [CrossRef] [PubMed]
  13. Xu, Q.; Yao, Q.; Wang, F.; Xiao, L.; Ma, J.; Kong, F.; Shang, X. Tracer Test Method to Confirm Hydraulic Connectivity Between Goafs in a Coal Mine. Mine Water Environ. 2024, 43, 104–116. [Google Scholar] [CrossRef]
  14. Yan, S.; Xue, G.-Q.; Qiu, W.-Z.; Li, H.; Zhong, H.-S. Feasibility of Central Loop TEM Method for Prospecting Multilayer Water-Filled Goaf. Appl. Geophys. 2016, 13, 587–597. [Google Scholar] [CrossRef]
  15. Moser, B.; Cook, P.G.; Miller, A.D.; Dogramaci, S.; Wallis, I. The Hydraulic Evolution of Groundwater-Fed Pit Lakes After Mine Closure. Groundwater 2024. [Google Scholar] [CrossRef] [PubMed]
  16. Roy, D.K.; Paul, C.R.; Munmun, T.H.; Datta, B. An Automatic Model Selection-Based Machine Learning Approach to Predict Seawater Intrusion into Coastal Aquifers. Environ. Earth Sci. 2024, 83, 287. [Google Scholar] [CrossRef]
  17. Brodic, B.; Malehmir, A.; Pacheco, N.; Juhlin, C.; Carvalho, J.; Dynesius, L.; van den Berg, J.; de Kunder, R.; Donoso, G.; Sjolund, T.; et al. Innovative Seismic Imaging of Volcanogenic Massive Sulfide Deposits, Neves-Corvo, Portugal–Part 1: In-Mine Array. Geophysics 2021, 86, B165–B179. [Google Scholar] [CrossRef]
  18. Donoso, G.A.; Malehmir, A.; Pacheco, N.; Araujo, V.; Penney, M.; Carvalho, J.; Spicer, B.; Beach, S. Potential of Legacy 2D Seismic Data for Deep Targeting and Structural Imaging at the Neves-Corvo Massive Sulphide-Bearing Deposit, Portugal. Geophys. Prospect. 2020, 68, 44–61. [Google Scholar] [CrossRef]
  19. Malehmir, A.; Durrheim, R.; Bellefleur, G.; Urosevic, M.; Juhlin, C.; White, D.J.; Milkereit, B.; Campbell, G. Seismic Methods in Mineral Exploration and Mine Planning: A General Overview of Past and Present Case Histories and a Look into the Future. Geophysics 2012, 77, WC173–WC190. [Google Scholar] [CrossRef]
  20. Jena, M.R.; Tripathy, J.K.; Sahoo, D.; Sahu, P. Geochemical Evaluation of Groundwater Quality in the Coastal Aquifers of Kujang Block, Jagatsinghpur District, Eastern Odisha, India. Water Air Soil. Pollut. 2024, 235, 349. [Google Scholar] [CrossRef]
  21. Kumar, G.; Kothandaraman, S.; Karuppanan, K.; Hussain, S. Groundwater Quality and Suitability Assessment in Tirupur Region, Tamil Nadu, India. J. Chem. 2024, 2024, 6083772. [Google Scholar] [CrossRef]
  22. Ahmad, S.; Singh, N.; Mazhar, S.N. Hydrochemical Characteristics of the Groundwater in Trans-Yamuna Alluvial Aquifer, Palwal District, Haryana, India. Appl. Water Sci. 2020, 10, 75. [Google Scholar] [CrossRef]
  23. Azari, T.; Tabari, M.M.R. An Integrated Approach Based on HFE-D, GIS Techniques, GQISWI, and Statistical Analysis for the Assessment of Potential Seawater Intrusion: Coastal Multilayered Aquifer of Ghaemshahr-Juybar (Mazandaran, Iran). Environ. Sci. Pollut. Res. 2024, 31, 13335–13371. [Google Scholar] [CrossRef] [PubMed]
  24. Molla, S.H.; Rukhsana; Ul Hasan, M.S. Deployment of Entropy Information Theory in the Indian Sundarban Region Using Hydrogeochemical Parameters and GIS for Assessment of Irrigation Suitability. Environ. Monit. Assess. 2023, 195, 1277. [Google Scholar] [CrossRef]
  25. Sadeghi-Lari, A.; Bahrami, M.; Dastandaz, T. Temporal and Spatial Variations of Groundwater Quantity and Quality for Drinking and Irrigation Purposes in the Arid and Hot Weather of Southern Iran. Phys. Chem. Earth 2024, 134, 103582. [Google Scholar] [CrossRef]
  26. Iddrisu, U.F.; Armah, E.K.; Amedorme, B.S.; Mbatchou, V.C. Assessing the Groundwater Quality in Ghana’s Nanton District: Comprehensive Evaluation and Implications for Sustainable Management. AQUA Water Infrastruct. Ecosyst. Soc. 2024, 73, 34–56. [Google Scholar] [CrossRef]
  27. Selmani, Y.; Chihi, L.; Kadri, A.; Hatira, N.; Regaya, K. Identifying Sub-Surface Triassic Salt Diapirs under Domal Structures in the Tunisian Atlas: Exploration Targets for Potential Mineralization. Carbonates Evaporites 2024, 39, 28. [Google Scholar] [CrossRef]
  28. Jiang, C.; Wang, L.; Yu, X.; Lv, W.; Yang, X. A New Method of Monitoring 3D Mining-Induced Deformation in Mountainous Areas Based on Single-Track InSAR. KSCE J. Civ. Eng. 2022, 26, 2392–2407. [Google Scholar] [CrossRef]
  29. Zhang, D.; Cen, X.; Wang, W.; Deng, J.; Wen, H.; Xiao, Y.; Shu, C.-M. The Graded Warning Method of Coal Spontaneous Combustion in Tangjiahui Mine. Fuel 2021, 288, 119635. [Google Scholar] [CrossRef]
  30. Sun, B.; Zhang, P.; Wu, R.; Fu, M.; Ou, Y. Research on the Overburden Deformation and Migration Law in Deep and Extra-Thick Coal Seam Mining. J. Appl. Geophys. 2021, 190, 104337. [Google Scholar] [CrossRef]
  31. Yu, C.; Ma, J.; Xue, J. Simulation and Analysis of the Transient Electromagnetic Method Response in Double-Layer Water-Filled Goaf in Coal Mines. J. Geophys. Eng. 2024, 21, 782–795. [Google Scholar] [CrossRef]
  32. Yang, Z.; Zhu, S.; Chen, Y. Study on Water Inrush Risk of Overlying Old Goaf Water in Fully Mechanized Caving Mining of Lower Coal Group. Q. J. Eng. Geol. Hydrogeol. 2024, 57, qjegh2023-064. [Google Scholar] [CrossRef]
  33. Yi, S.; Zhang, Y.; Yi, H.; Li, X.; Wang, X.; Wang, Y.; Chu, T. Study on the Instability Activation Mechanism and Deformation Law of Surrounding Rock Affected by Water Immersion in Goafs. Water 2022, 14, 3250. [Google Scholar] [CrossRef]
  34. Chang, J.; Su, B.; Malekian, R.; Xing, X. Detection of Water-Filled Mining Goaf Using Mining Transient Electromagnetic Method. IEEE Trans. Ind. Inform. 2020, 16, 2977–2984. [Google Scholar] [CrossRef]
  35. Luo, P.; Zhang, M.; Zhou, S. Research on the Reconstruction of Aquatic Vegetation Landscape in Coal Mining Subsidence Wetlands Based on Ecological Water Level. Water 2024, 16, 1339. [Google Scholar] [CrossRef]
Figure 1. Map of location of the study area: (a) Geographical location map; (b) Mine location map (c) Sampling point location map.
Water 16 02110 g001
Figure 2. Piper diagram of all water samples.
Water 16 02110 g002
Figure 3. Stiff map of typical borehole groundwater in the study area.
Water 16 02110 g003
Figure 4. Cation-exchange action diagram.
Water 16 02110 g004
Figure 5. Desulfurization coefficient diagram.
Water 16 02110 g005
Figure 6. The ratio relationship between ions.
Water 16 02110 g006
Figure 7. Curve of relationship between the heights of water accumulation in the goaf.
Water 16 02110 g007
Table 1. Statistics of all water samples.
AquifersStatisticsMass Concentration (meq/L)
Ca2+K++Na+Mg2+ClSO42−HCO3
GW (n = 60)Min.2.04 5.60 0.66 2.67 1.68 0.03
Max.8.57 25.98 4.90 25.59 5.15 10.95
Mean5.08 14.96 2.26 12.94 3.92 5.37
Standard deviation1.63 5.81 0.94 6.49 0.66 1.58
C.V0.32 0.39 0.42 0.50 0.17 0.29
RW (n = 30)Min.84.00 2.65 6.23 1.02 3.01 2.81
Max.113.00 8.41 24.27 4.85 27.71 5.41
Mean98.50 5.62 13.43 2.80 11.97 4.05
Standard deviation8.80 1.80 4.42 1.26 4.92 0.82
C.V0.09 0.32 0.33 0.45 0.41 0.20
FW (n = 23)Min.61.00 0.97 7.85 0.36 4.84 3.11
Max.83.00 8.77 28.75 4.79 29.54 5.20
Mean72.00 6.93 13.60 3.30 13.53 4.49
Standard deviation6.78 1.98 5.53 1.26 5.81 0.51
C.V0.09 0.29 0.41 0.38 0.43 0.11
OW (n = 19)Min.114.00 1.07 13.33 0.56 12.96 1.68
Max.132.00 6.12 27.55 2.40 27.15 4.79
Mean123.00 4.04 19.34 1.62 17.17 3.68
Standard deviation5.63 1.41 3.70 0.45 4.26 0.87
C.V0.05 0.35 0.19 0.28 0.25 0.24
Table 2. Accumulated volume of water in the goaf.
Working FaceLength (m)Width (m)Elevation (m)Dip Angle (°)Average Thickness (m)Volume (m3)
61,101982220780217.17124,594.4831
61,1021013235793.2218.3137,290.9631
61,1031048235791.17218.7142,034.4811
61,2012100240804.4116.96223,874.6692
61,202190724081029.9263,952.9857
61,207140526580528.6214,727.0919
61,208125426480327.5190,926.4544
61,3021897240788.6214.6262,568.8589
61,3031797240777.5223.1248,727.5906
61,3042154240783214.1298,140.9183
Table 3. Speed of water accumulation in the goaf.
Working FacePermeability Coefficient K (m/d)Water-Level Drawdown
S (m)
Water-Column Height H (m)Aquifer Thickness
M (m)
Predicted Area Conversion Radius
r0 (m)
Predicted Area Influence Radius
R (m)
Water Inflow Q (m3/h)
61,304 0.032 35.620 35.620 34.600 606.500 670.220 15.50
61,303 0.029 14.680 14.680 55.890 612.914 637.913 18.50
61,302 0.032 222.135 222.135 58.500 390.100 786.846 136.00
61,208 0.029 35.600 35.600 23.500 379.500 440.125 28.70
61,207 0.037 98.840 98.840 41.100 467.865 657.473 80.61
61,202 0.037 40.000 40.000 17.000 408.870 485.603 25.68
61,201 0.029 90.000 90.000 62.000 690.300 843.564 138.67
61,103 0.029 90.000 90.000 62.000 378.485 531.749 81.78
61,102 0.029 25.000 42.000 25.000 368.160 410.733 51.23
61,101 0.029 90.000 90.000 62.000 354.590 507.854 77.40
Mean 65.407
Table 4. Height of accumulated water and the time required.
Working FaceWater Elevation/H0 (m)t (h)
61,303778.076719513,444.73463
61,101780.576719515,054.44557
61,304783.576719534,289.34353
61,302789.176719536,219.9969
61,103791.746719537,956.76084
61,102793.776719540,636.67442
61,208803.576719547,289.16412
61,201804.844195848,903.57572
61,207805.576719551,567.35307
61,202810.576719561,845.89612
Disclaimer/Publisher’s Note: The statements, opinions and data contained in all publications are solely those of the individual author(s) and contributor(s) and not of MDPI and/or the editor(s). MDPI and/or the editor(s) disclaim responsibility for any injury to people or property resulting from any ideas, methods, instructions or products referred to in the content.

