Article

Dynamic Spatiotemporal Evolution and Driving Mechanisms of Vegetation in the Lower Reaches of the Tarim River, China

1
College of Hydrology and Water Resources, Hohai University, Nanjing 210098, China
2
School of Hydraulic Engineering, Wanjiang University of Technology, Ma’anshan 243000, China
3
Department of Civil, Construction and Environmental Engineering (Dept 2470), North Dakota State University, P.O. Box 6050, Fargo, ND 58108-6050, USA
*
Author to whom correspondence should be addressed.
Water 2024, 16(15), 2157; https://doi.org/10.3390/w16152157
Submission received: 2 July 2024 / Revised: 24 July 2024 / Accepted: 29 July 2024 / Published: 30 July 2024
(This article belongs to the Special Issue Advances in Ecohydrology in Arid Inland River Basins)

Abstract

:
Analyzing the changes in vegetation under different factors is crucial for ecological protection in arid areas. The spatial-temporal variations of vegetation in the lower reaches of the Tarim River (LRTR) from 2000 to 2020, were analyzed using the Theil-Sen estimator and the Mann-Kendall test. The future trends of NDVI are projected to use the Hurst exponent method. The driving mechanisms of vegetation changes were analyzed using the GeoDetector method and multivariate residual analysis. The NDVI values in the LRTR significantly increased during the study period, indicating good vegetation recovery. The overall vegetation level remains poor and was primarily concentrated around the riverine areas. There is still a risk of vegetation degradation in most areas of the future LRTR. Compared to climate change, vegetation was more affected by human activities. Human activities have helped restore the riparian vegetation and prevented the degradation of vegetation far from the river. Therefore, distance from river channels is the strongest explanatory factor (q = 0.078) for vegetation changes, followed by precipitation, and temperature, while changes in slope have minimal impact on vegetation. Statistics have found that when two factors are combined, their impact on vegetation change is stronger. These findings are beneficial for identifying vegetation evolution patterns in LRTR and providing theoretical support for the government to carry out ecological restoration.

1. Introduction

Vegetation plays a crucial role in regulating the regional climate, and maintaining soil and water conservation, making it a vital component of the ecological environment [1]. Because of the intensification of climate change and frequent human activities, ecological problems in arid areas are becoming increasingly severe [2]. Evaluating vegetation dynamics and further analyzing the driving mechanisms behind them have become crucial for the management and restoration of ecosystems in arid areas [3]. In order to achieve sustainable development and ecological conservation, the issue of vegetation restoration has garnered widespread attention worldwide [4,5,6].
In the study of vegetation dynamics, remote sensing data are widely used due to the advantages of continuous time series, wide coverage, and high spatial resolution [7,8]. By performing statistical analysis on the Normalized Difference Vegetation Index (NDVI), information on vegetation coverage and growth conditions can be obtained [9,10]. The Theil-Sen median estimator [11] coupled with the Mann-Kendall test [12,13] is a commonly used method for analyzing spatiotemporal changes in vegetation. This method is less susceptible to the influence of outliers and can more accurately describe the spatial and temporal variation characteristics of surface objects. Emamian et al. [14] discovered that NDVI in northern Iran exhibited a declining trend from 2004 to 2015. Sun et al. [15] indicated that in the Haihe River Basin, NDVI increased in 2000–2013. Therefore, exploring the driving mechanisms behind vegetation spatiotemporal changes has become a new research focus.
Residual analysis is utilized to examine the driving factor that influences NDVI, [16,17] and has been widely applied to research the contributions of human activity and climate change to vegetation cover changes. Yang, et al. [18] found that in the Han River Basin, human activity and climate change have generally promoted NDVI increase in non-urban areas. Liu, et al. [19] analyzed that climate change is the primary influence factor of NDVI increase on the Qinghai-Tibet Plateau, accounting for 68.05% of the observed increase. The Geodetector method is commonly used to analyze the spatial changes of vegetation and accurately identify the driving factors behind them [20]. Numerous researchers have employed the Geodetector method to investigate the impact factors driving the spatial and temporal changes of NDVI in different areas, such as Inner Mongolia [21], the Loess Plateau [22], and the Heihe River Basin [23]. This statistical method uncovers the factors influencing the temporal and spatial changes of vegetation cover, providing a comprehensive analysis of the variables [24].
The research area of this article is located in the lower reaches of the Tarim River (LRTR) in northwest China. The local drought and water shortage have led to a very fragile ecosystem [25]. Since 2000, the basin management organization has implemented ecological water conveyance (EWC) to artificially intervene in the vegetation of the LRTR, aiming to restore the degraded ecological environment. This paper investigates the spatiotemporal change process of NDVI in the LRTR using the Theil-Sen Median estimator coupled with the Mann-Kendall test. The impact of human activities and climate change on vegetation change was quantitatively evaluated through residual analysis. The impact of different driving factors on vegetation spatial change was evaluated using the Geodetector method, which helped clarify the mechanisms driving vegetation change and the research results provide theoretical support for the implementation of ecological restoration and management in LRTR.

2. Study Area and Data Processing
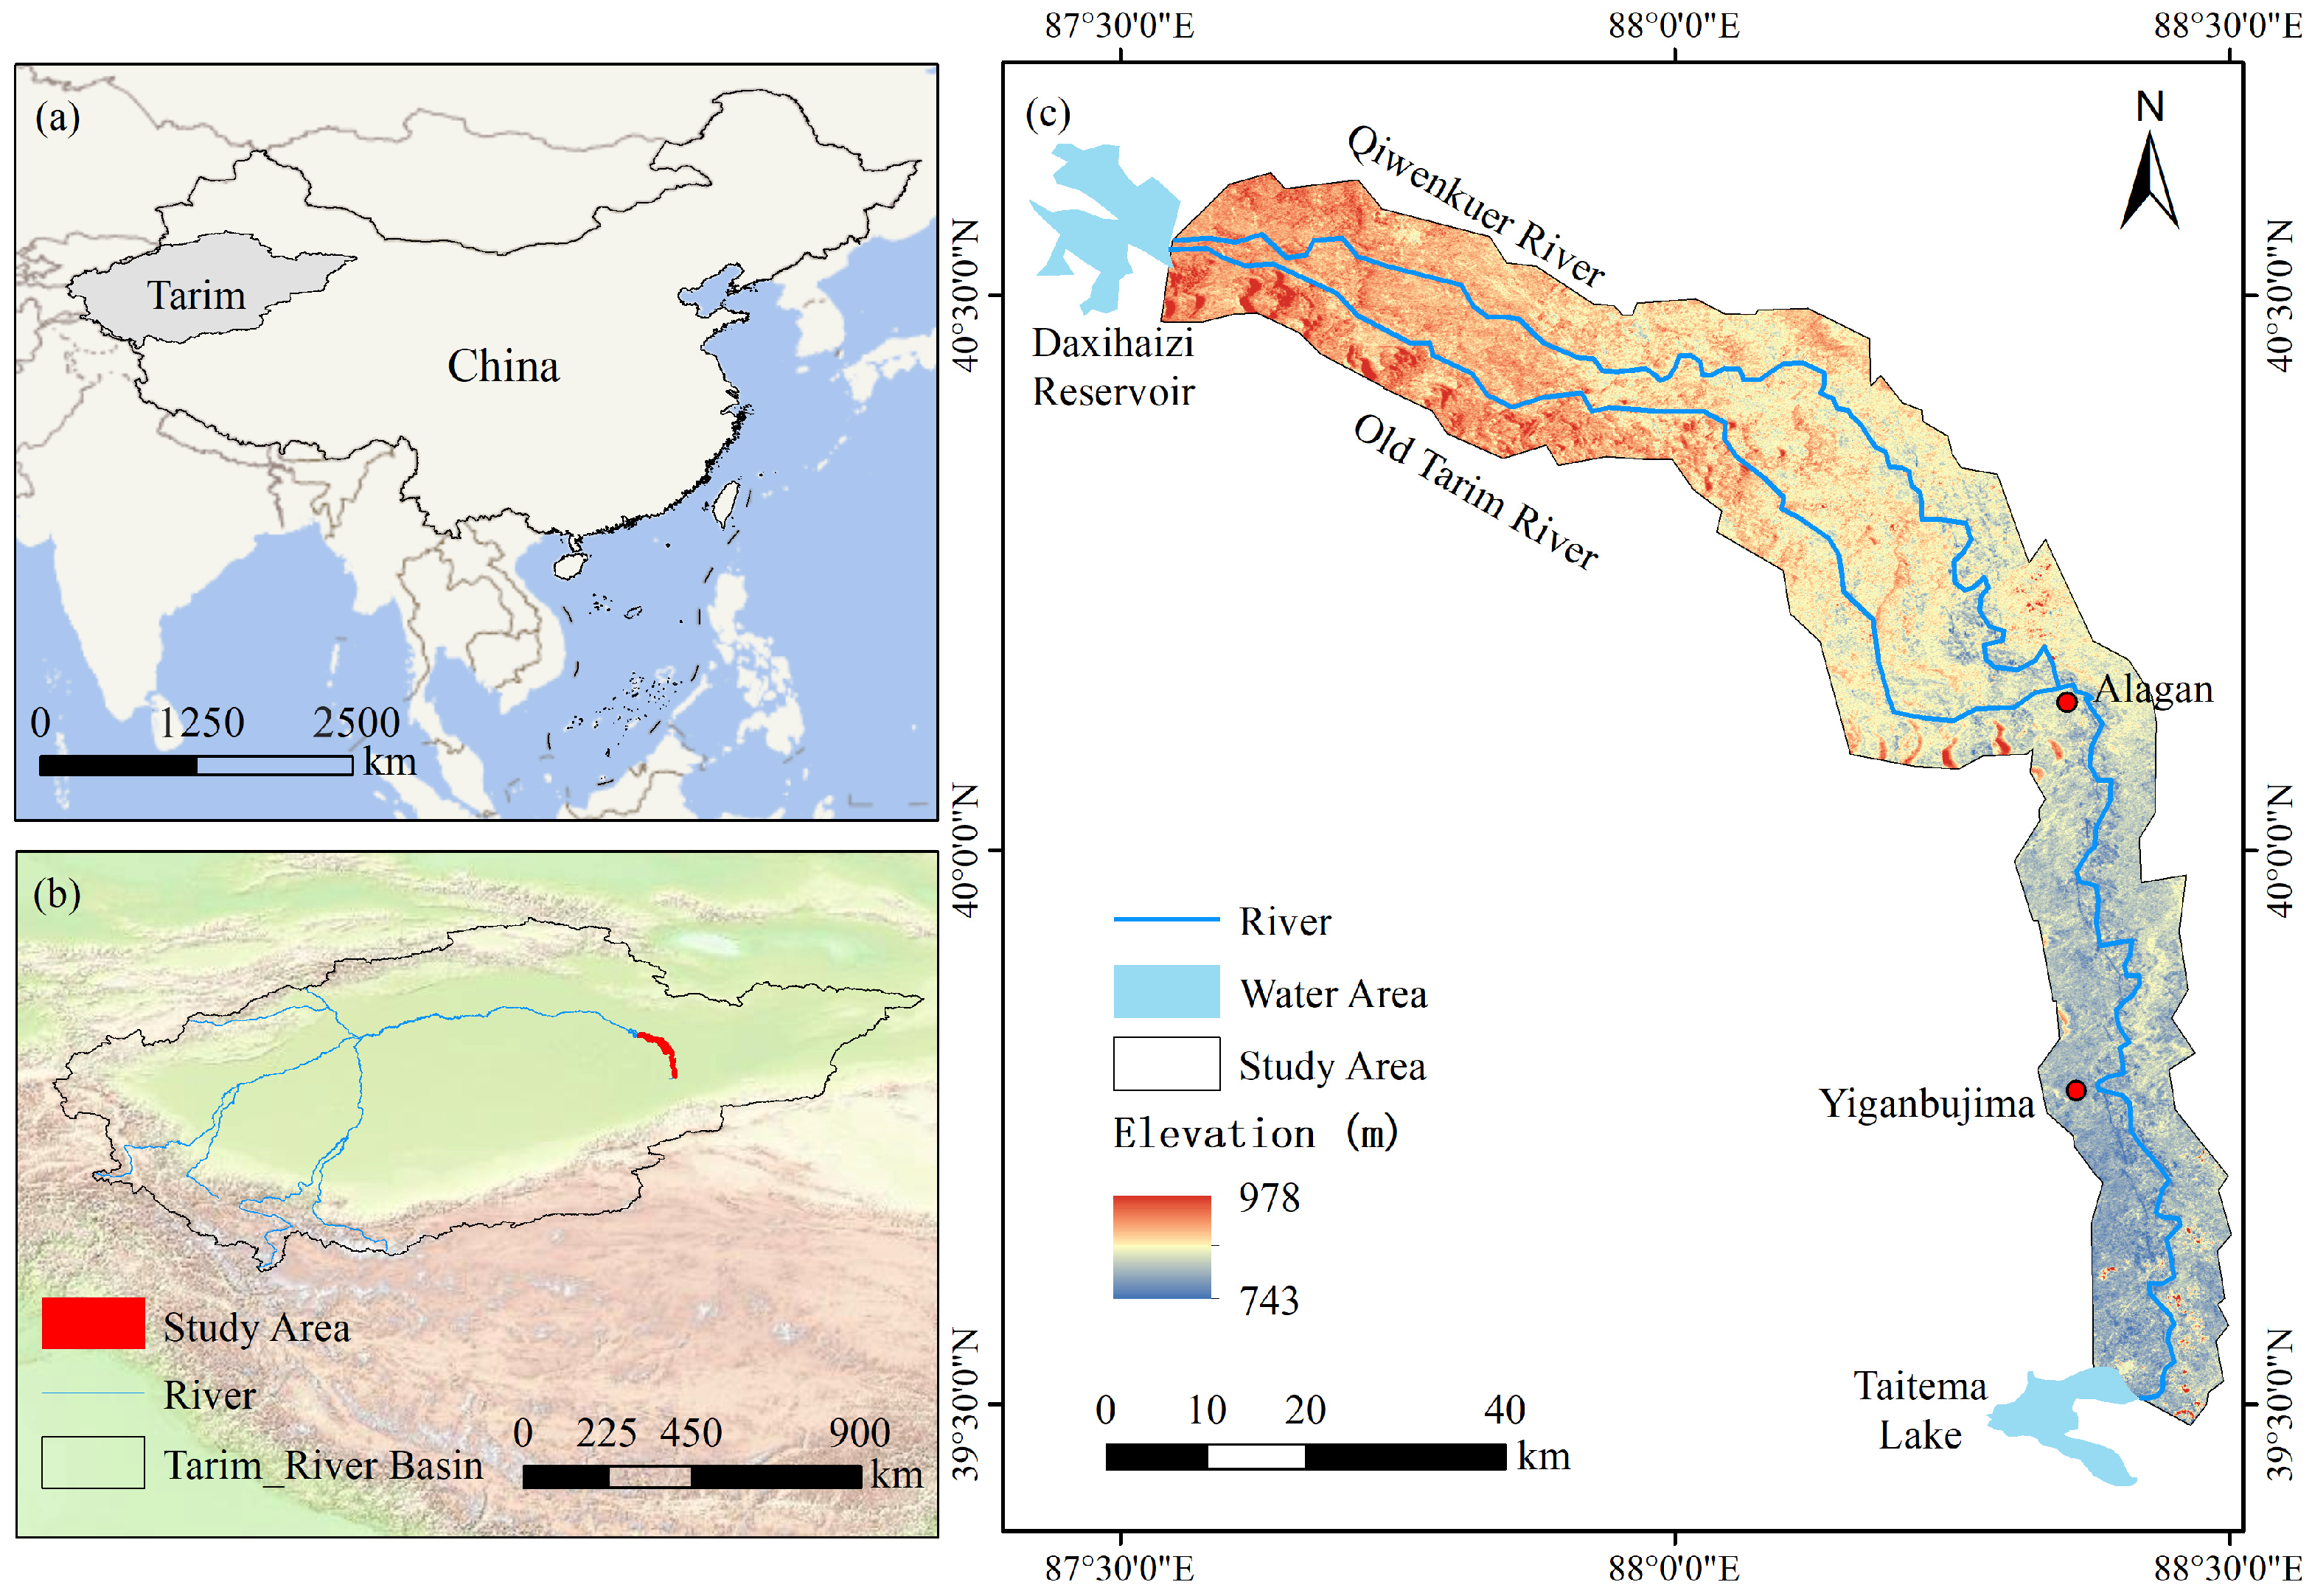
2.1. Study Area

The Tarim River, situated in northwest China, is the longest inland river in the country [26,27]. The climate in the basin is arid, with low annual precipitation (116 mm), high average annual temperature (10 °C), and extremely high evaporation (2200 mm) [28]. The geographical scope of LRTR is the area between the Daxihaizi Reservoir and the Taitema Lake. The local vegetation is dominated by species such as Populus euphratica and Hippophae rhamnoides, with a low vegetation coverage rate [29,30]. Vegetation growth heavily relies on groundwater, rendering the ecological environment extremely fragile. The Tarim River divides into two channels at the Daxihaizi Reservoir. The northern channel is called the Qiwenkuoer River, while the southern one is the Old Tarim River. These two channels converge at Alagan. Since the late 20th century, because of the unreasonable exploitation and allocation of water resources in the upstream area [31], the available water volume in the downstream has sharply decreased. This has led to serious ecological problems such as the decline of groundwater level, the reduction of vegetation, and the decrease of the area of the terminal lake [29,32]. In 2000, the Tarim River Basin Authority launched EWC to restore the ecosystem in the LRTR [33], conveying water from the Daxihaizi Reservoir through the old Tarim River and Qiwenkuoer River, to the downstream area. The river water ultimately flows into the terminal Taitema Lake, playing a pivotal role in restoring riparian vegetation [34]. See Figure 1.

2.2. Data Source and Preprocessing

This study utilized high-resolution NDVI data (16-day, 500 m) from the MOD13Q1 product, and analyzed vegetation changes by calculating the annual average NDVI data. The precipitation and temperature data (monthly, 1 km) were sourced from the National Tibetan Plateau/Third Pole Environment Data Center (http://data.tpdc.ac.cn, accessed on 28 July 2024) [35,36]. This study converted the monthly scale data to an annual scale in order to calculate the influence of climatic factors on vegetation.
The DEM data (90 m resolution) was obtained from the Geospatial Data Cloud website (https://www.gscloud.cn, accessed on 28 July 2024). ArcGIS 10.4 software was used to calculate slope data using the DEM data. Further calculations were made to determine the distance between different grids and river channels, in order to analyze the impact of EWC on riparian vegetation. The Tarim River Basin Authority provided the EWC data, including the volume and the duration. The time range of this study spanned from 2000 to 2020, and the grid accuracy is unified at 1 km. See Figure 2.

3. Method

3.1. Theil-Sen Estimator

The Theil-Sen estimator is recognized as a reliable non-parametric approach for trend analysis [37], and was proposed by Pranab K. Sen [38]. In contrast to approaches that rely on time series conformity, this method adeptly manages minor outliers and missing data. This study used it to compute the slope between successive data pairs within the NDVI dataset. The overall trend within the NDVI changes is represented by the median slope computed from the following calculations:
S l o p e N D V I = M e d i a n x j x i j i ,   j > i
where S l o p e N D V I represents the median of all slope data. If S l o p e N D V I > 0 , reveals a growing tendency in NDVI; if S l o p e N D V I < 0 , shows a decline in NDVI over time. x i and x j represent the two variables at time i and j , respectively.

3.2. Mann-Kendall (M-K) Significance Test

The Mann-Kendall significance test is combined with Theil-Sen estimator to assess the significance of time series trends [39,40]. In this study, it was employed to evaluate vegetation trends which were calculated as follows:
Z = S V ( S ) ( S > 0 ) 0 ( S = 0 ) S + 1 V ( S ) ( S < 0 )
S = i = 1 n 1 j = i + 1 n S i g n x j x i
V ( S ) = n ( n 1 ) ( 2 n + 5 ) 18
s i g n ( N D V I j N D V I i ) = 1 ,   N D V I j N D V I i > 0 0 ,   N D V I j N D V I i = 0 1 ,   N D V I j N D V I i < 0
where n refers to the length of the dataset. If the Z is greater than 1.65, 1.96, or 2.58 respectively, it indicates that the trend has passed the significance test at a confidence level of 90%, 95%, and 99%, respectively.
The integration of the Theil-Sen estimator and the M-K significance test effectively captured the diverse spatial distribution of vegetation change characteristics. By overlaying the Sen’s slope results with those of the M-K test, the changes in NDVI can be classified into nine categories. See Table 1.

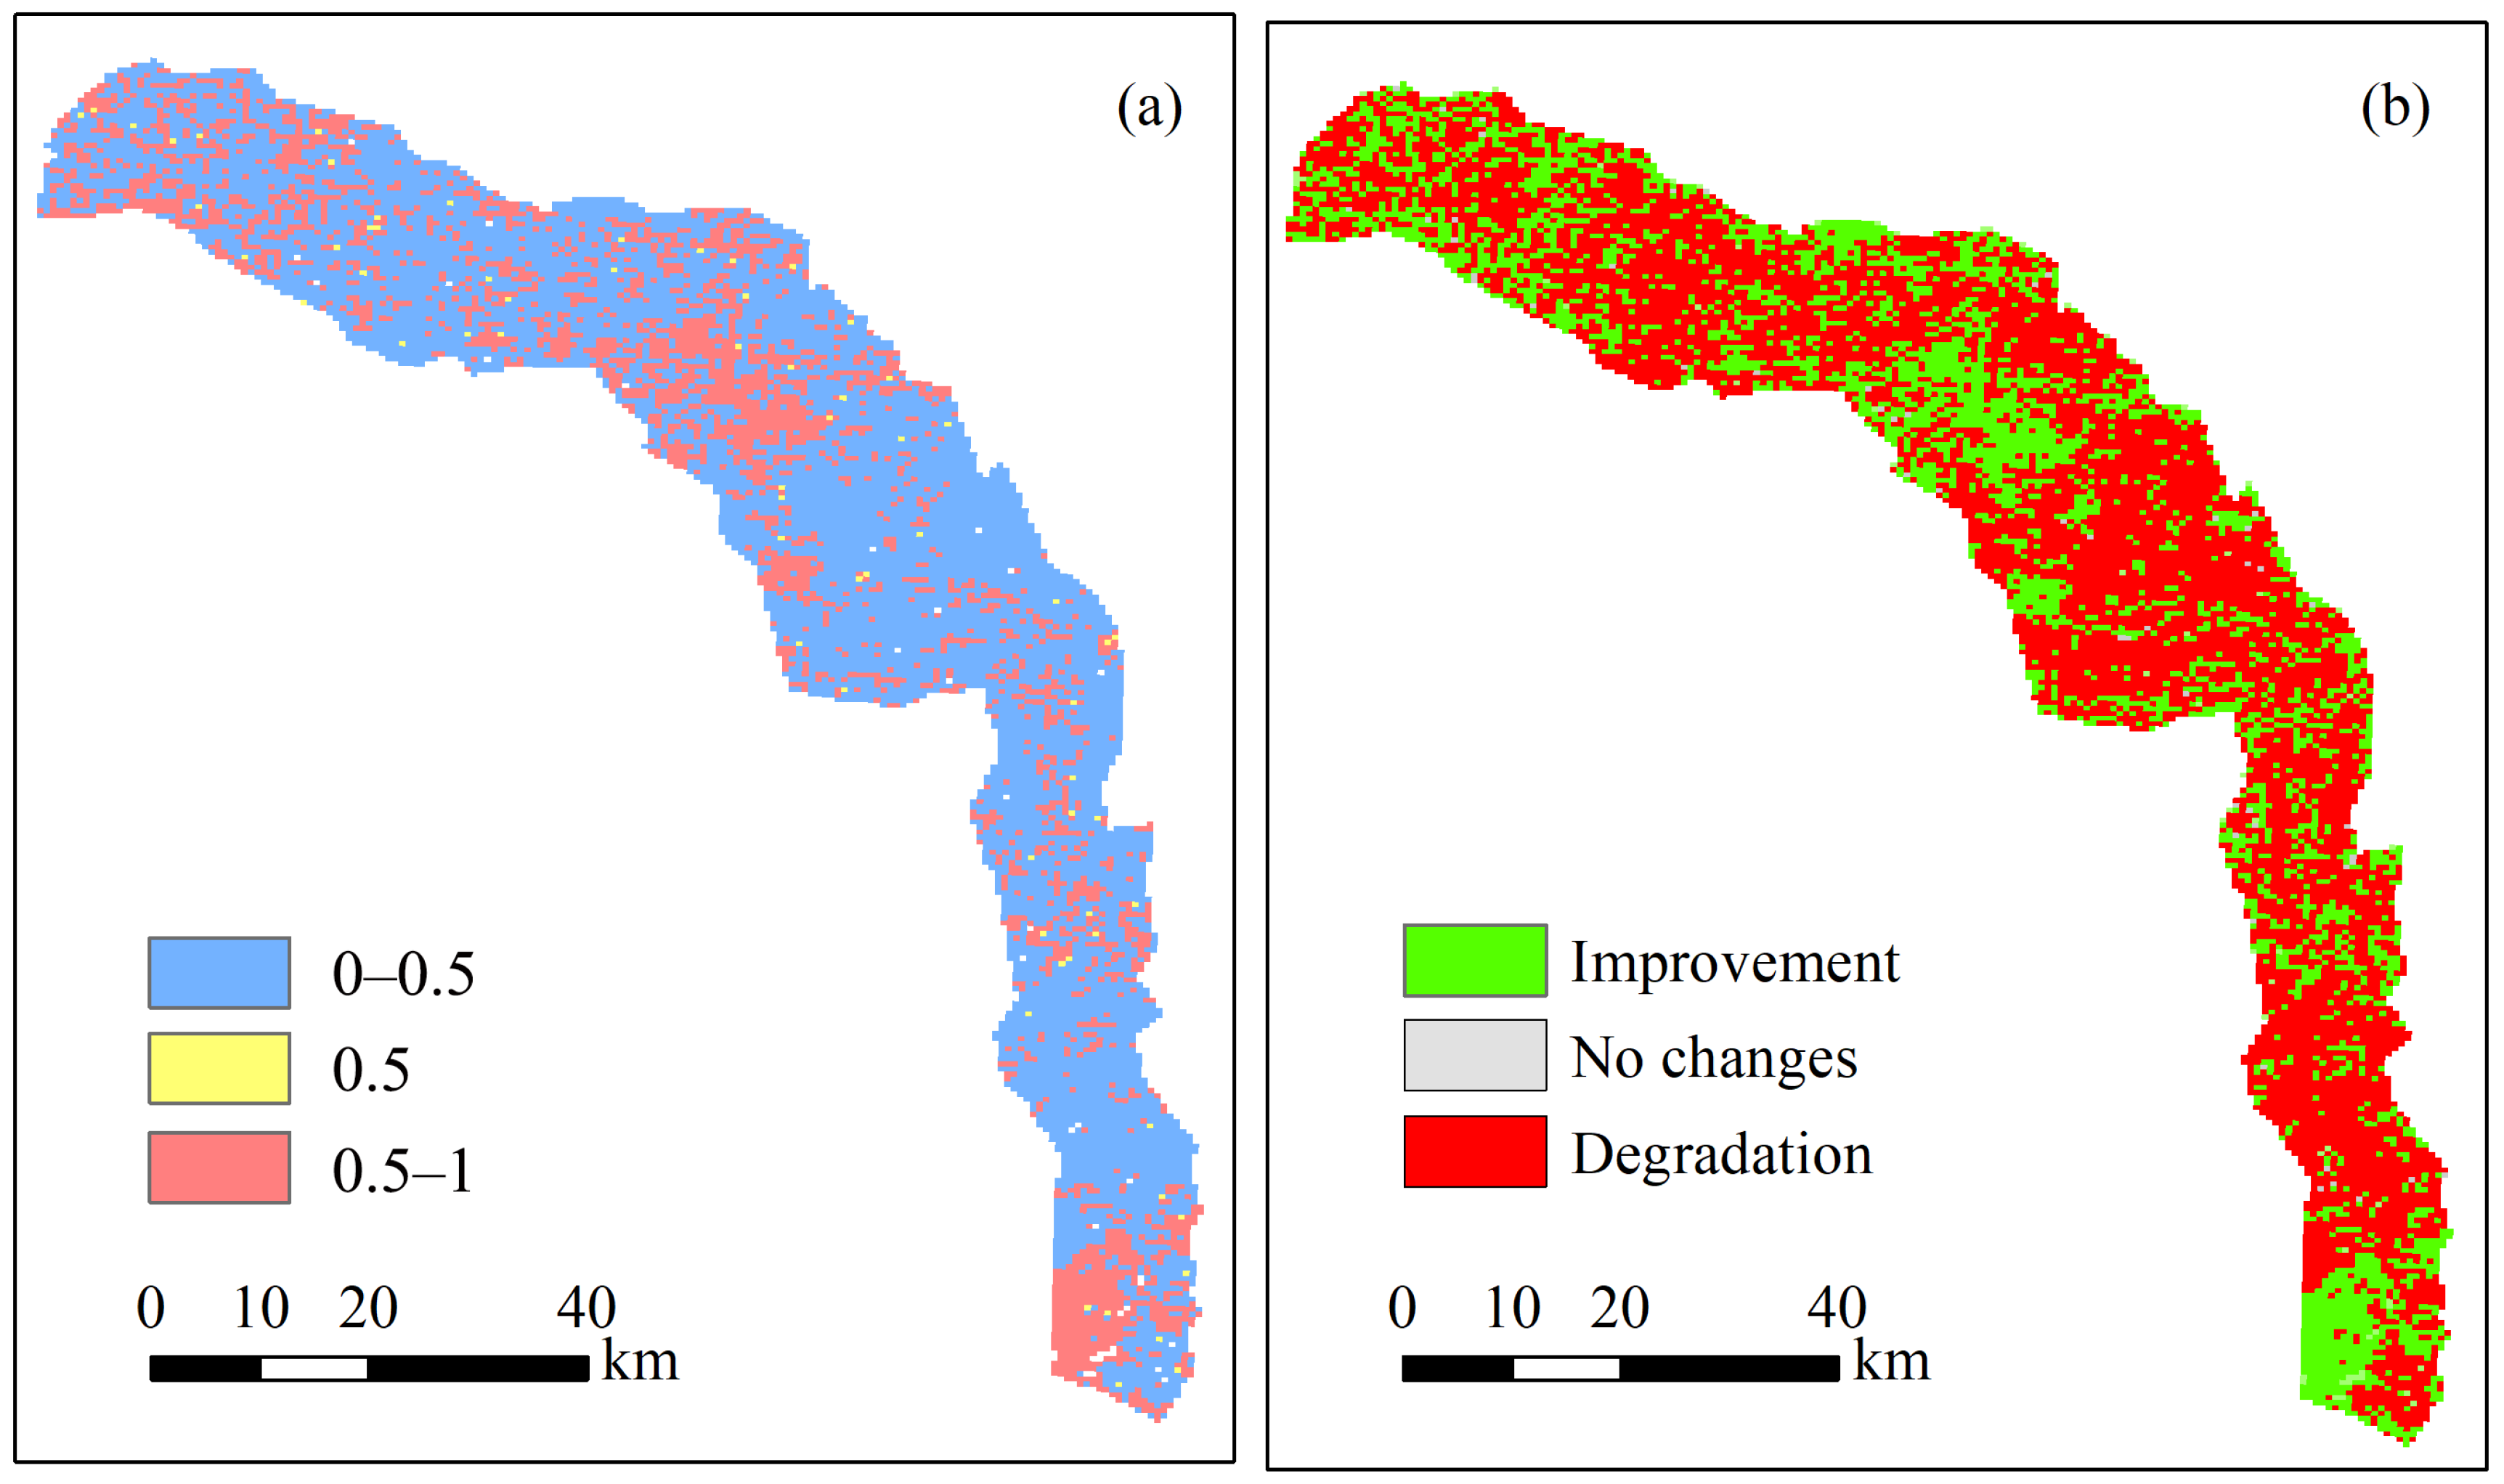
3.3. Hurst Exponent Method

The Hurst exponent, originally established by Hurst [41] and later improved by Mandelbrot [42], is a measure used to assess the persistence of changes in time series. It is calculated using the rescaled range analysis (R/S) method and assisted in revealing the autocorrelation within the time series, particularly emphasizing long-term trends that are might otherwise remain concealed. Recent research has increasingly incorporated this exponent into the analysis of long-term vegetation dynamics over time [43,44,45]. The process for conducting R/S analysis encompasses the following steps:
X t , a = z = 1 t x z , a e a ,   t = 1 ,   2 ,   ,   n
R a = m a x ( X t , a ) m i n ( X t , a ) ,   1 t m
( R / S ) m = 1 A a = 1 A R a / S a
( R / S ) m = D × m H
X t , a denotes the cumulative deviation; x is the annual NDVI; e a is the average NDVI; R a is the extreme deviation; and S a is the sample standard deviation. H ranges from 0 to 1 and can be categorized into three types. When H = 0.5 , the future changes of NDVI are random. When H > 0.5 , the future changes of NDVI remain the same as in the past. Conversely, if H < 0.5 , the future changes of NDVI are opposite to the past.
By combining the Theil-Sen median slope with the Hurst exponent method, the trend of vegetation changes in the future can be analyzed. The classification indicators are as follows (Table 2):

3.4. Multivariate Residual Analysis

The impact of human activities and climate change on vegetation changes was evaluated using multivariate residual analysis. This approach is based on the premise that changes in vegetation primarily driven by human activities can be discerned once the influence of climate factors has been eliminated as seen in the following:
N D V I C C = a × P + b × T + c
N D V I H A = N D V I o b s N D V I C C
where a and b are the regression coefficients, and c is the constant. P represents the precipitation time series and T represents the temperature time series. N D V I C C represents the calculated NDVI data with the regression equation, N D V I o b s represents the observed NDVI data, and  N D V I H A represents the result of subtracting observed from the calculated NDVI data. After conducting residual analysis, the factors influencing vegetation can be categorized into six classes. The classification criteria used are shown in the following (Table 3):

3.5. Geodetector Method

The Geodetector model, which can be freely downloaded from https://www.geodetector.cn/ (accessed on 28 July 2024), was utilized in conjunction with Excel. The model comprised of three types of detections: factor, ecological, and interactive. The factor detector identified the spatial differentiation of NDVI and quantified the extent to which a driving factor explained this differentiation. By calculating the q-values of various driving factors, the relative strength of their impacts on NDVI changes can be compared. The specific calculation process is as follows:
q = 1 h = 1 L N h σ h 2 b N σ 2
where L represents the variable of NDVI, N h and σ h 2 represent the number of units and variance of layer h , respectively, N and σ 2 refer to the number of units and overall variance. The range of the q value is [0,1]. The magnitude of the q value and driving factors on NDVI is positively proportional. At the same time, interaction detection identifies the interplay between various influencing factors and assesses the explanatory power when double driving factors interact.

4. Results

4.1. Temporal Variation Characteristics of the NDVI

From Figure 3a, it is observed that the annual average NDVI during 2000–2020 was about 0.007. NDVI exhibited an overall increasing trend, increasing by an average of 0.001 per year. At the same time, the accumulative ecological water conveyance volume (AEWCV) also increased year by year. In years when the slope of AEWCV increase and decreased, such as from 2006–2009, when ecological water conveyance volume (EWCV) declined, NDVI also decreased, this indicated a high correlation between the two. To evaluate areas with different vegetation cover, NDVI values were divided into three categories: 0–0.1, 0.1–0.2, and 0.2–1. Figure 3b shows that the area of the region with NDVI values between 0.1 and 0.2 significantly increases, while the area with NDVI values between 0.2 and 1 also showed a small increase. From this, it can be observed that EWC played a significant role in the vegetation restoration of LRTR.

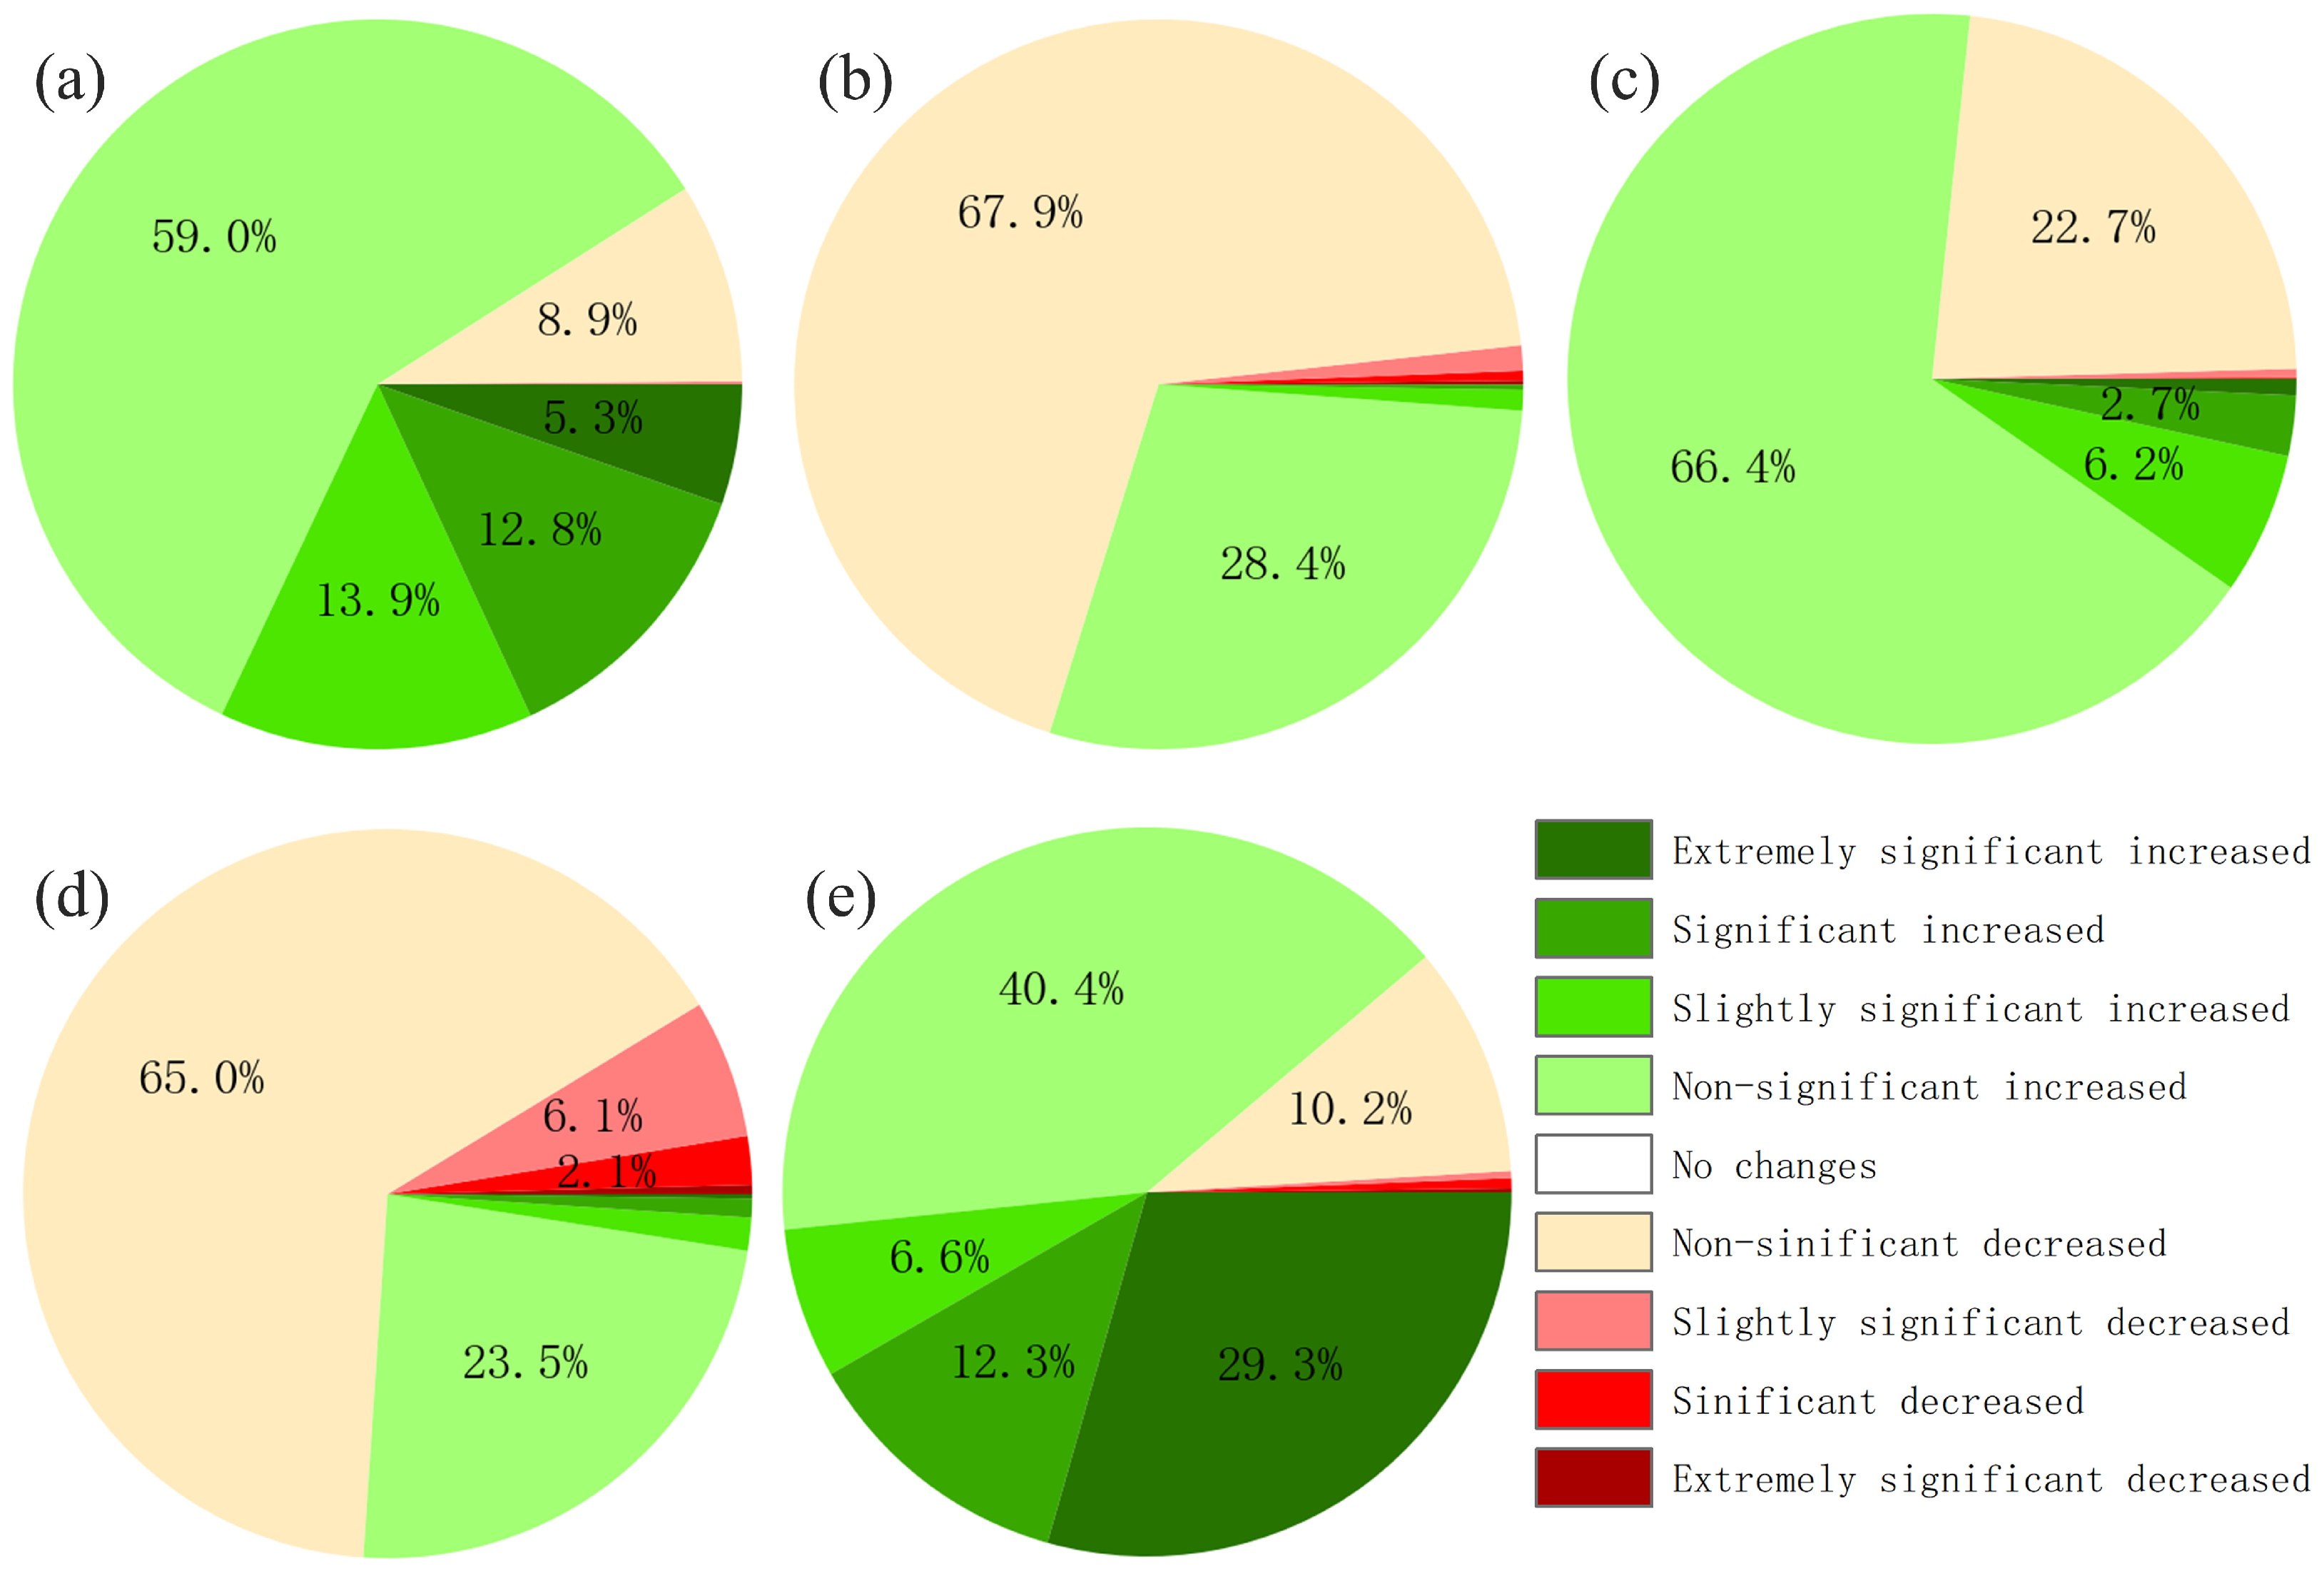
4.2. Spatial Variation Characteristics of the NDVI

From the vegetation change trends in Figure 4 and Figure 5, it can be observed that vegetation showed significant recovery during the first period after the initiation of EWC (2000–2005), with a recovery area proportion reaching 91%. The vegetation in areas proximate to the river channel has recovered better, indicating that EWC has a positive impact on vegetation growth. However, as it can be seen in Figure 4b,d and Figure 5b,d, during the periods from 2005–2010 and 2015–2020, vegetation degradation reoccurred across the study area, with the proportions of degraded areas reaching 71% and 73.2%, respectively. This was associated with concurrent decreases in EWCV during these periods. Among them, during the period from 2015 to 2020, the NDVI in 8.5% of the area significantly decreased, indicating that not only the reduced EWCV but also other combined factors contributed to vegetation degradation. From Figure 4e and Figure 5e, it can be seen that vegetation has significantly recovered during 2000–2020, with the restored areas accounting for 88.6% of the total, mainly concentrated around river channel and tail lake.
Furthermore, Hurst exponent analysis is used to analyze the vegetation change trend of future LRTR. Figure 6 illustrates that the spatial distribution of the trends was rather scattered, with no clear regularity. In total, 33% of the areas had H values between 0 and 0.5, indicating that the future trends would be opposite to the past; 66% of the areas had H values between 0.5 and 1, indicating that the future trends would continue like the past trends. Further, the results of the Theil-Sen estimator coupled with the Hurst exponent method showed three future trends in vegetation change. Among them, 27.8% of the areas would experience vegetation increase, while 71.5% of the areas would face vegetation degradation. In terms of spatial distribution, the upper and terminal regions of the watershed mainly showed an increasing trend in vegetation, while the middle region of the watershed showed a decreasing trend in vegetation. This serves as a warning for future ecological protection efforts.

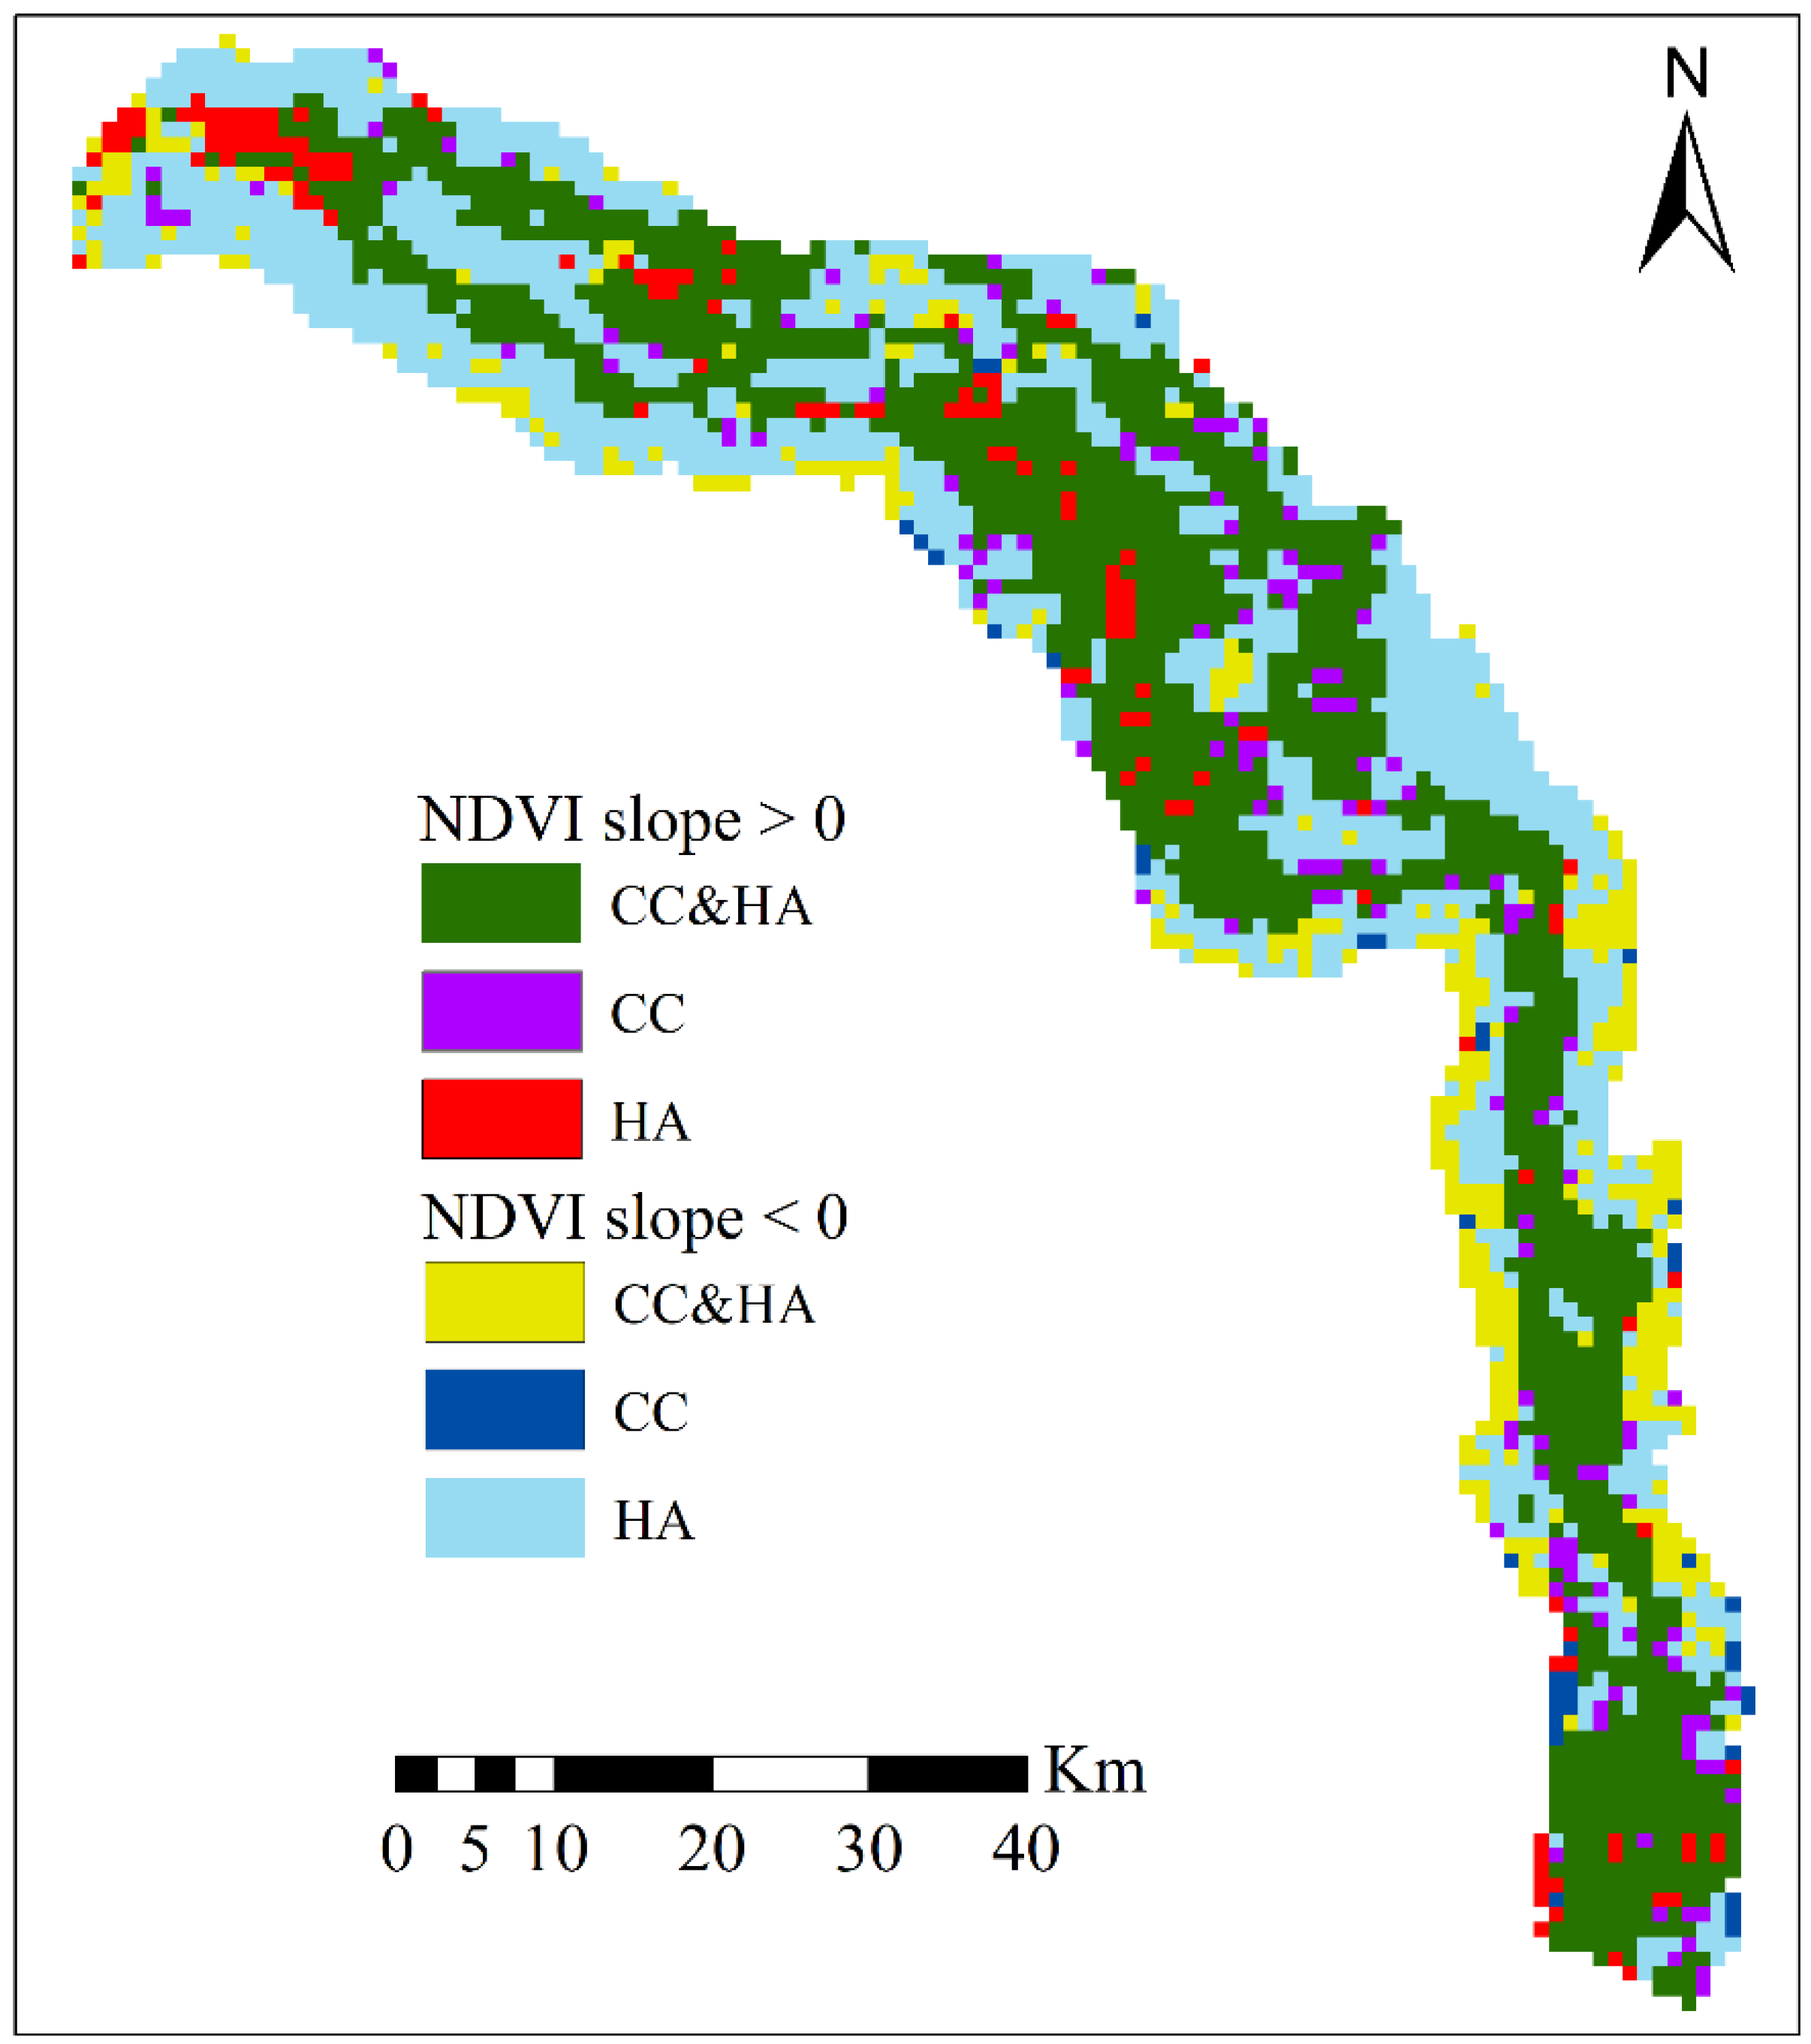
4.3. Contribution of Climate Change and Human Activity to Vegetation Dynamics

Multivariate residual analysis method was used to evaluate the spatial distribution of factors affecting NDVI changes. Figure 7 illustrates substantial spatial variability in how human activity and climate change influence NDVI across the study area. Firstly, it was evident that the area where NDVI has increased was much larger than the area where NDVI has decreased. In the areas surrounding the river channel, the increase in NDVI is due to the combined effects of climate change (CC) and human activity (HA). In contrast, the areas where climate change and human activity independently contribute to the increase of NDVI were scattered around the periphery without any regular pattern. Meanwhile, in areas far from the river channel, NDVI showed a decreasing trend, mostly driven by human activity.
Furthermore, the impacts of human activity and climate change on NDVI changes were quantified. The study categorized regions into 11 groups based on their varying contribution levels, specifically: [−100, −80), [−80, −60), …, (80, 100]. In Figure 8, the warmer the color tone, the greater the contribution to NDVI changes. Positive contributions indicate a positive effect on NDVI, while negative contributions indicate a negative effect. Figure 8a shows that regions where climate change contributes positively to NDVI changes cover approximately 32.26% of the study area. Notably, areas with contributions falling within the ranges of 0–20% and 80–100% collectively cover a significant portion, approximately 20.2% of the total area. In contrast, climate change had no observable impact on NDVI changes in 62% of the regions. Overall, the effect of climate change on NDVI changes in the LRTR was not significant, with the affected areas being relatively scattered.
As shown in Figure 8b, the effect of human activity on NDVI changes is more pronounced and the affected areas are relatively concentrated. However, the degree of impact is polarized. The regions where human activity contributed 80–100% were mainly concentrated near the river channel. This indicated that in these areas, the NDVI showed a significant increasing trend, and human activity positively contributed to vegetation restoration. The areas where the contribution of human activity ranges from −100% to 80% were mainly concentrated in regions far from the river channel, accounting for 38.15% of the whole study area. Considering that NDVI showed a decreasing trend, it can be understood that human activity has had a significant inhibitory effect on vegetation degradation.

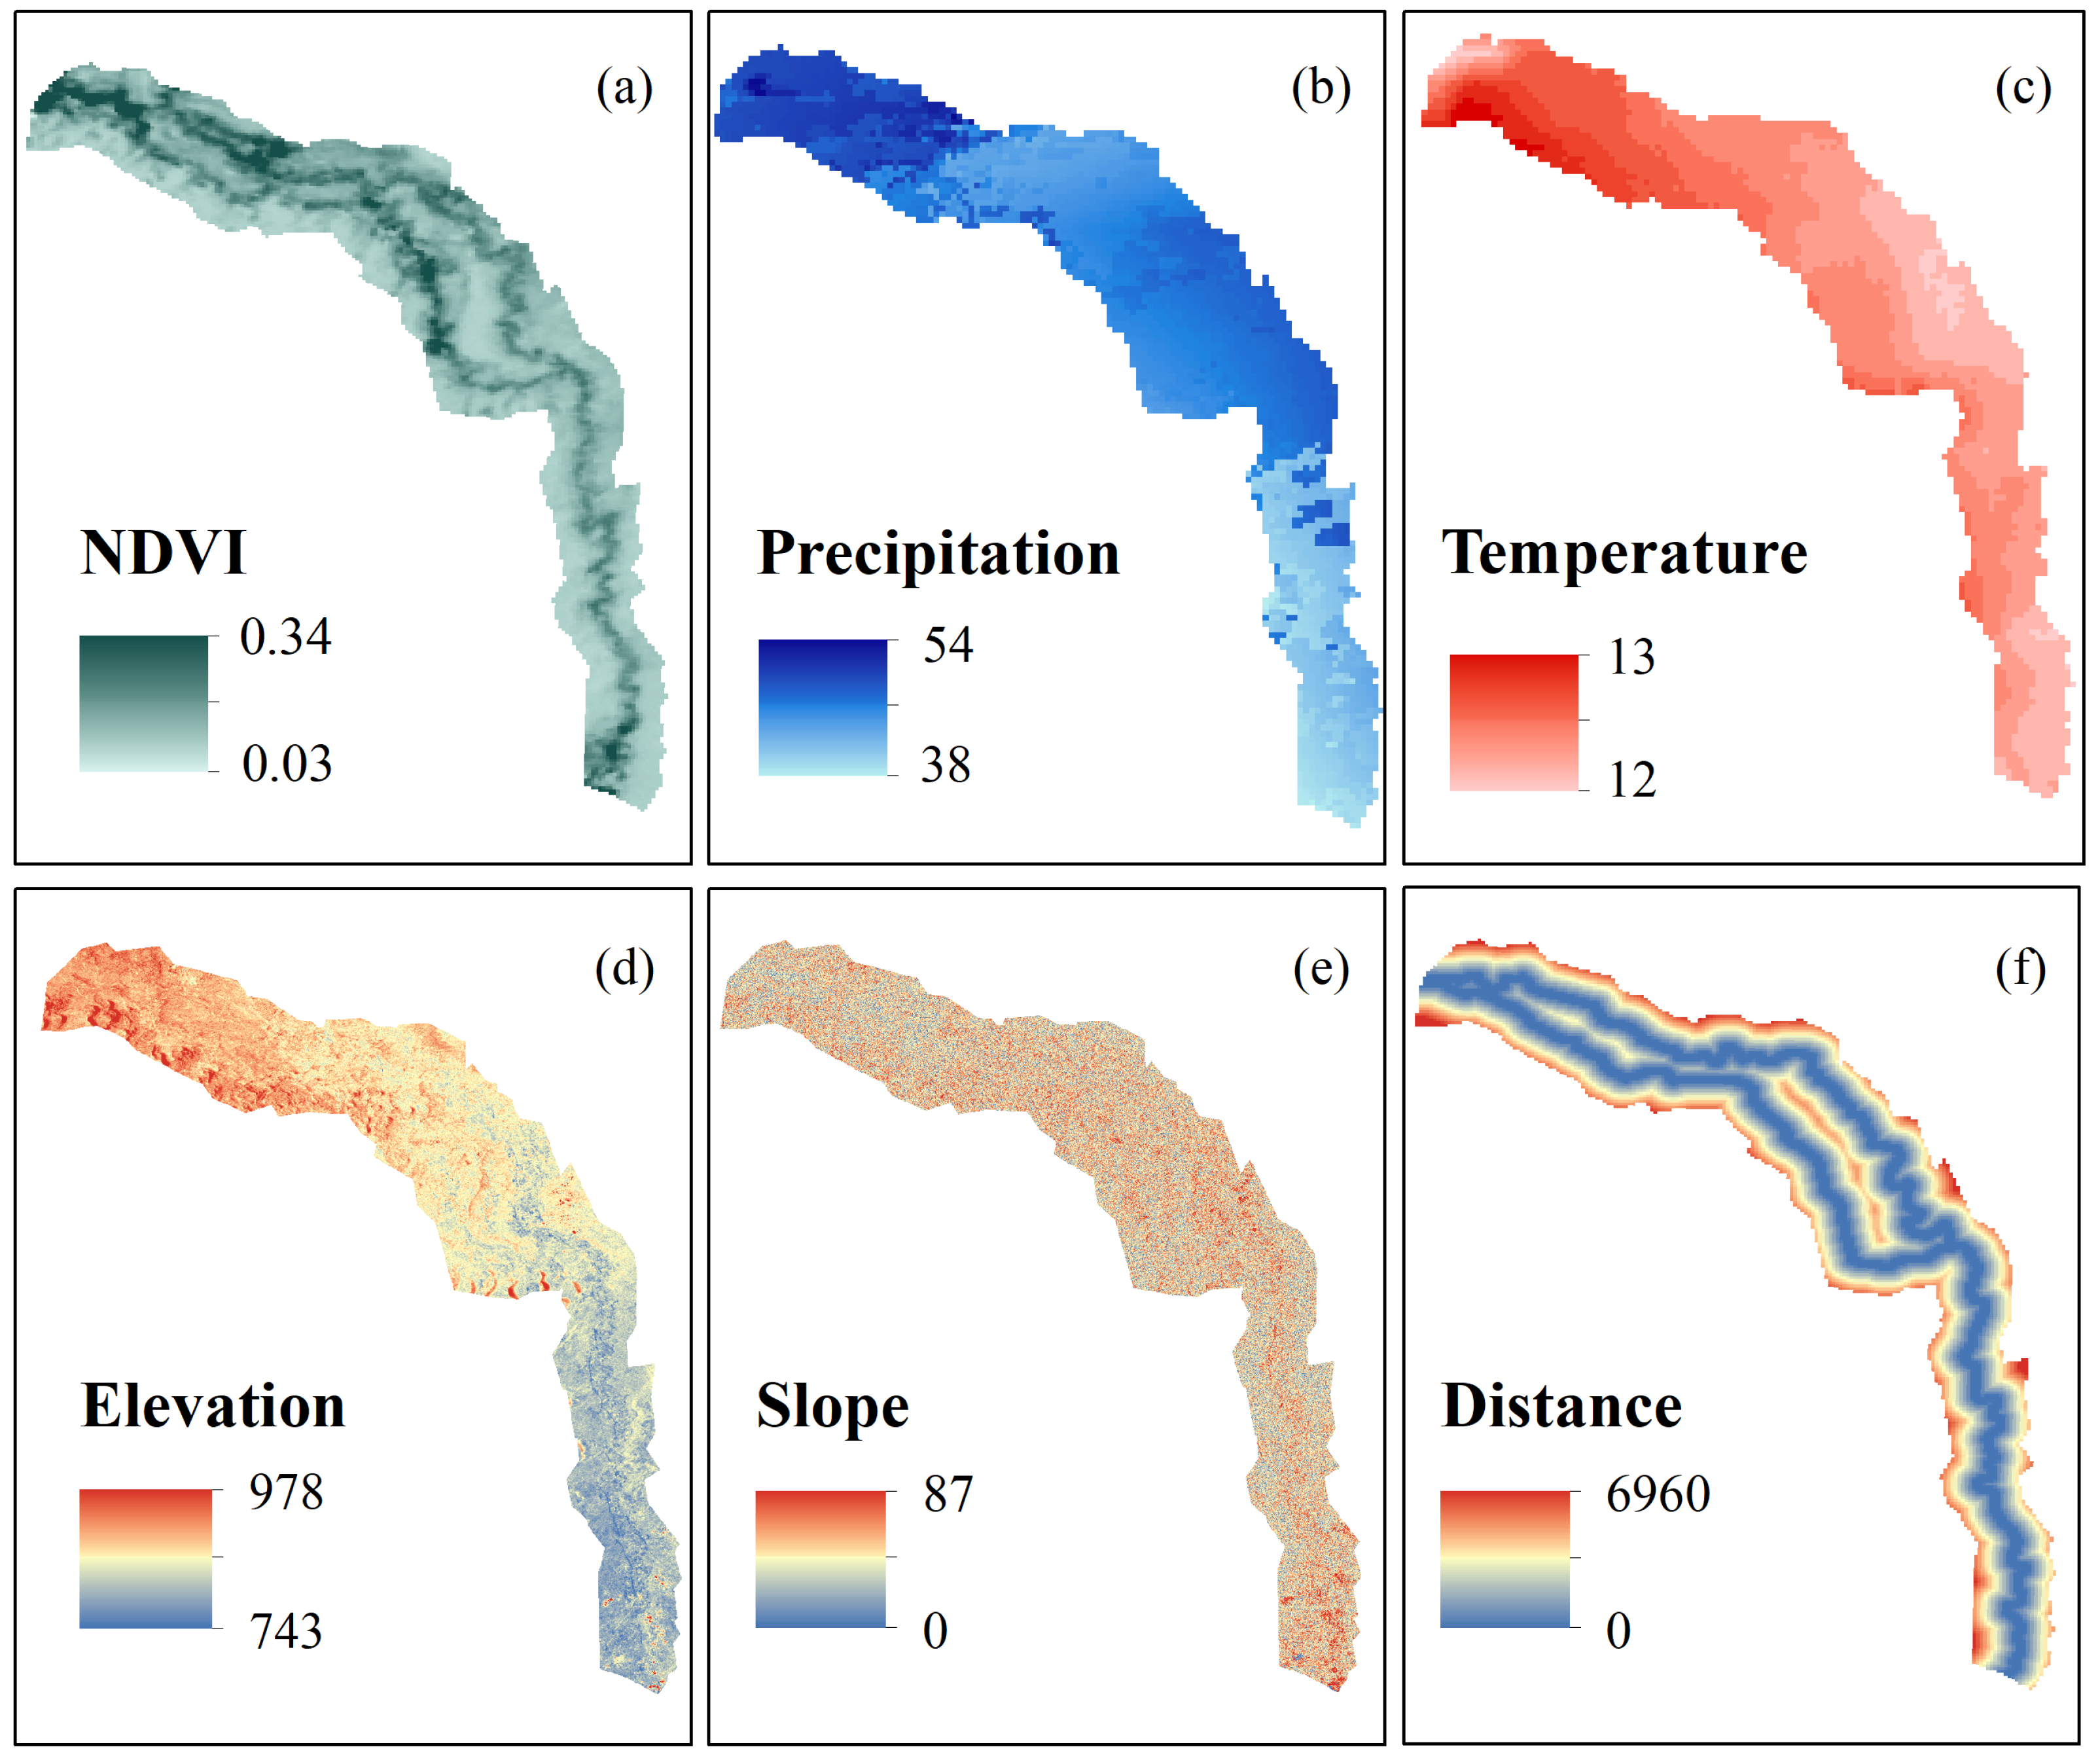
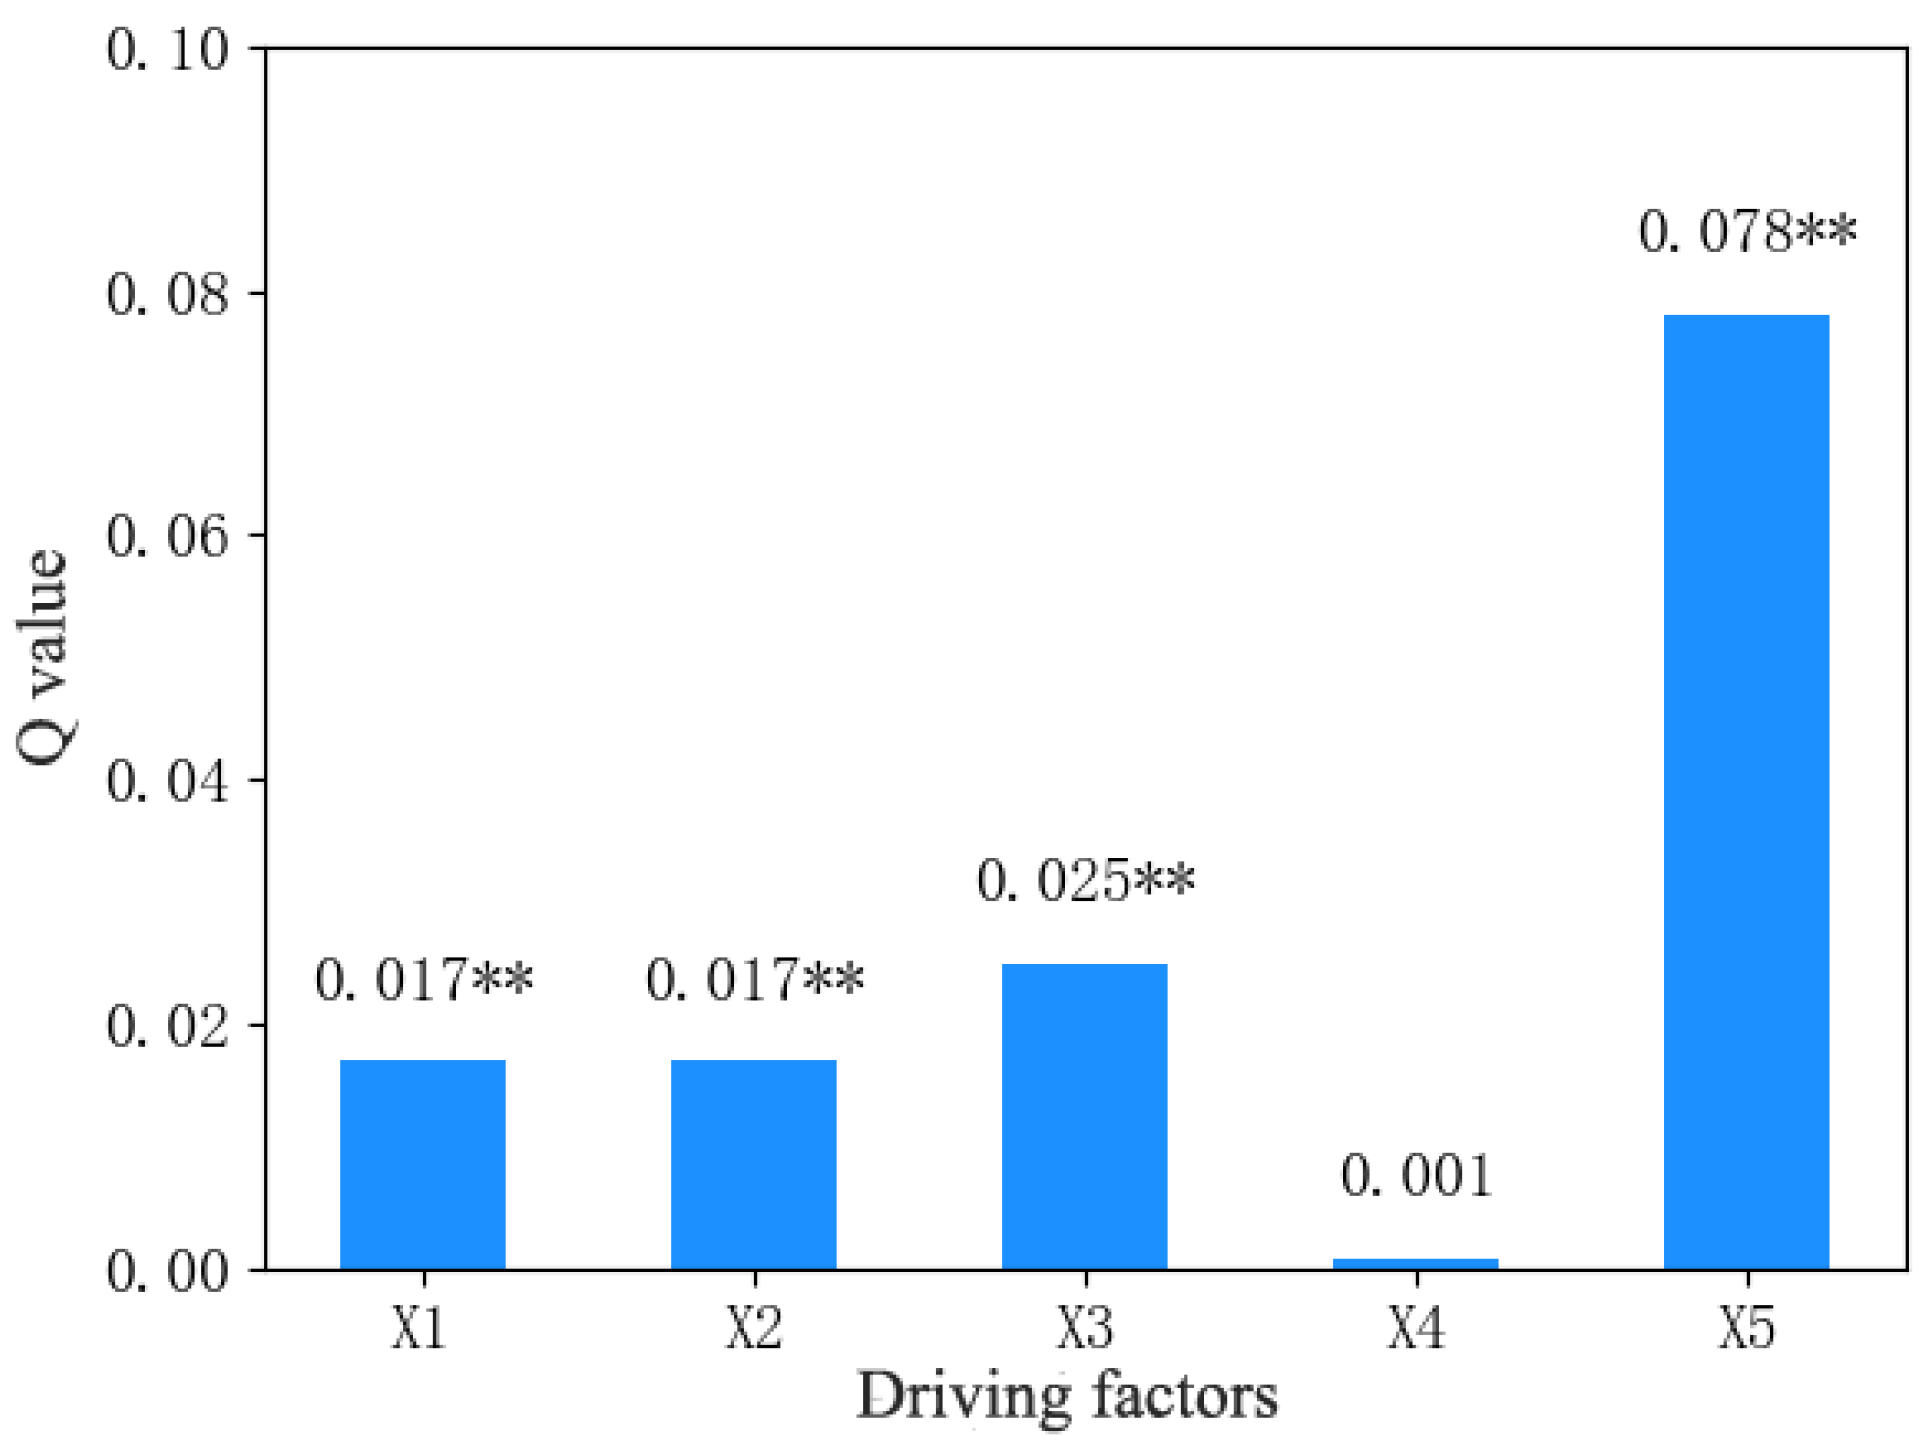
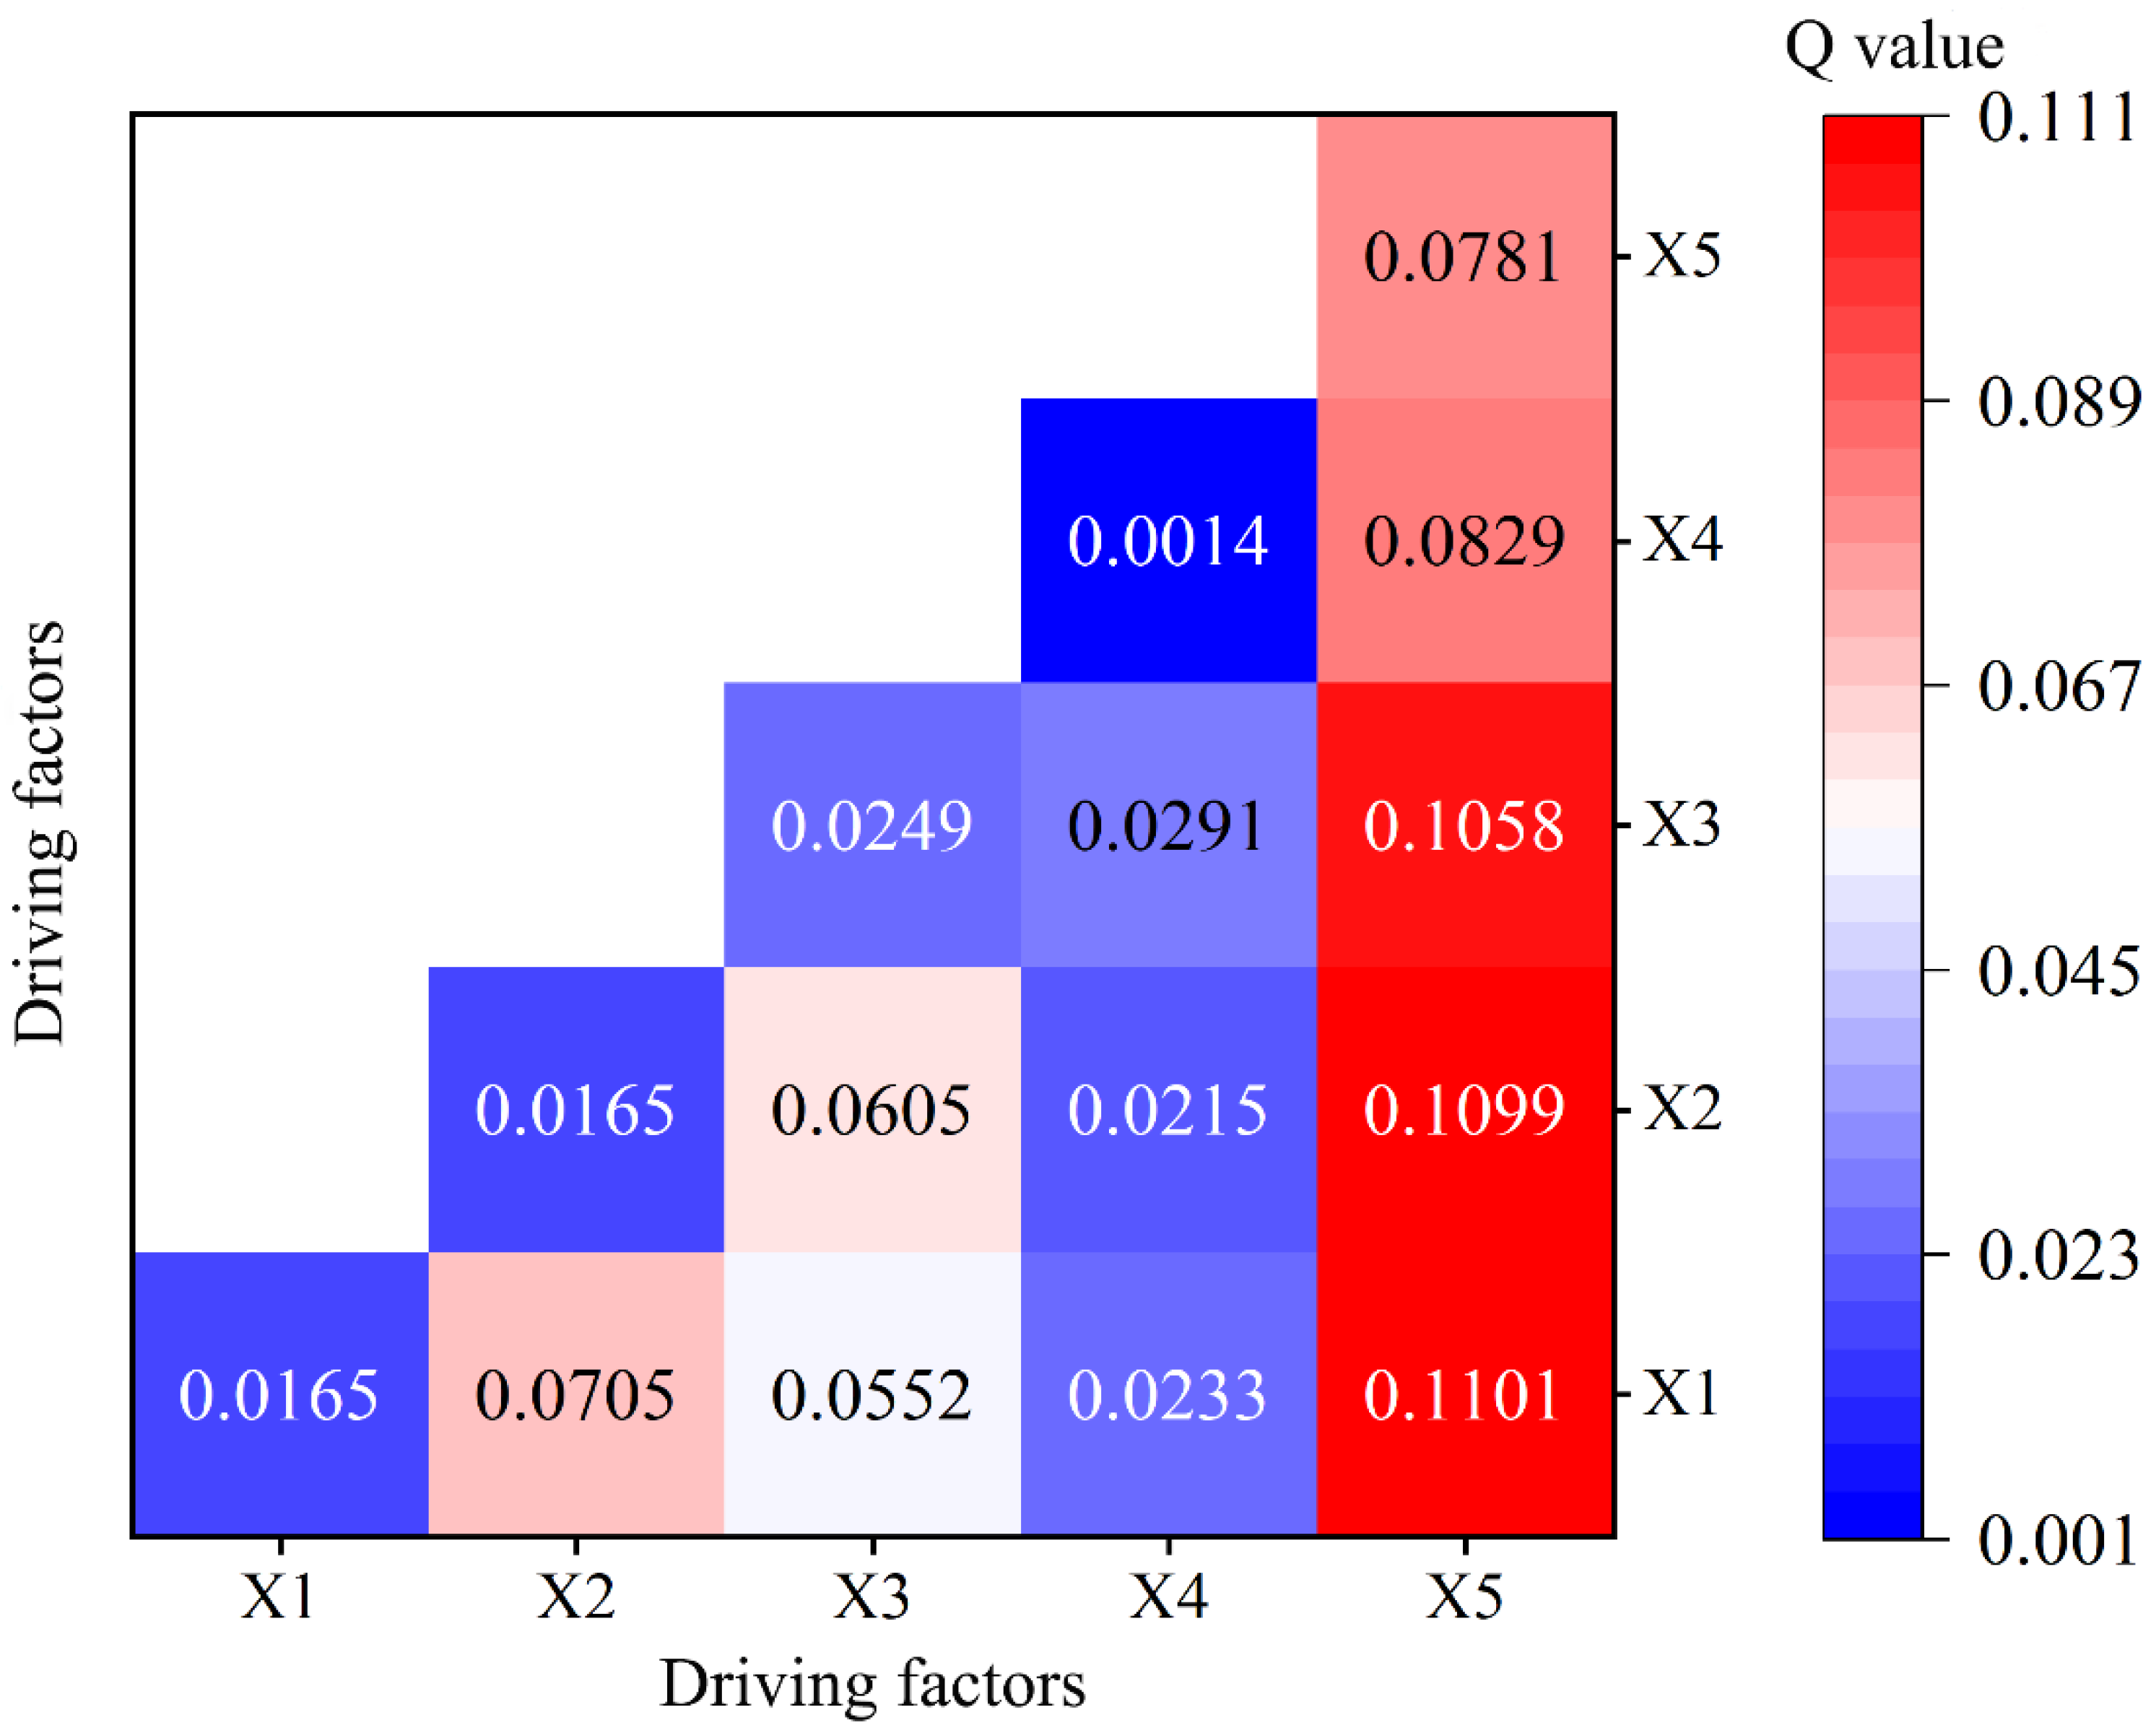
4.4. Detection of Factors Influencing Vegetation Distribution

This study considered five factors to analyze the driving mechanisms of vegetation spatial variation, as shown in Table 4. These factors were annual precipitation, annual average temperature, elevation, slope, and distance to the river channel. According to the factor detection results (Figure 9), the order of the impact of driving factors on NDVI was: X5 > X3 > X2 > X1 > X4. The distance to the river channel factor has the strongest explanatory power for NDVI, with a Q value of 0.078, much higher than other driving factors. The impact of slope on the spatiotemporal variation of NDVI is minimal, with a Q value of only 0.001.
Ecological detection results (Table 5) show that only the distance to the river channel, when combined with other factors, showed a significant difference ( α = 0.05 ) in the impact on the change of NDVI. The combinations of additional driving factors did not exhibit an insignificant variation in their influence on the spatial distribution of NDVI.
The comprehensive impact of driving factors on NDVI is evaluated using the interaction detector in the Geodetector method. The interactive detection results (Figure 10) demonstrated a notable synergistic enhancement effect between different factors, with the combination of two factors significantly amplifying their influence on NDVI’s spatial distribution. Among them, the interaction between the distance to the river channel factor and the precipitation factor, temperature factor, and elevation factor showed better explanatory power for NDVI spatial distribution, with Q values of 0.1101, 0.1099, and 0.1058, respectively. This result showed that the distance to the river channel was the primary factor influencing the NDVI changes. The study demonstrated that the driving factors influencing NDVI were interdependent and exhibited greater explanatory power when they interacted.

5. Discussion

5.1. Vegetation Variation Characteristics in the LRTR

This study revealed a continuous increase in NDVI in the LRTR in 2000–2020. Hu et al. [46] reported a significant vegetation increase in 65.9% of the Tarim River Basin, while Yu et al. [47] found that the proportion of increasing NDVI in China’s endorheic basins exceeded the proportion of decreasing NDVI. These findings were consistent with our results. The restoration in vegetation conditions in the LRTR can be largely attributed to the EWC [48]. Using the Theil-Sen estimator and the M-K significance test, we analyzed vegetation changes of the LRTR from 2000 to 2020 and found that the vegetation conditions in most areas (88.6%) have undoubtedly improved. From this perspective, the Chinese government’s ecological water conveyance has been very successful in effectively preventing vegetation degradation.

5.2. Effect of Driving Factors on LRTR Vegetation Change

The vegetation cover in the LRTR was affected by the EWC, resulting in a human activity contribution to NDVI changes significantly outweighing that of climate change. Due to the scarcity of precipitation in the LRTR, vegetation growth mainly depends on groundwater. At the same time, the main growth of drought-resistant tree species in the area has lower leaf evaporation and is less sensitive to high temperatures. Therefore, climate change has a small impact on vegetation. Meanwhile, human beings have made continuous efforts in ecological restoration, so under the comprehensive impact of climate change and human activities, vegetation is showing a trend of growth. Besides meteorological factors, the distance to the river channel was a key driver of vegetation distribution in the LRTR. Rivers mainly impact vegetation by recharging groundwater, which significantly influences NDVI in arid regions [49,50]. The closer the distance to the river channel, the higher the groundwater level, which better supplements water for plants. Additionally, elevation is a major factor influencing vegetation distribution. It indirectly affects vegetation growth by altering precipitation and temperature. However, in arid regions, due to the scarcity of precipitation, the differences in vegetation growth at varying elevations are not as pronounced as in humid areas [51]. Additionally, the slope has a weaker explanatory power for vegetation growth. The study results indicate that slope had little impact on vegetation distribution in the LRTR. Generally, slope affects vegetation growth through solar radiation. However, in arid regions, due to intense sunlight and high temperatures, vegetation growth may be inhibited due to water scarcity instead.
We found that combining low q statistics driving factors with other driving factors greatly enhances explanatory power. Moreover, interactions between two driving factors were not simply linear additions; instead, they exhibited nonlinear amplification. Specifically, factors like distance to the river channel, precipitation, and temperature, which are significantly correlated with vegetation, exhibited higher explanatory power after interaction. This suggests that the factors are not independent of each other and typically act together to collectively influence vegetation distribution.

6. Conclusions

This study employed multi-source geospatial data and used the Theil-Sen estimator and the Mann-Kendall significance test to assess historical changes in NDVI in the LRTR. Despite a gradual increase in vegetation cover from 2000–2020, the NDVI values in the LRTR remain relatively low. The future trend of NDVI change was analyzed using the Hurst exponent method. The findings showed that at the upper and lower parts of LRTR, most areas would further increase in vegetation, while in the middle reaches, vegetation was more likely to degrade. Subsequently, residual analysis was used for quantitative evaluation of the contributions of human activity and climate change to NDVI changes. The results showed that human activities, such as EWC, were the primary contributing factors to vegetation growth in the LRTR. Meanwhile, the contribution of climate change is minimal. Using the Geodetector method, we analyzed the driving mechanism of NDVI change in the LRTR. The top three driving factors affecting vegetation coverage were the distance to the river channel, precipitation, and temperature. Slope has the least effect on vegetation. The interaction effects between different driving factors showed significant nonlinear enhancement, surpassing the explanatory power of individual factors for vegetation changes. The study area is a typical arid region, and human intervention in local vegetation growth is very obvious. The issue of vegetation protection is a common problem faced by various arid regions around the world. Different human activities affect whether vegetation is restored or degraded. Research by scholars in northern Oman [52], the Loess Plateau in China [53], and Central Asia [54] has also confirmed that human activities are the main factors affecting vegetation growth in arid regions. Due to the positive impact of river leakage, riparian vegetation that relies on groundwater has emerged in arid areas, which is significantly denser than vegetation in other regions. Studying the mechanisms behind vegetation restoration and degradation is of great significance for protecting fragile ecosystems. These findings offer theoretical support for ecological conservation and sustainable development in arid areas.

Author Contributions

Methodology, Q.H., X.C. and S.L.; Software, T.Q. and X.C.; Validation, T.Q.; Formal analysis, Q.H.; Investigation, Y.L.; Resources, L.X. and S.L.; Data curation, Y.L.; Writing—original draft, Q.H.; Writing—review & editing, L.X.; Visualization, M.Y.; Supervision, M.Y.; Funding acquisition, L.X. All authors have read and agreed to the published version of the manuscript.

Funding

This study was supported by the National Key Research and Development Program of China (2023YFC3206804), Xinjiang Production and Construction Corps (No. 2022BC001), National Scientific Foundation of China (No. 51779074).

Data Availability Statement

The raw data supporting the conclusions of this article will be made available by the authors on request.

Conflicts of Interest

The authors declare that they have no known competing financial interests or personal relationships that could have appeared to influence the work reported in this paper.

References

  1. Karnieli, A.; Qin, Z.; Wu, B.; Panov, N.; Yan, F. Spatio-Temporal Dynamics of Land-Use and Land-Cover in the Mu Us Sandy Land, China, Using the Change Vector Analysis Technique. Remote Sens. 2014, 6, 9316–9339. [Google Scholar] [CrossRef]
  2. Han, Q.; Xue, L.; Liu, Y.; Yang, M.; Chu, X.; Liu, S. Developing a multi-objective simulation-optimization model for ecological water conveyance in arid inland river basins. J. Hydrol. Reg. Stud. 2023, 50, 101551. [Google Scholar] [CrossRef]
  3. Xu, Y.; Dai, Q.-Y.; Lu, Y.-G.; Zhao, C.; Huang, W.-T.; Xu, M.; Feng, Y.-X. Identification of ecologically sensitive zones affected by climate change and anthropogenic activities in Southwest China through a NDVI-based spatial-temporal model. Ecol. Indic. 2024, 158, 111482. [Google Scholar] [CrossRef]
  4. Xiao, X.; Guan, Q.; Zhang, Z.; Liu, H.; Du, Q.; Yuan, T. Investigating the underlying drivers of vegetation dynamics in cold-arid mountainous. Catena 2024, 237, 107831. [Google Scholar] [CrossRef]
  5. Zhan, Y.; Liu, X.; Li, Y.; Zhang, H.; Wang, D.; Fan, J.; Yang, J. Trends and contribution of different grassland types in restoring the Three River Headwater Region, China, 1988–2012. Sci. Total Environ. 2024, 908, 168161. [Google Scholar] [CrossRef]
  6. Khanaum, M.M.; Qi, T.; Boutin, K.D.; Otte, M.L.; Lin, Z.; Chu, X. Assessing the Impacts of Wetlands on Discharge and Nutrient Loading: Insights from Restoring Past Wetlands with GIS-Based Analysis and Modeling. Wetlands 2023, 43, 103. [Google Scholar] [CrossRef]
  7. Xiong, Y.; Zhang, Z.; Fu, M.; Wang, L.; Li, S.; Wei, C.; Wang, L. Analysis of Vegetation Cover Change in the Geomorphic Zoning of the Han River Basin Based on Sustainable Development. Remote Sens. 2023, 15, 4916. [Google Scholar] [CrossRef]
  8. Gao, C.; Ren, X.; Fan, L.; He, H.; Zhang, L.; Zhang, X.; Li, Y.; Zeng, N.; Chen, X. Assessing the Vegetation Dynamics and Its Influencing Factors in Central Asia from 2001 to 2020. Remote Sens. 2023, 15, 4670. [Google Scholar] [CrossRef]
  9. Ding, J.; Zhao, W.; Daryanto, S.; Wang, L.; Fan, H.; Feng, Q.; Wang, Y. The spatial distribution and temporal variation of desert riparian forests and their influencing factors in the downstream Heihe River basin, China. Hydrol. Earth Syst. Sci. 2017, 21, 2405–2419. [Google Scholar] [CrossRef]
  10. Shijie, P.; Lei, W.; Yongkun, L.; Ruowen, W.; Tianming, G.; Zongjun, G. A study on ecohydrological mutual feedback relationship of the Shangdong River basin based on hydrological connectivity. Sci. Total Environ. 2024, 927, 171957. [Google Scholar] [CrossRef]
  11. Wang, J.; Wang, K.; Zhang, M.; Zhang, C. Impacts of climate change and human activities on vegetation cover in hilly southern China. Ecol. Eng. 2015, 81, 451–461. [Google Scholar] [CrossRef]
  12. Mehmood, K.; Anees, S.A.; Rehman, A.; Pan, S.; Tariq, A.; Zubair, M.; Liu, Q.; Rabbi, F.; Khan, K.A.; Luo, M. Exploring spatiotemporal dynamics of NDVI and climate-driven responses in ecosystems: Insights for sustainable management and climate resilience. Ecol. Inform. 2024, 80, 102532. [Google Scholar] [CrossRef]
  13. Faheem, Z.; Kazmi, J.H.; Shaikh, S.; Arshad, S.; Mohammed, S. Random forest-based analysis of land cover/land use LCLU dynamics associated with meteorological droughts in the desert ecosystem of Pakistan. Ecol. Indic. 2024, 159, 111670. [Google Scholar] [CrossRef]
  14. Emamian, A.; Rashki, A.; Kaskaoutis, D.G.; Gholami, A.; Opp, C.; Middleton, N. Assessing vegetation restoration potential under different land uses and climatic classes in northeast Iran. Ecol. Indic. 2021, 122, 107325. [Google Scholar] [CrossRef]
  15. Sun, Y.-L.; Shan, M.; Pei, X.-R.; Zhang, X.-K.; Yang, Y.-L. Assessment of the impacts of climate change and human activities on vegetation cover change in the Haihe River basin, China. Phys. Chem. Earth 2020, 115, 102834. [Google Scholar] [CrossRef]
  16. Zhang, H.; Li, L.; Zhao, X.; Chen, F.; Wei, J.; Feng, Z.; Hou, T.; Chen, Y.; Yue, W.; Shang, H.; et al. Changes in Vegetation NDVI and Its Response to Climate Change and Human Activities in the Ferghana Basin from 1982 to 2015. Remote Sens. 2024, 16, 1296. [Google Scholar] [CrossRef]
  17. Yan, W.; Wang, H.; Jiang, C.; Jin, S.; Ai, J.; Sun, O.J. Satellite view of vegetation dynamics and drivers over southwestern China. Ecol. Indic. 2021, 130, 108074. [Google Scholar] [CrossRef]
  18. Yang, S.; Liu, J.; Wang, C.; Zhang, T.; Dong, X.; Liu, Y. Vegetation dynamics influenced by climate change and human activities in the Hanjiang River Basin, central China. Ecol. Indic. 2022, 145, 109586. [Google Scholar] [CrossRef]
  19. Liu, Y.; Zhang, X.; Du, X.; Du, Z.; Sun, M. Alpine grassland greening on the Northern Tibetan Plateau driven by climate change and human activities considering extreme temperature and soil moisture. Sci. Total Environ. 2024, 916, 169995. [Google Scholar] [CrossRef]
  20. Wang, J.; Xu, C. Geodetector: Principle and prospective. Acta Geogr. Sin. 2017, 72, 116–134. [Google Scholar]
  21. Kang, Y.; Guo, E.; Wang, Y.; Bao, Y.; Bao, Y.; Mandula, N. Monitoring Vegetation Change and Its Potential Drivers in Inner Mongolia from 2000 to 2019. Remote Sens. 2021, 13, 3357. [Google Scholar] [CrossRef]
  22. He, P.; Bi, R.-T.; Xu, L.-S.; Wang, J.-S.; Cao, C.-B. Using geographical detection to analyze responses of vegetation growth to climate change in the Loess Pla-teau, China. Ying Yong Sheng Tai Xue Bao = J. Appl. Ecol. 2022, 33, 448–456. [Google Scholar]
  23. Zhu, L.; Meng, J.; Zhu, L. Applying Geodetector to disentangle the contributions of natural and anthropogenic factors to NDVI variations in the middle reaches of the Heihe River Basin. Ecol. Indic. 2020, 117, 106545. [Google Scholar] [CrossRef]
  24. Whetton, R.; Zhao, Y.; Shaddad, S.; Mouazen, A.M. Nonlinear parametric modelling to study how soil properties affect crop yields and NDVI. Comput. Electron. Agric. 2017, 138, 127–136. [Google Scholar] [CrossRef]
  25. Han, Q.; Xue, L.; Qi, T.; Liu, Y.; Yang, M.; Chu, X.; Liu, S. Assessing the Impacts of Future Climate and Land-Use Changes on Streamflow under Multiple Scenarios: A Case Study of the Upper Reaches of the Tarim River in Northwest China. Water 2024, 16, 100. [Google Scholar] [CrossRef]
  26. Liao, S.; Xue, L.; Dong, Z.; Zhu, B.; Zhang, K.; Wei, Q.; Fu, F.; Wei, G. Cumulative ecohydrological response to hydrological processes in arid basins. Ecol. Indic. 2020, 111, 106005. [Google Scholar] [CrossRef]
  27. Xue, L.; Wang, J.; Zhang, L.; Wei, G.; Zhu, B. Spatiotemporal analysis of ecological vulnerability and management in the Tarim River Basin, China. Sci. Total Environ. 2019, 649, 876–888. [Google Scholar] [CrossRef] [PubMed]
  28. Huang, T.; Pang, Z. Changes in groundwater induced by water diversion in the Lower Tarim River, Xinjiang Uygur, NW China: Evidence from environmental isotopes and water chemistry. J. Hydrol. 2010, 387, 188–201. [Google Scholar] [CrossRef]
  29. Chen, Y.; Chen, Y.; Xu, C.; Ye, Z.; Li, Z.; Zhu, C.; Ma, X. Effects of ecological water conveyance on groundwater dynamics and riparian vegetation in the lower reaches of Tarim River, China. Hydrol. Process. 2010, 24, 170–177. [Google Scholar] [CrossRef]
  30. Hao, X.; Li, W.; Huang, X.; Zhu, C.; Ma, J. Assessment of the groundwater threshold of desert riparian forest vegetation along the middle and lower reaches of the Tarim River, China. Hydrol. Process. 2010, 24, 178–186. [Google Scholar] [CrossRef]
  31. Zhu, C.; Shen, Q.; Zhang, K.; Zhang, X.; Li, J. Multiscale Detection and Assessment of Vegetation Eco-Environmental Restoration following Ecological Water Compensation in the Lower Reaches of the Tarim River, China. Remote Sens. 2022, 14, 5855. [Google Scholar] [CrossRef]
  32. Wang, S.; Zhou, K.; Zuo, Q.; Wang, J.; Wang, W. Land use/land cover change responses to ecological water conveyance in the lower reaches of Tarim River, China. J. Arid. Land 2021, 13, 1274–1286. [Google Scholar] [CrossRef]
  33. Yan, W.; Ma, X.; Liu, Y.; Qian, K.; Yang, X.; Li, J.; Wang, Y. Ecological Assessment of Terminal Lake Basins in Central Asia under Changing Landscape Patterns. Remote Sens. 2022, 14, 4842. [Google Scholar] [CrossRef]
  34. Zhao, X.; Xu, H.; Zhang, Q.; Liu, K. Whether the ecological benefits will continue to increase as usual and improve under the background of continuous ecological water delivery?—Taking the Lower Tarim River in China as an example. Ecol. Indic. 2024, 159, 111733. [Google Scholar] [CrossRef]
  35. He, J.; Yang, K.; Tang, W.; Lu, H.; Qin, J.; Chen, Y.; Li, X. The first high-resolution meteorological forcing dataset for land process studies over China. Sci. Data 2020, 7, 25. [Google Scholar] [CrossRef] [PubMed]
  36. Yang, K.; He, J.; Tang, W.; Qin, J.; Cheng, C.C.K. On downward shortwave and longwave radiations over high altitude regions: Observation and modeling in the Tibetan Plateau. Agric. For. Meteorol. 2010, 150, 38–46. [Google Scholar] [CrossRef]
  37. Ren, Z.; Tian, Z.; Wei, H.; Liu, Y.; Yu, Y. Spatiotemporal evolution and driving mechanisms of vegetation in the Yellow River Basin, China during 2000–2020. Ecol. Indic. 2022, 138, 108832. [Google Scholar] [CrossRef]
  38. Sen, P.K. Estimates of the Regression Coefficient Based on Kendall’s Tau. J. Am. Stat. Assoc. 1968, 63, 1379–1389. [Google Scholar] [CrossRef]
  39. Kendall, M.G. Rank Correlation Methods. Br. J. Psychol. 1990, 25, 86–91. [Google Scholar] [CrossRef]
  40. Mann, H.B. Non-parametric tests against trend. Econometrica 1945, 13, 245. [Google Scholar] [CrossRef]
  41. Hurst, H.E. Long-Term Storage Capacity of Reservoirs. Trans. Am. Soc. Civ. Eng. 1951, 116, 770–799. [Google Scholar] [CrossRef]
  42. Mandelbrot, B.B.; Wallis, J.R. Robustness of the rescaled range R/S in the measurement of noncyclic long run statistical dependence. Water Resour. Res. 1969, 5, 967–988. [Google Scholar] [CrossRef]
  43. Bai, Y. Analysis of vegetation dynamics in the Qinling-Daba Mountains region from MODIS time series data. Ecol. Indic. 2021, 129, 108029. [Google Scholar] [CrossRef]
  44. Gu, Z.; Duan, X.; Shi, Y.; Li, Y.; Pan, X. Spatiotemporal variation in vegetation coverage and its response to climatic factors in the Red River Basin, China. Ecol. Indic. 2018, 93, 54–64. [Google Scholar] [CrossRef]
  45. Wang, B.; Xu, G.; Li, P.; Li, Z.; Zhang, Y.; Cheng, Y.; Jia, L.; Zhang, J. Vegetation dynamics and their relationships with climatic factors in the Qinling Mountains of China. Ecol. Indic. 2020, 108, 105719. [Google Scholar] [CrossRef]
  46. Hu, R.; Wang, Y.; Chang, J.; Istanbulluoglu, E.; Guo, A.; Meng, X.; Li, Z.; He, B.; Zhao, Y. Coupling water cycle processes with water demand routes of vegetation using a cascade causal modeling approach in arid inland basins. Sci. Total Environ. 2022, 840, 156492. [Google Scholar] [CrossRef] [PubMed]
  47. Yu, Z.; Zhang, Y.; Wang, P.; Yu, J.; Wang, T.; Shi, S. Detection of the nonlinear response of vegetation to terrestrial water storage changes in central Asian endorheic basins. Ecol. Indic. 2023, 154, 110901. [Google Scholar] [CrossRef]
  48. Song, J.; Betz, F.; Aishan, T.; Halik, U.; Abliz, A. Impact of water supply on the restoration of the severely damaged riparian plants along the Tarim River in Xinjiang, Northwest China. Ecol. Indic. 2024, 158, 111570. [Google Scholar] [CrossRef]
  49. Liu, Q.; Dai, H.; Gui, D.; Hu, B.X.; Ye, M.; Wei, G.; Qin, J.; Zhang, J. Evaluation and optimization of the water diversion system of ecohydrological restoration megaproject of Tarim River, China, through wavelet analysis and a neural network. J. Hydrol. 2022, 608, 127586. [Google Scholar] [CrossRef]
  50. Huang, F.; Ochoa, C.G.; Chen, X.; Zhang, D. Modeling oasis dynamics driven by ecological water diversion and implications for oasis restoration in arid endorheic basins. J. Hydrol. 2021, 593, 125774. [Google Scholar] [CrossRef]
  51. Liu, L.; Wang, Y.; Wang, Z.; Li, D.; Zhang, Y.; Qin, D.; Li, S. Elevation-dependent decline in vegetation greening rate driven by increasing dryness based on three satellite NDVI datasets on the Tibetan Plateau. Ecol. Indic. 2019, 107, 105569. [Google Scholar] [CrossRef]
  52. Brinkmann, K.; Dickhoefer, U.; Schlecht, E.; Buerkert, A. Quantification of Aboveground Rangeland Productivity and Anthropogenic Degradation on the Arabian Peninsula Using Landsat Imagery and Field Inventory Data. Remote Sens. Environ. 2011, 115, 465–474. [Google Scholar] [CrossRef]
  53. Shi, S.; Yu, J.; Wang, F.; Wang, P.; Jin, K. Quantitative contributions of climate change and human activities to vegetation changes over multiple time scales on the loess plateau. Sci. Total Environ. 2021, 755 Pt 2, 142419. [Google Scholar] [CrossRef]
  54. Jiang, L.; Jiapaer, G.; Bao, A.; Guo, H.; Ndayisaba, F. Vegetation dynamics and responses to climate change and human activities in Central Asia. Sci. Total Environ. 2017, 599, 967–980. [Google Scholar] [CrossRef]
Figure 1. Schematic diagram of the LRTR: (a) geographical location of the Tarim River Basin in China; (b) geographical location of the LRTR in the Tarim River Basin; (c) elevation and river distribution in the LRTR.
Water 16 02157 g001
Figure 2. Diagram of the study data: (a) average NDVI; (b) annual precipitation (mm); (c) annual average temperature (°C); (d) elevation (m); (e) slope (°); (f) distance to the river channel (m).
Water 16 02157 g002
Figure 3. Interannual variation of NDVI: (a) overall changes in NDVI and AEWCV; (b) changes in the proportion of areas classified by different NDVI.
Water 16 02157 g003
Figure 4. The changing trends of NDVI from: (a) 2000 to 2005, (b) 2005 to 2010, (c) 2010 to 2015, (d) 2015 to 2020, and (e) 2000 to 2020.
Water 16 02157 g004
Figure 5. The proportion of areas with different trends in NDVI from: (a) 2000 to 2005, (b) 2005 to 2010, (c) 2010 to 2015, (d) 2015 to 2020, and (e) 2000 to 2020 (portions less than 2% do not display specific numbers).
Water 16 02157 g005
Figure 6. The Hurst exponent of (a) NDVI and (b) its future trends.
Water 16 02157 g006
Figure 7. Driving factors of NDVI change in different regions.
Water 16 02157 g007
Figure 8. Spatial distribution of the contributions of (a) climatic change and (b) human activity to NDVI change.
Water 16 02157 g008
Figure 9. The result of factor detection (** indicates p < 0.01, significant by testing).
Water 16 02157 g009
Figure 10. Interaction between factors.
Water 16 02157 g010
Table 1. The classification of NDVI changes.
Sen’s SlopeZ ValueTrend Characteristics
β > 0 2.58 < Z Extremely significant increased
1.96 < Z 2.58 significant increased
1.65 < Z 1.96 slightly significant increased
Z 1.65 Non-significant increased
β = 0 0No changes
β < 0 Z 1.65 Non-significant decreased
1.65 < Z 1.96 slightly significant decreased
1.96 < Z 2.58 significant decreased
2.58 < Z Extremely significant decreased
Table 2. Classification of vegetation change trends.
HurstSen’s SlopeFuture Trends
0.5 < H < 1 β > 0 Improvement
β < 0 Degradation
H = 0.5 -Uncertain
0 < H < 0.5 β > 0 Degradation
β < 0 Improvement
Table 3. Classification criterion of the driving factors of NDVI change.
Slope (NDVIobs)Driving FactorsDivision CriteriaContribution Rate/%
Slope (NDVICC)Slope (NDVIHA)Climate Change (CC)Human Activity (HA)
>0CC&HA>0>0 S l o p e ( N D V I C C ) S l o p e ( N D V I o b s ) S l o p e ( N D V I H A ) S l o p e ( N D V I o b s )
CC>0<01000
HA<0>00100
<0 CC&HA <0<0 S l o p e ( N D V I C C ) S l o p e ( N D V I o b s ) S l o p e ( N D V I H A ) S l o p e ( N D V I o b s )
CC<0>01000
HA>0<00100
Table 4. Symbols for each factor.
X1X2X3X4X5
annual precipitationannual average temperatureelevationslopedistance to the river channel
Table 5. The result of ecological detection.
X1X2X3X4X5
X1\
X2N\
X3NN\
X4NNN\
X5YYYY\
Note: Y indicates a significant difference exists between the two driving factors at the α = 0.05 level, while N indicates there is none.
Disclaimer/Publisher’s Note: The statements, opinions and data contained in all publications are solely those of the individual author(s) and contributor(s) and not of MDPI and/or the editor(s). MDPI and/or the editor(s) disclaim responsibility for any injury to people or property resulting from any ideas, methods, instructions or products referred to in the content.

