Article

Energy Loss and Noise Reduction of Centrifugal Pump Based on Bionic V-Groove Geometry

1
Daya Bay Nuclear Power Operations and Management Co., Ltd., Shenzhen 518124, China
2
National Research Center of Pumps, Jiangsu University, Zhenjiang 212013, China
3
Research Center of Fluid Machinery Engineering and Technology, Jiangsu University, Zhenjiang 212013, China
4
School of Mechanical Engineering, Jiangsu University of Technology, Changzhou 213001, China
5
School of Energy and Power Engineering, Jiangsu University, Zhenjiang 212013, China
*
Authors to whom correspondence should be addressed.
Water 2024, 16(15), 2183; https://doi.org/10.3390/w16152183
Submission received: 3 July 2024 / Revised: 25 July 2024 / Accepted: 31 July 2024 / Published: 1 August 2024

Abstract

:
The vortex shedding and shock generated inside the pump used in nuclear power plants during operation lead to energy loss and efficiency reduction, and the noise induced by the flow affects the system’s safety and reliability. The groove-type geometry of shark skin surface has features such as low hydraulic drag coefficient and low turbulence noise and has been widely applied in energy engineering. This study adopted computational fluid dynamics (CFD) and computational aerodynamic acoustics (CAA) methods to research the effects of Space-V-groove and V-groove bionic impellers on hydraulic performance and acoustic characteristics. In addition, the impacts of both bionic groove geometries on the external characteristics, wall shear stress, blade surface velocity, and vortex core distribution were compared and analyzed. The results found that Space-V-groove can effectively improve hydraulic performance. At the rated flow rate, the drag reduction rates of Space-V-groove and V-groove pumps are 2.86% and 1.82%, while the total sound pressure level is reduced by 1.36% and 1.2%, respectively. The Space-V-groove geometry is more effective in destroying the shedding vortex and trailing vortex, thereby modifying the turbulence in the impeller flow path and reducing energy loss and noise.

1. Introduction

Centrifugal pumps utilized in fire protection systems at nuclear power plants generate vortex shedding and shock inside the flow channel during operation, leading to energy losses and reduced efficiency [1,2]. Additionally, these pumps typically produce significant noise during operation [3,4,5]. Meanwhile, increasing efficiency and noise reduction can bring economic benefits to nuclear power plants, which is an urgent requirement for green ecological development.
Bionics is a scientific approach to optimizing the performance of engineering machinery by adapting the geometries or similar functions of biological creatures. Scientists have proposed that many creatures, such as dolphins and sharks, have non-smooth skins on their bodies after years of genetic variation and natural selection. Non-smooth skins are adaptable to the natural environment and have excellent properties such as drag reduction, noise reduction, and anti-adhesion [6,7]. In particular, the groove-type geometry of shark skin has features such as an outstanding low fluid drag coefficient and low turbulent noise. It is widely used in the energy engineering field. The application of bionic groove geometry in pumps provides a new method to decrease energy loss and noise. It has important theoretical significance and practical engineering value for promoting the development of centrifugal pump drag and noise reduction technology.
Yan et al. [8,9] designed an impeller with sinusoidal tubercle trailing edges (STTE) based on bionic optimization and evaluated it using entropy production theory (EPT), and concluded that the STTE impeller can reduce the total energy consumption. Ma et al. [10] designed a bionic non-smooth surface on the blade backside according to the wear characteristics, and this method improved the anti-wear performance of the blade. Dai et al. [11,12] investigated the effect of impellers with sawtooth and pit bionic geometries on the noise reduction capability of centrifugal pumps. The sawtooth structure effectively suppresses discrete noise at blade pass frequency (BPF) and harmonics but not for high-frequency noise. In addition, it is also pointed out that the average shear stress on the wall is a useful indicator for evaluating resistance and noise reduction. Tian et al. [13,14] developed a centrifugal pump with a bionic coupling impeller. Polyurethane coupled with a non-smooth surface can modify turbulence and increase the pump’s efficiency and high-efficiency range. Wang et al. [15] used non-smooth geometry to design a bionic oil well pump with friction and wear reduction, which improved the stress on the plunger surface and reduced wear. Liu et al. [16,17] developed a bionic structure guide vane based on the wavy structure of the fins using the multi-objective particle swarm optimization (MOPSO) algorithm. It was found that the wavy trailing edge can depress the separation vortices, increasing the pump’s efficiency and head by 1.6% and 1.27%, respectively. Gu et al. [18,19] found that the circular groove blade has good anti-cavitation performance and can effectively reduce the probability of adverse incidence at critical cavitation. The impact of the bionic groove geometry on the hydraulic performance and acoustic characteristics of centrifugal pumps still needs to be determined. It is necessary to further research the effect and law of the bionic groove geometry to obtain its drag and noise reduction mechanism.
In practical application, the fire protection system of a nuclear power plant was equipped with four horizontal single-stage centrifugal pumps with a design flow rate of 342 m3/h, a head of 127.5 m, a motor power of 250 Kw, an operating voltage of 6600 V and a rated speed of 3000 rpm. The pump system was installed at −14 m and sucks water from the pool and transfers the medium to the pipe network. These pumps always had a loud noise after startup, but after monitoring the bearings, no bearing failures were found. Meanwhile, the pump was disassembled for inspection, but no abnormality was detected. It is further deduced that the noise of this pump mainly originates from the impeller. Therefore, the proposed study was carried out based on bionics to address the noise problem of this pump.
This paper investigated the effects of Space-V-groove and V-groove geometries on centrifugal pumps’ hydraulic and drag reduction performance through test and numerical simulation. The external characteristics, wall shear stress, and vortex core distribution characteristics of the two bionic grooved pumps were compared and analyzed. In addition, the acoustic finite element method (FEM) was used to study the acoustic power distribution and the spectrum characteristics of the internal field noise at different flow rates. The Space-V-groove bionic impeller is more effective in improving the drag and noise reduction capability. This work contributes to the optimal design of centrifugal pumps regarding energy consumption and noise reduction.

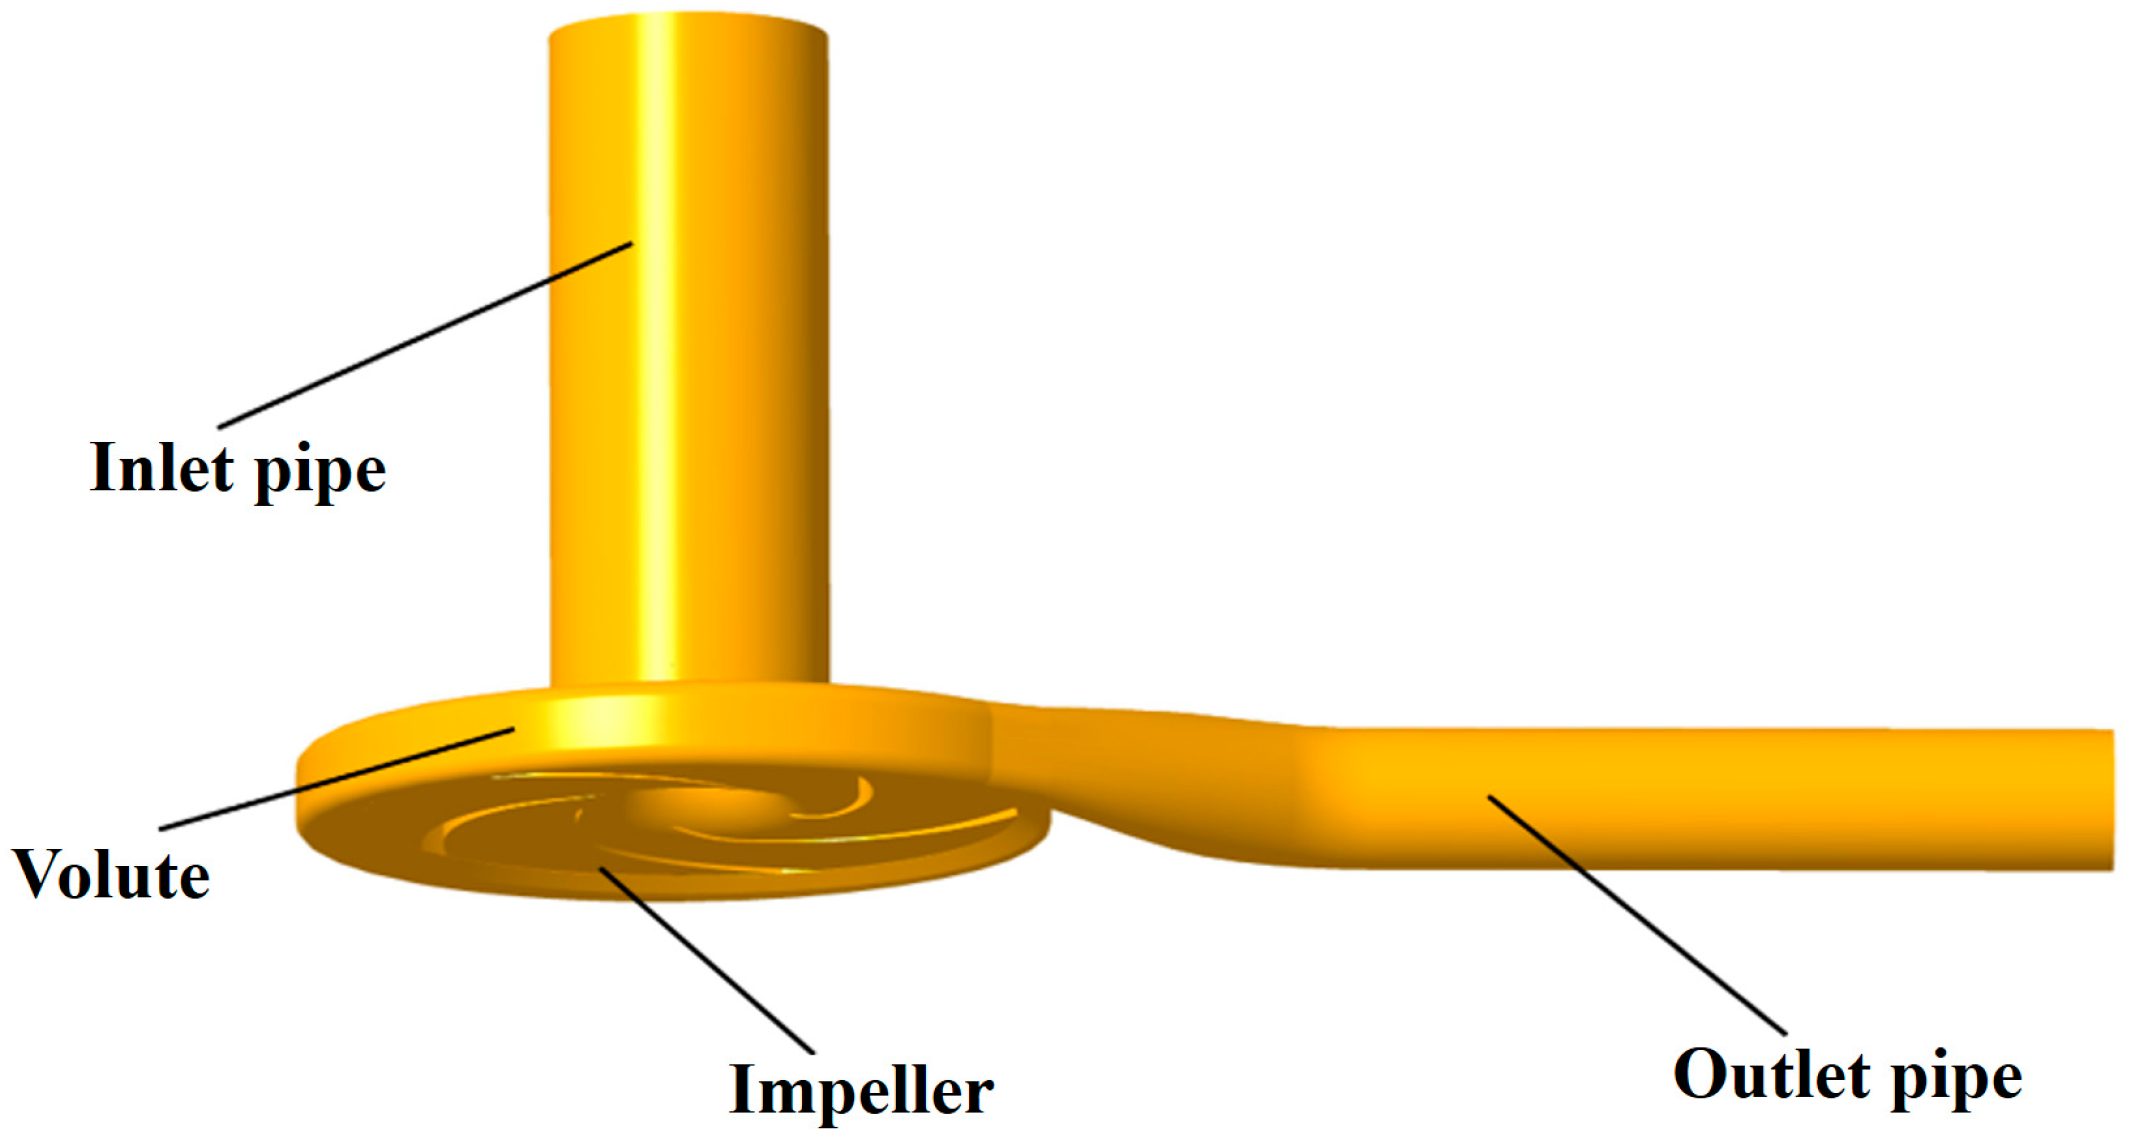
2. Research Model and Numerical Simulation Strategies

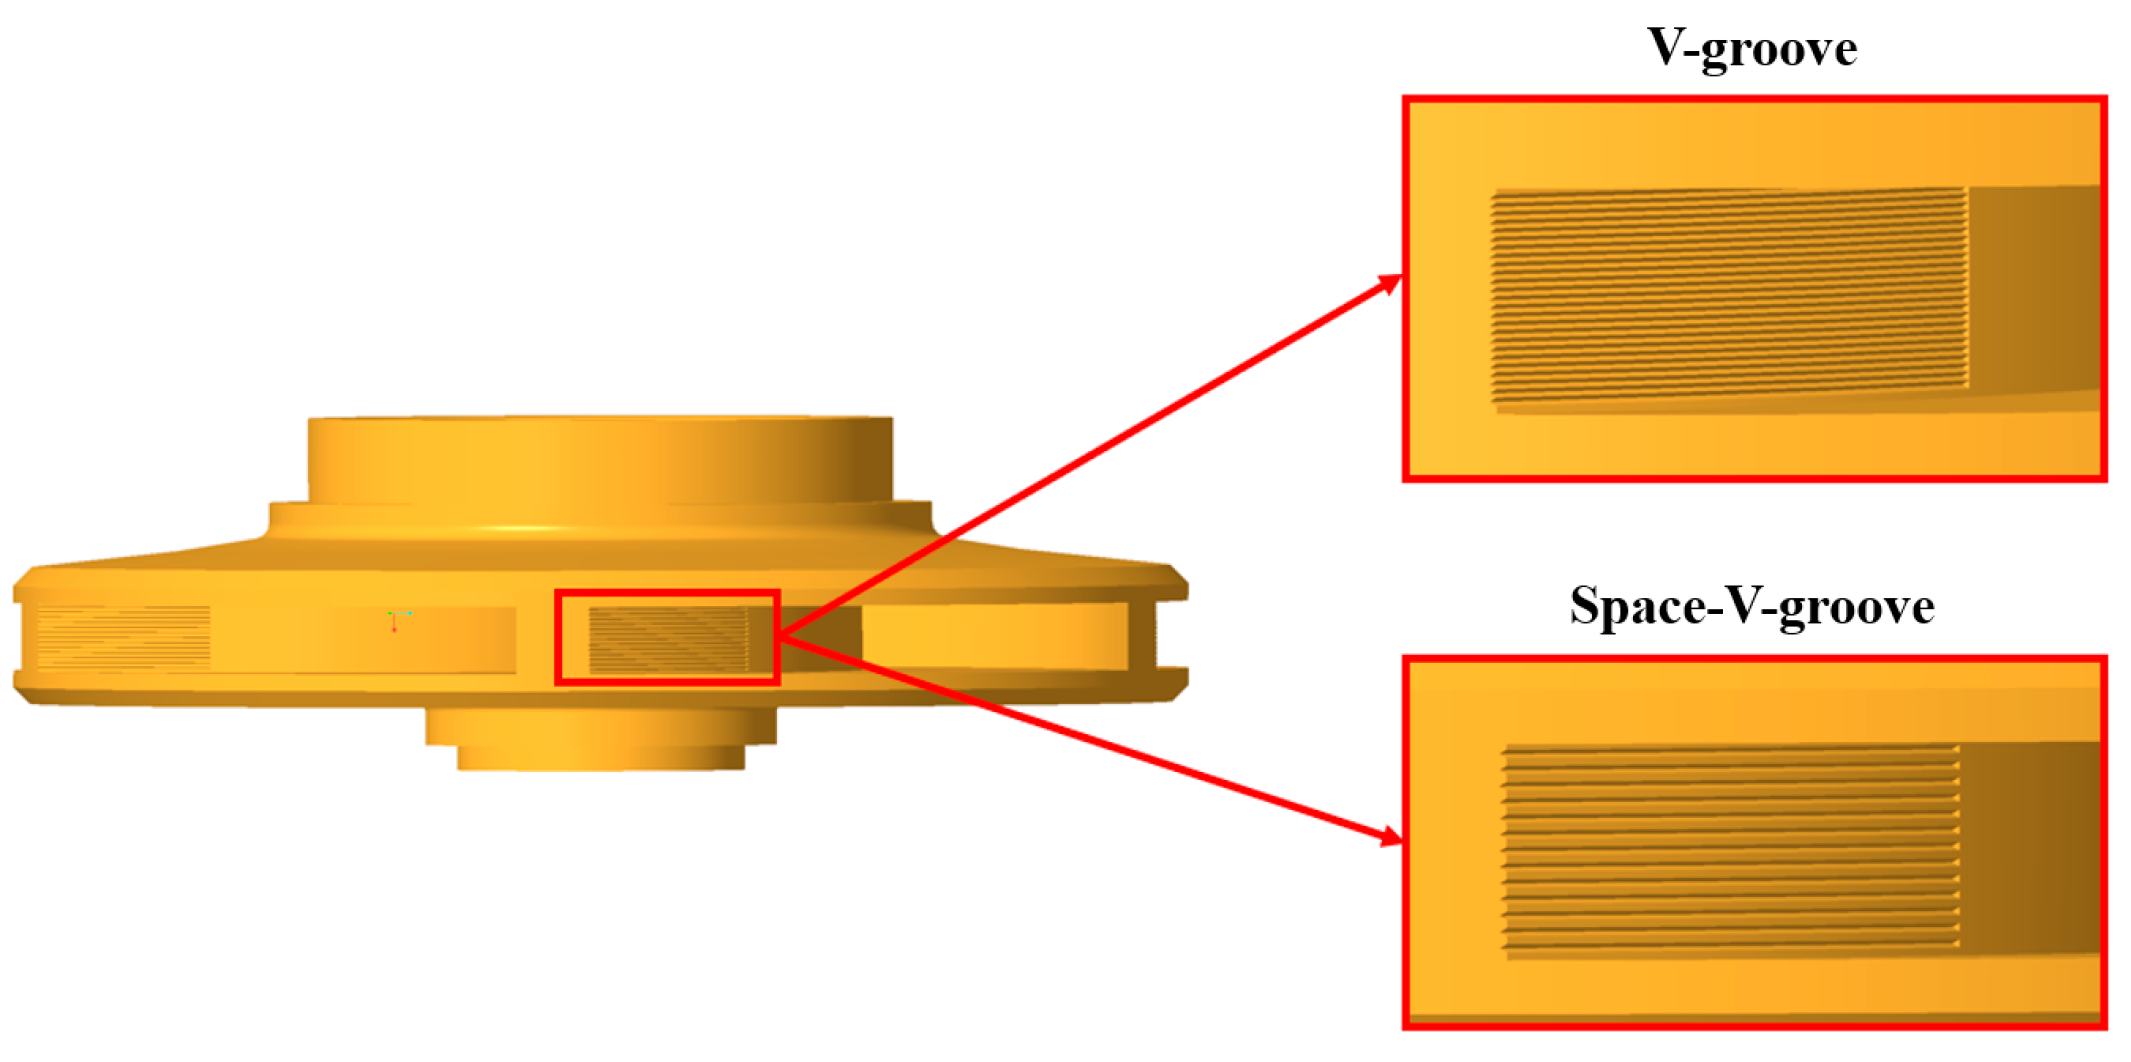
2.1. Bionic Groove Design

The object of the study is a centrifugal pump with a specific speed of ns = 50. Its primary design parameters are flow rate Qd = 10.6 m3/h, head H = 26 m, rotational speed n = 2900 r/min, and the primary parameters of the impeller and volute are given in Table 1.
The most studied bionic groove geometries are V-shaped, U-shaped, L-shaped, and Space-V-shaped [12]. Researchers have studied different types of bionic groove geometries to some extent, but there are fewer comparative studies on different bionic groove geometries in centrifugal pumps. Therefore, this work investigates the effect of V-groove and Space-V-groove geometries on hydraulic performance and acoustic characteristics. Figure 1 shows the two bionic groove geometries.
Walsh et al. [20] revealed that the bionic groove geometry has drag reduction properties with dimensionless height h+ ≤ 25 and width s+ ≤ 30. Based on this, the dimensionless height h+ and width s+ were both chosen to be 12 in this work. According to Equations (1) and (2), we can obtain s = h = 0.3 mm. In order to accurately compare the effects of the two bionic groove geometries on the performance of the centrifugal pump and reduce the effect of variances, the Space-V-groove dimensions are taken to be s = h = b = 0.3 mm.
h + = h u ν C f 2 ,
s + = s u ν C f 2 ,
where ν is the kinematic viscosity coefficient, u is the inflow velocity, and Cf is the frictional drag coefficient.
According to reference [8], the layout of the non-smooth surface at the blade trailing edge can achieve a significant drag reduction effect. In addition, the wall shear stress at the blade outlet of the centrifugal pump is high. Therefore, this paper places the bionic groove on the 1/3 area of the blade working surface near the outlet. Two types of impellers with bionic grooves are shown in Figure 2.
The computational domain is shown in Figure 3. Extended straight pipes were added at the impeller inlet and volute outlet to ensure a steady flow into the impeller without backflow. Meanwhile, the monitoring points of the internal flow field and internal sound field can correlate with the positions of the pressure pulsation sensor and hydrophones to better compare the simulation results with the test results.

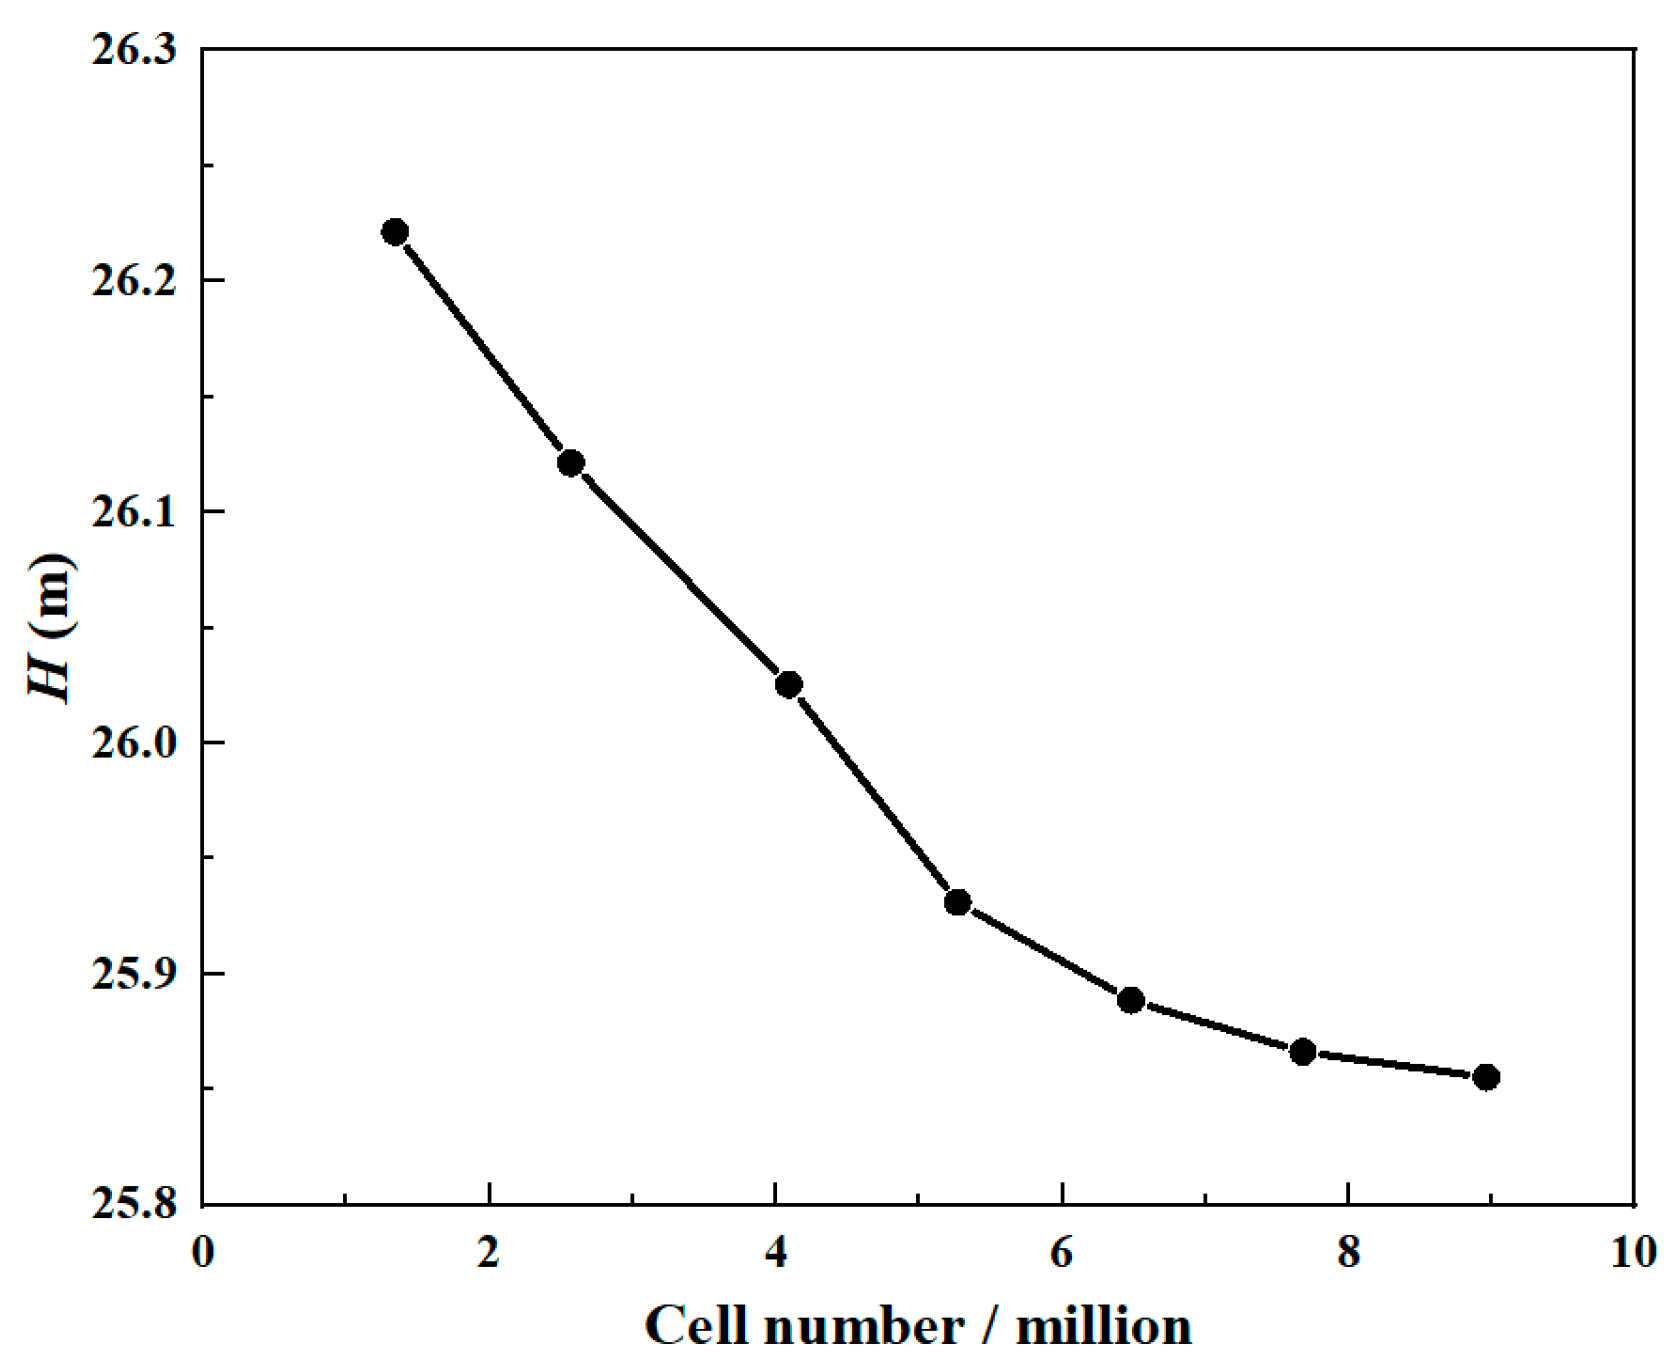
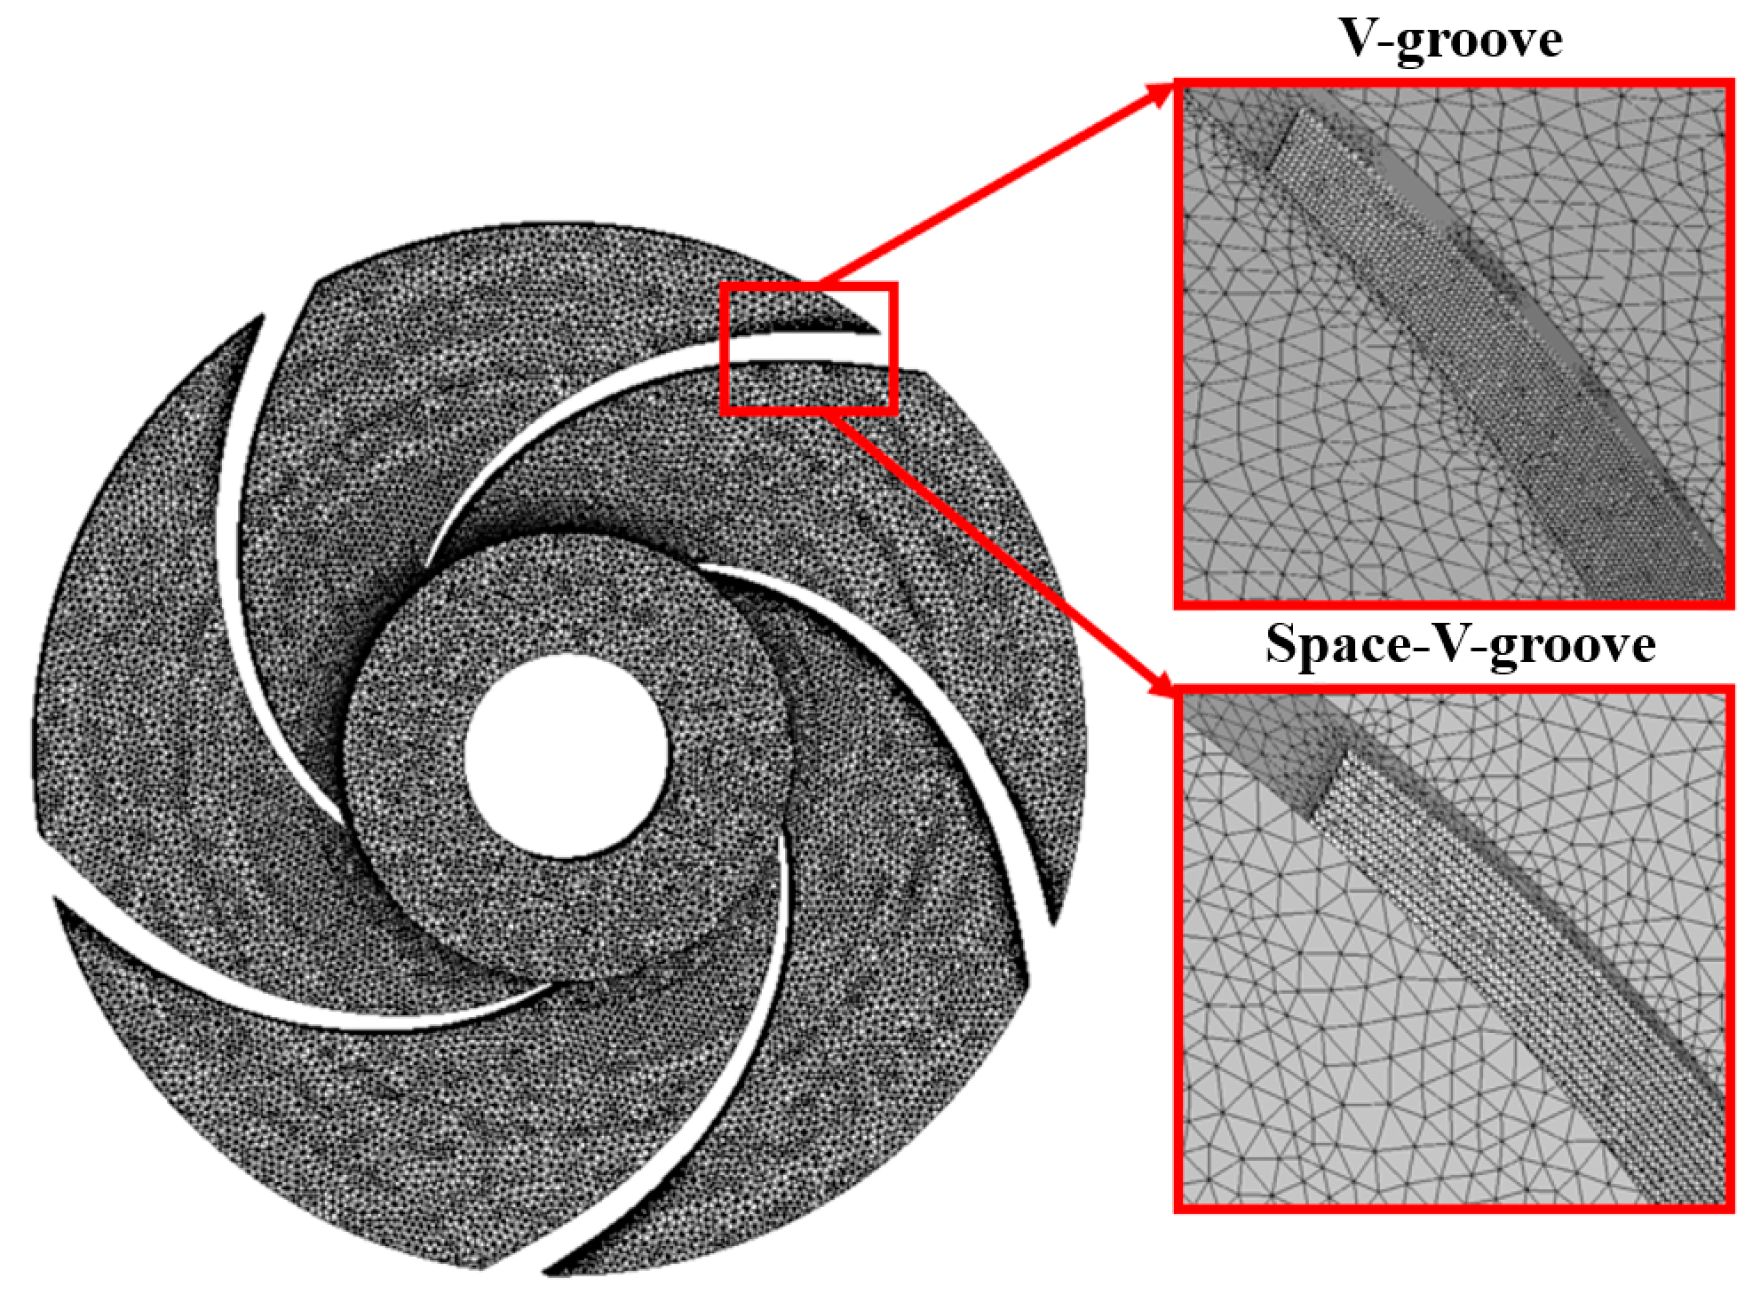
2.2. Grid Generation

2.2.1. Computational Fluid Dynamics Grid

Due to the tiny size of the grooves, it is challenging to build blocks for hexahedral meshing, which may cause low mesh quality. Moreover, considering that the bionic impellers need to be compared with the smooth model, the meshing method needs to be unified. Therefore, this paper adopted a tetrahedral grid to mesh the computational domain. When the numerical simulation of the flow field is carried out, the influence of the cell number on the accuracy and the time cost of the results needs to be considered comprehensively. A small number of cells can lead to low accuracy of calculation and an inability to capture the flow field variations correctly. Too many cells will lead to long computing time and unnecessary cost of resources. Hence, grid-independent verification is required to obtain an appropriate set of cells to capture the flow field variation accurately and minimize computational time costs. This work carried out grid-independent verification for seven sets of grids, and the heads of the prototype pump at each cell number are shown in Figure 4. The head is gradually stabilized at a cell number of 7.8 million, which is sufficient for numerical simulation.
It is necessary to increase the mesh density of the bionic groove to accurately capture the flow structure at the bionic surface. The heads of the two bionic pumps with different numbers of grids are shown in Figure 5. The head tends to stabilize at a cell number of about 10 million for the V-groove pump. Furthermore, for the Space-V-groove pump, the number of cells needed is around 9 million. Therefore, these two sets of grids were selected for the study. The maximum cell size of the impeller is set to 1.3 mm, and the cell size of the groove surface is set to 0.3 mm. The height of the boundary layer grid is set to 0.1 mm, and the maximum y+ is controlled to be less than 80. The bionic impeller and the local mesh of the grooves are shown in Figure 6.

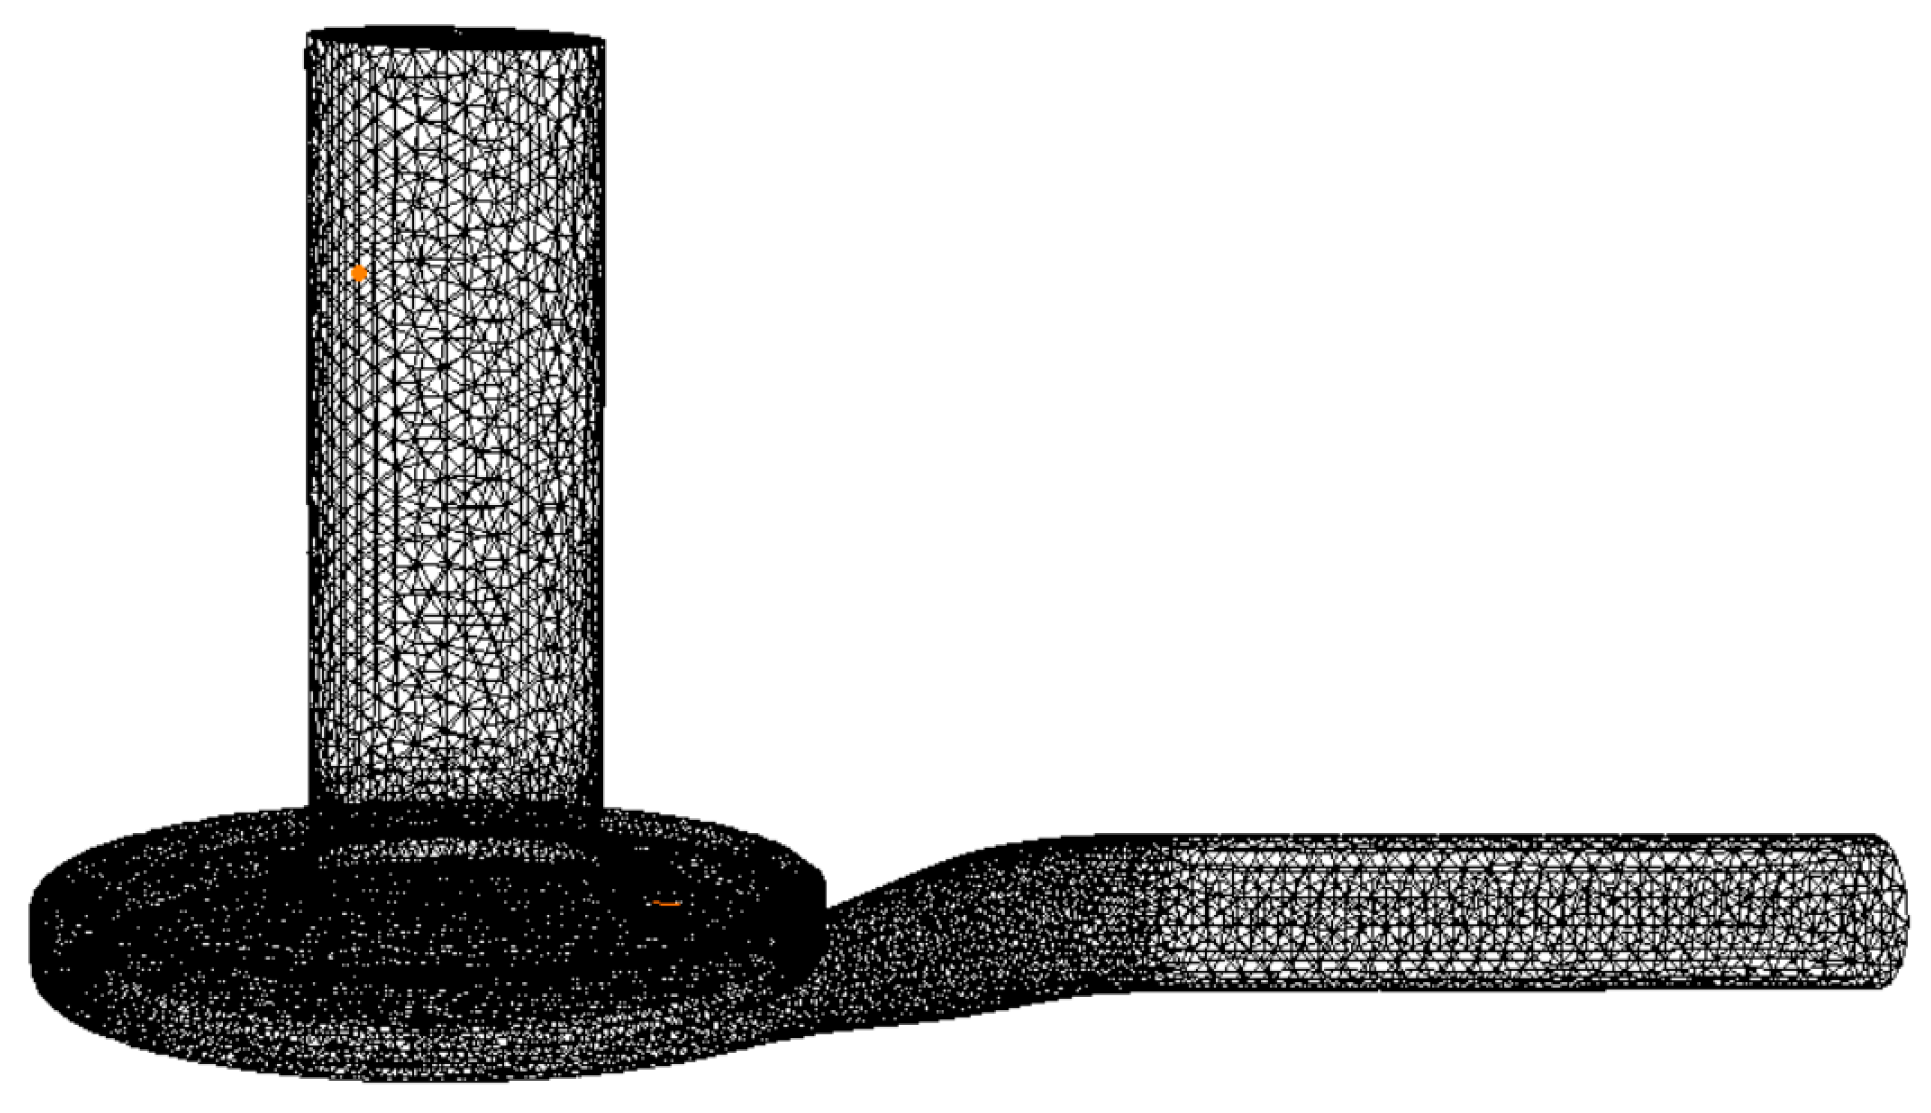
2.2.2. Computational Aeroacoustics Grid

Computational aeroacoustics has strict requirements on the acoustic grid size, which needs to meet the relationship with the computed frequency, as Equation (3).
f max = c 6 L
where L is the cell length and c is the medium’s sound propagation speed. The sound speed in the water is 1500 m/s, and fmax is the maximum frequency that can be calculated.
The highest frequency, fmax = 2000 Hz, is calculated in this paper, so the cell length of the acoustic grid must be satisfied as follows:
L c 6 f max
That is, L ≤ 0.125 m. Meanwhile, the refraction and reflection of sound waves should be considered. If the mesh is too rough, it will affect the calculation accuracy. Therefore, this paper set the impeller and volute acoustic grid size to 3 mm and the inlet and outlet pipe grid size to 6 mm. Figure 7 shows the acoustic grid.

2.3. Boundary Conditions

2.3.1. Flow Field Boundary Conditions

This paper applied ANSYS CFX software for the simulation of the flow field, and the standard k-ε model was chosen for the turbulence model. The standard k-ε turbulence model is universal and widely used in engineering. Moreover, it is also suitable for the bionic model to capture the internal flow field. The fluid medium is 25 °C water, the inlet pressure is set to 1 atm, and the outlet is mass flow rate. The rotor–stator interfaces are set to the transient rotor–stator, and the rotational speed is 2900 r/min. High resolution is used for the convection term, and second-order backward Euler is used for the transient term. The time step is 1° of impeller rotation, and the total time is the time of sixteen rotation cycles. The convergence criterion is set to 10−4.

2.3.2. Acoustic Boundary Conditions

LMS Virtual. Lab software was adopted for the numerical simulation of the internal acoustic field. The pressure pulsation data obtained by CFD are mapped onto the acoustic mesh based on the finite element method (FEM). If the inlet and outlet surfaces are not handled, the sound propagation to the inlet and outlet can be reflected, resulting in inaccurate variations in the internal field noise. In order to make the noise non-reflective at the inlet and outlet, the inlet and outlet walls need to be defined as fully absorbing properties and assume that the rest of the surfaces are fully reflective. Acoustic impedance Z = ρc = 1.5 × 10⁶ kg/(m2·s), where the speed of sound c is 1500 m/s. The monitoring point is determined according to the location of the hydrophone.

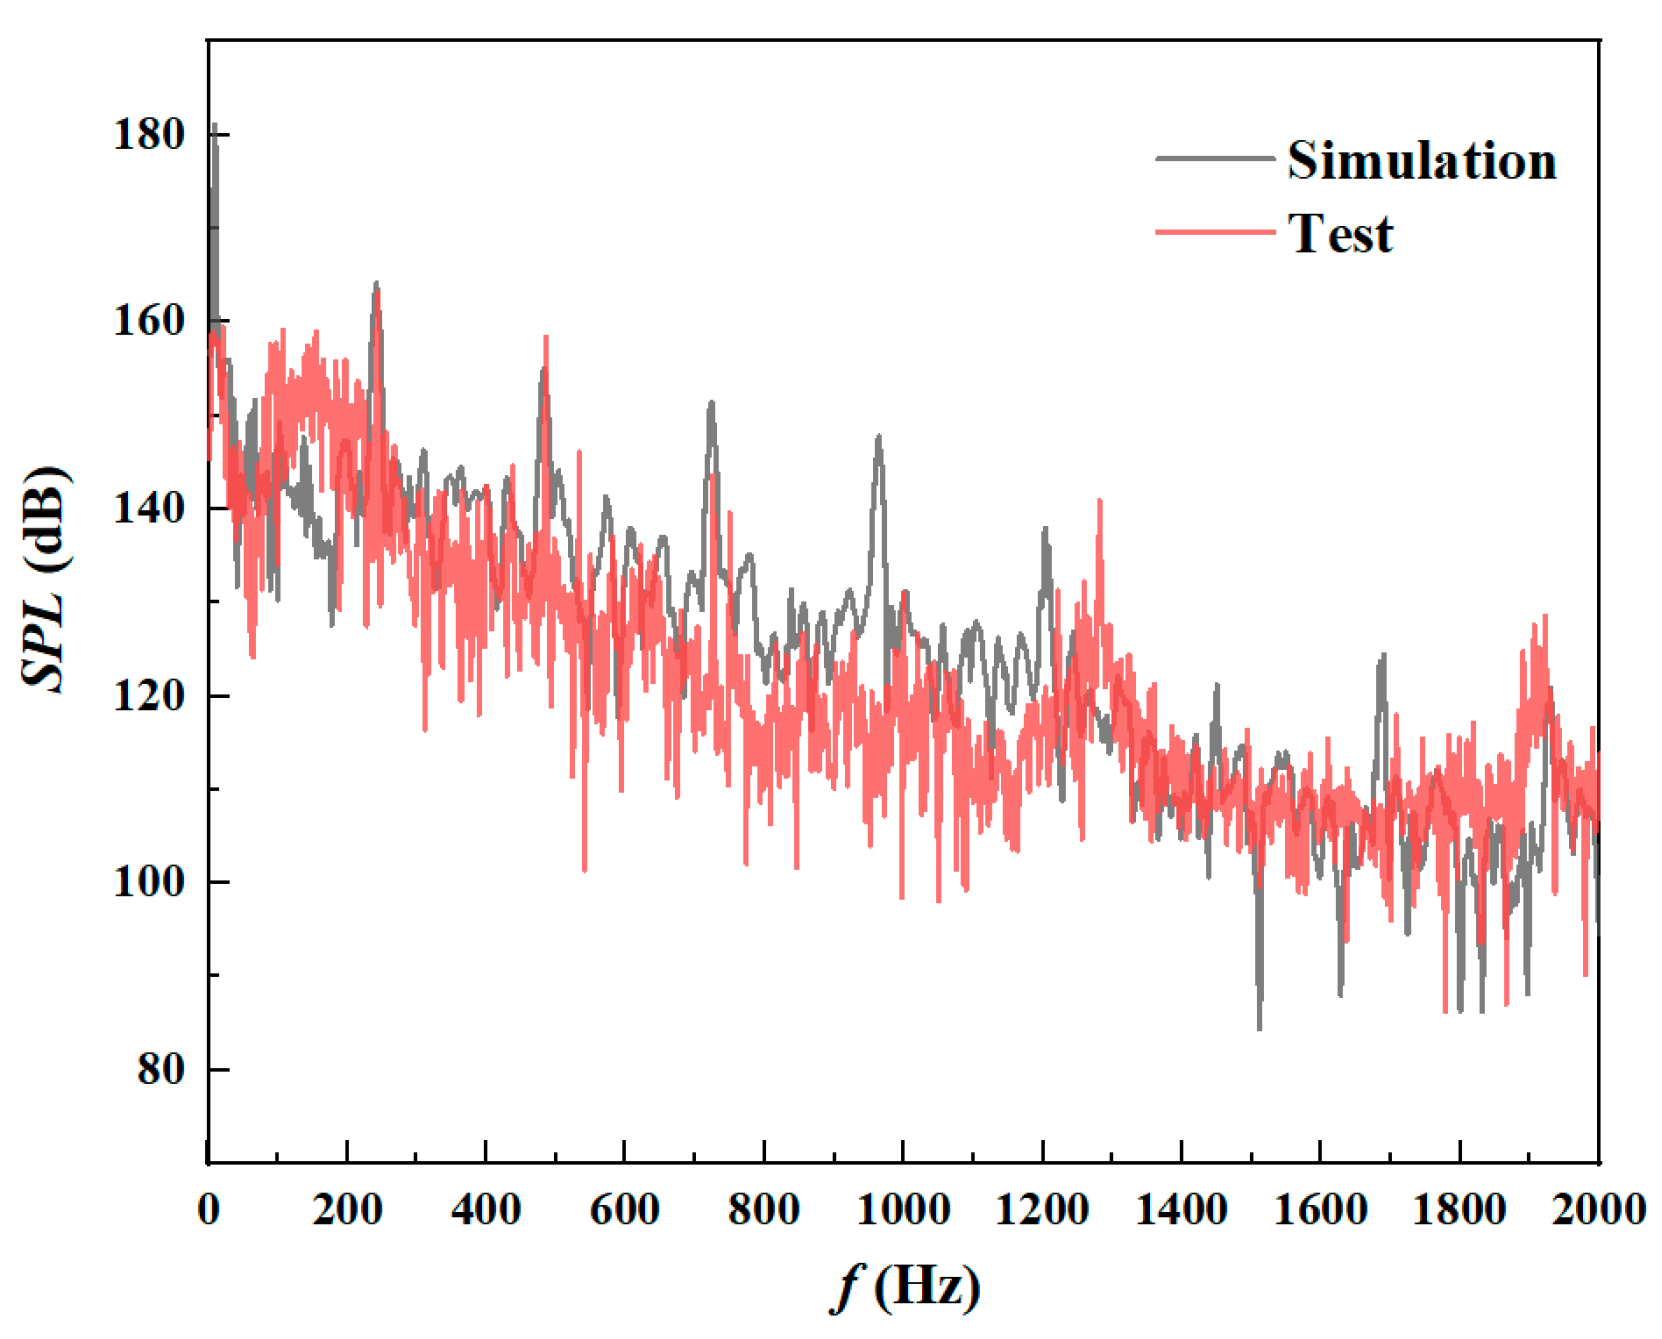
2.4. Test Verification

Figure 8 shows the results of the external characteristics of the prototype centrifugal pump for simulation and testing. The trends of head and efficiency with flow rate obtained from the test and simulation are consistent. Under the rated working condition, the simulated and tested heads are 26.72 m and 25.63 m, respectively, with an error of 4.08%; the efficiencies are 66.71% and 63.47%, respectively, with an error of 4.84%. In other working conditions, the head error is within 4%, and the efficiency error is within 5%. Therefore, the simulation method established in this paper has high accuracy.
Figure 9 displays the numerical simulation and test comparison of the sound pressure level (SPL) at the outlet of the inner sound field. The test results follow the same trend as the simulation results, with the main frequency at the blade pass frequency (BPF, 241.7 Hz). The test values are higher than the simulation below the BPF, while the opposite is valid after the BPF. The error in the broadband may be due to the simulation ignoring the scattering of the flow noise on the pipe wall.
In order to compare the test and simulation results more clearly, the test and simulation results both at the characteristic frequencies are shown in Table 2. The test value is higher than the simulation in the broadband below the BPF. The sound pressure level of the test at the axial frequency (AF, 48.3 Hz) is 143.8 dB, with the simulation value 142.6 dB, with an error of only 0.83%. From 1 BPF to 5 BPF, both show a decreasing trend as the frequency increases. At the 1 BPF (241.7 Hz), the sound pressure level obtained in the test is 160.1 dB, and the simulation is 162.9 dB, with an error of 1.10%. At 2 BPF, the test sound pressure level is 158.4 dB, and the simulated sound pressure level is 153.9 dB, with an error of 2.84%. At 3 BPF, the sound pressure level by the test is 143.6 dB, the simulated sound pressure level is 150.1 dB, and the error is 4.53%. After 5 BPF, the simulation result of the broadband noise basically overlaps with the test result, both fluctuating in the range of 105–115 dB. According to Equation (5), the total sound pressure level of the test result is 180.02 dB, and the total sound pressure level of the simulation is 183.34 dB, with an error of 1.81%.
O A S P L = 10 l g i = 1 n 10 S P L f i 10
OASPL is the total sound pressure level, SPL is the sound pressure level, and fi is the 1/3 octave center frequency. The internal field noise results obtained by simulation and test differ in some frequency bands. However, most of the characteristic frequency errors are very small, which can reflect regularities of the actual noise amplitude and frequency features.

3. Results and Discussion

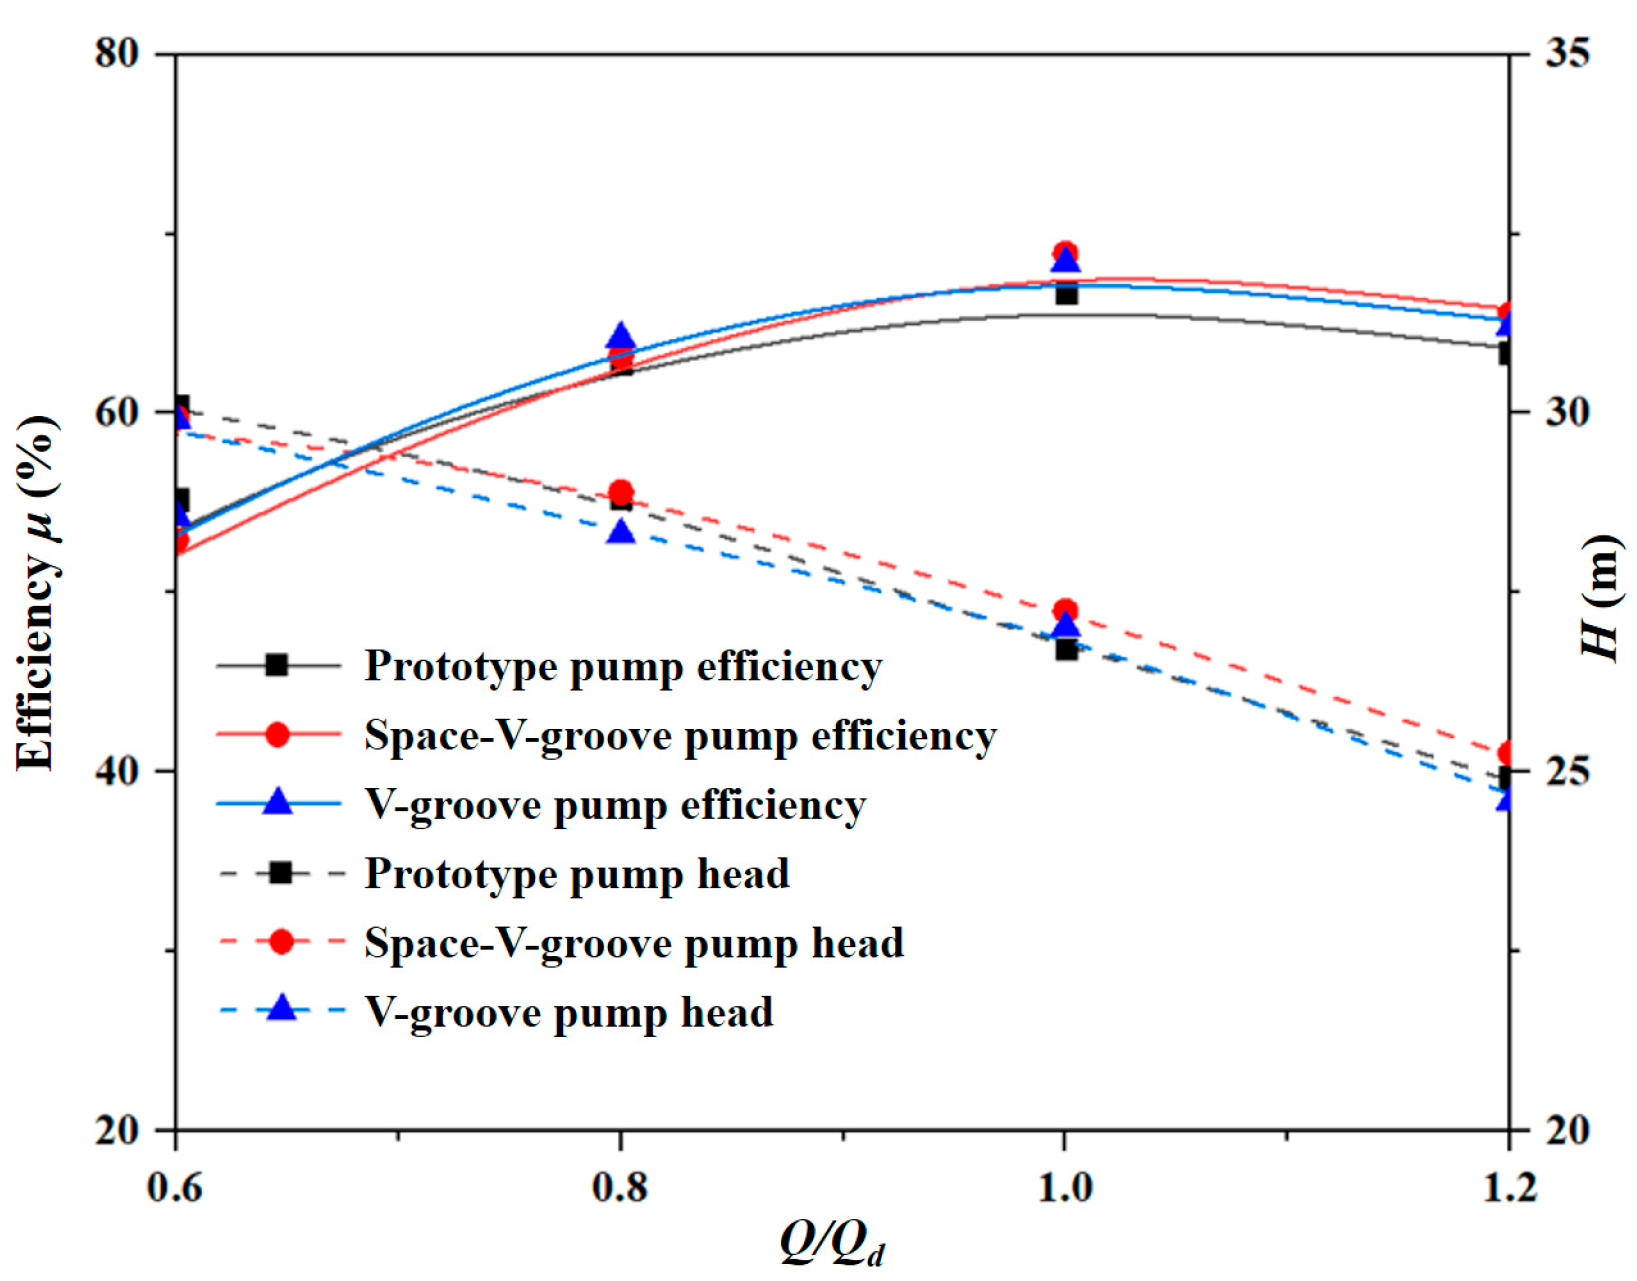
3.1. Impact of Bionic Grooved Blades on Hydraulic Performance

Figure 10 compares the hydraulic performance of the bionic grooved centrifugal pump and the prototype centrifugal pump. The head and efficiency of the two bionic grooves and the prototype centrifugal pumps show the same trend. In addition, bionic centrifugal pumps have lower heads than prototype centrifugal pumps at 0.6 Qd. As the flow rate increases, the head of the bionic pump begins to be higher than the prototype centrifugal pump. The head difference between the bionic and prototype pumps reaches its maximum at 1.0 Qd. The head difference between the Space-V and V-groove models and the prototype model are 0.66 m and 0.23 m, respectively. The head difference becomes smaller when the flow rate increases to 1.2 Qd. In this case, the Space-V and V-groove models are 0.58 m and 0.24 m, respectively. The Space-V-groove has a high effect on the head and remains effective at flow rates higher than 0.8 Qd. In contrast, the V-groove improves the head of centrifugal pumps at the design flow rate less significantly than the Space-V-groove.
To more clearly analyze the impact of the two bionic groove models on efficiency, increased efficiency δ η is introduced, which is expressed as follows:
δ η = η η 0 η 0
In the formula, η is the bionic pump’s efficiency and η0 is the prototype pump’s efficiency.
Table 3 shows the efficiency improvement of the bionic pump under different operating conditions. The efficiency improvement of the two bionic groove models is gradually obvious with the flow rate increase. At 0.6 Qd conditions, both bionic groove pumps are less efficient than the prototype pump, and the hydraulic performance of the centrifugal pump decreases. Moreover, the efficiency of both bionic groove pumps starts to improve from 0.8 Qd. At 1.0 Qd, the increased efficiency of the Space-V-groove pump increases by 3.3%, and the V-groove pump increases by 2.49%. Meanwhile, the Space-V-groove is also higher than the V-groove by 0.73% at 1.2 Qd. Therefore, the Space-V-groove provides better efficiency improvements than the V-groove, especially at rated flow conditions.

3.2. Analysis of Bionic Groove Blades on Drag Reduction

To obtain a clear perspective of the drag reduction effect of the bionic centrifugal pump, the drag reduction rate (DRR) was introduced, according to Gu et al. [21]. The drag reduction rate C can be expressed as follows:
C = N s N r N r × 100 %
where Ns is the torque of the prototype impeller and Nr is the torque of bionic impeller torque.
Table 4 displays the DRRs of the bionic groove model under different operating conditions. At 0.6 Qd, the torque of both bionic groove impellers is higher than that of the prototype impeller, and in this case, both bionic grooves have no drag reduction effect. However, the torque of both bionic groove impellers is less than the prototype impeller at 0.8 Qd. The best drag reduction is achieved at 1.0 Qd, which is 2.86% for the Space-V-groove and 1.82% for the V-groove. When the flow rate is further increased, the DRRs of both bionic groove impellers start to decrease. However, both are positive and still show the drag reduction effect. Both bionic groove models have a drag reduction effect, and the Space-V-groove is more effective than the V-groove in reducing drag.

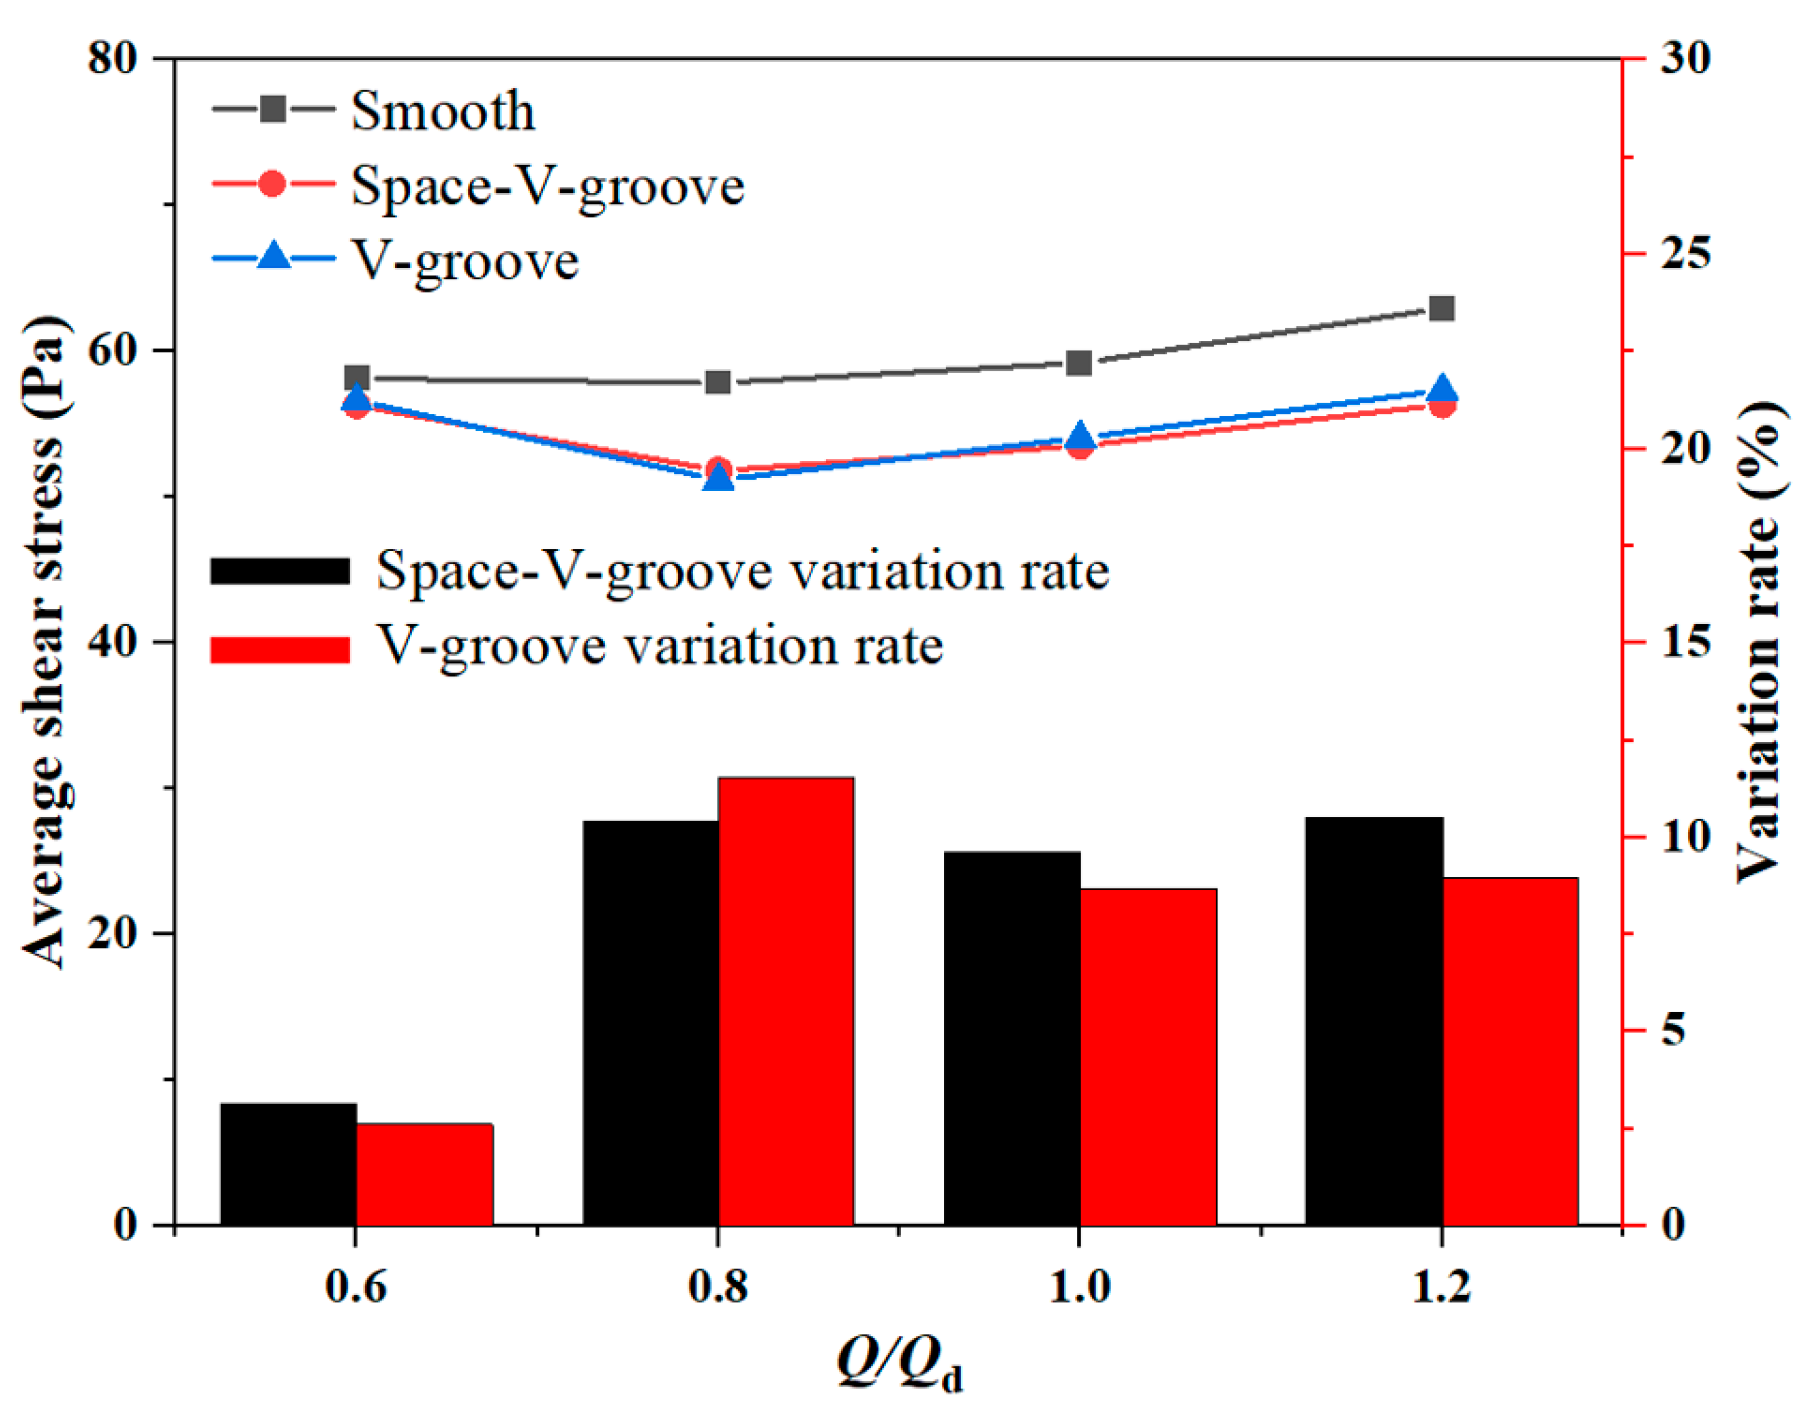
3.2.1. Wall Shear Stress Analysis

When fluid flows through the blade surface, the drag is dominated by the frictional stresses on the blade walls, including viscous shear stress and turbulent Reynolds stress. Viscous shear stress plays a significant role in the surface of the wall. Figure 11 shows the shear stress on different blade surfaces. The shear stress is high at the blade outlet, and the wall shear stress increases along the incoming flow direction for the smooth and the bionic groove blades. As the flow rate increases, the flow behavior in the pump is stabilized gradually. Meanwhile, the wall shear stress at the blade outlet position is still high. The fluid speed at the blade inlet is low, and the frictional drag between the fluid and the blade wall is small. Furthermore, near the blade outlet, the fluid velocity is higher, and the corresponding frictional drag is also considerable. The wall shear stresses at the outlet of the bionic groove blades are alleviated. The shear stress is high near the groove tips and low near the groove valleys. It indicates that the bionic groove geometry changes the distribution of shear stress on the blade surface, resulting in lower shear stress in the groove region compared to the smooth surface. At 0.6 Qd working condition, the bionic groove blade has prominent shear stress variation at the blade outlet with a slight shear stress gradient. As the flow rate increases, both bionic groove surfaces exhibit a decreasing effect on the wall shear stress.
Figure 12 shows the average shear stress on the blade’s surface. The wall shear stress of the smooth blade increases with increasing flow, while the wall shear stress of both bionic groove blades first decreases and then increases. The shear stress of the Space-V-groove blade is slightly higher than the V-groove at 0.6 Qd. Furthermore, at 1.0 Qd, the average wall shear stress is reduced by 9.59% for the Space-V-groove blade and 8.68% for the V-groove blade. As the flow rate increases to 1.2 Qd, the impact of the Space-V-groove on shear stress remains larger than that of the V-groove model, which is consistent with the torque trend.

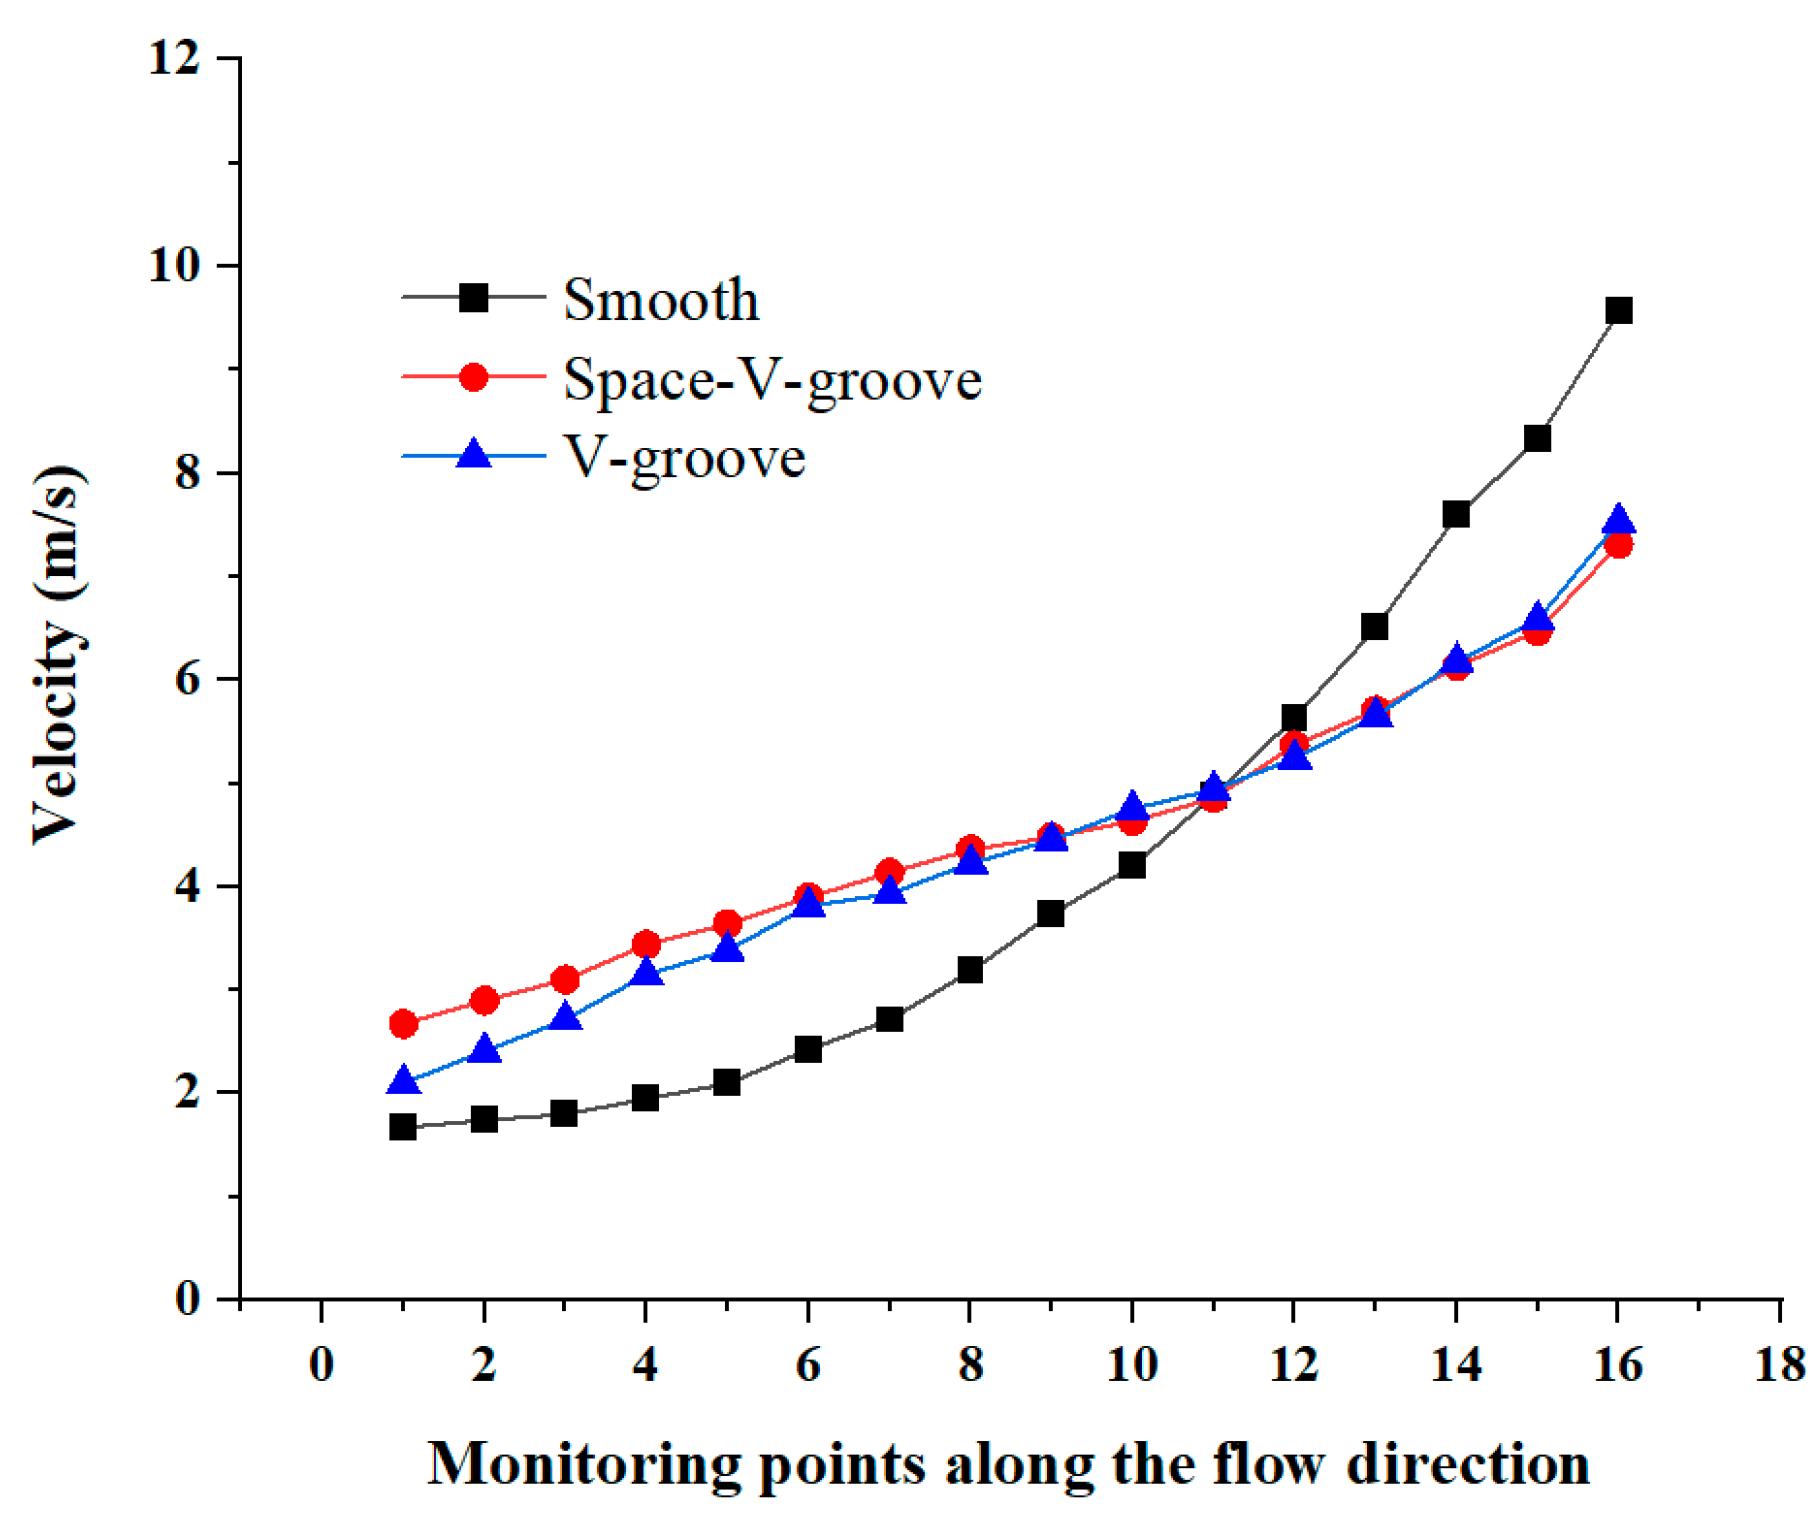
3.2.2. Blade Surface Velocity Analysis

Sixteen velocity monitoring points were set at the same position along the flow direction on the grooved and smooth blade surfaces to more clearly compare the influence of the two bionic groove geometries on velocity. The 16th monitoring point is at the outlet position of the blade. The variation of velocity along the flow direction for different blades is shown in Figure 13. The bionic groove geometry reduces the velocity and its gradient near the blade outlet. It indicates that both bionic groove geometries achieve drag reduction by reducing the velocity gradient of the viscous layer. The Space-V-groove model has slightly less velocity and gradient at the blade outlet than the V-groove model.
The primary reason for the drag reduction of the bionic groove geometry is the effective control or correction of the blade surface boundary layer. It affects and changes the boundary layer’s inverse order structure, thereby inhibiting the transition of the fluid from laminar to turbulent flow. The near-wall flow is more stable, reducing the velocity gradient at the surface and decreasing the turbulent kinetic energy dissipation rate, viscous shear stress, and Reynolds stress, thus reducing frictional drag.

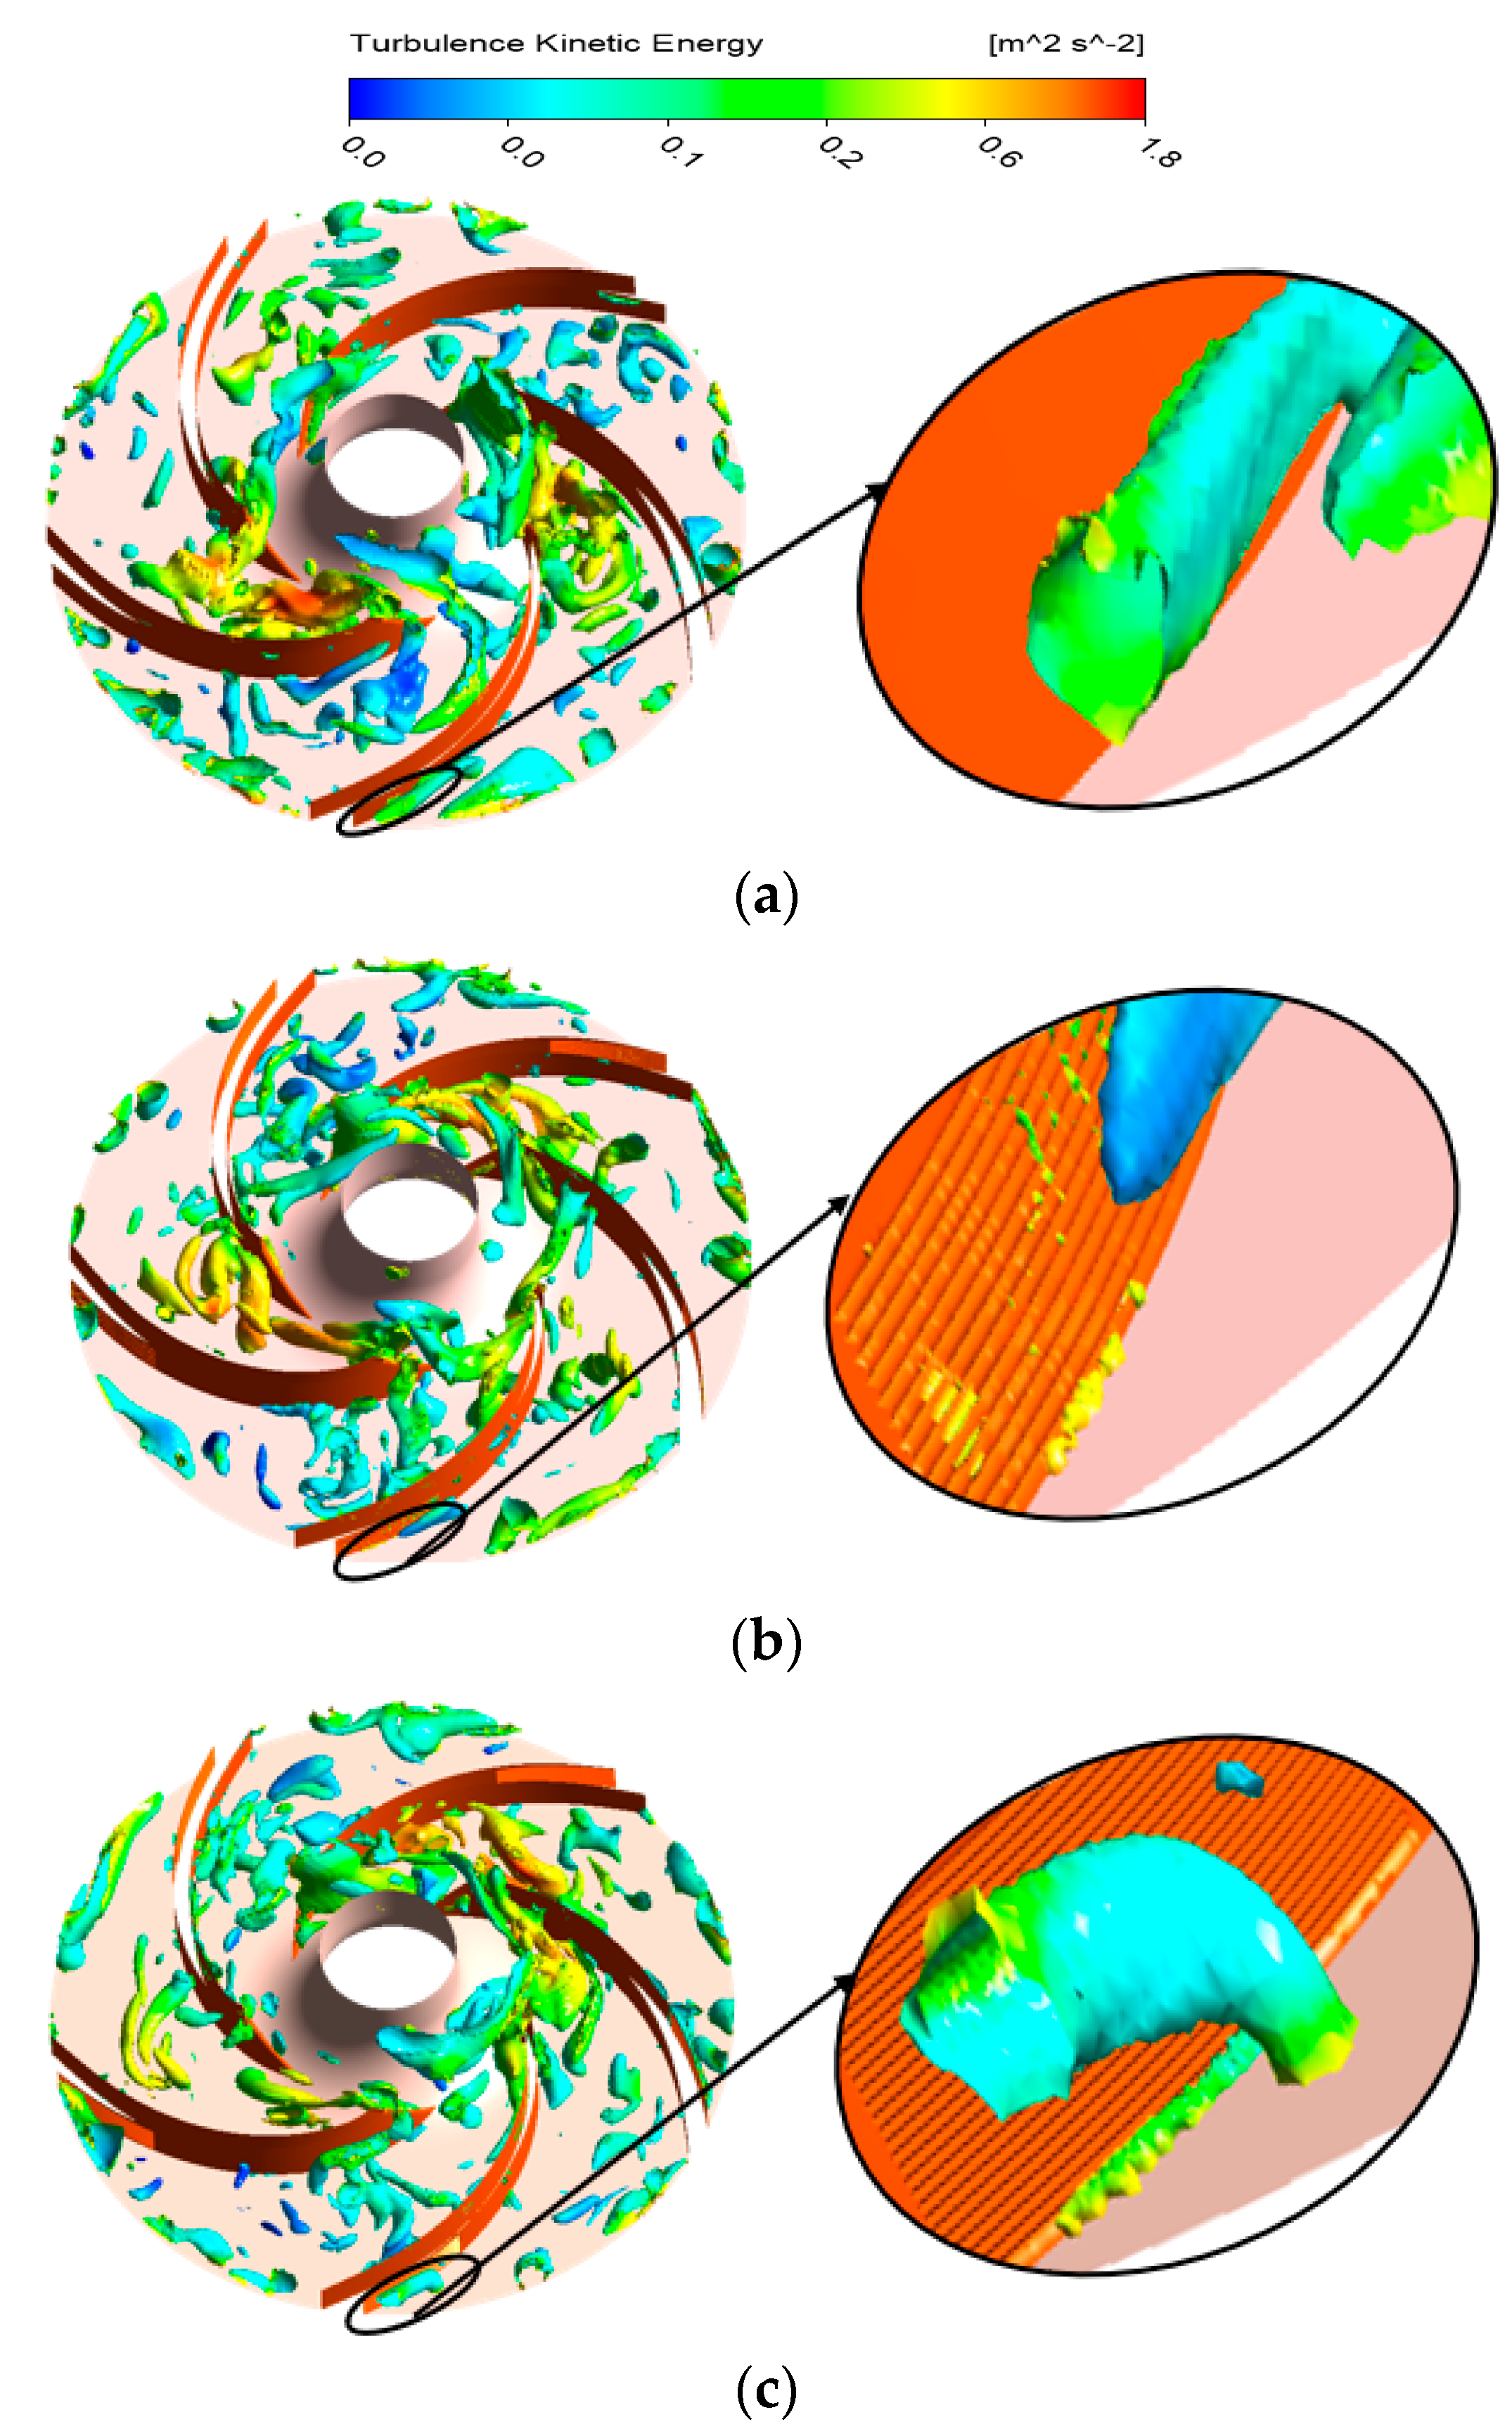
3.3. Vortex Core Analysis

The Q-criterion is based on the complex imaginary part of the eigenvalues of the velocity gradient tensor. The larger the Q-value, the closer to the vortex core. This paper selects Q = 0.1 for the vortex structures inside the different impellers. The vortex cores inside the three impellers are shown in Figure 14. The vortex cores inside the bionic groove impeller decrease compared with the prototype pump. It indicates that the bionic groove geometry on the blade surface can improve the flow behavior and reduce energy loss. Particularly in the marked area, both bionic groove geometries disrupt the vortex structure on the blade surface, which can reduce the acoustic power in the pump. Space-V-groove decomposes the vortex more significantly on the blade surface compared to V-groove.

3.4. Flow Excitation Noise Analysis

3.4.1. Acoustic Power Analysis

In order to better research the influence of the bionic groove geometry on the internal field noise, the sound power of the centrifugal pump was analyzed. The acoustic power level is the total sound energy radiated by the acoustic source per time unit. Proudman [22] obtained the acoustic power equation by Lighthill acoustic analogy, and Sarkar and Husseini [23] obtained the results for noise by direct numerical simulation (DNS) consistent with the Proudman equation.
The acoustic power equation is given as follows:
W A = α ρ u 3 l u 5 c 5
where α is a constant, generally taken as 0.1, l is the turbulence scale, c is the speed of sound, ρ is the fluid density, and u is the turbulence velocity, determined by Equation (9).
u 2 = 2 3 k
where k is the turbulent kinetic energy.
Equation (8) can be written as follows:
W A = α ε ρ ε M t 5
where
M t = 2 k c
The acoustic power level is calculated by Equation (12).
L W = 10 log W A W r e f
where Wref is the reference acoustic power, and the reference acoustic power in water is Wref = 6.7 × 10⁻¹⁹ W/m3.
The acoustic power of three pumps at different operating conditions is shown in Figure 15. The high acoustic power area inside the pump is primarily located in the volute diffusion section. The turbulent kinetic energy is severe due to the rotor–stator interference, so the acoustic power level is relatively high near the interface between the impeller and the volute. The acoustic power in the volute diffusion section decreases with increasing flow rate. Since the rotor–stator interference at high flow rates is not as distinct as at low flow rates, and the flow behavior in the pump under high flow rates is stable, the energy lost is relatively low. Under different operating conditions, the acoustic power level in the channel of the bionic groove impeller is lower than that of the prototype impeller. Meanwhile, there is a localized low acoustic power region at the blade working surface. Notably, at the rated flow rate, the Space-V-groove impeller has a larger area of low acoustic power region in the flow channel compared to other impellers, which is consistent with the vortex core distribution feature. Therefore, it shows that the Space-V-groove can effectively reduce the turbulence inside the impeller, hence the acoustic power in the flow channel.

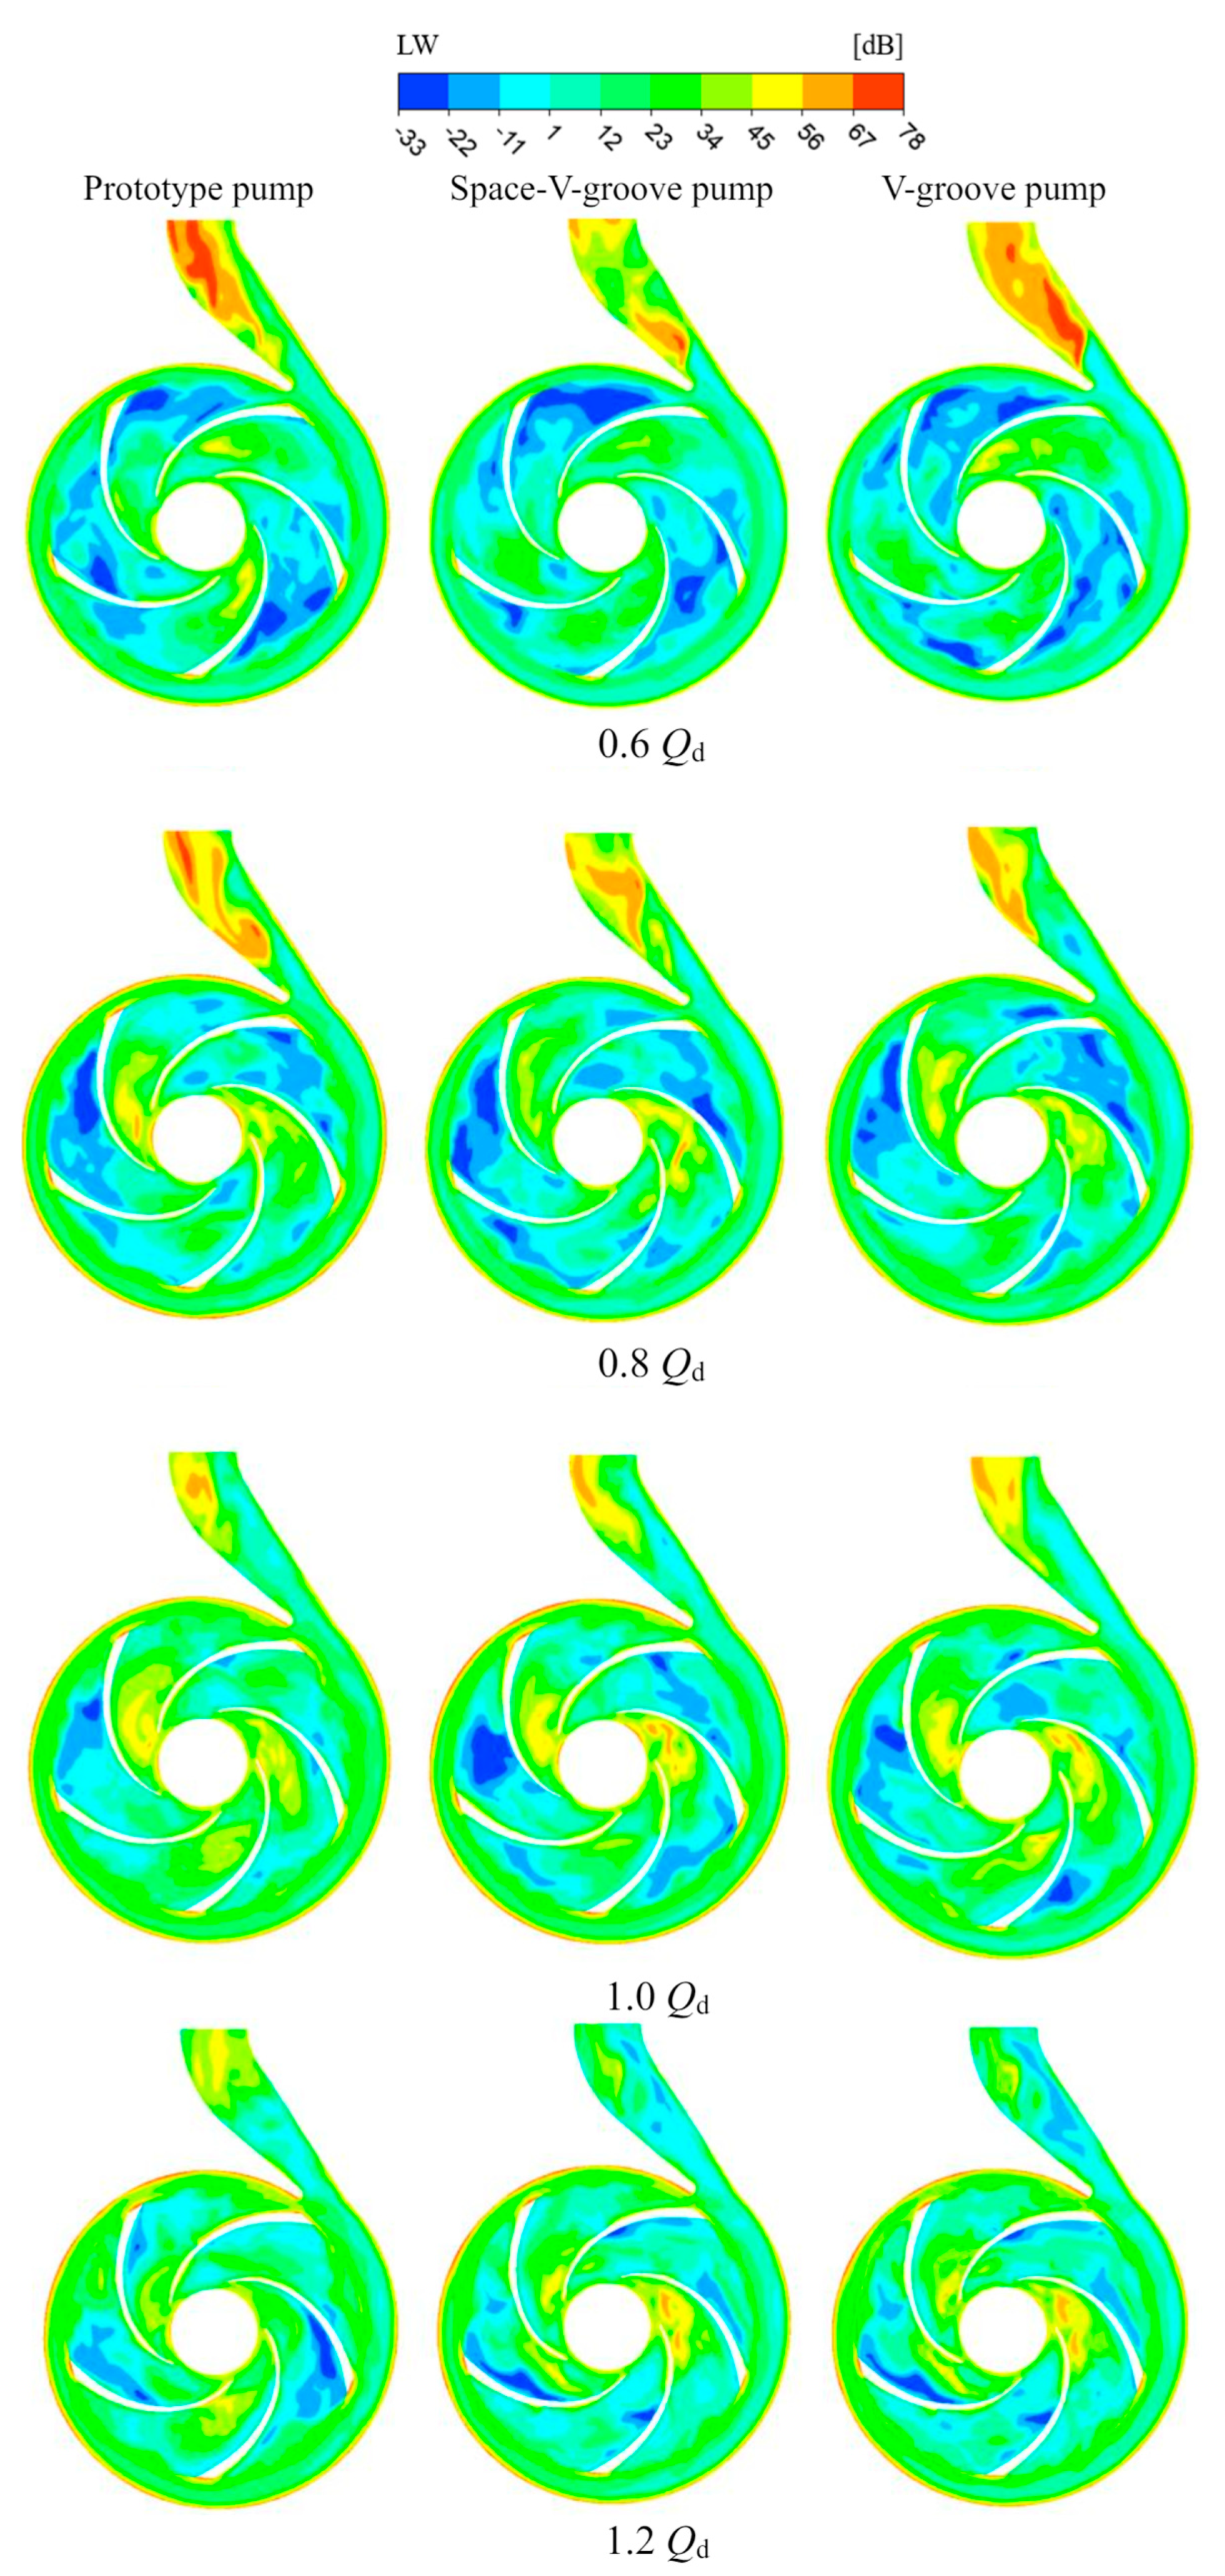
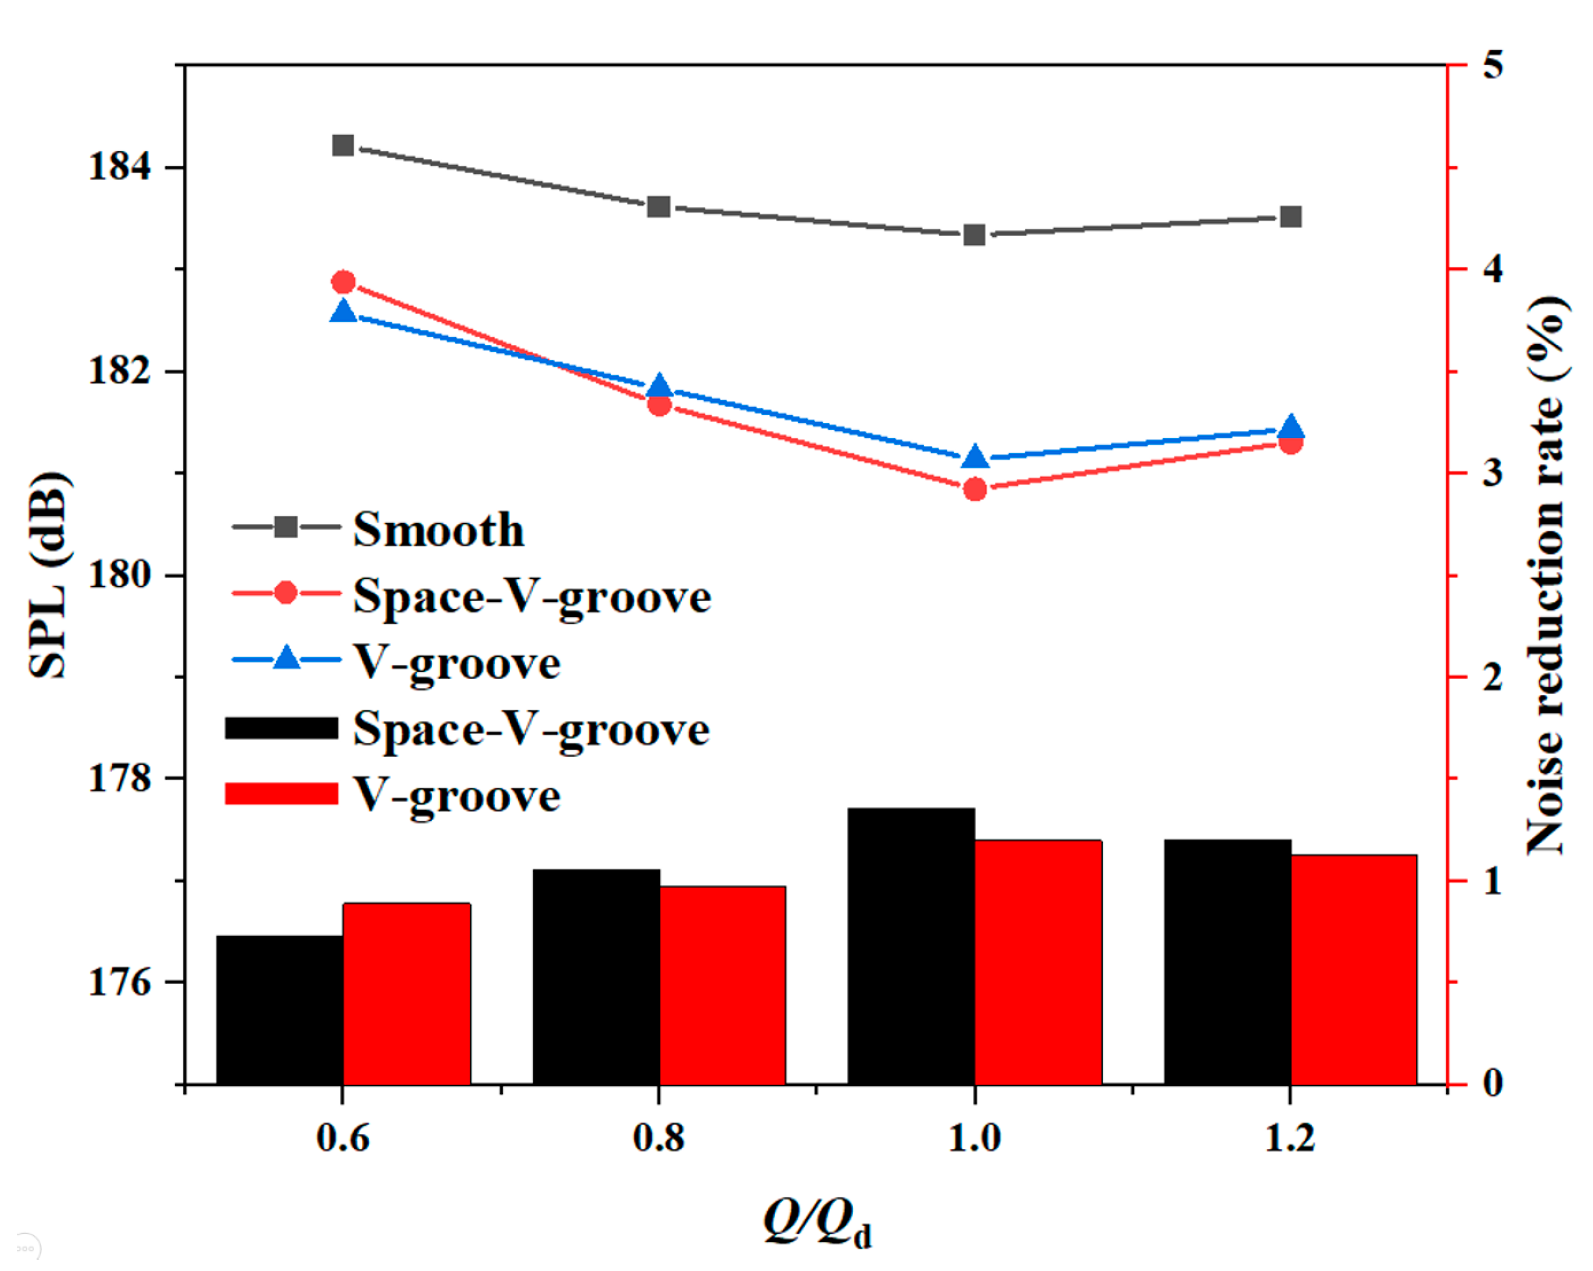
3.4.2. Internal Field Noise Analysis

Figure 16 illustrates the frequency response of the outlet sound pressure level. The internal field noise of the three pumps shows broadband noise in the entire frequency band, and the sound pressure level decreases with increasing frequency. Moreover, there are apparent characteristic peaks at the blade pass frequency (BPF, 241.7 Hz) and harmonics.
To compare the noise reduction ability of both bionic groove geometries, the total sound pressure level of each pump at different flow rates is calculated according to Equation (5). The total sound pressure level and noise reduction rate are shown in Figure 17. The total sound pressure level of both bionic pumps and the prototype pump tends to decrease and then increase with the flow rate. The flow behavior is stable at the rated flow rate, making the total sound pressure level minimum. The pump’s efficiency is lower under partial working conditions, and the lost energy is partially converted into sound energy, resulting in a higher total sound pressure level. Both bionic groove geometries reduce the total sound pressure level by approximately 0.71% to 1.36%. At a low flow rate of 0.6 Qd, the V-groove reduces the total sound pressure level better than the Space-V-groove by 0.89% for the V-groove and 0.73% for the Space-V-groove. As the flow rate increases, the Space-V-groove pump gradually outperforms the V-groove pump in reducing the total sound pressure level. The two bionic groove geometries show the best noise reduction at rated flow rates, with the Space-V-groove reducing 1.36% and the V-groove reducing 1.2%.
The bionic groove geometry not only has an effect on the broadband noise but also reduces the discrete noise at each characteristic frequency. The discrete noise of the three models under different operating conditions is quantitatively analyzed, as shown in Figure 18. Both bionic groove geometries reduce the sound pressure level at the characteristic frequency. At the BPF, 2 BPF, and 4 BPF, the noise reduction effects of the two bionic groove geometries are equivalent. The noise reduction of the Space-V-groove is significantly better than the V-groove at 0.6 Qd. At the 3 BPF, the Space-V-groove has a relatively effective noise reduction at all operating conditions. Therefore, both bionic trench geometries can reduce the total sound pressure level, and the Space-V-groove provides better suppression of the total sound pressure level than the V-groove.

4. Conclusions

This paper focuses on the noise problems in the operation of centrifugal pumps used in fire protection systems of nuclear power plants based on bionics and investigates the effects of Space-V-groove and V-groove geometries on the hydraulic performance and acoustic characteristics through test and simulation. The performance and vortex cores of two bionic groove centrifugal pumps were compared and analyzed. The drag and noise reduction mechanisms of different bionic groove geometries were investigated.
(1)
The bionic groove geometry can effectively enhance hydraulic performance. At rated operating conditions, the two bionic groove pumps show the most significant improvement in hydraulic performance, with the Space-V-groove increasing head by 0.66 m and efficiency by 3.30%, and the V-groove improving head by 0.23 m and efficiency by 2.49%. Space-V-groove geometry is better than V-groove in improving hydraulic performance.
(2)
The Space-V-groove has better drag reduction than the V-groove. At rated operating conditions, the drag reduction was 2.86% for the Space-V-groove pump and 1.82% for the V-groove pump. The bionic groove geometry enables the obstruction of the high-speed flow near the wall and reduces the Reynolds stress at the blade outlet.
(3)
The bionic groove geometry can destroy the vortex shedding and trailing vortex, which can effectively control the turbulence and prevent the vortex core inside the impeller channel. Meanwhile, the bionic groove geometry can destroy the vortex core on the blade surface and decrease the energy inside the impeller, thereby reducing the acoustic power.
(4)
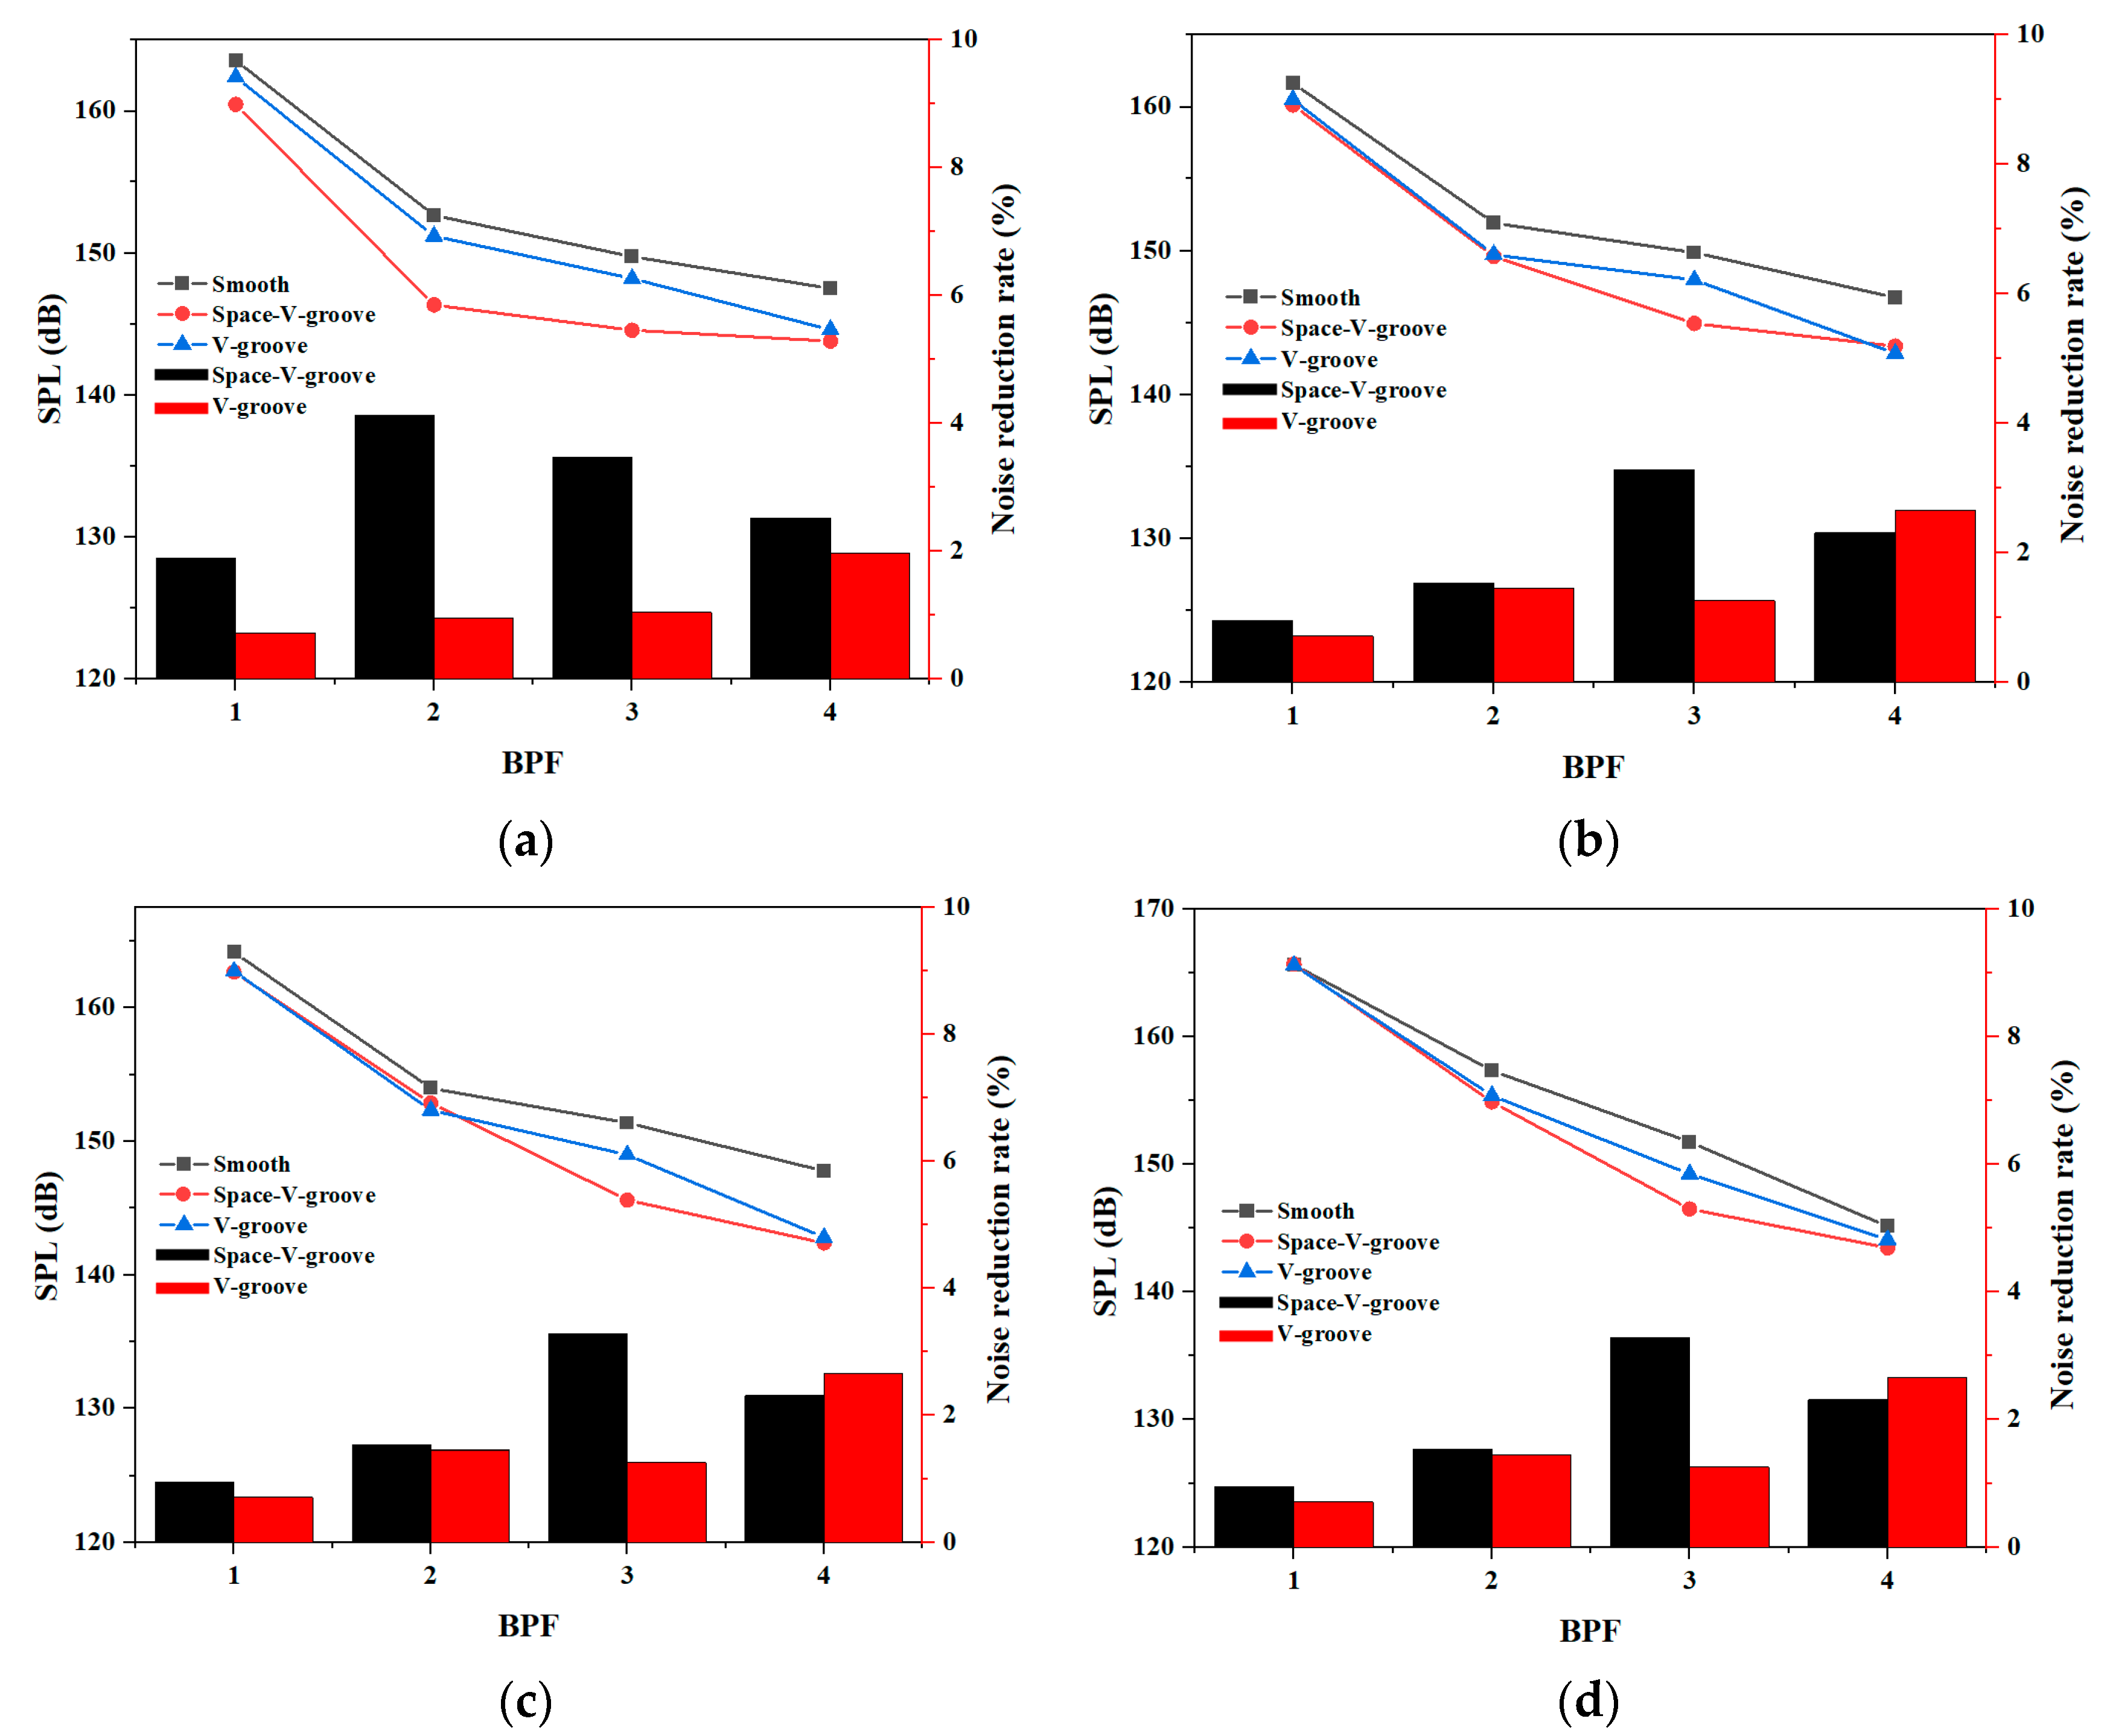
The bionic groove geometry can reduce the total sound pressure level by about 0.71% to 1.36% under different operating conditions. Particularly at rated operating conditions, the bionic groove geometry reduces the total sound pressure level the most, both by 1.36% and 1.2%, respectively. Meanwhile, Space-V-groove is more effective in reducing internal field noise.

Author Contributions

Conceptualization, L.D.; Software, C.G.; Formal analysis, C.G.; Investigation, C.G.; Resources, Y.W.; Writing—original draft, R.Z.; Writing—review & editing, R.Z.; Supervision, C.D.; Project administration, L.D.; Funding acquisition, Y.W. All authors have read and agreed to the published version of the manuscript.

Funding

This research was funded by the National Natural Science Foundation of China (No. 52279087, 51879122), the Taizhou Major Scientific and Technological Achievements Transformation Program (SCG202205), and the Program Development of Jiangsu Higher Education Institutions (PAPD).

Data Availability Statement

Data are contained within the article.

Conflicts of Interest

Author Yinchu Wang was employed by the company Daya Bay Nuclear Power Operations and Management Co., Ltd. The remaining authors declare that the research was conducted in the absence of any commercial or financial relationships that could be construed as a potential conflict of interest.

References

  1. Wang, C.; Shi, W.; Wang, X.; Jiang, X.; Yang, Y.; Li, W.; Zhou, L. Optimal design of multistage centrifugal pump based on the combined energy loss model and computational fluid dynamics. Appl. Energy 2017, 187, 10–26. [Google Scholar] [CrossRef]
  2. Lin, T.; Li, X.; Zhu, Z.; Xie, J.; Li, Y.; Yang, H. Application of enstrophy dissipation to analyze energy loss in a centrifugal pump as turbine. Renew. Energy 2021, 163, 41–55. [Google Scholar] [CrossRef]
  3. Choi, J.-S.; McLaughlin, D.K.; Thompson, D.E. Experiments on the unsteady flow field and noise generation in a centrifugal pump impeller. J. Sound Vib. 2003, 263, 493–514. [Google Scholar] [CrossRef]
  4. Langthjem, M.A.; Olhoff, N. A numerical study of flow-induced noise in a two-dimensional centrifugal pump. Part II. Hydroacoustics. J. Fluids Struct. 2004, 19, 369–386. [Google Scholar] [CrossRef]
  5. Wang, Y.; Ding, Z. Influence of blade number on flow-induced noise of centrifugal pump based on CFD/CA. Vacuum 2020, 172, 109058. [Google Scholar]
  6. Tian, L.M.; Ren, L.Q.; Liu, Q.P.; Han, Z.W.; Jiang, X. The mechanism of drag reduction around bodies of revolution using bionic non-smooth surfaces. J. Bionic Eng. 2007, 4, 109–116. [Google Scholar] [CrossRef]
  7. An, Y.; Wei, W.; Li, S.; Liu, C.; Meng, X.; Yan, Q. Research on the mechanism of drag reduction and efficiency improvement of hydraulic retarders with bionic non-smooth surface spoilers. Eng. Appl. Comput. Fluid Mech. 2020, 14, 447–461. [Google Scholar] [CrossRef]
  8. Lin, Y.; Li, X.; Zhu, Z.; Wang, X.; Lin, T.; Cao, H. An energy consumption improvement method for centrifugal pump based on bionic optimization of blade trailing edge. Energy 2022, 246, 123323. [Google Scholar] [CrossRef]
  9. Lin, Y.; Li, X.; Li, B.; Jia, X.-Q.; Zhu, Z. Influence of impeller sinusoidal tubercle trailing-edge on pressure pulsation in a centrifugal pump at nominal flow rate. J. Fluids Eng. 2021, 143, 091205. [Google Scholar] [CrossRef]
  10. Ma, L.; Gu, Y.; Xia, K.; Mou, J.; Wu, D.; Yan, M. Effect of bionic nonsmooth surface vane on the antiwear characteristics of double-vane pump. Appl. Bionics Biomech. 2022, 2022, 4442417. [Google Scholar] [CrossRef] [PubMed]
  11. Dai, C.; Guo, C.; Chen, Y.; Dong, L.; Liu, H. Analysis of the influence of different bionic structures on the noise reduction performance of the centrifugal pump. Sensors 2021, 21, 886. [Google Scholar] [CrossRef] [PubMed]
  12. Dai, C.; Guo, C.; Ge, Z.; Liu, H.; Dong, L. Study on drag and noise reduction of bionic blade of centrifugal pump and mechanism. J. Bionic Eng. 2021, 18, 428–440. [Google Scholar] [CrossRef]
  13. Tian, L.; Gao, Z.; Ren, L.; Han, Z.; Liao, G. The study of the efficiency enhancement of bionic coupling centrifugal pumps. J. Braz. Soc. Mech. Sci. Eng. 2013, 35, 517–524. [Google Scholar] [CrossRef]
  14. Tian, L.; Jin, E.; Li, Z.; Mei, H.; Wang, Y.; Shang, Y. The fluid control mechanism of bionic structural heterogeneous composite materials and its potential application in enhancing pump efficiency. Adv. Mech. Eng. 2015, 7, 1687814015619551. [Google Scholar] [CrossRef]
  15. Wang, B.; Chen, M.; Lu, Z.; Sun, J.; Wei, J. Optimized design of oil well pump plunger using bionic structure of decision system. Soft Comput. 2022, 26, 10827–10836. [Google Scholar] [CrossRef]
  16. Liu, H.; Wang, X.; Lu, Y.; Yan, Y.; Zhao, W.; Wu, X.; Zhang, Z. Application and optimal design of the bionic guide vane to improve the safety serve performances of the reactor coolant pump. Nucl. Eng. Technol. 2022, 54, 2491–2509. [Google Scholar] [CrossRef]
  17. Liu, H.; Lu, Y.; Wang, X.; Li, Y.; Yan, Y.; Lai, X. Investigation of the effects of the vane blades on the CAP1400 nuclear coolant pump’s performance based on a bionic strategy. Nucl. Eng. Des. 2021, 384, 111465. [Google Scholar] [CrossRef]
  18. Zhang, Z.; Dai, Y.; Gu, Y.; Shi, Z.; Mou, J. Effect of Bionic Groove Surface Blade on Cavitation Characteristics of Centrifugal Pump//Fluids Engineering Division Summer Meeting. Am. Soc. Mech. Eng. 2019, 59025, V001T01A041. [Google Scholar]
  19. Gu, Y.; Yu, L.; Mou, J.; Shi, Z.; Yan, M.; Wu, D. Influence of circular non-smooth structure on cavitation damage characteristics of centrifugal pump. J. Braz. Soc. Mech. Sci. Eng. 2022, 44, 155. [Google Scholar] [CrossRef]
  20. Walsh, M.J. Riblets as a viscous drag reduction technique. AIAA J. 1983, 21, 485–486. [Google Scholar] [CrossRef]
  21. Gu, Y.; Zhao, G.; Zheng, J.; Li, Z.; Liu, W.; Muhammad, F. Experimental and numerical investigation on drag reduction of non-smooth bionic jet surface. Ocean Eng. 2014, 81, 50–57. [Google Scholar] [CrossRef]
  22. Proudman, I. The generation of noise by isotropic turbulence. Proc. R. Soc. London. Ser. A Math. Phys. Sci. 1952, 214, 119–132. [Google Scholar]
  23. Sarkar, S.; Husseini, M.Y. Computation of the Sound Generated by Isotropic Turbulence; ICASE Technical Report; NASA Langley Research Center: Hampton, VA, USA, 1993; pp. 74–93. [Google Scholar]
Figure 1. Groove dimensions: (a) V-groove and (b) Space-V-groove.
Water 16 02183 g001
Figure 2. Bionic impeller.
Water 16 02183 g002
Figure 3. Computational domain.
Water 16 02183 g003
Figure 4. Head of the prototype pump with different grid numbers.
Water 16 02183 g004
Figure 5. Bionic pump heads with differing grid numbers.
Water 16 02183 g005
Figure 6. Grid of bionic impeller.
Water 16 02183 g006
Figure 7. Acoustic grid.
Water 16 02183 g007
Figure 8. Simulation and test results of external characteristics.
Water 16 02183 g008
Figure 9. Simulation and test results of internal field noise.
Water 16 02183 g009
Figure 10. Head and efficiency of different centrifugal pumps at various conditions.
Water 16 02183 g010
Figure 11. Shear stress distribution of different blades at various conditions.
Water 16 02183 g011
Figure 12. Average shear stress of different blades at various conditions.
Water 16 02183 g012
Figure 13. Velocity variations of different blades along the flow direction.
Water 16 02183 g013
Figure 14. Vortex core distribution: (a) smooth blades, (b) Space-V-groove blades, and (c) V-groove blades.
Water 16 02183 g014
Figure 15. Acoustic power distribution of different centrifugal pumps.
Water 16 02183 g015
Figure 16. Frequency response of outlet sound pressure level: (a) 0.6 Qd, (b) 0.8 Qd, (c) 1.0 Qd, and (d) 1.2 Qd.
Water 16 02183 g016
Figure 17. Total sound pressure level and noise reduction rate.
Water 16 02183 g017
Figure 18. Sound pressure level and noise reduction rate at characteristic frequency: (a) 0.6 Qd, (b) 0.8 Qd, (c) 1.0 Qd, and (d) 1.2 Qd.
Water 16 02183 g018
Table 1. Main geometric parameters.
ComponentsParametersSymbolsValue
ImpellerInlet diameter/mmD160
Outlet diameter/mmD2140
Outlet width/mmb28
Blade wrap angle/°φ100
Blade numberz5
VoluteBase circle diameter/mmD3150
Inlet width/mmb314
Outlet diameter/mmDd32
Table 2. Internal field noise at characteristic frequencies.
Internal Field NoiseFrequency/Hz
APF (48.3)BPF (241.7)2 BPF (483.4)3 BPF (725.1)
Test/dB143.8160.1158.4143.6
Simulation/dB142.6162.9153.9150.1
Error0.83%1.10%2.84%4.53%
Table 3. Increased efficiency with different bionic grooves.
Q/QdEfficiency/%Increased Efficiency/%
PrototypeSpace-VVSpace-VV
0.655.2354.2554.32−1.72−1.65
0.862.8263.4564.221.042.23
1.066.7468.9168.403.302.49
1.263.4265.5464.813.382.19
Table 4. Drag reduction rate with different bionic grooves.
Q/QdTorque/N*mDRR/%
PrototypeSpace-VVSpace-VV
0.63.193.243.23−1.56−1.25
0.83.453.413.401.161.51
1.03.853.743.782.861.82
1.24.314.274.290.930.46
Disclaimer/Publisher’s Note: The statements, opinions and data contained in all publications are solely those of the individual author(s) and contributor(s) and not of MDPI and/or the editor(s). MDPI and/or the editor(s) disclaim responsibility for any injury to people or property resulting from any ideas, methods, instructions or products referred to in the content.

