Water Quality in Estero Salado of Guayaquil Using Three-Way Multivariate Methods of the STATIS Family
Abstract
:1. Introduction
2. Materials and Methods
2.1. Experimental Design
2.2. Analytical Procedure
2.3. Partial Triadic Analysis
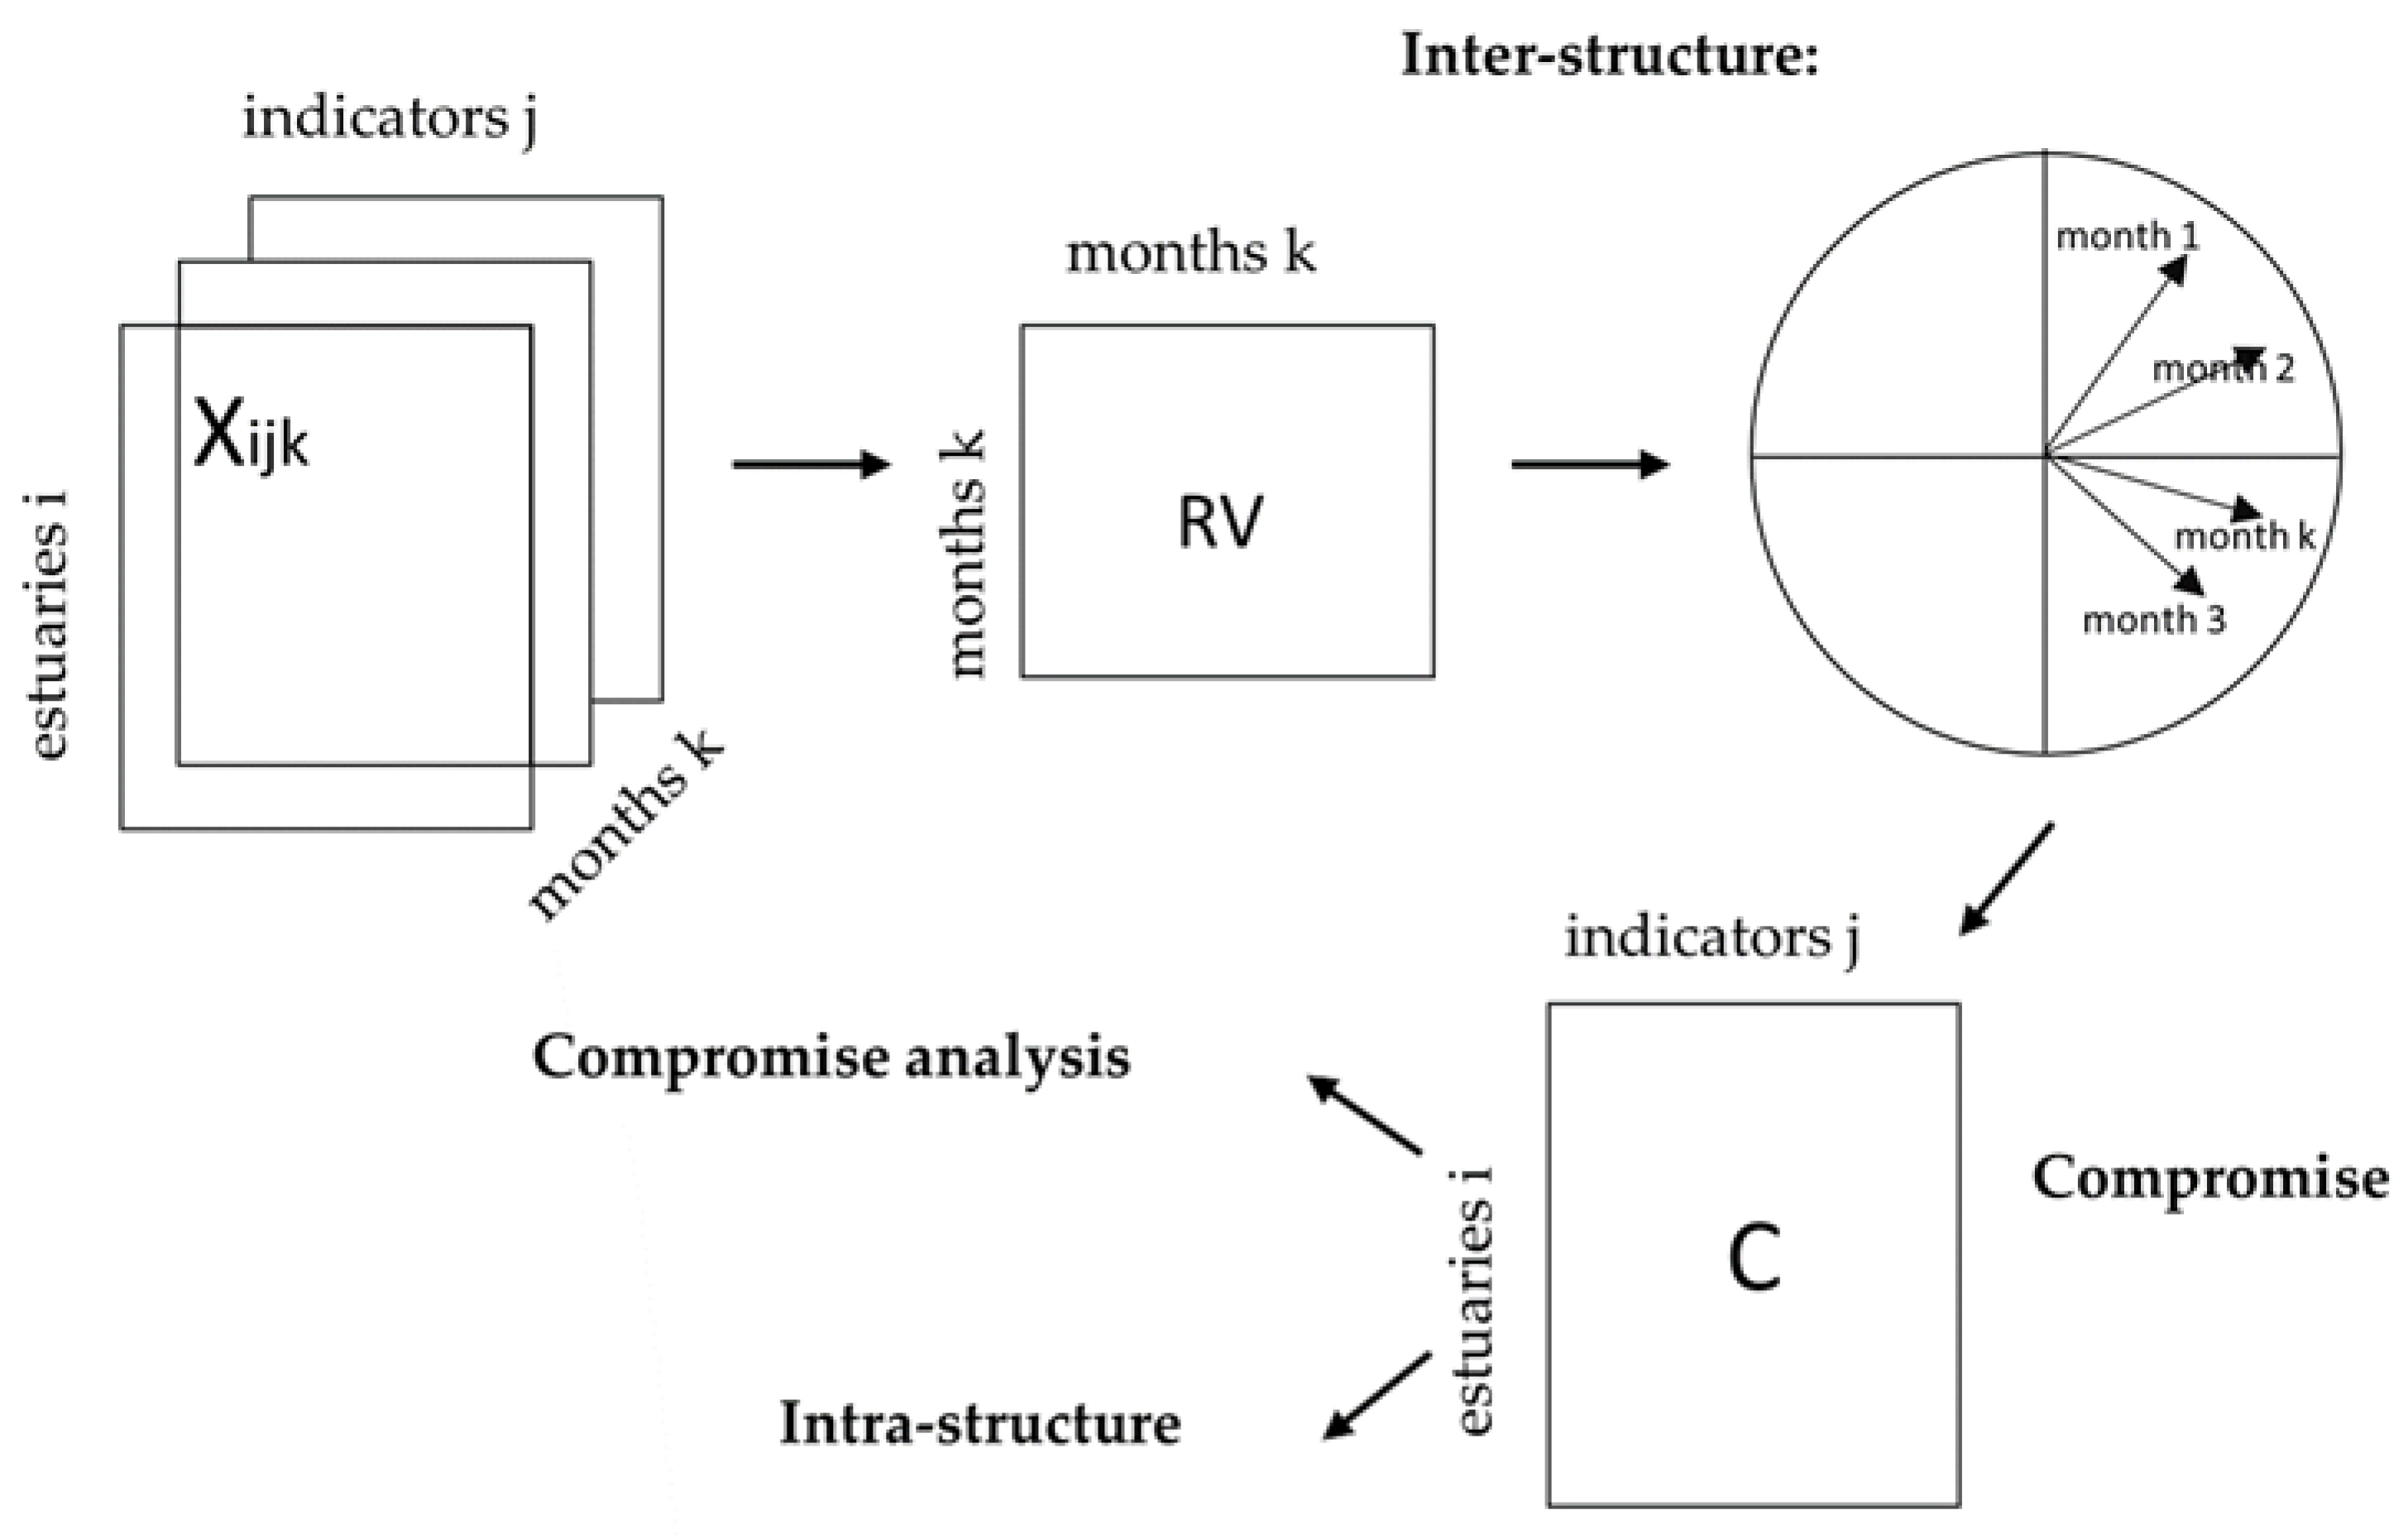
2.3.1. Step 1: Inter-Structure
- Qk(p×p): Weight symmetric matrix for the table variables Xk(n×p) and is a metric used as an inner product in Rp allowing to measure distances between the n objects. When the variables are centered and reduced, then matrix Qk is the identity matrix.
- Dn×n: Weight matrix corresponding to the stations, defined as a diagonal matrix where each element represents the weight assigned to an individual. This configuration allows Dn×n to be used as a metric in Rn space, providing a means to assess interactions among the p variables. For this specific study, the weights for all stations are standardized, assigning a uniform value of to each.
2.3.2. Step 2: Compromise
- u1 is the first eigenvector of the matrix U.
- (, …, ) are the components of the eigenvector, where each acts as a weight assigned to the corresponding table Xk.
- . For k = 1, …, K; this condition specifies that the total sum of the weights must be equal to 1.
- L: Row scores, projection of the rows of XC onto the principal axes A.
- XC: Matrix used for the projections; involves both rows for L and columns (as ) for C.
- Q: Transformation matrix that, together with A, aligns XC to the principal axes.
- A: Principal axes onto which the rows of XC are projected.
- C: Column scores, projection of the columns of XC (via ) onto the principal components B.
- D: Weighting matrix that, together with B, aligns the transposed XC to the principal components.
- B: Principal components onto which the columns of XC are projected.
2.3.3. Step 3: Intra-Structure
- RK: Row scores for table k, calculated by projecting Xk onto the principal axes A using transformation matrix Q.
- CK: Column scores for table k, derived from projecting the transposed columns of Xk (denoted ) onto the principal components B with weighting matrix D.
3. Results and Discussion
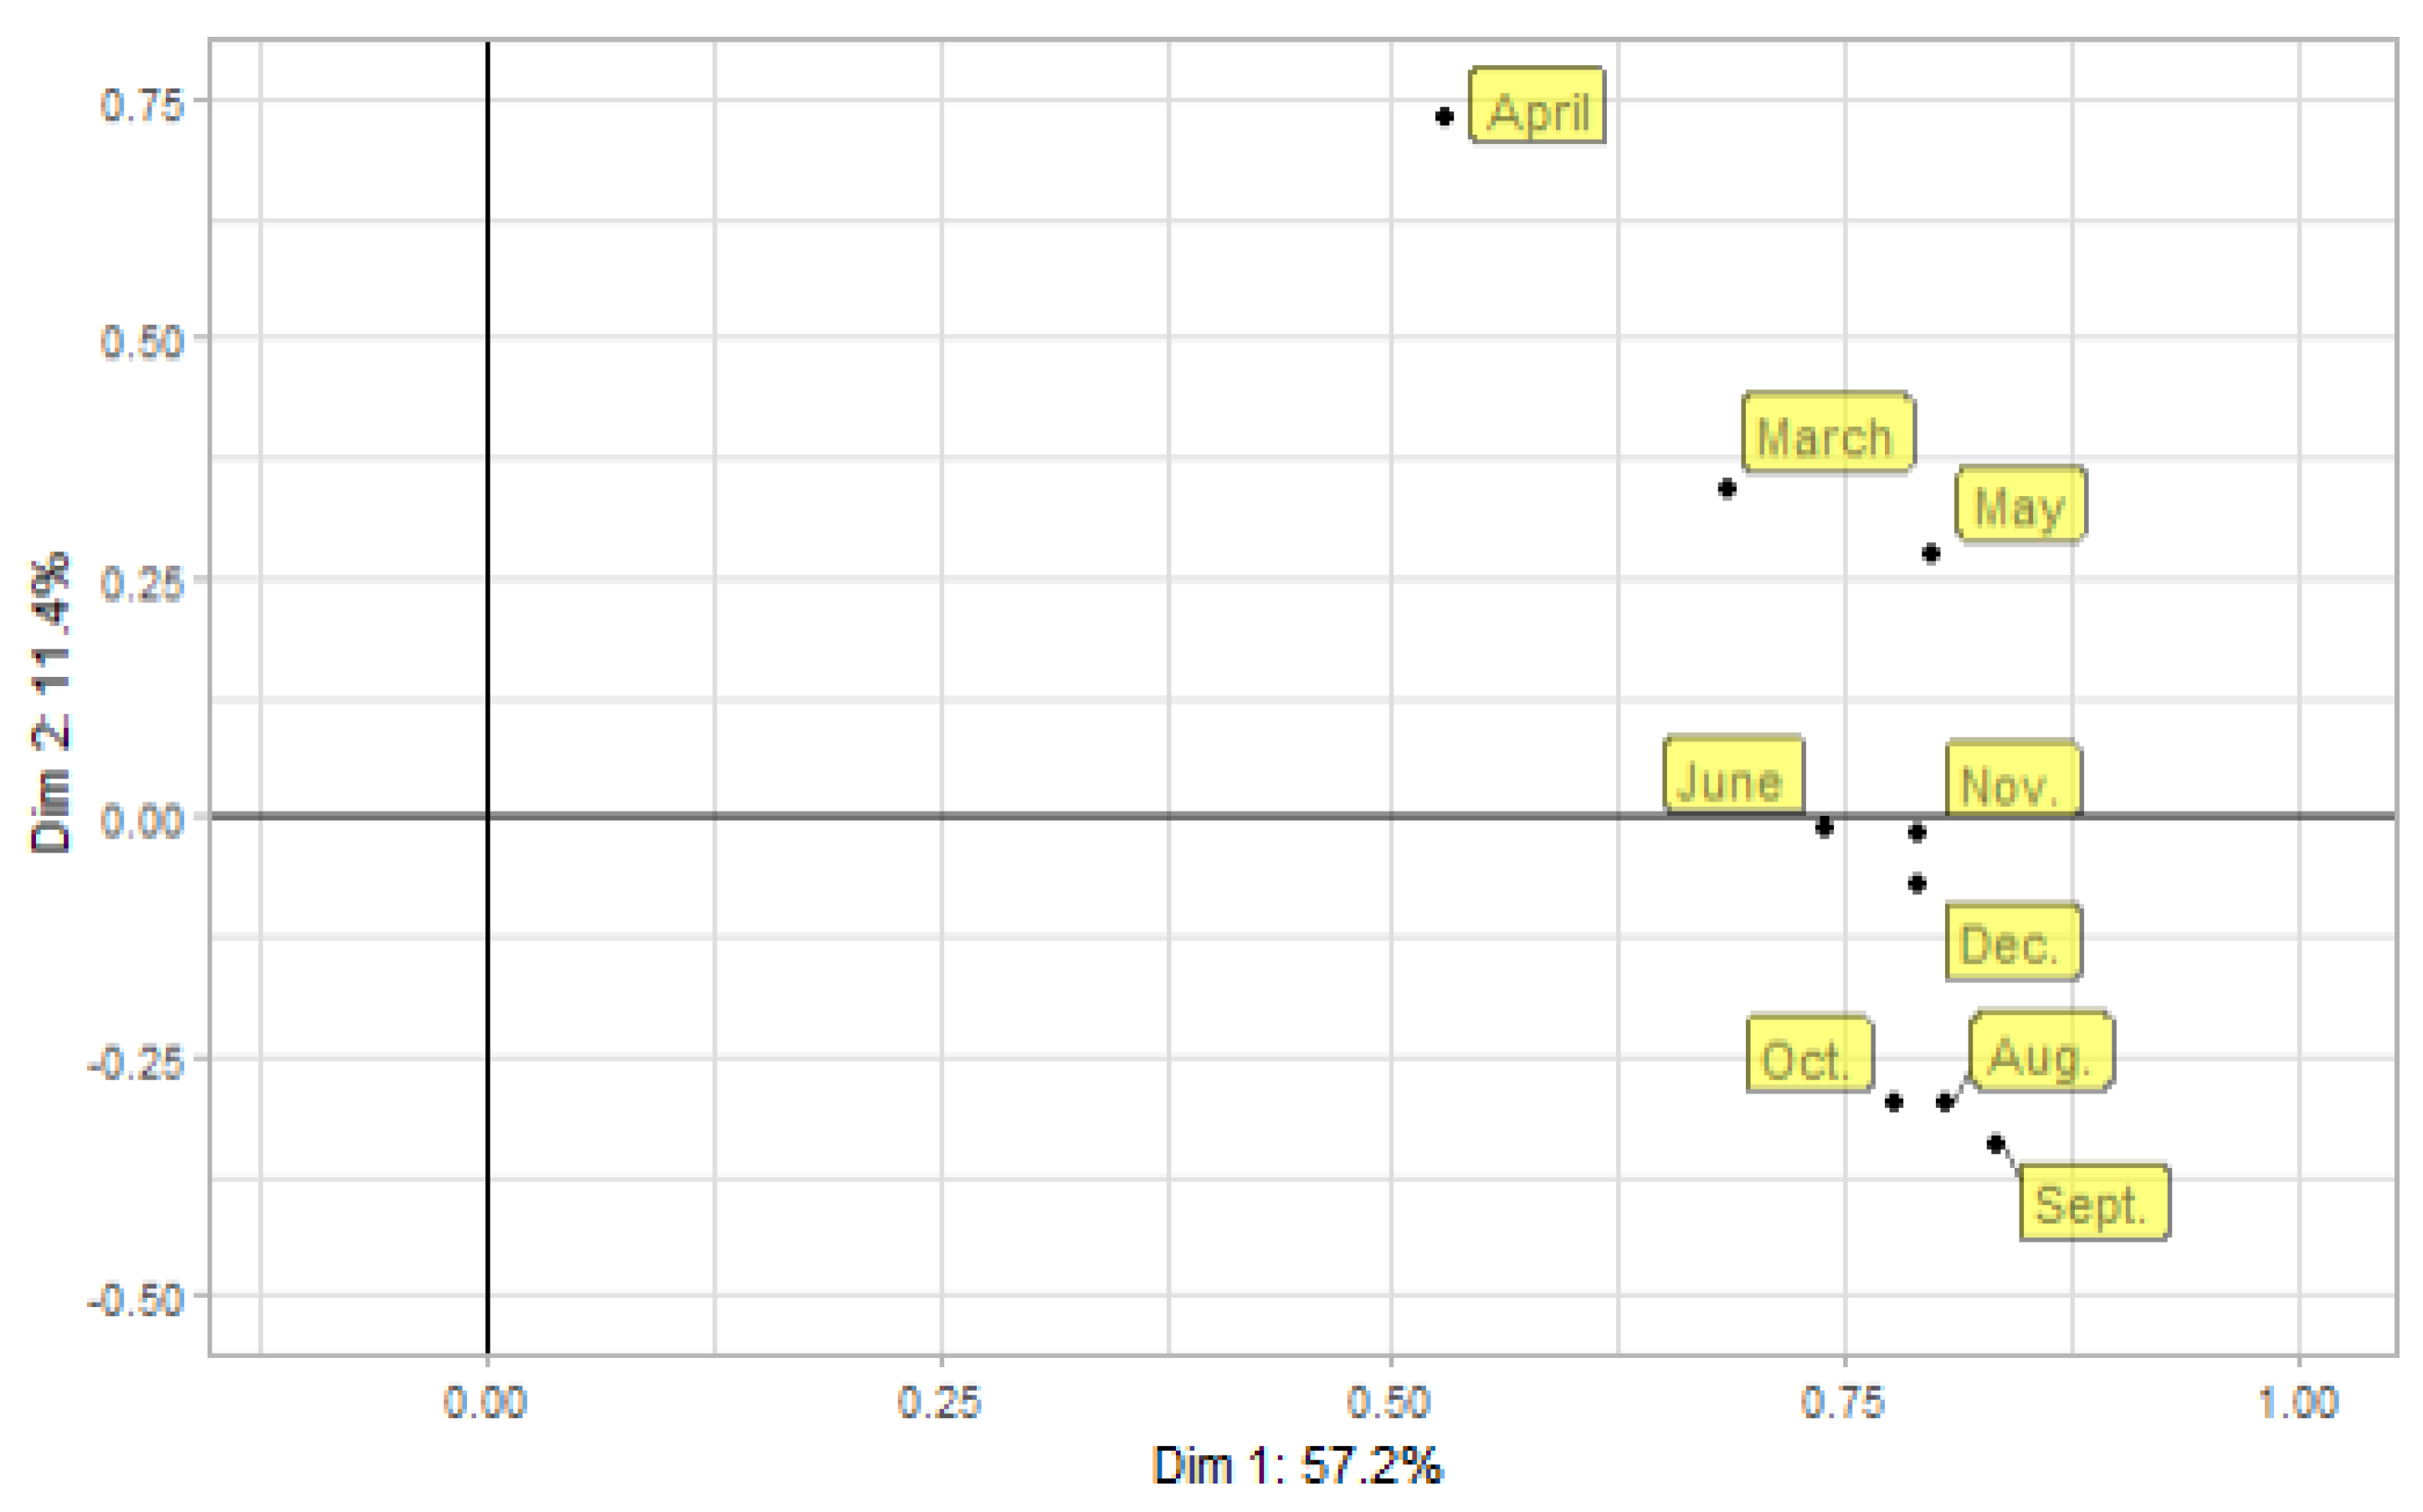
3.1. Inter-Structure Analysis
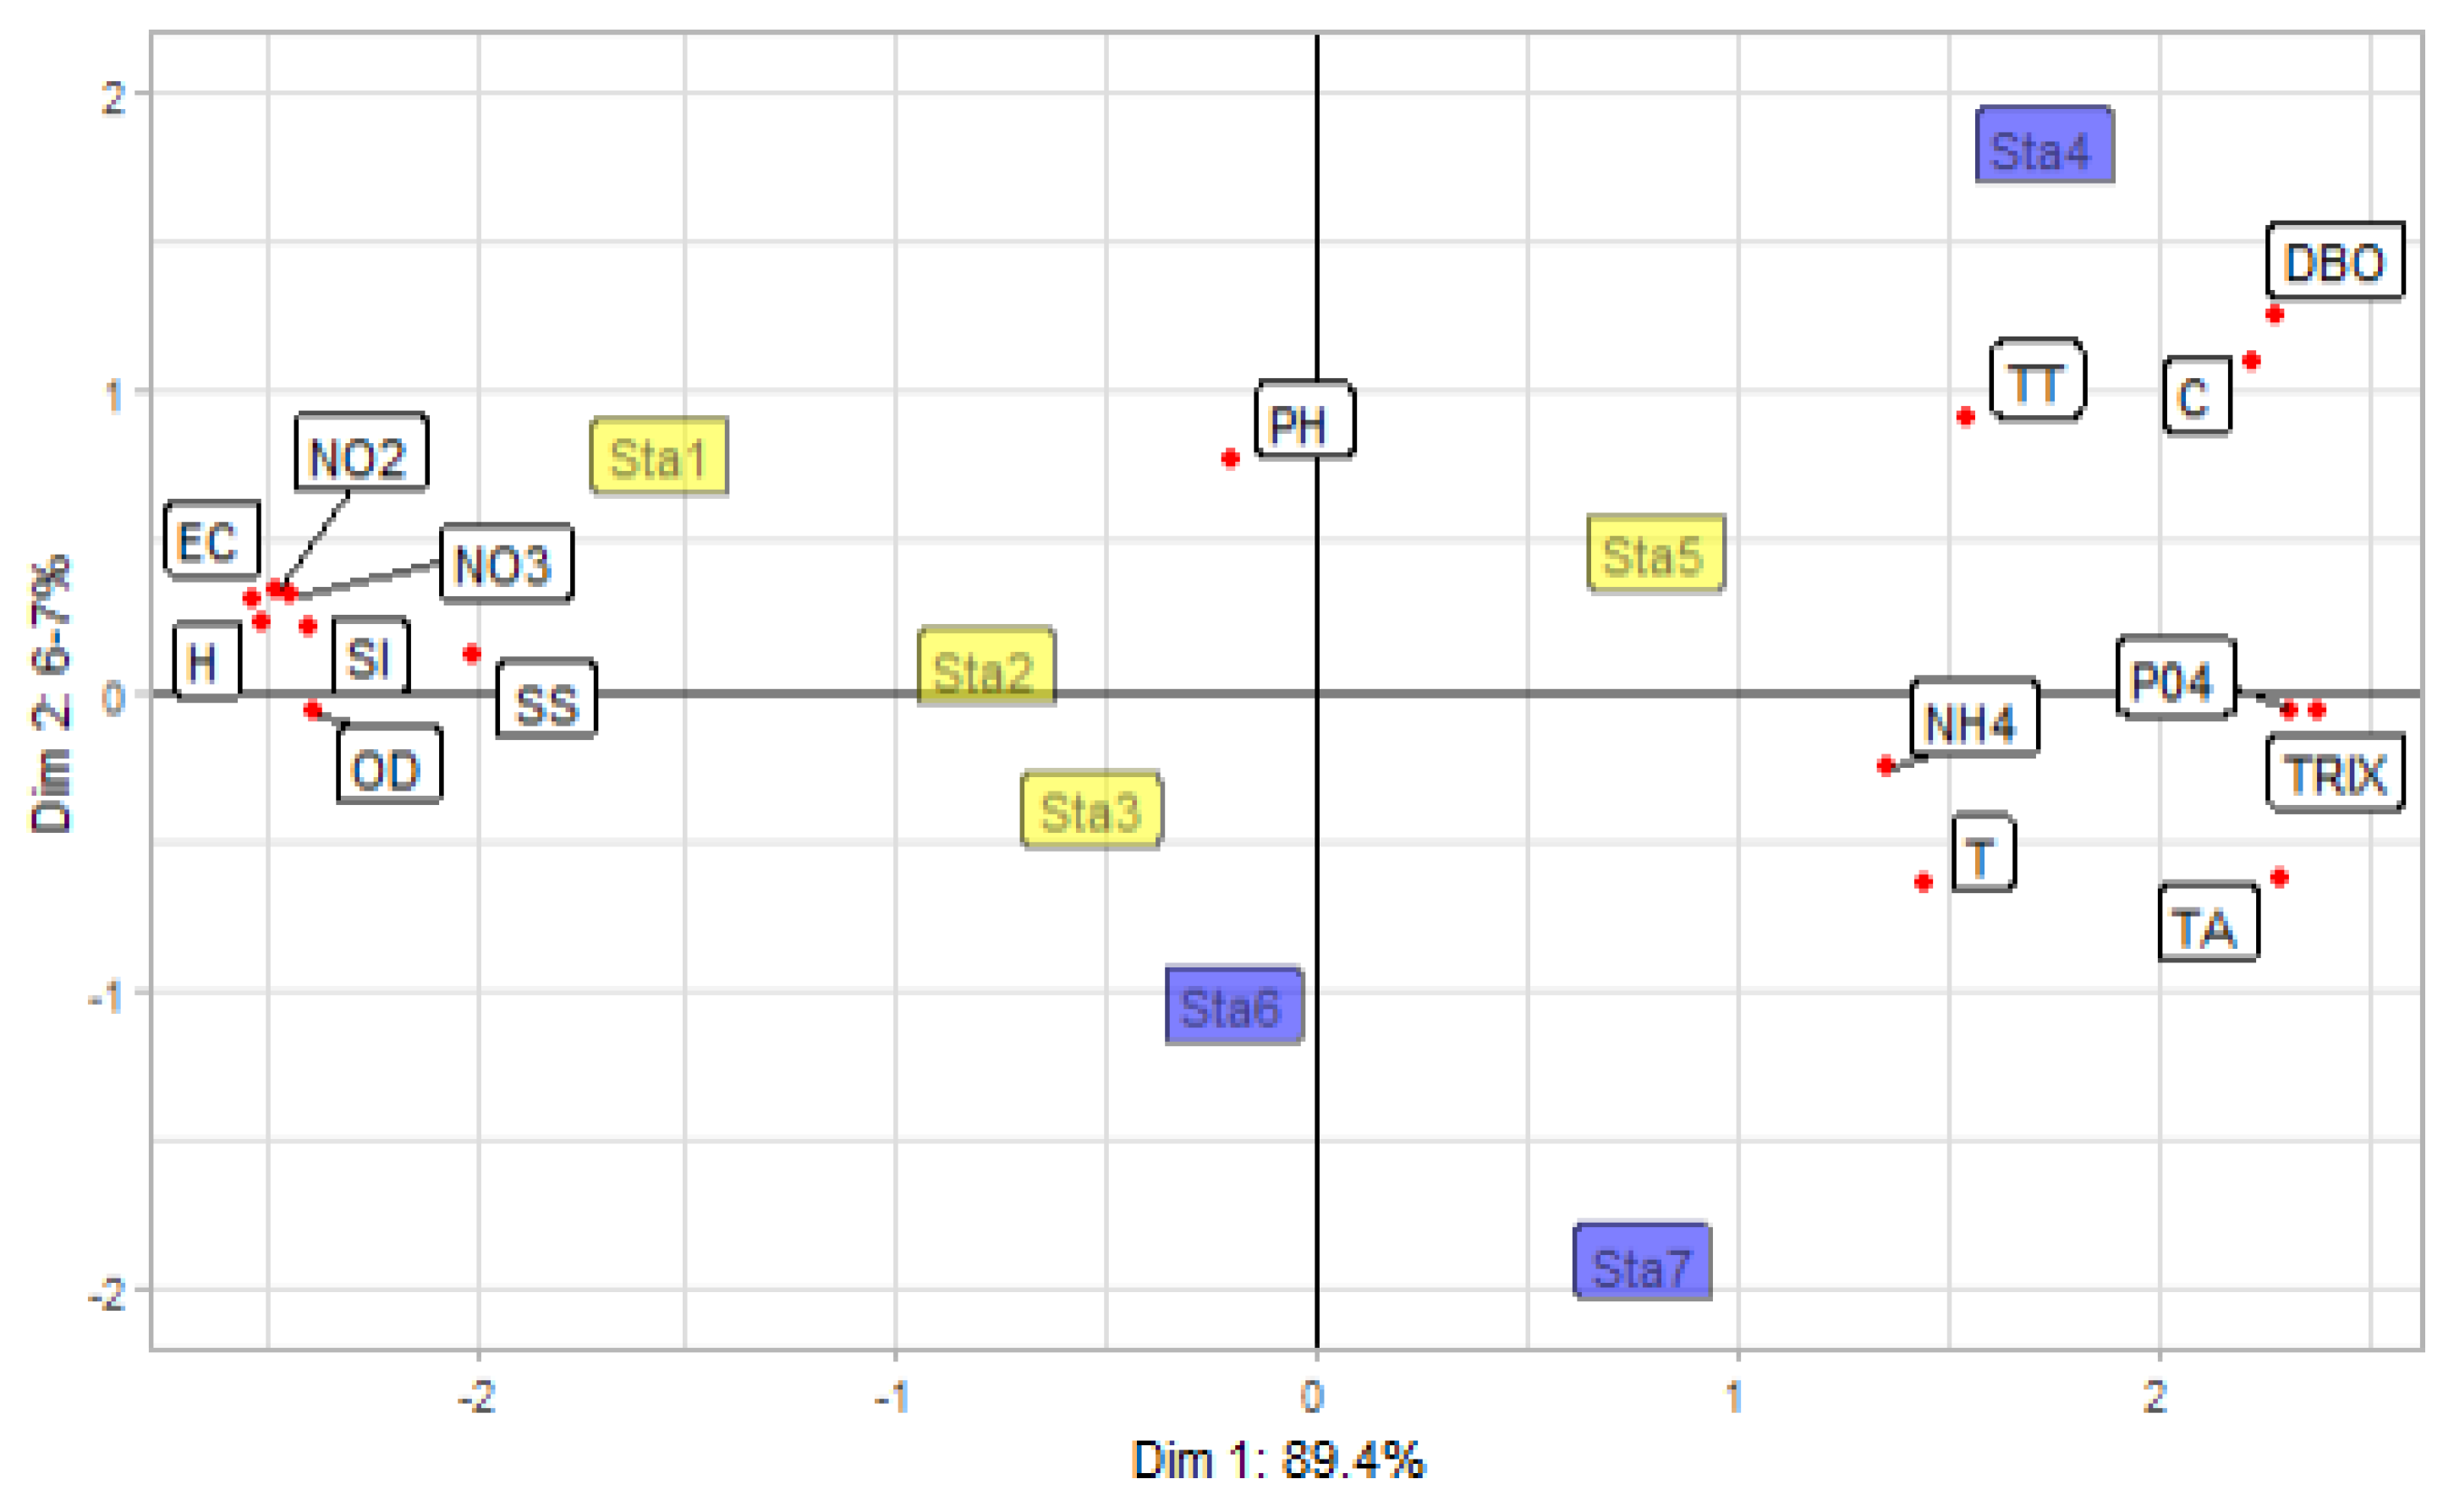
3.2. Compromise Analysis
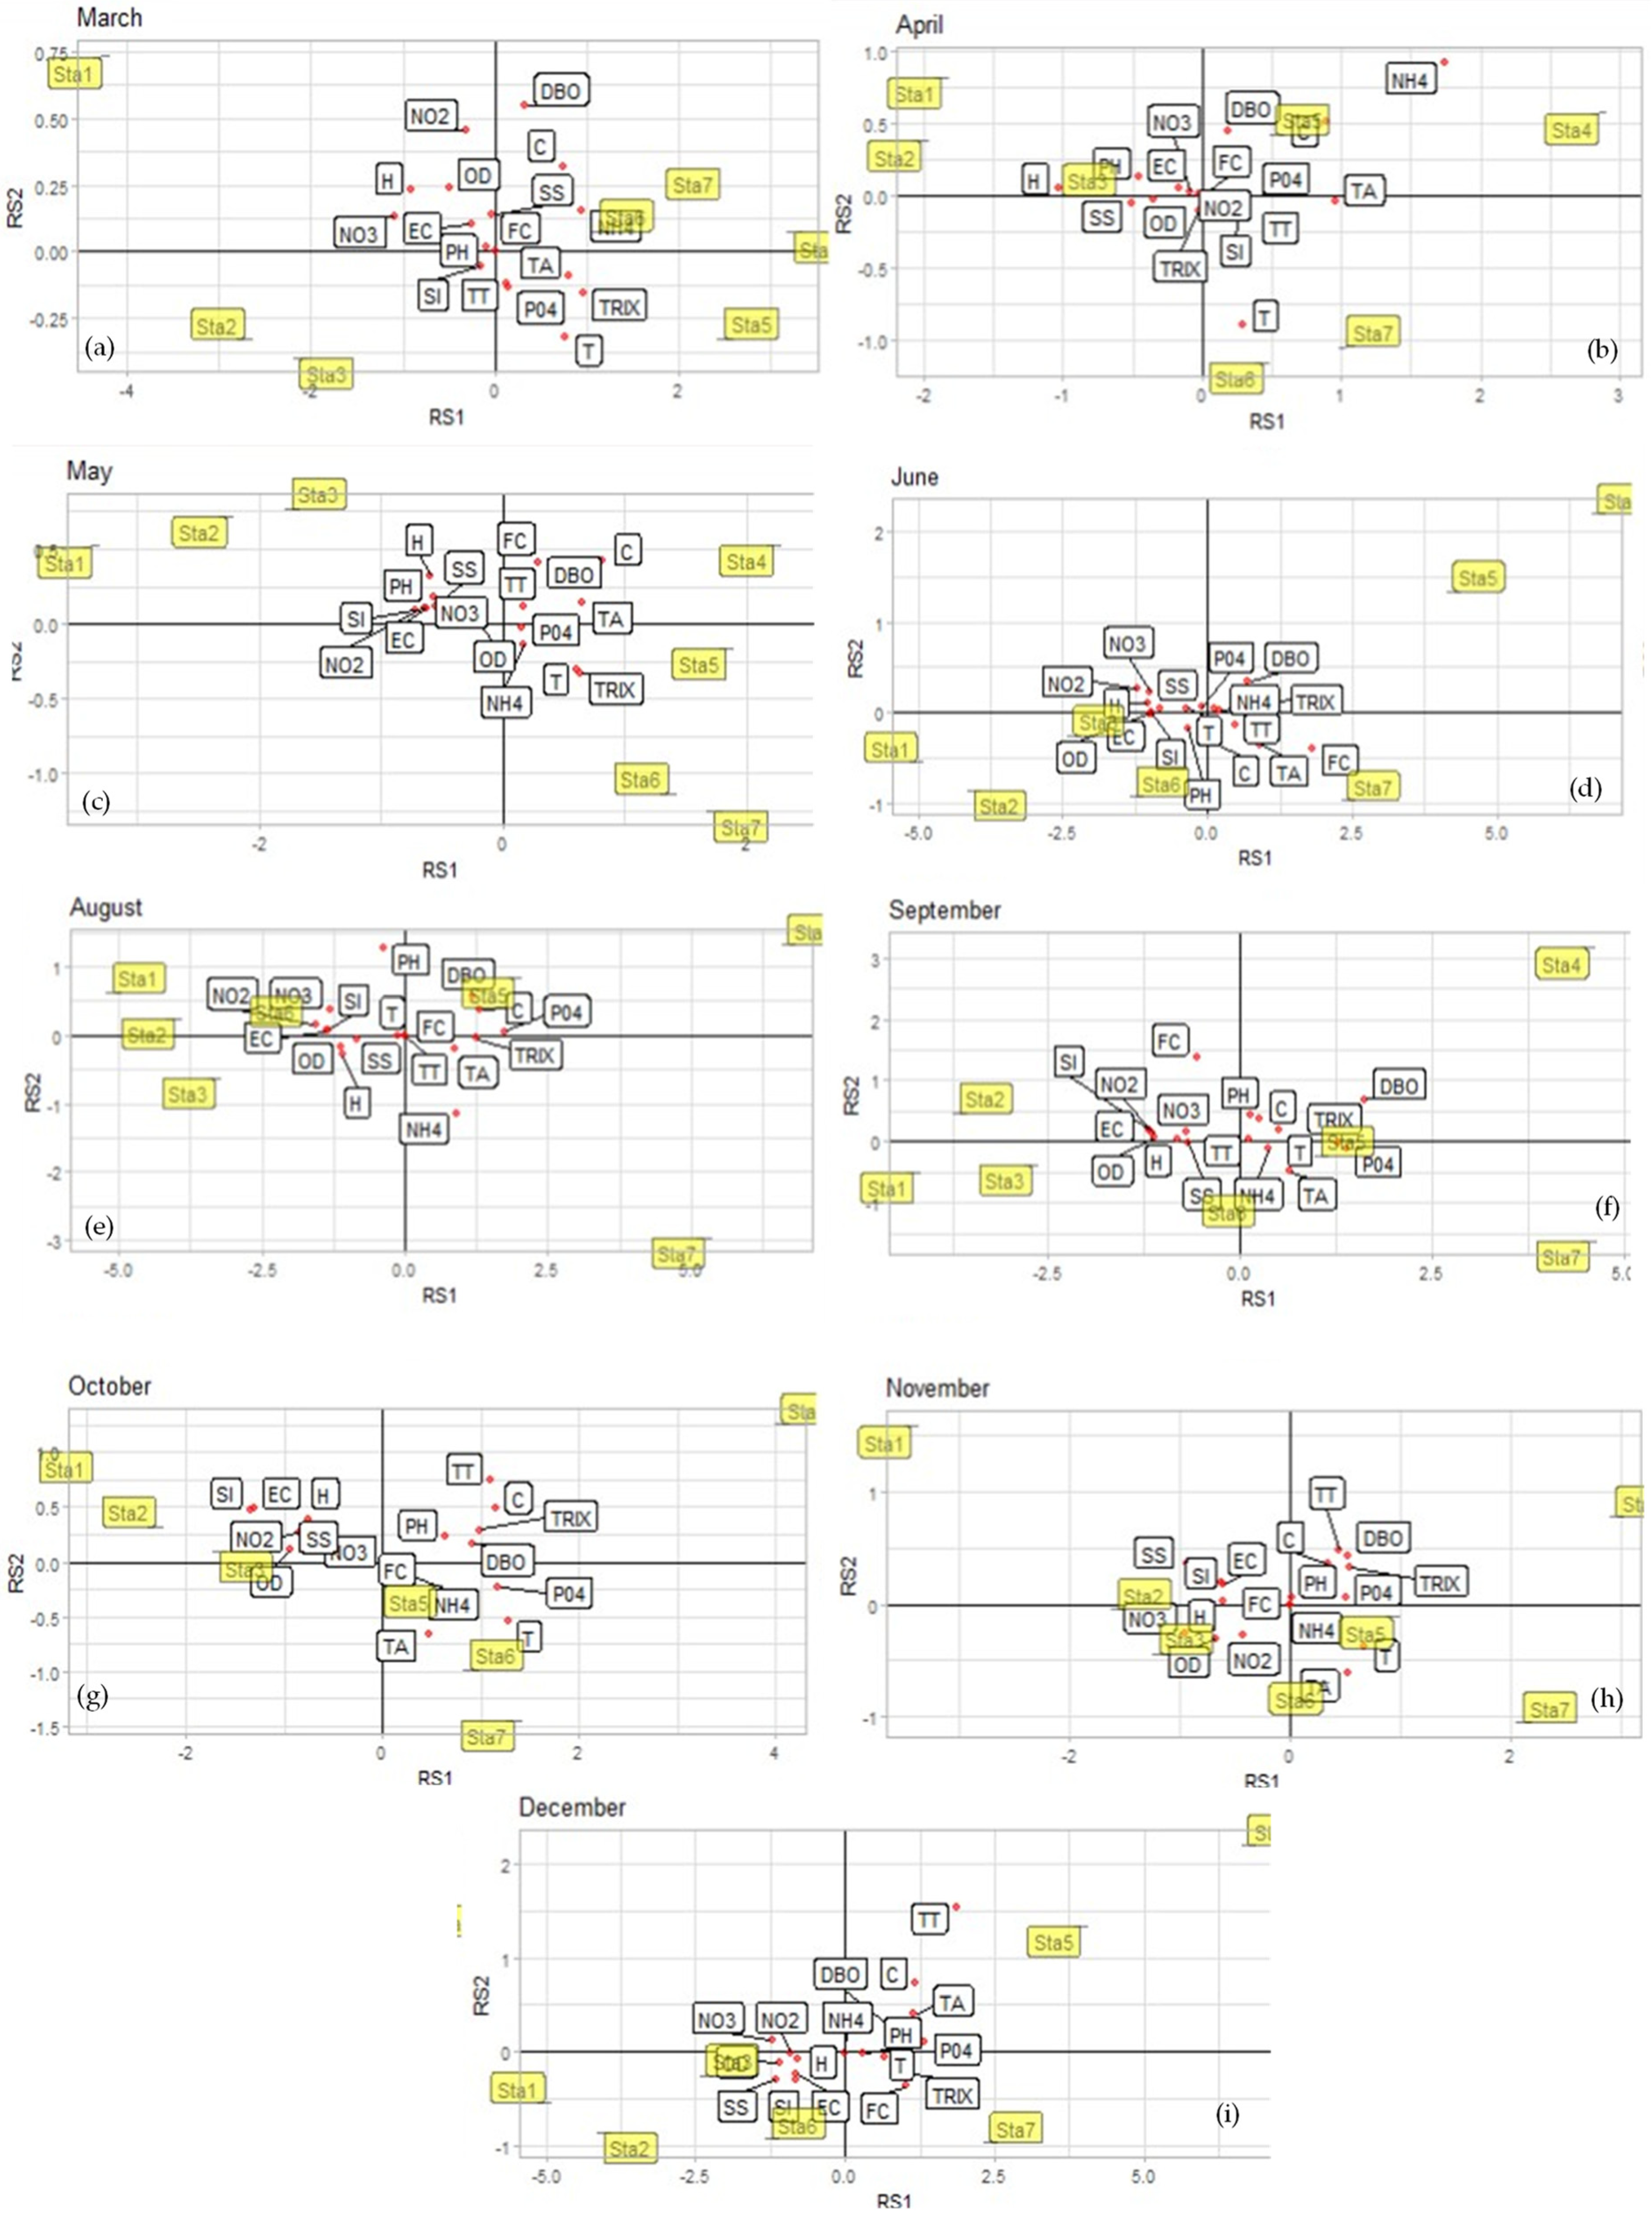
3.3. Intra-Structure Analysis
4. Conclusions
Author Contributions
Funding
Data Availability Statement
Acknowledgments
Conflicts of Interest
Appendix A. Application of Partial Triadic Analysis and Value Extraction
| Dim 1 | Dim 2 | |
|---|---|---|
| Eigenvalues | 5.152 | 1.0 |
| Inertia | 0.572 | 0.114 |
| Accumulated inertia | 0.572 | 0.686 |
| Dim 1 | Dim 2 | |
|---|---|---|
| March | 0.687 | 0.341 |
| April | 0.531 | 0.730 |
| May | 0.800 | 0.275 |
| June | 0.740 | −0.013 |
| August | 0.808 | −0.301 |
| September | 0.835 | −0.340 |
| October | 0.778 | −0.301 |
| November | 0.792 | −0.018 |
| December | 0.792 | −0.072 |
| Month | α |
|---|---|
| March | 0.303 |
| April | 0.234 |
| May | 0.352 |
| June | 0.326 |
| August | 0.356 |
| September | 0.368 |
| October | 0.343 |
| November | 0.349 |
| December | 0.349 |
| Dim 1 | Dim 2 | |
|---|---|---|
| Eigenvalues | 73.013 | 5.492 |
| Inertia | 0.894 | 0.067 |
| Accumulated inertia | 0.894 | 0.962 |
| Dim 1 | Dim 2 | |
|---|---|---|
| Sta1 | −1.343 | 0.612 |
| Sta2 | −1.007 | 0.261 |
| Sta3 | −0.756 | −0.213 |
| Sta4 | 1.510 | 1.645 |
| Sta5 | 0.586 | 0.287 |
| Sta6 | 0.017 | −0.867 |
| Sta7 | 0.993 | −1.724 |
| Months | Variable | Dim 1 | Dim 2 |
|---|---|---|---|
| March | NO3− | −1083 | 0.110 |
| TRIX | 0.958 | −0.178 | |
| NH4+ | 0.937 | 0.145 | |
| H | −0.912 | 0.232 | |
| TA | 0.808 | −0.092 | |
| April | NH4+ | 1737 | 0.920 |
| H | −1039 | 0.034 | |
| TA | 0.959 | −0.053 | |
| C | 0.894 | 0.528 | |
| T | 0.302 | −0.892 | |
| May | C | 0.816 | 0.436 |
| NO2− | −0.712 | 0.085 | |
| TA | 0.656 | 0.145 | |
| EC | −0.641 | 0.104 | |
| TRIX | 0.633 | −0.325 | |
| June | NO2− | −1209 | 0.263 |
| H | −1029 | 0.114 | |
| DO | −1 | −0.007 | |
| NO3− | −0.997 | 0.24 | |
| EC | −0.988 | −0.005 | |
| August | PO43− | 1737 | 0.072 |
| NO2− | −1563 | 0.152 | |
| EC | −1355 | 0.046 | |
| Sl | −1334 | 0.06 | |
| C | 1316 | 0.39 | |
| September | DBO | 1606 | 0.684 |
| PO43− | 1379 | −0.103 | |
| TRIX | 1271 | −0.016 | |
| Sl | −1194 | 0.172 | |
| EC | −1191 | 0.168 | |
| October | Sl | −1348 | 0.46 |
| EC | −1314 | 0.477 | |
| T | 1276 | −0.553 | |
| PO43− | 1177 | −0.217 | |
| C | 1158 | 0.51 | |
| November | NO3− | −0.958 | −0.263 |
| SSs | −0.94 | 0.353 | |
| T | 0.678 | −0.373 | |
| DO | −0.669 | −0.307 | |
| Sl | −0.619 | 0.197 | |
| December | TT | 1848 | 1542 |
| PO43− | 1333 | 0.098 | |
| NO3− | −1229 | 0.121 | |
| C | 1171 | 0.721 | |
| SSs | −1156 | −0.284 |
Appendix B. Water Parameter Results
| Parameter | Indicator | E1 | E2 | E3 | E4 | E5 | E6 | E7 |
|---|---|---|---|---|---|---|---|---|
| Inorganic nutrients | NO2− (mg/L) | 0.15 ± 0.065 | 0.13 ± 0.066 | 0.12 ± 0.055 | 0.01 ± 0.021 | 0.04 ± 0.048 | 0.06 ± 0.049 | 0.02 ± 0.024 |
| NO3−(mg/L) | 0.68 ± 0.321 | 0.73 ± 0.401 | 0.61 ± 0.389 | 0.1 ± 0.073 | 0.16 ± 0.233 | 0.32 ± 0.355 | 0.1 ± 0.144 | |
| NH4+ (mg/L) | 0.17 ± 0.15 | 0.33 ± 0.234 | 0.39 ± 0.331 | 1.12 ± 1.445 | 0.81 ± 0.853 | 0.66 ± 0.698 | 1.05 ± 1.089 | |
| PO43− (mg/L) | 0.55 ± 0.278 | 0.73 ± 0.416 | 0.98 ± 0.596 | 1.89 ± 1.351 | 1.39 ± 1.005 | 1.18 ± 0.732 | 1.68 ± 1.161 | |
| Chemical indicators | DO (mg/L) | 2.89 ± 0.625 | 2.69 ± 0.458 | 2.29 ± 0.768 | 0.49 ± 0.481 | 0.94 ± 0.78 | 2.15 ± 1.112 | 0.79 ± 0.631 |
| pH (U-pH) | 7.58 ± 0.319 | 7.56 ± 0.196 | 7.52 ± 0.195 | 7.59 ± 0.243 | 7.48 ± 0.194 | 7.51 ± 0.237 | 7.5 ± 0.246 | |
| BOD (mg/L) | 6.8 ± 3.529 | 6.58 ± 3.248 | 6.27 ± 3.217 | 26.05 ± 7.824 | 18.67 ± 7.495 | 10.6 ± 2.645 | 11.53 ± 4.327 | |
| TA (mg/L) | 129.71 ± 5.844 | 132.44 ± 7.355 | 140.03 ± 8.256 | 164.38 ± 21.713 | 150.48 ± 9.955 | 153.3 ± 12.099 | 167.55 ± 11.609 | |
| TH (mg/L) | 1285.4 ± 220.747 | 1220.71 ± 313.04 | 1223.07 ± 277.488 | 624.53 ± 347.656 | 883.69 ± 308.969 | 1000.76 ± 391.497 | 633.24 ± 384.294 | |
| SI (mg/L) | 18.12 ± 7.687 | 15.52 ± 7.554 | 14.72 ± 6.651 | 7.69 ± 4.31 | 11.41 ± 6.001 | 11.89 ± 5.428 | 9.14 ± 5.59 | |
| Physical indicators | TT (NTU) | 2.32 ± 1.325 | 2.77 ± 1.588 | 5.35 ± 7.794 | 34.51 ± 38.099 | 19.88 ± 22.254 | 9.09 ± 8.963 | 11.33 ± 8.36 |
| C (mg/L) | 57.06 ± 13.909 | 70.89 ± 26.34 | 75.89 ± 28.796 | 368.67 ± 163.286 | 199.22 ± 137.157 | 94.89 ± 49.17 | 175.11 ± 89.71 | |
| SSs (mg/L) | 152.56 ± 54.089 | 134.28 ± 46.767 | 141.11 ± 42.803 | 93.89 ± 29.354 | 120.89 ± 38.866 | 125.56 ± 35.861 | 99 ± 31.03 | |
| T (°C) | 26.78 ± 0.852 | 26.71 ± 0.679 | 26.79 ± 0.661 | 27.31 ± 0.5 | 27.23 ± 0.812 | 27.26 ± 1.016 | 27.72 ± 0.85 | |
| EC | 546.14 ± 220.582 | 472.92 ± 217.556 | 448.47 ± 190.267 | 231.04 ± 146.061 | 354.15 ± 171.471 | 357.16 ± 180.897 | 258.42 ± 179.001 | |
| Contamination indicator | TRIX | 7.18 ± 0.344 | 7.44 ± 0.329 | 7.61 ± 0.415 | 8.37 ± 0.78 | 8.26 ± 0.62 | 8.04 ± 0.506 | 8.1 ± 0.634 |
| Parameter | Indicator | March | April | May | June | Aug. | Oct. | Nov. | Dec. | Sept. |
|---|---|---|---|---|---|---|---|---|---|---|
| Inorganic nutrients | NO2− (mg/L) | 0.084 ± 0.05 | 0.0027 ± 0.002 | 0.069 ± 0.047 | 0.078 ± 0.085 | 0.119 ± 0.105 | 0.06 ± 0.062 | 0.078 ± 0.034 | 0.078 ± 0.066 | 0.11 ± 0.075 |
| NO3−(mg/L) | 0.71 ± 0.41 | 0.03 ± 0.04 | 0.24 ± 0.18 | 0.34 ± 0.35 | 0.5 ± 0.46 | 0.11 ± 0.08 | 0.75 ± 0.32 | 0.52 ± 0.44 | 0.26 ± 0.25 | |
| NH4+ (mg/L) | 1.04 ± 0.76 | 1.99 ± 1.38 | 0.344 ± 0.15 | 0.397 ± 0.13 | 0.987 ± 1.17 | 0.479 ± 0.22 | 0.017 ± 0.01 | 0.019 ± 0.01 | 0.544 ± 0.26 | |
| PO43− (mg/L) | 0.35 ± 0.12 | 0.42 ± 0.21 | 0.34 ± 0.1 | 0.52 ± 0.17 | 2.09 ± 1.06 | 1.81 ± 0.75 | 1.07 ± 0.31 | 2.21 ± 0.84 | 2 ± 0.86 | |
| Chemical indicators | DO (mg/L) | 1.46 ± 0.87 | 1.85 ± 0.52 | 1.76 ± 0.42 | 1.44 ± 1.24 | 2.16 ± 1.49 | 1.46 ± 1.12 | 2.01 ± 0.86 | 1.75 ± 1.69 | 1.84 ± 1.35 |
| pH (U-pH) | 7.04 ± 0.04 | 7.72 ± 0.12 | 7.73 ± 0.14 | 7.6 ± 0.07 | 7.54 ± 0.16 | 7.65 ± 0.11 | 7.33 ± 0.04 | 7.74 ± 0.08 | 7.48 ± 0.12 | |
| BOD (mg/L) | 14.12 ± 5.4 | 12.47 ± 4.27 | 8.48 ± 4.87 | 10.02 ± 6.5 | 15.11 ± 10.92 | 9.83 ± 7.64 | 11.63 ± 5.5 | 11.86 ± 6.23 | 17.72 ± 15.07 | |
| TA (mg/L) | 144.4 ± 15.92 | 146.69 ± 18.89 | 142.16 ± 12.54 | 151.22 ± 17.63 | 144.43 ± 17.19 | 149.01 ± 14.33 | 141.82 ± 15.47 | 165.75 ± 23.67 | 148.95 ± 13.93 | |
| TH (mg/L) | 717.72 ± 286.67 | 596.75 ± 320.5 | 884.18 ± 248.12 | 746.1 ± 344.25 | 995.93 ± 397.66 | 978.98 ± 290.1 | 1552.56 ± 226.91 | 1358.94 ± 248.72 | 1003.5 ± 283.24 | |
| SI (mg/L) | 5.11 ± 1.57 | 4.45 ± 1.38 | 8.78 ± 3.42 | 11.02 ± 4.47 | 12.93 ± 6.1 | 15.35 ± 6.53 | 20.8 ± 3.78 | 20.43 ± 3.98 | 14.9 ± 5.66 | |
| Physical indicators | TT (NTU) | 6.25 ± 3.09 | 21.47 ± 10.72 | 4.16 ± 3.94 | 12.01 ± 9.79 | 2.27 ± 0.96 | 19.9 ± 24.64 | 8.22 ± 13.08 | 31.92 ± 44.3 | 3.4 ± 2.19 |
| C (mg/L) | 143.43 ± 99.97 | 163.14 ± 128.26 | 160.29 ± 114.12 | 97.43 ± 44.97 | 253.29 ± 170.47 | 199.71 ± 158.46 | 46 ± 67.07 | 199.57 ± 174.93 | 76.5 ± 63.19 | |
| SSs (mg/L) | 82 ± 9.09 | 63.29 ± 16.51 | 116.14 ± 16.97 | 110.29 ± 27.38 | 120.29 ± 36.16 | 147.14 ± 39.29 | 167.86 ± 35.48 | 174.86 ± 36.09 | 133.21 ± 27.68 | |
| T (°C) | 27.86 ± 0.56 | 28.06 ± 0.79 | 27.83 ± 0.45 | 26.84 ± 0.44 | 26.69 ± 0.71 | 26.64 ± 0.94 | 26.83 ± 0.54 | 26.94 ± 0.45 | 26.34 ± 0.48 | |
| EC | 159.59 ± 47.71 | 83.06 ± 48.92 | 282.53 ± 100.23 | 347.1 ± 129.87 | 401.06 ± 178.66 | 466.64 ± 185.27 | 621.22 ± 102.94 | 610.92 ± 110.64 | 458.55 ± 162.82 | |
| Contamination indicator | TRIX | 7.87 ± 0.69 | 7.47 ± 0.13 | 7.21 ± 0.38 | 7.35 ± 0.17 | 8.2 ± 0.65 | 8.2 ± 0.58 | 7.58 ± 0.4 | 8.39 ± 0.62 | 8.43 ± 0.68 |
References
- Mosquera, M.N.R.; Criollo, D.A.R. El Estero Salado en el desarrollo urbano de Guayaquil: Crónicas de un recurso natural en decadencia. In Seminario Internacional de Investigación en Urbanismo; Universitat Politècnica de Catalunya: Barcelona, Spain, 2019. [Google Scholar]
- Dudgeon, D.; Arthington, A.H.; Gessner, M.O.; Kawabata, Z.I.; Knowler, D.J.; Lévêque, C.; Naiman, R.J.; Prieur-Richard, A.H.; Soto, D.; Stiassny, M.L.J.; et al. Freshwater biodiversity: Importance, threats, status and conservation challenges. Biol. Rev. Camb. Philos. Soc. 2006, 81, 163–182. [Google Scholar] [CrossRef]
- Zambrano, N. Plan de Manejo del Bosque Protector Estero Salado Norte. In Programa de Manejo de Recursos Costeros; PMRC: Athens, GA, USA, 2007; 79p. [Google Scholar]
- Monserrate, L.; Medina, J.F.; Calle, P. Estudio de Condiciones Físicas, Químicas y Biológicas en la zona Intermareal de dos Sectores del Estero Salado con Diferente Desarrollo Urbano; Escuela Superior Politécnica del Litoral, ESPOL: Guayaquil, Ecuador, 2011. [Google Scholar]
- Villacis, J.E.R.; Gavilánez, L.H.; Huilcapi, C.S.; Alvarado, H.M.A.; García, R.S.M.; Larreta, F.S.G.; Santi, W.M. Evaluación de la contaminación físico-química y microbiológica de aguas del estero salado. Dominio Cienc. 2017, 3, 672–691. [Google Scholar]
- Distrital, A.A. Norma Técnica para el Control de Descargas Líquidas; Cámara de Industrias y Producción: Quito, Ecuador, 2013. [Google Scholar]
- Vollenweider, F.X.; Vollenweider-Scherpenhuyzen, M.F.; Bäbler, A.; Vogel, H.; Hell, D. Psilocybin induces schizophrenia-like psychosis in humans via a serotonin-2 agonist action. Neuroreport 1998, 9, 3897–3902. [Google Scholar] [CrossRef]
- Gourdol, L.; Hissler, C.; Hoffmann, L.; Pfister, L. On the potential for the Partial Triadic Analysis to grasp the spatio-temporal variability of groundwater hydrochemistry. Appl. Geochem. 2013, 39, 93–107. [Google Scholar] [CrossRef]
- Mendes, S.; Fernández-Gómez, M.J.; Pereira, M.; Azeiteiro, U.; Galindo-Villardón, M.P. The efficiency of the Partial Triadic Analysis method: An ecological application. Biom. Lett. 2010, 47, 83–106. [Google Scholar]
- Thioulouse, J.; Simier, M.; Chessel, D. Simultaneous analysis of a sequence of paired ecological tables. Ecology 2004, 85, 272–283. [Google Scholar] [CrossRef]
- Rossi, J.P. The spatiotemporal pattern of a tropical earthworm species assemblage and its relationship with soil structure: The 7th international symposium on earthworm ecology·Cardiff·Wales·2002. Pedobiologia 2003, 47, 497–503. [Google Scholar]
- Rossi, J.P.; Nardin, M.; Godefroid, M.; Ruiz-Diaz, M.; Sergent, A.S.; Martinez-Meier, A.; Paques, L.; Rozenberg, P. Dissecting the space-time structure of tree-ring datasets using the partial triadic analysis. PLoS ONE 2014, 9, e108332. [Google Scholar] [CrossRef] [PubMed]
- Marco, C.; Fenga, L. Assessing Partial Triadic Analysis with MaximumEntropy Bootstrap: An Application to BES Italianeducation Indicators. preprint 2021, 21. [Google Scholar] [CrossRef]
- Bertrand, F.; Maumy, M. Using Partial Triadic Analysis for Depicting the Temporal Evolution of Spatial Structures: Assessing Phytoplankton Structure and Succession in a Water Reservoir. Case Stud. Bus. Ind. Gov. Stat. 2010, 4, 23–43. [Google Scholar]
- Prieto, J.M.; Amor, V.; Turias, I.; Almorza, D.; Piniella, F. Evaluation of Paris MoU Maritime Inspections Using a STATIS Approach. Mathematics 2021, 9, 2092. [Google Scholar] [CrossRef]
- Misztal, M. Application of the Partial Triadic Analysis Method to Analyze the Crime Rate in Poland in the Years 2000–2017. Folia Oeconomica Stetin. 2020, 20, 249–278. [Google Scholar] [CrossRef]
- Rodríguez-Rosa, M.; Gallego-Álvarez, I.; Vicente-Galindo, P.; Galindo-Villardón, M.P. Are Social, Economic and Environmental Well-Being Equally Important in all Countries around the World? A Study by Income Levels. Soc. Indic. Res. 2017, 131, 543–565. [Google Scholar] [CrossRef]
- García-Bustos, S.; Ruiz-Barzola, O.; Morán, M.; Tandazo, W. Método XSTATIS para estudio de las principales causas de muerte en Ecuador 2020. Papeles Población 2024, 29, 53–81. [Google Scholar] [CrossRef]
- Prieto, J.M.; Amor-Esteban, V.; Almorza-Gomar, D.; Turias, I.; Piniella, F. Application of Multivariate Statistical Techniques as an Indicator of Variability of the Effects of COVID-19 on the Paris Memorandum of Understanding on Port State Control. Mathematics 2023, 11, 3188. [Google Scholar] [CrossRef]
- Darwiche-Criado, N.; Comín, F.A.; Jiménez, J.J.; Masip, A.; García, M.; Eismann, S.G.; Sorando, R. Restoring wetlands to remove agricultural pollution in surface waters: Assessment and monitoring through partial triadic analysis (PTA). In Proceedings of the 9th Symposium for European Freshwater Sciences, Geneva, Switzerland, 5–10 July 2015; Volume 2, p. 4. [Google Scholar]
- Jiménez, J.J.; Darwiche-Criado, N.; Sorando, R.; Comín, F.A.; Sánchez-Pérez, J.M. A Methodological Approach for Spatiotemporally Analyzing Water-Polluting Effluents in Agricultural Landscapes Using Partial Triadic Analysis. J. Environ. Qual. 2015, 44, 1617–1630. [Google Scholar] [CrossRef] [PubMed]
- Slimani, N.; Jiménez, J.J.; Guilbert, E.; Boumaïza, M.; Thioulouse, J. Surface water quality assessment in a semiarid Mediterranean region (Medjerda, Northern Tunisia) using partial triadic analysis. Environ. Sci. Pollut. Res. 2020, 27, 30190–30198. [Google Scholar] [CrossRef] [PubMed]
- Cedeño, J.; Donoso, M.C. Atlas Pluviométrico del Ecuador, 1st ed.; Programa Hidrológico Internacional de la UNESCO para América Latina y el Caribe: Guayaquil, Ecuador, 2010; pp. 1–86. [Google Scholar]
- NTE INEN 2176; Agua. Calidad del Agua. Muestreo. Técnicas de Muestreo. INEN: Quito, Ecuador, 2019.
- APHA. Standard Methods for the Examination of Water and Wastewater, 21st ed.; American Public Health Association/American Water Works Association/Water Environment Federation: Washington, DC, USA, 2005. [Google Scholar]
- NTE INEN 2169:2013; Agua. Calidad del Agua. Muestreo. Manejo y Conservación de Muestras. INEN: Quito, Ecuador, 2013.
- Abdi, A.; Williams, L.; Valentin, D.; Bennani-Dosse, M. STATIS and DISTATIS: Optimum multitable principal component analysis and three way metric multidimensional scaling. Wiley Interdiscip. Rev. Comput. Stat. 2012, 6, 124–167. [Google Scholar] [CrossRef]
- Lavit, C.; Escoufier, Y.; Sabatier, R.; Traissac, P. The ACT (STATIS method). Comput. Stat. Data Anal. 1994, 8, 97–119. [Google Scholar] [CrossRef]
- Jaffrenou, P.; Malécot, G. Sur l’analyse des Familles Finies de Variables Vectorielles: Bases Algébriques et Application à la Description Statistique; Éditeur non Identifié. 1978. Available online: https://three-mode.leidenuniv.nl/bibliogr/jaffrennoupa_thesis/jaffrennoupa1978.pdf (accessed on 22 July 2024).
- Rodríguez-Martínez, C.C.; Cubilla-Montilla, M.; Vicente-Galindo, P.; Galindo-Villardón, P. X-STATIS: A Multivariate Approach to Characterize the Evolution of E-Participation, from a Global Perspective. Mathematics 2023, 11, 1492. [Google Scholar] [CrossRef]
- Robert, P.; Escoufier, Y. A Unifying Tool for Linear Multivariate Statistical Methods: The RV-Coefficient. J. R. Stat. Soc. Ser. C Appl. Stat. 1976, 25, 257–265. [Google Scholar] [CrossRef]
- Dray, S.; Dufour, A.B. The ade4 Package: Implementing the Duality Diagram for Ecologists. J. Stat. Softw. 2007, 22, 1–20. [Google Scholar] [CrossRef]
- Durmishi, N.; Xhabiri, G.; Ferati, I.; Alija, D.; Karakashova, L.; Stamatovska, V.; Lazova-Borisova, I. Monitoring of some parameters of quality and microbiological safety in drinking water. J. Food Technol. Nutr. 2023, 6, 2023. [Google Scholar]
- Fiori, E.; Zavatarelli, M.; Nadia, P.; Mazziotti, C.; Ferrari, C. Observed and simulated trophic index (TRIX) values for the Adriatic Sea basin. Nat. Hazards Earth Syst. Sci. 2016, 16, 2043–2054. [Google Scholar] [CrossRef]
- Aibar, G.B.; Monteiro, S.D.F.; Somohano-Rodríguez, F.M. The Waste Hierarchy at the Business Level: An International Outlook. Mathematics 2023, 11, 4574. [Google Scholar] [CrossRef]


| Parameter | Indicator | Unit of Measurement |
|---|---|---|
| Inorganic nutrients | Nitrite (NO2−) | mg/L |
| Nitrate (NO3−) | mg/L | |
| Ammonium (NH4+) | mg/L | |
| Ortho-phosphate (PO43−) | mg/L | |
| Chemical indicators | Dissolved oxygen (DO) | mg/L |
| pH | U-pH | |
| Biochemical oxygen demand (BOD) | mg/L | |
| Total alkalinity (TA) | mg/L | |
| Total hardness (TH) | mg/L | |
| Salinity (SI) | mg/L | |
| Physical indicators | Turbidity (TT) | NTU |
| Color (C) | mg/L | |
| Suspended solids (SSs) | mg/L | |
| Temperature (T) | °C | |
| Electric conductivity (EC) | NTU | |
| Contamination indicator | Trophic index (TRIX) | - |
Disclaimer/Publisher’s Note: The statements, opinions and data contained in all publications are solely those of the individual author(s) and contributor(s) and not of MDPI and/or the editor(s). MDPI and/or the editor(s) disclaim responsibility for any injury to people or property resulting from any ideas, methods, instructions or products referred to in the content. |
© 2024 by the authors. Licensee MDPI, Basel, Switzerland. This article is an open access article distributed under the terms and conditions of the Creative Commons Attribution (CC BY) license (https://creativecommons.org/licenses/by/4.0/).
Share and Cite
Grijalva-Endara, A.; Valenzuela-Cobos, J.D.; Guevara-Viejó, F.; Macías Mora, P.A.; Quichimbo Moran, J.S.; Ruiz-Muñoz, G.; Galindo-Villardón, P.; Vicente-Galindo, P. Water Quality in Estero Salado of Guayaquil Using Three-Way Multivariate Methods of the STATIS Family. Water 2024, 16, 2196. https://doi.org/10.3390/w16152196
Grijalva-Endara A, Valenzuela-Cobos JD, Guevara-Viejó F, Macías Mora PA, Quichimbo Moran JS, Ruiz-Muñoz G, Galindo-Villardón P, Vicente-Galindo P. Water Quality in Estero Salado of Guayaquil Using Three-Way Multivariate Methods of the STATIS Family. Water. 2024; 16(15):2196. https://doi.org/10.3390/w16152196
Chicago/Turabian StyleGrijalva-Endara, Ana, Juan Diego Valenzuela-Cobos, Fabricio Guevara-Viejó, Patricia Antonieta Macías Mora, Jorge Stalin Quichimbo Moran, Geovanny Ruiz-Muñoz, Purificación Galindo-Villardón, and Purificación Vicente-Galindo. 2024. "Water Quality in Estero Salado of Guayaquil Using Three-Way Multivariate Methods of the STATIS Family" Water 16, no. 15: 2196. https://doi.org/10.3390/w16152196
APA StyleGrijalva-Endara, A., Valenzuela-Cobos, J. D., Guevara-Viejó, F., Macías Mora, P. A., Quichimbo Moran, J. S., Ruiz-Muñoz, G., Galindo-Villardón, P., & Vicente-Galindo, P. (2024). Water Quality in Estero Salado of Guayaquil Using Three-Way Multivariate Methods of the STATIS Family. Water, 16(15), 2196. https://doi.org/10.3390/w16152196


