Article

Wastewater Treatment for Nutrients and Pathogens in a Demonstration-Scale Outdoor Constructed Wetland System

1
Department of Earth and Environmental Sciences, University of Waterloo, Waterloo, ON N2L 3G1, Canada
2
Centre for Alternative Wastewater Treatment, Fleming College, Lindsay, ON K9V 5E6, Canada
3
Independent Researcher, 4460 Tucana Ct #304, Mississauga, ON L5R 3K9, Canada
*
Author to whom correspondence should be addressed.
Water 2024, 16(15), 2198; https://doi.org/10.3390/w16152198
Submission received: 13 June 2024 / Revised: 25 July 2024 / Accepted: 26 July 2024 / Published: 2 August 2024
(This article belongs to the Special Issue Wastewater Treatment Technologies: Theory, Methods and Applications)

Abstract

:
A demonstration-scale outdoor constructed wetland (CW) wastewater treatment system was evaluated for about two years for its effectiveness in treating septic system effluents. The system included three treatment cells: an anaerobic cell, an aerated cell, and a basic oxygen furnace slag (BOFS)-based phosphorus (P) treatment cell. High removal efficiencies were achieved, with reductions of >99% for PO4-P, >83% for NH3-N, >99% for cBOD5, and >76% for COD, with influent concentrations averaging 6, 48, 63, and 143 mg L−1, respectively. Additionally, pathogen removal was high, with an over 99% decrease in E. coli and total coliform levels. The BOFS cell was critical, elevating effluent pH to 10.9 ± 1.5, which effectively inactivated pathogens. Environmental safety before discharge was ensured by CO2(g) sparging to adjust the pH and a zero-valent iron layer in the BOFS cell to control dissolved metal concentrations. Analytical techniques (FESEM-EDX, FTIR, and XANES) confirmed the formation of Ca carbonate and Ca phosphate on spent BOFS, highlighting their role in the treatment process. This study highlights the potential of integrating complementary technologies in constructed wetlands for sustainable and efficient wastewater management.

1. Introduction

Domestic and municipal wastewater often contains elevated concentrations of dissolved nutrients, including phosphorus (P) and nitrogen (N) species. Although N and P can be removed in wastewater treatment systems, elevated levels of these nutrients in effluents contribute significantly to eutrophication in nearby aquatic environments, causing algal blooms and ecological disturbances, a critical and widely acknowledged environmental issue [1,2,3,4,5,6,7]. Constructed wetland systems, particularly those utilizing horizontal and vertical flow configurations, have been recognized for their effectiveness in removing a wide range of wastewater pollutants [8,9,10,11]. The initial P removal from wastewater was as high as 46% in constructed wetlands; however, subsequent declines in P removal were observed for extended periods [12]. Compound-specific treatment strategies and suitable P treatment media for constructed wetlands (CWs) have been explored in many studies, e.g., [10,13,14].
Several studies have identified potential substrates that can be used in CWs to improve the P removal efficiency [15,16,17,18,19,20,21,22,23,24,25]. The materials selected as substrates in CWs are based on their high P adsorption capacities and the potential to precipitate phosphate-bearing phases. Potential substrate materials include industrial byproducts such as electric arc furnace (EAF) slag [26], shale [27], lightweight aggregates [17], and blast furnace steel slags [28].
Basic oxygen furnace slag (BOFS), a waste by-product generated during steelmaking [29,30], has been used as a reactive material for phosphate removal [14,20,31,32,33,34]. The chemical composition of BOFS differs depending on the raw materials used at the various steel production sites [35]. The dominant phases (>10 wt.%) of BOFS are di-calcium silicate (Ca2SiO4), tri-calcium silicate (Ca3SiO5), ferrous oxide (FeO), and Ca-Mg-Mn-Zn-ferrite. The major oxides (~70–80 wt.%) of BOFS are CaO, Fe2O3, and SiO2; and the minor constituents (20–30 wt.%) of the material are MgO, MnO, Al2O3, P2O5, TiO2, K2O, Na2O, and Cr2O3 [32,36,37,38,39,40,41,42,43].
The effectiveness of BOFS in removing phosphorus through adsorption and coprecipitation has been evaluated [20,31,34,44,45,46], and the attenuation of bacterial indicators through microbial inactivation at high pH has been studied [20,41,47,48]. BOFS has been used as a low-cost reactive material with the potential to remove phosphorus, arsenic, and waterborne pathogens from groundwater and wastewater [49,50,51,52,53]. The treatment efficiencies of arsenic, phosphate, and pathogen indicators (e.g., E. coli) are often over 99% in BOFS, based on the laboratory and field applications for treating wastewater [31,41,45,47,48].
Based on a laboratory experiment, ref. [31] suggested that hydraulic retention times of at least 24 h in BOFS media may be required to ensure the maximum phosphorus removal efficiency. BOFS was utilized as a substrate in the phosphorus removal cell in a multi-component pilot scale (mean flow rate: 68 L d−1; hydraulic retention time, HRT: 6.3 days) wastewater treatment system [20]. Excess alkalinity in effluents and the potential for metal leaching from BOFS are concerns that need to be considered when implementing a BOFS treatment system.
The main objective of this study is to assess the effectiveness of a demonstration-scale outdoor constructed wetland (CW) system that integrates BOFS and ZVI for treating septic system effluent.
The specific objectives of this study involve evaluating the removal efficiencies of P, N, COD, cBOD5, and pathogens (E. coli and total coliforms); examining the geochemical processes and interactions in the CW system, focusing on the role of BOFS in P removal through adsorption and precipitation mechanisms; and assessing the potential for metal leaching from BOFS and the overall environmental safety of the treated effluent.
The hypotheses for this study are: (i) the constructed wetland system with BOFS and ZVI will achieve high removal efficiencies for key contaminants, including phosphorus, nitrogen, COD, cBOD5, and pathogens; (ii) the BOFS material will enhance phosphorus removal through the formation of calcium phosphate phases, contributing to significant reductions in effluent P concentrations; and (iii) the integration of ZVI and pH adjustment units will minimize metal leaching and ensure the environmental safety of the treated effluent.
While BOFS has appeared to effectively remove phosphorus from wastewater, there is a lack of long-term performance data, particularly regarding changes in efficiency over time and under varying operational conditions. Additionally, there is limited information on the characterization of reaction products and potential metal leaching associated with using BOFS as a substrate in constructed wetlands. Addressing these gaps requires long-term field experiments and comprehensive environmental assessments to ensure the sustainability and effectiveness of BOFS in wastewater treatment systems.
This paper illustrates an outdoor CW system, incorporating a BOFS-ZVI cell and a pH adjustment unit constructed to remove nutrients (P and N), cBOD5, COD, and pathogens. The solid-phase outer layer of spent BOFS was investigated to determine the P removal mechanism.
This research combines BOFS for phosphorus removal and pathogen inactivation through high pH conditions, with a pH adjustment unit to ensure environmental safety. This approach represents a sustainable and efficient method for decentralized wastewater treatment.

2. Materials and Methods

2.1. System Configuration

The constructed wetland (CW) system, located at the Center for Alternative Wastewater Treatment, Fleming College, Lindsay, Ontario, Canada, has been comprehensively analyzed for its ability to remove pharmaceuticals and artificial sweeteners [54]. This system, with a daily capacity of about 5 m3, was actively monitored for around two years beginning in January 2010. It utilizes the same configuration described in [54], including a sequence of treatment cells designed to process septic tank effluent. Critical components include a vegetated vertical subsurface flow aerated cell and a BOFS phosphate treatment cell (Figure 1), which are fundamental for both studies [54]. A detailed description of the cells is provided in Table 1. These components ensure effective nutrient and pathogen removal.
Continuous flow measurements, occasionally disrupted by equipment clogs, verified the consistent operation of the system. Final effluent was discharged to the City of the Kawartha Lakes sewer system [54]. Detailed information on the physical and chemical properties of BOFS and ZVI is provided by [54].

2.2. Characterization of the Reactive Material and Reaction Products

Basic oxygen furnace slag (BOFS) was collected from the US Steel Stelco Hilton Works facility, Hamilton, ON, Canada. Zero-valent iron (ZVI) was obtained from Connelly GPM (Chicago, IL, USA). The particle density of the BOFS and ZVI were determined using a pycnometer (Air Comparison Beckman Model 930). The surface area was determined using a surface area analyzer (Micromeritics Gemini® VII 2390 Series surface area analyzer and associated MicroActive Reporting Software—BET Microporous, Norcross, GA, USA) with three replicates for each sample.
The chemical and mineralogical compositions of the BOFS were determined using X-ray fluorescence (XRF; MiniPal4, PANanalytical B.V., Almelo, The Netherlands) and X-ray diffraction (XRD Rigaku D/MAX 2500 rotating anode powder diffractometer with monochromatic CuKa radiation at 50 kV and 260 mA; Rigaku Corporation, Tokyo, Japan). XRD measurements were conducted with 2θ angular range from 5 to 70°, where the step size and scan speed were 0.02° and 1°/min. Phase identifications were made using patterns from the International Center for Diffraction Data (ICDD) and the Inorganic Crystal Structure Database (ICSD) and through the JADE software, version 9. Samples of precipitates from Cell 4 effluent (accumulated at the bottom of the Cell 4 effluent collection chamber, a small chamber integrated in cell 4) and Cell 5 (accumulated at the bottom of the pH adjustment tank) were examined using a Leo 1530 field emission scanning electron microscope (FE-SEM) with energy-dispersive X-ray (EDX) (Carl Zeiss AG, Oberkochen, Germany) analysis with three different areas analyzed per sample.
An iron steelmaking slag standard from the Institute for Ferrous Metallurgy, Gliwice, Poland, was used as the standard. The recovery of the standard for the XRF analysis was between 80% and 120%; particularly, the recovery of CaO was 95% and the limit of reporting (LOR) for CaO was 0.01%.
The detection limits of the XRD powder diffractometer for major elements (e.g., Si, Al, Fe) were in the range of 0.1% to 1% by weight and trace elements between 1% and 10% by weight.
The EDX system attached to the Leo is an Oxford AZtec. It fits the EDX spectra with an Oxford standardless fit. It is not calibrated by the user, although the laboratory checks the copper peak position annually. The detection limits of SEM-EDX were ~1%, although it is poorer for lighter elements. EDX depends on having a “line-of-sight” to the detector. This can be a problem with rough samples, or inside cracks and holes. Quantifying EDX data accurately assumes that the sample is flat and is at a fixed angle to the detector. It is also assumed that the sample is lying flat on the SEM stub. However, if the sample is not perfectly flat, it is possible to get qualitative EDX data.
The spent media samples were collected from nine sampling locations in Cell 4 for solid-phase analysis. At each location, samples were collected at 8–10 cm vertical intervals from the surface of the reactive material (Profiles 1–9, Figure S1). Accumulated materials (adsorbed or precipitated) on the spent BOFS were analyzed using FTIR and XANES. The FTIR spectra were collected from the top-most samples from all nine sampling profiles using a Bruker Tensor 27 infrared spectrometer with three replicates per sample.
Phosphorus K absorption edge data were recorded using the Soft X-ray Micro-characterization Beam line (SXRMB; 06B1-1) on samples collected from Cell 4 including a sample from the influent zone (Profile 3, sample 1) and a sample from the effluent zone (Profile 8, sample 1) at the Canadian Light Source, Saskatoon, Canada, using the 2.9 GeV storage ring, with two to three replicates per sample. XANES spectra were processed and analyzed using the Athena (version 0.8.56) data processing package [55]. Linear combination (LC) fitting was used to compare the spectra from spent BOFS and the reference materials based on the goodness of fit criteria. Detailed methods for collection and interpretation of FTIR and XANES are described in the Supplementary Materials. Reference materials, including hydroxyapatite (HAP-S), tricalcium phosphate (α-TCP & β-TCP), calcium phosphate dihydrate (CPD), calcium phosphate dihydrate dibasic (CPDD), and iron phosphate (FeP) used for FTIR and XANES analysis were obtained from Sigma Aldrich, Canada. In addition, hydroxyapatite (HAP-WM) was synthesized in the laboratory following a liquid mix technique described in [56] and used as reference material.
Phosphate sorbed on calcite (labelled PSC) reference materials were synthesized in the laboratory and characterized by FTIR and SEM-EDX. The quantity of phosphate in the PSC was estimated from the initial and final concentrations of P in the solution.
The spent BOFS samples and the reference materials were examined using a Leo 1530 field emission scanning electron microscope (FESEM) with energy-dispersive X-ray (EDX) analysis, with three to five different areas analyzed per sample, and analyzed by Fourier transform infrared spectroscopy (FTIR) with three replicates per sample.
X-ray photoelectron spectroscopic (XPS) analyses were performed using a Kratos Axis Ultra spectrometer, operated with a monochromatic Al K(α) source (15 mA, 14 kV). The XPS data processing software CasaXPS (version 2.3.14) was used to analyze the spectra.

2.3. Sample Collection and Analysis

Measurements of pH and Eh were made on unfiltered samples immediately after collection using combination electrodes (Thermo Scientific Orion ROSS pH electrode and Thermo Scientific Orion Eh electrode; Thermo Fisher Scientific, Waltham, Massachusetts, USA). Consistent with the methods outlined in [20], water samples, including field and trip blanks, were collected to analyze cations, anions, PO4-P, NH4-N, COD, CBOD5, and total coliform and Escherichia coli (E. coli). Cation and anion samples were filtered through a 0.45 µm membranes; cation samples were preserved with 16N HNO3 to pH < 2 after being filtered; both were stored at 4 °C and until analysis within 28 days of collection. PO4-P, NH3-N, cBOD5, and COD samples were acidified with 18N H2SO4 and stored at 4 °C. PO4-P and NH3-N samples were filtered through 0.45 µm membranes before acidifying and analyzed within 28 days after collection. PO4-P samples were analyzed with 7 days. COD samples were analyzed within 3 days and cBOD5 samples were analyzed immediately after the samples were collected. The total coliform and Escherichia coli (E. coli) samples were stored at 4 °C and analyzed within 24 h after collection. The average minimum and maximum air temperatures were −4.0 and 17.6 °C, and the influent sample temperatures were between 4.3 and 14.2 °C.
Phosphate (PO4-P) analyses were conducted using the ascorbic acid method, HACH Method 8048 based on SM 4500 P E [57]). K2HPO4 standard (Sigma-Aldrich. Potassium phosphate dibasic, CAS No.: 7758-11-4) was used for the preparation of standards to create the standard curve for the analysis. The detection limit for phosphorus analysis is 0.005 mg L−1.
Anions were analyzed by Dionex Ion Chromatograph model DX120, and anion AS50 analytical column(Thermo Fisher Scientific, Waltham, Massachusetts, USA) and Inorganic Ventures. “7 Anion Calibration Standard (125 mL).” Inorganic Ventures, n.d. Web. 29 July 2024 [58] was used for calibration. The method detection limit (MDL) for all anions was 0.01 mg L−1. Major cations were analyzed by inductively coupled plasma optical emission spectroscopy (ICP-OES; Thermo Instruments iCAP 6500 Duo; Thermo Fisher Scientific, Waltham, Massachusetts, USA) and ICP-OES standard, Inorganic Ventures. “26 Element ICP Calibration/Quality Control Standard.” Inorganic Ventures, n.d. Web. 29 July 2024 [59] was used for calibration. The MDL for Ca, mg, and Na was 0.2 mg L−1 and for K it was 0.1 mg L−1. Continuing calibration verification (CCV) recoveries were between 101 and 104%; quality control standards (QCS) were between 98 and 102%.
The trace element concentrations obtained by inductively coupled plasma mass spectrometry (ICP-MS; Thermo Instruments XSeries 2; Thermo Fisher Scientific, Waltham, Massachusetts, USA) and ICP-MS standard, Inorganic Ventures. “10 ppm 43 Element ICP Calibration/Quality Control Standard.” Inorganic Ventures, n.d. Web. 29 July 2024 [60] was used for calibration. The MDL varies among the elements (MDL for trace metals was between 0.2 and 0.006 µg L−1). Continuing calibration verification (CCV) recoveries were between 93 and 106%; quality control standards (QCS) were between 98 and 108%. The carbonaceous biochemical oxygen demand (cBOD5) was measured following the standard method ‘‘SM 5210 B’’ [53]. Chemical oxygen demand (COD) was determined using the standard method ‘‘SM 8000′’ [53]. Dissolved oxygen was measured using a YSI 5100 Dissolved Oxygen Meter (YSI Incorporated, Yellow Springs, OH, USA). NH3-N analysis was performed following the salicylate (colorimetric) method [61].
The most probable number counts for coliform and E. coli were determined using a 96-well titer plate method (ColiplateTM). All analyses were conducted at the CAWT Laboratory, Fleming College and the Environmental Geochemistry Laboratory, University of Waterloo. A subset of samples was analyzed for cations and trace metals at SGS Lakefield Research Limited for QA/QC purposes.

2.4. Geochemical Modeling

The geochemical modeling code PHREEQC Interactive was used to calculate the saturation indices (SIs) for CaP phases (e.g., hydroxyapatite) and other mineral phases relevant to the treatment system [62]. The WATEQ4F database was used for these calculations. Solubility product values for brushite, monetite, octacalciumphosphate, β-tricalciumphosphate, and variscite (Table S1) were added to the database using published solubility constants [31]. Saturation indices were calculated for four sampling events at the effluent of Cells 1, 2, 3, and 4.

2.5. Statistical Analysis

The Kruskal–Wallis One Way Analysis of Variance on Ranks indicates statistically significant differences in the median values of various water quality parameters and contaminants among the treatment cells (p < 0.001). To isolate the group or groups that differ from the others, a multiple comparison procedure was used.

3. Results and Discussion

The water chemistry data presented in [54] are included for the duration when the PhACs and artificial sweetener samples were collected; however, this article includes the full length of the experiment. Thus, there are some differences in the overall water chemistry.

3.1. Characteristics of the Reactive Materials

The BOFS particle size ranged from <0.5 to 8 mm. Among the BOFS fractions, the finest fraction represented the highest mass-weighted surface area, as indicated in Table S2. The particle density of the BOFS was 3.43 g cm−3. The XRF analysis of the BOFS indicated the presence of 33.8% CaO, 24.3% Fe2O3, 11.3% SiO2, 9.6% MgO, 4.1% MnO, and 7.4% Al2O3 (Table S2). The XRD analysis confirmed the presence of wuestite (FeO), lime (CaO), larnite (Ca(SiO4)), srebrodolskite (Ca2Fe2O5), anhydrite (CaSO4), and possibly portlandite (Ca(OH)2). However, it should be noted that only one of the analyzed samples contained both lime and anhydrite. The XRD analysis also detected the presence of corundum (Al2O3), which likely originated from the mortar and pestle used during sample preparation (Table S2). The particle size, surface area, and density of the zero-valent iron (ZVI) were 8 to 50 mesh (0.297–2.38 mm), 4.4 m2 g−1, and 6.7 g cm−3 (Table S3).

3.2. Flow Characteristics

The flow rate was highly variable throughout the study period due to variations in the size of student population at the college. The average flow rate was 0.89 m3 day−1 and the flow rate varied between 0.02 and 4.3 m3 day−1 (σ = 625, Figure S2). The mean hydraulic retention time was 7.6 (minimum HRT of 1.59 days) in Cells 2 and 3, and 6.0 (minimum HRT of 1.24 days) days in Cell 4. Although no significant change in flow rate was observed during the experimental period, it should be noted that a decrease in flow rate is expected in cases of prolonged operation without proper maintenance.

3.3. pH and Alkalinity

The mean pH values of the effluents from Cells 1, 2, 3, and 4 were 7.61, 7.81, 7.94, and 11.4, respectively (Table S4). A gradual increase in pH was observed in the effluents of Cells 2 and 3, which is attributed to CO2 respiration through plant roots in Cell 2 and aeration in Cell 3 (Figure 2). The effluent from Cell 4 consistently exhibited pH levels above 9.4, with a pH range of 10.9 ± 1.47 throughout the experiment. The mean alkalinity values in the effluents of Cells 1, 2, 3, and 4 were 550, 505, 237, and 738 mg L−1 as CaCO3, respectively (Table S4). Initially, the alkalinity values in the effluent from Cell 4 were notably high (up to 2360 mg L−1 as CaCO3), which can be attributed to the dissolution of CaO and Ca(OH)2 from the outer layers of the BOFS. Over time, the alkalinity values gradually decreased in Cell 4 effluent as the CaO and Ca(OH)2 phases became depleted. However, the pH values did not exhibit significant changes over time, likely because the hydraulic retention time (~5 days) was sufficient to dissolve the calcium phases from the BOFS.
The high-pH effluent from Cell 4 was neutralized in Cell 5, the pH adjustment tank, by sparging it with CO2. A significant volume of white precipitate accumulated at the bottom of the pH neutralization chamber. The accumulation of these precipitates during neutralization was expected because of the high average electrical conductivity (4052 µS cm−1) and total suspended solid (TSS) concentration (252 mg L−1) in the Cell 4 effluent compared to the effluent from the other cells (Figure 2). FTIR analysis suggested that these precipitates mainly consisted of CaCO3 (Table S5). The formation of carbonate minerals was minimized by maintaining a pH between 6.5 and 7 through CO2 sparging. The rate of CO2 addition required to neutralize the effluent pH was determined based on the difference between the measured concentration of OH in the effluent of Cell 4 and the desired OH concentration. Typically, 10−2 moles of CO2 are required to reduce the pH from 12 to 7.5 per L effluent.

3.4. Phosphorus Removal

Mean PO4-P (P) concentrations in the effluent from Cells 1, 2, 3, and 4 were 6.32, 6.74, 3.86, and 0.33 mg L−1, respectively (Figure 2). The removal efficiency of P in Cells 2, 3, and 4 was 4%, 20%, and 99%, respectively (Figure 2). Thus, the overall P removal efficiency of the treatment system is ~99%. The removal efficiency of P in Cell 3 (aerated CW cell) was 40%. Similar efficiencies (40–60%) have been reported for other aerated CW systems [12,63]. The extent of P removal was greatest (99%) in Cell 4. Furthermore, the P removal efficiency in Cell 4 was approximately 99% with respect to the effluent of Cell 3. The concentrations of PO4-P in the effluent of Cell 5 were greater than those in the effluent of Cell 4 (Figure S3). Phosphorus mass retention was higher in Cell 4 (~94%) compared to Cell 2 (1.3%) and Cell 3 (27%) during the experiment (Figure S2, Table S6). The influent and effluent PO4-P concentrations were not affected by the seasonal variations. However, the influent PO4-P concentration increased in the Fall terms when the student population was higher than the rest of the year.
The average TP concentration is 1.13 mg L−1 (with two outliers included in the calculation), which exceeded the water quality objectives of 1 mgL−1 [64] (a detailed description is provided in the Supplementary Information). However, the average TP is 0.9 mg L−1 without the outliers (out of 29 data points). There was a sharp decreasing trend observed after the outliers, indicating that the TP removal efficiency was not diminishing.
Adsorption, precipitation, and plant uptake are the primary mechanisms of phosphorus removal in constructed wetlands, which are facilitated by the presence of essential elements like Fe and Al hydrous oxides, Ca, and Mg [65]. The adsorption of inorganic P on the hydrous oxides of Fe and Al is favored in acidic environments; however, alkaline conditions are suitable for the precipitation of calcium phosphate phases [66]. The low removal efficiency of P in Cell 3 was probably due to the low abundance of Ca, Fe, and Al in the granitic gravel because these metals are commonly involved in the formation of P-bearing phases [12]. In contrast, the presence of significant quantities of Ca, Fe, Al, and Mg oxides (Table S2) in the BOFS enhanced the removal of P in Cell 4.
The precipitation of Al phosphate and Fe phosphate phases is favored in near-neutral to acidic conditions [67]. In contrast, Ca-rich alkaline conditions (pH > 9) favor the formation of calcium phosphate phases (e.g., hydroxyapatite) [31,32]. In BOFS-based treatment systems, the precipitation of calcium phosphate phases (i.e., hydroxyapatite) is found to be the most important P removal mechanism [31,32]. However, the formation of hydroxyapatite can be inhibited by high concentrations of dissolved Mg [37].
Under high pH conditions (pH > 9), due to the presence of CaO in the BOFS, HPO42− and PO43− are the dominant phosphate species [67]. Although the adsorption of these phosphate species is anticipated to be less significant at a high pH (pH > 9), the presence of several metal oxides in BOFS with a high pH of zero point of charge (pHZPC) values including 11.2% MgO (with pHZPC of 12.4 [68]), CaCO3 (pHZPC > 8.5 [69]), and 3.4% Al2O3 (pHZPC = 9.1 [68]) allow for modest phosphate adsorption on these metal oxides.
The influent water was consistently undersaturated with respect to brushite, monetite, and vivianite in all sampling events (Figure S4). It was also undersaturated with respect to variscite in all sampling events, except for that on 3 June 2010. Conversely, it was supersaturated with respect to octacalciumphosphate, β-tricalciumphosphate, MnHPO4, calcite, aragonite, gibbsite, goethite, ferrihydrite, hydroxyapatite, and strengite in all sampling events, except for 3 June 2010. Very low phosphate concentrations in the Cell 4 effluent and the supersaturation of the pore water with respect to calcium phosphate phases, including hydroxyapatite, one of the major P-bearing phases in Ca- and P-rich environments with lowest thermodynamic solubility product and high saturation indices [32,66,70,71], suggest that the precipitation of calcium phosphate phases is a likely mechanism for P retention in the BOFS media.

3.4.1. Fourier Transform Infrared Spectroscopy

FTIR spectra were collected for the outer layer materials of the spent media from the top 5 cm of the nine sampling locations in Cell 4. All spectra showed pronounced carbonate and phosphate bands. Table 2 summarizes the FTIR spectral data for the carbonate and phosphate bands observed in the samples. The sharp carbonate bands and their overtones suggest that calcite was one of the predominant minerals in the outer layer materials accumulated on the spent reactive materials. An example spectrum plotted with labeled carbonate vibrational bands for calcite and aragonite is shown in Figure S5. A broad phosphate ν3 band was observed in the range of 1030–1039 cm−1. Additionally, several phosphate ν4 bands were identified (Table 2). There was also a phosphate ν2 band noted between 450 and 461 cm−1 and at 475 cm−1. However, none of these spectra showed any signature of the phosphate ν1 band (Table S5). Although the phosphate ν3 and ν2 bands were well defined, most of the phosphate ν4 bands were weak to very weak. The FTIR spectra were analyzed and compared with reference materials, including HAP-S and β-TCP (Figure S5). The wavenumbers of the phosphate vibrational bands obtained from the reference materials were similar to the HAP and β-TCP reported in previous studies [37,56,72,73,74,75,76,77,78]. The phosphate vibrational bands of β-TCP showed a better match with the samples compared to HAP-S. However, due to the relatively low concentration of phosphorus compared to calcium in the samples, and the absence of appropriate conditions (e.g., high temperature, ~1000 °C required for the crystallization of HAP and β-TCP), the wavenumbers may not align precisely with those of crystalline reference materials during the formation of CaPO4.

3.4.2. XANES Spectroscopy

XANES spectra were collected for samples P2-S1, P2-S2, and P8-S1 from the upper influent and effluent part of Cell 4 (Figure 3). The XANES spectra show the presence of phosphate (oxidation state +5)-bearing phases by comparing the primary fluorescence peak positions. The primary peak positions reported for the reference phosphate species are approximately 2149 eV [83,84], 2150 eV [85,86], 2151 eV [87], and 2158.5 eV [88]. This primary peak is also referred to as the absorption edge or white line in the XANES spectra [86,87], and is based on the charge, electronegativity, and interatomic distance of the coordinating cation. The white line may vary between ±0.5 eV [89]. The pre- and post-edge spectral features that are characteristic of various phosphate phases, including Ca-, Fe-, and Al-phosphates, have been described in previous studies [83,84,85,90,91,92].
The energy range of the P K-edge of the CaP reference materials analyzed in this study was between 2151.5 and 2151.7 eV. A well-defined post-edge shoulder (~2154.7 eV) and two other features (~2162.5 eV and ~2169.0 eV) were observed in the spectra. The iron phosphate reference material, iron (III) phosphate, exhibited a white line at a higher energy (2152.2 eV) and displayed a unique pre-edge feature at 2148.5 eV. The position of this pre-edge feature is consistent with the results of previous studies [83,84,85,90,91,92,93].
The calcium phosphate phases all exhibited a shoulder at ~2154.7 eV (Figure 3i(c)) and a distinct feature at ~2162.5 eV (Figure 3i(d)). Although other studies have reported different energies for these features, their relative positions with respect to the white lines were within the same range [84,88]. Another feature at ~2169 eV was observed at a similar position relative to the white line, which was attributed to oxygen oscillation by [84,88].
XANES spectra of the calcium phosphate reference materials and the spent BOFS samples are compared in a combined plot (Figure 3i). Phosphate sorbed on calcite (PSC) was synthesized in the laboratory and used as a reference material in this study. The XANES spectrum of this PSC sample closely resembled the PSC spectrum presented in previous studies [20,88,94]. The absorption edges of all spectra collected for the samples from Cell 4 were between 2151.5 and 2151.7 eV. This edge position was similar to that observed for the Ca-PO4 reference materials. The samples obtained from Cell 4 also showed post-edge features, including a shoulder at 2154.7 eV, a Ca-PO4 peak at 2162.5 eV, and an oxygen oscillation peak at 2169.0 eV. Although their relative positions were similar to those observed in the reference materials, these features were not as distinct as those observed in the reference materials. The sharpness of spectral features is proportional to the degree of crystallinity [84,88]. The XANES spectra showed small differences between the samples, suggesting minor differences in the composition or structure. No pre-edge features were observed in the XANES spectra of the samples, indicating the absence of iron phosphate phases.
In the linear combination (LC) fitting of calcium phosphate (Ca-PO4) reference materials to the sample spectra, iron phosphate (Fe-PO4) was excluded due to the absence of the distinctive pre-edge feature in the samples. The linear combination (LC) fitting of P-XANES spectroscopy on spent BOFS samples highlighted the dominant influence of Phosphate Sorbed on Calcite (PSC 1%) in the examination of phosphate forms (Figure 4; Table S7). For sample P3-S1, LC fits showed a nearly exclusive presence of PSC 1%, with minor contributions from calcium phosphate dihydrate (CPD) and dihydrate dibasic (CPDD) along with β-tricalcium phosphate (β-TCP), yielding low chi-square (χ2) values of 0.38. In sample P4-S1, a notable composition of 81.5% PSC 1% and 18.5% α-tricalcium phosphate (α-TCP) was observed, with slightly higher χ2 values indicating more complex phosphate interactions. Sample P6-S1 demonstrated a dominant fit of PSC 1% and β-TCP, showing a low χ2 of 0.33. Similarly, for sample P8-S1, the combination of hydroxyapatite (HAP), PSC 1%, and β-TCP resulted in a χ2 of 1.65, also indicating significant contributions of PSC 1% and β-TCP. These results emphasize typical spectral discrepancies observed in the literature, as highlighted by higher χ2 values for sample P8-S2, which is consistent with previous findings [86]. However, this analysis supports the contribution of PSC 1% in the spectral characteristics of the sample. These results affirm that sorption is the most significant mechanism influencing the phosphate-binding dynamics in BOFS, emphasizing its utility in understanding phosphate interactions in environmental and treatment contexts.
In the analysis of Ca-XANES spectra, all samples and reference materials displayed a small pre-edge feature at approximately 4039.5 eV and a consistent Ca K-edge around 4046.8 eV, aligning with previous findings (Figure 3ii). Notably, the spent BOFS samples showed a pre-edge shoulder at 4043.0 eV, a post-edge shoulder at 4059.0 eV, and sharp post-edge features at 4070.4 and 4079.0 eV. Similar spectral characteristics were observed in PSC 0.004%, 1%, and 8% samples, particularly a broad post-edge shoulder at 4059.0 eV comparable to that of calcite, and another distinctive post-edge peak at 4094.0 eV that matched with PSC and calcite references. Additional post-edge peaks in other materials ranged from 4091.0 to 4094.2 eV.
The linear combination fitting of Ca-XANES spectra for spent BOFS samples highlighted the significant influence of PSC 1% in spectral matching (Figure 4, Table S8). For sample P3-S1, an optimal fit was achieved with a χ2 value of 0.07 using a combination of PSC 1% and α-TCP. Samples P4-S1 and P6-S1 showed best fits with combinations of PSC 1% and CPDD, both achieving lower χ2 values of 0.05 and 0.04, respectively. For P8-S1, the combination of PSC 1%, CPDD, and β-TCP resulted in a χ2 of 0.05, reconfirming the importance of PSC 1% in phosphate binding within the BOFS matrix.

3.5. Ammonia and Nitrate

The mean concentrations of NH3-N in Cell 1, 2, 3, and 4 effluents were 48, 38, 3.6, and 8.3 mg L−1, respectively, while the concentrations of NO3-N in Cell 1, 2, 3, and 4 effluents were 3.3, 2.2, 42, and 35 mg L−1, respectively. There were sharp differences observed in NH3-N and NO3-N concentrations between effluents from Cells 2 and 3 during the experiment (Table S4). The removal efficiencies of NH3-N in Cells 2, 3, and 4 were 19, 90, and -128%, respectively. Although Cell 4 contributed ~128% of NH3-N with respect to the Cell 3 effluent, the overall removal efficiency of the treatment system was ~83%.
The mean NO3-N concentration decreased in Cell 2 by 35% and then increased sharply in Cell 3 (~19 times higher than the concentrations in the Cell 2 effluent). Finally, the NO3-N concentration decreased by 17% in Cell 4 with respect to the Cell 3 effluent (Figure 2). These sharp changes in NH3-N and NO3-N concentrations from Cells 2 to 3, which were also reflected by the high NO3-N to NH4-N ratio (between 1.6 and 5455) in Cell 3, can be attributed to the microbially mediated oxidation of NH3-N to NO3-N. Nitrification was enhanced by the continuous supply of O2 through the forced aeration system, as evidenced by the high dissolved oxygen (DO) concentrations in these cells (Figure 2, Table S4). Similar degrees of nitrification have been observed in other CW systems [95,96].
The ZVI layer at the bottom of Cell 4 may have played an important role in increasing the ammonia concentration in the effluent of Cell 4. The reduction in nitrate and nitrite by ZVI and the release of NH3 have been reported in previous studies [97,98]. A very small positive change in mass (2% N mass loss) was observed in this treatment system (Table S9). There is no specific water quality objective for NH3-N. The explanation of the water quality objectives is provided in the Supplementary Materials.

3.6. Carbonaceous Biochemical Oxygen Demand (cBOD5) and Chemical Oxygen Demand (COD)

Significant reductions in both cBOD5 and COD were observed in the treatment system, as detailed in Table S10. Initial concentrations in Cell 1 were followed by a progressive decrease through the treatment process. The removal efficiencies for cBOD5 in Cells 2, 3, and 4 were 58%, 71%, and 89%, respectively, with an overall system efficiency exceeding 99%. The removal efficiency in Cell 3 was 71%, reflecting an increase of approximately 23% from the removal efficiency observed in Cell 2, which is somewhat lower than the previously reported values [99]. The high cBOD5 removal efficiency in Cell 3 demonstrates aerobic degradation as the primary mechanism for organic matter removal, a finding consistent with previous studies [100,101]. The significant increase in NO3-N levels and concurrent decrease in NH3-N within this cell further suggest that the elevated NO3-N concentrations are due to the aerobic oxidation of NH3-N. Moreover, the variations in cBOD5 removal across the cells illustrate the impact of different treatment conditions, particularly the highly alkaline environment in Cell 4, which likely contributes to the further breakdown of residual organic material.
The mean initial COD concentrations in Cells 1, 2, 3, and 4 were 143, 72, 28, and 34 mg L−1, respectively. This change represents a progressive decrease in COD through the treatment Cells 1–3, with removal efficiencies in Cells 2 and 3 of 50% and 61% relative to Cell 1. Although an increase in COD by 20% was observed in Cell 4 compared to Cell 3, the overall COD removal efficiency of the treatment system was ~76%. Similar to COD, the aerobic degradation of cBOD5 is the main mechanism of cBOD5 removal in Cell 3, which is consistent with [102]. The fluctuation in both cBOD5 and COD levels throughout the treatment process can be attributed to variations in flow, which were influenced by changes in the student population (Tables S10 and S11).

3.7. Major Ion Chemistry
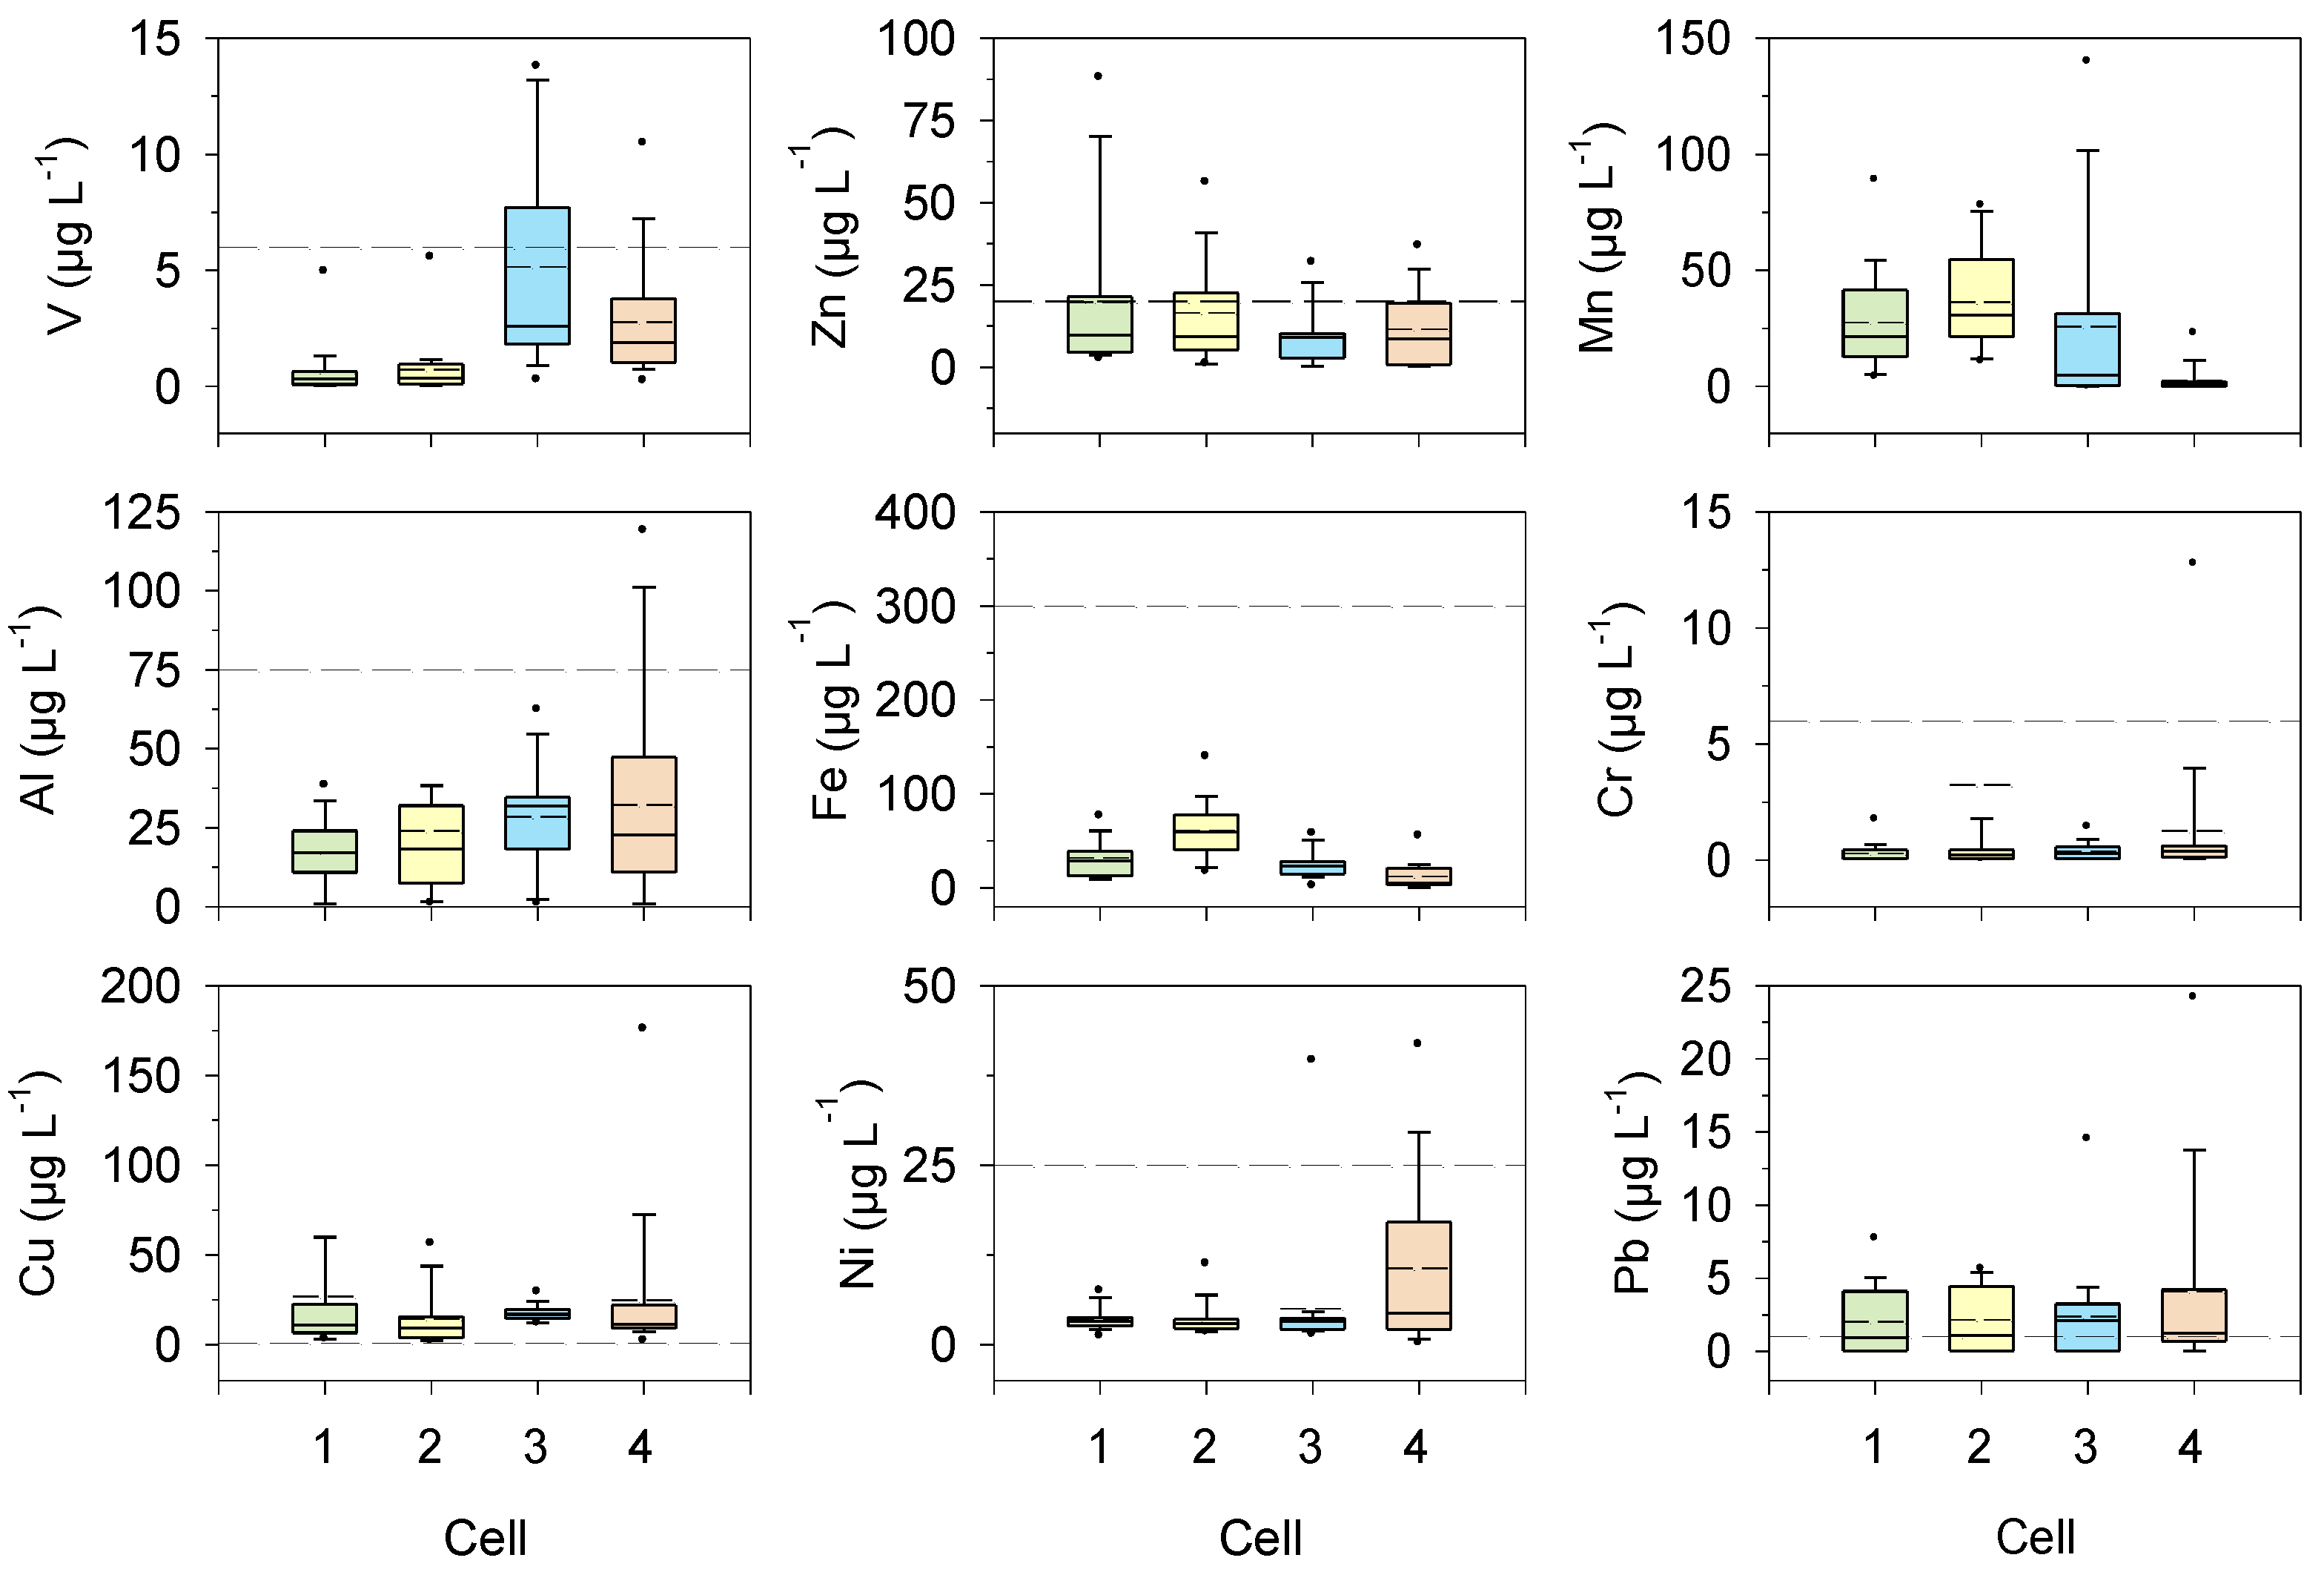
Consistent trends were observed in major ion concentrations throughout the study. The mean Ca concentration was 101 mg L−1 in the Cell 1 effluent, which remained at 101 mg L−1 in Cell 2 and rose to 105 mg L−1 in Cell 3. In Cell 4, a significant spike in Ca concentration to 193 mg L−1 was initially observed, likely due to the dissolution of CaO and Ca(OH)2. Over time, as continuous flushing occurred, the concentrations notably decreased, stabilizing at lower levels (Figure S6). In Cell 5, where CO2 sparging occurred, there was a marked decrease in Ca concentrations, likely as a result of CaCO3 precipitation (Figure S6). Sodium concentrations were fairly constant, initially 131 mg L−1 in Cell 1 and gradually decreasing across the treatment cells to 119 mg L−1 in Cell 4, reflecting the conservative nature of Na (Figure S6). Magnesium concentrations showed a decrease from 12 mg L−1 in Cell 1 to 11 mg L−1 in Cell 2, an increase to 14 mg L−1 in Cell 3, and a sharp decline to 4.3 mg L−1 in Cell 4, possibly due to Mg incorporation into CaCO3 precipitates (Figure S6). Sulfate (SO42−) concentrations fluctuated; they started at 42.3 mg L−1 in Cell 1, then decreased by 20% to 33.9 mg L−1 in Cell 2, increased by 35% to 45.6 mg L−1 in Cell 3, and then decreased by 33% to 30.5 mg L−1 in Cell 4. The reducing conditions in Cell 4, indicated by low Eh values (Figure 2), were conducive to sulfate reduction and the precipitation of metal sulfides. Chloride concentrations remained stable with only a 5% variation throughout the cells, maintaining conservative behavior in the treatment system (Figure S6 and Table S4).

3.8. Trace Metals

The concentrations of dissolved trace metals such as Zn, Fe, Mn, Cr, Ni, and Pb remained predominantly below the water quality guidelines for Ontario (Figure 5, [103]), with only a few exceptions noted in the initial stages. The mean Al concentrations in the effluents from Cells 1, 2, 3, and 4 were 17.1, 24.0, 28.4, and 32.3 µg L−1, respectively. The concentration of Al exhibited a gradual increase along the flow path but decreased significantly in Cell 5 as the cell pH was adjusted to near-neutral levels (Figure S3, [66]), reflecting the typical decrease in Al solubility at lower pH values.
The release of V from BOFS has been observed previously [104], and the observed increase in V was probably derived from BOFS. The V concentrations in the effluents from Cells 1 and 3 were relatively low (<1.5 µg L−1) and then increased to 5.2 µg L−1 in the effluent from Cell 4, before decreasing again to 2.8 µg L−1 in the Cell 5 effluent (Figure S5). This pattern of fluctuation in V concentrations can be attributed to the release of V from BOFS, particularly noted during the initial stages of the experiment where V concentrations in the effluent of Cell 3 reached as high as 13.76 µg L−1. The high concentrations of V were likely due to the presence of a small sacrificial container filled with BOFS positioned just below the effluent pipe of Cell 3. As the experiment progressed, the release of V decreased, and the concentrations in the effluent from Cell 4 were lower than expected (1.36 µg L−1), suggesting the influence of the ZVI layer at the base of Cell 4 in reducing vanadate (VO43−) and facilitating its precipitation or adsorption. However, this increase was less than that observed in previous studies [35].
Copper concentrations varied across the cells, with the effluent from Cell 1 showing the highest levels of up to 59.9 µg L−1, which exceeds the Ontario water quality guidelines of 1 µg L−1 [103]. The mean Cu concentrations in the effluents from Cells 1, 2, 3, and 4 were 26.9, 14.4, 17.6, and 24.8 µg L−1, respectively. Despite these fluctuations, the average concentration of Cu in the Cell 4 effluent reached a maximum of 72.5 µg L−1, but remained below the peak levels observed in Cell 1, indicating the partial removal of Cu by the CW system (Figure 5).

3.9. Inactivation of Bacterial Indicators (E. coli and Total Coliforms)

The mean influent and effluent concentrations of E. coli were 3.31 × 10⁵ and 1.01 × 10² CFU 100 mL−1, while the mean influent and effluent concentrations of total coliform were 2.00 × 10⁶ and 8.49 × 101 CFU 100 mL−1 (Table S10). The inactivation of both E. coli and total coliforms in Cells 2 and 3 occurred due to aeration, and in Cell 4 due to highly alkaline conditions. All the treated cells contributed significantly to the inactivation of bacterial indicators with more than 99.9% efficiency.

3.10. Statistical Analysis and Interpretation

The confidence intervals for PO4-P concentrations in Cells 1 and 2 indicate high and similar efficiencies in phosphorus removal, with overlapping intervals suggesting comparable performance (Table S4). In contrast, Cell 3 exhibits a significantly lower PO4-P concentration with a narrow confidence interval, indicating more precise and effective removal. Cell 4 shows the lowest PO4-P concentration with an extremely narrow confidence interval, reflecting highly efficient and consistent PO4-P removal. For NH3-N concentrations, Cell 1 has the highest concentration with wide variability, while Cell 2 shows a reduction with narrower variability, though still inconsistent. Cell 3 demonstrates effective NH3-N removal with a narrow confidence interval, and increased concentration in Cell 4 with high variability highlights the need for optimization. In terms of NO3-N concentrations, Cells 1 and 2 show low levels with high variability, indicating initial nitrification stages or active denitrification. The significantly higher NO3-N concentration in Cell 3 with moderate variability suggests efficient nitrification, while Cell 4 maintains high nitrate levels with moderate variability, indicating sustained nitrification with potential denitrification. The evolution of dissolved oxygen (DO) concentrations from low in Cell 1 to high in Cell 3 indicates a transition from anaerobic to aerobic conditions, which are crucial for sequential contaminant treatment. The consistent reduction in cBOD5 and COD concentrations across the cells, with decreasing variability, reflects the efficiency of the system in degrading organic pollutants (Table S10). The significant reduction in total coliform and E. coli concentrations from Cell 1 to Cell 4, with progressively lower variability, highlights the effectiveness of the system in bacterial contaminant removal, ensuring the effluent meets safety standards.

3.11. Statistical Comparison Using Dunn’s Method

Multiple comparisons using Dunn’s Method show that Cells 1 and 2 significantly differ from Cells 3 and 4 in PO4-P concentrations, with Cell 3 also significantly differing from Cell 4, and no significant difference between Cells 1 and 2. For NH3-N concentrations, Cell 1 significantly differs from Cells 3 and 4, and Cell 2 significantly differs from Cells 3 and 4, with no significant differences between Cells 1 and 2, and Cells 4 and 3. In terms of NO3-N concentrations, Cells 3 and 4 significantly differ from Cells 1 and 2, but there is no significant difference between Cells 3 and 4, and between Cells 1 and 2. NO2-N concentrations show that Cell 4 significantly differs from Cells 1, 2, and 3, but there are no significant differences among Cells 1, 2, and 3.
Multiple comparisons using Dunn’s Method reveal that the DO concentrations in Cell 4 significantly differ from Cells 1, 2, and 5, and Cell 5 significantly differs from Cells 1 and 2, with no significant difference between Cells 1 and 2. For carbonaceous BOD (cBOD5) concentrations, Cell 1 significantly differs from Cells 3 and 4, Cell 2 significantly differs from Cells 3 and 4, and Cell 3 significantly differs from Cell 4, with no significant difference between Cells 1 and 2. The COD concentrations show that Cell 1 significantly differs from Cells 2, 3, and 4, and Cell 2 significantly differs from Cells 3 and 4, with no significant difference between Cells 3 and 4. The total coliform concentrations demonstrate that all pairwise comparisons are significant, indicating that each cell significantly differs from the others. Similarly, E. coli concentrations show that all pairwise comparisons are significant, with each cell significantly differing from the others. These findings highlight the effectiveness of the treatment processes in significantly reducing contaminant levels across the different treatment cells, with specific cells showing distinct performance differences.

3.12. Environmental Impact and Sustainability

Utilizing BOFS in constructed wetlands for wastewater treatment provides environmental and economic benefits; however, it requires a thorough evaluation of long-term sustainability and environmental impacts. The utilization of BOFS reduces disposal needs for the steel industry and benefits the wastewater treatment industry. It is effective in removing phosphorus through adsorption and precipitation, which eventually mitigate eutrophication. However, the high pH conditions created through the use of BOFS could lead to metal leaching, particularly vanadium and chromium. A pH adjustment unit and a zero-valent iron (ZVI) layer are incorporated to ensure that the treated effluent meets water quality guidelines. Although the high alkalinity conditions created by BOFS facilitate the inactivation of pathogens, it can also harm aquatic ecosystems. Therefore, an effluent neutralization unit is necessary to adjust the pH levels and prevent any adverse effects.
Employing BOFS in the constructed wetlands aligns with circular economy principles by converting industrial byproducts into valuable resources, reducing waste, and enhancing resource efficiency. Long-term studies are important to determine the life-span of the BOFS media for its treatment efficiency. Continuous monitoring can help identify changes in treatment efficiency and environmental impact. The outcome of BOFS in pilot-scale systems indicates the potential for larger-scale applications and adaptability to various wastewater compositions and environmental conditions. BOFS provides an affordable solution for phosphorus removal, making it cost-effective for regions with limited financial resources.
Addressing these issues is crucial for effective wastewater treatment and promoting sustainable environmental practices with BOFS in constructed wetlands.

3.13. Practical Implications and Potential Limitations

The BOFS and ZVI in a multicomponent constructed wetland wastewater treatment system offers an effective solution for contaminant removal. The high removal efficiency of the treatment system for the contaminants including phosphorus, nitrogen, COD, cBOD5, and pathogens like E. coli and total coliforms highlights the potential of these systems to address key environmental challenges. This treatment option not only helps in reducing eutrophication in surrounding water bodies, but also ensures that the treated effluent meets the water quality guidelines.
This study also emphasizes the importance of optimizing operational conditions including aeration, flow rates, and hydraulic retention time to maintain the efficiency of the treatment system. The benefit of using BOFS as a treatment medium including the precipitation of calcium phosphate phases and disinfection through creating high pH conditions offers a preferable treatment option. The implementation of this type of wastewater treatment system can be beneficial for small- to medium-sized wastewater systems in rural and suburban areas, which also provides a cost-effective and environment friendly alternative to conventional wastewater treatment systems.
While the treatment system demonstrates various benefits, its sustainability can be further enhanced by addressing several potential limitations. Seasonal variations can impact treatment performance, and fluctuations in influent wastewater characteristics, flow rates, and aeration rates need to be carefully managed. Additionally, the potential for metal leaching from various BOFS sources under different environmental conditions must be thoroughly evaluated. To ensure the long-term efficacy and adaptability of the system, extensive performance assessments at both demonstration-scale and full-scale field trials are essential.

4. Conclusions

This study demonstrates the effectiveness of constructed wetland systems enhanced with basic oxygen furnace slag (BOFS) and zero-valent iron (ZVI) for treating municipal and domestic wastewater. The integration of these materials within the constructed wetlands not only meets but often exceeds removal efficiencies for critical contaminants of concern such as phosphorus, nitrogen, chemical oxygen demand (COD), and carbonaceous biochemical oxygen demand (cBOD5). These systems showed their potential to prevent eutrophication in surface water bodies through efficient nutrient removal and highlighted the benefit of BOFS in wastewater treatment processes.
Our findings reveal that the specific configuration of treatment cells, including vegetated subsurface flow cells and pH adjustment units, along with the use of BOFS and ZVI, significantly enhances the phosphorus removal capabilities through mechanisms such as adsorption and coprecipitation. The operational conditions, such as flow rates and aeration, significantly influence system performance, but required regular monitoring to maintain optimal functionality. The geochemical modeling and the application of XANES and FTIR spectroscopy enhanced the understanding of the interactions within the system.
Microbial activity, particularly involving nitrification and denitrification processes, plays a crucial role in managing nitrogen levels within the wetlands. The alkaline conditions, attributed to the presence of BOFS, promote the precipitation of PO4. However, these conditions also lead to concerns such as potential metal leaching. The results from this study illustrate the potential benefits of integrated treatment systems including high removal rates for multiple contaminants, including phosphorus, nitrogen, pathogens like E. coli and total coliforms, and trace metals, with efficiencies often exceeding 99%. The use of BOFS not only promotes the precipitation of calcium phosphate phases such as β-tricalcium phosphate (β-TCP) and hydroxyapatite (HAP), but also ensures effective disinfection due to the elevated pH levels.
There are several areas for improvement and potential future research. One of the main research objectives could be long-term monitoring by varying the volume fraction of ZVI in Cell 4. Geochemical reactive transport modeling can help estimate the optimal ZVI volume fraction. This modeling may also predict the longevity of BOFS and its expected phosphorus removal efficiency, aiding in the selection of appropriate slag types for the treatment system. Future research may also focus on optimizing hydraulic retention time (HRT), as it is a critical factor for successful technology implementation. Additionally, exploring the feasibility of scaling up the treatment system can be considered to increase its technology readiness level (TRL). Finally, comprehensive environmental impact assessments and public health implications must be considered to ensure the treated effluent meets all safety standards.

Supplementary Materials

The following supporting information can be downloaded at: https://www.mdpi.com/article/10.3390/w16152198/s1, Figure S1: Locations of solid phase spent media collected from the BOFS cell; Figure S2: Flow rate, PO4-P concentrations in the influent and effluent, and P load in BOFS Cell; Figure S3: pH values, Ca, Al, and PO4-P concentrations versus distance (Cells 1–5) along the flow path; Figure S4: Saturation indices for calcium phosphate and other related phases (calculated using PHREEQCI) along the treatment cells during three sampling events. Saturation index of hydroxyapatite (indicated by *) was plotted using a modified log Ksp value [31]; Figure S5: FTIR spectrum of sample with highest mass and reference materials and sample P2-S1, with phosphate vibrational bands for (a) HAP-S, (b) β-TCP, (c) calcite, (d) aragonite. Vertical dotted lines in “a” and “b” represent phosphate vibrational bands, while vertical dotted lines in “c” and “d” represent carbonate vibrational bands: Figure S6: Box plots of Ca, Na, Mg, K, SO4, and Cl concentrations versus distance (Cells 1–4) along the flow path. Boxes represent 50% of the data (between the first and third quartiles). Horizontal solid lines and broken lines on the boxes represent median and mean concentrations. Bars extend from the box to the highest/lowest value within 1.5 × inter-quartile range (IQR). Points (outliers) are values > 1.5 × IQR. Top- and bottom-most dots represent maximum observation above upper fence and minimum observation below lower fence; Table S1: Ksp values of the calcium phosphate minerals added to the PHREQCI database; Table S2: Physical and chemical properties of the BOFS materials used in the experiments [54]; Table S3: Physical and chemical properties of the ZVI materials used in the experiments [54]; Table S4: Mean (arithmetic) concentrations, concentration ranges (expressed as average of maximum and minimum values), standard deviation, confidence Norm, and 95% confidence interval of pH, alkalinity, conductivity, and other target parameters including PO4, NH3-N, NO3-N, NO2-N, Cl, and SO4 in the effluents of Cells 1, 2, 3, and 4; Table S5: Vibrational bands of carbonate and phosphate and the corresponding wavenumbers in the FTIR spectra of the surface materials; Table S6: Mass change of PO4-P observed in different components of the treatment system. The +ve values indicate mass losses from the system component; Table S7: Linear combination fitting results of P-XANES for spent BOFS samples; Table S8: Linear combination fitting results of Ca-XANES for spent BOFS samples; Table S9: Mass change of NT observed in different components of the treatment system. The +ve values indicate mass losses from the system component and the −ve values indicate mass gains within the system component; Table S10: Mean (arithmetic) concentrations, concentration ranges (expressed as average of maximum and minimum values), standard deviation, confidence Norm, and 95% confidence interval of DO, cBOD5, COD, total coliform, and E. coli in the effluents of Cells 1, 2, 3, and 4; Table S11: Mass change of cBOD5 observed in different components of the treatment system. The +ve values indicate mass losses from the system component.

Author Contributions

Conceptualization, S.I.H., D.W.B. and C.J.P.; Formal analysis, S.I.H.; Investigation, S.I.H., B.C.W., G.B. and J.H.; Resources, D.W.B., C.J.P., B.C.W., G.B. and J.H.; Data curation, S.I.H. and G.B.; Writing—original draft, S.I.H.; Writing—review and editing, D.W.B. and C.J.P.; Supervision, D.W.B. and C.J.P.; Project administration, D.W.B. and C.J.P.; Funding acquisition, D.W.B. and C.J.P. All authors have read and agreed to the published version of the manuscript.

Funding

This research was supported by the Natural Sciences and Engineering Research Council (NSERC) Discovery Grants awarded to D. Blowes and C. Ptacek, the Ontario Research Fund—Research Excellence Program awarded to D. Blowes and C. Ptacek, the Lake Simcoe Region Conservation Authority, the Lake Simcoe Clean-up Fund of Environment Canada, and the Ontario Ministry of the Environment. The XANES experiments were performed at the Canadian Light Source, which is supported by NSERC, NRC, CIHR, and the University of Saskatchewan on the 06B1-1 (SXRMB) beamline as part of proposal # 16-4419 and 18-5318.

Data Availability Statement

Data are contained within the article.

Acknowledgments

We thank Y. Hu for assistance with the synchrotron spectroscopy. We also thank B. Gibson, J.H. Jamieson-Hanes, K.T. Leung, N. Heinig, J. Fisher, H. Siu, M. Biesinger, J. Bain, L. Groza, J. Hu, S. Collins, H. Broadbent, and J. Ma for their assistance.

Conflicts of Interest

The authors declare no conflict of interest.

References

  1. EPA 910-R-07-002; Advanced Wastewater Treatment to Achieve Low Concentration of Phosphorus. U.S. Environmental Protection Agency, Office of Water and Watersheds: Washington, DC, USA, 2007.
  2. Vymazal, J. Subsurface horizontal-flow constructed wetlands for wastewater treatment: The Czech experience. Wetl. Ecol. Manag. 1997, 4, 199–206. [Google Scholar] [CrossRef]
  3. Xue, X.; Hawkins, T.; Schoen, M.; Garland, J.; Ashbolt, N. Comparing the life cycle energy consumption, global warming and eutrophication potentials of several water and waste service options. Water 2016, 8, 154. [Google Scholar] [CrossRef]
  4. Basu, S. Controlling Nitrogen and Phosphorous in Wastewater. Chem. Eng. Prog. 2020, 116, 28–34. [Google Scholar]
  5. Preisner, M.; Neverova-Dziopak, E.; Kowalewski, Z. Mitigation of eutrophication caused by wastewater discharge: A simulation-based approach. Ambio 2020, 50, 413–424. [Google Scholar] [CrossRef] [PubMed]
  6. Pandey, P. Eutrophication in aquatic ecosystem. In Aquatic Environment Management; Pandey, P.K., Pande, A., Eds.; CRC Press: Boca Raton, FL, USA, 2023; pp. 50–62. [Google Scholar] [CrossRef]
  7. Tat Wai, K.; O’Sullivan, A.D.; Bello-Mendoza, R. Nitrogen and Phosphorus Removal from Wastewater Using Calcareous Waste Shells—A Systematic Literature Review. Environments 2024, 11, 119. [Google Scholar] [CrossRef]
  8. Vymazal, J. Removal of nutrients in various types of constructed wetlands. Sci. Total Environ. 2007, 380, 48–65. [Google Scholar] [CrossRef] [PubMed]
  9. Kadlec, R.H.; Wallace, S. Treatment Wetlands, 2nd ed.; CRC Lewis Publishers Press: Boca Raton, FL, USA, 2009. [Google Scholar] [CrossRef]
  10. Vymazal, J. Constructed wetlands for wastewater treatment: Five decades of experience. Environ. Sci. Technol. 2011, 45, 61–69. [Google Scholar] [CrossRef] [PubMed]
  11. Huang, X.; Liu, C.; Li, K.; Su, J.; Zhu, G.; Liu, L. Performance of vertical up-flow constructed wetlands on swine wastewater containing tetracyclines and tet genes. Water Res. 2015, 70, 109–117. [Google Scholar] [CrossRef]
  12. Vymazal, J. Removal of phosphorus in constructed wetlands with horizontal sub-surface flow in the Czech Republic. Water Air Soil Pollut. Focus 2004, 4, 657–670. [Google Scholar] [CrossRef]
  13. Gubernat, S.; Masłoń, A.; Czarnota, J.; Koszelnik, P. Reactive Materials in the Removal of Phosphorus Compounds from Wastewater—A Review. Materials 2020, 13, 3377. [Google Scholar] [CrossRef]
  14. Murujew, O.; Le Corre, K.; Wilson, A.; Bajón Fernández, Y.; Vale, P.; Jefferson, B.; Pidou, M. Reactive media constructed wetland for phosphorus removal: Assessing the opportunity and challenges. H2Open J. 2024, 7, 187–198. [Google Scholar] [CrossRef]
  15. Johansson, L. Industrial by-products and natural substrata as phosphorus sorbents. Environ. Technol. 1999, 20, 309–316. [Google Scholar] [CrossRef]
  16. Drizo, A.; Comeau, Y.; Forget, C.; Chapuis, R.P. Phosphorus saturation potential: A parameter for estimating the longevity of constructed wetland systems. Environ. Sci. Technol. 2002, 36, 4642–4648. [Google Scholar] [CrossRef] [PubMed]
  17. Jenssen, P.D.; Krogstad, T. Design of constructed wetlands using phosphorus sorbing lightweight aggregate (LWA). In Constructed Wetlands for Wastewater Treatment in Cold Climates; Mander, Ü., Jenssen, P.D., Eds.; WIT Press: Southampton, UK; Boston, MA, USA, 2003; Volume 11, pp. 259–272. [Google Scholar]
  18. Barca, C.; Troesch, S.; Meyer, D.; Drissen, P.; Andrès, Y.; Chazarenc, F. Steel slag filters to upgrade phosphorus removal in constructed wetlands: Two years of field experiments. Environ. Sci. Technol. 2013, 47, 549–556. [Google Scholar] [CrossRef] [PubMed]
  19. Mansing, R.P.; Rout, P.D. Removal of phosphorus from sewage effluent by adsorption on laterite. Int. J. Eng. Res. Technol. 2013, 2, 551–559. [Google Scholar]
  20. Hussain, S.I.; Blowes, D.W.; Ptacek, C.J.; Jamieson-Hanes, J.H.; Wootton, B.; Balch, G.; Higgins, J. Mechanism of phosphorus removal in a pilot-scale constructed wetland/BOF slag wastewater treatment system. Environ. Eng. Sci. 2015, 32, 340–352. [Google Scholar] [CrossRef]
  21. Yun, Y.; Zhou, X.; Li, Z.; Uddin, S.M.N.; Bai, X. Comparative research on phosphorus removal by pilot-scale vertical flow constructed wetlands using steel slag and modified steel slag as substrates. Water Sci. Technol. 2015, 71, 996–1003. [Google Scholar] [CrossRef] [PubMed]
  22. Mateus, D.M.R.; Vaz, M.M.N.; Capela, I.; Pinho, H.J.O. The potential growth of sugarcane in constructed wetlands designed for tertiary treatment of wastewater. Water 2016, 8, 93. [Google Scholar] [CrossRef]
  23. Gupta, P.; Ann, T.W.; Lee, S.M. Use of biochar to enhance constructed wetland performance in wastewater reclamation. Environ. Eng. Res. 2016, 21, 36–44. [Google Scholar] [CrossRef]
  24. Claveau-Mallet, D.; Boutet, É.; Comeau, Y. Steel slag filter design criteria for phosphorus removal from wastewater in decentralized applications. Water Res. 2018, 143, 28–37. [Google Scholar] [CrossRef]
  25. Zehua, J.; Wenzhong, T.; Yuansheng, P. Constructed wetland substrates: A review on development, function mechanisms, and application in contaminants removal. Chemosphere 2022, 286, 131564. [Google Scholar] [CrossRef]
  26. Drizo, A.; Forget, C.; Chapuis, R.P.; Comeau, Y. Phosphorus removal by electric arc furnace steel slag and serpentinite. Water Res. 2006, 40, 1547–1554. [Google Scholar] [CrossRef]
  27. Drizo, A.; Frost, C.A.; Grace, J.; Smith, K.A. Physico-chemical screening of phosphate-removing substrates for use in constructed wetland systems. Water Res. 1999, 33, 3595–3602. [Google Scholar] [CrossRef]
  28. Vohla, C.; Kõiv, M.; Bavor, H.J.; Chazarenc, F.; Mander, Ü. Filter materials for phosphorus removal from wastewater in treatment wetlands-A review. Ecol. Eng. 2011, 37, 70–89. [Google Scholar] [CrossRef]
  29. Mikhail, S.A.; Owens, D.R.; Wang, S.S.B.; Lastra, R.; Van Huyssteen, E. Characterization of Basic Oxygen Furnace Dust and Slag in Steelmaking; Report No. 94-18 (R); MSL Project; Mineral Sciences Laboratories, Canada Centre for Mineral and Energy Technology, Division: Ottawa, ON, USA, 1994; Volume 691, pp. 1–41.
  30. Shi, C. Steel slag—Its production, processing, characteristics, and cementitious properties. J. Mater. Civ. Eng. 2004, 16, 230–236. [Google Scholar] [CrossRef]
  31. Baker, M.J.; Blowes, D.W.; Ptacek, C.J. Laboratory development of permeable reactive mixtures for the removal of phosphorus from onsite wastewater disposal systems. Environ. Sci. Technol. 1998, 32, 2308–2316. [Google Scholar] [CrossRef]
  32. Bowden, L.I.; Jarvis, A.P.; Younger, P.L.; Johnson, K.L. Phosphorus removal from waste waters using basic oxygen steel slag. Environ. Sci. Technol. 2009, 43, 2476–2481. [Google Scholar] [CrossRef]
  33. Hussain, S.I.; Blowes, D.W.; Ptacek, C.J.; Olding, D. Phosphorus removal from lake water using basic oxygen furnace slag: System performance and characterization of reaction products. Environ. Eng. Sci. 2014, 31, 631–642. [Google Scholar] [CrossRef]
  34. Zhang, J.; Zou, Y.; Yu, X.; Ding, S.; Yan, J.; Min, Y. Vegetated Steel Slag Substrate Constructed Wetlands can Achieve High Efficiency Simultaneous Nitrogen and Phosphorus Removal. Front. Environ. Sci. 2022, 10, 947783. [Google Scholar] [CrossRef]
  35. Proctor, D.M.; Fehling, K.A.; Shay, E.C.; Wittenborn, J.L.; Green, J.J.; Avent, C.; Bigham, R.D.; Connolly, M.; Lee, B.; Shepker, T.O.; et al. Physical and chemical characteristics of blast furnace, basic oxygen furnace, and electric arc furnace steel industry slags. Environ. Sci. Technol. 2000, 34, 1576–1582. [Google Scholar] [CrossRef]
  36. Cha, W.; Kim, J.; Choi, H. Evaluation of steel slag for organic and inorganic removals in soil aquifer treatment. Water Res. 2006, 40, 1034–1042. [Google Scholar] [CrossRef]
  37. Kim, E.-H.; Hwang, H.-K.; Yim, S.-B. Phosphorus removal characteristics in hydroxyapatite crystallization using converter slag. J. Environ. Sci. Health A 2006, 41, 2531–2545. [Google Scholar] [CrossRef]
  38. Xue, Y.; Hou, H.; Zhu, S. Characteristics and mechanisms of phosphate adsorption onto basic oxygen furnace slag. J. Hazard. Mater. 2009, 162, 973–980. [Google Scholar] [CrossRef]
  39. Navarro, C.; Diaz, M.; Villa-Garcia, M.A. Physico-chemical characterization of steel slag study of its behavior under simulated environmental conditions. Environ. Sci. Technol. 2010, 44, 5383–5388. [Google Scholar] [CrossRef]
  40. Mahieux, P.; Aubert, J.; Escadeillas, G. Utilization of weathered basic oxygen furnace slag in the production of hydraulic road binders. Constr. Build. Mater. 2009, 23, 742–747. [Google Scholar] [CrossRef]
  41. Stimson, J.; Chae, G.; Ptacek, C.J.; Emelko, M.B.; Mesquita, M.M.; Hirata, R.A.; Blowes, D.W. Basic oxygen furnace slag as a treatment material for pathogens: Contribution of inactivation and attachment in virus attenuation. Water Res. 2010, 44, 1150–1157. [Google Scholar] [CrossRef]
  42. Yildirim, I.Z.; Prezzi, M. Chemical mineralogical and morphological properties of steel slag. Adv. Civ. Eng. 2011, 2011, 463638. [Google Scholar] [CrossRef]
  43. Belhadj, E.; Diliberto, C.; Lecomte, A. Characterization and activation of Basic Oxygen Furnace slag. Cement. Concrete. Comp. 2012, 34, 34–40. [Google Scholar] [CrossRef]
  44. Baker, M.J.; Blowes, D.W.; Ptacek, C.J. Phosphorous adsorption and precipitation in a permeable reactive wall: Applications for wastewater disposal systems. Land Contam. Reclam. 1997, 5, 189–193. [Google Scholar]
  45. Blowes, D.W.; Ptacek, C.J.; Benner, S.G.; McRae, C.W.T.; Bennett, T.A.; Puls, R.W. Treatment of inorganic contaminants using permeable reactive barriers. J. Contam. Hydrol. 2000, 45, 123–137. [Google Scholar] [CrossRef]
  46. Han, C.; Wang, Z.; Yang, H.; Xue, X. Removal kinetics of phosphorus from synthetic wastewater using basic oxygen furnace slag. J. Environ. Sci. 2015, 30, 21–29. [Google Scholar] [CrossRef] [PubMed]
  47. Smyth, D.J.A.; Blowes, D.W.; Ptacek, C.J.; Baker, M.J.; Ford, G.; Foss, S.; Bernstene, E. Removal of phosphate and waterborne pathogens from wastewater effluent using permeable reactive materials. In Proceedings of the 55th Canadian Geotechnical and 3rd Joint IAH-CNC and CGS Groundwater Specialty Conference, Niagara Falls, ON, Canada, 20–23 October 2002; pp. 1123–1127. [Google Scholar]
  48. Suhogusoff, A.V.; Hirata, R.; Ferrari, L.C.K.M.; Robertson, W.D.; Stimson, J.; Forbes, D.; Blowes, D.W. Field performance of two on-site wastewater treatment systems using reactive media layers for nutrient and pathogen removal. J. Water Process Eng. 2019, 32, 100905. [Google Scholar] [CrossRef]
  49. Blowes, D.W.; Ptacek, C.J.; Baker, M.J. Treatment of Wastewater. G.B. Patent 2,306,954, 1 December 1999. [Google Scholar]
  50. Blowes, D.W.; Ptacek, C.J.; Baker, M.J. Treatment of Wastewater. Canadian Patent 2,190,933, 11 November 1996. [Google Scholar]
  51. Blowes, D.W.; Ptacek, C.J.; Baker, M.J. Treatment of Wastewater. U.S. Patent 5,876,606, 9 March 1999. [Google Scholar]
  52. Phosphex™ Canadian Trademark Registration. Canadian Patent 1,051,185, 17 March 2000.
  53. Phosphex™, U.S. Trademark Registration. U.S. Patent 78/015,068, 30 June 2000. [Google Scholar]
  54. Hussain, S.I.; Ptacek, C.J.; Blowes, D.W.; Liu, Y.; Wootton, B.C.; Balch, G.; Higgins, J. Transport and attenuation of an artificial sweetener and six pharmaceutical compounds in a sequenced wetland-steel slag wastewater treatment system. Water 2023, 15, 2835. [Google Scholar] [CrossRef]
  55. Ravel, B.; Newville, M. Athena, Artemis, Hephaestus: Data analysis for X-ray absorption spectroscopy using IFEFFIT. J. Synchrotron Rad. 2005, 12, 537–541. [Google Scholar] [CrossRef] [PubMed]
  56. Pena, J.; Vallet-Regi, M. Hydroxyapatite, tricalcium phosphate and biphasic materials prepared by a liquid mix technique. J. Eur. Ceram. Soc. 2003, 23, 1687–1696. [Google Scholar] [CrossRef]
  57. APHA. Standard Methods for the Examination of Water and Wastewater, 20th ed.; American Public Health Association, American Water Works Association and Water Environmental Federation: Washington DC, USA, 1998. [Google Scholar]
  58. Inorganic Ventures. “7 Anion Calibration Standard (125 mL).” Inorganic Ventures, n.d. Web. Available online: https://www.inorganicventures.com/7-anion-calibration-std-125ml (accessed on 25 July 2024).
  59. Inorganic Ventures. “26 Element ICP Calibration/Quality Control Standard.” Inorganic Ventures, n.d. Web. Available online: https://www.inorganicventures.com/qcplus-qc-solution-26-125ml (accessed on 25 July 2024).
  60. Inorganic Ventures. “10 ppm 43 Element ICP Calibration/Quality Control Standard.” Inorganic Ventures, n.d. Web. Available online: https://www.inorganicventures.com/icp-ms-complete-std-125ml (accessed on 25 July 2024).
  61. Hach Company. Method 10031: Nitrogen, Ammonia-Salicylate HR Method, Test ‘N Tube™ Vials. DOC316.53.01079. Available online: https://www.hach.com/p-nitrogen-ammonia-reagent-set-tnt-amver-salicylate-high-range/2606945 (accessed on 25 July 2024).
  62. Parkhurst, D.L.; Appelo, C.A.J. Users Guide to PHREEQC (Version2)—A Computer Program for Speciation, Batch-Reaction, One-Dimensional Transport, and Inverse Geochemical Calculations; U.S. Geological Survey Water-Resources Investigations Report 99-4259: 312; U.S. Geological Survey: Washington, DC, USA, 1999.
  63. Knight, R.L.; Payne, V.W.E., Jr.; Borer, R.E.; Clarke, R.A., Jr.; Pries, J.H. Constructed wetlands for livestock wastewater management. Ecol. Eng. 2000, 15, 41–55. [Google Scholar] [CrossRef]
  64. Government of Ontario. “F-5-1 Determination of Treatment Requirements for Municipal and Private Sewage Treatment Works.” Ontario.ca. Available online: https://www.ontario.ca/page/f-5-1-determination-treatment-requirements-municipal-and-private-sewage-treatment-works#section-2 (accessed on 24 July 2024).
  65. Aregu, M. Industrial wastewater treatment efficiency of mixed substrate (pumice and scoria) in horizontal subsurface flow constructed wetland: Comparative experimental study design. Air Soil Water Res. 2022, 15, 117862212110638. [Google Scholar] [CrossRef]
  66. Qualls, R.G.; Richardson, C.J. Forms of soil phosphorus along a nutrient enrichment gradient in the northern everglades. Soil Sci. 1995, 160, 183–198. [Google Scholar] [CrossRef]
  67. Stumm, W.; Morgan, J.J. Aquatic Chemistry, 2nd ed.; Wiley-Interscience: New York, NY, USA, 1981; 780p. [Google Scholar]
  68. Parks, G.A. The isoelectric points of solid oxides, solid hydroxides, and aqueous hydroxo complex systems. Chem. Rev. 1965, 65, 177–198. [Google Scholar] [CrossRef]
  69. Kosmulski, M. Surface Charging and Points of Zero Charge; CRC Press, Taylor & Francis Group: Boca Raton, FL, USA, 2009. [Google Scholar]
  70. Yamada, H.; Kayama, M.; Saito, K.; Hara, M. A fundamental research on phosphate removal by using slag. Water Res. 1986, 20, 547–557. [Google Scholar] [CrossRef]
  71. Yang, L.; Remmers, J.C.; Saakes, M.; Buisman, C.J. Is there a precipitation sequence in municipal wastewater induced by electrolysis? Environ. Sci. Technol. 2018, 52, 8399–8407. [Google Scholar] [CrossRef]
  72. Rehman, I.; Bonfield, W. Characterization of hydroxyapatite and carbonated apatite by photo acoustic FTIR spectroscopy. J. Mater. Sci.-Mater. M. 1997, 8, 1–4. [Google Scholar] [CrossRef]
  73. Ribeiro, C.C.; Gibson, I.; Barbosa, M.A. The uptake of titanium ions by hydroxyapatite particles—Structural changes and possible mechanisms. Biomaterials 2006, 27, 1749–1761. [Google Scholar] [CrossRef] [PubMed]
  74. Panda, R.N.; Hsieh, M.F.; Chung, R.J.; Chin, T.S. FTIR, XRD, SEM and solid state NMR investigations of carbonate-containing hydroxyapatite nano-particles synthesized by hydroxide-gel technique. J. Phys. Chem. Solids. 2003, 64, 193–199. [Google Scholar] [CrossRef]
  75. Singh, A.; Purohit, K.M. Chemical synthesis, characterization and bioactivity evaluation of hydroxyapatite prepared from Garden snail (Helix aspersa). J. Bioprocess. Biotechniq. 2011, 1, 104. [Google Scholar] [CrossRef]
  76. Matković, I.; Maltar-Strmecki, N.; Babić-Ivancić, V.; Dutour Sikirić, M.; Noethig-Laslo, V. Characterisation of b-tricalcium phosphate-based bone substitute materials by electron paramagnetic resonance spectroscopy. Radiat. Phys. Chem. 2012, 81, 1621. [Google Scholar] [CrossRef]
  77. De Oliveira Ugarte, J.F.; De Sena, L.Á.; De Castro Pérez, C.A.; De Aguiar, P.F.; Rossi, A.M.; Soares, G.A. Influence of processing parameters on structural characteristics of porous calcium phosphate samples: A study using an experimental design method. Mat. Res. 2005, 8, 71–76. [Google Scholar] [CrossRef]
  78. Neto, J.R.B.; de Lima-Neto, P.; Sales, F.A.M.; da Silva, E.E.; Ladeira, L.O.; Freire, V.N.; Caetano, E.W.S. Phosphate group vibrational signatures of the osteoporosis drug alendronate. J. Raman Spectrosc. 2014, 45, 801–806. [Google Scholar] [CrossRef]
  79. Gillet, P.; McMillan, P.; Schott, J.; Badro, J.; Grzechnik, A. Thermodynamic properties and isotopic fractionation of calcite from vibrational spectroscopy of 18O-substituted calcite. Geochim. Cosmochim. Acta. 1996, 60, 3471–3485. [Google Scholar] [CrossRef]
  80. Vongsavat, V.; Winotai, P.; Meejoo, S. Phase transitions of natural corals monitored by ESR spectroscopy. Nucl. Instrum. Meth. B 2006, 243, 167–173. [Google Scholar] [CrossRef]
  81. Tatzber, M.; Stemmer, M.; Spiegel, H.; Katzlberger, C.; Haberhauer, G.; Gerzabek, M.H. An alternative method to measure carbonate in soils by FT-IR spectroscopy. Environ. Chem. Lett. 2007, 5, 9–12. [Google Scholar] [CrossRef]
  82. Gunasekaran, S.; Anbalagan, G. Spectroscopic study of phase transitions in natural calcite mineral. Spectrochim. Acta. A 2008, 69, 1246–1251. [Google Scholar] [CrossRef]
  83. Hesterberg, D.; Zhou, W.; Hutchison, K.J.; Beauchemin, S.; Sayers, D.E. XAFS study of adsorbed and mineral forms of phosphate. J. Synchrotron Rad. 1999, 6, 636–638. [Google Scholar] [CrossRef]
  84. Sato, S.; Solomon, D.; Hyland, C.; Ketterings, Q.M.; Lehmann, J. Phosphorus speciation in manure and manure-amended soils using XANES spectroscopy. Environ. Sci. Technol. 2005, 39, 7485–7491. [Google Scholar] [CrossRef]
  85. Shober, A.L.; Hesterberg, D.L.; Sims, J.T.; Gardner, S. Characterization of phosphorus species in biosolids and manures using XANES spectroscopy. J. Environ. Qual. 2006, 35, 1983–1993. [Google Scholar] [CrossRef]
  86. Güngör, K.; Jürgensen, A.; Karthikeyan, K.G. Determination of phosphorus speciation in dairy manure using XRD and XANES spectroscopy. J. Environ. Qual. 2007, 36, 1856–1863. [Google Scholar] [CrossRef]
  87. Brandes, J.A.; Ingall, E.; Paterson, D. Characterization of minerals and organic phosphorus species in marine sediments using soft X-ray fluorescence spectromicroscopy. Mar. Chem. 2007, 103, 250–265. [Google Scholar] [CrossRef]
  88. Peak, D.; Sims, J.T.; Sparks, D.L. Solid-state speciation of natural and alum-amended poultry litter using XANES spectroscopy. Environ. Sci. Technol. 2002, 36, 4253–4261. [Google Scholar] [CrossRef]
  89. Franke, R.; Hormes, J. The P K-near edge absorption spectra of phosphates. Phys. B Phys. Condens. Matter 1995, 216, 85–95. [Google Scholar] [CrossRef]
  90. Ajiboye, B.; Akinremi, O.O.; Hu, Y.; Jürgensen, A. XANES speciation of phosphorus in organically amended and fertilized Vertisol and Mollisol. Soil Sci. Soc. Am. J. 2008, 72, 1256–1262. [Google Scholar] [CrossRef]
  91. Eveborn, D.; Gustafsson, J.P.; Hillier, S. XANES speciation of P in environmental samples: An assessment of filter media for on-site wastewater treatment. Environ. Sci. Technol. 2009, 43, 6515–6521. [Google Scholar] [CrossRef]
  92. Beauchemin, S.; Hesterberg, D.; Chou, J.; Beauchemin, M.; Simard, R.R.; Sayers, D.E. Speciation of phosphorus in phosphorus-enriched agricultural soils using X-ray absorption near-edge structure spectroscopy and chemical fractionation. J. Environ. Qual. 2003, 32, 1809–1819. [Google Scholar] [CrossRef]
  93. Khare, N.; Hesterberg, D.; Beauchemin, S.; Wang, S. XANES determination of adsorbed phosphate distribution between ferrihydrite and boehmite in mixtures. Soil Sci. Soc. Am. J. 2007, 68, 460–469. [Google Scholar] [CrossRef]
  94. Hussain, S.I.; Phillips, L.A.; Hu, Y.; Frey, S.K.; Geuder, D.S.; Edwards, M.; Lapen, D.R.; Ptacek, C.J.; Blowes, D.W. Differences in phosphorus biogeochemistry and mediating microorganisms in the matrix and macropores of an agricultural clay loam soil. Soil Biol. Biochem. 2021, 161, 108365. [Google Scholar] [CrossRef]
  95. Green, M.; Friedler, E.; Safrai, I. Enhancing nitrification in vertical flow constructed wetland utilizing a passive air pump. Water Res. 1998, 32, 3513–3520. [Google Scholar] [CrossRef]
  96. Ye, F.; Li, Y. Enhancement of nitrogen removal in towery hybrid constructed wetland to treat domestic wastewater for small rural communities. Ecol. Eng. 2009, 35, 1043–1050. [Google Scholar] [CrossRef]
  97. Rahman, A.; Agrawal, A. Reduction of nitrate and nitrite by iron metal: Implications for ground water remediation. In Proceedings of the 213th ACS National meeting, Sanfrancisco, CA, USA, 13–17 April 1997; Volume 37, pp. 157–159. [Google Scholar]
  98. Liu, Y.Y.; Ptacek, C.J.; Blowes, D.W. Treatment of dissolved perchlorate, nitrate, and sulfate using zero-valent iron and organic carbon. J. Environ. Qual. 2014, 43, 842–850. [Google Scholar] [CrossRef] [PubMed]
  99. Johnson, M.; Mara, D.D. Aerated rock filters for enhanced nitrogen and faecal coliform removal from facultative waste stabilization pond effluents. Water Sci. Technol. 2005, 51, 99–102. [Google Scholar] [CrossRef]
  100. Brix, H.; Arias, C.A. The use of vertical flow constructed wetlands for on-site treatment of domestic wastewater: New Danish guidelines. Ecol. Eng. 2005, 25, 491–500. [Google Scholar] [CrossRef]
  101. Matamoros, V.; Arias, C.; Brix, H.; Bayona, J.M. Removal of pharmaceuticals and personal care products (PPCPs) from urban wastewater in a pilot vertical flow constructed wetland and a sand filter. Environ. Sci. Technol. 2007, 41, 8171–8177. [Google Scholar] [CrossRef]
  102. Tang, X.; Huang, S.; Scholz, M.; Li, J. Nutrient removal in pilot-scale constructed wetlands treating eutrophic river water: Assessment of plants, intermittent artificial aeration and polyhedron hollow polypropylene balls. Water Air Soil Pollut. 2009, 197, 61–73. [Google Scholar] [CrossRef]
  103. MOEE (Ministry of Environment and Energy). Water Management Policies, Guidelines, Provincial Water Quality Objectives; Ontario Ministry of Environment and Energy: Toronto, ON, Canada, 1994; pp. 9–28.
  104. Chaurand, P.; Rose, J.; Briois, V.; Olivi, L.; Hazemann, J.-L.; Proux, O.; Domas, J.; Bottero, J.-Y. Environmental impacts of steel slag reused in road construction: A crystallographic and molecular (XANES) approach. J. Hazard. Mater. 2007, B139, 537–542. [Google Scholar] [CrossRef] [PubMed]
Figure 1. Schematic diagram of the CW-BOFS demonstration-scale treatment system. Wastewater was continuously flushed through the system by a combination of gravity feed and pumping (adapted from [54]).
Water 16 02198 g001
Figure 2. Box plots of pH values, Eh, alkalinity, conductivity, TSS, DO, cBOD5, COD, PO4-P, SO4, NH3-N, NO3-N, NO2-N, NH3-N/NT, and NO3-N/NT versus distance (Cells 1–4) along the treatment flow path. Dotted lines represent the Ontario Provincial Water Quality Objective (PWQO). Boxes represent 50% of the data (between the first and third quartiles). Horizontal solid lines and broken lines on the boxes represent median and mean concentrations. Bars extend from the box to the highest/lowest value within 1.5 × inter-quartile range (IQR). Points (outliers) are values > 1.5 × IQR. Top- and bottom-most dots represent maximum observation above upper fence and minimum observation below lower fence.
Water 16 02198 g002
Figure 3. (i) XANES spectra for reference materials, PO4 sorbed on CaCO3 (PSC [88]), and samples P2-S1, P2-S2, and P8-S1. Vertical lines represent various spectral features: (a) pre-edge feature for FeP; (b) absorption edge (white line) for CaP species; (c) shoulder (sharpness dependent on the degree of crystallinity; (d) spectral feature common in HAP; (e) oxygen oscillation. (ii) Ca K-edge XANES spectra for reference materials and samples. Vertical lines represent various spectral features: pre-edge feature (a), pre-edge shoulder (b), white line (c), post-edge shoulder (d), sharp post-edge features (e,f), and broad post-edge feature (g).
Water 16 02198 g003
Figure 4. (a) Linear combination fit results for spent BOFS samples P3-S1 and P4-S1 for P-XANES and Ca-XANES. (b) Linear combination fit results for spent BOFS samples P6-S1 and P8-S1 for P-XANES and Ca-XANES.
Water 16 02198 g004aWater 16 02198 g004b
Figure 5. Box plots of V, Al, Cu, Zn, Fe, Ni, Mn, Cr, and Pb concentrations versus distance (Cells 1–4) along the flow path. Dotted lines represent the Ontario Provincial Water Quality Objective (PWQO). Horizontal solid lines and broken lines on the boxes represent median and mean concentrations. Top- and bottom-most dots represent maximum observation above upper fence and minimum observation below lower fence.
Water 16 02198 g005
Table 1. Description of the treatment cells, including the cell volume, media volume, porosity, and hydraulic retention time (adapted from [54]).
Cell IDCell TypeCell DescriptionCell
Volume (m3)
Media Volume (m3)Porosity
(θ)
Hydraulic Retention Time (HRT) (Day)
Cell 1Pre-treatment septic tank effluent chamberThe influent of the treatment system, wastewater, was received from this pre-treatment septic tank and periodically pumped to Cell 2. 1---
Cell 2Subsurface flow constructed wetland
(HSSF CW Cell)
Filled with granitic gravel and vegetated with cattails (Typha spp.).2419.40.357.64
Cell 3Subsurface flow aerated constructed wetland (Aerated VSSF CW Cell)Filled with granitic gravel and vegetated with cattails (Typha spp.).24.219.30.357.61
Cell 4Downward vertical flow cell (BOFS Cell)Filled with BOFS and ZVI to remove phosphate. BOFS media were covered by a granitic gravel layer and then a plastic tarp and a sand layer to avoid atmospheric oxygen ingress. A sacrificial BOFS chamber was placed before cell four to prevent the formation of a CaCO3 scale around the Cell 4 inlet.27.413.30.45.97
Cell 5pH adjustment unitEquipped with a CO2 sparger and an adjusted pH between 6.5 and 8.5 before being released into the City of Kawartha Lakes sewer system.2---
Table 2. FTIR spectral data of carbonate and phosphate bands.
Band TypeWavenumber (cm−1)DescriptionReferences
Carbonate ν4712–713Sharp carbonate band[79,80,81,82]
Carbonate ν2872–874Sharp carbonate band
Carbonate ν31422–1426Broad distinct carbonate band
Carbonate ν1 + ν41797–1800Combination band[79,80,82]
Carbonate ν1 + ν32514–2515Combination band[80]
Carbonate 2 ν2 + ν42514–2515Combination band[82]
Carbonate overtones2874–2876, 2980–2982Weaker carbonate overtones[82]
Phosphate ν31030–1039Broad phosphate band[37,56,70,71,72,73,76,77,78]
Phosphate ν4632–635, 602–608, 595–597, 583–588, 567–575Several weak to very weak phosphate bands
Phosphate ν2450–461, 475Phosphate band
Disclaimer/Publisher’s Note: The statements, opinions and data contained in all publications are solely those of the individual author(s) and contributor(s) and not of MDPI and/or the editor(s). MDPI and/or the editor(s) disclaim responsibility for any injury to people or property resulting from any ideas, methods, instructions or products referred to in the content.

