Abstract
Foreshore slope is crucial in designing beach berm nourishment schemes and understanding coastal responses to wave forces. Beach berm nourishment often suffers from a high loss rate, necessitating theoretical research and design parameter comparison to mitigate these losses early on. This study uses Bagnold’s energy conservation method and the small-angle approximation method to establish a relationship between cross-shore sediment transport and foreshore slope. The feedback mechanism between these factors shows that when the foreshore slope is fewer than 10 degrees, a smaller initial slope results in a reduced rate of sediment transport. Over time, the foreshore slope decreases and eventually reaches equilibrium, promoting the formation of an offshore sandbar, which helps reduce sediment loss. Using data from Guanhu Beach in Dapeng Bay, this study constructs a realistic numerical beach model to simulate the dynamic behavior of beach profiles with varying foreshore slopes under the influence of monsoon waves and storm surges. The simulation results support the feedback mechanism findings, demonstrating that profiles with minimal foreshore slopes experience the least initial sediment loss, thus facilitating sandbar formation more effectively. These insights can inform beach berm nourishment strategies, emphasizing early-stage efforts to expand beach areas and reduce sediment loss.
1. Introduction
The foreshore slope plays a vital role in characterizing coastal responses to wave activity [1] and significantly influences cross-shore sediment transport [2]. As cross-shore sediment transport primarily causes adjustments to profile morphology during the inception of beach nourishment, the foreshore slope becomes a paramount parameter within beach berm nourishment scheme designs.
Seasonal variations in wave conditions or extreme storm surges can substantially alter cross-shore sediment transport on beach profiles [3,4]. These modifications often manifest as changes in the foreshore slope due to the existing intricate feedback mechanism between cross-shore sediment transport and the foreshore slope. Originally, the foreshore slope influences the cross-shore sediment transport trends which subsequently cause continuous slope changes. The system eventually attains a transitory equilibrium under present dynamics. Renowned scholars such as Dean [5], Hattori, Kawamata [6], Sunamura, and Horikawa [7] have primarily employed cross-shore sediment transport studies to classify beach profiles, proposing a series of determinative parameters. However, these parameters seldom involve calculations of the net cross-shore sediment transport rate on a profile, making granular interpretations challenging. Hence, later studies typically utilize physical experiments and numerical simulations to investigate cross-shore sediment transport on beach profiles. For instance, Mustafa et al. demonstrated through physical experiments that reducing the foreshore slope increases both the offshore sandbar volume and the stretch from the offshore sandbar to the coastline [8]. Furthermore, Qu et al. established a relevant physical model to examine how different beach profiles reach equilibrium under regular wave conditions and the associated storm surge defense effectiveness [9]. Their research concludes that profile shape drastically influences cross-shore sediment transport trends over a short duration. While the aforementioned studies outline objective laws, numerical simulation methods are needed for more detailed theoretical research. Numerical simulations predominantly segregate into closed and open-loop forms. The closed-loop form posits the eventual equilibrium of the beach under persistent dynamic conditions, with cross-shore sediment transport being accountable for deviations from this equilibrium profile. A widely recognized example includes Zheng’s numerical model, which necessitates substantial measured data to ascertain the equilibrium profile [10]. The open-loop form, on the other hand, suggests that profile morphology is determined by sediment transport, with the XBeach numerical model being a modern instance. This model utilizes the Euler method and convective diffusion equation to simulate cross-shore sediment transport’s role in profile alterations. However, given the Euler method’s emphasis on spatial points’ physical properties, it exhibits evident limitations while investigating the relationship between cross-shore sediment transport and spatial factors such as the foreshore slope. Therefore, scrutinizing the feedback mechanism between these two demands a novel perspective.
Within the realm of beach nourishment, numerous sand replenishment strategies opt for an approach akin to equilibrium profiling [11,12], out of which beach berm nourishment emerges as the most uncomplicated and effective construction method. However, it presents a notable drawback in its high loss rate [13]. Various studies demonstrate that approximately 70% of the replenished sand dissipates within the initial few months following project implementation [14]. This process, though it swiftly accommodates shifts in the surrounding dynamic landscape toward equilibrium profiling [15], may encompass sand redistribution instigated by alongshore sediment transport and aims to facilitate the maturation of profiles elsewhere [16]. Nonetheless, reductions in cross-shore sediment transport can precipitously decrease the beach’s expanse and fail to provide nourishment to other beach profiles. From the perspective of environmental protection, beach nourishment can have irreversible deleterious impacts on the environment [17]. Therefore, stabilizing the nourished beach berm means saving the coastal environment. Consequently, it becomes imperative to discern the correlation between cross-shore sediment transport and the parameters of design to curtail losses in cross-shore sediment transport during beach nourishment. In the beach nourishment plan for Nha Trang beach in Vietnam, parameters were adopted from the Japanese beach design manual [18]. The designers amassed extensive field data about the beach to validate and select the design parameters. However, this approach merely attests that the design parameters are in line with the inherent laws of the beach. This encompasses an empirical relationship between the design profile foreshore slope, berm elevation, waves, slopes, and the beach sediment particle size. No comprehensive research has been conducted regarding the maintenance effects and subsequent sand loss. It is therefore unfeasible to determine if the chosen parameters foster stable beach conditions. Numerous scholars have performed single-factor analyses on factors such as replenishment grain size, berm width, height, and the foreshore slope during the beach berm nourishment profile design [19,20,21]. Yet, most methodologies involve simple computations using the initial design profile on the numerical model XBeach, without supporting field data for verification of the mathematical findings. Hence, it becomes imperative to construct a real-scale mathematical model based on on-site measurements to gauge beach profiles’ responses with varied initial foreshore slopes under complex, naturally dynamic conditions.
To maximize beach nourishment benefits and shield against substantial early-stage profile alterations, a rigorous theoretical investigation into the correlation between cross-shore sediment transport and the foreshore slope is imperative. This research aims to mitigate losses in sediment transport occurring during the initial phase of beach nourishment. Therefore, following the complex feedback mechanisms between morphology and hydrodynamics, a research plan is proposed to focus on two open questions related to previous observations: (1) What is the mathematical and physical relationship between cross-shore sediment transport and beach foreshore slope? (2) How do beach berm nourishment schemes with different foreshore slopes respond to complex hydrodynamic conditions? This study aims to explore the feedback mechanism between cross-shore sediment transport and foreshore slope from a microscopic perspective, utilizing fundamental energy principles. This approach enables the rapid qualitative identification of optimal foreshore slopes during the preliminary design phase of beach nourishment. Furthermore, numerical modeling tools will be employed to confirm the effectiveness of optimal foreshore slopes. Currently, there are numerous options available for selecting reasonable slopes in the early stages of beach nourishment, and the findings of this research can provide valuable reference points. This paper is structured as follows: Section 2 provides a brief introduction to the research area. Section 3 introduces the methodologies employed for conducting beach field surveys and the establishment of the Bagnold energy method and numerical model. Section 4 elucidates the feedback mechanism between cross-shore sediment transport and foreshore slope through the derived function equation, and with the help of the established numerical model, calculates the response results of beach profiles with different foreshore slopes to the dynamics of monsoon waves and storm surges for a mutual corroboration discussion. The conclusion is presented in Section 5.
2. Study Area and Data Sources
Dapeng Bay is located between Dapeng Peninsula and Kowloon Peninsula, Hong Kong with a total area of 335 km2. It is surrounded by mountains on the east, north, and west. The bay mouth is facing the southeast. In the northeast of Dapeng Bay, there are many sandy coasts and headlands. Headland-bay beaches are formed between the headlands. The central area of this study is Guanhu Beach, and the location of the study area is shown in Figure 1a. The length of Guanhu Beach is 600 m, and the width is less than 100 m. The beach width gradually decreases from west to east. The local sediment particles are mainly coarse sand. Seasonal transport dynamics influence the grain size at mid–low tide levels, leading to coarser particles during the summer and autumn months. This change occurs mainly due to the erosion of finer sediments from the beach. Despite this slight shift, the overall impact is limited, and the average median grain size of sediment across different tidal levels remains approximately 0.2 mm.
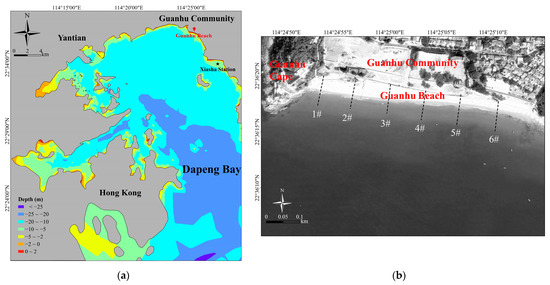
Figure 1.
The description of the study area with the focus area on Guanhu Beach: (a) The topography and bathymetry of Dapeng Bay. (b) The distribution of Guanhu Beach and measurement profile.
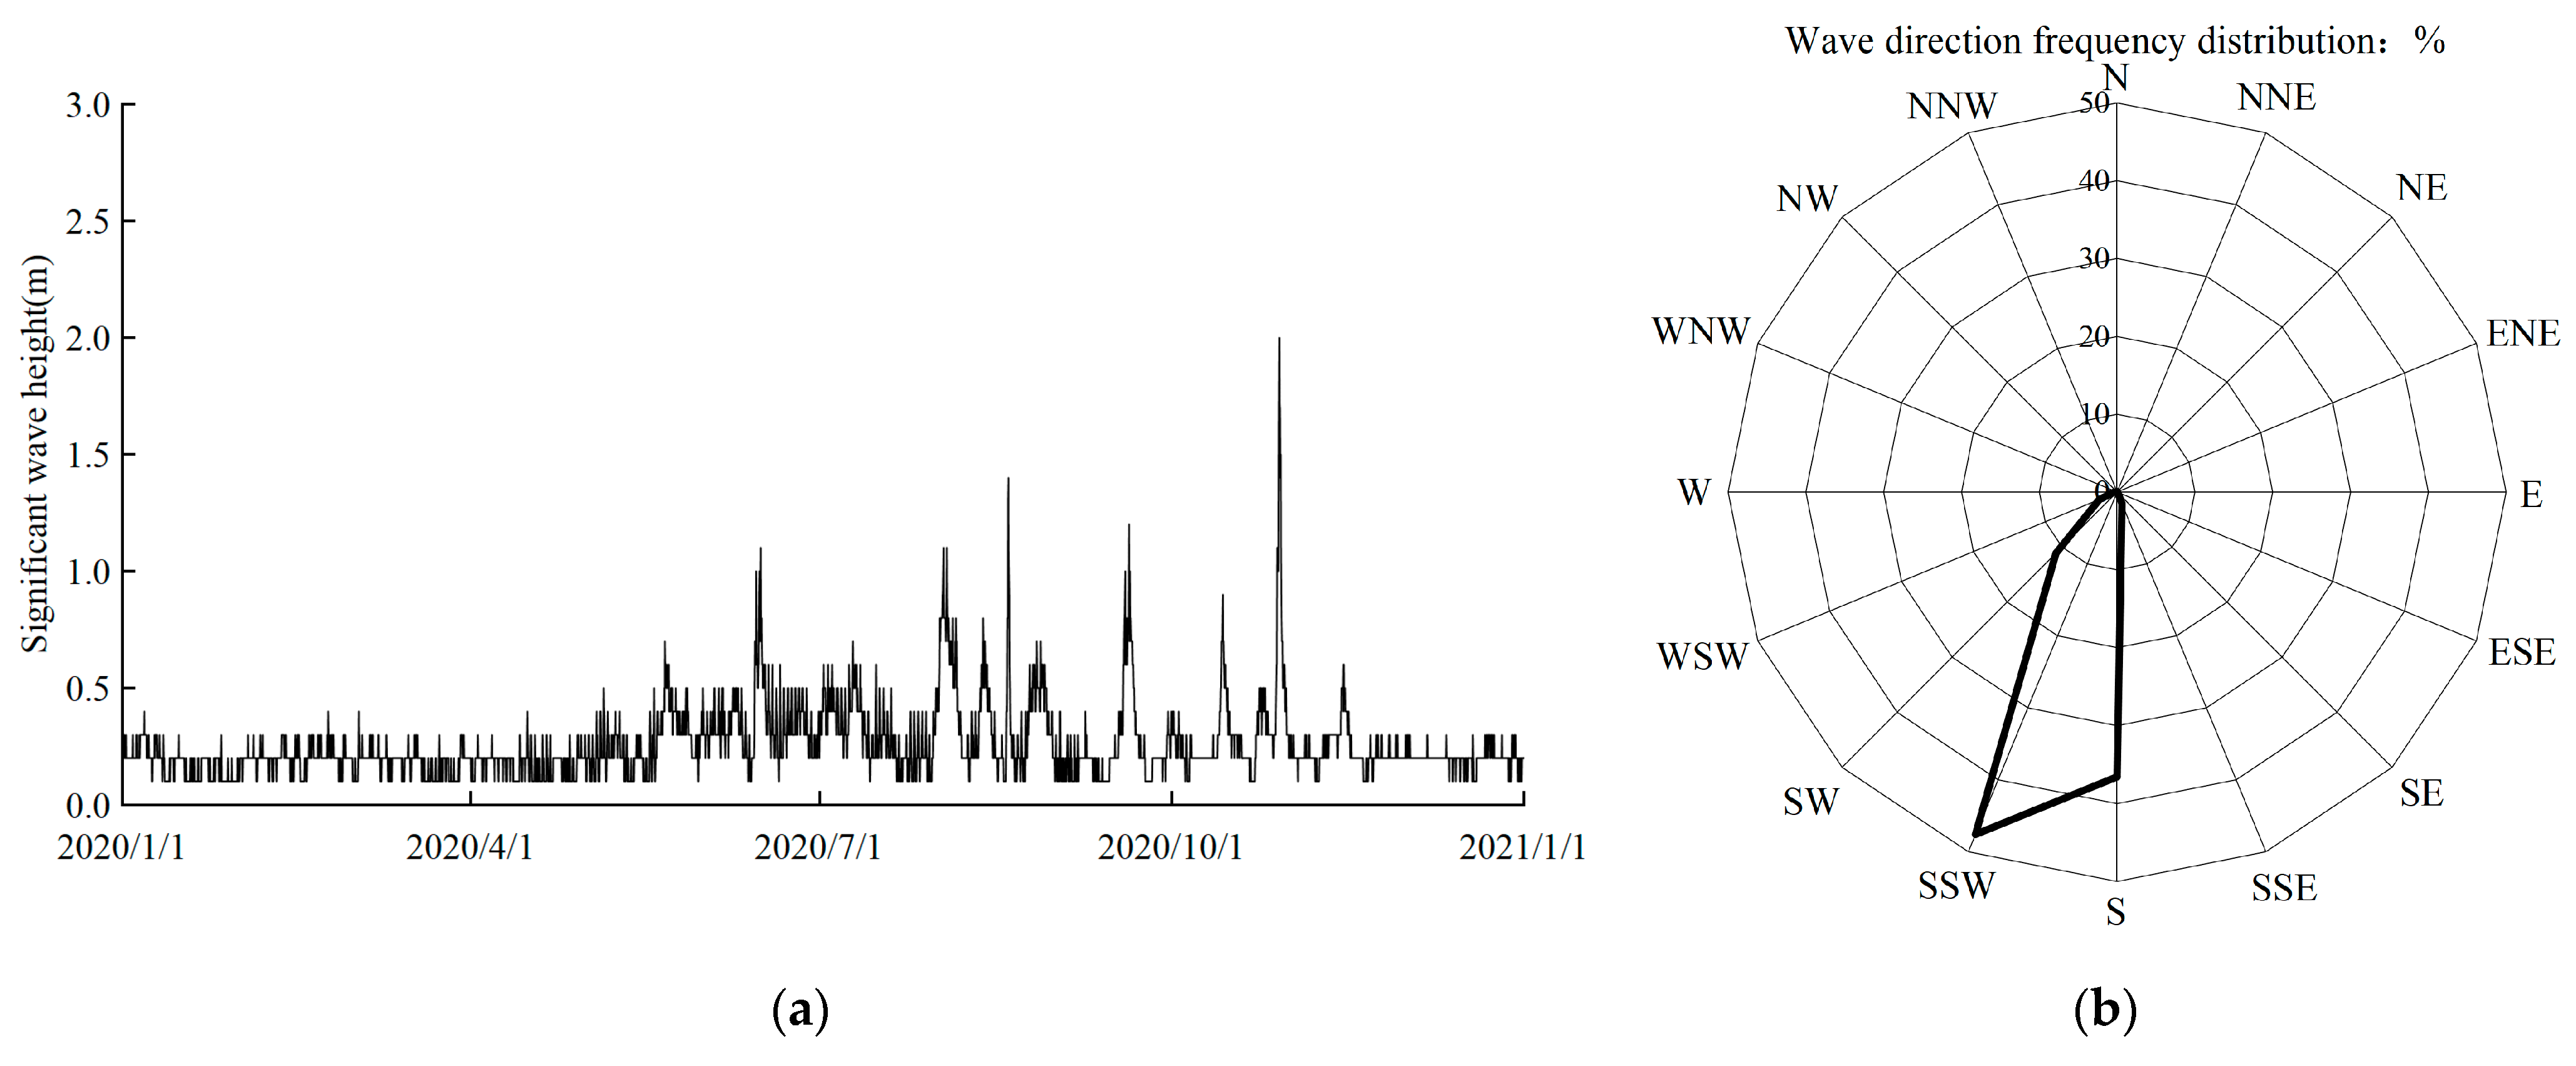
The main headland of Guanhu Beach is Guanhu Cape. Guanhu Beach is a typical headland-bay beach located on the west side of Guanhu Community (Figure 1b). The tidal type of Dapeng Bay is irregular semidiurnal tide. In 2020, the mean high water is about 0.91 m (1985 national elevation benchmarks, this elevation system is used in the whole paper) and the mean low water is about −0.63 m. The mean tidal range is 1.98 m which indicates the tidal intensity is weak. Wind and wave data are collected from the Shenzhen Marine Monitoring and Forecasting Center. According to observed data at Xiasha station (Figure 2) in 2020, the prevailing wind direction of Dapeng Bay is SSW with a frequency of 11.1% and the secondary prevailing wind direction is NW with a frequency of 9.7%. All wave data are based on measurements taken at Xiasha station, with a collection frequency of every two hours. The summer prevailing wind direction is SSW and the winter prevailing wind direction is NW. The annual average wind speed is 4.5 m/s. The Bay is mainly affected by offshore surges. The annual strongest wave direction is SSW and the maximum significant wave height is 2.6 m. The dominant wave direction is SSW with a frequency of 47.59% and the second most dominant wave direction is S with a frequency of 36.55%.
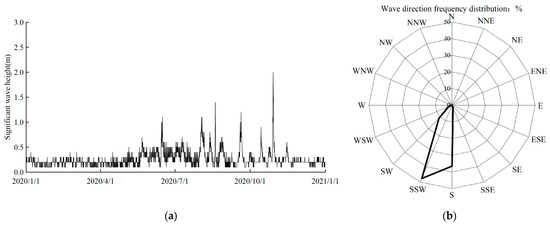
Figure 2.
Wave conditions of the study area (measured by Xiasha station with a collection frequency of every two hours): (a) Significant wave height. (b) Wave direction frequency.
3. Methods
This study conducted seasonal field surveys at Guan Hu Beach in Shenzhen throughout 2020. We aimed to derive the interaction mechanism between cross-shore sand transport and the foreshore slope using the Bagnold energy method. The findings qualitatively described how the foreshore slope affects the longevity of beach nourishment. Additionally, a numerical model was developed to quantitatively evaluate the outcomes of various beach nourishment schemes under different conditions, thereby validating the qualitative research results. In this section, we focus on the methods used for the field surveys and showcase the development of the Bagnold cross-shore sediment transport energy model and the numerical model.
3.1. Beach Profile Measurement and Sediment Collection
To develop a comprehensive beach nourishment plan, profile measurements and sediment collection were conducted four times on Guanhu Beach in Shenzhen, specifically in May 2020, July 2020, October 2020, and January 2021. Measurements were taken during lower low water springs, ensuring consistency in tidal conditions. Profile measurements and sediment collection occurred simultaneously, resulting in a total of eighteen sediment samples collected from each beach profile at high tide, midtide, and low tide. These samples were then transported to the laboratory for particle composition analysis.
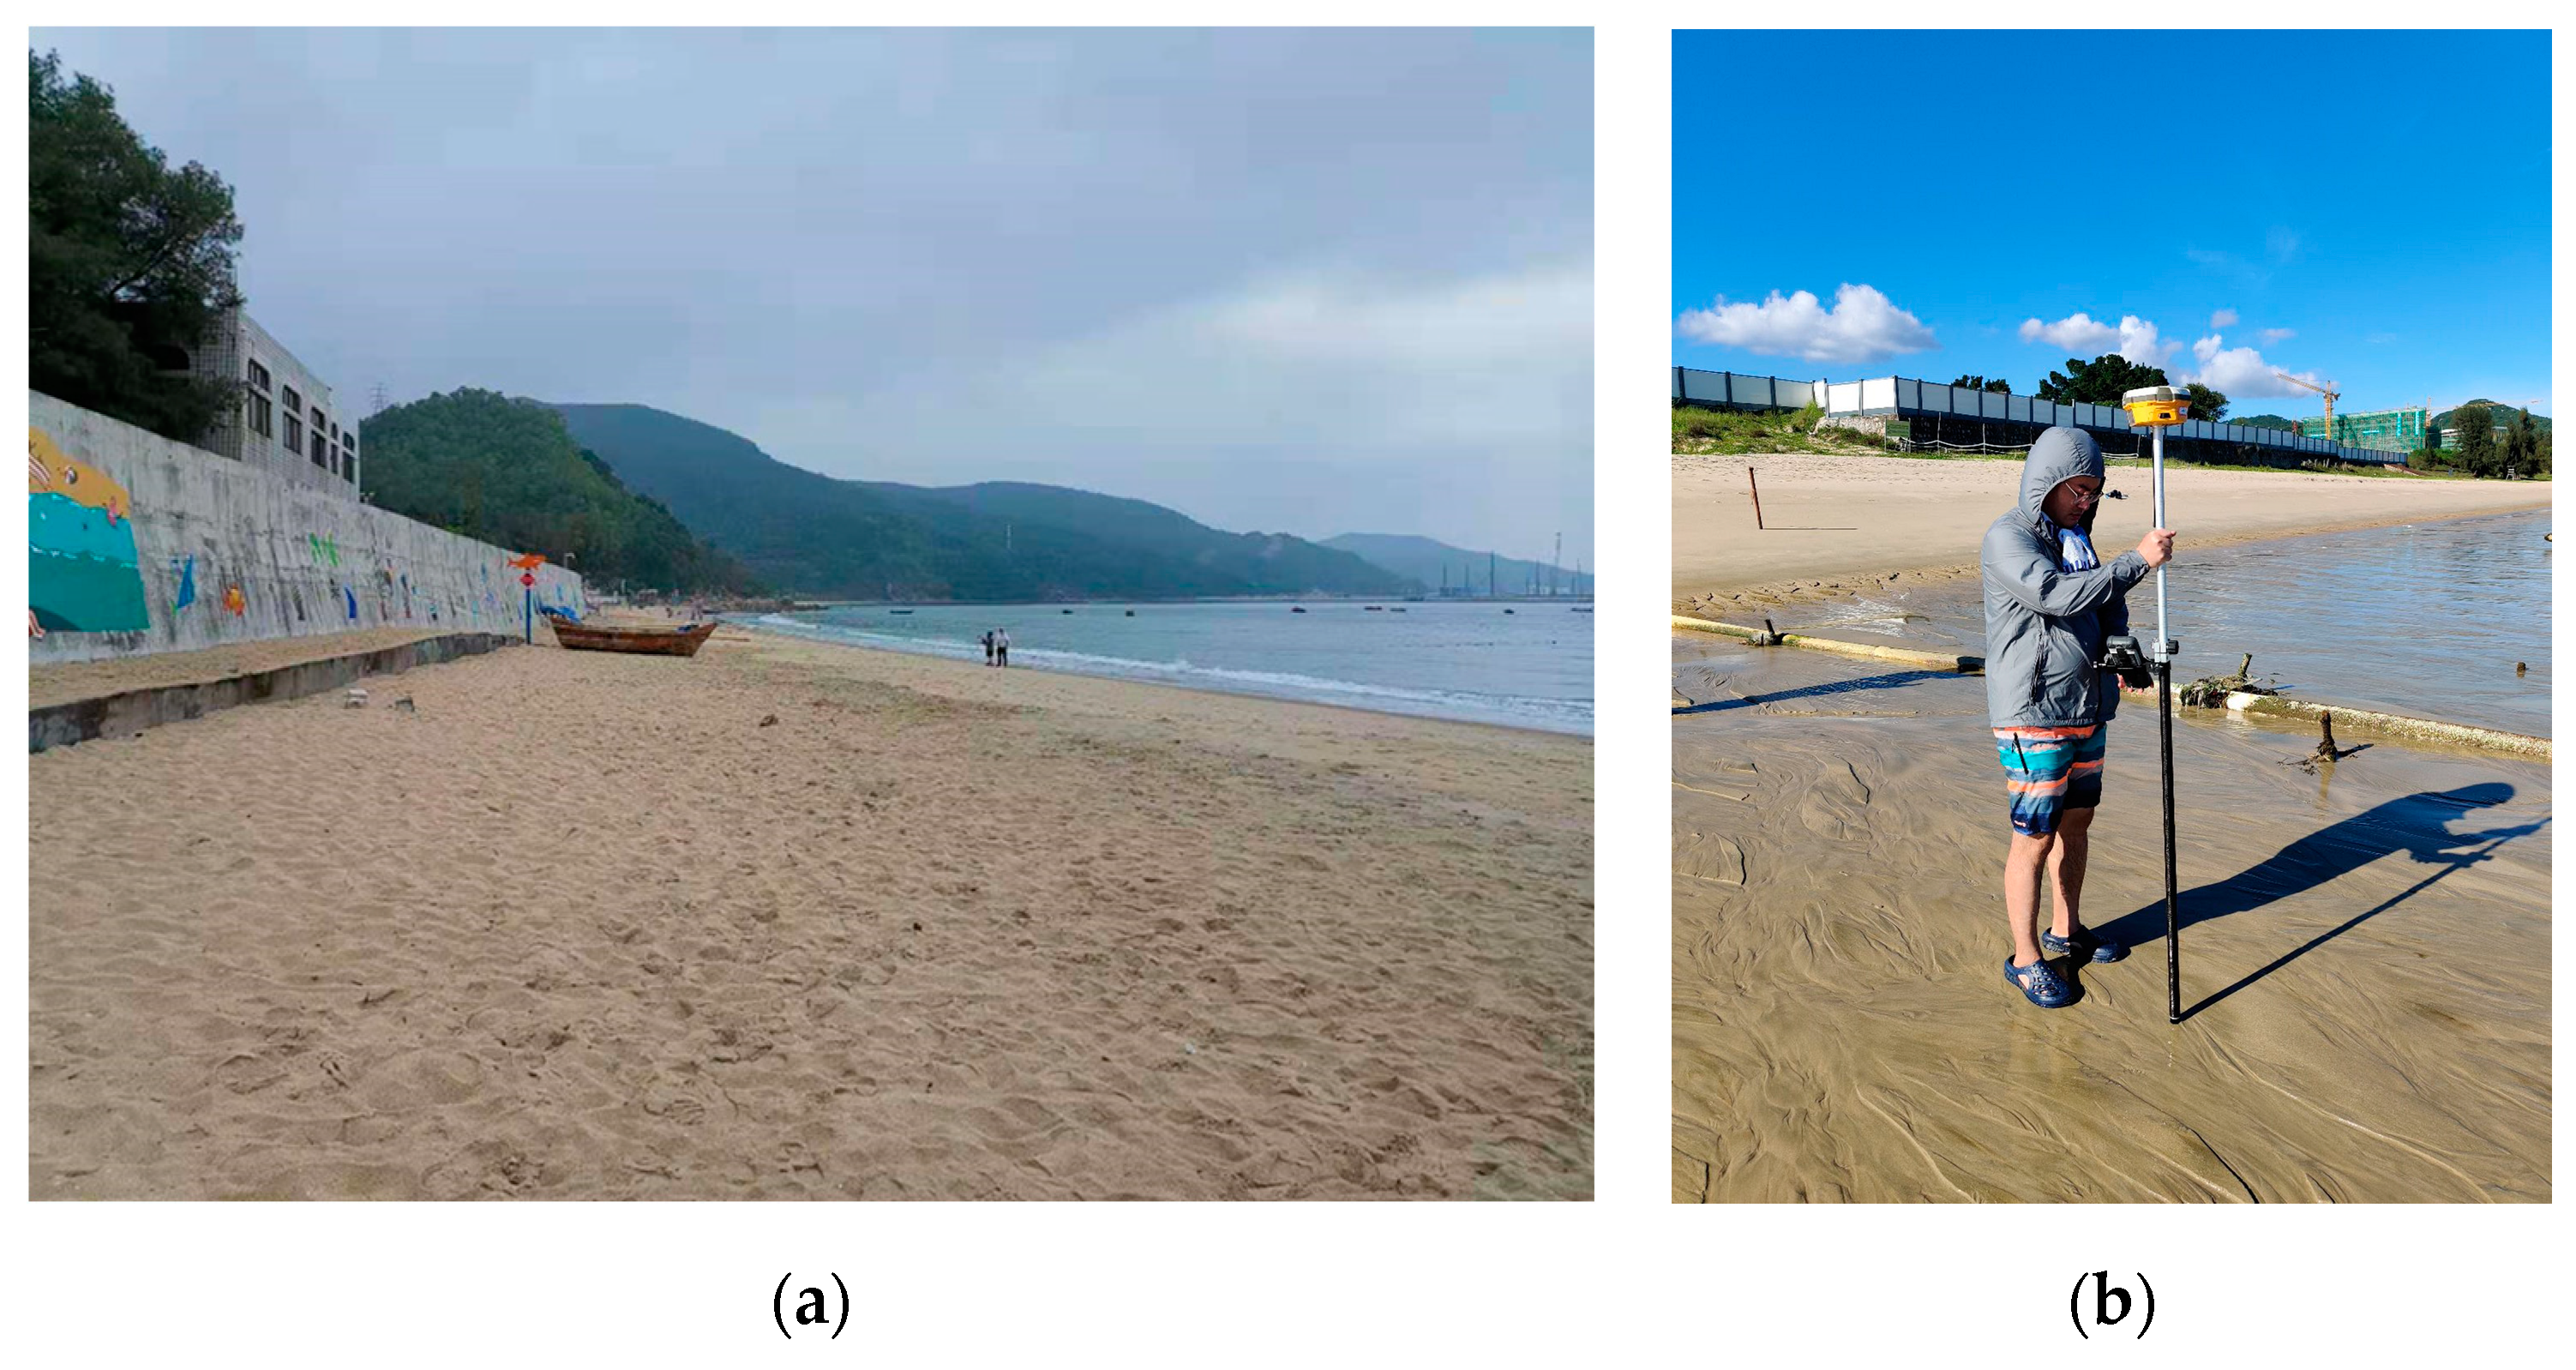
Our research team utilized Real-Time Kinematic (RTK) GPS instruments to conduct field surveys (Figure 3). While establishing the base station, the mobile station was configured for manual step measurements to determine elevation. The location and elevation of the base station were predetermined values confirmed through on-site measurements. Given that the base station elevation is relatively fixed, elevation values across the beach can be computed by referencing the base station’s elevation. Due to the nature of manual measurements and the hazards associated with underwater operations, the measurements were conducted only until the water level reached waist height. The closure depth of the study area is 3.50 m, ensuring that the majority of the measuring profiles remained above this depth. The measuring interval was standardized in areas where topographic changes were minimal, while the number of measuring points was increased in regions with significant topographic variation. Although the measuring profiles were fixed, the exact positions of each measuring point varied. To accommodate this, fixed analysis points were established along the profile, and the measuring data were interpolated to these points. The measured beach profiles are indicated in Figure 1b as 1# to 6#, spaced at intervals of 100 m. There were no typhoons during the measuring period.

Figure 3.
Field survey conduction: (a) Guanhu beach. (b) Real Time Kinematic (RTK) measurement.
3.2. Bagnold Cross-Shore Sediment Transport Energy Model
The equations governing the movement of sediment under wave action are different from those that apply to unidirectional flow. Longuet-Higgins’ theoretical equation and laboratory data show that the sediment transport direction at the bottom of shallow water is onshore while the middle is offshore [22]. After the wave propagates to the shallow water area, due to the shallow water deformation, the wave crest duration is short and the trajectory speed is large, the wave trough duration is long, and the trajectory speed is small. This phenomenon causes the coarse-grained sediment to move toward the shore continuously and the fine-grained sediment to suspend upwards. Under the combined action of the trajectory speed and mass transfer speed in the offshore direction, the suspended sediment moves offshore, and the bottom sediment moves toward the shore. The ratio of the two sediment transport rates determines the scouring and depositional state of the beach [23]. According to the characteristics of sediment movement under wave conditions in the two-dimensional shallow beach area, a vertical section near the breaking point is taken by applying the Bagnold energy conservation [24,25] method (Figure 4).
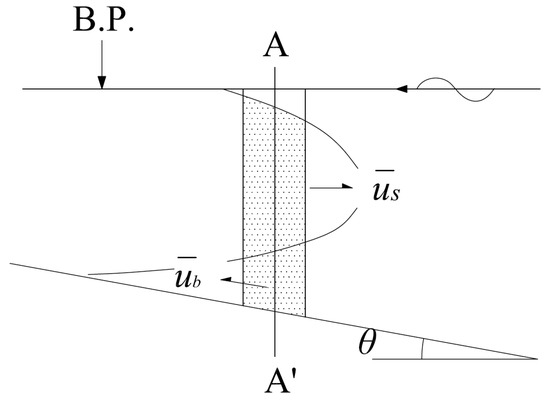
Figure 4.
Illustration of the Bagnold energy conservation method: B.P. stands for Barometric Pressure; A-A’ is a vertical cross-section located just outside the breaking point of the waves.
Consider the volume of sediment moving shoreward per unit area of the seabed as (m2), with a transport speed of (m/s). Simultaneously, let (m2) represent the volume of sediment moving shoreward per unit area of the bed, while (m/s) represents the average transport speed of suspended sediment. Consequently, the bed sediment’s volume transport rate qb (m3/s) can be calculated as follows:
The suspended sediment’s volume transport rate qs (m3/s) can be calculated as follows:
Thus, the cross-shore sediment transport rate qoff (m3/s) can be calculated as follows:
The power required to overcome both resistance and gravitational forces during sediment movement, and the power to surmount gravity when the sediment is suspended, are fuelled by wave energy. As the power for seabed sediment to resist and overcome gravity correlates with the foreshore angle, we can deduce the following based on energy conservation principles and the cross-shore sediment transport rate’s definition:
where θ is the foreshore slope, and f(θ) represents the functional relationship between qoff and θ. The cross-shore sediment transport of the beach profile shifts offshore when qoff > 0, and onshore when qoff < 0.
3.3. Numerical Simulation by XBeach
The XBeach model (1.23.5526), which is based on SBeach and funded by the United States Army Corps of Engineers and the European Union, is an open-source software based on Fortran90 architecture. It is widely used to simulate coastal dynamics such as tidal waves [26], tsunami waves, storm surges [27] and their corresponding coastline evolution [28], seabed evolution, and sediment transport [29].
The purpose of this study is to simulate the seasonal topographic evolution of Guanhu Beach under prevailing wind and wave conditions. It is relatively reasonable to establish a 2DH (2-dimensional horizontal) model considering the sediment transport between profiles. Since the time scale studied in this paper is seasonal variation and most of the beach waves are broken waves, Surf-beat mode was selected for simulation.
A 2DH model was set up with a domain size of 600 m in the alongshore and approximately 120 m in the cross-shore. A constant grid size of 100 m was used in the alongshore, while the grid size in the cross-shore varied on the basis of the spacing of measured points. The grid nodes with the same y coordinate in the initial grid form a profile and the simulation results are the evolution of the beach profile. As the initial grid is 600 m long along the coast with an interval of 100 m, the profiles formed by grid nodes correspond to six profiles (1#~6# profile) of Guanhu Beach. The initial topographic data is the measured data of Guanhu Beach in July 2020, and the validation data are the measured data in October 2020. The wave boundary conditions are determined by the measured data at Xiasha wave station from July to October 2020. The tide boundary conditions are determined by the measured data at Dapeng Bay tidal station on the 2020 tide table. In order to simulate the evolution of Guanhu Beach in three months and ensure the accuracy of the results, the total simulated time is 743,040 s (Tstop) with a 10 (morfac) acceleration factor. According to previous studies, a morphological acceleration factor of 10 can ensure the reliability of the simulation and the rationality of calculation time. Some important model parameters are described in Table 1:

Table 1.
Default and Setup Values of Model Parameters.
If the model simulation results align closely with the measured data, the 2D hydrodynamic (2DH) model can be employed to simulate sand loss in beach nourishment schemes with varying foreshore slopes. To establish the design parameters for these beach nourishment schemes, including the foreshore slope, the following calculations should be performed.
According to the Coastal Engineering Manual published by the US Army Corps of Engineers, the beach berm elevation should be determined by the average elevation of the local beach measured through years of investigation. When the particle size of beach nourishment is close to the original particle size, the width of the beach berm can be 30 m. The Technical guide for beach nourishment and restoration in China stipulates that the width of the beach berm should be between 30 and 60 m. The beach berm elevation should be designed by the wave overtopping. Previous survey shows that the elevation of the beach berm of Guanhu Beach is about 3.0 m, and the width of the beach berm is about 30 m. Therefore, the elevation and width of the beach berm in the design profile are 3.0 m and 30 m respectively.
In Coastal Engineering Manual published by USACE:
where A = 0.41(D50)0.94, D50 < 0.4 mm, and D50 (mm) is median particle diameter. , hc (m) is closure depth, Hs (m) is wave significant height, Ts (s) is the period of significant wave, and g (m/s2) is the gravitational acceleration.
The foreshore slope of the beach nourishment in the Manual of Beach Planning and design (Japanese Manual) is calculated as follows:
where L0 (m) is wavelength of deep-water waves.
The equation for judging the scouring and deposition state of beach profile proposed by Hattori and Kawamata is similar to the calculation method of cross-shore sediment transport in Section 3.1. The simplicity of the equation lies in that the parameters in the equation can be obtained from the measured data. Meanwhile, it does not involve the calculation of resistance coefficient under wave conditions to avoid the tediousness. The equation is shown below:
where C is balance coefficient, ω (m/s) is sediment settling velocity.
The design profile consisting of the obtained foreshore slope and other beach profile parameters can be input into the validated numerical model for further study. To ensure that the optimized beach nourishment scheme is effective during storm surge events, it is essential to assess how the designed beach profile responds to these conditions. In this study, the dynamic conditions associated with Typhoon Mangkhut are used as input parameters. This approach allows us to calculate the morphological changes in the beach profile and compare the effectiveness of different schemes under storm surge conditions.
4. Results and Discussion
4.1. Beach Morphology
We interpolated the beach survey data to clearly illustrate changes in the beach profile under monsoon conditions. This will also provide validation data for subsequent numerical simulation. Beach morphology is displayed in two categories, including beach profiles (Figure 5) and cross-shore sediment transport characteristics (Table 2).
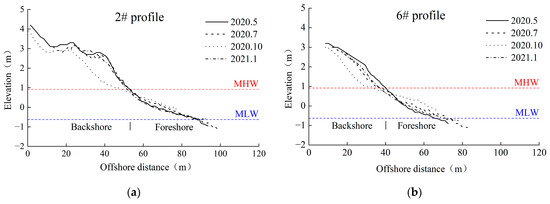
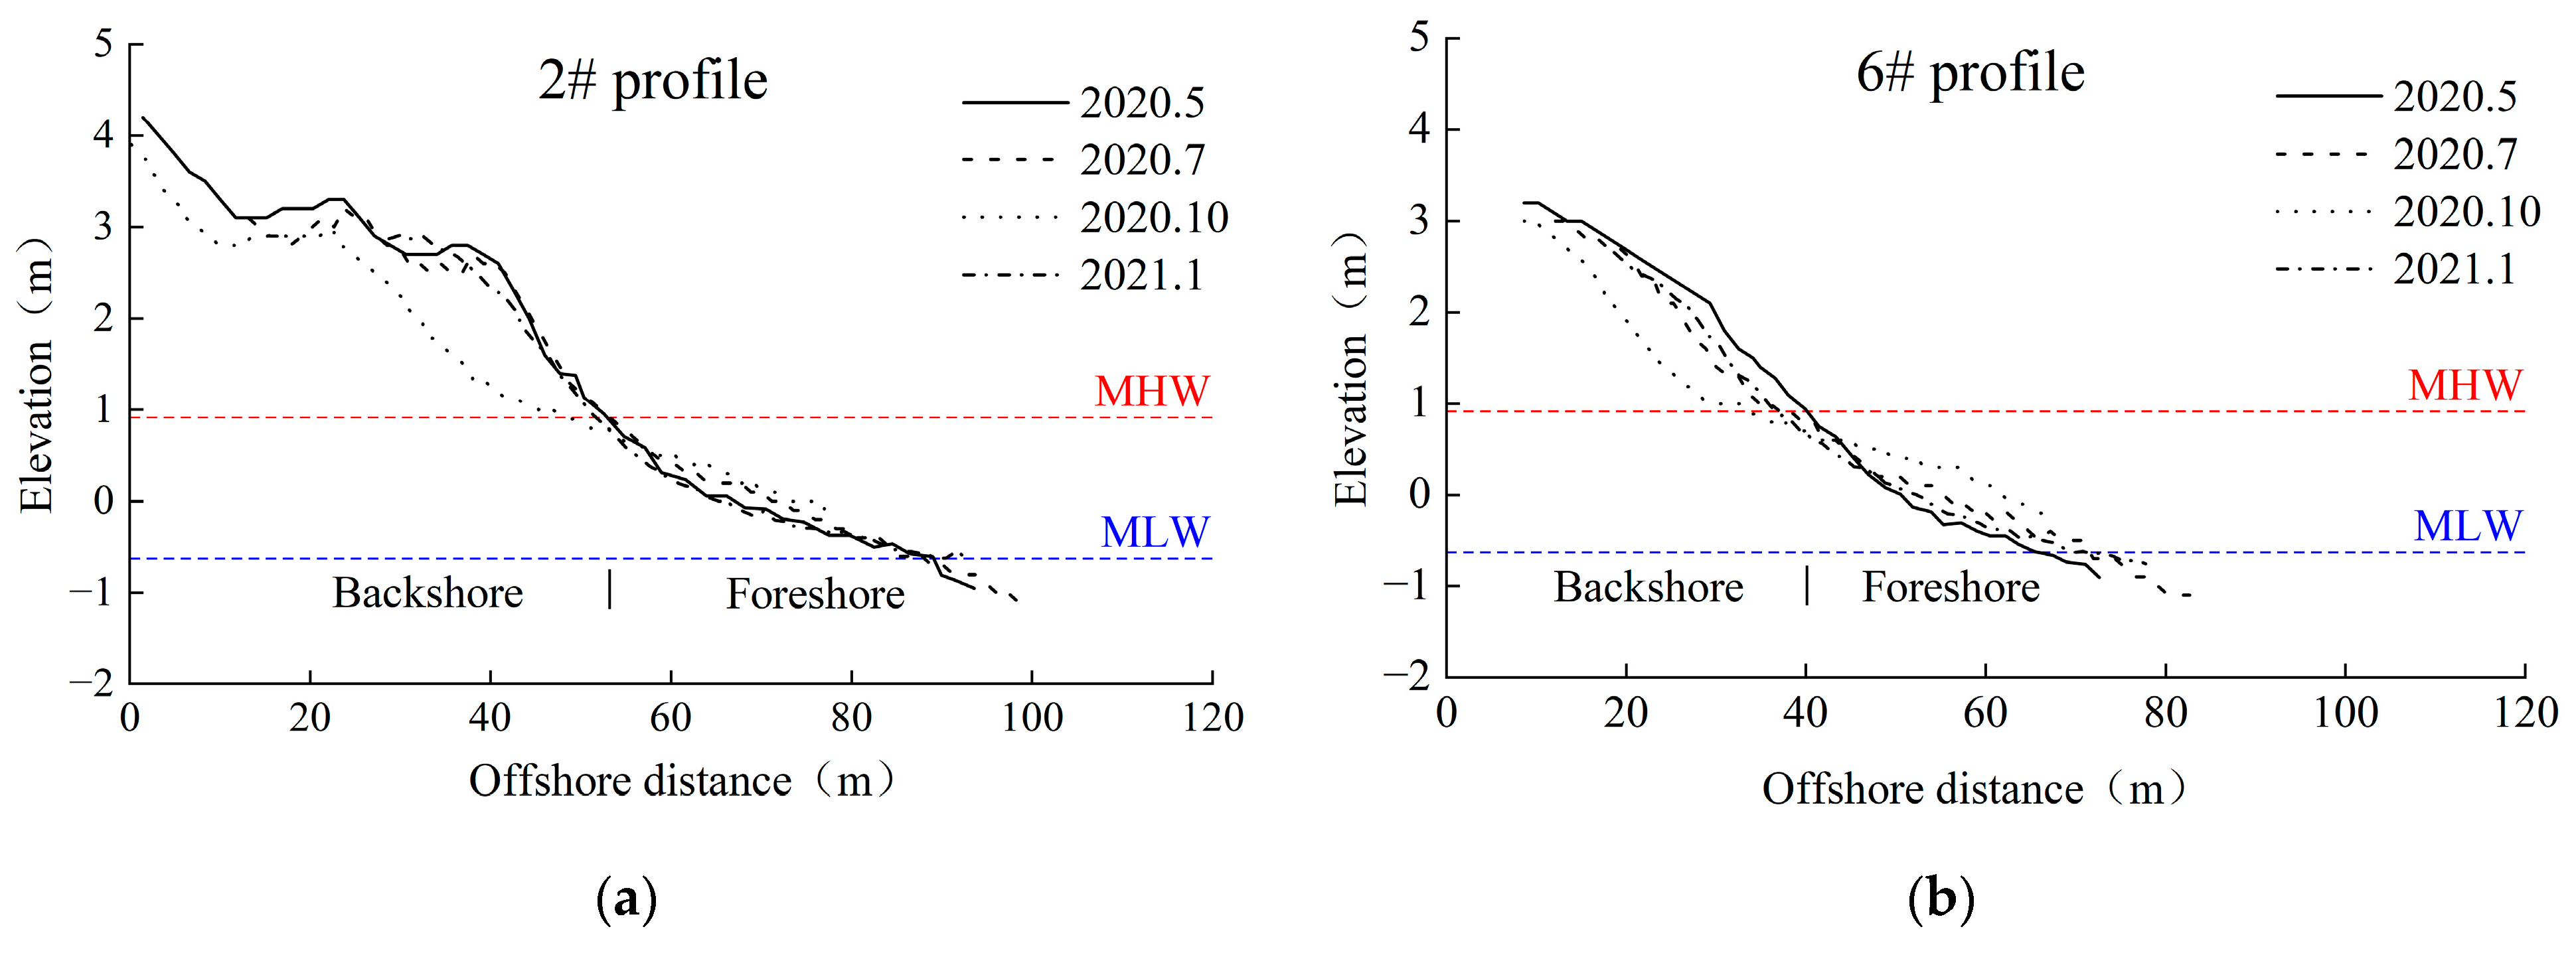
Figure 5.
Seasonal variation in typical profile: (a) Beach evolution of 2# profile. (b) Beach evolution of 6# profile. The berm at Guan Hu Beach has a consistent elevation of 3 m and a width of 30 m. Between July and October 2020, significant erosion was observed, resulting in a change in the foreshore slope from 1:8 to 1:25.
Table 2.
Cross-shore sediment transport of the beach profile in October.
4.1.1. Beach Profile
As the shape of Guanhu Beach is wide in the west and narrow in the east from the top view, the beach profiles can be classified and grouped after summarizing the evolution law, profile shape, and relative geographical location. The profiles of Guanhu Beach are specifically divided into 1#~4# profile and 5#~6# profile. The former group of profiles has a beach berm while the latter group of sections has no beach berm and shows a slope type. Their geographical locations correspond to the west side of Guanhu Beach and the east side of Guanhu Beach, respectively. The 2# profile and 6# profiles are typical profiles of the west side of Guanhu Beach and the east side of Guanhu Beach, respectively. The seasonal variation in the typical profile is shown in Figure 5. Both groups of profiles have erosion in autumn.
As shown in Figure 5, seasonal erosion at Guanhu Beach primarily occurs at the beach berm during autumn. To accommodate the rapid increase in dry beach area during this season, applying beach berm nourishment is the most effective approach. The maximum erosion depth of profile 2# is recorded at 40 m from the nearshore. During autumn, some of the backshore sand is transferred to the foreshore, with an average erosion depth of 0.78 m and a maximum depth of 1.7 m. For profile 6#, the maximum erosion depth is observed at 30 m from the nearshore. Similar to profile 2#, a portion of the backshore sand in Profile 6 also transitions to foreshore sand, with an average erosion depth of 0.4 m and a maximum of 0.9 m. In the summer, the foreshore slopes of both profiles are approximately 1:8. As erosion progresses in autumn, these slopes gradually decrease to 1:25. These findings are consistent with observations from the west coast of the Gulf of Thailand [4], where beach slopes vary seasonally due to shifting wave patterns. This study highlights the erosion dynamics occurring in the backshore during autumn. Therefore, when designing the nourishment scheme for Guanhu Beach, it is essential to prioritize the calculation of cross-shore sediment transport specifically for the autumn season.
4.1.2. Cross-Shore Sediment Transport Characteristics of Guanhu Beach
The cross-shore sediment transport is mainly related to wave steepness, beach sediment particle size, and beach slope. The characteristics of cross-shore sediment transport C can be determined according to Equation (8). The equation is as follows:
In the equation, when C is between 0.3 and 0.7, the profile is transitional, and the scouring and deposition amplitude is small. According to the dispersion relationship of deep-water waves, . ω is sediment settling velocity, and it can be calculated by a semiempirical equation [30] as follows:
The parameters can be determined from the measured data and the characteristic parameters of cross-shore sediment transport C of the beach profile in October are calculated as shown in Table 2.
The C values are all above 0.5, indicating that the direction of cross-shore sediment transport in autumn is offshore dominated. The scheme with the lowest cross-shore sediment transport rate in autumn should be selected as the best scheme.
4.2. The Feedback Mechanism between Cross-Shore Sediment Transport and Foreshore Slope
According to Section 3.1, the volume of sediment moving toward the shore at the bottom of the bed surface per unit area is Vb. The density of sediment and water are and . Its weight is
The component of gravity along the slope is
When the bottom sediment moves toward the shore, the resistance along the slope R is
where fw is the resistance coefficient under wave conditions. Taking the velocity of sediment transport at the bottom as , it can be deduced from the law of conservation of energy that the power to overcome resistance and gravity during sediment movement is provided by wave energy, i.e.,
where eb is the efficiency coefficient, is time-averaged energy flow gradient of binary propelling wave and it can be expressed as follows:
where H is wave height, C is wave velocity, k is wave number and D is water depth. Due to the volume sediment discharge rate of bottom sediment , then it can be expressed as follows:
Assuming that the volume of sediment moving toward the bank at the bottom of the bed surface per unit area is Vs and the average velocity of suspended sediment transferring is , the power to overcome gravity when suspended sediment is also provided by wave energy and the energy conversion efficiency is es, i.e.,
The volume sediment discharge rate of suspended sediment , then it can be expressed as follows:
For eroded beaches, , , then net cross-shore sediment transport qoff can be expressed as follows:
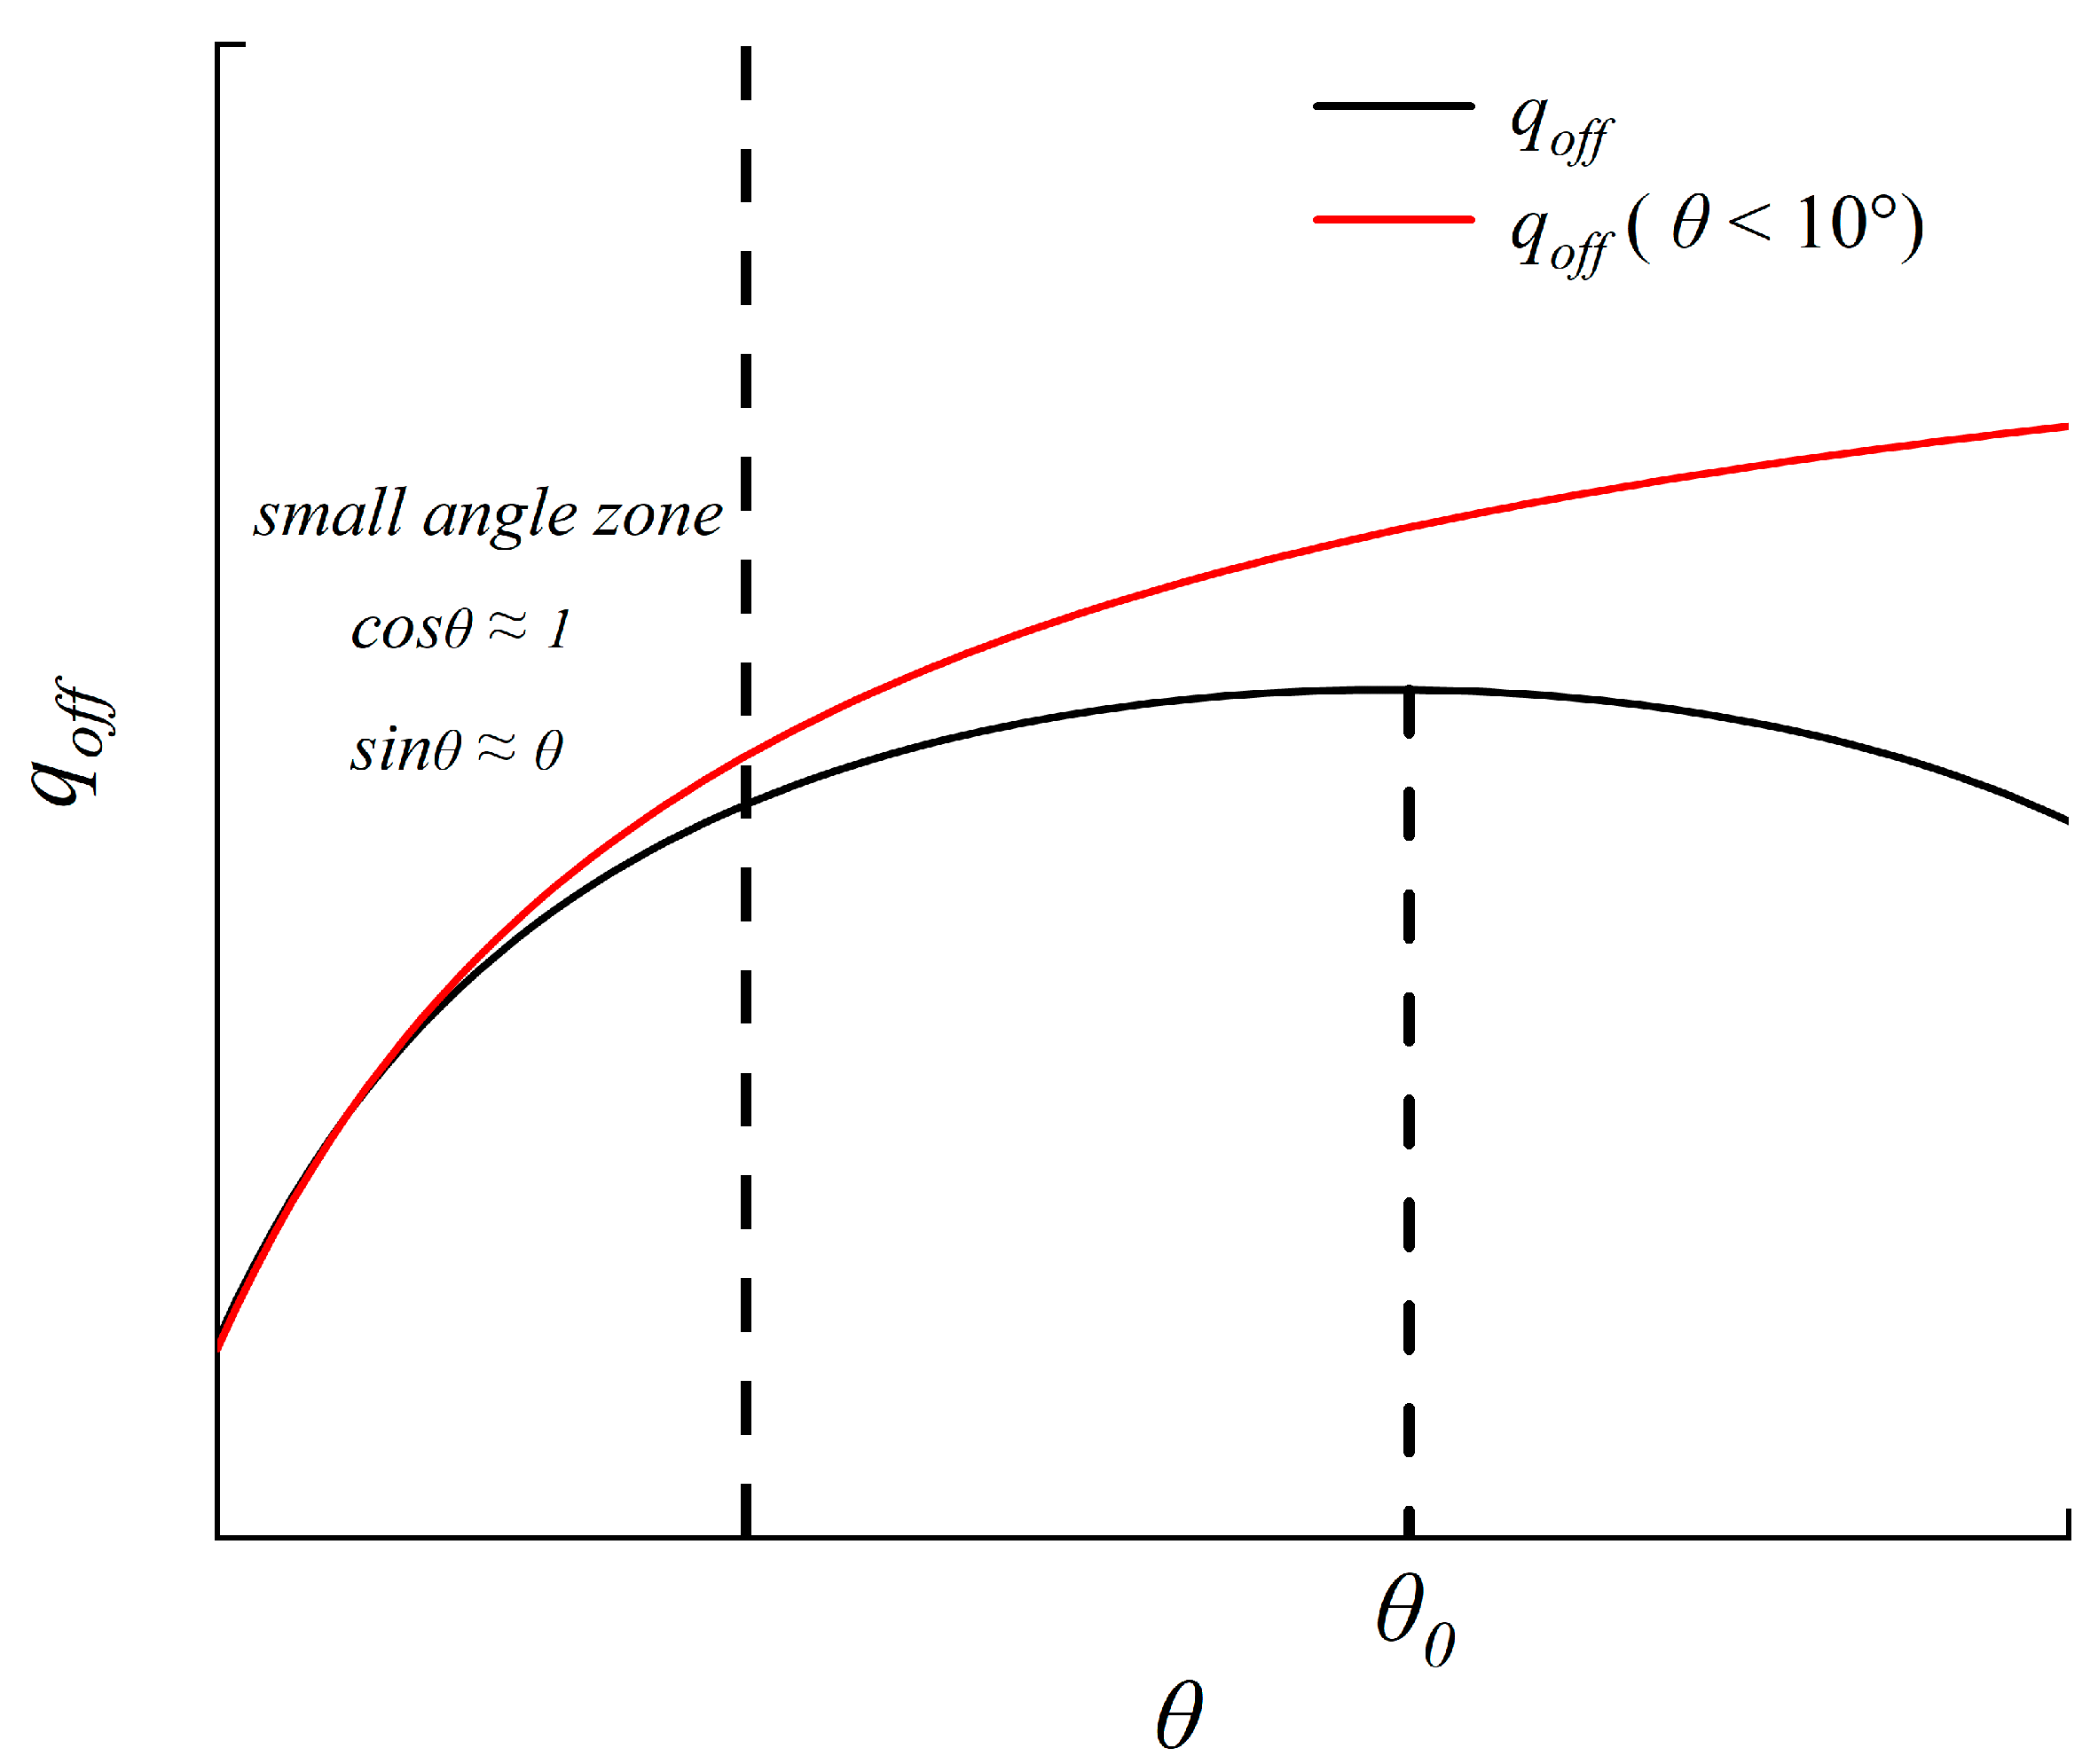
According to the monotonicity analysis of the net cross-shore sediment discharge, the extreme point of the equation is θ0 = arccotfw. When the degree of foreshore θ is between 0 and arccotfw, the net cross-shore sediment discharge increases monotonically. As the degree of foreshore θ is over arccotfw, it decreases monotonically. The foreshore slope of nourishment is slow, and the angle is below 10 degrees refer to the previous research. When the angle is less than 10°, calculations based on trigonometric functions can be derived that ,. Therefore, the Equation (18) can be replaced as
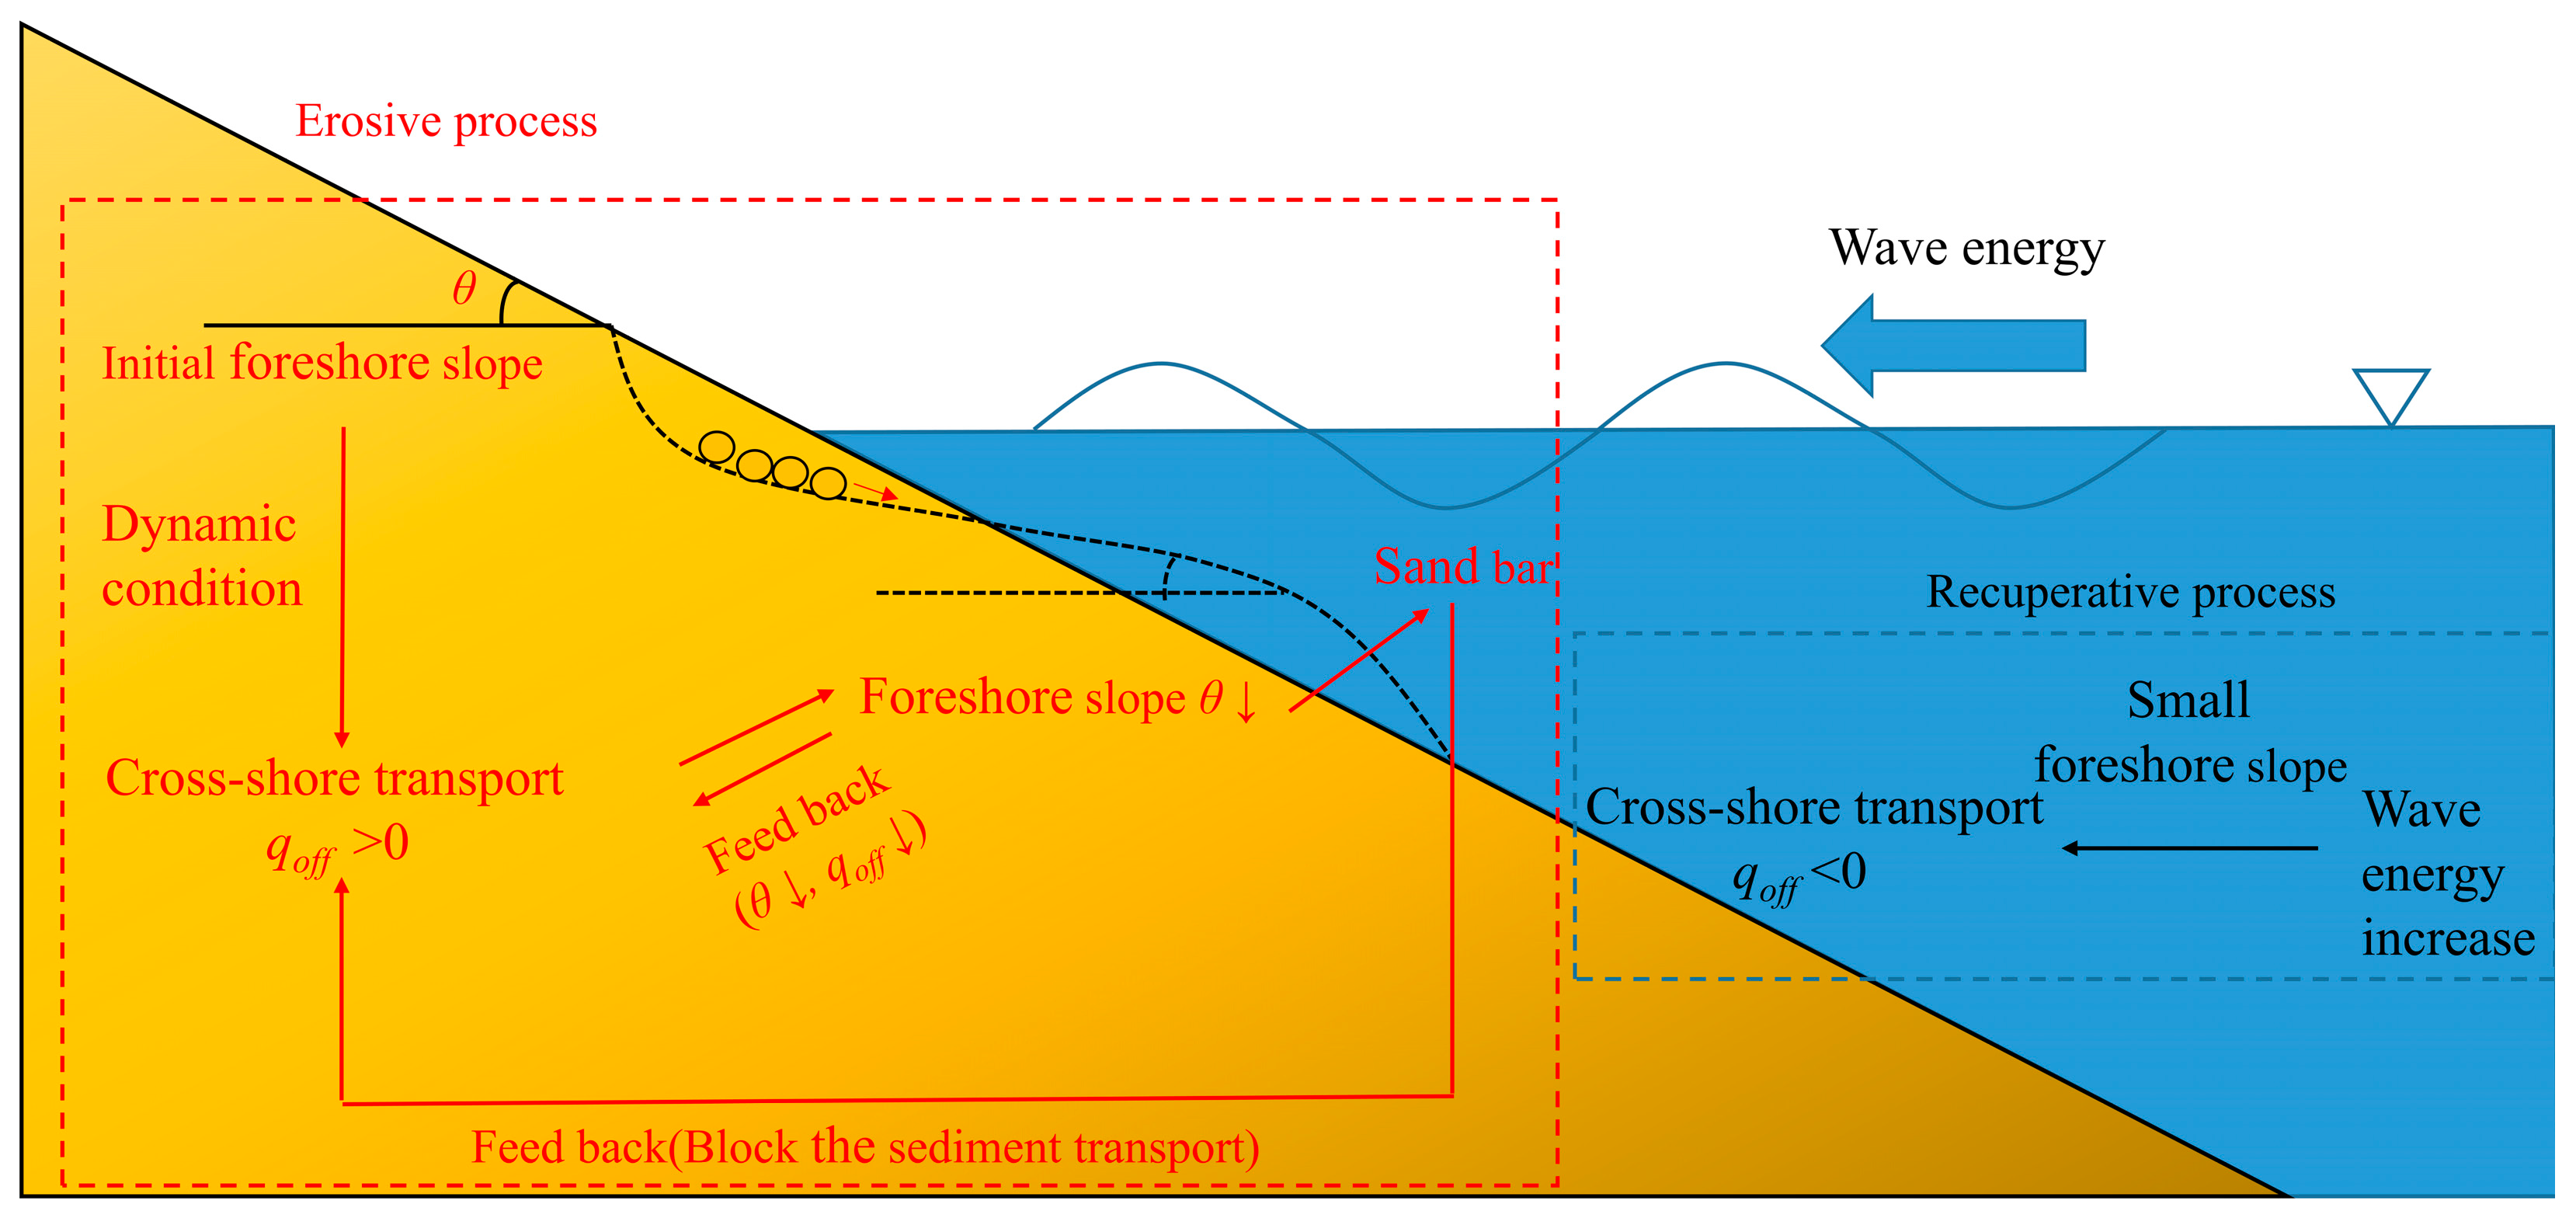
The figure (Figure 6) illustrates a general trend: a smaller foreshore slope, predominantly within the small-angle zone, results in decreased cross-shore sediment transport. The reduced transport corresponds to less net cross-shore sediment loss in the beach profile. Sediment, typically moved seaward during transport, further decreases the foreshore slope. This ongoing process, mirrored in the relationship curve within the small-angle zone, contributes to the sustained decrease in cross-shore sediment transport. Once sediment transport reduces to zero, a temporary equilibrium in the profile is attained. This balance facilitates off-shore sandbar nourishment—particularly when the initial foreshore slope is small, maintaining balance for extended periods and enabling larger sandbar formation. The findings of this study align with Mustafa’s experimental results [8], showing that beach profiles with smaller initial slopes can form larger equilibrium sandbars. Conversely, a larger initial slope makes sandbar formation less likely. Seasonal changes—such as increased wave energy input with changing monsoon conditions—can cause transport to decrease below zero, shifting toward on-shore transport and initiating recovery. This analysis aligns with Li’s experimental findings [31]. As wave energy increases, the rate of sand transport toward the shore also rises. This results in the movement of sandbars closer to the shore and leads to the sediment deposition in the beach profile. Both erosive and recuperative processes contribute to the beach profile’s seasonal variation in cross-shore sediment transport (Figure 7). In monsoon-dominated coastal processes, the erosive process occurs during storm season and the recuperative process occurs during calm season [32,33]. Figure 7 offers a detailed explanation. Accordingly, the beach nourishment scheme should incorporate an appropriate smaller foreshore slope to promote the formation of a larger equilibrium sandbar, which can help reduce the net cross-shore sediment transport rate. This section outlines the principles for selecting an optimal beach nourishment scheme from a qualitative perspective. In the following sections, numerical simulation will provide a quantitative assessment to validate these principles.

Figure 6.
Relationship between qoff and θ. The black line represents Equation (18), while the red line represents Equation (19). In the small-angle zone with angles less than 10°, the values of the two equations can be considered similar, as the red line nearly coincides with the black line.

Figure 7.
The feedback process between cross-shore sediment transport and foreshore slope. The red box illustrates the erosive process, while the blue box illustrates the recuperative process. Together, these elements contribute to the seasonal changes observed on the beach.
4.3. Responses of Beach Profiles with Diverse Foreshore Slopes to Real-Scale Dynamics
The preceding section theoretically analyzed the interplay between cross-shore sediment transport and foreshore slope. However, it is uncertain whether the characteristics of cross-shore sediment transport in a beach profile under complex hydrodynamic conditions align with this feedback mechanism. To explore this proposition, we introduce Guanhu Beach as the focus of our study, examining the responses of beach profiles with diverse foreshore slopes to real-scale dynamics. Section 2 provides an overview of the beach and discloses the recent dynamic conditions.
4.3.1. Numerical Simulation Validation and Beach Profile Design
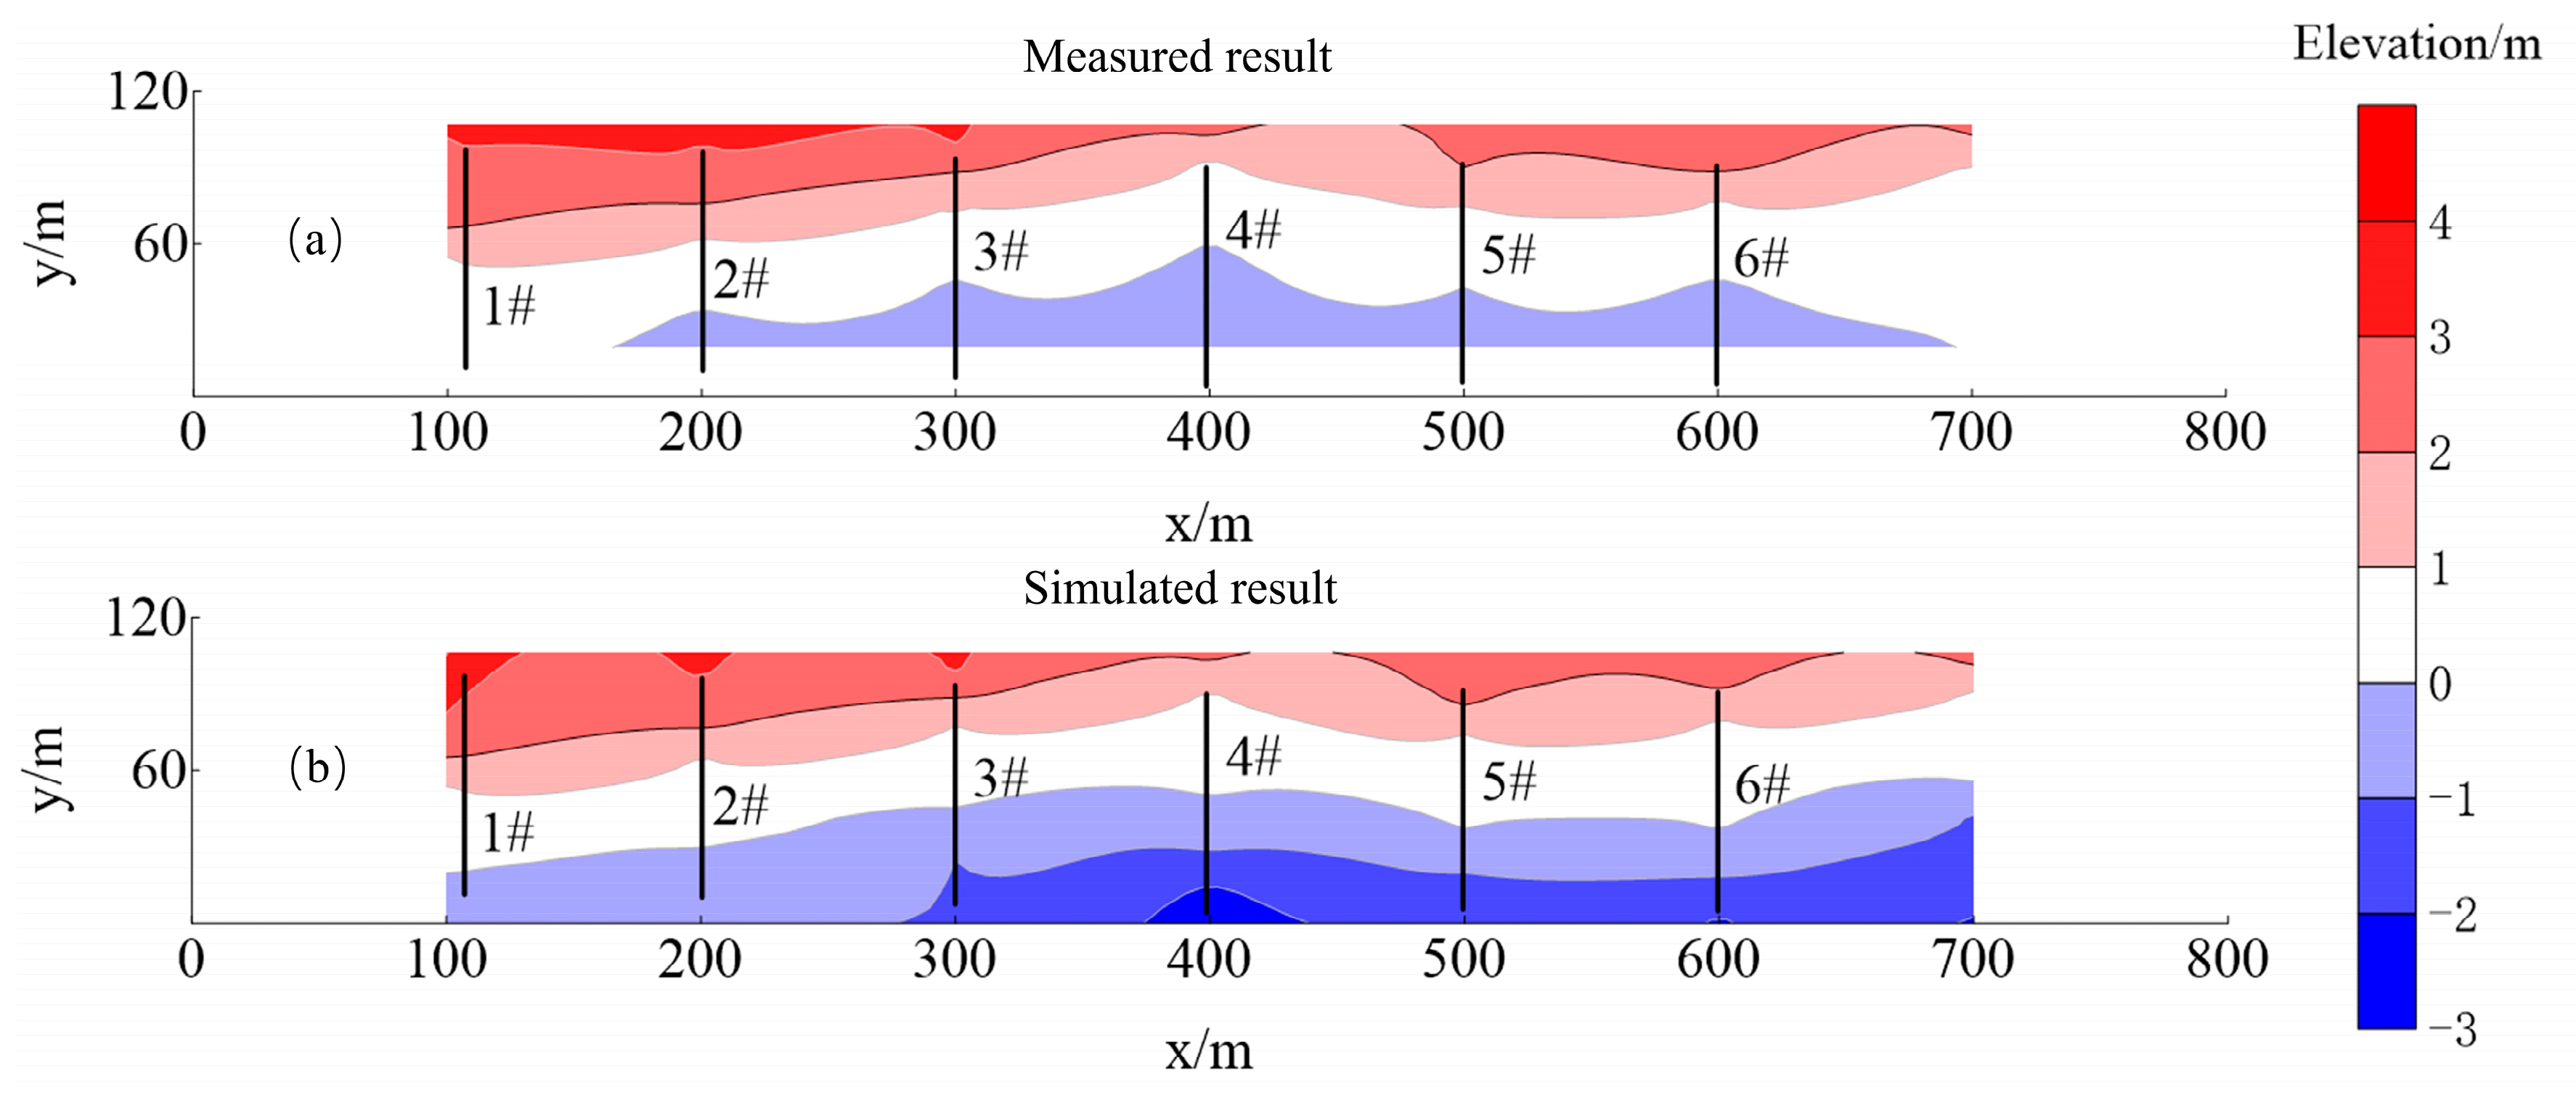
The profile after 3 months is simulated by running the XBeach model. The simulated result, i.e., the beach elevation in October, is compared with the measured profile in October 2020. A plan view comparison between the field and numerical model is shown in Figure 8. The simulated area is slightly larger than the measured area due to weakening boundary effects. The verification of each profile is shown in Figure 9.

Figure 8.
Plan view of the field and numerical model: (a) Measured beach elevation in October 2020. (b) Simulated beach elevation in October 2020. The white and red regions represent land, while the blue area represents the sea. The area included in the simulation is slightly larger than the measured area.
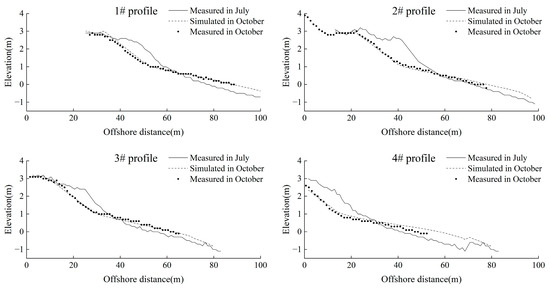
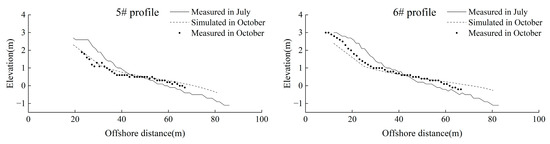
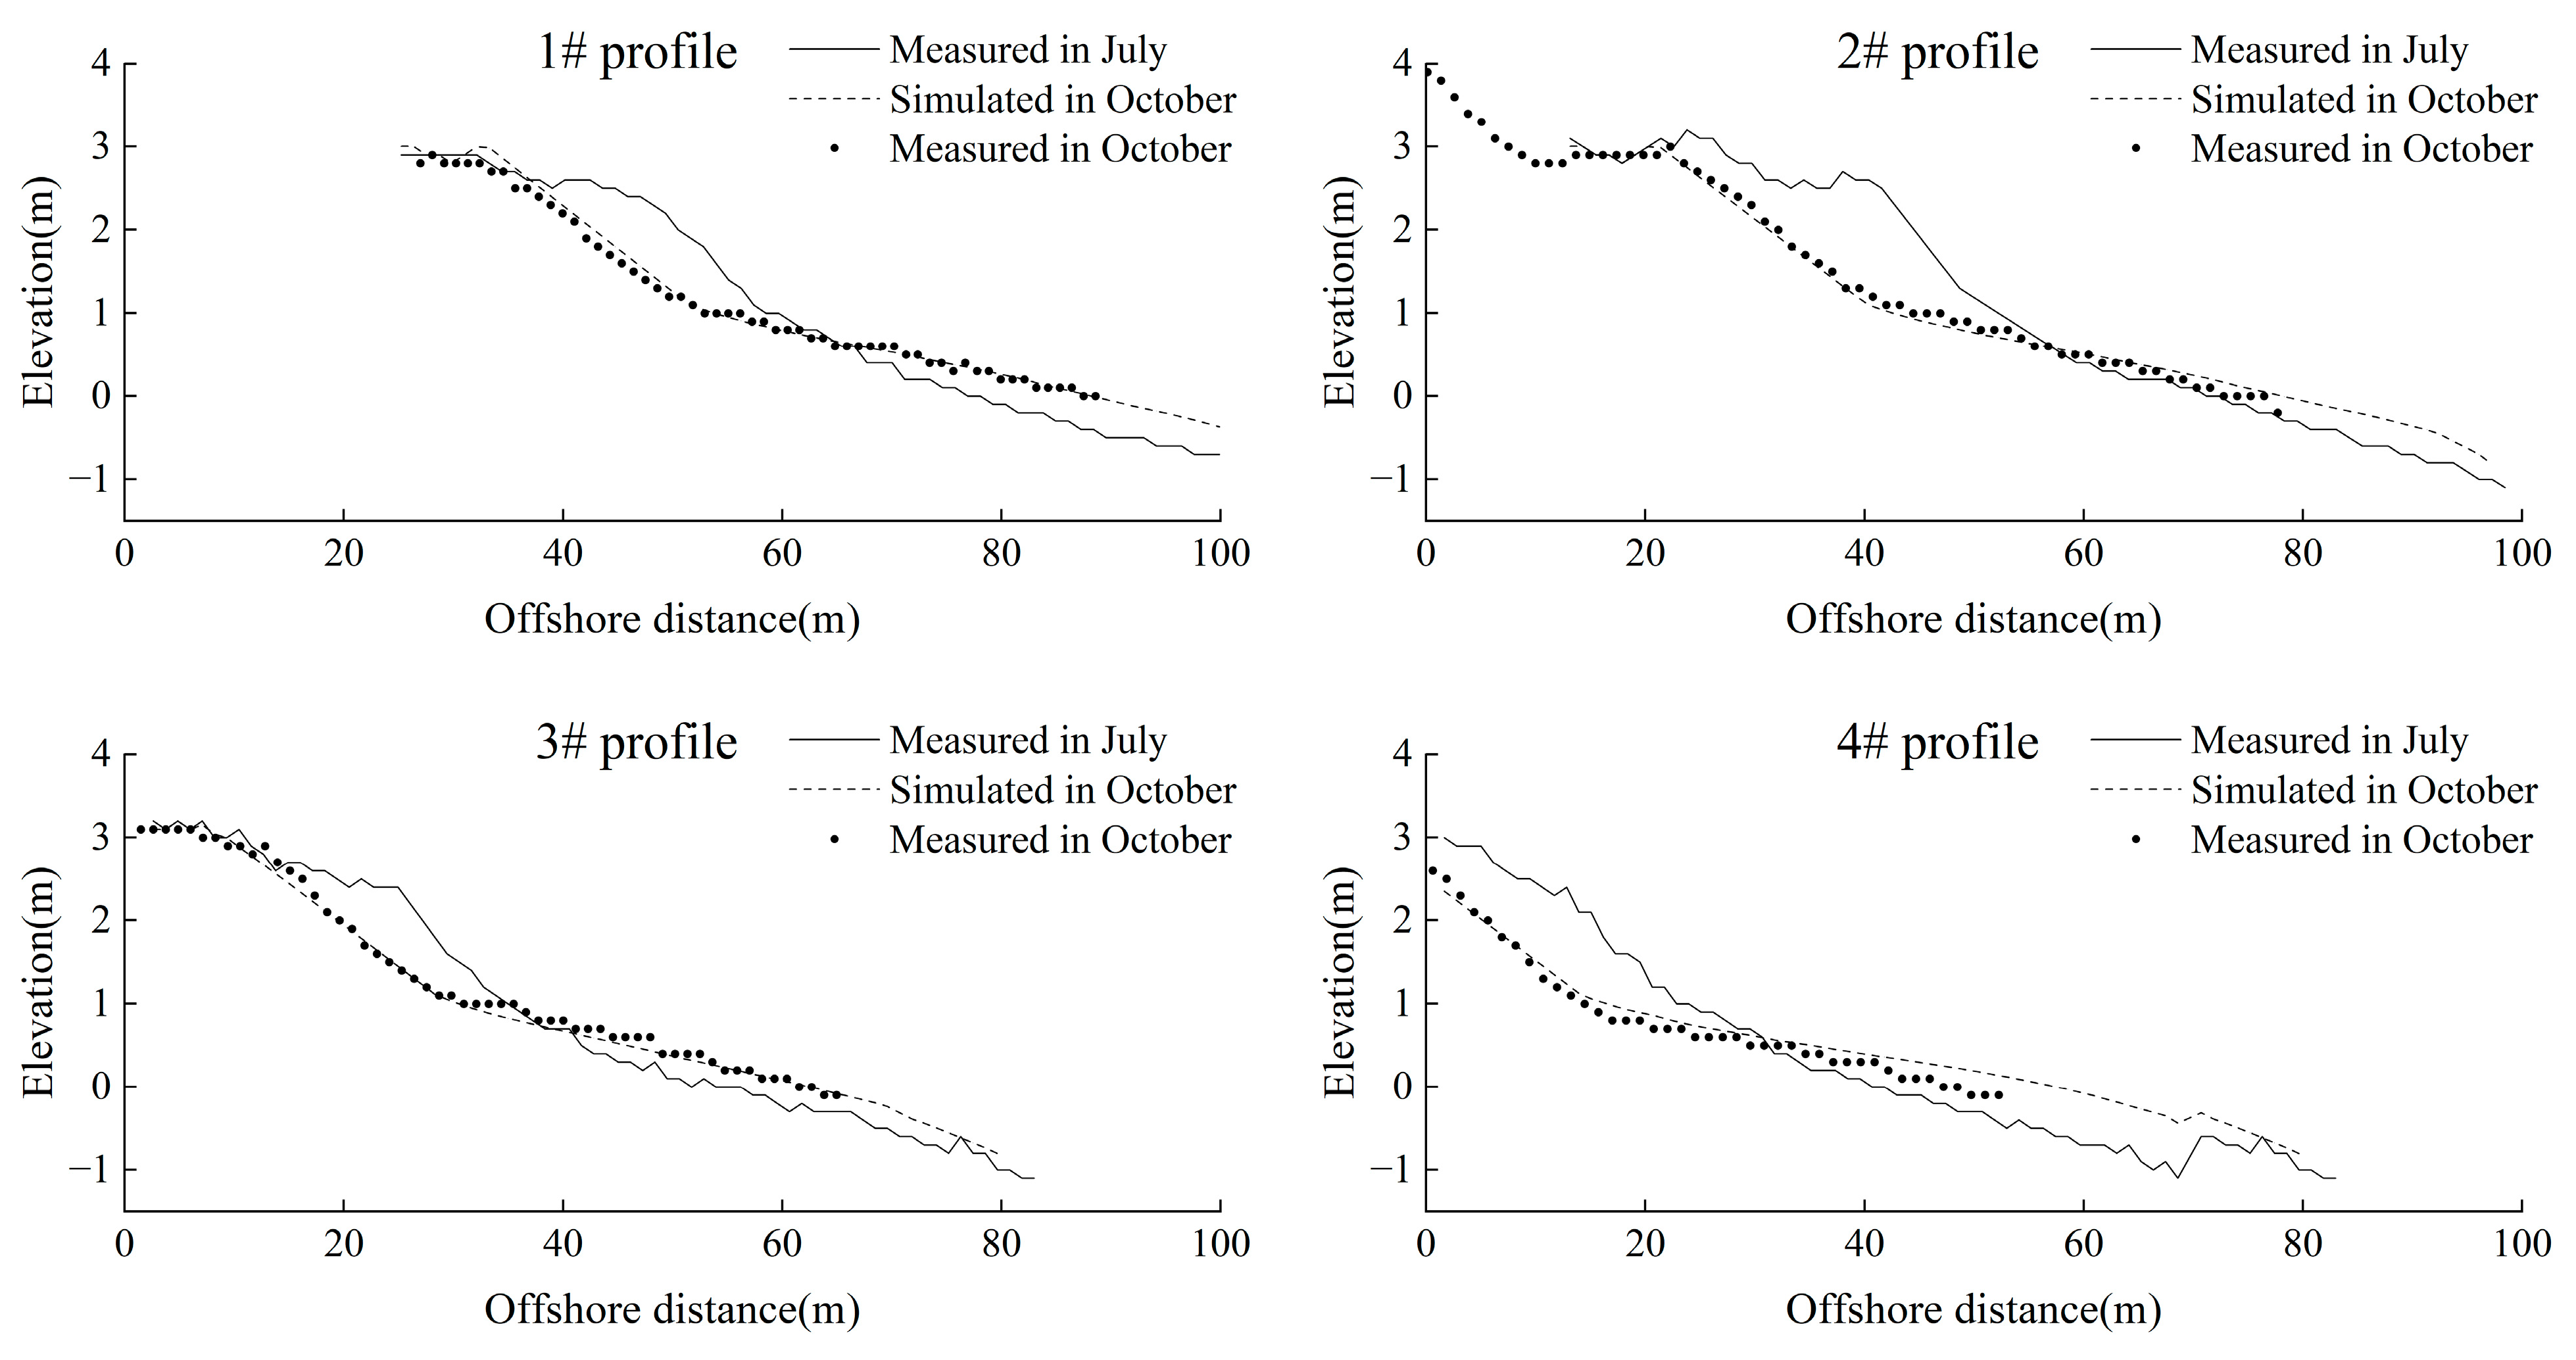
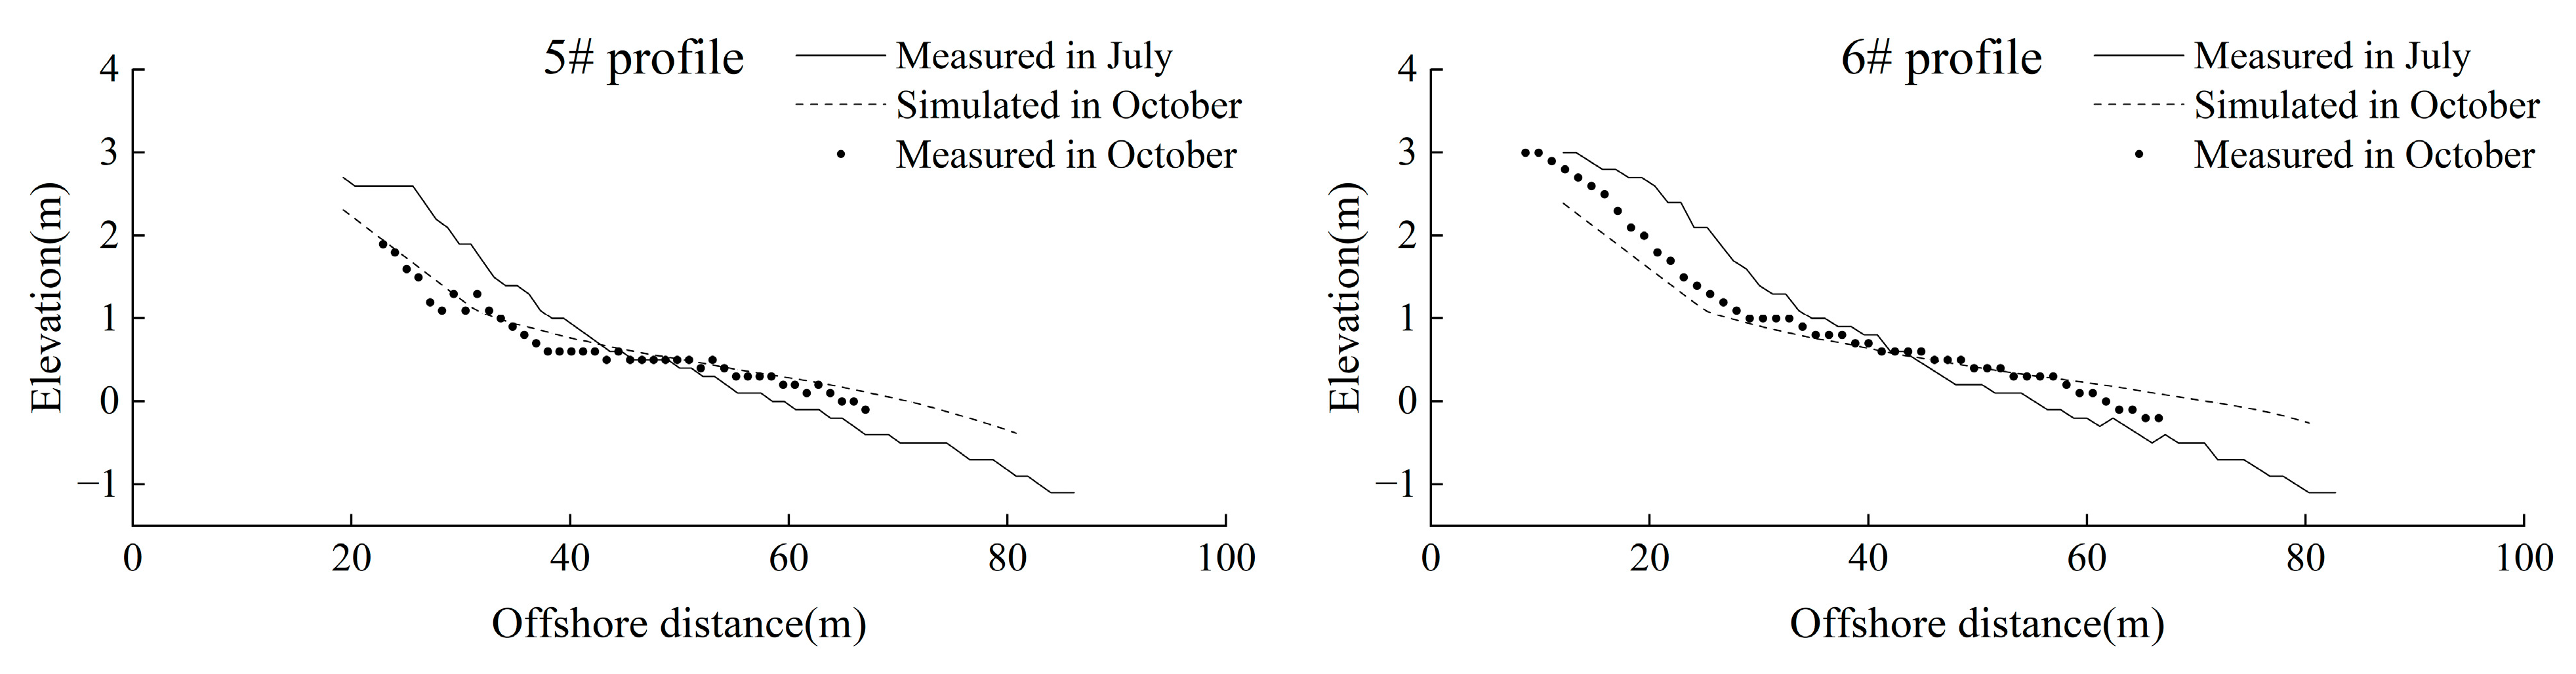
Figure 9.
Xbeach model profile validation (successively from 1# profile to 6# profile). The Brier Skill Scores for each profile exceed 0.8, while the coefficient of determination is over 0.9. These results demonstrate that the two-dimensional model effectively simulates changes in beach profiles in response to actual dynamic conditions.
The result of numerical simulation is consistent with the measured result. The cross-shore sediment transport is offshore, which leads to erosion of the beach backshore and siltation of the beach foreshore.
The Brier Skill Scores (BSS) value [34] is a common parameter used to verify the accuracy and validity of mathematical models. The specific expressions are as follows:
where is the simulated results of the mathematical model; are measured data; are initial data. The BBS value should be close to 1, which means that the mathematical model is close to the actual situation. It is generally considered that the mathematical model is effective between 0.6 and 1 [35,36].
The determination coefficient R2 can be used to describe the correlation between measured results and model results. The closer R2 is to 1, the higher the fitting degree between model results and measured data is. The specific calculation equation is as follows:
The model evaluation values are calculated as shown in the Table 3:
Table 3.
Evaluation values for XBeach model.
The results indicate that this model closely aligns with actual conditions and effectively demonstrates the topographic evolution of Guanhu Beach under dynamic environmental conditions. Next, beach nourishment schemes with different foreshore slopes will be designed for separate studies on the responses of the beach profile to monsoon wave conditions and storm surge conditions.
According to the introduction of the foreshore slope in Section 3.3, the recommended foreshore can be calculated as follows: , , . The slope derived from the United States Army Corps of Engineers Manual aligns with the equilibrium slope results produced by the Hattori and Kawamata formula. This alignment occurs because both calculations fundamentally adhere to Dean’s equilibrium profile principle. Compared with the other two slopes, the slope of the beach profile calculated according to the Japanese Manual closely matches the actual beach slope but is relatively steeper. By leveraging the calculated foreshore slope and the data from previous surveys, we designed beach profiles for two different schemes. Additionally, to facilitate a comparative analysis, we included the original 2# profile of the actual topography in Guanhu Beach. The following table (Table 4) illustrates the parameters for each profile:
Table 4.
Parameters of beach profiles.
4.3.2. Beach Profile Evolution under Monsoon Wave Conditions
The design profile parameters of each plan are imported into the XBeach model for simulation and the dynamic conditions remain unchanged. The simulated results are shown in the Figure 10:
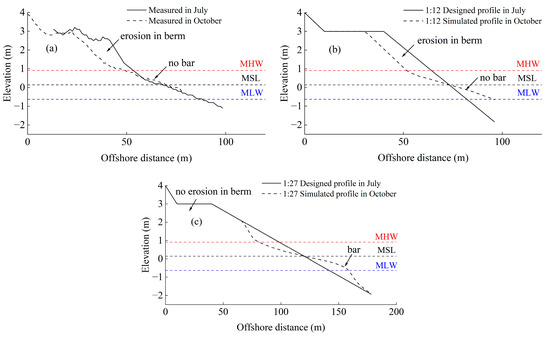
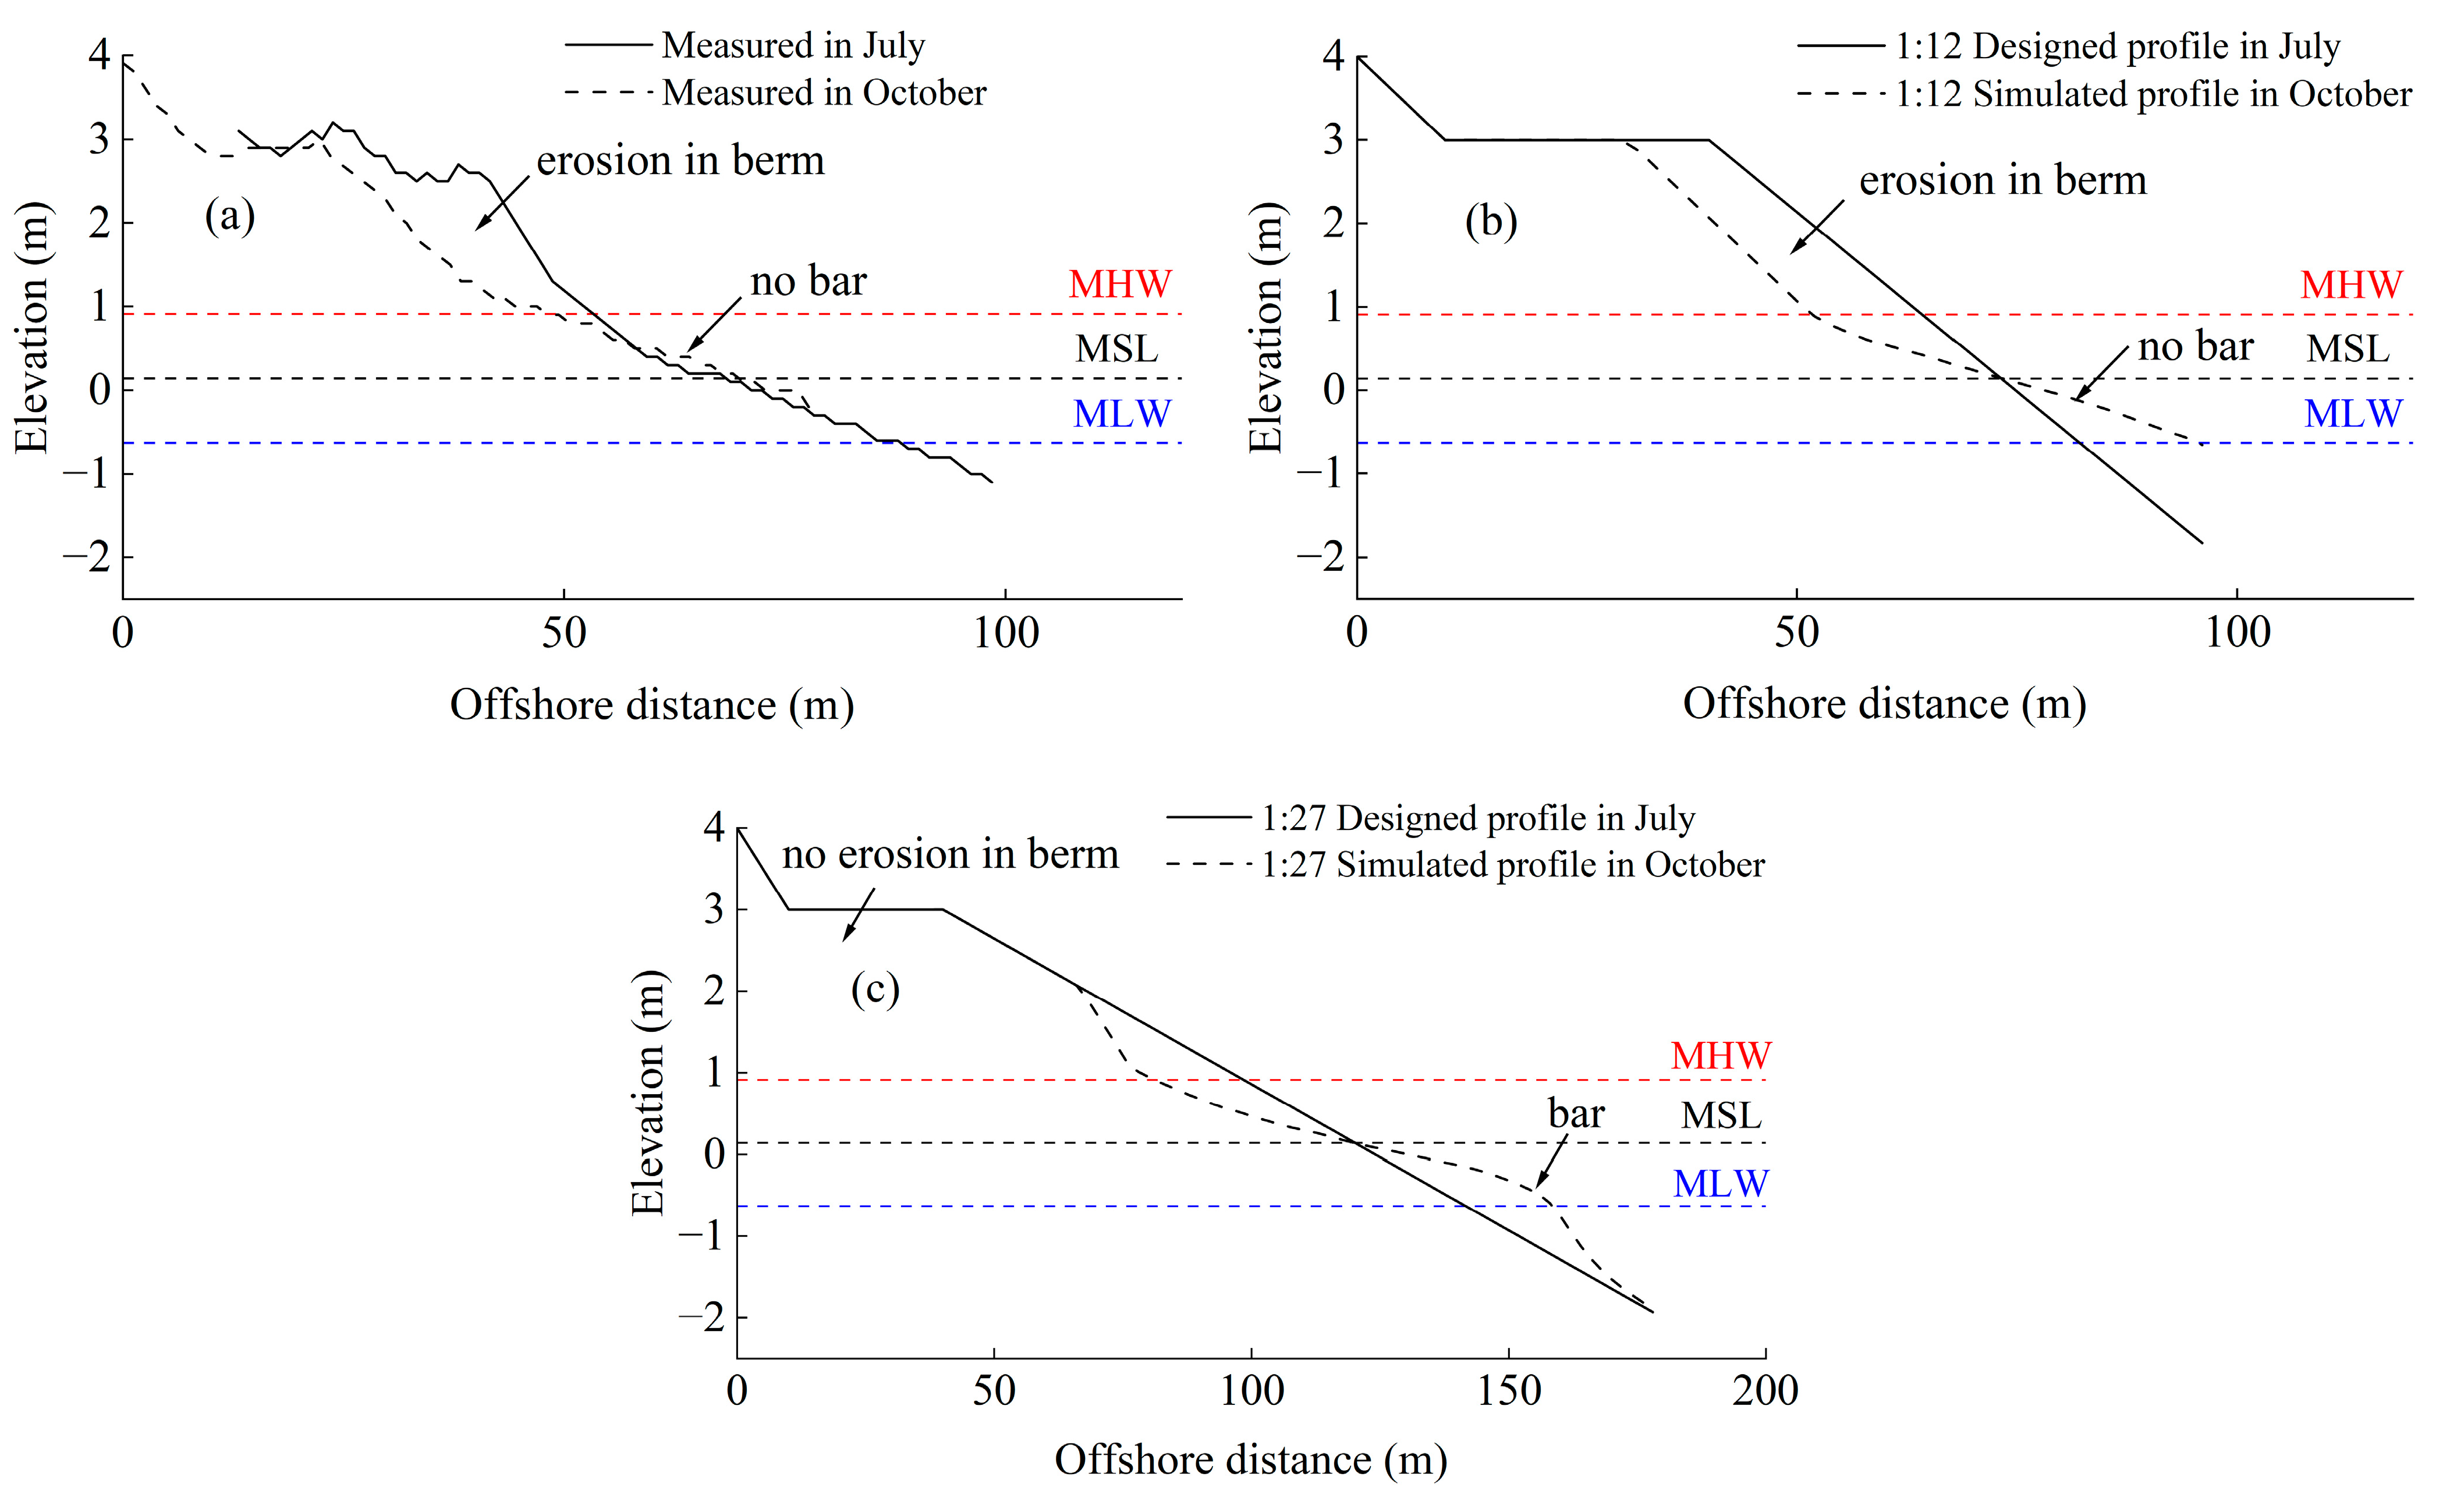
Figure 10.
Various beach profile evolution under monsoon wave conditions: (a) 1:8 initial foreshore slope (b) 1:12 initial foreshore slope; (c) 1:27 initial foreshore slope. The steep foreshore slopes (a,b) experienced direct erosion of the berm, without the formation of a sandbar, while the gentler foreshore slope (c) showed no berm erosion and resulted in the establishment of a stable sandbar.
Examining the beach profile morphology reveals that both the original and Scheme 1 profiles exhibit direct erosion of the beach berm but lack the formation of sandbars. In contrast, the Scheme 2 profile does not show direct erosion of the beach berm but rather displays the development of sandbars. Detailed characteristics are outlined in the subsequent table (Table 5).
Table 5.
Erosion and sandbar development characteristics of profiles with different foreshore slopes under monsoon wave conditions.
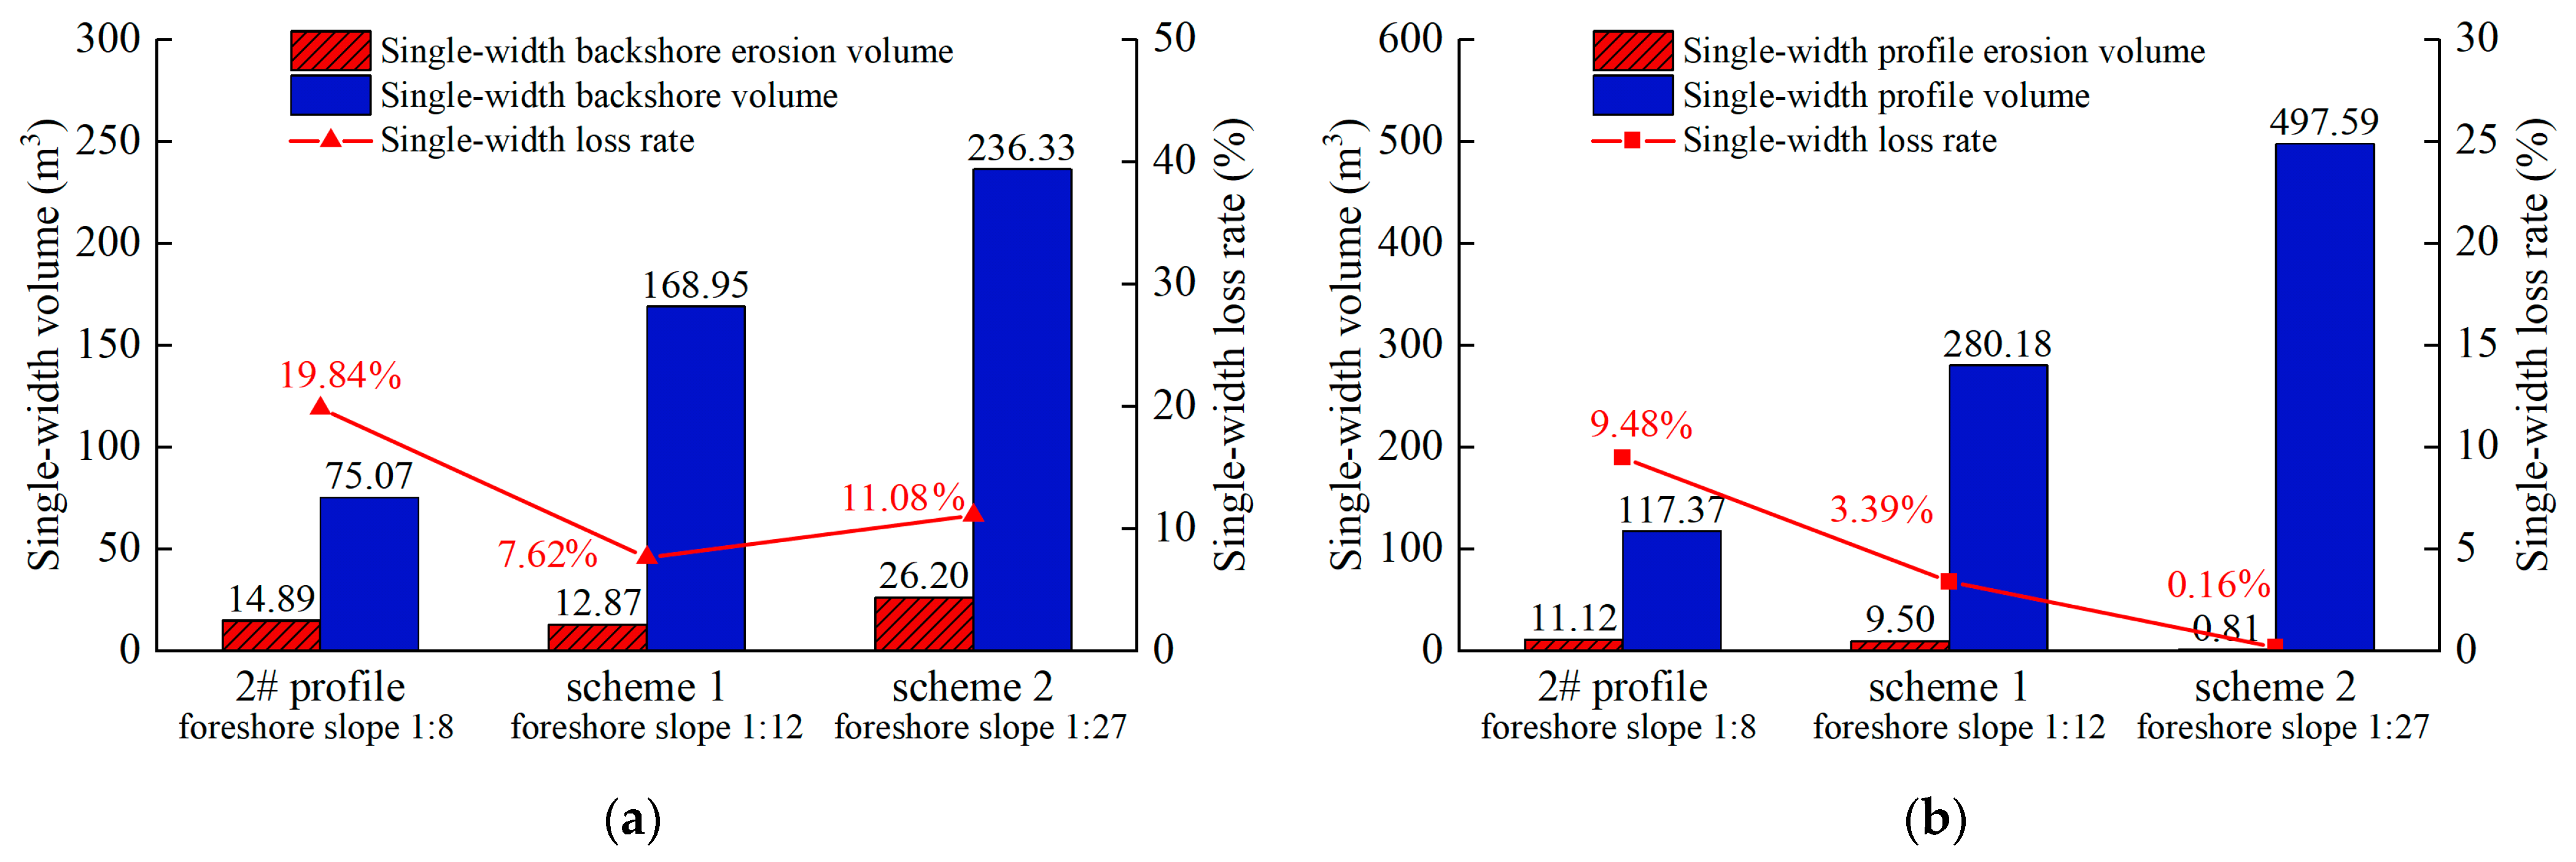
The backshore’s alterations show that as the slope diminishes, so does the single-width backshore loss rate. Interestingly, Scheme 2’s single-width backshore volume increases by only 50% in comparison to Scheme 1, yet its single-width loss rate falls by 100%. This fact implies that Scheme 2 efficiently enlarges the beach area while diminishing initial backshore loss. A comprehensive evaluation of the beach profile alterations indicates that both the single-width cross-shore sediment loss and loss rate dwindle as the slope recedes. In Scheme 2, the net cross-shore sediment transport dips to a mere 0.12%, suggesting the cross-shore sediment transport of the beach profile has essentially achieved a balance.
It can be seen that the simulated results are consistent with the theoretical derivation results of Section 4.1. When the beach nourishment foreshore slope decreases, the erosion volume and single-width attrition rate of beach nourishment are both reduced. Meanwhile, the volume of beach nourishment increases as a whole. The results indicate that the better scheme for beach nourishment in Guanhu Beach is Scheme 2, i.e., the width of the beach berm is 30 m, the elevation of the beach berm is 3.0 m, and the foreshore slope is 1:27. The backshore–shore single-width loss rate of Scheme 2 is 8.39%, and the overall profile single-width loss rate is 0.12% (Figure 11). If considering the loss rate of the beach area and the maintenance time of beach nourishment only, the equilibrium profile foreshore slope should be selected as the priority for beach nourishment. Additionally, it is more convenient to calculate the equilibrium profile of the foreshore slope with the equation proposed by Hattori and Kawamata in actual engineering.

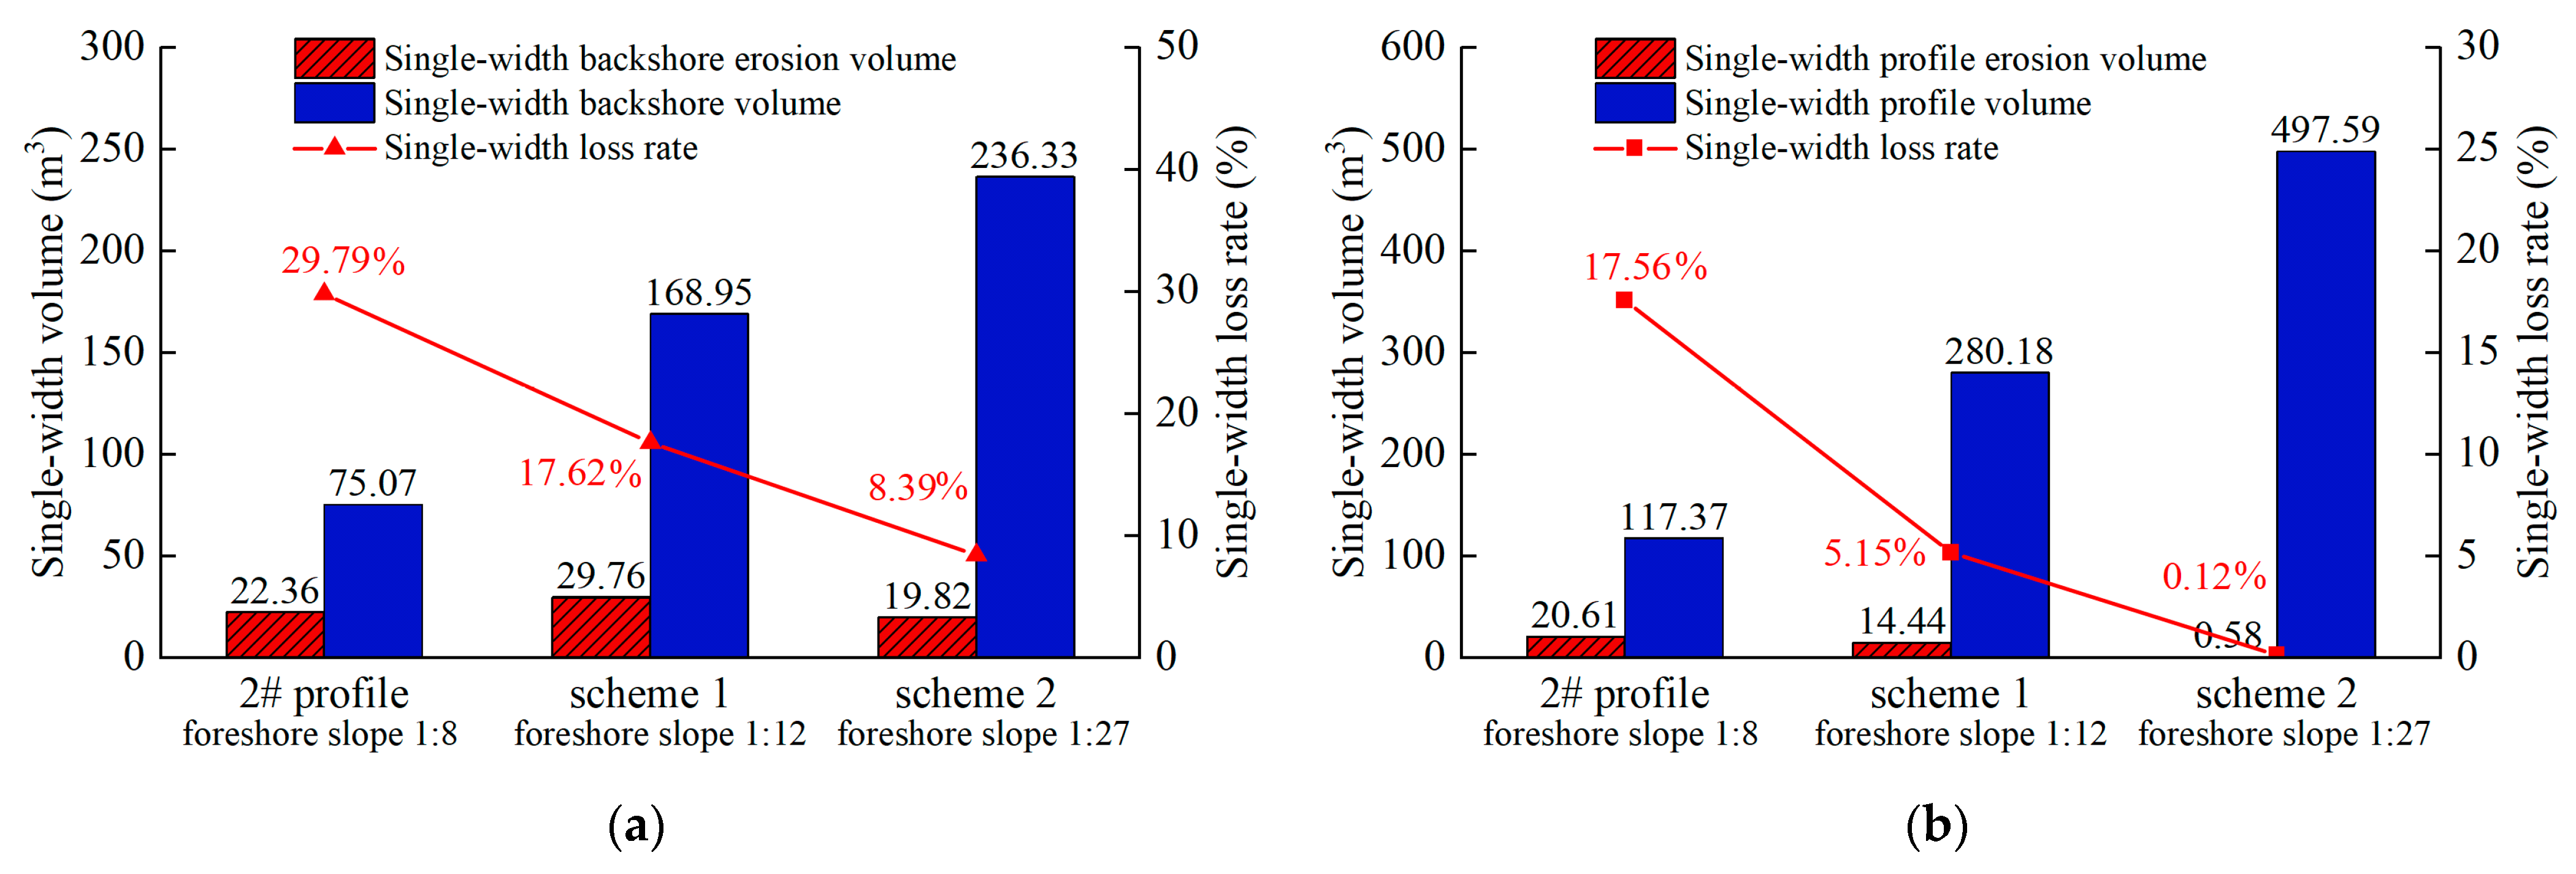
Figure 11.
Erosion and loss rate in single width of profiles with different foreshore slopes under monsoon wave conditions: (a) Only count the backshore erosion. (b) Count the whole profile erosion. Both the backshore erosion rate and the overall profile erosion rate decrease as the slope of the foreshore becomes gentler.
Reducing the foreshore slope in the design plan from 1:8 to 1:27 significantly decreased the volume loss per unit width from 20.61 m3 to 0.58 m3 and resulted in the formation of a protective sandbar. This sandbar effectively reduced sediment loss in the profile. Thus, Scheme 2 is preferred. In beach nourishment design, maintaining the original berm width and elevation with a gentler slope is crucial. This approach ensures lower erosion rates in the backshore and overall profile while promoting larger sandbar formation, which further minimizes sediment loss. Natural beach profiles also indicate that steeper slopes lead to higher erosion rates [4,37]. The beach is not in stable equilibrium with wave conditions, and storm swash–backwash will occur on the beach [38].
Because of different foreshore slopes, erosion degree under dynamic conditions is related to whether the erosion occurs directly on the beach berm of the profile. According to calculation results, beach berm is easier to erode when the foreshore slope is steeper. If the profile is close to Dean’s equilibrium profile, the eroded area is above the mean sea level and below the beach berm elevation. From this comparison, once erosion occurs directly on the beach berm, the loss rate of beach nourishment will be higher. Therefore, there may be a critical foreshore slope so that erosion just does not directly occur on the beach berm. In this event, the loss rate of beach nourishment is relatively low and the cost of the engineering will be further reduced. In addition, existing physical model experimental results [39] are consistent with the conclusions in this paper that the smaller foreshore slope means less beach erosion. However, it is not obvious that smaller foreshore slopes led to more efficient attainment of equilibrium profiles. Therefore, determining a reasonable sand replenishment slope should be based on actual needs.
In the XBeach model simulation, the boundary between beach erosion and accretion is defined by the mean sea level. As the foreshore slope increases, the extent of beach erosion decreases, while the volume of erosion increases significantly. In addition to the dynamic factors incorporated in the XBeach model, other elements such as wind field influences, storm surges, and human activities also play crucial roles in the evolution of beach profiles. It is essential to reasonably prioritize these factors based on the specific circumstances of the area. If necessary, conducting storm surge simulations and thoroughly considering dynamic conditions will help optimize the beach nourishment scheme.
4.3.3. Beach Profile Evolution under Storm Surge Conditions
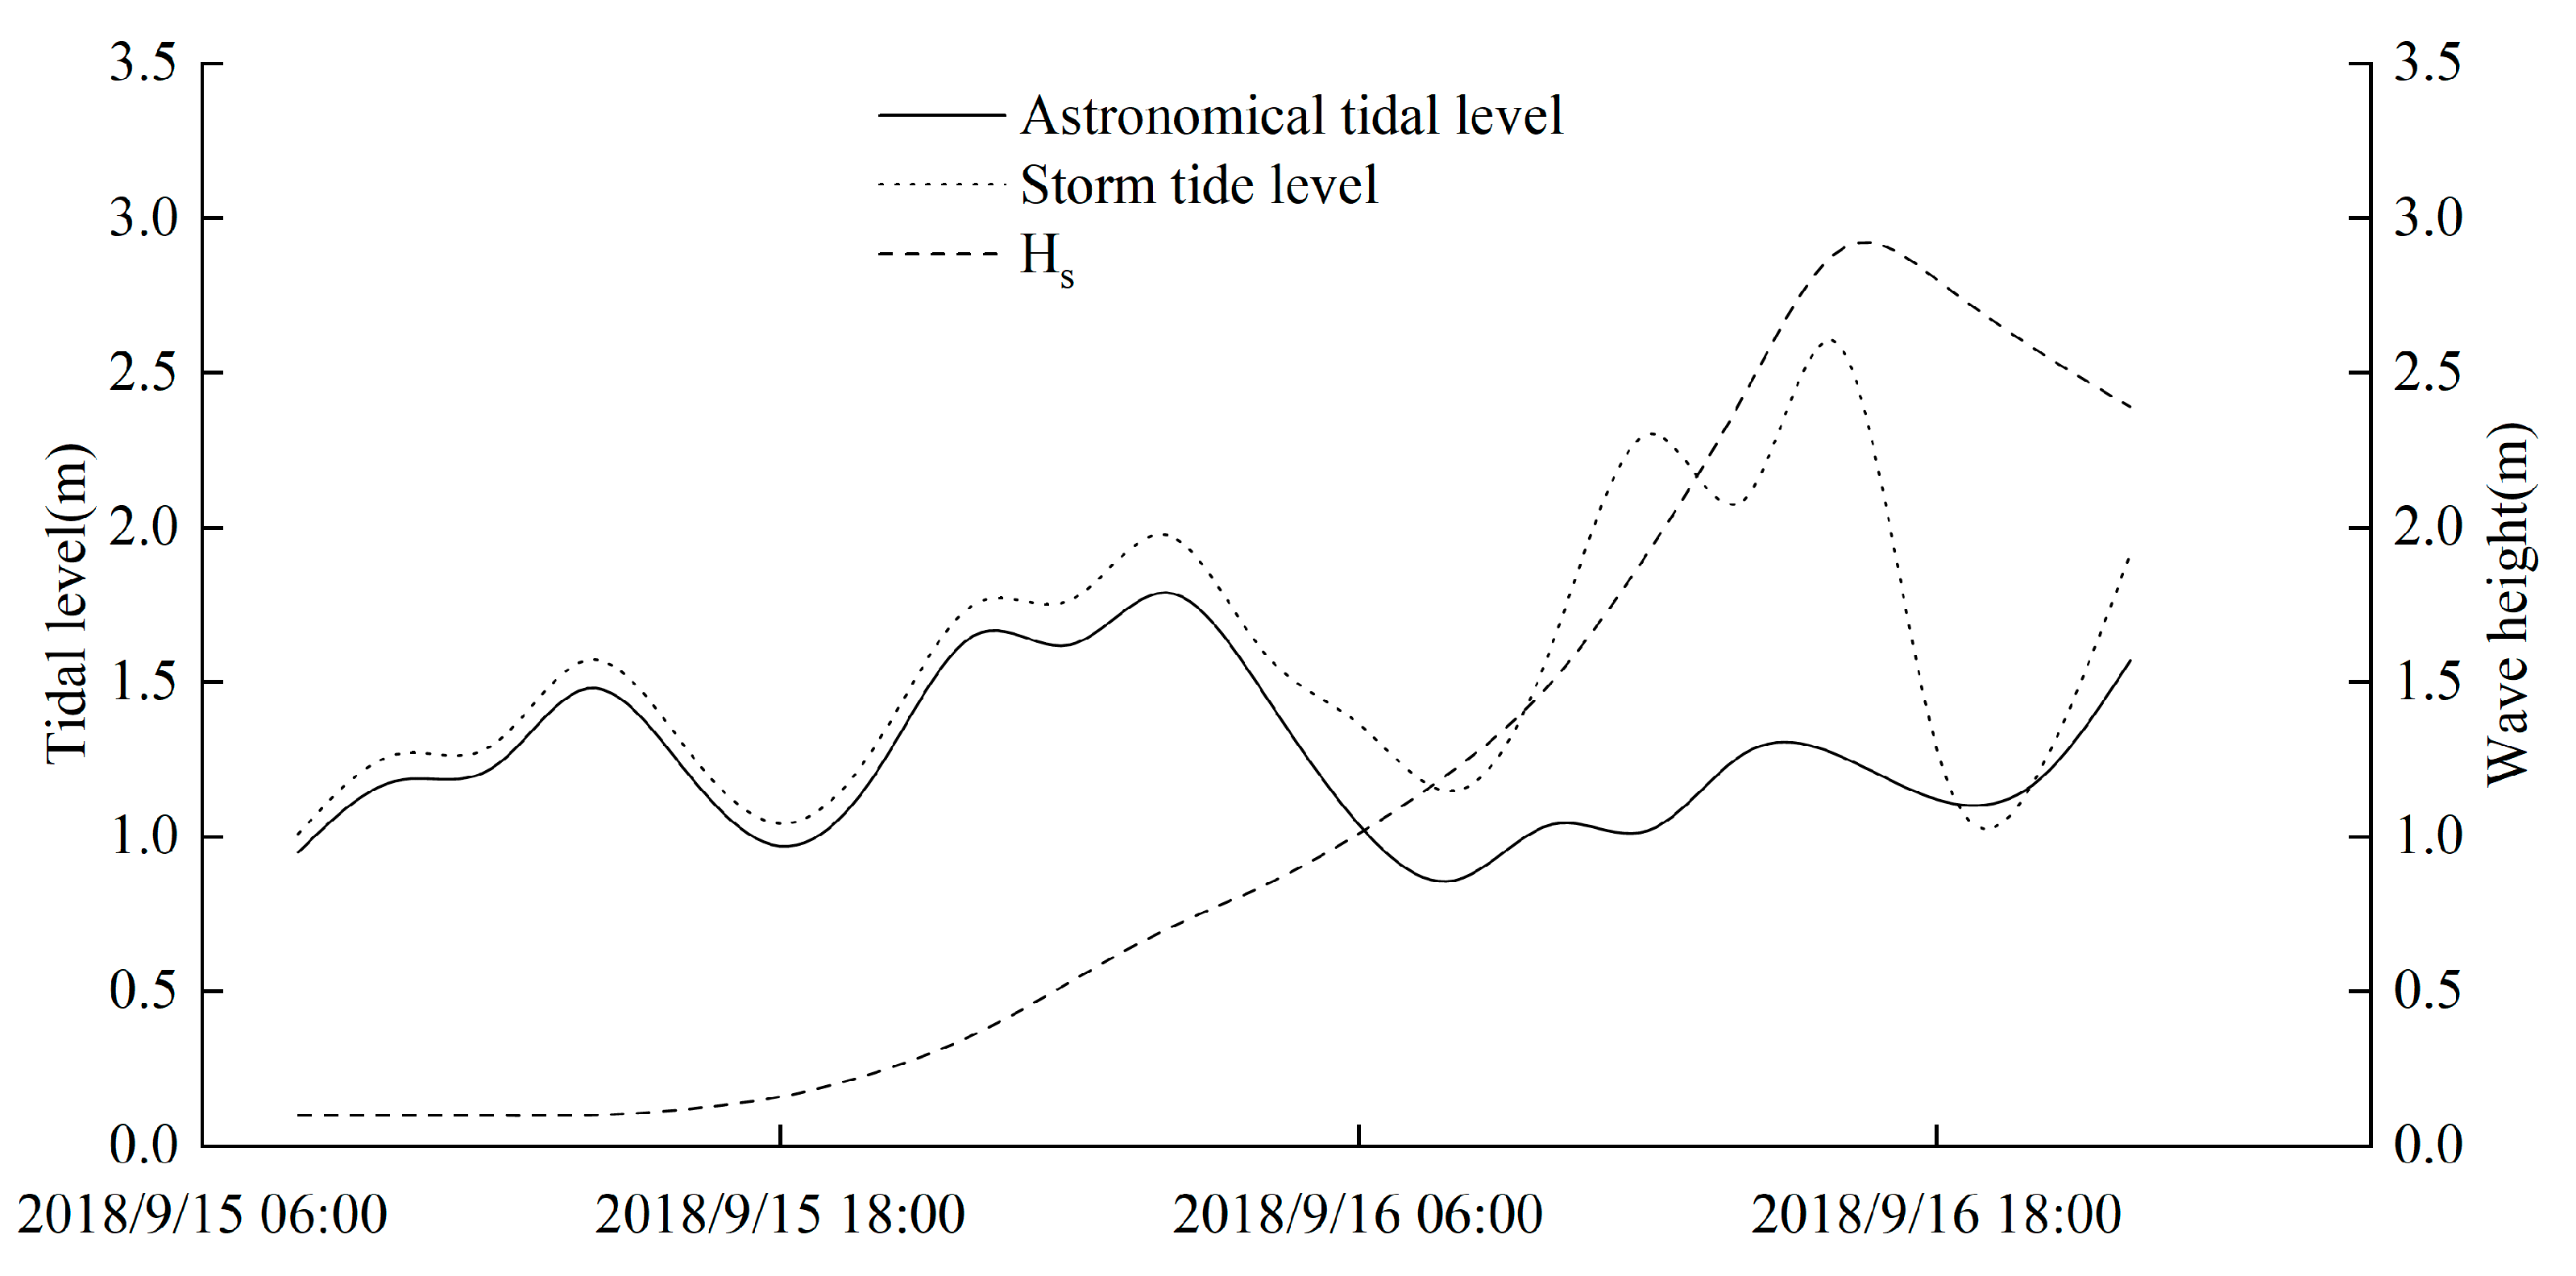
Typhoon Mangkhut made landfall in Guangdong Province from 15 September to 16 2018. A mathematical model was used to invert the changes in tidal level and wave height near Guanhu Beach, as shown in Figure 12.
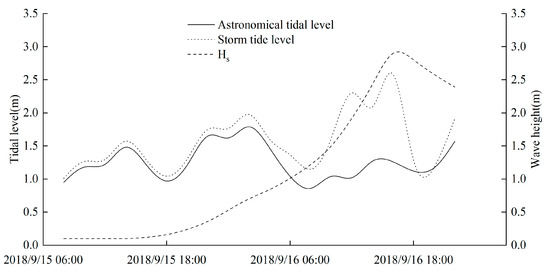
Figure 12.
Storm surge dynamic conditions under Typhoon Mangkhut. Wave data are sourced from Xiasha Station.
By changing the dynamic boundary conditions in the XBeach model, while keeping all other parameter settings unchanged except for the initial shape of the beach profile, the research compared the response of storm surges with different foreshore slope beach profiles. The results are shown in Figure 13.
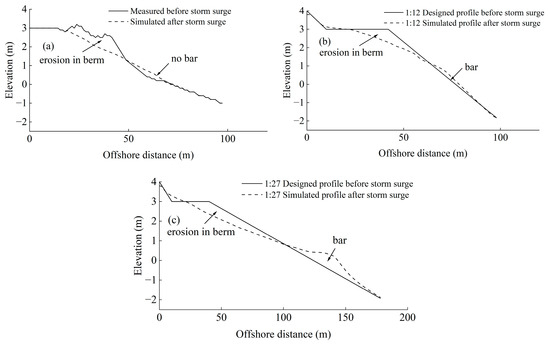
Figure 13.
Various beach profile evolution under storm surge conditions: (a) 1:8 initial foreshore slope; (b) 1:12 initial foreshore slope; (c) 1:27 initial foreshore slope. During storm surge conditions, direct erosion of the berm occurred, with (a) not resulting in the formation of a sandbar. However, as the foreshore slope became gentler, both (b) and (c) produced sandbars, with the size of the sandbar increasing as the foreshore slope decreased.
Examining the beach profile morphology during storm surge conditions, all profiles evidently show direct erosion of beach berm. There is no formation of sandbars in the original 2# profile while smaller sloped schemes such as Scheme 1 and Scheme 2 lead to sandbar formation. However, the sandbar under Scheme 1 is marginally smaller than that under Scheme 2. Detailed characteristics of this comparison are further depicted in the subsequent table (Table 6):
Table 6.
Erosion and sandbar development characteristics of profiles with different foreshore slopes under storm surge conditions.
Under the influence of Typhoon Mangkhut, both profiles experienced direct erosion on the beach berm. Under the influence of storm surges, beach profiles consistently show erosion in the backshore and accretion in the foreshore. This pattern mirrors the changes observed at Tantou Beach in Zhejiang, China, during Typhoon Muifa [40]. Similarly, numerical simulations of the Southern Beach of Chudao during Typhoon Lekima produced comparable results [28]. Profiles with smaller foreshore slopes resulted in sandbar formations, whereas the original topography, attributed to its steeper foreshore slope, did not present any sandbar formations. The lower the preceding foreshore slope, the greater the likelihood of sandbar formation, implying that these formations will be longer and higher, corroborating the findings presented in Section 4.1. The creation of sandbars obstructs and preserves the seaward sediment transport, thereby mitigating the cross-shore sediment transport loss. Concurrently, the foreshore slope becomes gentler, indicating negative feedback on beach erosion. Field investigations have shown that beach profiles with a gentler foreshore slope are more likely to develop offshore sandbars after storm surges [41]. The sandbar plays a crucial role in preventing further erosion of the beach.
Upon examination of the backshore changes, Scheme 1 yielded the smallest losses in both backshore single-width and rate, suggesting that under storm surge conditions, a 1:12 slope might more closely represent an equilibrium slope based on contemporary dynamics. Such a balance results in fewer adjustments in response to storm surge dynamics, thus minimizing backshore loss rate. However, a comprehensive overview of profile changes reveals a decrease in cross-shore sediment transport loss and its rate commensurate with a decrease in foreshore slope. In Scheme 2, the overall profile’s single-width loss rate stands at 0.16%, indicating a greater change in backshore under storm surge conditions compared with Scheme 1. Yet, the net transverse sand transport loss remains minimal, maintaining a negative correlation with the foreshore slope (Figure 14). As the foreshore slope decreases from 1:8 to 1:27, the single-width profile erosion volume reduces from 11.12 m3 to 0.16 m3. Furthermore, the beach profile changes from lacking sandbars to the development of higher and longer offshore sandbars. This transformation significantly enhances the longevity of beach nourishment. In the context of storm surge effects, Scheme 2 stands out as the preferred option for beach berm nourishment. This choice provides enhanced protection and resilience for coastal areas.

Figure 14.
Erosion and loss rate in single width of profiles with different foreshore slopes under storm surge conditions: (a) Only count the backshore erosion. (b) Count the whole profile erosion. The overall net erosion rate of the profile decreases as the foreshore slope becomes gentler. In contrast, the erosion rate of the backshore shows irregular patterns due to the complex effects of storm surges, resulting in chaotic adjustments without a clear trend.
5. Conclusions
This research explicates the mathematical and physical correlation between cross-shore sediment transport and the foreshore slope. By utilizing Bagnold’s method of energy conservation, the derivation of a cross-shore sediment transport equation is accomplished (Equation (19)). When the foreshore angle is between 0 and arccotfw, the net cross-shore sediment transport increases monotonically. As the foreshore angle is greater than arccotfw, it decreases monotonically (Figure 5). When the foreshore angle is less than 10°, the interconnected mechanism between cross-shore sediment transport and the foreshore slope suggests that a diminished initial foreshore slope leads to a reduced rate of cross-shore sediment transport. As the process of cross-shore sediment transport transpires, the foreshore slope continually lessens until equilibrium is achieved, fostering the growth of offshore sandbars. Consequently, this process is efficacious in mitigating the loss of offshore sediments (Figure 6).
Field surveys and analyses conducted on Guanhu Beach clearly depict a substantial erosion of the beach’s profile during the autumn season. Both typical profiles highlight parameter C of the cross-shore sediment transport discrimination exceeding 0.5, confirming cross-shore sediment transport as a primary cause of Guanhu Beach’s autumn erosion. Utilizing XBeach, a full-scale numerical model of the beach has been established, accurately replicating the autumnal evolution of Guanhu Beach in Shenzhen. The model presents the evolution results of the beach profile under the influence of monsoon waves and storm surge conditions, considering various foreshore slopes. The scheme yielding the smallest cross-shore sediment transport rate incorporates a beach berm elevation of 3 m, a beach berm width of 30 m, and a slope of 1:27. Under monsoon wave conditions, this approach results in a seasonal profile loss rate of 0.12%, and a profile loss rate of 0.16% following Typhoon Mangkhut.
Finally, after comparing the evolution results of the beach profiles for each scheme, it is evident that the net cross-shore sediment transport rate is inversely associated with the foreshore slope. Smaller foreshore slopes and more complex dynamic conditions facilitate the formation of sandbars on beach profiles, leading to larger sandbar formations. These findings align with the earlier discussion on the feedback mechanism. Therefore, beach berm nourishment necessitates the choice of a smaller foreshore slope to minimize cross-shore sediment transport loss during the initial stage of nourishment. However, this research focuses on the initial stage of beach berm nourishment. It remains unclear whether the impact of changing foreshore slope can extend to a longer time scale. Further research is needed to explore a more optimized beach berm nourishment scheme. Nevertheless, this study can still provide a reference for beach berm nourishment that requires a rapid increase in beach area and less sediment loss in the initial stage.
Author Contributions
Conceptualization, X.L. (Xinglu Liu) and X.L. (Xiaofeng Luo); methodology, X.L. (Xiaofeng Luo) and C.L.; software, X.L. (Xinglu Liu); validation, X.L. (Xinglu Liu), G.Z. and W.D.; formal analysis, X.L. (Xinglu Liu); investigation, X.L. (Xinglu Liu), C.L. and G.Z; writing—original draft preparation, X.L. (Xinglu Liu); writing—review and editing, X.L. (Xiaofeng Luo) and C.L.; figure, X.L. (Xinglu Liu) and C.L.; supervision, W.D. All authors have read and agreed to the published version of the manuscript.
Funding
This research was funded by the Fund of National Key R&D Program Key Special Projects (2023YFC3208501).
Data Availability Statement
The data presented in this study are available on request from the corresponding author. The data are not publicly available due to the cumbersome amount of data.
Acknowledgments
The authors are very grateful for the help of the anonymous staff at the survey site.
Conflicts of Interest
The authors declare no conflicts of interest. The funders had no role in the design of the study; in the collection, analyses, or interpretation of data; in the writing of the manuscript; or in the decision to publish the results.
Abbreviations
| BBS | Brier Skill Scores |
| B.P. | Barometric Pressure |
| MHW | Mean High Water |
| MLW | Mean Low Water |
| MSL | Mean Sea Level |
| RTK | Real-Time Kinematic |
| 2DH | Two-Dimensional Horizontal |
References
- Mingo, I.M.; Lacaze, L.; Almar, R. A semi-empirical formula of beach slope on flat lower platforms. Coast. Eng. 2024, 190, 104506. [Google Scholar] [CrossRef]
- Pezerat, M.; Bertin, X.; Coulombier, T. Cross-shore suspended sediment transport in a macro-tidal and low-sloping upper shoreface. Earth Surf. Process. Landf. 2023, 48, 853–862. [Google Scholar] [CrossRef]
- Cao, C.; Mao, Z.; Cai, F.; Qi, H.; Liu, J.; Lei, G.; Zhao, S.; Liu, G. Dynamic geomorphology and storm response characteristics of the promontory-straight beach—A case of Gulei Beach, Fujian. Acta Oceanol. Sin. 2023, 42, 64–78. [Google Scholar] [CrossRef]
- Yun, L.S.; Saengsupavanich, C.; Ariffin, E.H.; Rashidi, A.H.M. The morphodynamics of wave on a monsoon-dominated coasts: West coast of GoT. Reg. Stud. Mar. Sci. 2023, 57, 102729. [Google Scholar] [CrossRef]
- Dean, R.G. Heuristic models of sand transport in the surf zone. In Proceedings of the First Australian Conference on Coastal Engineering, 1973: Engineering Dynamics of the Coastal Zone, Sydney, Australia, 14–17 May 1973; pp. 215–221. [Google Scholar]
- Hattori, M.; Kawamata, R. Onshore-offshore transport and beach profile change. In Coastal Engineering 1980; American Society of Civil Engineers: Sydney, Australia, 1980; pp. 1175–1193. [Google Scholar]
- Sunamura, T.; Horikawa, K. Two dimensional beach transformation due to waves. In Coastal Engineering 1974; American Society of Civil Engineers: Copenhagen, Denmark, 1974; pp. 920–938. [Google Scholar]
- Demirci, M.; Aköz, M.S. An investigation on the formation of submerged bar under surges in sandy coastal region. China Ocean Eng. 2012, 26, 535–546. [Google Scholar] [CrossRef]
- Liang, B.; Zhu, M.; Qu, Z.; Wang, C.; Li, D. Comparative analysis on numerical simulation of the impacts of different beach nourishment schemes on beach profile. Acta Oceanol. Sin. 2021, 43, 136–145. (In Chinese) [Google Scholar]
- Zheng, J.; Dean, R.G. Numerical models and intercomparisons of beach profile evolution. Coast. Eng. 1997, 30, 169–201. [Google Scholar] [CrossRef]
- Karasu, S.; Work, P.A.; Uzlu, E.; Kankal, M.; Yüksek, Ö. Beach nourishment alternative assessment to constrain cross-shore and longshore sediment transport. Appl. Ocean Res. 2016, 59, 459–471. [Google Scholar] [CrossRef]
- Somphong, C.; Udo, K.; Ritphring, S.; Shirakawa, H. Beach nourishment as an adaptation to future sandy beach loss owing to sea-level rise in Thailand. J. Mar. Sci. Eng. 2020, 8, 659. [Google Scholar] [CrossRef]
- Van Rijn, L. Coastal erosion and control. Ocean Coast. Manag. 2011, 54, 867–887. [Google Scholar] [CrossRef]
- De Schipper, M.; De Vries, S.; Mil-Homens, J.; Reniers, A.; RANASINGHE, R.; Stive, M. Initial volume losses at nourished beaches and the effect of surfzone slope. In The Proceedings of the Coastal Sediments 2015; World Scientific: Singapore, 2015. [Google Scholar]
- Board, M. Beach Nourishment and Protection; The National Academies Press: Washington, DC, USA, 1995; pp. 334–340. [Google Scholar]
- De Schipper, M.A.; de Vries, S.; Ruessink, G.; de Zeeuw, R.C.; Rutten, J.; van Gelder-Maas, C.; Stive, M.J. Initial spreading of a mega feeder nourishment: Observations of the Sand Engine pilot project. Coast. Eng. 2016, 111, 23–38. [Google Scholar] [CrossRef]
- Saengsupavanich, C.; Pranzini, E.; Ariffin, E.H.; Yun, L.S. Jeopardizing the environment with beach nourishment. Sci. Total Environ. 2023, 868, 161485. [Google Scholar] [CrossRef] [PubMed]
- Thuy, M.T.; Nagasawa, T.; Tanaka, H.; Viet, N.T. Sandy beach restoration using beach nourishment method: A case study of Nha Trang Beach, Vietnam. J. Coast. Res. 2018, 81, 57–66. [Google Scholar] [CrossRef]
- Dong, L. The Numerical and Experimental Application Research of Equilibrium Profile Design in Beach Nourishment. Master’s Thesis, Dalian University of Technology, Dalian, China, 2012. [Google Scholar]
- Gong, Y. Research on Restoration of Muddy Sand Beach. Master’s Thesis, Zhejiang University, Hangzhou, China, 2019. [Google Scholar]
- Tan, X. The Research of Conservation Design Method of Sandy Beaches Profile. Master’s Thesis, Dalian University of Technology, Dalian, China, 2016. [Google Scholar]
- Longuet-Higgins, M.S. On the statistical distribution of the heights of sea waves. J. Mar. Res. 1952, 11, 245–266. [Google Scholar]
- Xu, X. Types of two-dimension sandy beaches and their criterion. Ocean Eng. 1988, 06, 51–62. (In Chinese) [Google Scholar]
- Bagnold, R. Mechanics of marine sedimentation. Sea 1963, 3, 507–528. [Google Scholar]
- Bagnold, R. Beach and Nearshore Processes: The Mechanics of Marine Sedimentation and Littoral Processes. In The Physics of Sediment Transport by Wind and Water; ASCE: New York, NY, USA, 1963; pp. 188–230. [Google Scholar]
- Nahon, A.; Fortunato, A.B.; Oliveira, F.S.; Azevedo, A.; Henriques, M.J.; Silva, P.A.; Baptista, P.; Freire, P. 2DH modelling and mapping of surfbeat-driven flooding in the shadow of a jettied tidal inlet. Coast. Eng. 2023, 184, 104342. [Google Scholar] [CrossRef]
- Hwang, B.; Do, K.; Chang, S. Morphological Changes in Storm Hinnamnor and the Numerical Modeling of Overwash. J. Mar. Sci. Eng. 2024, 12, 196. [Google Scholar] [CrossRef]
- Xing, H.; Li, P.; Zhang, L.; Xue, H.; Shi, H.; You, Z. Numerical Simulation of the Beach Response Mechanism under Typhoon Lekima: A Case Study of the Southern Beach of Chudao. J. Mar. Sci. Eng. 2023, 11, 1156. [Google Scholar] [CrossRef]
- Kaehler, C.; Cantré, S.; Schweiger, C.; Saathoff, F. Dune Erosion at the German baltic coast—Investigation and analysis of a large-scale field experiment compared to life dunes. J. Mar. Sci. Eng. 2022, 10, 1605. [Google Scholar] [CrossRef]
- Zhou, Z. Coastal Hydrodynamics, 4th ed.; People’s Communications Press: Beijing, China, 2009; pp. 134–139. [Google Scholar]
- Li, Y.; Zhang, C.; Cai, Y.; Xie, M.; Qi, H.; Wang, Y. Wave dissipation and sediment transport patterns during shoreface nourishment towards equilibrium. J. Mar. Sci. Eng. 2021, 9, 535. [Google Scholar] [CrossRef]
- Ariffin, E.H.; Sedrati, M.; Akhir, M.F.; Yaacob, R.; Husain, M.L. Open sandy beach morphology and morphodynamic as response to seasonal monsoon in Kuala Terengganu, Malaysia. J. Coast. Res. 2016, 75, 1032–1036. [Google Scholar] [CrossRef]
- Gunasinghe, G.; Ruhunage, L.; Ratnayake, N.; Ratnayake, A.; Samaradivakara, G.; Jayaratne, R. Influence of manmade effects on geomorphology, bathymetry and coastal dynamics in a monsoon-affected river outlet in Southwest coast of Sri Lanka. Environ. Earth Sci. 2021, 80, 238. [Google Scholar] [CrossRef]
- Sutherland, J.; Peet, A.; Soulsby, R. Evaluating the performance of morphological models. Coast. Eng. 2004, 51, 917–939. [Google Scholar] [CrossRef]
- van Rijn, L.C.; Walstra, D.J.; Grasmeijer, B.; Sutherland, J.; Pan, S.; Sierra, J. The predictability of cross-shore bed evolution of sandy beaches at the time scale of storms and seasons using process-based profile models. Coast. Eng. 2003, 47, 295–327. [Google Scholar] [CrossRef]
- Williams, J.J.; de Alegría-Arzaburu, A.R.; McCall, R.T.; Van Dongeren, A. Modelling gravel barrier profile response to combined waves and tides using XBeach: Laboratory and field results. Coast. Eng. 2012, 63, 62–80. [Google Scholar] [CrossRef]
- Narashid, R.H.; Zakaria, M.A.; Mohd, F.A.; Pa’suya, M.F.; Talib, N.; Ariffin, E.H. Effect of erosion and accretion on beach profile in Kuala Terengganu coastal areas. In Proceedings of the IOP Conference Series: Earth and Environmental Science; IOP Publishing: Perlis, Malaysia, 2021; p. 012008. [Google Scholar]
- Yaacob, R.; Shaari, H.; Sapon, N.; Ahmad, M.F.; Arifin, E.H.; Zakariya, R.; Hussain, M.L. Annual changes of beach profile and nearshore sediment distribution off Dungun-Kemaman, Terengganu, Malaysia. J. Teknol. 2018, 80, 58–62. [Google Scholar] [CrossRef]
- Wang, J.; You, Z.; Liang, B. Laboratory simulation on sandy beach stability under storm wave. Oceanol. Limnol. Sin. 2022, 53, 933–950. (In Chinese) [Google Scholar]
- Lei, Q.; Wang, X.; Liu, Y.; Guo, J.; Cai, T.; Xia, X. Monitoring Change and Recovery of an Embayed Beach in Response to Typhoon Storms Using UAV LiDAR. Drones 2024, 8, 172. [Google Scholar] [CrossRef]
- Wen, M.; Zhang, H.; Wang, S.; Shang, Z.; Zhang, S.; Yang, P.; Wang, H. Field Investigation on the Coastal Erosion and Progradation Evolution of the Binzhou Shelly Chenier in China: Comparisons between Normal and Typhoon Hydrodynamics. J. Mar. Sci. Eng. 2022, 10, 752. [Google Scholar] [CrossRef]


Disclaimer/Publisher’s Note: The statements, opinions and data contained in all publications are solely those of the individual author(s) and contributor(s) and not of MDPI and/or the editor(s). MDPI and/or the editor(s) disclaim responsibility for any injury to people or property resulting from any ideas, methods, instructions or products referred to in the content. |
© 2024 by the authors. Licensee MDPI, Basel, Switzerland. This article is an open access article distributed under the terms and conditions of the Creative Commons Attribution (CC BY) license (https://creativecommons.org/licenses/by/4.0/).