Article

Effect of Stocking Density on Growth Performance of Juvenile Gibel Carp (Carassius gibelio) and Economic Profit of Land-Based Recirculating Aquaculture System

1
Hongshan Laboratory, College of Fisheries, Huazhong Agricultural University, Wuhan 430070, China
2
Engineering Research Center of Green Development for Conventional Aquatic Biological Industry in the Yangtze River Economic Belt, Ministry of Education, Wuhan 430070, China
3
Hubei Provincial Engineering Laboratory for Pond Aquaculture, Wuhan 430070, China
4
College of Life Sciences and Technology, Tarim University, Alar 843300, China
5
Hubei Wuchang Experimental High School, Wuhan 430061, China
*
Author to whom correspondence should be addressed.
These authors contributed equally to this work.
Water 2024, 16(17), 2367; https://doi.org/10.3390/w16172367
Submission received: 30 July 2024 / Revised: 15 August 2024 / Accepted: 17 August 2024 / Published: 23 August 2024

Abstract

:
The land-based recirculating aquaculture system (RAS) has been widely applied to fish farming as a new eco-friendly culture model. This system consists of circular culture tanks on land integrated with water treatment and recycling systems. This study investigated the growth performance of juvenile gibel carp (Carassius gibelio) cultured at high stocking density (HSD, 0.3 kg/m3) and low stocking density (LSD, 0.15 kg/m3) conditions in RAS, and evaluated the comprehensive economic profit of RAS. The body weight, body length, weight gain rate, and condition factor of gibel carp in the LSD group were significantly higher than those in the HSD group (p < 0.05). The feed conversion ratio increased significantly in the HSD group (p < 0.05). A histological analysis revealed a significantly higher density of white muscle fibers in the LSD group (p < 0.05). Relative mRNA expression levels showed that ubiquitin–proteasome system (UPS)-related genes, ub, psma2, and mafbx, were significantly expressed in the HSD group, while the s6k1 expression was elevated in the LSD group (p < 0.05). The mRNA expression levels of keap1 and hsp70 in the dorsal muscle were significantly higher in the HSD group (p < 0.05). Throughout the rearing period, the water temperature remained consistent between the two density groups. The pH value gradually decreased and the dissolved oxygen levels in the HSD group were generally lower than in the LSD group. The nitrite nitrogen (NO2-N) content was higher in the HSD group. Compared to the LSD group, the return on investment was significantly lower in the HSD group. In conclusion, the water quality and growth rates of juvenile gibel carp were better in the LSD group. An appropriate stocking density improved the growth performance and aquaculture economic efficiency.

1. Introduction

Fish are an essential source of protein for millions of people worldwide and their cultivation in aquaculture systems helps to alleviate pressure on overfished natural stock [1,2]. The rapid growth of the global aquaculture industry is primarily driven by the increasing demand for sustainable and efficient seafood production systems. Aquaculture plays a crucial role in providing high-quality protein and supporting global food security. According to a report by the Food and Agriculture Organization [1], global aquaculture production has surpassed capture fisheries, becoming the main source of seafood supply [1]. With the continuous growth of the global population and the depletion of natural fisheries resources, the importance of aquaculture is further highlighted [3]. Among various cultured species, the gibel carp has become an important candidate due to its robust characteristics, high market value, and adaptability to a wide range of farming conditions. This species not only performs well in traditional farming systems in China, but also shows great potential in modern aquaculture systems. However, optimizing farming conditions to improve the growth performance and economic returns while maintaining environmental sustainability remains a key challenge [4,5,6].
One crucial factor influencing the success of aquaculture is the stocking density, which directly affects fish welfare, the growth rate, and the overall efficiency of the production system [7,8,9,10]. The stocking density refers to the number of fish per unit volume or area of water. Although high-density farming can increase the yield per unit area, it may also bring about a series of negative effects. Under high-density conditions, fish may face an insufficient oxygen supply, accumulation of metabolic waste, and inadequate resources and space [11,12,13]. These stress factors may lead to slower growth rates, reduced feed conversion efficiency, and even increased disease risk [14,15]. Conversely, under low-density conditions, although fish experience lower stress levels, the efficiency of the farming system is not fully utilized, leading to higher production costs and lower economic returns. Therefore, determining the optimal stocking density is crucial to achieving a balance between the growth performance and economic benefits [16,17].
Recirculating aquaculture systems (RASs) as an advanced intensive farming technology have gained wide attention due to the controlled environment they provide, reduced emissions, and enhanced biosecurity. The advantages of RASs lie in their ability to increase production efficiency while minimizing environmental impact [18,19]. This system continuously circulates and treats the aquaculture water, reducing dependence on natural water bodies, lowering wastewater discharge, and improving water resource utilization efficiency [18]. The land-based circular-tank recirculating aquaculture model has emerged as a new form of aquaculture in recent years. However, research on the stocking density and economic benefits remains limited. This study aims to explore the optimal stocking density for juvenile gibel carp (Carassius gibelio) in a land-based recirculating aquaculture system by comprehensively evaluating the growth parameters, gene expression, and economic outcomes.

2. Materials and Methods

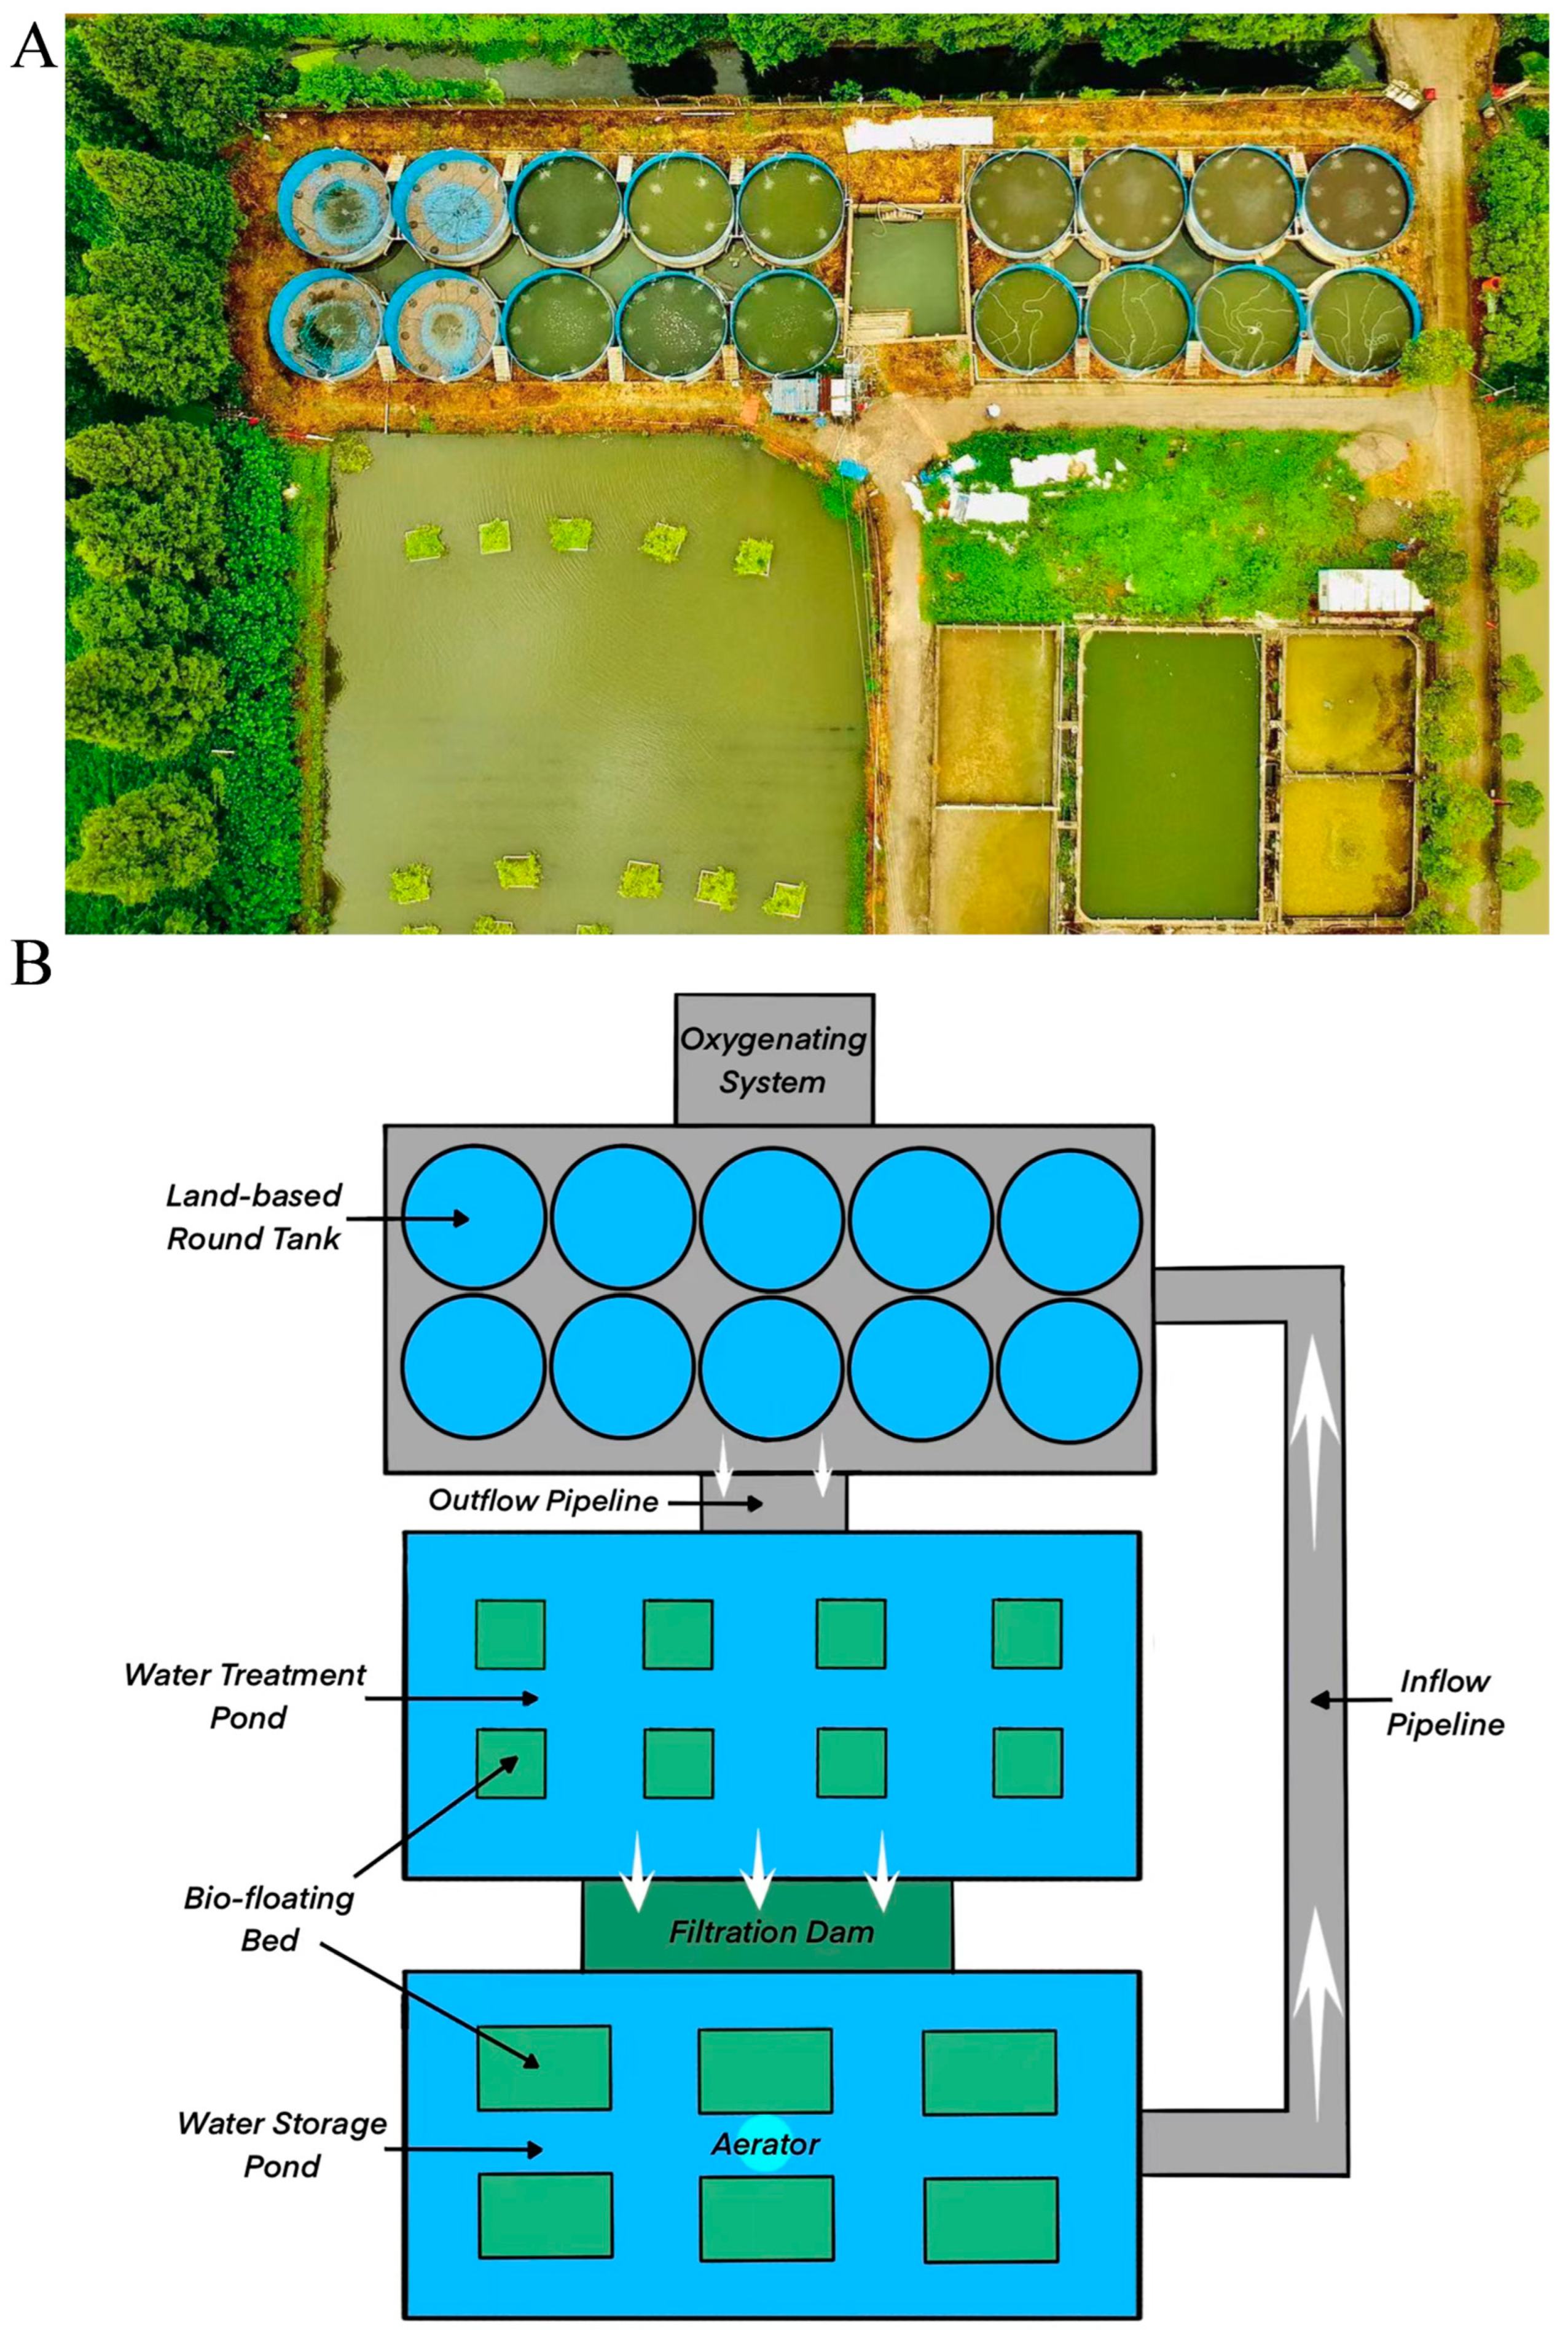
2.1. Aquaculture System

The experiment was conducted at the Wuqi Dongfang Aquaculture Co., Ltd. in Wuhan, China, utilizing a land-based recirculating aquaculture system (Figure 1). The system consisted of an aquaculture pond with a diameter of 8 m and a height of 2 m, featuring a conical bottom in an inverted configuration. The comprehensive RAS comprised not only the aquaculture pond, but also a tailwater treatment system and was supported by integrated oxygen and water supply systems, all enclosed within a fully operational circulating framework.

2.2. Experimental Design and Feeding Management

Healthy, size-matched juvenile gibel carp (1.15 ± 0.06 g) were randomly selected for the experiment. The fish were divided into two density groups: a high-density group (11,110 fish, 0.3 kg/m3) and a low-density group (6666 fish, 0.15 kg/m3), with three replicates per group. The rearing period lasted 160 days, during which growth data and water samples were collected every two weeks. During the first 1–2 days post-stocking, the fish were trained to feed, with careful observation of their feeding behavior. They were fed an extruded compound feed containing approximately 30% crude protein (Tianmen Tongwei Biotechnology Co., Ltd., Wuhan, China). Feed was administered at 3% of body weight, three times daily (07:00, 11:00, and 16:00 CST). The feeding schedule was adjusted based on weather conditions and fish consumption. Vitamin C and natural plant polysaccharides were supplemented to enhance the fish’s immune system. During feeding, fish were monitored for consumption, body shape, and coloration. Regular growth measurements were taken to adjust the feed quantity accordingly. The ponds were regularly patrolled to remove any diseased or dead fish promptly to prevent infections. Diseased fish were dissected and examined microscopically for timely treatment. Comprehensive rearing records were maintained throughout the experiment. Water levels were maintained at approximately 1 m during the initial stage, gradually increasing to 2 m in the later stages. Daily measurements of water temperature and dissolved oxygen were conducted. Probiotics such as Bacillus spp. were used periodically to regulate water quality, ensuring the recycling of rearing water. Water samples were collected regularly for relevant water quality parameters. Equipment, including blowers and submersible pumps, was routinely inspected and maintained to ensure proper function and prevent adverse impacts on the rearing process.

2.3. Sample Collection

At the end of the experimental period, 30 fish were randomly selected from each tank on land and sedated with MS-222 at a concentration of 100 mg/L. Measurements were taken for body weight, standard length, and total length. Samples of dorsal white muscle were promptly frozen in liquid nitrogen and kept at −80 °C for later gene expression analysis. Additionally, muscle tissue samples measuring 0.5 cm × 0.5 cm × 0.5 cm were fixed in a muscle-specific fixative (Borf Bio, B0007-100, Wuhan, China) at ambient temperature for the preparation and examination of histological sections.

2.4. Measurement Indicators and Methods

2.4.1. Growth Performance

During the culture experiment, sampling was conducted every 30 days using a seine net to sample each land-based tank. At least 30 fish were randomly selected from each tank for measuring body weight and total length. The experimental fish were promptly and carefully measured before being returned to the tank for ongoing culture. At the conclusion of the culture period, relevant growth indices were calculated.
W e i g h t   g a i n   r a t e   ( W G R ) = ( f i n a l   w e i g h t i n i t i a l   w e i g h t ) / i n i t i a l   w e i g h t × 100
S p e c i f i c   g r o w t h   r a t e   ( S G R ) = ( l n ( f i n a l   w e i g h t ) l n ( i n i t i a l   w e i g h t ) ) / t i m e × 100
F e e d   c o n v e r s i o n   r a t i o   ( F C R ) = f e e d   i n t a k e / ( f i n a l   w e i g h t i n i t i a l   w e i g h t )
S u r v i v a l   r a t e   ( S ) = ( i n i t i a l   n u m b e r f i n a l   n u m b e r ) / i n i t i a l   n u m b e r × 100
H e p a t o s o m a t i c   i n d e x   ( H S I ) = l i v e r   w e i g h t / b o d y   w e i g h t × 100
V i s c e r o s o m a t i c   i n d e x   ( V S I ) = v i s c e r a   w e i g h t / b o d y   w e i g h t × 100
C o n d i t i o n   f a c t o r   ( C F ) = b o d y   w e i g h t / ( l e n g t h 3 ) × 100

2.4.2. Water Quality Parameters

Water quality levels were evaluated every 15 days by sampling water from three distinct locations within each tank on land, at a depth of 50 cm, utilizing a 1 L water collection device. These samples were combined equally for the assessment of various water quality parameters. In situ measurements of temperature, dissolved oxygen, and pH were conducted using a YSI portable water quality analyzer (USA). Details of the methodologies for other parameters comprised determining total ammonium nitrogen (TAN) (mg/L) through the Nessler reagent colorimetric technique (GB7479-87), analyzing nitrate nitrogen (NO3-N) (mg/L) via the ultraviolet spectrophotometric approach (GB7493-87), evaluating nitrite nitrogen (NO2-N) (mg/L) using the spectrophotometric method with hydrochloric acid naphthyl ethylenediamine (GB7493-87), determining total nitrogen (TN, mg/L) by the alkaline persulfate digestion ultraviolet spectro-photometric method (GB11894-1989), and assessing total phosphorus (TP, mg/L) via the alkaline persulfate digestion ammonium molybdate spectrophotometric method (GB11893-1989).

2.4.3. Total RNA Extraction and Reverse Transcription

In this experiment, the consumables used were soaked overnight in 0.1% DEPC (diethyl pyrocarbonate) water, rinsed with double-distilled water, and sterilized at high temperature and pressure. Tissue samples were taken from frozen storage tubes for RNA extraction, following the steps outlined in the Trizol Reagent manual. The entire extraction process was conducted on ice, as follows: Samples were removed from a −80 °C freezer, and appropriate amounts were quickly placed into 2 mL EP tubes with 1 mL Trizol and two glass beads. The EP tubes were then placed in a pre-cooled shaking box, and tissue grinding was performed at 30 r/min for about 5 min. After grinding, 200 μL of chloroform was added to the EP tubes, and the mixture was thoroughly vortexed until the solution emulsified and turned milky white. The mixture was allowed to stand at room temperature for 5 min, then centrifuged at 12,000 r/min at 4 °C for 15 min. This resulted in three distinct layers: a colorless supernatant containing RNA, a white interphase containing mostly DNA, and a colored organic phase at the bottom. The supernatant was transferred to a new 1.5 mL centrifuge tube, and an equal volume of isopropanol was added. The mixture was gently inverted to mix thoroughly. The mixture was allowed to stand for 10 min, then centrifuged at 12,000 r/min at 4 °C for 10 min. The supernatant was discarded, and the RNA pellet was retained. The pellet was washed by adding 1 mL of pre-cooled 75% ethanol, gently inverting the tube, and centrifuging at 12,000 r/min at 4 °C for 5 min. This washing step was repeated twice. The centrifuge tube was opened and placed in a fume hood to air dry, allowing the ethanol to evaporate completely. Once the pellet was dry and translucent, it was dissolved in an appropriate amount of RNase-free water. Total RNA samples were checked by loading 2 μL of RNA and 1 μL of loading buffer onto a 1.1% (w/v) agarose gel, running electrophoresis at 160 V for 12 min, and imaging the gel. RNA concentration was determined using a Nano Drop 8000 Spectrophotometer (Nano Drop, Boston, MA, USA). For reverse transcription, 1 μg of total RNA was used as a template with the Hifair® III 1st Strand cDNA Synthesis Super Mix for qPCR (gDNA digester plus) kit (YEASEN, batch number H0901221) for cDNA synthesis.

2.4.4. Real-Time Quantitative PCR (qPCR)

Tianyi Huiyuan Biotechnology Co., Ltd. (Wuhan, China) synthesized the primers for the experiment, as outlined in Table 1. The quantitative fluorescence reaction was carried out using the HieffTM qPCR SYBR® Green Master Mix (Low Rox Plus) (Shanghai, China) kit from YEASEN (batch number H6004040) on a Quant Studio 6 Flex Real-Time PCR Detection System from Applied Biosystems, Foster City, California, USA. The reaction mixture comprised of 10 μL of HieffTM qPCR SYBR® Green Master Mix (Low Rox Plus) (Shanghai, China), 0.4 μL each of the forward and reverse primers, 7.2 μL of double-distilled water, and 2 μL of cDNA template. The protocol included an initial denaturation step at 95 °C for 5 min, followed by 40 cycles of denaturation at 95 °C for 10 s, annealing at specific temperatures for 20 s (58 °C for hsp70, hsp90, nrf2, keap1, ub, psma2, psmc1, murf1, mtor, s6k1, and β-actin; 55 °C for mafbx), and extension at 72 °C for 20 s. Each sample was analyzed in triplicate, and the relative expression levels were determined using the 2−ΔΔCt method.

2.4.5. Microscopic Examination of Dorsal White Muscle Sections

Tissue sections were created employing paraffin embedding and hematoxylin–eosin (H&E) staining methods. The histological features were examined with a Nikon Eclipse 80i microscope, and the sections were photographed using a camera attached to the microscope. For each tissue section, the number and area of muscle fibers were quantified in three distinct fields of view at various locations. The muscle fiber density (fibers/mm2) and diameter (μm) were determined. The density of muscle fibers was calculated as the number of fibers per mm2, and the fiber diameter was computed using the formula:
d = 2 a r e a / π
Image-pro plus software 6.0 was used for image processing and analysis.

2.5. Statistical Methods

The results are presented as mean ± SE. Statistical comparisons were made using independent samples t-test in SPSS 21.0 software. The significant difference was defined as p < 0.05. Graphical representations were produced using Origin 2021 software.

3. Results

3.1. Growth Indicators

After 160 days of cultivation, significant growth differences were observed between the two groups of juvenile gibel carp. In the high-density group, the fish showed an increase in weight by 13.5 times, whereas the low-density group exhibited a more substantial growth, increasing by 25.8 times. This variation in growth rates was further reflected in significant differences in the final weight (FW), final length (FL), WGR, SGR, FCR, and CF between the two groups (p < 0.05) (Table 2). However, no significant differences were noted in SR, VSI, and HSI between the groups.

3.2. Water Quality Indicators

During the cultivation period, the water temperature initially increased and then decreased, peaking at 31.7 °C in August. The water pH gradually decreased but remained mildly alkaline throughout the cultivation period. The dissolved oxygen levels were consistently higher in the low-density group, with a significant difference at 50 days (p < 0.05). Additionally, concentrations of TP, NO3-N, and NO2-N gradually increased. There were no significant differences in the NO3-N and TN levels between the two groups. However, the TAN concentration was consistently higher in the high-density group, with significant differences at 50 and 69 days (p < 0.05). The NO2-N levels fluctuated considerably, with significant differences between the two groups at 30, 50, 69, and 114 days (p < 0.05). The TP concentration showed a statistically significant difference between the groups only at 30 days (p < 0.05), with no significant differences at other times (Figure 2).

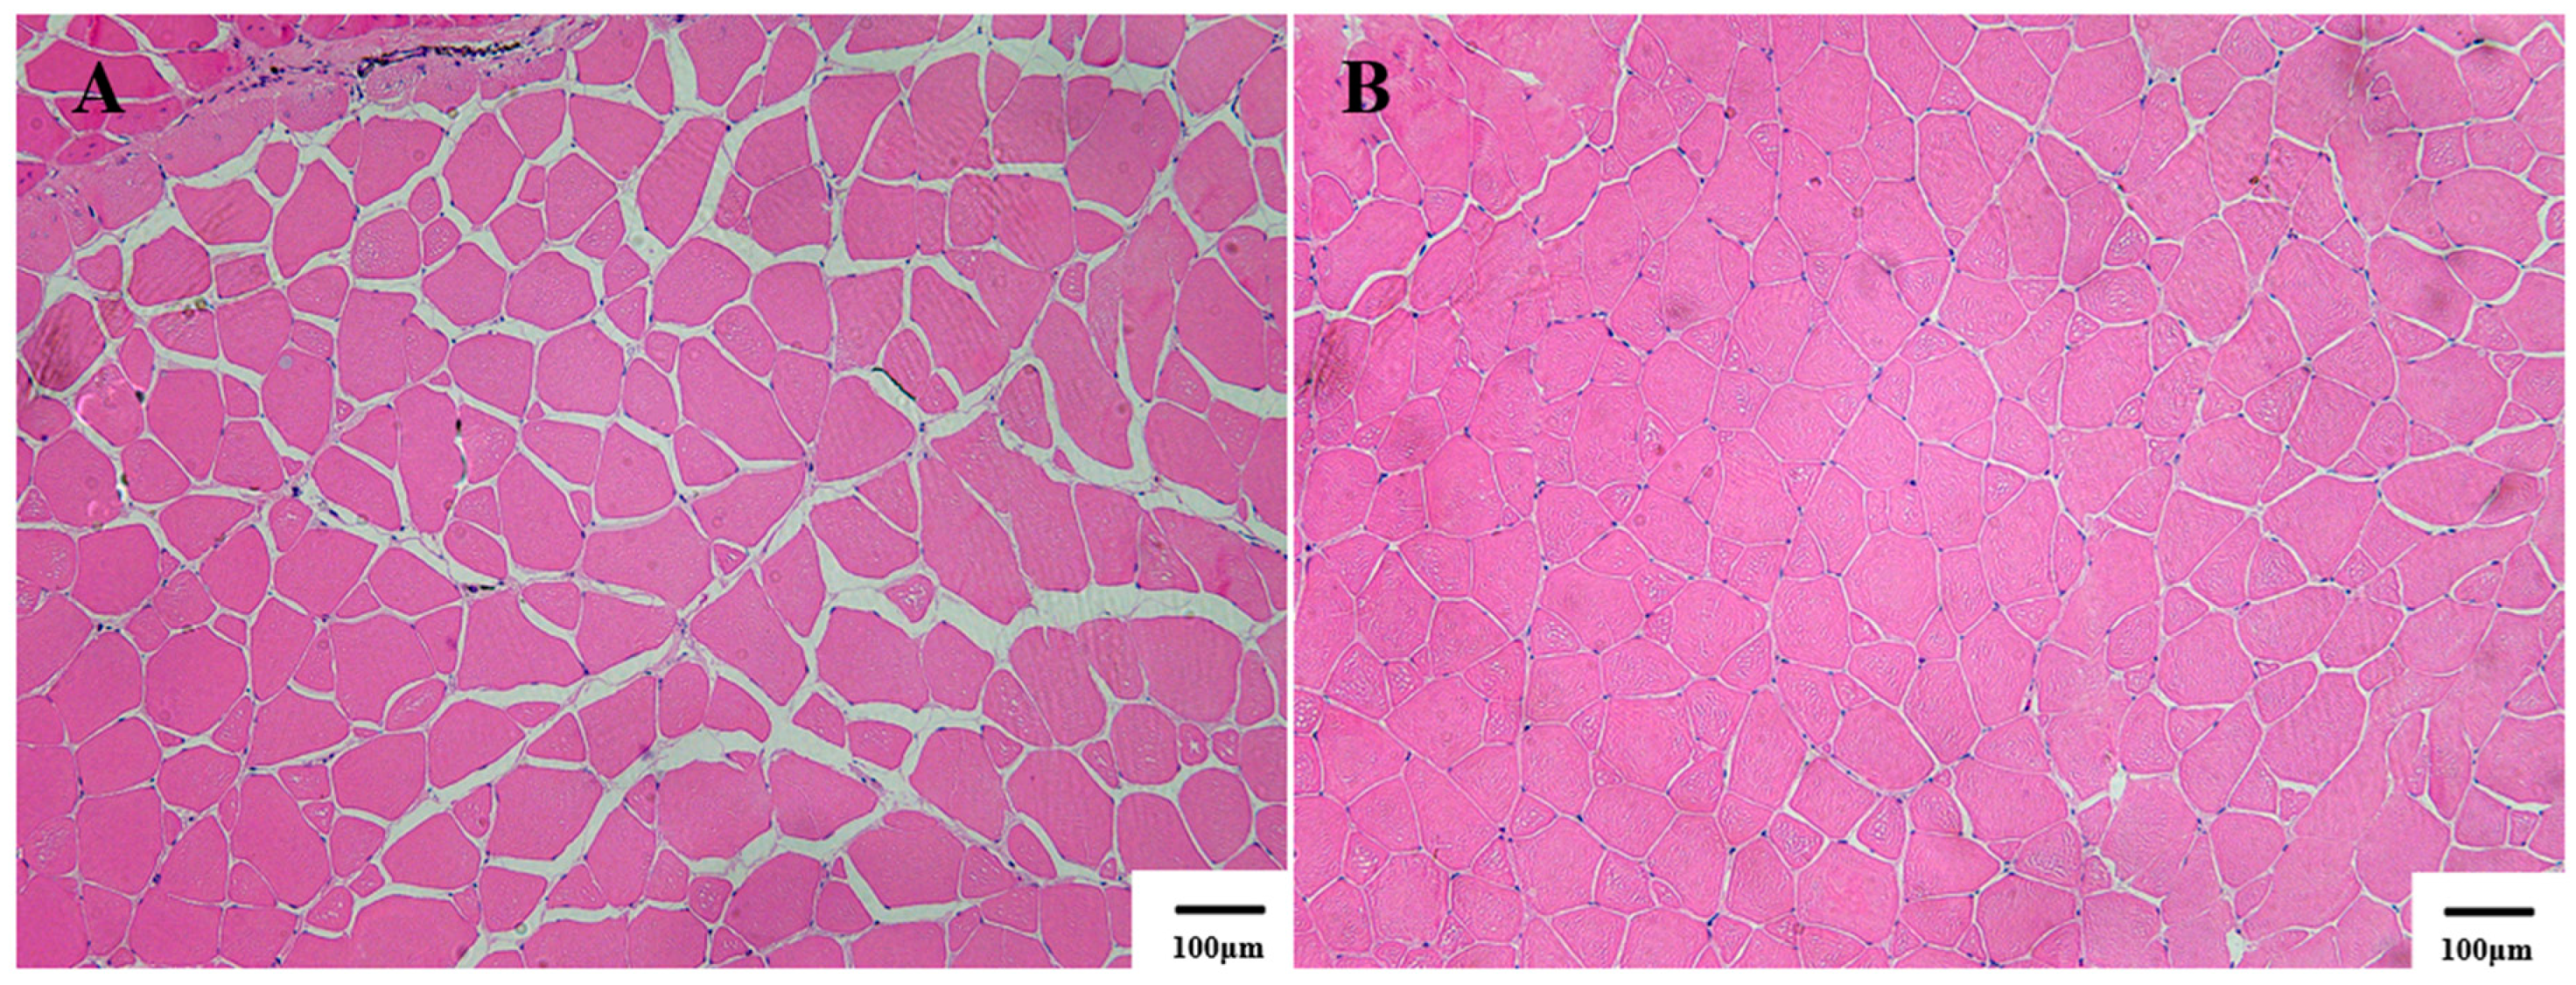
3.3. Muscle Tissue Histological Observations

Analysis of white muscle tissue histology (Figure 3) revealed that the muscle fiber diameter in the high stocking density (HSD) group measured 95.14 ± 7.75 μm, whereas in the low stocking density (LSD) group, it was 94.86 ± 7.13 μm. These results suggest that the stocking density did not significantly impact the muscle fiber size in gibel carp. Nonetheless, there was a notable disparity in the white muscle fiber density between the two groups, with the LSD group displaying a significantly higher density than the HSD group (p < 0.05) (Figure 4).

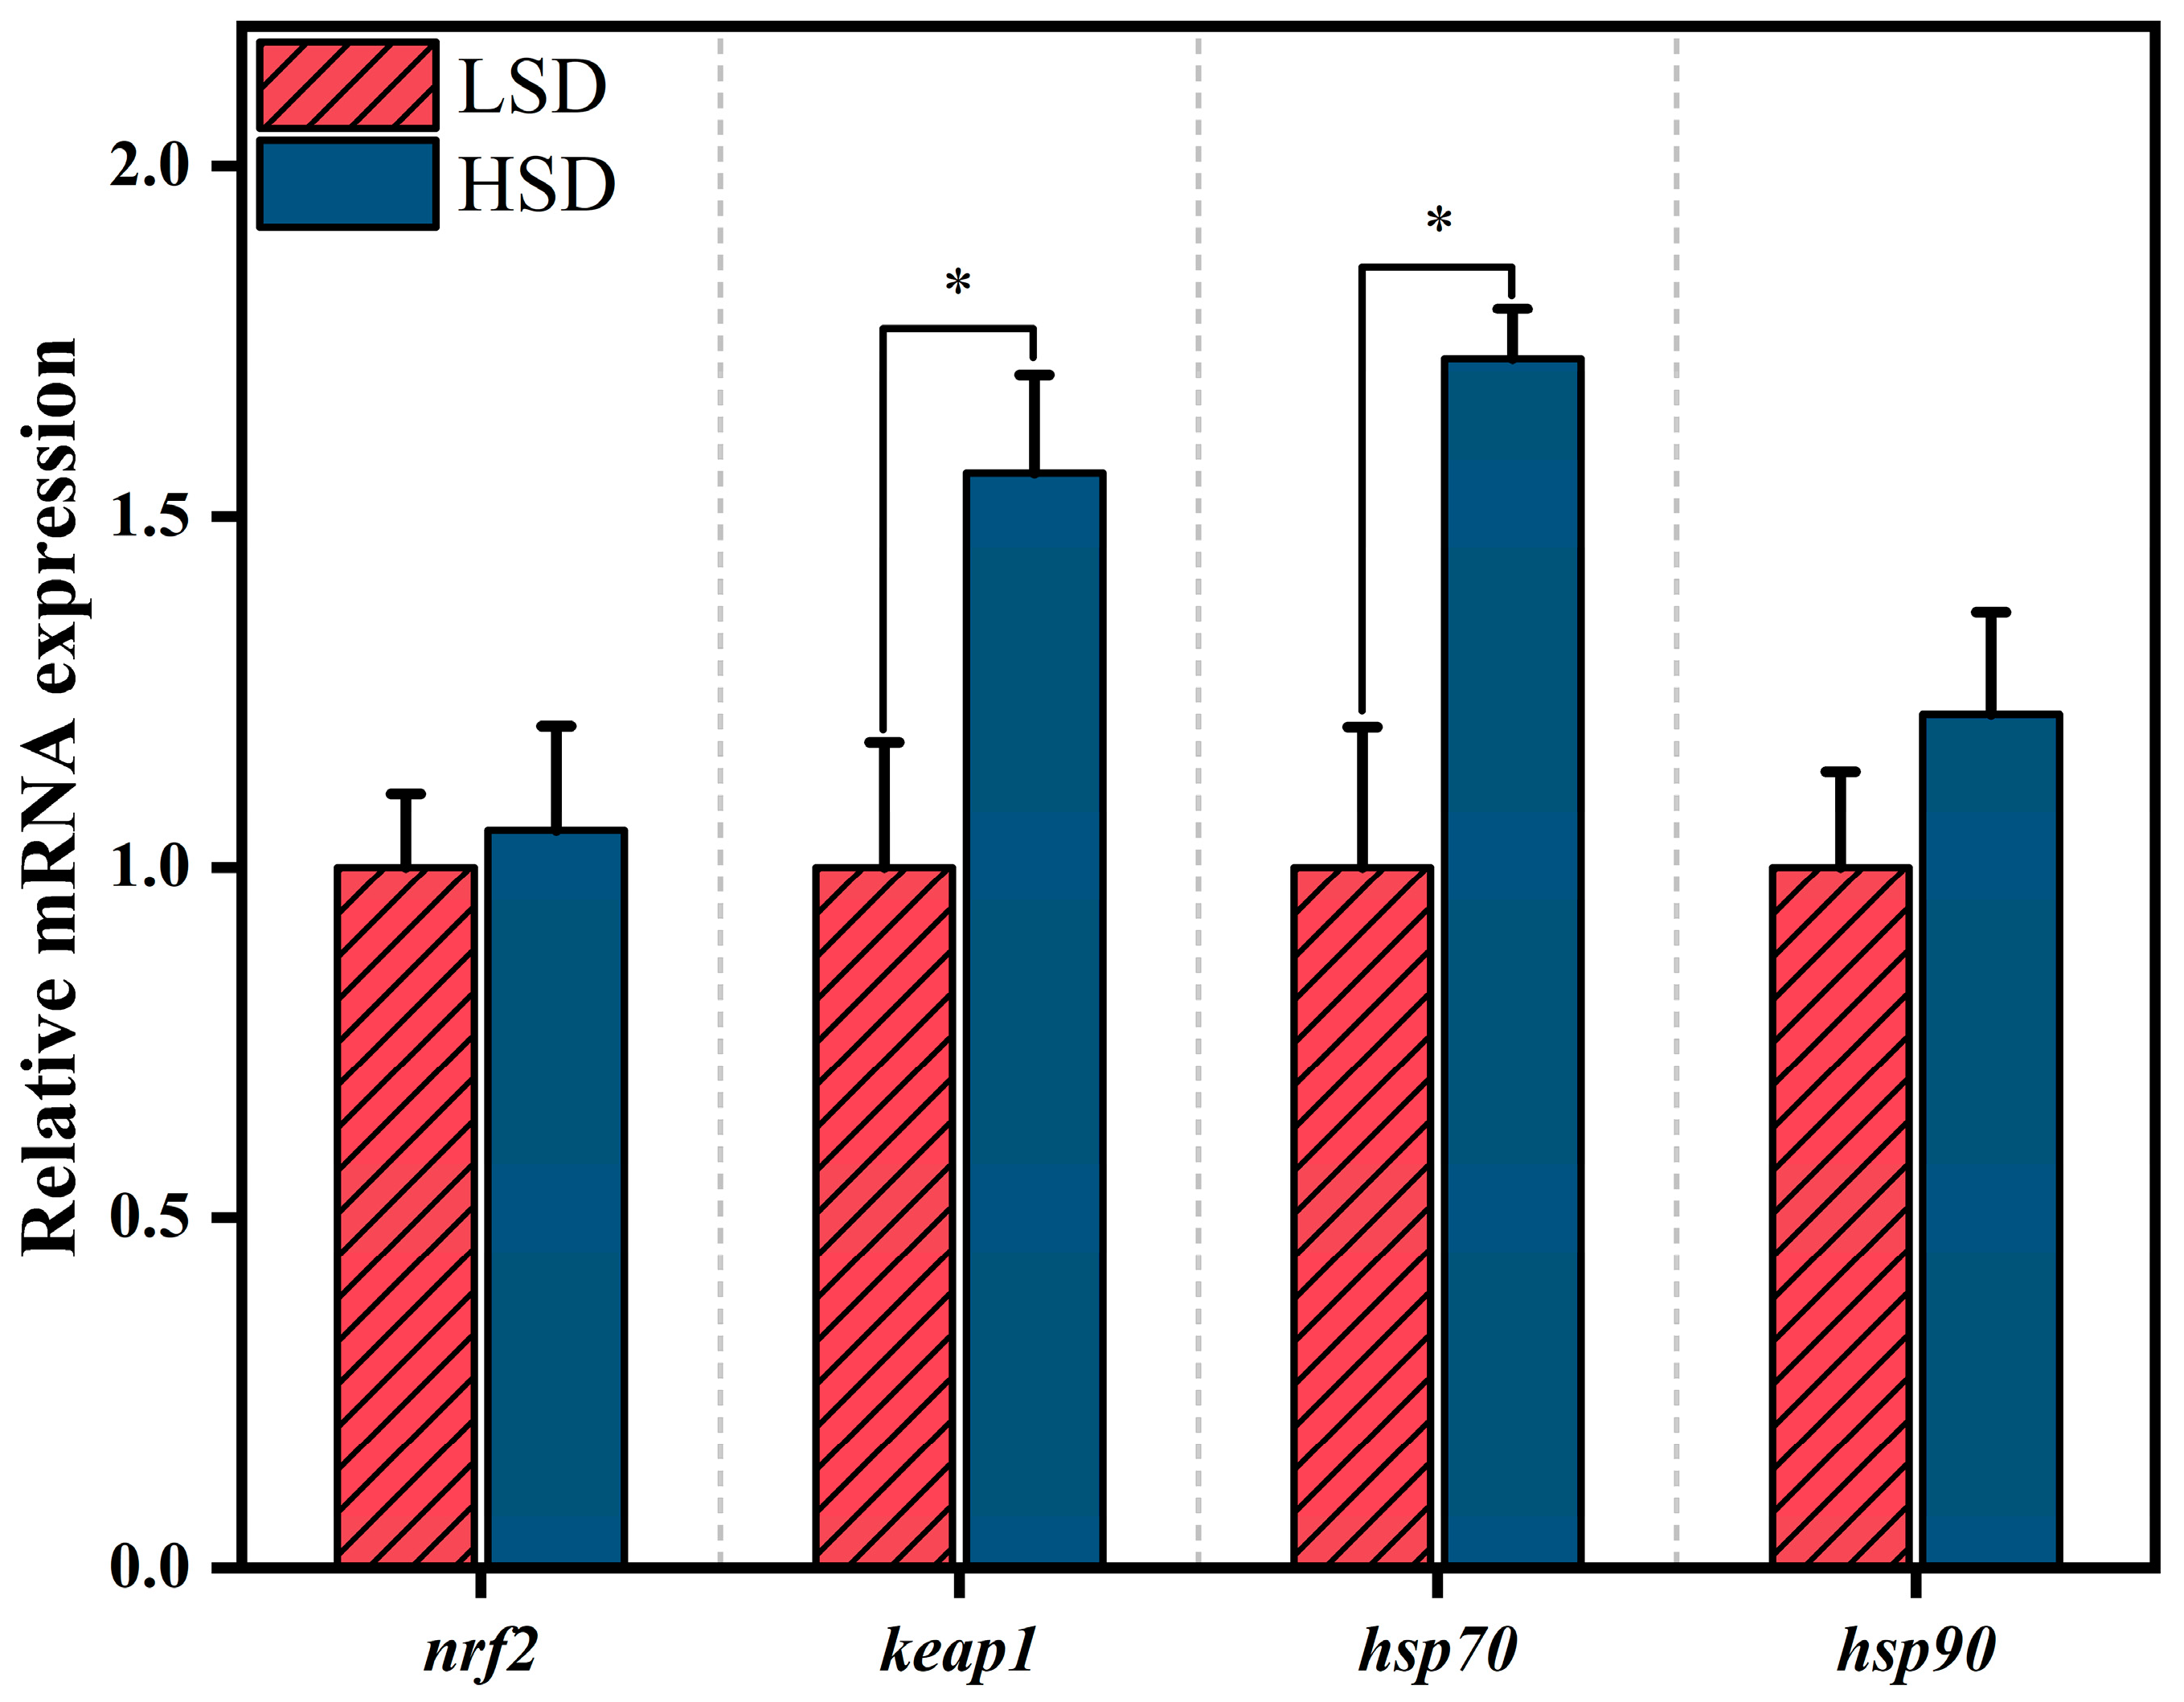
3.4. Expression of Muscle nrf2, keap1, and hsp

In gibel carp, the expression of keap1 in white muscle was significantly upregulated in the high stocking density (HSD) group (p < 0.05). Similarly, hsp70 expression was significantly upregulated in the HSD group (p < 0.05). Stocking density differences led to differential hsp70 expression in white muscle, with significantly higher levels in the HSD group (p < 0.05). However, nrf2 and hsp90 expression levels did not significantly differ between the HSD and low stocking density (LSD) groups (Figure 5).

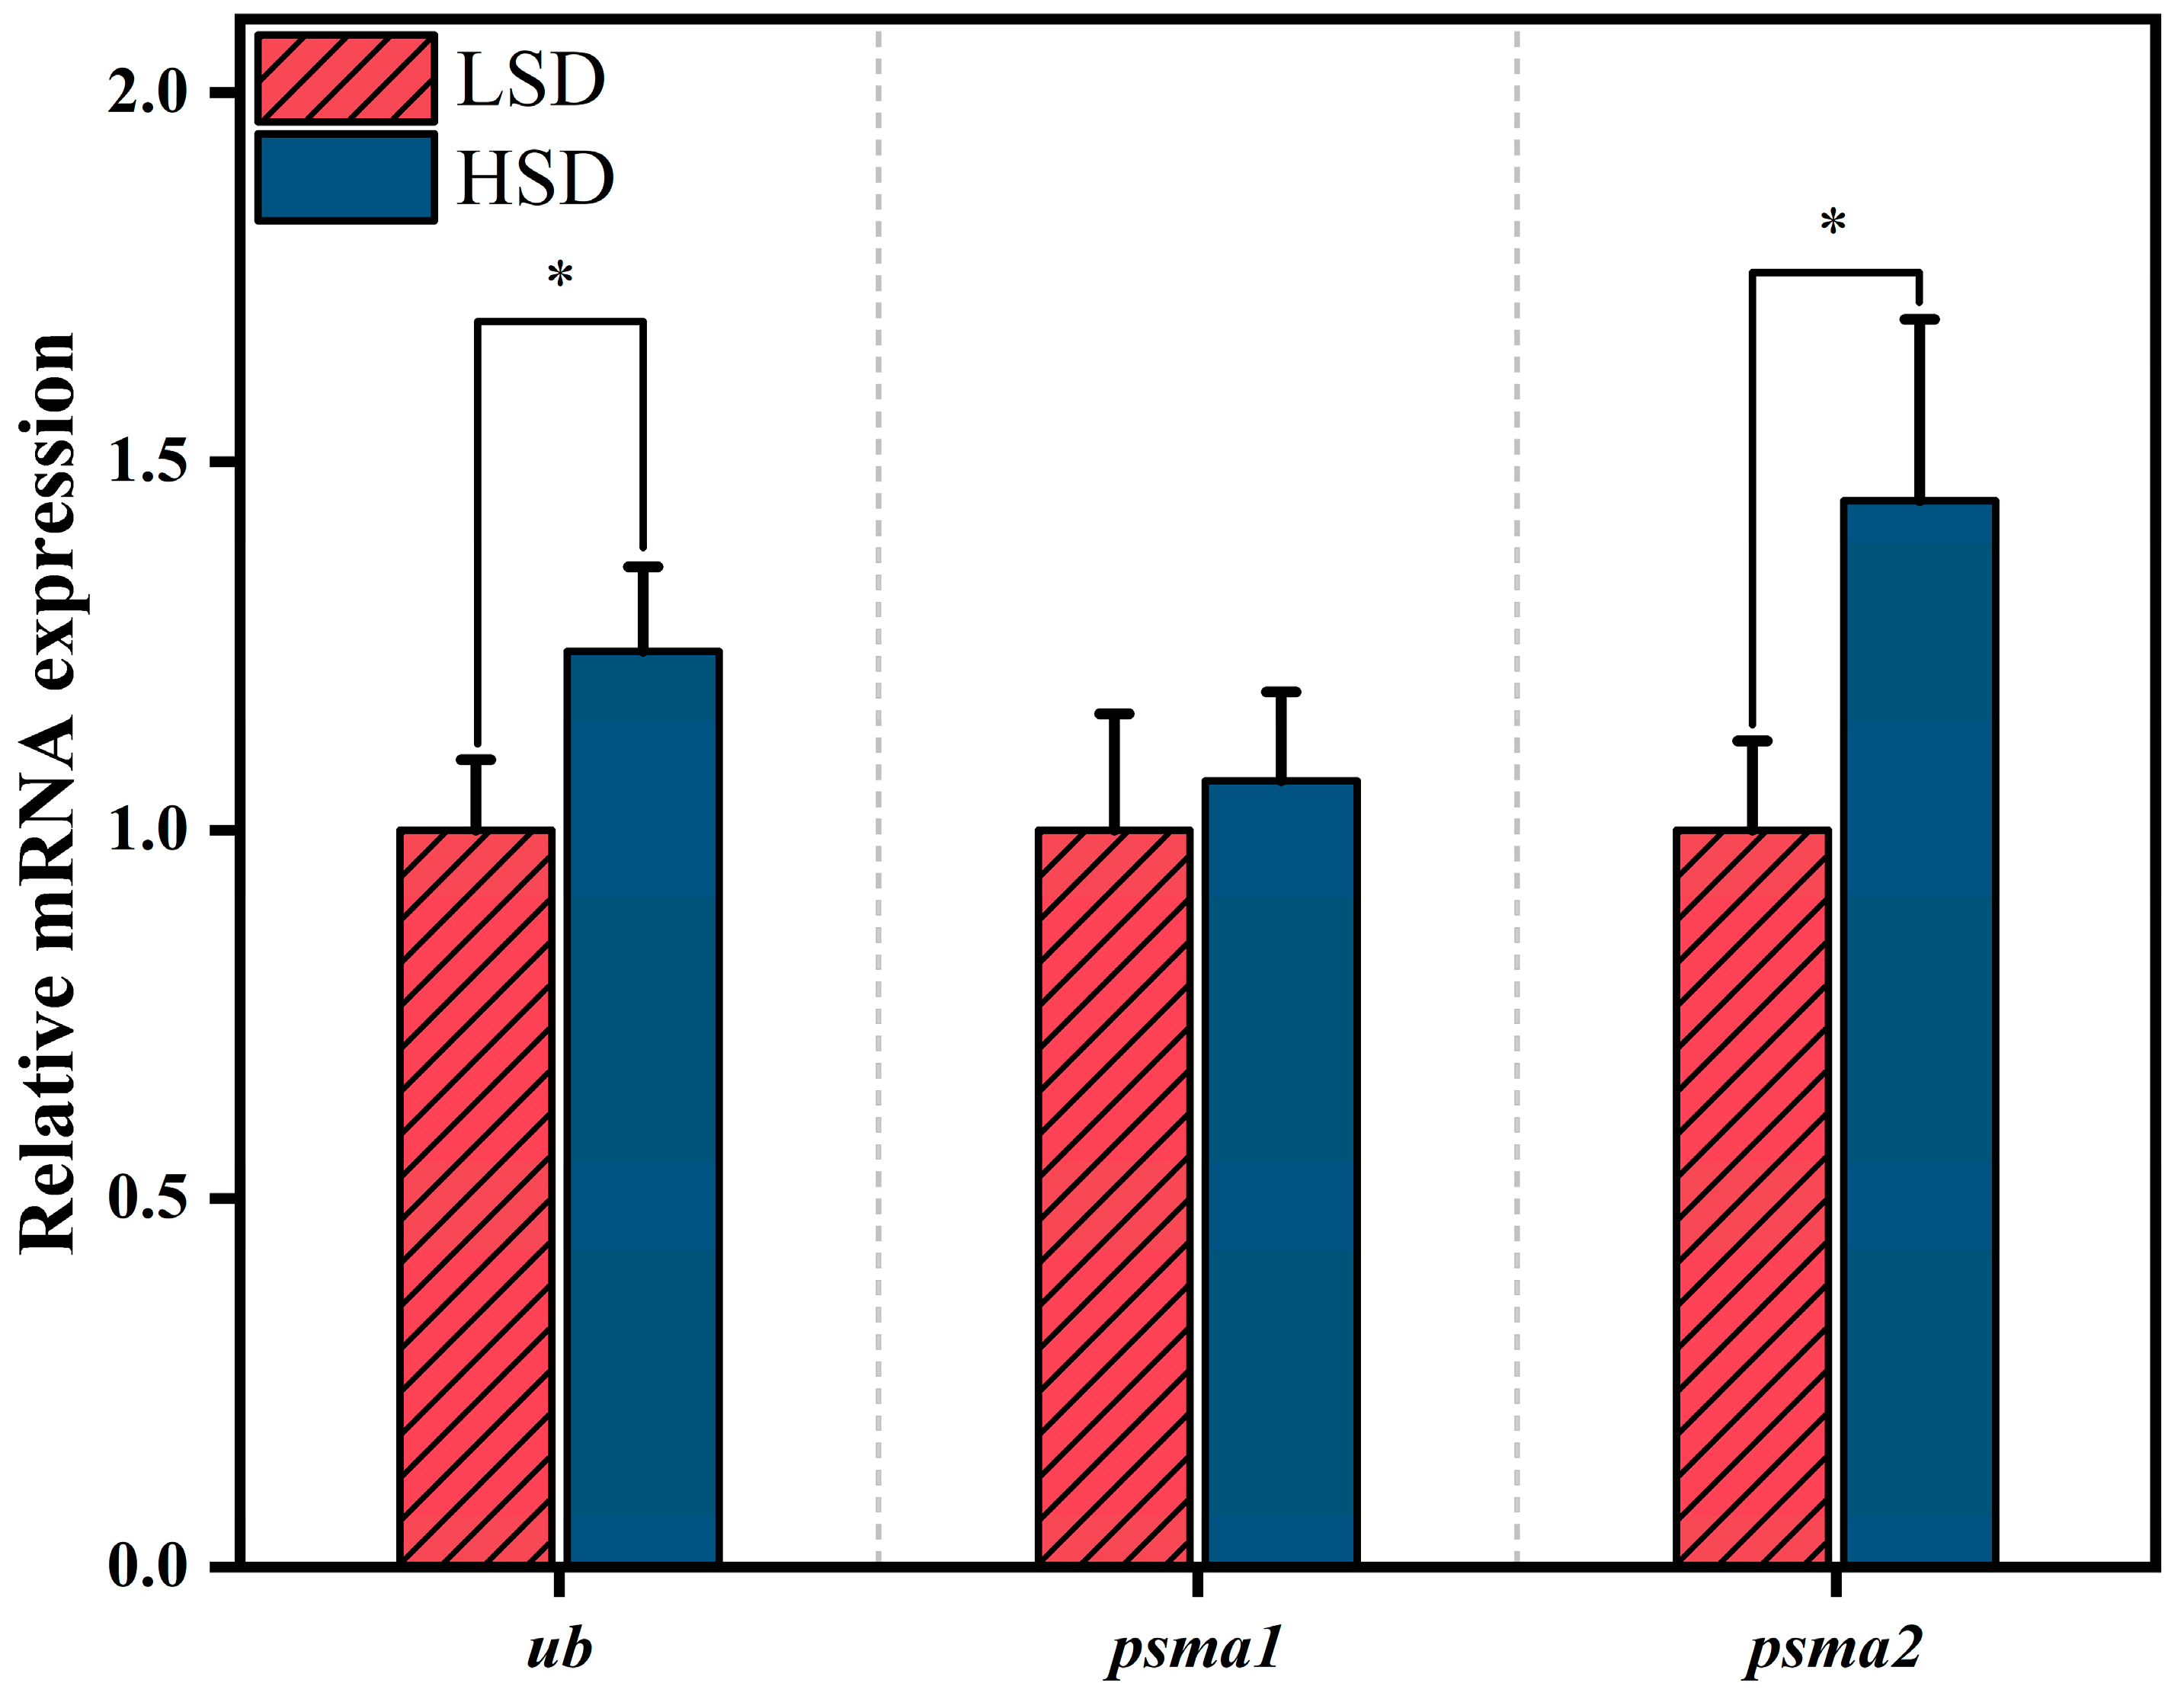
3.5. Ubiquitin–Proteasome System Activity

In the dorsal white muscle of gibel carp, ubiquitin (ub) expression was significantly upregulated in the high stocking density (HSD) group. Similarly, psma2 expression was significantly elevated in the HSD group (p < 0.05). However, psmc1 expression did not significantly differ between the HSD and low stocking density (LSD) groups (Figure 6).

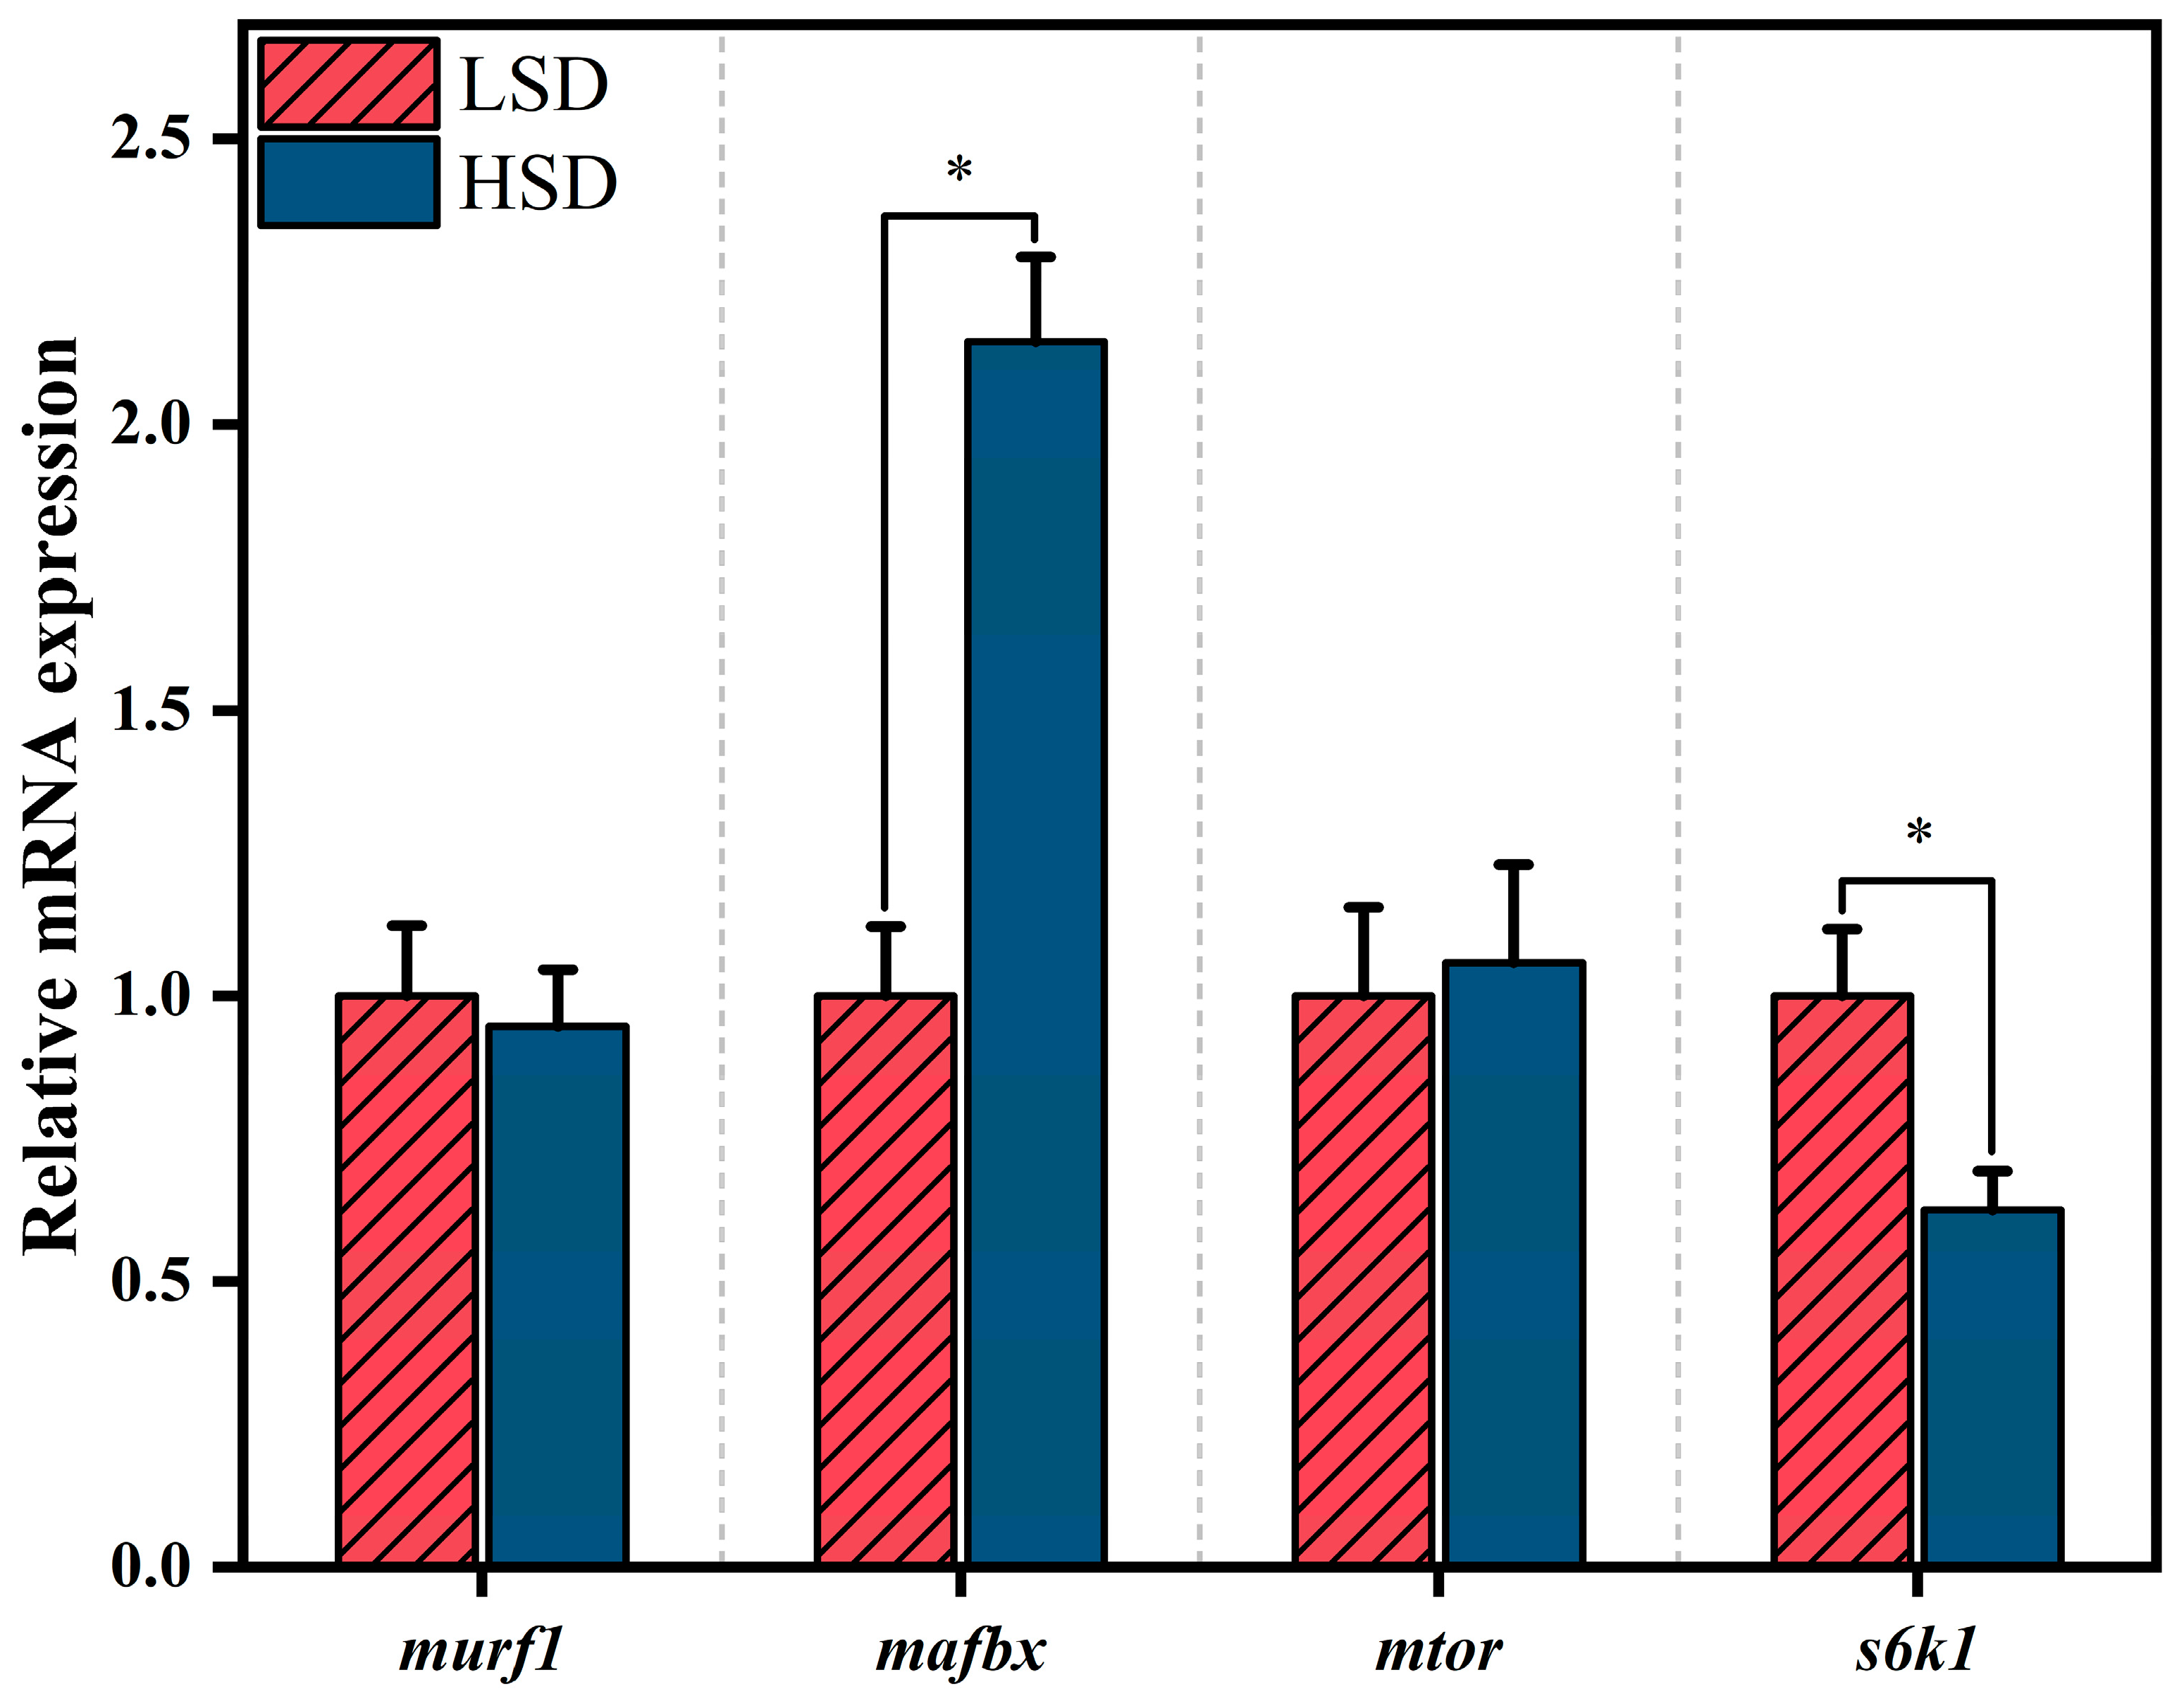
3.6. Expression of Muscle Protein Metabolism-Related Genes

The expression of muscle protein metabolism-related genes: In gibel carp, the relative expression level of mafbx was significantly elevated in the high stocking density (HSD) group (p < 0.05), while s6k1 expression was significantly upregulated in the low stocking density (LSD) group (p < 0.05). The expression levels of murf1 and mtor did not show significant differences between the two groups (Figure 7).

3.7. Economic Profit

After 160 days of cultivation, the net income for the high-density barrel was USD 49.79, resulting in a return on investment (ROI) of 5.75%, while the net income for the low-density barrel was approximately USD 120.85, yielding an ROI of 15.98% (Table 3).

4. Discussion

During a 160-day cultivation experiment, juvenile gibel carp in the high-density group (HSD) exhibited a 13.37-fold increase in body mass, whereas the low-density group (LSD) achieved a 24.53-fold increase. This substantial difference indicates a significant variation in FCR between the two groups, with the LSD group demonstrating superior cultivation outcomes. These results are consistent with several studies suggesting that low-density conditions enhance the feed conversion efficiency and growth performance in farmed fish [20,21]. The condition factor, which reflects the fish’s body shape and growth development [22], was significantly higher in the LSD group compared to the HSD group, indicating better growth under low-density conditions. Additionally, the survival rates showed no significant difference between the two groups, suggesting that land-based rearing tanks are suitable for high-density aquaculture. The HSI and VSI did not exhibit significant differences between the density groups, indicating that the cultivation density did not adversely affect the internal organs of juvenile gibel carp and there was no notable difference in fat deposition in the hepatopancreas. Fish skeletal muscle, a differentiated tissue, grows post-embryonically through the proliferation of myogenic precursor cells, providing nuclei for fiber recruitment and hypertrophy. A significant increase in the muscle fiber number, reflected by a higher muscle fiber density, is indicative of favorable growth conditions [23]. Notably, the muscle fiber density in the HSD group was significantly lower, likely due to the faster proliferation and differentiation of muscle cells in the LSD group, leading to a more rapid increase in the muscle fiber density and overall growth rate.
Throughout the aquaculture process, water temperatures in both density groups were comparable due to the exposure of all tanks to outdoor conditions, leading to consistent weather impacts. Fluctuations in the ambient temperature caused corresponding changes in the water temperature, though these changes were less pronounced. The pH levels of the water showed a decreasing trend during the rearing period. It has been reported that exposure to a low environmental pH adversely affects fish, including reduced growth and feeding rates [21,24]. In this study, the water quality remained slightly alkaline, not reaching levels that could impact fish growth and physiology. We believe the gradual decline in pH during the rearing period was due to CO2 accumulation from fish respiration, with higher densities producing more CO2, resulting in lower pH levels in the high-density group during the latter stages of rearing. Dissolved oxygen (DO) levels in the water are a critical factor influencing aquaculture yields, especially in intensive systems where DO plays a pivotal role. Optimal DO levels promote growth and metabolism in aquaculture species [25]. Previous studies have shown a positive correlation between fish body weight and DO levels at constant temperatures [25]. Our results are consistent with these findings, with DO levels being higher in the low-density group. Around day 50, both groups experienced a notable decrease in DO levels due to prolonged rainfall, which hindered photosynthetic oxygen production by phytoplankton while continuously consuming oxygen, thus lowering DO levels in the water. In the latter stages of rearing, a slight increase in DO levels was observed in both groups, likely due to seasonal temperature drops reducing fish respiratory metabolism and oxygen consumption. When feeding aquatic animals, the protein in the feed is metabolized, with approximately 27–28% accumulating in the animal tissues, while the remainder is excreted as ammonia and organic nitrogen, contributing to the nitrogen content in the water [26]. Research has found that NO3-N and NO2-N levels are higher in high-density aquaculture systems, which is consistent with the results of our experiment [27]. This suggests that as the stocking density increases, residual feed and feces also increase, resulting in higher levels of inorganic and organic nitrogen from decomposition, ultimately leading to an accumulation of harmful waste in high-density groups.
The structure and sequence of the heat shock protein family (HSPs) are highly conserved and are found in all known organisms, serving as molecular chaperones. Among them, heat shock protein 70 (hsp70) is a critical molecule that mediates various cellular activities, such as repairing and degrading altered or denatured proteins [28]. Iwama et al. (2004) highlighted their role in preventing muscle damage or atrophy in response to environmental stress [29]. Previous studies have reported a significant increase in the relative expression of hsp70 in the head kidney of turbot under a high stocking density after 120 days of rearing [30], consistent with the findings in rainbow trout (Oncorhynchus mykiss) [31]. Similarly, the expression of the Hsp90 gene was higher in turbot (Scophthalmus maximus) under high-density conditions [30]. The increased expression of hsp70 and Hsp90 represents an adaptive mechanism in fish, indicating a positive response to counteract the adverse effects of stress [32]. In this study, hsp70 was significantly upregulated in the high-density group, while Hsp90 showed no significant difference between the two density groups, indicating stress in juvenile gibel carp under high-density rearing. Keap1 pairs with E3 ligase substrates to typically promote the degradation of Nrf2 through related pathways. However, during stress, the collaboration with keap1 prevents nrf2 degradation, allowing it to exert its function [33]. Research has shown that the expression levels of nrf2 and keap1 significantly increase in fish under stress conditions [34,35]. In this study, the expression of keap1 was also significantly elevated in the high-density group, further indicating that the high-density group experienced stress. Although there was no significant difference in nrf2 expression between the two density groups, the upregulation of keap1 suggests that high-density rearing has a substantial impact on the stress response.
Skeletal muscle atrophy leads to muscle mass reduction, characterized by muscle fiber shrinkage due to an accelerated rate of protein degradation [36]. When fish are exposed to environmental stimuli, the heat shock protein family genes are activated, triggering a series of responses to counteract external stimuli. Simultaneously, the Keap1-Nrf2-ARE pathway is activated to resist oxidative stress, and UPS activity is enhanced [37,38]. The ubiquitin–proteasome system (UPS) is the primary pathway for protein degradation in cells [39], maintaining protein homeostasis by recognizing and degrading abnormal or damaged proteins. This system consists of ubiquitin (Ub), the E1 activating enzyme, E2 conjugating enzyme, E3 ligase, and the 26S proteasome [40]. Psmc1 and psma2 are components of the 26S proteasome, involved in protein recognition and degradation processes [40]. In skeletal muscle, environmental stimuli can enhance UPS activity, where Ub binds to misfolded protein molecules, forming a substrate complex with the help of the E1, E2, and E3 enzymes and binding to the 26S proteasome for degradation. In this study, the expression of ub and psma2 genes in the white muscle of juvenile gibel carp was significantly upregulated in the high-density group, indicating an accelerated protein degradation rate under high-density rearing conditions. The expression of psmc1 did not change significantly, suggesting that its function might be relatively stable in both low-density and high-density groups. This further explains the faster growth of fish in the low-density group, as increased protein synthesis under low-density conditions likely promotes muscle growth.
Ubiquitin ligases mafbx and murf1 are crucial for muscle mass regulation by promoting protein degradation [41]. Our results showed a significant increase in mafbx expression in the high-density group, indicating higher stress levels under crowded conditions, leading to increased protein degradation and slower muscle growth. Murf1 expression did not differ significantly between the groups, suggesting its stable role under varying density conditions. Additionally, mtor and s6k1 are key genes in muscle growth regulation. Mtor is a critical regulator of cell growth and metabolism [42,43], while s6k1, a downstream effector of the mtor pathway, promotes cell growth by regulating protein synthesis. Although mtor expression did not significantly differ between the groups, s6k1 expression was significantly lower in the high-density group. This suggests that mtor pathway activity may be inhibited under high-density conditions, affecting protein synthesis and muscle growth.
Fish play a crucial role in aquaculture, contributing significantly to global food security and economic stability. As a staple in many regions, fish farming provides a sustainable source of protein while supporting livelihoods in rural communities [3,44]. The economic analysis has indicated that compared to high-density farming, the low-density farming of juvenile gibel carp significantly increases the net income and return on investment. This finding is consistent with previous studies on the in-pond tank culture system for grass carp (Ctenopharyngodon idella) [27]. Despite the higher initial costs and feed expenses associated with high-density systems, the lower associated costs and comparable revenues render low-density methods more profitable. It is suggested that for small and medium-sized aquaculture enterprises, the adoption of low-density farming strategies may lead to more favorable economic outcomes.

5. Conclusions

This study assessed the impact of the stocking density on growth gene expression and economic efficiency in juvenile gibel carp reared in land-based recirculating aquaculture systems. The key findings are as follows: (1) The low stocking density (LSD) group demonstrated a superior growth performance, with a higher final weight, length, weight gain rate, specific growth rate, and condition factor compared to the high stocking density (HSD) group, indicating better overall growth and development. (2) The water quality was notably better in the LSD group, contributing to enhanced growth conditions. This underscores the critical role of maintaining an optimal water quality for promoting health and growth in aquaculture. (3) A gene expression analysis revealed an increased expression of protein synthesis-related genes, such as s6k1, in the LSD group. In contrast, the HSD group displayed elevated levels of stress-related genes, including hsp70 and keap1. Additionally, the LSD group had a higher muscle fiber density, indicative of enhanced muscle development under less crowded conditions. (4) Economically, the LSD group achieved superior returns, benefiting from higher growth rates and improved feed conversion efficiency. The economic assessment revealed a significantly lower return on investment in the HSD group, highlighting the economic benefits of optimal stocking densities in enhancing profitability in recirculating aquaculture systems.

Author Contributions

Conceptualization, H.L. and D.L.; Data curation, H.L. and X.G.; Formal analysis, H.L. and J.L.; Funding acquisition, L.Y., R.T., C.W., L.L. (Li Li) and D.L.; Investigation, H.L., J.L. and X.G.; Methodology, H.L. and X.G.; Supervision, L.Y., R.T., C.W., L.L. (Li Li) and D.L.; Validation, X.G. and D.L.; Visualization, H.L., J.L. and L.L. (Luyi Li); Writing—original draft, H.L.; Writing—review and editing, J.L., L.Y., R.T., C.W., L.L. (Li Li) and D.L. All authors have read and agreed to the published version of the manuscript.

Funding

This research was supported by the earmarked fund for China Agriculture Research System (CARS-45-23) and the National Key Research and Development Program of China (2023YFD2400501).

Institutional Review Board Statement

Not applicable.

Informed Consent Statement

Not applicable.

Data Availability Statement

Data are contained within the article.

Acknowledgments

The authors extend their sincere gratitude to Qixin Hu, Jun Xie, Yin Wang, Tingting Xu, Chengchen Jiang, Wenhan Li, Yutian Yuan, and Xuxu Li for their valuable assistance.

Conflicts of Interest

The authors declare no conflicts of interest.

References

  1. Food and Agriculture Organization of the United Nations. The State of World Fisheries and Aquaculture 2020: Sustainability in Action; Food and Agriculture Organization of the United Nations: Rome, Italy, 2020. [Google Scholar]
  2. Béné, C.; Barange, M.; Subasinghe, R.; Pinstrup-Andersen, P.; Merino, G.; Hemre, G.-I.; Williams, M. Feeding 9 billion by 2050—Putting fish back on the menu. Food Secur. 2015, 7, 261–274. [Google Scholar] [CrossRef]
  3. Naylor, R.L.; Goldburg, R.J.; Primavera, J.H.; Kautsky, N.; Beveridge, M.C.; Clay, J.; Folke, C.; Lubchenco, J.; Mooney, H.; Troell, M. Effect of aquaculture on world fish supplies. Nature 2000, 405, 1017–1024. [Google Scholar] [CrossRef]
  4. Waite, R.; Beveridge, M.; Brummett, R.; Castine, S.; Chaiyawannakarn, N.; Kaushik, S.; Mungkung, R.; Nawapakpilai, S.; Phillips, M. Improving Productivity and Environmental Performance of Aquaculture; WorldFish: Penang, Malaysia, 2014. [Google Scholar]
  5. Boyd, C.E.; D’Abramo, L.R.; Glencross, B.D.; Huyben, D.C.; Juarez, L.M.; Lockwood, G.S.; McNevin, A.A.; Tacon, A.G.; Teletchea, F.; Tomasso, J.R., Jr. Achieving sustainable aquaculture: Historical and current perspectives and future needs and challenges. J. World Aquacult. Soc. 2020, 51, 578–633. [Google Scholar] [CrossRef]
  6. Dong, S.-L.; Dong, Y.-W. Sustainability of Aquaculture Production Systems. In Aquaculture Ecology; Springer: Berlin/Heidelberg, Germany, 2023; pp. 491–530. [Google Scholar]
  7. Hoseini, S.M.; Yousefi, M.; Hoseinifar, S.H.; Van Doan, H. Effects of dietary arginine supplementation on growth, biochemical, and immunological responses of common carp (Cyprinus carpio L.), stressed by stocking density. Aquaculture 2019, 503, 452–459. [Google Scholar] [CrossRef]
  8. Iguchi, K.i.; Ogawa, K.; Nagae, M.; Ito, F. The influence of rearing density on stress response and disease susceptibility of ayu (Plecoglossus altivelis). Aquaculture 2003, 220, 515–523. [Google Scholar] [CrossRef]
  9. Jiwyam, W. The effect of stocking density on yield, growth, and survival of Asian river catfish (Pangasius bocourti Sauvage, 1880) cultured in cages. Aquac. Int. 2011, 19, 987–997. [Google Scholar] [CrossRef]
  10. Liu, Q.; Hou, Z.; Wen, H.; Li, J.; He, F.; Wang, J.; Guan, B.; Wang, Q. Effect of stocking density on water quality and (growth, body composition and plasma cortisol content) performance of pen-reared rainbow trout (Oncorhynchus mykiss). J. Ocean Univ. China 2016, 15, 667–675. [Google Scholar] [CrossRef]
  11. Ashley, P.J. Fish welfare: Current issues in aquaculture. Appl. Anim. Behav. Sci. 2007, 104, 199–235. [Google Scholar] [CrossRef]
  12. Angel, D.; Jokumsen, A.; Lembo, G. Aquaculture production systems and environmental interactions. In Organic Aquaculture: Impacts and Future Developments; Springer: Berlin/Heidelberg, Germany, 2019; pp. 103–118. [Google Scholar]
  13. Domínguez-Godino, J.A.; González-Wangüemert, M. Does space matter? Optimizing stocking density of Holothuria arguinensis and Holothuria mammata. Aquac. Res. 2018, 49, 3107–3115. [Google Scholar] [CrossRef]
  14. Köprücü, K.; Yonar, S.M.; Köprücü, S.; Yonar, M. Effect of different stocking densities on growth, oxidative stress, antioxidant enzymes, and hematological and immunological values of European catfish (Silurus glanis L., 1758). Aquac. Int. 2024, 32, 2957–2973. [Google Scholar] [CrossRef]
  15. Jia, R.; Wang, L.; Hou, Y.; Feng, W.; Li, B.; Zhu, J. Effects of stocking density on the growth performance, physiological parameters, redox status and lipid metabolism of Micropterus salmoides in integrated rice–fish farming systems. Antioxidants 2022, 11, 1215. [Google Scholar] [CrossRef] [PubMed]
  16. Mugwanya, M.; Dawood, M.A.; Kimera, F.; Sewilam, H. A review on recirculating aquaculture system: Influence of stocking density on fish and crustacean behavior, growth performance, and immunity. Ann. Anim. Sci. 2022, 22, 873–884. [Google Scholar] [CrossRef]
  17. Saraiva, J.L.; Rachinas-Lopes, P.; Arechavala-Lopez, P. Finding the “golden stocking density”: A balance between fish welfare and farmers’ perspectives. Front. Vet. Sci. 2022, 9, 930221. [Google Scholar] [CrossRef]
  18. Ahmed, N.; Turchini, G.M. Recirculating aquaculture systems (RAS): Environmental solution and climate change adaptation. J. Clean. Prod. 2021, 297, 126604. [Google Scholar] [CrossRef]
  19. Yanong, R.P. Biosecurity in Aquaculture, Part 2: Recirculating Aquaculture Systems; Southern Regional Aquaculture Center: Stoneville, MS, USA, 2012. [Google Scholar]
  20. Pandey, A.; Pathan, M.A.; Ananthan, P.S.; Sudhagar, A.; Krishnani, K.K.; Sreedharan, K.; Kumar, P.; Thirunavukkarasar, R.; Harikrishna, V. Stocking for sustainable aqua-venture: Optimal growth, yield and economic analysis of Penaeus vannamei culture in inland saline water (ISW) of India. Environ. Dev. Sustain. 2024, 26, 6913–6942. [Google Scholar] [CrossRef]
  21. Abd El-Hack, M.E.; El-Saadony, M.T.; Nader, M.M.; Salem, H.M.; El-Tahan, A.M.; Soliman, S.M.; Khafaga, A.F. Effect of environmental factors on growth performance of Nile tilapia (Oreochromis niloticus). Int. J. Biometeorol. 2022, 66, 2183–2194. [Google Scholar] [CrossRef] [PubMed]
  22. Arame, H.; Adıte, A.; Adjıbade, N.; Imorou, R.S.; Sonon, P. Length-weight relationships and condition factors of Mochokidae (Pisces: Teleostei: Siluriformes) from Niger River, Northern Benin. Aquat. Res. 2020, 3, 72–84. [Google Scholar] [CrossRef]
  23. Rowlerson, A. Cellular mechanisms of post-embryonic muscle growth in aquaculture species. Muscle Growth and Development; Academic Press: Cambridge, MA, USA, 2001. [Google Scholar]
  24. Kawamura, G.; Bagarinao, T.; Yong, A.S.K.; Chen, C.Y.; Noor, S.N.M.; Lim, L.S. Low pH affects survival, growth, size distribution, and carapace quality of the postlarvae and early juveniles of the freshwater prawn Macrobrachium rosenbergii de Man. Ocean Sci. J. 2015, 50, 371–379. [Google Scholar] [CrossRef]
  25. Wu, X.; Li, D.; Lu, J.; Liu, L.; Yang, Q.; Tang, R.; Zhang, X.; Li, L. Adaptation strategies of juvenile grass carp (Ctenopharyngodon idella) facing different dissolved oxygen concentrations in a recirculating aquaculture system. Water Biol. Secur. 2023, 2, 100202. [Google Scholar] [CrossRef]
  26. Takeuchi, T. Overview of Land-Based Recirculating Aquaculture. In Application of Recirculating Aquaculture Systems in Japan; Springer: Berlin/Heidelberg, Germany, 2017; pp. 3–18. [Google Scholar]
  27. Lu, J.; Li, S.; He, X.; Tang, R.; Li, D. An in-pond tank culture system for high-intensive fish production: Effect of stocking density on growth of grass carp (Ctenopharyngodon idella Valenciennes, 1844) and blunt snout bream (Megalobrama amblycephala Yih, 1955). Aquaculture 2022, 549, 737808. [Google Scholar] [CrossRef]
  28. Basu, N.; Todgham, A.; Ackerman, P.; Bibeau, M.; Nakano, K.; Schulte, P.; Iwama, G.K. Heat shock protein genes and their functional significance in fish. Gene 2002, 295, 173–183. [Google Scholar] [CrossRef]
  29. Iwama, G.K.; Afonso, L.O.; Todgham, A.; Ackerman, P.; Nakano, K. Are hsps suitable for indicating stressed states in fish? J. Exp. Biol. 2004, 207, 15–19. [Google Scholar] [CrossRef]
  30. Liu, B.; Fei, F.; Li, X.; Wang, X.; Huang, B. Effects of stocking density on stress response, innate immune parameters, and welfare of turbot (Scophthalmus maximus). Aquac. Int. 2019, 27, 1599–1612. [Google Scholar] [CrossRef]
  31. Yarahmadi, P.; Miandare, H.K.; Fayaz, S.; Caipang, C.M.A. Increased stocking density causes changes in expression of selected stress-and immune-related genes, humoral innate immune parameters and stress responses of rainbow trout (Oncorhynchus mykiss). Fish Shellfish Immunol. 2016, 48, 43–53. [Google Scholar] [CrossRef]
  32. Roberts, R.; Agius, C.; Saliba, C.; Bossier, P.; Sung, Y. Heat shock proteins (chaperones) in fish and shellfish and their potential role in relation to fish health: A review. J. Fish Dis. 2010, 33, 789–801. [Google Scholar] [CrossRef] [PubMed]
  33. Hayes, J.D.; McMahon, M.; Chowdhry, S.; Dinkova-Kostova, A.T. Cancer chemoprevention mechanisms mediated through the Keap1–Nrf2 pathway. Antioxid. Redox Signal. 2010, 13, 1713–1748. [Google Scholar] [CrossRef]
  34. Zeng, L.; Ai, C.-X.; Wang, Y.-H.; Zhang, J.-S.; Wu, C.-W. Abrupt salinity stress induces oxidative stress via the Nrf2-Keap1 signaling pathway in large yellow croaker Pseudosciaena crocea. Fish Physiol. Biochem. 2017, 43, 955–964. [Google Scholar] [CrossRef]
  35. Jiang, Y.; Liu, Z.; Zhang, L.; Liu, W.; Li, H.; Li, X. Phosphatidylserine Counteracts the High Stocking Density-Induced Stress Response, Redox Imbalance and Immunosuppression in Fish Megalobrama ambylsephala. Antioxidants 2024, 13, 644. [Google Scholar] [CrossRef]
  36. Fanzani, A.; Conraads, V.M.; Penna, F.; Martinet, W. Molecular and cellular mechanisms of skeletal muscle atrophy: An update. J. Cachexia Sarcopenia Muscle 2012, 3, 163–179. [Google Scholar] [CrossRef] [PubMed]
  37. Bonura, A.; Giacomarra, M.; Montana, G. The Keap1 signaling in the regulation of HSP90 pathway. Cell Stress Chaperones 2022, 27, 197–204. [Google Scholar] [CrossRef]
  38. Lee, S.; Hu, L. Nrf2 activation through the inhibition of Keap1–Nrf2 protein–protein interaction. Med. Chem. Res. 2020, 29, 846–867. [Google Scholar] [CrossRef] [PubMed]
  39. Huang, X.; Wei, S.; Ni, S.; Huang, Y.; Qin, Q. Ubiquitin–proteasome system is required for efficient replication of singapore grouper iridovirus. Front. Microbiol. 2018, 9, 2798. [Google Scholar] [CrossRef] [PubMed]
  40. Todgham, A.E.; Crombie, T.A.; Hofmann, G.E. The effect of temperature adaptation on the ubiquitin–proteasome pathway in notothenioid fishes. J. Exp. Biol. 2017, 220, 369–378. [Google Scholar] [CrossRef]
  41. Sandri, M.; Sandri, C.; Gilbert, A.; Skurk, C.; Calabria, E.; Picard, A.; Walsh, K.; Schiaffino, S.; Lecker, S.H.; Goldberg, A.L. Foxo transcription factors induce the atrophy-related ubiquitin ligase atrogin-1 and cause skeletal muscle atrophy. Cell 2004, 117, 399–412. [Google Scholar] [CrossRef]
  42. Edinger, A.L.; Thompson, C.B. Akt maintains cell size and survival by increasing mTOR-dependent nutrient uptake. Mol. Biol. Cell 2002, 13, 2276–2288. [Google Scholar] [CrossRef]
  43. Gulati, P.; Gaspers, L.D.; Dann, S.G.; Joaquin, M.; Nobukuni, T.; Natt, F.; Kozma, S.C.; Thomas, A.P.; Thomas, G. Amino acids activate mTOR complex 1 via Ca2+/CaM signaling to hVps34. Cell Metab. 2008, 7, 456–465. [Google Scholar] [CrossRef]
  44. Pradeepkiran, J.A. Aquaculture role in global food security with nutritional value: A review. Transl. Anim. Sci. 2019, 3, 903–910. [Google Scholar] [CrossRef]
Figure 1. The land-based aquaculture system. (A) Bird’s-eye-view of land-based tanks integrated with water treatment pond. (B) Diagrammatic representation scheme of a land-based aquaculture system.
Water 16 02367 g001
Figure 2. Water quality variations in the cultivation of juvenile gibel carp at different densities. (A) Chang in T; (B) Chang in TP; (C) Chang in TN; (D) Chang in TAN; (E) Chang in NO2-N; (F) Chang in NO3-N; (G) Chang in pH; (H) Chang in DO. An asterisk (*) was used to highlight statistically significant differences (p < 0.05).
Water 16 02367 g002
Figure 3. Microscopic images of cross-sections of white muscle in juvenile gibel carp at varying densities. (A) Muscle sections from the high stocking density group; (B) Muscle sections from the low stocking density group.
Water 16 02367 g003
Figure 4. Effects of cultivation density on the diameter and density of white muscle fibers in juvenile gibel carp. (A) White muscle fiber diameter; (B) White muscle fiber density. Diverse lowercase letters denote notable variations in significance.
Water 16 02367 g004
Figure 5. Expression of nrf2, keap1, and hsp in the dorsal white muscle of juvenile gibel carp. An asterisk (*) was used to highlight statistically significant differences (p < 0.05).
Water 16 02367 g005
Figure 6. Expression levels of ups-related genes in the dorsal white muscle of juvenile gibel carp at different cultivation densities. An asterisk (*) was used to highlight statistically significant differences (p < 0.05).
Water 16 02367 g006
Figure 7. Relative expression levels of murf1, mafbx, mtor, and s6k1 in the dorsal white muscle of juvenile gibel carp. An asterisk (*) was used to highlight statistically significant differences (p < 0.05).
Water 16 02367 g007
Table 1. RT-PCR primers used in the study.
Gene NamePrimer SequencesProduct Size
hsp70F:GTCCATCCTGACCATTGAA
R:CCTTCTTGTGCTTCCTCTT
195 bp
hsp90F:CAACGATGACGAGCAGTA
R:GGTGAAGAATGACTCTGGTT
138 bp
nrf2F:GTCCACAGTAAATGGGATCTGC
R:ACCACCCTTCACCAAAGACA
100 bp
keap1F:ACGCCCAGAGCAAAGACTAC
R:CAGAGACTGCCGGAAGTATCC
137 bp
ubF:GCCAAGCGACACCATTGAG
R:GGATGTTGTAGTCGGACAG
156 bp
psma2F:CAGGCCAGCTTGTTCAGAGA
R:TCCCAGCCAGCAATCAGAAG
100 bp
psmc1F:CGGCTGCTCTGTGTTACTGA
R:ACTCTGGATGTGTGAGGGGA
191 bp
mafbxF:GGACGAGATCTGGTTAGCC
R:CTTGCGGATCTGTCTAGCT
135 bp
murf1F:TGTCTATGGACTACAGAGGAA
R:GGATTTCAAAGGAGGTTCAAG
103 bp
mtorF:CGTTCTACTGCTGGGTGTGGAT
R:TGCTGGTCTTCTGCTGCGATA
125 bp
s6k1F:GCGAAATCCGAGCCCTTAC
R:GCAATAGTGAACAGCGTTATGT
162 bp
β-actinF:CATTGACTCAGGATGCGGAAACT
R:CTGTGAGGGCAGAGTGGTAGACG
144 bp
Table 2. Growth indicators of juvenile gibel carp at different stocking densities (Mean ± SE, n = 30).
ParameterLSDHSD
IW (g)1.15 ± 0.061.15 ± 0.01
IL (cm)3.51 ± 0.043.51 ± 0.01
FW (g)29.68 ± 0.88 *15.51 ± 0.62
FL (cm)9.63 ± 0.08 *7.86 ± 0.09
WGR (%)2496.34 ± 9.19 *1249.9 ± 6.97
SGR (%/d)2.03 ± 0.04 *1.63 ± 0.03
FCR1.13 ± 0.02 *1.73 ± 0.07
CF (%)3.32 ± 0.04 *3.19 ± 0.02
SR (%)96.02 ± 0.6293.34 ± 1.1
VSI (%)14.96 ± 0.3915.41 ± 0.28
HSI (%)8.6 ± 0.338.24 ± 0.14
Note: An asterisk (*) was used to highlight statistically significant differences (p < 0.05). IW: Initial body weight. IL: Initial body length.
Table 3. Economic analysis of juvenile gibel carp in a Land-Based Recirculating Aquaculture System (Mean ± SE, n = 3).
ParametersLSDHSD
Mean size of fry (g)1.15 ± 0.061.15 ± 0.01
Total fry weight (kg)8.4 ± 0.3 *14 ± 0.28
Mean harvest weight (g)29.68 ± 0.88 *15.51 ± 0.62
Total harvest weight (kg)156.25 ± 2.51 *163.2 ± 2.77
Survival rate (%)96.02 ± 0.6293.34 ± 1.1
Weight gain ratio (%)2496.34 ± 9.19 *1249.9 ± 6.97
Fish seed cost (USD)92.33 ± 3.3 *154.55 ± 6.62
Expenses on feed (USD)104.16 *128.77
Veterinary cost (USD)35.00 *58.33
Electricity cost (USD)151.20151.20
Labor cost (USD)373.33373.33
Total investment (USD)756.02 ± 1.77 *866.18 ± 6.62
Gross income (USD)875.00 ± 9.93 *913.92 ± 18.29
Net income (USD)120.85 ± 6.70 *49.79 ± 2.39
Return on investment (%)15.98 ± 0.82 *5.75 ± 0.25
Note: An asterisk (*) was used to highlight statistically significant differences (p < 0.05). The expenses on feed, veterinary cost, electricity cost, and labor cost were identical among replicates within each density group. Hence, there is no variance.
Disclaimer/Publisher’s Note: The statements, opinions and data contained in all publications are solely those of the individual author(s) and contributor(s) and not of MDPI and/or the editor(s). MDPI and/or the editor(s) disclaim responsibility for any injury to people or property resulting from any ideas, methods, instructions or products referred to in the content.

