Article

Assessment of Human Errors in the Operation of the Water Treatment Plant

by
Jakub Żywiec
1,*,
Barbara Tchórzewska-Cieślak
1 and
Kateryna Sokolan
2
1
Department of Water Supply and Sewerage Systems, Faculty of Civil, Environmental Engineering and Architecture, Rzeszow University of Technology, Al. Powstańców Warszawy 6, 35-959 Rzeszow, Poland
2
Department of Mechanical Engineering Technology, Faculty of Engineering, Transport and Architecture, Khmelnytsky National University, 11 Instytutska Str., 29016 Khmelnytsky, Ukraine
*
Author to whom correspondence should be addressed.
Water 2024, 16(17), 2399; https://doi.org/10.3390/w16172399
Submission received: 1 August 2024 / Revised: 22 August 2024 / Accepted: 24 August 2024 / Published: 26 August 2024

Abstract

:
The water supply system (WSS) is an anthropotechnical system whose reliability depends on proper human activity. Research indicates that 75% of WSS failures are due to human errors. The water treatment plant (WTP) is a key element of the WSS. The water treatment process requires human control as the operator. His task is to maintain an appropriate level of reliability and safety for the system by controlling the technological objects. The aim of the work was to assess the reliability of the WTP operator. The paper presents a Human Reliability Assessment (HRA) of the operator of the WTP using the Fuzzy-Bayes CREAM method. The values of the Human Error Probability (HEP) for operators were determined, which are key to carrying out further analyses of the human impact on the reliability and operational safety of anthropotechnical critical infrastructure systems. The HEP value of the water treatment plant operator varies in the range of 0.0005–0.0746 (depending on the technological process). Identification of new threats related to the impact of the human factor on the WSS’s functioning and taking them into account in reliability calculations will allow for a better representation of actual operating conditions.

1. Introduction

Critical infrastructure systems must be characterized by high technical reliability and operational safety [1]. The management of such systems should be based on a strategy aimed at minimizing the risk of their failure [1]. Among the causes of failure, apart from technical or environmental reasons, the direct or indirect impact of the human factor is also important [2]. It can affect the system already at the design stage, at the stage of system construction, or finally during its operation, creating conditions for failure [2]. Statistics show that human activities contribute to 60–90% of failures in various technical systems [2,3].
Access to drinking water is one of the most important aspects of society’s functioning. Water supply systems (WSS) are classified as critical infrastructure systems [1]. They are also an example of an anthropotechnical system, i.e., a system consisting of three elements: man-technical object-environment [4]. Data available in the literature indicate that the human factor contributed to 75% of failures in water supply systems [5,6]. The impact of the human factor on the functioning of the technical system may be internal, including authorized activities (of staff), or external in relation to acts of vandalism, terrorism, or its incorrect use (actions of third parties) [4]. A man in the anthropotechnical system may turn out to be the weakest link. For this reason, in the early 1960s, research on human reliability [7] was started in order to determine the probability of the correct performance of the task by the technical staff, in a given time interval, at any time of the system operation. From the very beginning, there was a multidisciplinary approach to the subject of Human Reliability Assessment (HRA), which included the sciences of reliability, ergonomics, and psychology [2,8]. Over the last 60 years, over 70 different HRA methods have been presented [2,9,10]. In order to classify them, a division into three generations has been proposed [10]. The first generation of HRA covers the years 1960–1990 and includes such methods as HEART (Human Error Assessment and Reduction Technique) [11] and TESEO (Tecnica Empirica Stima Errori Operatori) [12]. These methods focus on quantifying the probability of human error. The second generation of HRA methods covers the years 1990–2005. The methods of this generation take into account the influence of the human’s cognitive functions, such as memory, attention, thinking, and perception, as well as the context of the situation on the human’s reliability. Examples of methods of this generation are ATHEANA (A Technique for Human Event Analysis) [13] and CREAM (Cognitive Reliability and Error Analysis Methods) [14]. The third generation of HRA, developed after 2005, focuses on the use of simulation methods to assess human reliability or proposes modifications of earlier generation methods, e.g., CARA (Controller Action Reliability Assessment) [15] and Bayes-SLIM (Success Likelihood Index Method) [16]. Methods of assessing human reliability have been widely used in many fields, including critical infrastructure sectors such as the energy sector [17,18,19], space sector [20], transport sector [15,21,22,23,24,25,26], and health sector [3,27]. The paper [17] presents the use of the HCR (Human Cognitive Reliability) method to determine the human error probability for hydropower station operation. The work [18] presents the use of the FTA (Fault Tree Analysis) method to calculate the human reliability of maintenance groups in power transmission grids. The work [19] presents an HRA analysis using the classic CREAM method for oil well workers. The CREAM method was also used in [20] to analyze human errors in the crew fueling process during a space launch. In paper [15], a tool for analyzing the human reliability of air traffic controllers was presented. HRA analyses related to air transport were also presented in the works [21,22], where a modified version of the CREAM method (with fuzzy logic) was used. HRA analyses are also presented for sea transport. The paper [23] presents an analysis using the fuzzy HEART method for cargo operation in offshore tanker units. Another modification of the HEART method using the Dempster–Shafer evidence theory approach was presented in [24] to assess human reliability for the gas-freeing process on chemical tankers. A fuzzy and Bayesian network CREAM model for human reliability analysis was presented in [25] for assessing the reliability of a tanker crew. A different approach to the CREAM method with fuzzy-based clustering was presented in [26] for assessing the human reliability of professional drivers. A proposal for a new HRA method was presented in the paper [3] for formal pharmaceutical human reliability assessment. The analysis of HRA in the medical area is also presented in paper [27], which presents human reliability assessment for medical devices based on failure mode and effects analysis and fuzzy linguistic theory. Based on the literature review, the continuous development of new HRA assessment methods and modifications of previous generation methods and their applications in various systems is observed. All this research allows us to better investigate human reliability and contribute to the development of knowledge in the field of reliability research.
The impact of the human factor on the functioning of the WSS is not fully recognized, which is reflected in the small number of research on this subject. Żywiec et al. [4] presented the concept of WSS safety assessment, including the influence of the system operator. Wu et al. [5] reviewed 62 failure cases of WSS in terms of identifying human errors. Tang et al. [6] presented an approach to water safety assessment based on resilience mechanisms. No direct HRA studies for WSS operators had been found in the available literature; what was the inspiration to undertake the research problem.
The aim of the work was to assess the reliability of the operator of the water treatment plant, whose task is to manage and control the operation of technological facilities. The obtained results will allow us to determine the impact of the human factor on the functioning of WTP facilities. The paper presents the results of Human Reliability Analysis for WTP operators, which was carried out using the Fuzzy-Bayes CREAM [25] method. The research was carried out with a group of 38 operators who work at 12 water treatment plants located in south-eastern Poland. The presented results show the Human Error Probability values (HEP) for different scenarios, including the operator’s work in the processes of water intake, water treatment, water storage, and water pumping.
According to the authors, HRA should be included as a permanent element of the WSS reliability assessment. Recognition of the Human Error Probability (HEP) values allows for further WSS reliability research, which will take into account the human impact on the functioning of the anthropotechnical critical infrastructure system. Taking into account the previously ignored human factor in the reliability analysis will allow for a better representation of the actual operating conditions of the WSS, as a complex system whose reliable and safe operation depends on the interactions between man, the technical system, and the environment.

2. Materials and Methods

2.1. CREAM Framework

The CREAM method was introduced by E. Hollnagel in 1998 [14]. It has been used in many fields, such as: chemical industry, air transport, and sea transport [19,20,25]. It is based on the model of cognitive processes, the Contextual Control Model (COCOM), which describes the relationships between cognitive functions in the human mind [14]. In simple terms, this model assumes that every human action results from a controlled process of using their competences, depending on the requirements of a given situation. Human control can fluently change levels from complete lack to full control. In the COCOM model, there are four control modes, which are described by the values of the Human Error Probability (HEP) [14]. They are presented in Table 1.
The essence of the method is to determine the HEP value based on the operator’s control mode [14]. To do this, nine Common Performance Conditions (CPC) factors must be assessed. They can have a positive, negative, or neutral impact on operator reliability. The 9 CPC factors are: work organization, working conditions, quality of the human-machine interface, availability of procedures/plans, number of simultaneously performed tasks, amount of time to complete the task, time of day, qualifications and experience, and team cooperation. The HEP value is determined based on the operator control mode, which is determined by the assessment of the CPC factors, presented in the form of a matrix [14]:
{∑N, ∑O, ∑P}
where:
∑N—number of factors having a negative impact on operator reliability,
∑O—number of factors having a neutral impact on operator reliability,
∑P—number of factors having a positive impact on operator reliability.
Then, based on the model presented in Figure 1, the operator control mode is determined [14]. There are 52 possible result combinations. The most favorable is {0, 2, 7} and means that there are 0 factors negatively affecting the operator’s reliability, 2 factors with a neutral impact, while 7 of the factors have a positive impact; the most unfavorable result possible to obtain is the combination {9, 0, 0}, where all 9 assessed CPC factors have a negative impact on operator reliability [14].

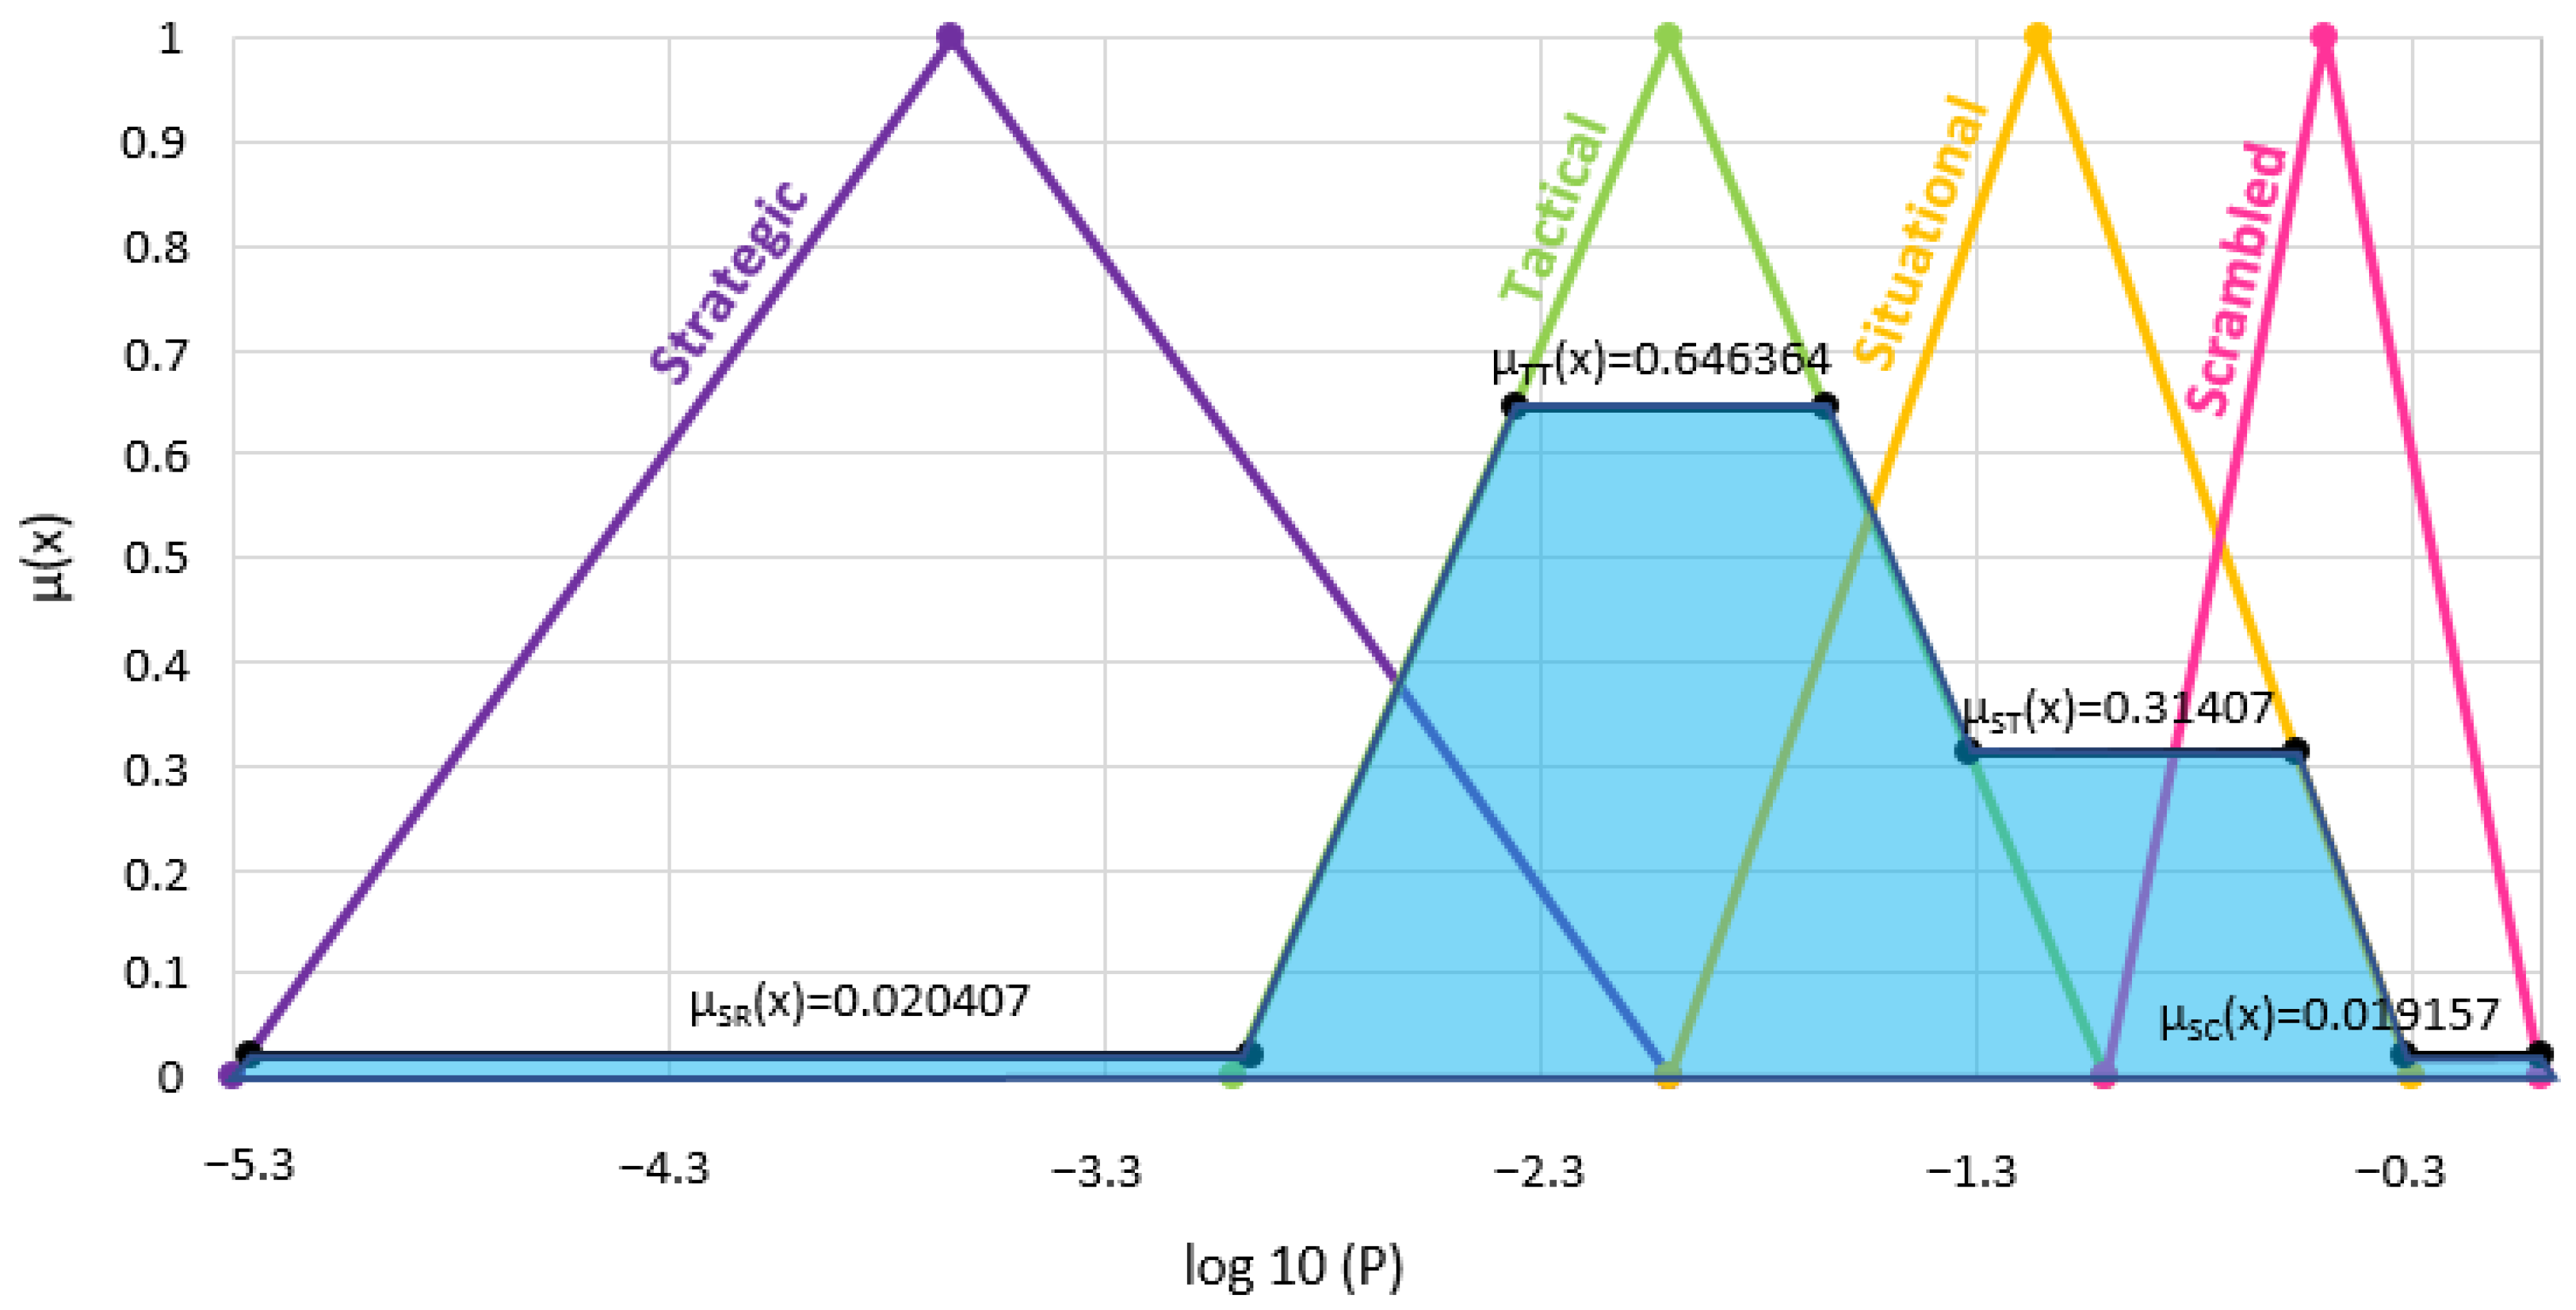
2.2. Use of Fuzzy Logic in CREAM

The theory of fuzzy logic and fuzzy sets was introduced in 1965 by Zadeh [28]. The author introduced the concepts of fuzzy sets and fuzzy numbers, which can be used to mathematically model imprecise or uncertain quantities and have found wide practical applications in many fields of science [29,30]. Due to the fact that human action is complex and difficult to describe mathematically, fuzzy logic has often been used to modify HRA methods, including CREAM [22,25,27].
The fuzification process allows us to transform the input values into fuzzy numbers, which are described by the membership function, assigning values from 0 to 1 for all elements belonging to the set. With regard to the CREAM method, the works of Zhou et al. [25] and Jin et al. [22] present the use of fuzzy logic to modify the assessment of CPC factors. The proposal for assessing CPC factors for the WSS operator is presented in Table 2.
As a given factor may cause an increase or decrease in operator reliability or may have no impact on the level of operator reliability, a three-level rating scale was proposed for factors CPC1-CPC4, CPC6, CPC8, and CPC 9 as: appropriate, acceptable, inappropriate, and for factors CPC 5 and CPC7, a two-level scale as: acceptable and inappropriate [22,25]. Figure 2 shows a graphical interpretation of the proposed rating scale. The scale can be described using fuzzy numbers, described by membership functions according to Equations (2)–(4) for a three-level scale [22,25]:
μ I N A D E Q U A T E x = 1 , x 0 1 , 0 < x 10 ( 50 x ) / 40 , 10 x 50 0 , x 50
μ A C C E P T A B L E x = 0 , x 10 ( x 10 ) / 40 , 10 < x 50 ( 90 x ) / 40 , 50 x 90 0 , x 90
μ A D E Q U A T E x = 0 , x 50 ( x 50 ) / 40 , 50 < x 90 1 , 90 x 100 1 , x 100
and Equations (5) and (6) for the two-level scale [21,26]:
μ I N A D E Q U A T E x = 1 , x 0 1 , 0 < x 50 ( 90 x ) / 40 , 50 x 90 0 , x 90
μ A C C E P T A B L E x = 0 , x 50 ( x 50 ) / 40 , 50 < x 90 1 , 90 x 100 1 , x 100
Quantities describing control modes are also described by using fuzzy numbers. For this purpose, the HEP intervals were presented in the form of a decimal logarithm, as shown in Table 3. The values determined in this way were used for fuzzy modeling using triangular fuzzy numbers. The membership functions for individual control modes are described by Equations (7)–(10) [22,25]. Figure 3 shows a graphical interpretation of the adopted fuzzy model for control modes.
μ S C x = 0 , x 1 2 · x + 2 , 1 x 0.5 2 · x , 0.5 x 0 0 , x 0
μ S T x = 0 , x 2 x + 2 0.85 , 2 x 1.15 0.3 x 0.85 , 1.15 x 0.3 0 , x 0.3
μ T T x = 0 , x 3 x + 3 , 3 x 2 1 x , 2 x 1 0 , x 1
μ S R x = 0 , x 5.3 x + 5.3 1.65 , 5.3 x 3.65 2 x 1.65 , 3.65 x 2 0 , x 2
The opposite process of fuzzification is defuzzification. It involves transforming a number from a fuzzy form to a crisp form. A number of tools for defuzzification of fuzzy numbers have been presented in the literature [29,30,31]. One of the most popular defuzzification methods is the COG (Center of Gravity) method. In this method, the center of gravity of the figure obtained on the membership function graph is determined according to the equation [30]:
C V = x · μ ( x ) d x μ ( x ) d x
where:
-
CV—crisp value–defuzzified value of fuzzy number,
-
x—element of the real set (R), x ∈ R,
-
μ(x)—membership function that assigns each element x ∈ R its degree of membership in the fuzzy set.

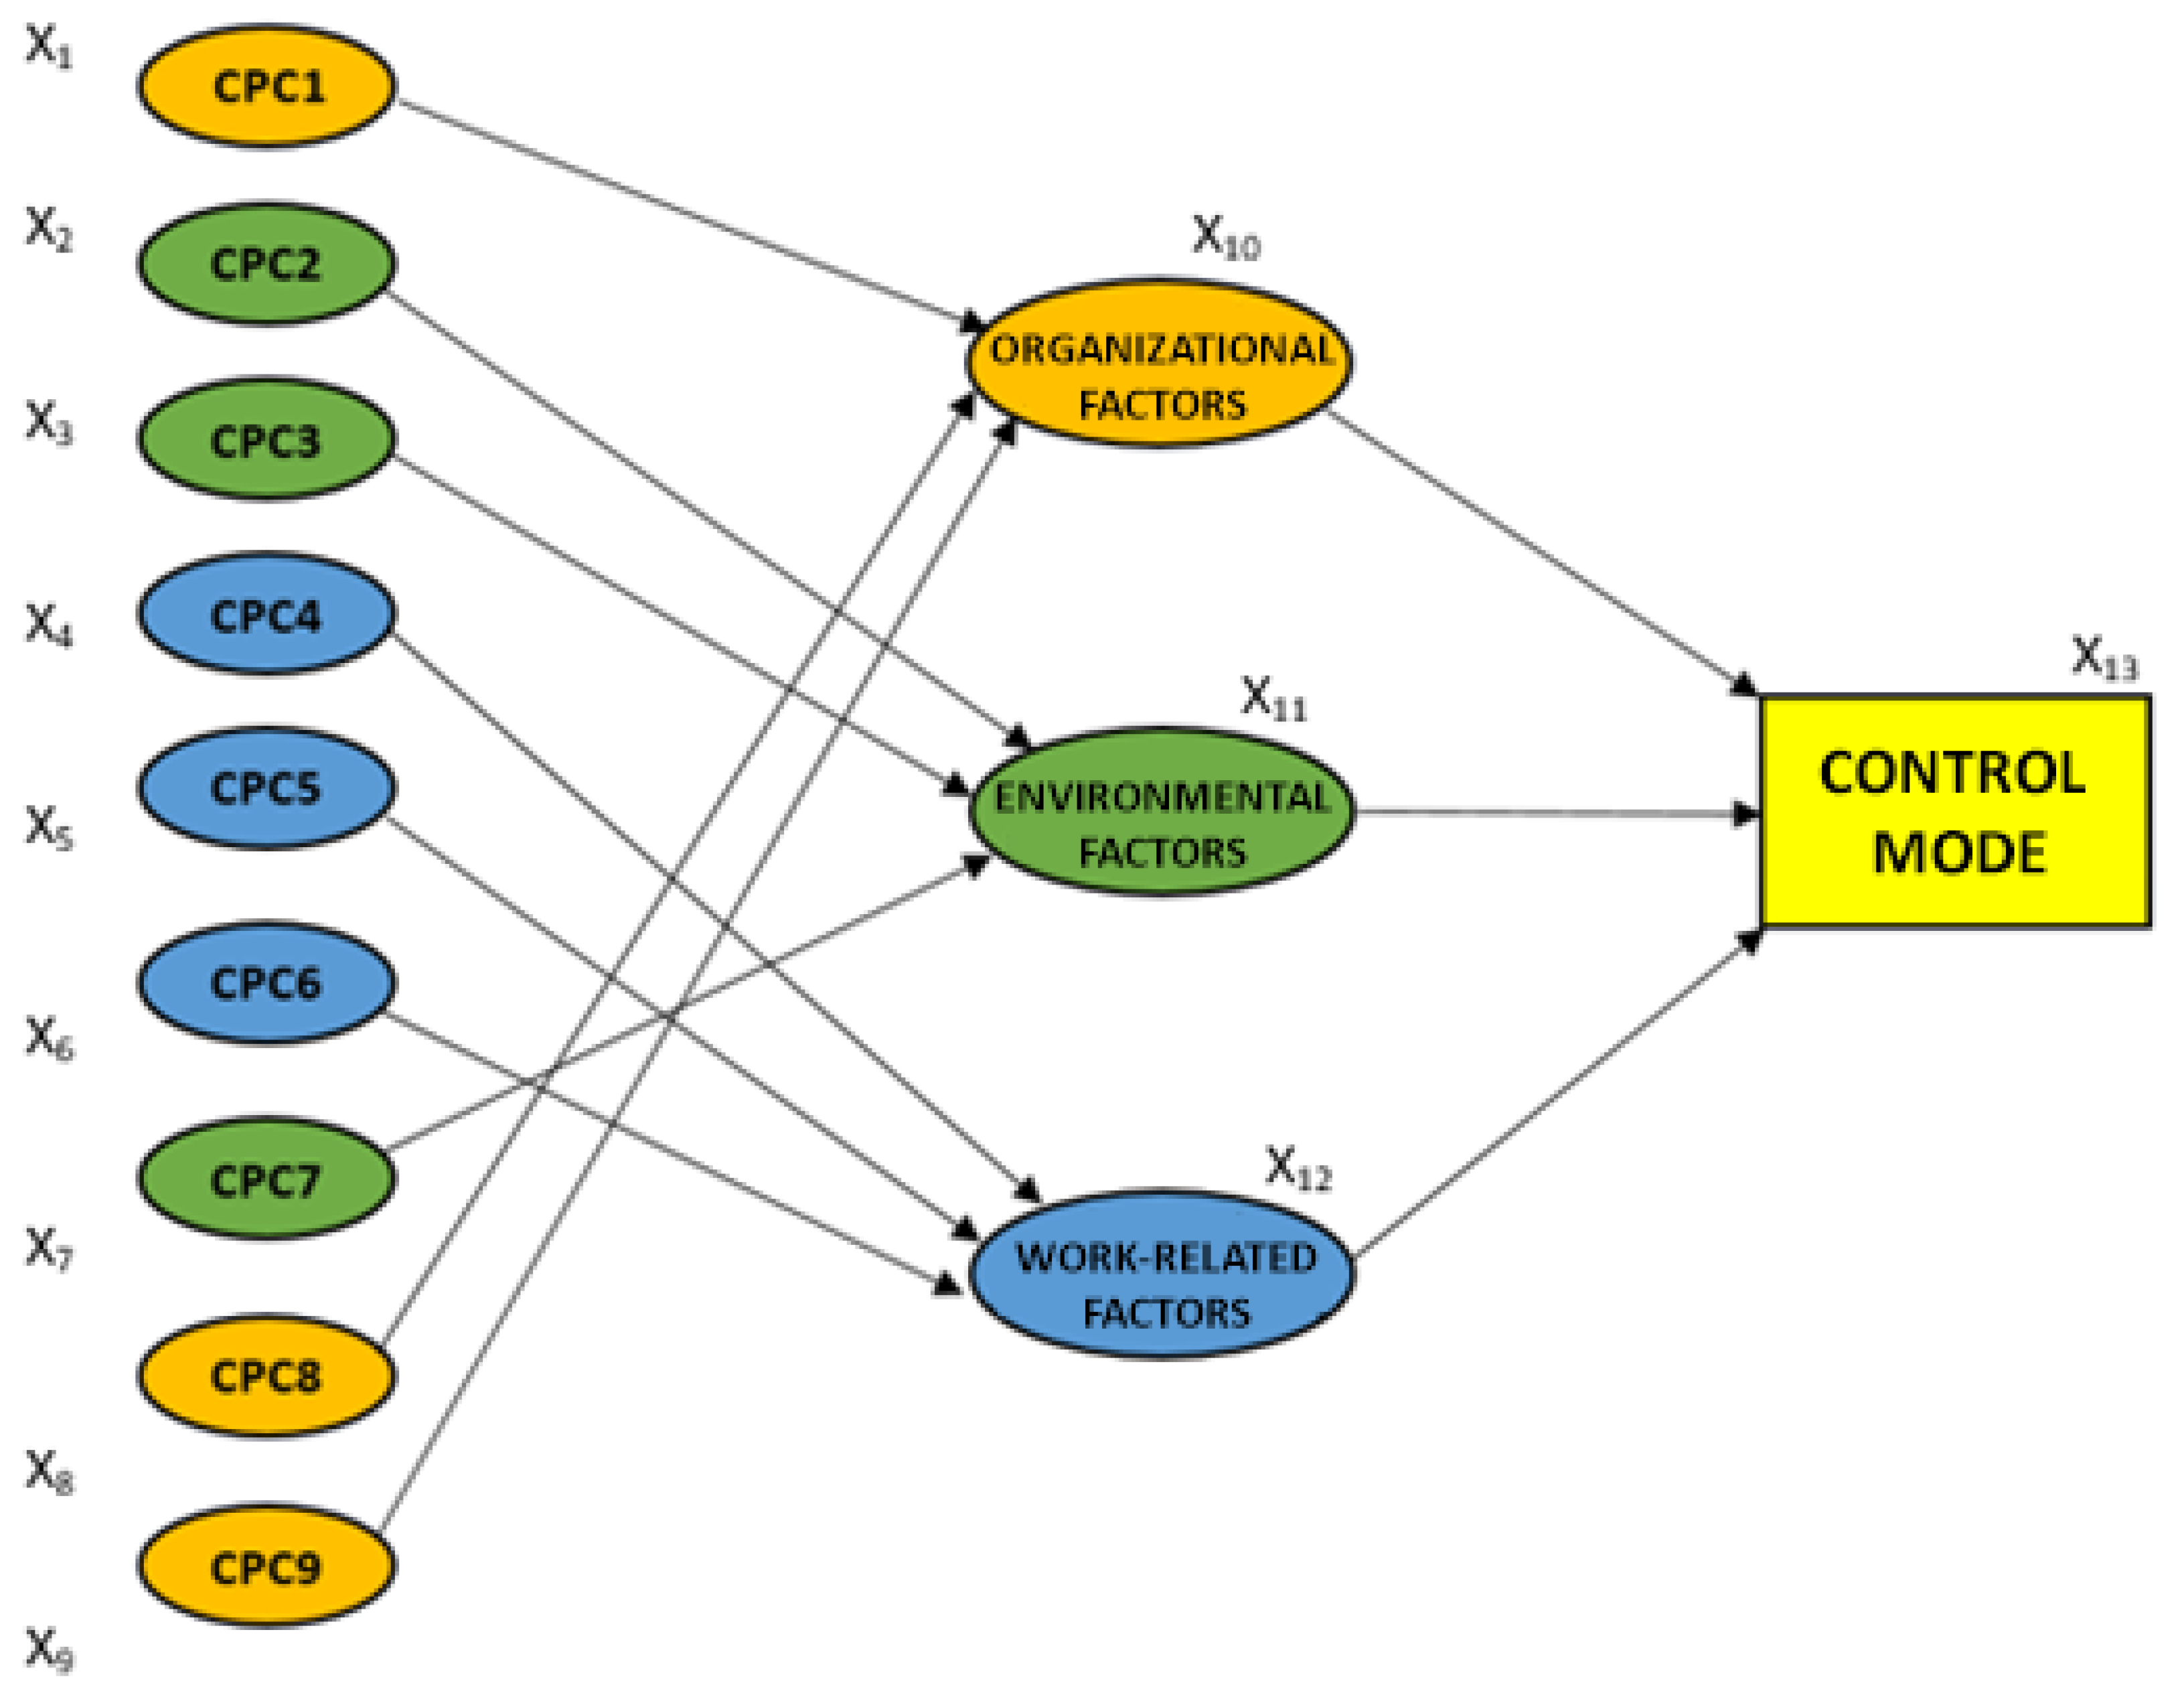
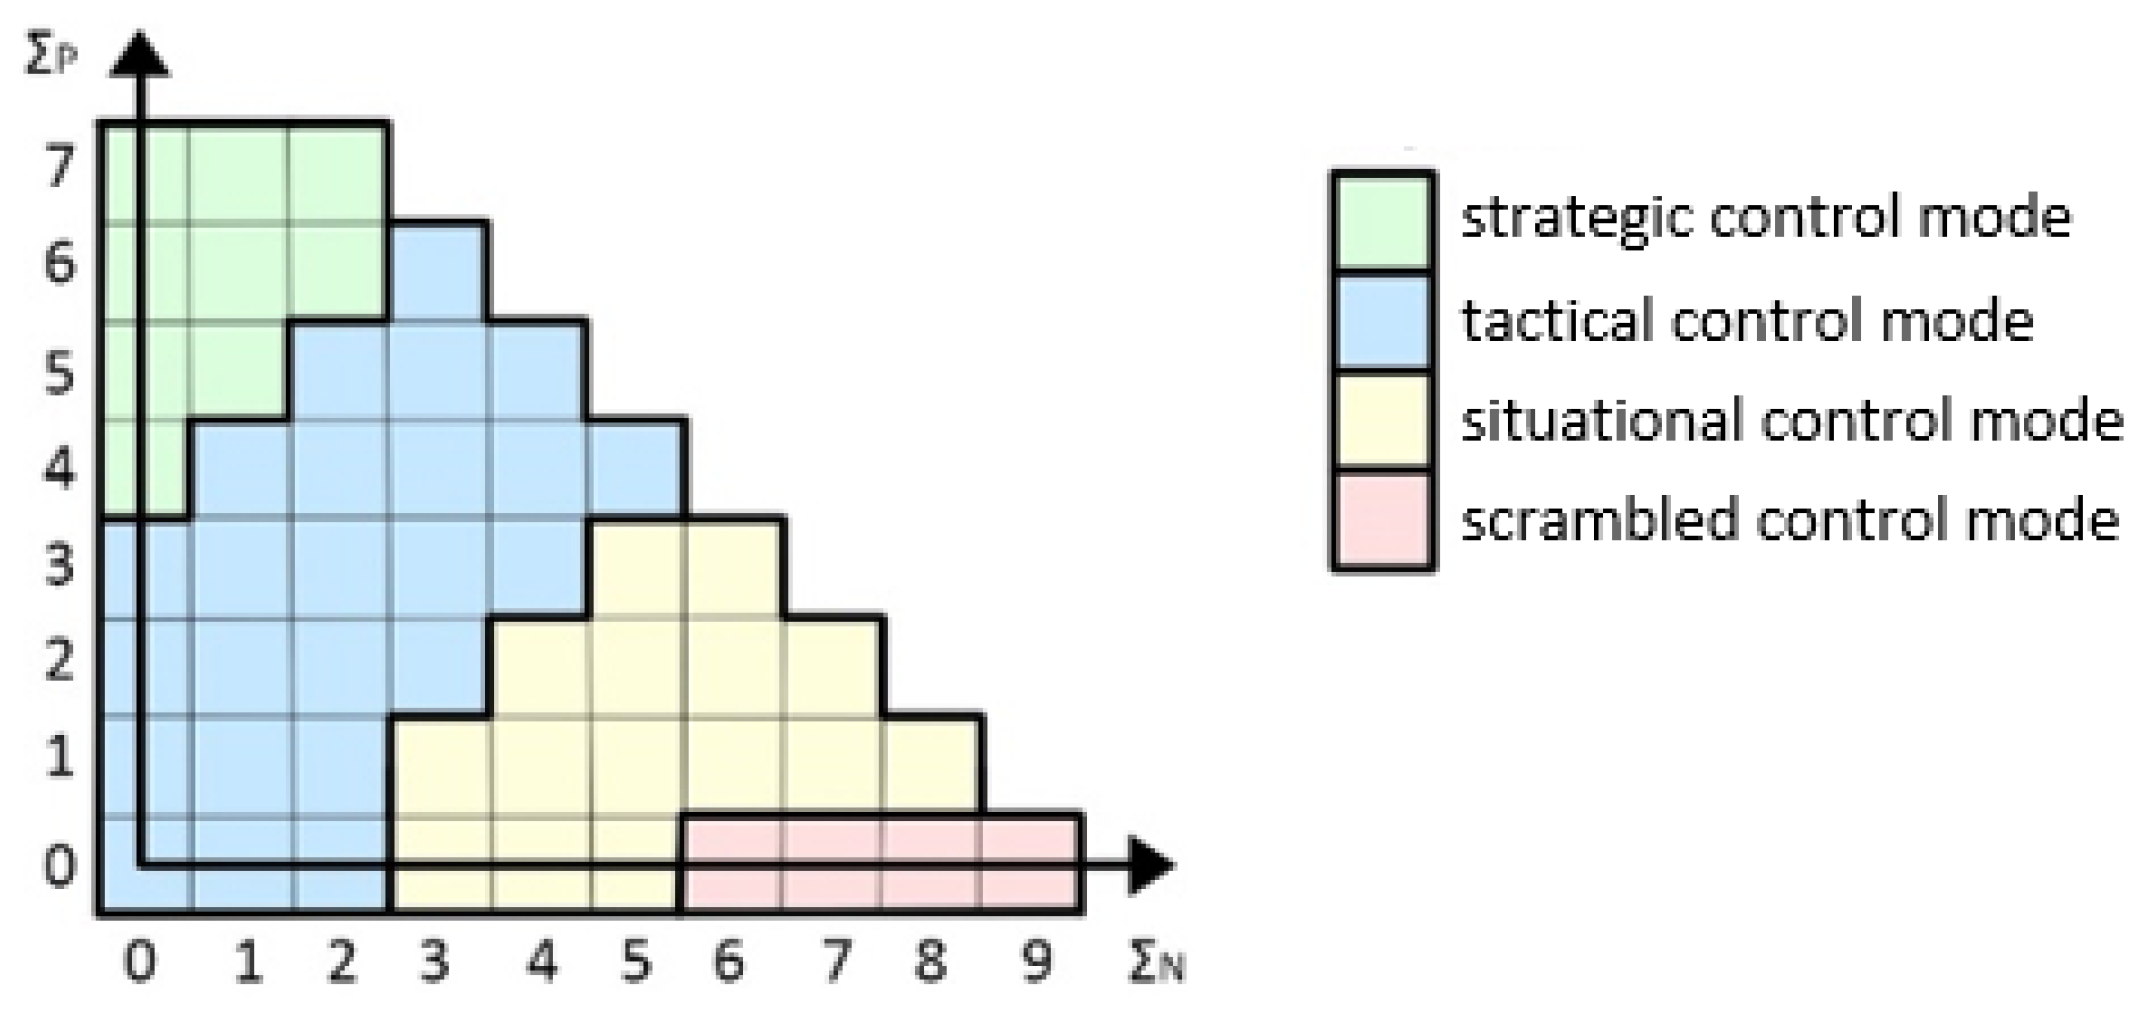
2.3. Use of Bayesian Networks in CREAM

The Bayesian network is used to graphically present a probabilistic model for a group of random variables and the relationships between them [32]. It has many applications, including: in medicine, genetics, statistics, economics, and environmental engineering [33,34,35]. A Bayesian network is a pair (D, P), where D is a directed acyclic graph and P is a probability distribution. The network is composed of nodes representing random variables and directed arcs representing relationships between subsequent variables [32]. If the variable Xj has an influence on the variable Xi, there is an arc illustrating this relationship coming from the node Xj and entering the node Xi. Node Xi is then called the “parent” of node Xj. Each node in the network stores a probability distribution P(Xi|Xπ(i)) where Xπ(i) is the set of nodes corresponding to π(i) parents of node i [32]. The conditional probability values stored at each node, form a table of conditional probabilities.
The probability distribution of all random variables in the network is described by the equation [32,36]:
P X 1 , , X n = i = 1 n P ( X i | X π ( i ) )
Probability values for individual variables can be determined using the inference by enumeration method [32,36]. Let us assume that among the studied variables, we distinguish the variable Q, dependent on the variables E1, E2, …, Ek and the remaining variables H1, H2, …, Hr. Joint probability for variables Q and E1, E2, …, En is described by the formula [32,36]:
P Q , E 1 , E 2 , , E k = h 1 h r P ( Q , H 1 H 2 , , H r , E 1 , E 2 , , E k )
The works of Zhou et al. [25] and Jin et al. [22] present the possibility of using Bayesian networks in the CREAM method. The essence of the CREAM method is to determine the operator’s control mode during the work and then the value of Human Error Probability. This value varies depending on the given circumstances, which are described by CPC factors. The relationship between CPC factors and control mode can be represented using a Bayesian network. Due to the fact that 7 CPC factors have 3 impact effects on operator reliability, and the remaining 2 factors have 2 impact effects, so for the entire set there are 37 × 22 = 8748 different combinations of CPC factor evaluation. For each combination, as shown in Figure 1, an appropriate control mode is assigned. By using a Bayesian network, it is possible to determine the probability distribution of the control mode for each combination. To reduce the complexity of calculations, CPC factors have been divided into three categories: organizational factors, environmental factors, and work-related factors [22,25]. Figure 4 shows a Bayesian network that can be used to determine the probability distribution for control modes. The first layer in the network is the fuzzified survey score of CPC factors, which are input data for the presented network. The second layer aims to simplify the calculations by dividing the CPC factors into groups:
  • organizational factors–include training, experience, and skills of operators, organization, planning, supervision of work processes, enterprise administration, etc.,
  • environmental factors–related to the work environment, e.g., lighting, noise, vibration, temperature, air humidity, ergonomics of the workplace,
  • work-related factors–refer to the work process, e.g., length of shift, number of tasks to be performed simultaneously, characteristics of the task, and the stressful nature of the task.
The last layer allows you to determine the probability distribution for the control mode, as the output values for the analyzed network.
Figure 4. Bayesian network proposed for the determination of the control mode probability distribution.
Water 16 02399 g004
The relationships between individual nodes in the Bayesian network presented in Figure 4 are as follows: π(X13) = (X10,X11,X12), π(X12) = (X4, X5, X6), π(X11) = (X2, X3, X7), π(X10) = (X1, X8, X9), π(X1) = ( ), π(X2) = ( ), π(X3) = ( ), π(X4) = ( ), π(X5) = ( ), π(X6) = ( ), π(X7) = ( ), π(X8) = ( ), π(X9) = ( ). The probability value at each node is described by Equations (14)–(17).
P X 10 , X 1 , X 8 , X 9 = X 1 X 8 X 9 P ( X 10 | X 1 , X 8 , X 9 ) · P ( X 1 ) · P ( X 8 ) · P ( X 9 )
P X 11 , X 2 , X 3 , X 7 = X 2 X 3 X 7 P ( X 11 | X 2 , X 3 , X 7 ) · P ( X 2 ) · P ( X 3 ) · P ( X 7 )
P X 12 , X 4 , X 5 , X 6 = X 4 X 5 X 6 P ( X 12 | X 4 , X 5 , X 6 ) · P ( X 4 ) · P ( X 5 ) · P ( X 6 )
P X 13 , X 10 , X 11 , X 12 = X 10 X 11 X 12 P ( X 13 | X 10 , X 11 , X 12 ) · P ( X 10 ) · P ( X 11 ) · P ( X 12 )
The dependencies presented are based on probability theory and may be difficult to calculate due to their complexity. There are computer programs designed to perform such calculations for Bayesian networks. In this paper, the GeNIe 3.0 program from BayesFusion, LLC (Pittsburgh, PA, USA) [37] was used to perform calculations for the Bayesian network presented in Figure 4.
The probability distribution for the operator control mode obtained in the final node should be defuzzified using the COG method to obtain a crisp value (CV) from the fuzzy form, in accordance with Equation (11). Based on Figure 3, the value of the Human Error Probability (HEP) should be calculated from the equation [22,25]:
H E P = 10 C V

2.4. Research Object

The research object was a group of water treatment plant operators, including 38 operators working in 12 water treatment plants located in south-eastern Poland. For the research, persons working as operators were qualified, whose task was to control the operation of technological objects and supervise the operation of the water treatment plants using available means (SCADA system, manual or local control of technological objects). HRA was carried out for 6 scenarios covering the operator’s work in individual subsystems, i.e., the water intake subsystem, the water treatment subsystem (separately for technological processes of coagulation, filtration, and disinfection), the water storage subsystem, and the water pumping subsystem. Operators were subjected to surveys in which they assessed individual CPC factors on a scale of 0–100. A survey form is presented in Table 4.
Tables S1 and S2 in the Supplementary Materials present the collective results of the survey carried out within the group of tested operators for the 6 analyzed scenarios.
To summarize the methodological approach, Figure 5 presents the individual stages of operator reliability analysis using the Fuzzy-Bayes CREAM method.

3. Results

In order to illustrate the reasoning, the sequence of calculations is presented with the example of one operator for the water filtration process. Table 5 presents the survey score for CPC factors assessment for operator O1 in the water filtration process and their form after the fuzzification process in accordance with Equations (2)–(4) and Figure 2. The fuzzy values were then entered into BayesFusion GeNIe 3.0 software, and Bayesian network calculations were performed using Equations (14)–(17). The results obtained with the program present the probability distribution for the control mode in which the tested operator works. The results are presented in Figure 6. The operators survey scores of O1–O19 are shown in Table S1, the operators survey scores of O20–O38 are shown in Table S2.
The next step is to defuzzify the obtained results using the COG method to obtain the Crisp Value (CV) according to Equation (11), and then the HEP value from Equation (18).
C V = x · μ T x d x μ T x d x = = 5.3 5.266 x · x + 5.3 1.65 d x + 5.266 2.980 x · 0.020407 d x + 5.3 5.266 x + 5.3 1.65 d x + 5.266 2.980 0.020407 d x + + 2.980 2.354 x · x + 3 d x + 2.354 1.646 x · 0.646364 d x + + 2.980 2.354 x + 3 d x + 2.354 1.646 0.646364 d x + + 1.646 1.314 x · x 1 d x + 1.314 0.614 x · 0.31407 d x + + 1.646 1.314 x 1 d x + 1.314 0.614 0.31407 d x + + 0.614 0.316 x · x 0.3 d x + 0.316 0.010 x · 0.019157 + + 0.614 0.316 x 0.3 d x + 0.316 0.010 0.019157   d x + + 0.010 0 x · ( 2 x ) d x + 0.010 0 2 x   d x = 1.8481
H E P = 10 1.8481 = 0.0142
The results for the other operators and other tested scenarios are presented in Tables S3–S8 in the Supplementary Materials.
Figure 7 shows the results of the HRA analysis for the tested group of operators in the form of Human Error Probability (HEP) values for six scenarios regarding operator work in the water intake subsystem (WI SubS), water treatment subsystem in the coagulation process (WT SubS: C), water treatment subsystem in the filtration process (WT SubS: F), water treatment subsystem in the disinfection process (WT SubS: D), water pumping subsystem (WP SubS), and water storage subsystem (WS SubS).
The highest average HEP value was determined for operators in the water intake subsystem (0.0148), while the lowest average HEP value was determined in the water treatment subsystem in the disinfection process (0.0122). The highest unit HEP value was determined for the operator in the water pumping subsystem (0.0746). The lowest unit HEP value was observed for the operator in the water treatment subsystem in the coagulation process (0.0005). The obtained values, in relation to the criteria of the classic CREAM method version, classified the operators’ work in situational, tactical, and strategic control modes. The use of the Fuzzy-Bayes CREAM method allowed obtaining precise HEP values for each operator, which is necessary for using these data in further reliability analyses, e.g., with the fault tree analysis or the parametric method [4,25,38]. A detailed analysis of the obtained results is presented in the next chapter.

4. Discussion

For all processes in the water treatment subsystem, lower average HEP values are observed than in the other tested subsystems (average value of HEPWT SubS: C = 0.0132; HEPWT SubS: F = 0.0147; HEPWT SubS: D = 0.0122). The coagulation process involves removing colloids and hard-to-fall particles from water, which are responsible for the turbidity and color of the water, as a result of adding chemicals to the water. In the coagulation process, the operator’s main tasks include adjusting the doses of reagents to changes in water quality parameters as well as inspections and maintenance of devices and equipment of technological facilities [4]. In the filtration process, water is passed through a filter bed, where contaminants are removed in the form of suspension. Filter operation control consists of maintaining a constant filtration speed while increasing hydraulic pressure losses on the filter bed, determining the end of the filtration cycle, and then carrying out the procedure of rinsing the bed and putting it back into operation. In addition, the operator is also responsible for replacing the filling of the filter bed, checking the technical condition of the filter drainage, washing troughs, pipelines, and filter equipment [4]. The purpose of the disinfection process is to neutralize living and spore forms of pathogenic organisms and to protect water against secondary contamination in the water supply network. The most popular disinfectants include chlorine gas Cl2, chlorine dioxide ClO2, sodium hypochlorite, and UV radiation. Due to the use of hazardous chemicals, the operation of devices intended for water disinfection and the preparation of disinfectants must be carried out with particular care and in compliance with applicable occupational safety and health requirements. The main tasks of the operator in the disinfection process include adjusting the dose of disinfectant to the demand for chlorine, setting the power of UV radiators, and checking the technical condition of devices and technological facilities [4]. Improper operation of the water treatment subsystem poses a threat to human life and health. The operator’s work in the water treatment subsystem, due to its specificity, has the greatest impact on the reliability and safety of the water production process; therefore, operators must have high competence. In the water treatment plants where the research was carried out, operators in the water treatment subsystem had a number of facilities that allowed them to minimize errors, including an extensive control system, an operating parameter monitoring system, an alarm system, workplace instructions, and periodic operator training. The obtained results confirm the effectiveness of such activities in reducing threats resulting from erroneous human activity. In other subsystems, the HEP values are higher, which may be due to the fact that the impact of the failure of these subsystems on the reliability and safety of the water production process is smaller than the failure of the water treatment subsystem [39]. The second most important subsystem influencing the reliability and safety of water production is the water pumping subsystem, followed by the water storage subsystem, while the water intake subsystem has the smallest impact [39]. The HEP values obtained in the remaining subsystems are proof of the statement above, where the highest average HEP value (0.0148) was obtained for the water intake subsystem, while for the pumping and storage subsystems, the obtained HEP values were lower at: 0.0146 and 0.0145. The main tasks of operators in the water storage subsystem are to monitor the operation of tanks and control valves on the water supply and discharge pipes and the drainpipe in the tanks. Other operational tasks include monitoring the water level in the tank, checking water quality, checking the condition of the tank and the valve chamber (leakage control), as well as maintaining the tank (washing, disinfection) [4]. In the water pumping subsystem, the operator’s tasks include supervising the operation of pumps and their proper operation, including proper start-up and shutdown of the units, periodic tests of the efficiency of the units, and qualification of damaged or worn-out pumps for renovation or replacement [4]. The operator in the water intake subsystem is responsible for regulating the amount of water intake depending on the demand for water at a given moment, the hydrological or hydrogeological situation, or the observable threat to water quality [4]. Other operational tasks in the water intake subsystem include: for surface water intakes-observation of the lowest water levels during the year, observation of flood surges, movement of the bottom and debris, removal of coastal vegetation, protection of water against blooms, and control of the quality of the intake water; for groundwater intakes-water quality control, observation of well efficiency, observation of water table levels in the well and nearby of the intake, removal of sediments formed on the well filter, and, if necessary, renovation and desanding [4].
The differences between HEP values in individual subsystems are small, but they show the work priorities of WTP operators. The greatest threats, the effects of which are also of the greatest importance (threat to the health and life of the consumer), concern the operator’s work in the water treatment subsystem. Maintaining the appropriate quality of treated water that meets quality standards is the most important task of WTP operators and requires the greatest level of skills and concentration when performing their work. The operation of the remaining subsystems, including the water intake subsystem, water pumping subsystem, and water storage subsystem, is more related to ensuring the appropriate amount of water supplied to consumers. Their operation seems to be more resistant to human errors from the technical side (e.g., the existence of reserve water intakes; raw water ponds; backup pumps; independent treated water tanks). Therefore, the work of operators in these subsystems is associated with less responsibility than in the water treatment subsystem, which is confirmed by the results obtained.

5. Conclusions

The water production process is an extensive process; it includes the operator’s work in the water intake subsystem, water treatment subsystem, water pumping subsystem, and water storage subsystem. It is a key process to ensure the security and reliability of water supplies to consumers, both in terms of quantity and quality. For this reason, reliability and safety analyses for WSS are essential tools for maintaining the appropriate level of quality of water supply services. The paper presents the results of HRA research for a group of 38 operators working in 12 water treatment plants located in south-eastern Poland. The analysis was performed using the Fuzzy-Bayes CREAM method. The obtained results present the probability of making an error by the operator (HEP value) while working in the water production process, with the division of the operator’s work into individual subsystems. The analysis allowed the following conclusions to be formulated:
  • The probability of making an error by the WTP operator varies in the range of 0.0005–0.0746 depending on the analyzed subsystem.
  • The lowest average probability of making an error by the WTP operator occurs for the water treatment subsystem in the disinfection process (HEP WTSubS: D = 0.0122).
  • Due to the nature of the operator’s work in the water treatment subsystem, where chemicals are used in the water treatment process and precise technological processes are performed, the operator is required to have high competence and care for the correct execution of tasks. The failure of this subsystem is mainly related to maintaining appropriate water quality and may pose a threat to the health or life of water consumers.
  • The highest average probability of making an error by the WTP operator occurs for the water intake subsystem (HEP WISubS = 0.0148).
  • Failures of the water intake, water pumping, or water storage subsystems are mainly related to maintaining the supply of an appropriate amount of water and may pose a threat to the continuity of its supply or maintaining appropriate hydraulic parameters of the network operation.
The obtained results allow taking into account the impact of the human factor on the operation of WTP and WSS, which has been ignored so far due to a lack of probability data. On their basis, reliability analyses, including the influence of human factors on the WSS, can be carried out in the future. Taking into account the influence of the human factor in the form of the system operator will allow for a better representation of the actual conditions of operation of the anthropotechnical system, such as WSS, which is also a critical infrastructure system.

Supplementary Materials

The following supporting information can be downloaded at: https://www.mdpi.com/article/10.3390/w16172399/s1, Table S1: O1–O19 operators survey scores; Table S2: O20–O38 operators survey scores; Table S3: Results of HEP calculations in the water intake subsystem (WI SubS); Table S4: Results of HEP calculations in the water treatment subsystem in the coagulation process (WT SubS: C); Table S5: Results of HEP calculations in the water treatment subsystem in the filtration process (WT SubS: F); Table S6: Results of HEP calculations in the water treatment subsystem in the disinfection process (WT SubS: D); Table S7: Results of HEP calculations in the water pumping subsystem (WP SubS); Table S8: Results of HEP calculations in the water storage subsystem (WS SubS).

Author Contributions

Conceptualization J.Ż. and B.T.-C.; data curation J.Ż.; formal analysis J.Ż.; methodology J.Ż. and K.S.; resources J.Ż.; supervision, B.T.-C.; writing—original draft preparation, J.Ż., B.T.-C. and K.S.; visualization, J.Ż. and K.S.; writing—review and editing, J.Ż. and B.T.-C. All authors have read and agreed to the published version of the manuscript.

Funding

This research received no external funding.

Data Availability Statement

The original contributions presented in the study are included in the Supplementary Materials, further inquiries can be directed to the corresponding author.

Conflicts of Interest

The authors declare no conflicts of interest.

References

  1. Liu, W.; Song, Z. Review of studies on the resilience of urban critical infrastructure networks. Reliab. Eng. Syst. Saf. 2020, 193, 106617. [Google Scholar] [CrossRef]
  2. French, S.; Bedford, T.; Pollard, S.J.T.; Soane, E. Human reliability analysis: A critique and review for managers. Saf. Sci. 2011, 49, 753–763. [Google Scholar] [CrossRef]
  3. Zheng, X.; Bolton, M.L.; Daly, C.; Biltekoff, E. The development of a next-generation human reliability analysis: Systems analysis for formal pharmaceutical human reliability (SAFPH). Reliab. Eng. Syst. Saf. 2020, 202, 106927. [Google Scholar] [CrossRef]
  4. Żywiec, J.; Tchórzewska-Cieślak, B.; Rak, J. Safety of the Water Supply System from the System Operator Perspective. In Lecture Notes in Civil Engineering, Proceedings of the 18th International Conference Current Issues of Civil and Environmental Engineering Lviv—Košice—Rzeszów, CEE 2023, Rzeszów, Poland, 6–8 September 2023; Springer Nature: Cham, Switzerland, 2024; Volume 438, pp. 551–561. [Google Scholar] [CrossRef]
  5. Wu, S.; Hrudey, S.; French, S.; Bedford, T.; Soane, E.; Pollard, S. A role for human reliability analysis (HRA) in preventing drinking water incidents and securing safe drinking water. Water Res. 2009, 43, 3227–3238. [Google Scholar] [CrossRef]
  6. Tang, Y.; Wu, S.; Miao, X.; Pollard, S.J.T.; Hrudey, S.E. Resilience to evolving drinking water contamination risks: A human error prevention perspective. J. Clean. Prod. 2013, 57, 228–237. [Google Scholar] [CrossRef]
  7. Dhillon, B.S. Human Reliability: With Human Factors; Elsevier: Oxford, UK, 1986. [Google Scholar]
  8. De Felice, F.; Petrillo, A. Human Factors and Reliability Engineering for Safety and Security. In Critical Infrastructures—Decision Making, Theory, and Practice; De Felice, F., Ed.; Springer International Publishing: Cham, Switzerland, 2018. [Google Scholar] [CrossRef]
  9. Dsouza, N.; Lu, L. A Literature Review on Human Reliability Analysis Techniques Applied for Probabilistic Risk Assessment in the Nuclear Industry. Adv. Intell. Syst. Comput. 2017, 495, 41–54. [Google Scholar] [CrossRef]
  10. Tao, J.; Qiu, D.; Yang, F.; Duan, Z. A bibliometric analysis of human reliability research. J. Clean. Prod. 2020, 260, 121041. [Google Scholar] [CrossRef]
  11. Williams, J.C. A data-based method for assessing and reducing human error to improve operational performance. In Proceedings of the IEEE Fourth Conference on Human Factors and Power Plants, Monterey, CA, USA, 5–9 June 1988; IEEE: New York, NY, USA, 1988. [Google Scholar] [CrossRef]
  12. Bello, G.C.; Colombari, V. The human factors in risk analyses of process plants: The control room operator model ‘TESEO’. Reliab. Eng. Syst. Saf. 1980, 1, 3–14. [Google Scholar] [CrossRef]
  13. US Nuclear Regulatory Commission. NUREG-1624: Technical Basis and Implementation Guidelines for a Technique for Human Event Analysis (ATHEANA); US Nuclear Regulatory Commission: Washington, DC, USA, 2000.
  14. Hollnagel, E. Cognitive Reliability and Error Analysis Method (CREAM); Elsevier Science: Amsterdam, The Netherlands, 1998. [Google Scholar] [CrossRef]
  15. Kirwan, B.; Gibson, H. CARA: A Human Reliability Assessment Tool for Air Traffic Safety Management—Technical Basis and Preliminary Architecture. In Safety of Systems, Proceedings of the 15th Safety-Critical Systems Symposium, Bristol, UK, 13–15 February 2007; Springer: London, UK, 2007. [Google Scholar] [CrossRef]
  16. Tu, J.; Lin, W.; Lin, Y. A Bayes-SLIM based methodology for human reliability analysis of lifting operations. Int. J. Ind. Ergon. 2015, 45, 48–54. [Google Scholar] [CrossRef]
  17. Li, D.; Li, L. Preliminary Study of Human Factor Reliability in Hydropower Station. Adv. Mat. Res. 2011, 422, 803–806. [Google Scholar] [CrossRef]
  18. Tavakoli, M.; Nafar, M. Modification of the FFTA method for calculating and analyzing the human reliability of maintenance groups in power transmission grids. Int. J. Syst. Assur. Eng. Manag. 2021, 12, 1221–1234. [Google Scholar] [CrossRef]
  19. Borgheipour, H.; Mohammadfam, I.; Narenji, M.A. Assessing and Comparing Human Errors in Technical operations in Petroleum Wells using Extended CREAM Technique. J. Occup. Hyg. 2017, 9, 132–141. [Google Scholar]
  20. Wang, X.; Zhang, W.; Pan, X.; Liu, T. Method for Crew Human Reliability Analysis Based on CREAM. In Advances in Human Error, Reliability, Resilience and Performance; Springer: Cham, Switzerland, 2019; pp. 225–234. [Google Scholar] [CrossRef]
  21. Guo, Y.; Sun, Y.; Yang, X.; Wang, Z. Flight Safety Assessment Based on a Modified Human Reliability Quantification Method. Int. J. Aerosp. Eng. 2019, 2019, 2812173. [Google Scholar] [CrossRef]
  22. Jin, J.; Li, K.; Yuan, L. A Fuzzy and Bayesian Network CREAM Model for Human Error Probability Quantification of the ATO System. In Proceedings of the 4th International Conference on Electrical and Information Technologies for Rail Transportation (EITRT), Qingdao, China, 25–27 October 2019; Springer: Singapore, 2020; pp. 567–576. [Google Scholar] [CrossRef]
  23. Akyuz, E.; Celik, E. A modified human reliability analysis for cargo operation in single point mooring (SPM) off-shore units. Appl. Ocean Res. 2016, 58, 11–20. [Google Scholar] [CrossRef]
  24. Sezer, S.I.; Akyuz, E.; Arslan, O. An extended HEART Dempster–Shafer evidence theory approach to assess human reliability for the gas freeing process on chemical tankers. Reliab. Eng. Syst. Saf. 2022, 220, 108275. [Google Scholar] [CrossRef]
  25. Zhou, Q.; Wong, Y.D.; Loh, H.S.; Yuen, K.F. A fuzzy and Bayesian network CREAM model for human reliability analysis—The case of tanker shipping. Saf. Sci. 2018, 105, 149–157. [Google Scholar] [CrossRef]
  26. He, C.; Söffker, D. Human reliability analysis in situated driving context considering human experience using a fuzzy-based clustering approach. In Proceedings of the 2021 IEEE 2nd International Conference on Human-Machine Systems (ICHMS), Magdeburg, Germany, 8–10 September 2021; IEEE: New York, NY, USA, 2021; pp. 1–6. [Google Scholar] [CrossRef]
  27. Lin, Q.L.; Wang, D.J.; Lin, W.G.; Liu, H.C. Human reliability assessment for medical devices based on failure mode and effects analysis and fuzzy linguistic theory. Saf. Sci. 2014, 62, 248–256. [Google Scholar] [CrossRef]
  28. Zadeh, L.A. Fuzzy sets. Inf. Control 1965, 8, 338–353. [Google Scholar] [CrossRef]
  29. Kluska, J. Analytical Methods in Fuzzy Modeling and Control; Springer: Berlin/Heidelberg, Germany, 2009. [Google Scholar] [CrossRef]
  30. Zimmermann, H.J. Fuzzy Set Theory—And Its Applications; Springer: Dordrecht, The Netherlands, 2001. [Google Scholar] [CrossRef]
  31. Dubois, D.; Prade, H. Fuzzy Sets and Systems: Theory and Applications; Academic Press: Cambridge, MA, USA, 1980. [Google Scholar]
  32. Jensen, F.V. An Introduction to Bayesian Networks; UCL Press Ltd.: London, UK, 1996. [Google Scholar]
  33. Habier, D.; Fernando, R.L.; Kizilkaya, K.; Garrick, D.J. Extension of the bayesian alphabet for genomic selection. BMC Bioinform. 2011, 12, 186. [Google Scholar] [CrossRef]
  34. Nistal-Nuño, B. Tutorial of the probabilistic methods Bayesian networks and influence diagrams applied to medicine. J. Evid.-Based Med. 2018, 11, 112–124. [Google Scholar] [CrossRef]
  35. Tchórzewska-Cieślak, B.; Rak, J.; Szpak, D. Bayesian Inference in the Analysis of the Failure Risk of the Water Supply Network. J. KONBiN 2019, 49, 433–450. [Google Scholar] [CrossRef]
  36. Bishop, C. Pattern Recognition and Machine Learning; Springer: Singapore, 2006. [Google Scholar]
  37. BayesFusion. Genie 3.0 Software. 2020. Available online: https://bayesfusion.com/2020/08/26/genie-3-0-released/ (accessed on 10 December 2023).
  38. Boryczko, K.; Szpak, D.; Żywiec, J.; Tchórzewska-Cieślak, B. The Use of a Fault Tree Analysis (FTA) in the Operator Reliability Assessment of the Critical Infrastructure on the Example of Water Supply System. Energies 2022, 15, 4416. [Google Scholar] [CrossRef]
  39. Żywiec, J.; Tchórzewska-Cieślak, B. Analysis of the impact of failures related to the operator’s actions on the functioning of the collective water supply system. In Problems of Reliability of Technical Systems: Theory and Applications; Oficyna Wydawnicza Politechniki Warszawskiej: Warsaw, Poland, 2021. (In Polish) [Google Scholar]
Figure 1. Control mode model [14].
Water 16 02399 g001
Figure 2. Membership function for the CPC factor rating scale: (A) three-level rating scale; (B) two-level rating scale (based on [22,25]).
Water 16 02399 g002
Figure 3. Membership function for control modes (based on [22,25]).
Water 16 02399 g003
Figure 5. Stages of HRA analysis using the Fuzzy-Bayes CREAM method.
Water 16 02399 g005
Figure 6. Graph of the probability distribution for the control mode of operator O1 for the water filtration process.
Water 16 02399 g006
Figure 7. HEP values for the tested scenarios.
Water 16 02399 g007
Table 1. Human control modes and their probability [14].
Control ModeDescriptionHEP Value
Scrambled (SC)This mode characterizes situations in which the operator devotes little attention to the planning of subsequent actions or does not plan them at all. He takes action in a random, unplanned way. Most often, it concerns an unknown situation, when the operator loses the ability to think logically, does not analyze the possible solutions and effects of his actions.10−1 < P < 1
Situational (ST)The operator takes further actions based on the current state of the system, ignoring the achievement of the main task objective. Most often, this applies to situations in which there are time constraints, or the operator is unable to properly interpret the current state of the system.1 × 10−2 < P < 5 × 10⁻¹
Tactical (TT)The operator takes subsequent actions according to procedures or plans known to him. In the event of an unknown situation, the next action is taken after analyzing the operating parameters of the system and the context of the situation. It is based on familiar patterns of action.1 × 10−3 < P < 1 × 10⁻¹
Strategic (SR)The operator takes actions in a thoughtful and planned manner, knowing their consequences. His actions are directed toward achieving the main goal of the task. The operator relies on his knowledge and experience.5 × 10−6 < P < 1 × 10⁻²
Table 2. Modification of CPC factors.
No.CPC NameCPC LevelEffectMembership Function Parameters
CPC1Adequacy of organizationadequatepositive(50, 90, 100, 100)
acceptableneutral(10, 50, 90)
inadequatenegative(0, 0, 10, 50)
CPC2Working conditionsadequatepositive(50, 90, 100, 100)
acceptableneutral(10, 50, 90)
inadequatenegative(0, 0, 10, 50)
CPC3Quality of the SCADA Systemadequatepositive(50, 90, 100, 100)
acceptableneutral(10, 50, 90)
inadequatenegative(0, 0, 10, 50)
CPC 4Availability of procedures and plansadequatepositive(50, 90, 100, 100)
acceptableneutral(10, 50, 90)
inadequatenegative(0, 0, 10, 50)
CPC 5Number of simultaneous tasksacceptableneutral(50, 90, 100, 100)
inadequatenegative(0, 0, 50, 90)
CPC 6Available timeadequatepositive(50, 90, 100, 100)
acceptableneutral(10, 50, 90)
inadequatenegative(0, 0, 10, 50)
CPC 7Time of dayacceptableneutral(50, 90, 100, 100)
inadequatenegative(0, 0, 50, 90)
CPC 8Qualifications and trainingadequatepositive(50, 90, 100, 100)
acceptableneutral(10, 50, 90)
inadequatenegative(0, 0, 10, 50)
CPC 9Team collaboration qualityadequatepositive(50, 90, 100, 100)
acceptableneutral(10, 50, 90)
inadequatenegative(0, 0, 10, 50)
Table 3. Dependence of control mode and HEP value.
Control ModeLogarithmized HEP ValueMembership Function Parameters
Scrambled (SC)0 < log10 (P) < −1(−1; −0.5; 0)
Situational (ST)−2 < log10 (P) < −0.3(−2; −1.15; −0.3)
Tactical (TT)−3 < log10 (P) < −1(−3; −2; −1)
Strategic (SR)−5.3 < log10 (P) < −2(−5.3; −3.65; −2)
Table 4. Survey questionnaire.
CPC FactorScore
Scale: 0 Inadequate, 50 Acceptable, 100 Adequate
CPC 1Adequacy of organization(answer)
CPC 2Working conditions(answer)
CPC 3Quality of the SCADA interface(answer)
CPC 4Availability of procedures and plans(answer)
CPC 5Number of simultaneous tasks(answer)
CPC 6Available time(answer)
CPC 7Time of day(answer)
CPC 8Qualifications and training(answer)
CPC 9Crew collaboration quality(answer)
Table 5. Survey score for operator O1 for the water filtration process.
CPC FactorSurvey ScoreFuzzy Values
CPC1500; 1; 0
CPC2600.25; 0.75; 0
CPC3500; 1; 0
CPC4500; 1; 0
CPC5600.25; 0,75
CPC6600.25; 0.75; 0
CPC7500; 1
CPC8700.5; 0.5; 0
CPC9600.25; 0.75; 0
Disclaimer/Publisher’s Note: The statements, opinions and data contained in all publications are solely those of the individual author(s) and contributor(s) and not of MDPI and/or the editor(s). MDPI and/or the editor(s) disclaim responsibility for any injury to people or property resulting from any ideas, methods, instructions or products referred to in the content.

