Article

The Response of NDVI to Drought at Different Temporal Scales in the Yellow River Basin from 2003 to 2020

1
College of Urban and Environmental Sciences, Northwest University, Xi’an 710127, China
2
Shaanxi Key Laboratory of Earth Surface System and Environmental Carrying Capacity, College of Urban and Environmental Sciences, Northwest University, Xi’an 710127, China
Water 2024, 16(17), 2416; https://doi.org/10.3390/w16172416
Submission received: 3 July 2024 / Revised: 22 August 2024 / Accepted: 24 August 2024 / Published: 27 August 2024

Abstract

:
Ecological protection in the Yellow River Basin (YRB) is a major strategy for China’s sustainable development. Amid global warming, droughts have occurred more frequently, severely affecting vegetation growth. Based on the Standardized Precipitation Evapotranspiration Index (SPEI) and Normalized Difference Vegetation Index (NDVI) at different time scales from 2003 to 2020, this study employed the linear trend method and the Spearman correlation coefficient method to calculate the trends and correlation coefficients of NDVI and SPEI at different scales at the pixel scale and explored the spatial distribution pattern of the sensitivity of vegetation growth in the YRB to drought. The results show that: (1) NDVI and SPEI are positively correlated in 77% of the area, negatively correlated in 9%, and are positively correlated in the arid and semi-arid areas, while negatively correlated in the humid and subhumid areas. The significant negative correlation between NDVI and drought at high altitudes may be due to the fact that Gramineae vegetation is more sensitive to drought, with heat being more affected than water. (2) Urbanization has a relatively obvious impact on the distribution of drought. Extreme drought mainly occurs in the middle and upper reaches of the Wei River; severe drought mainly occurs in the central area of the Guanzhong Plain centered on Xi’an; the central area of the Loess Plateau; and the surrounding areas of the Zhengzhou-centered Central Plains City Group. (3) The NDVI showed an upward trend from 2003 to 2020, indicating an increase in vegetation density or an expansion of vegetation coverage. From the temporal trend, SPEI decreased at a rate of −0.17/decade, indicating that the entire watershed has a drought trend on an annual scale. (4) Spring NDVI is more sensitive to the water supply provided by SPEI-1, while the positive correlation between SPEI and NDVI begins to rise in June and reaches its peak in July, then starts to decline in August. In autumn and winter, NDVI is more sensitive to 3–6-month accumulated drought. (5) From the dynamic transmission laws of different levels of positive correlation, the positive impact of the 3-month accumulated drought on NDVI is most significant, and the influence of SPEI-1 on the negative correlation between SPEI and NDVI is most significant. This paper aims to clarify the sensitivity of vegetation to different time-scale droughts, provide a basis for alleviating drought in the YRB, and promote sustainable development of ecological environmental protection. The research findings enable us to gain a profound insight into the responsiveness of vegetation growth to drought in the context of global warming and offer a valuable theoretical foundation for devising pertinent measures to alleviate stress on vegetation growth in regions prone to frequent droughts.

1. Introduction

The dependence of vegetation growth on water fully reflects the water, carbon, and energy exchange between land and atmosphere [1,2,3,4], and drought has a significant negative impact on the function of terrestrial ecosystems [5]. Extreme drought reduces the strength of terrestrial carbon sinks [6] and leads to imbalance in terrestrial ecosystems [7]. The accelerated water cycle brought by global warming is limited by soil moisture, resulting in a weak water supply in the atmosphere [8,9,10,11], and drought is intensifying in frequency, intensity, and duration, triggering drought self-propagation [12], with more vegetation growth affected by water scarcity [13]. However, whether vegetation has the ability to adapt to changes in water availability under the background of climate warming is unknown, which hinders our deep understanding of the physiological mechanisms by which drought affects vegetation [6].
The rise in global vegetation coverage and enhanced net primary productivity has led to an increased demand for water by plants [14,15], creating a positive feedback loop in ecosystem water scarcity [16,17]. This results in a mutual constraint between plant growth and water availability [18,19]. Factors such as vegetation types, sudden droughts, urban heat waves, and prolonged low water supply all play significant roles in influencing regional vegetation cover and plant growth [20,21], with drought exerting a particularly detrimental impact on ecosystems’ vegetation [22]. However, non-water-limited high-latitude regions may have beneficial effects on vegetation function within the context of climate change [23]. Therefore, studying the relationship between vegetation dynamics and drought can enhance our understanding of plant sensitivity and resilience to drought under changing conditions.
The development of drought in the Yellow River basin (YRB) is often accompanied by warm periods. Even if precipitation occurs at the same time, it is difficult to prevent the drought from causing destructive impacts on ecosystems during the plant-growing period [21]. The YRB encompasses a large area of arid and semi-arid regions as well as semi-humid areas with diverse vegetation cover, including grasslands, sandy areas, original forests, artificial forests, and construction land. Compared with grasslands and forests, arid and semi-arid areas with higher agricultural or construction coverage experience shorter drought propagation times, while drought propagation speed in forested areas is slower [24]. Research indicates that agricultural land exhibits the greatest response to drought, followed by urban and rural land; meanwhile, forests have the weakest response to the drought index due to their strong resistance and resilience [25]. Therefore, vegetation sensitivity to drought is not only related to water scarcity but also associated with vegetation type and water-heat combination in different seasons.
The seasonal dynamics and extent of dry spells play a crucial role in shaping how these events affect plant life over time [26], with winter dry spells generally lasting longer than those occurring in summer [27]. As such, investigating these phenomena across various time scales becomes essential for accurately gauging their impact on plant communities [28]. Drought-induced water scarcity places considerable stress on plants; initially, they exhibit some resistance but eventually display resilience following relief from or cessation of prolonged dry conditions [29,30], resulting in delayed responses with cumulative effects [28]. Consequently, both spatial distribution patterns as well as temporal responses vary among plant communities affected by drought, underscoring the importance of conducting detailed assessments at finer scales. The standardized precipitation evapotranspiration index (SPEI), which accounts for both precipitation levels and evaporation rates, proves highly sensitive to natural environmental fluctuations [24]; it enables assessment of varying degrees of drought severity across different time frames while highlighting accumulated impacts and delayed vegetative responses [28]. Nevertheless, there remains limited research focusing on finely-scaled evaluations assessing plant sensitivities to drought, particularly regarding dynamic responses within individual seasons.
The main objective of this study is as follows: (1) to analyze the temporal and spatial trends of SPEI and NDVI to evaluate the drought-vegetation evolution pattern of YRB from 2003 to 2020; (2) to conduct a spatial analysis of the correlation between annual scale NDVI and SPEI from 2003 to 2020 at the pixel level to elucidate the response of NDVI to SPEI at different temporal scales; and (3) to investigate the regularity of the correlation between SPEI and NDVI in space and time. Consequently, this study conducts a temporal and spatial dynamic analysis of vegetation responses across different seasons at various temporal scales. It identifies the season and month with the highest vegetation sensitivity, investigates the cumulative effect of drought and the delayed response of vegetation, and presents a research case for addressing the contradiction between regional drought and vegetation. These findings have significant implications for advancing ecological protection and promoting high-quality development in the YRB.

2. Materials and Methods
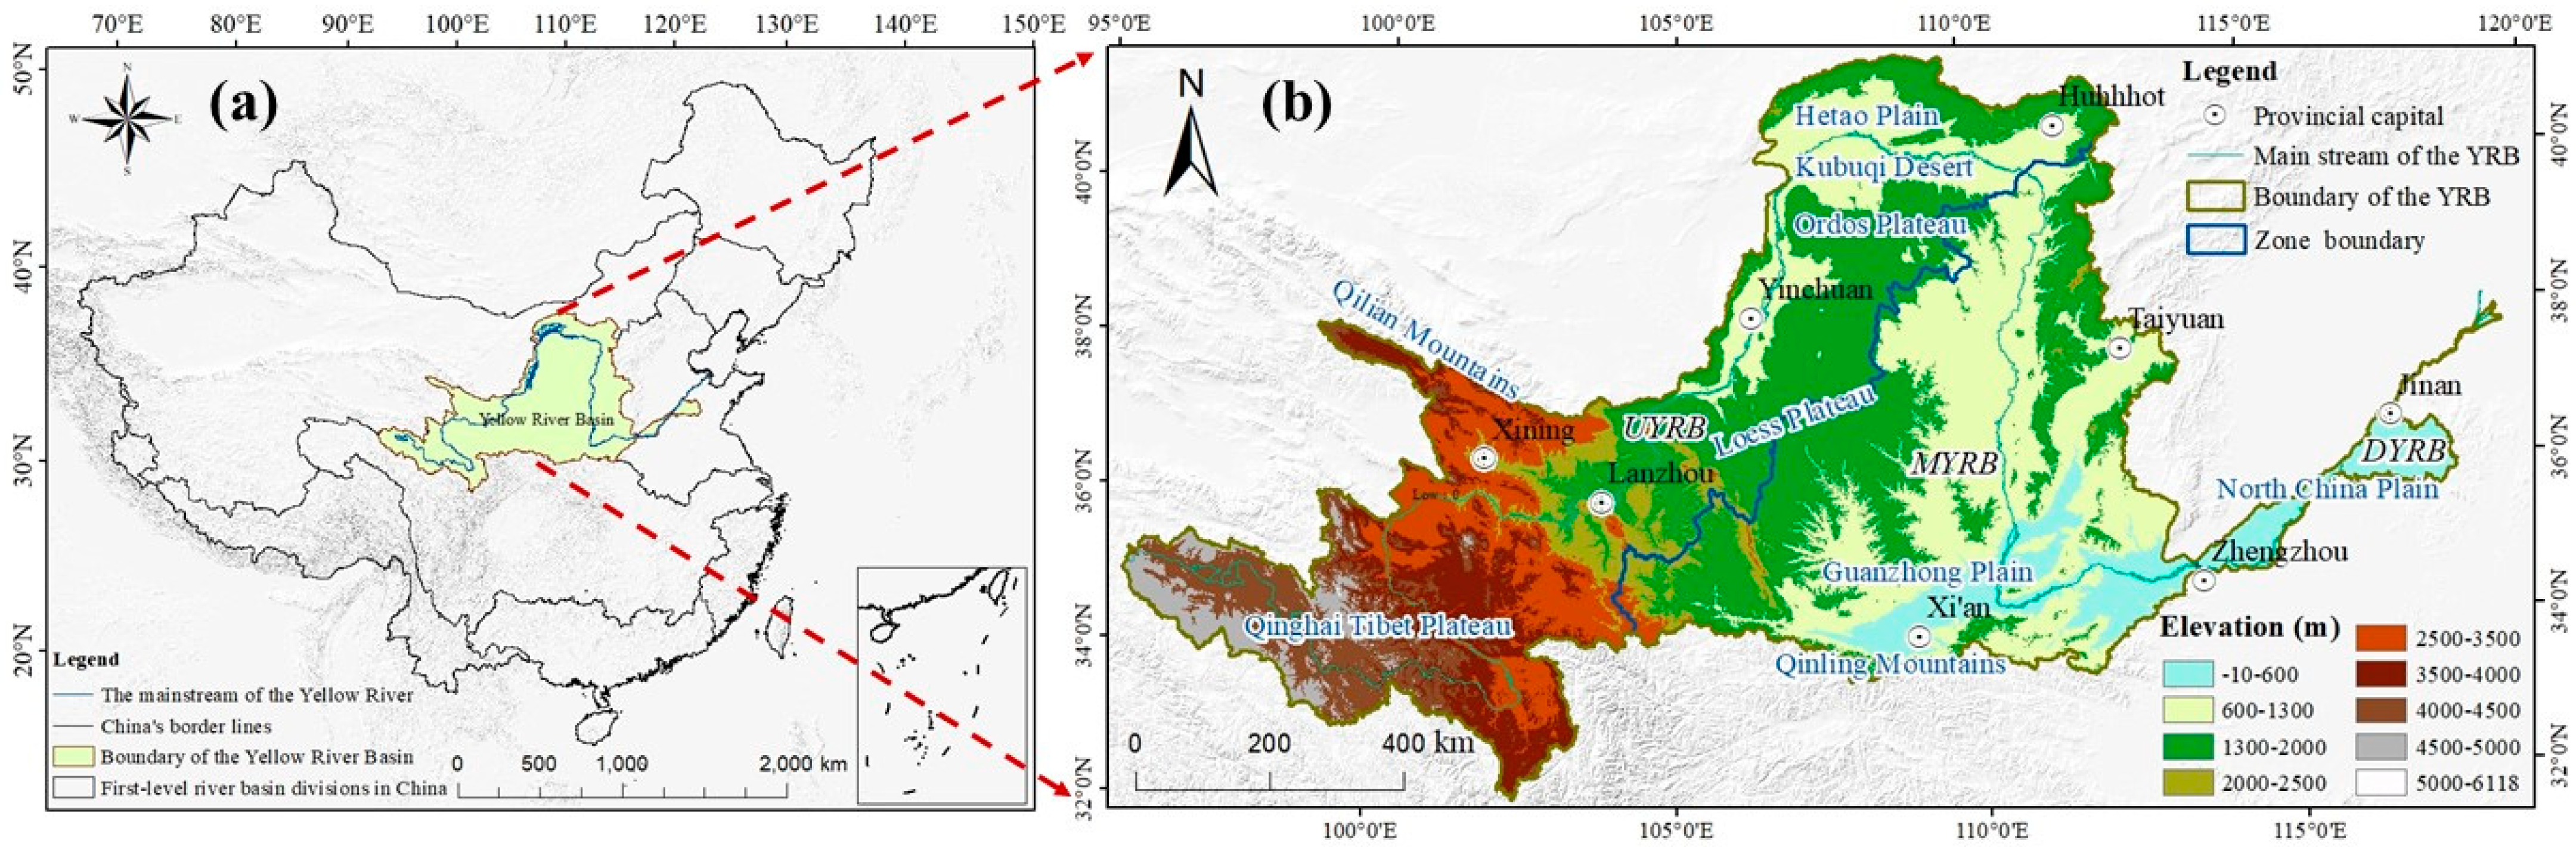
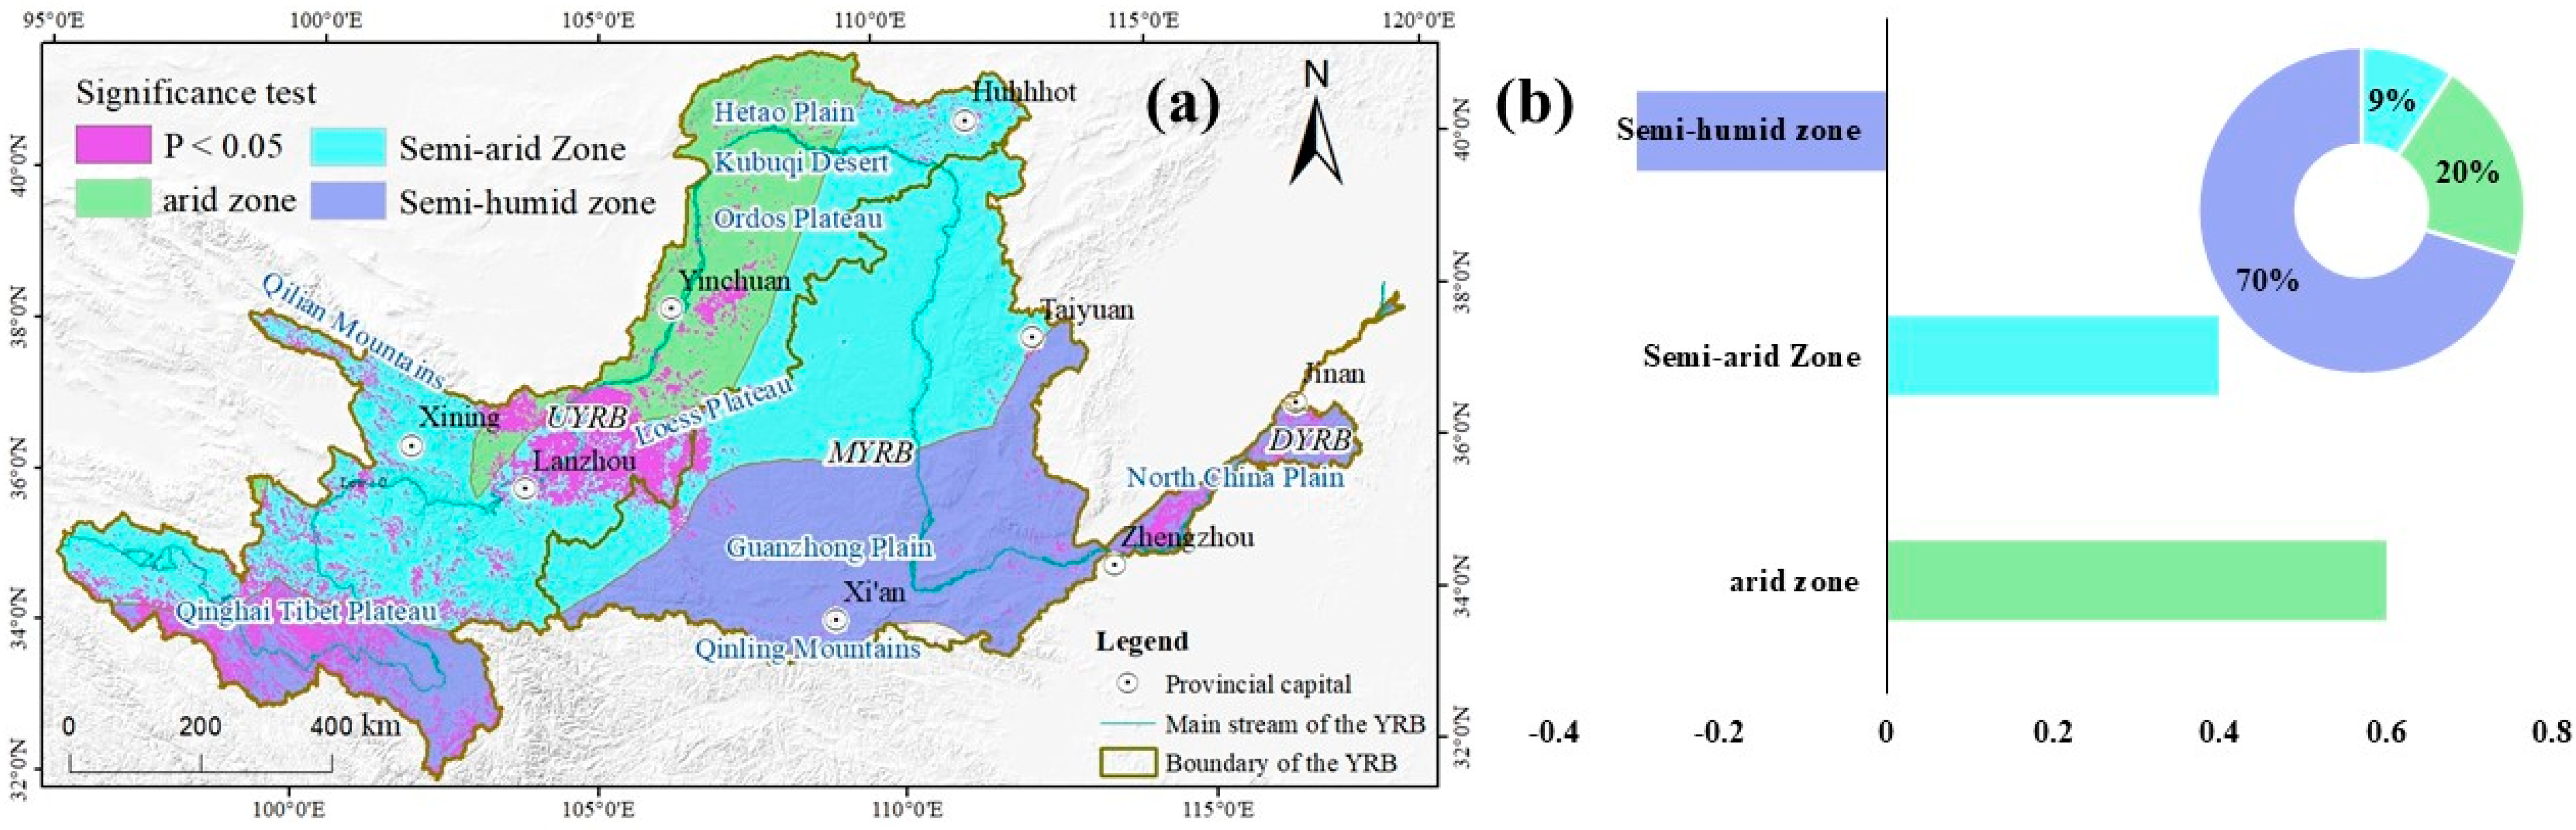
2.1. Study Area

The YRB, characterized by its west-high-east-low topography (Figure 1), is esteemed as the cradle of Chinese civilization. Originating from the lofty Qinghai-Tibet Plateau at an average elevation of 4000 m, it intricately meanders through the Inner Mongolia Plateau and the Loess Plateau at an average elevation of 1000–2000 m before gracefully descending onto the North China Plain with an average elevation of 50 m or less [31]. Finally, it merges into the Bohai Sea. Encompassing Shaanxi, Gansu, Ningxia, Qinghai, Henan, and Shanxi provinces within its embrace [32], this region boasts a diverse climate ranging from plateau to temperate zones and encompasses arid deserts as well as semi-humid areas. Notably, China’s highest annual evaporation rate exceeds 2500 mm while receiving annual precipitation between 200 and 600 mm [33]. Covering a staggering 38% of China’s land area and supporting one-third of its population, which contributes to one-quarter of China’s GDP. This basin is home to seven city clusters, including mature ones such as Guanzhong Plain and developing ones like Hohhot-Baotou-Yinchuan [34]. However, the water resources in the YRB are characterized by significant contradictions and frequent droughts, which have severely constrained local social and economic development. The proposal and implementation of a strategy for ecological protection and high-quality development in the YRB hold far-reaching significance for China’s ecological and environmental security as well as sustained high-speed economic growth.

2.2. Method and Materials

2.2.1. Data Source

The Normalized Difference Vegetation Index (NDVI) data come from the MOD13A2 product provided by NASA (https://ladsweb.modaps.eosdis.nasa.gov/, accessed on 1 December 2023), which is collected by the MODIS satellite and then stitched and projected to convert from sinusoidal projection to WGS84 projection coordinates, with a spatial resolution of 1 km, to obtain the monthly NDVI data for the YRB from 2003 to 2020.
The SPEI data are calculated based on meteorological data, which are sourced from the China Meteorological Data Sharing Network (https://www.cma.gov.cn/en/, accessed on 30 June 2021). Interpolate meteorological data to obtain gridded meteorological data, calculate the monthly scale SPEI data, and align the projection, resolution, and temporal scale of the SPEI data with the NDVI data. The SPEI classification is based on Table 1 [35,36], with the calculation method described in the references [37,38,39].

2.2.2. Linear Trend Method

The trend analysis in this paper is carried out using linear least squares regression [31]. Calculate the trends of SPEI and NDVI at a resolution of 1000 m per pixel for the period 2003–2020 to fully reflect the temporal and spatial evolution characteristics of NDVI and SPEI [40]. The calculation formula is as follows:
S l o p e = n × i = 1 n ( i × y i ) i = 1 n i i = 1 n y i n × i = 1 n i 2 ( i = 1 n i ) 2
In the formula, n represents the time series for the period 2003–2020 under study, and y i denotes the value of y at time i . S l o p e > 0 indicates an upward trend in y , while S l o p e < 0 indicates a downward trend. Perform a t-test on the trend values, and if the p-value is less than 0, the result is significant.

2.2.3. Correlation Analysis

Calculate the Pearson Correlation Coefficient (CC) between the 2003–2020 NDVI sequence and different temporal scales of SPEI to measure the correlation between vegetation and drought. Using Pearson’s CC, the relationship between SPEI and NDVI at different temporal scales can be evaluated. The higher the CC, the better the correlation between SPEI and NDVI, and it can also clarify the lag time of vegetation’s response to drought [41]. The CC classification is shown in Table 2 [42,43]. The calculation formula is as follows:
R xy = i = 1 n [ ( x i x ¯ ) ( y i y ¯ ) ] i = 1 n ( x i x ¯ ) 2 × i = 1 n ( y i y ¯ ) 2
In this equation, n represents the number of years in the time series; R xy is the CC between two influencing factors x and y , while x i and y i represent the values of x and y in the i-th year. Additionally, x ¯ and y ¯ denote the average values of these two influencing factors over n years.
The significance test for linear trend and correlation analysis is completed by a t-test. In this article, P = 0.05 is used as the dividing line. P > 0.05 is considered non-significant, while P ≤ 0.05 is considered significant. The formula for the t-test is as follows:
P = x μ / s / n
In this equation, P represents the significance value of the t-test, x is the sample mean, μ is the population mean, s is the sample standard deviation, and n is the sample size.

3. Results

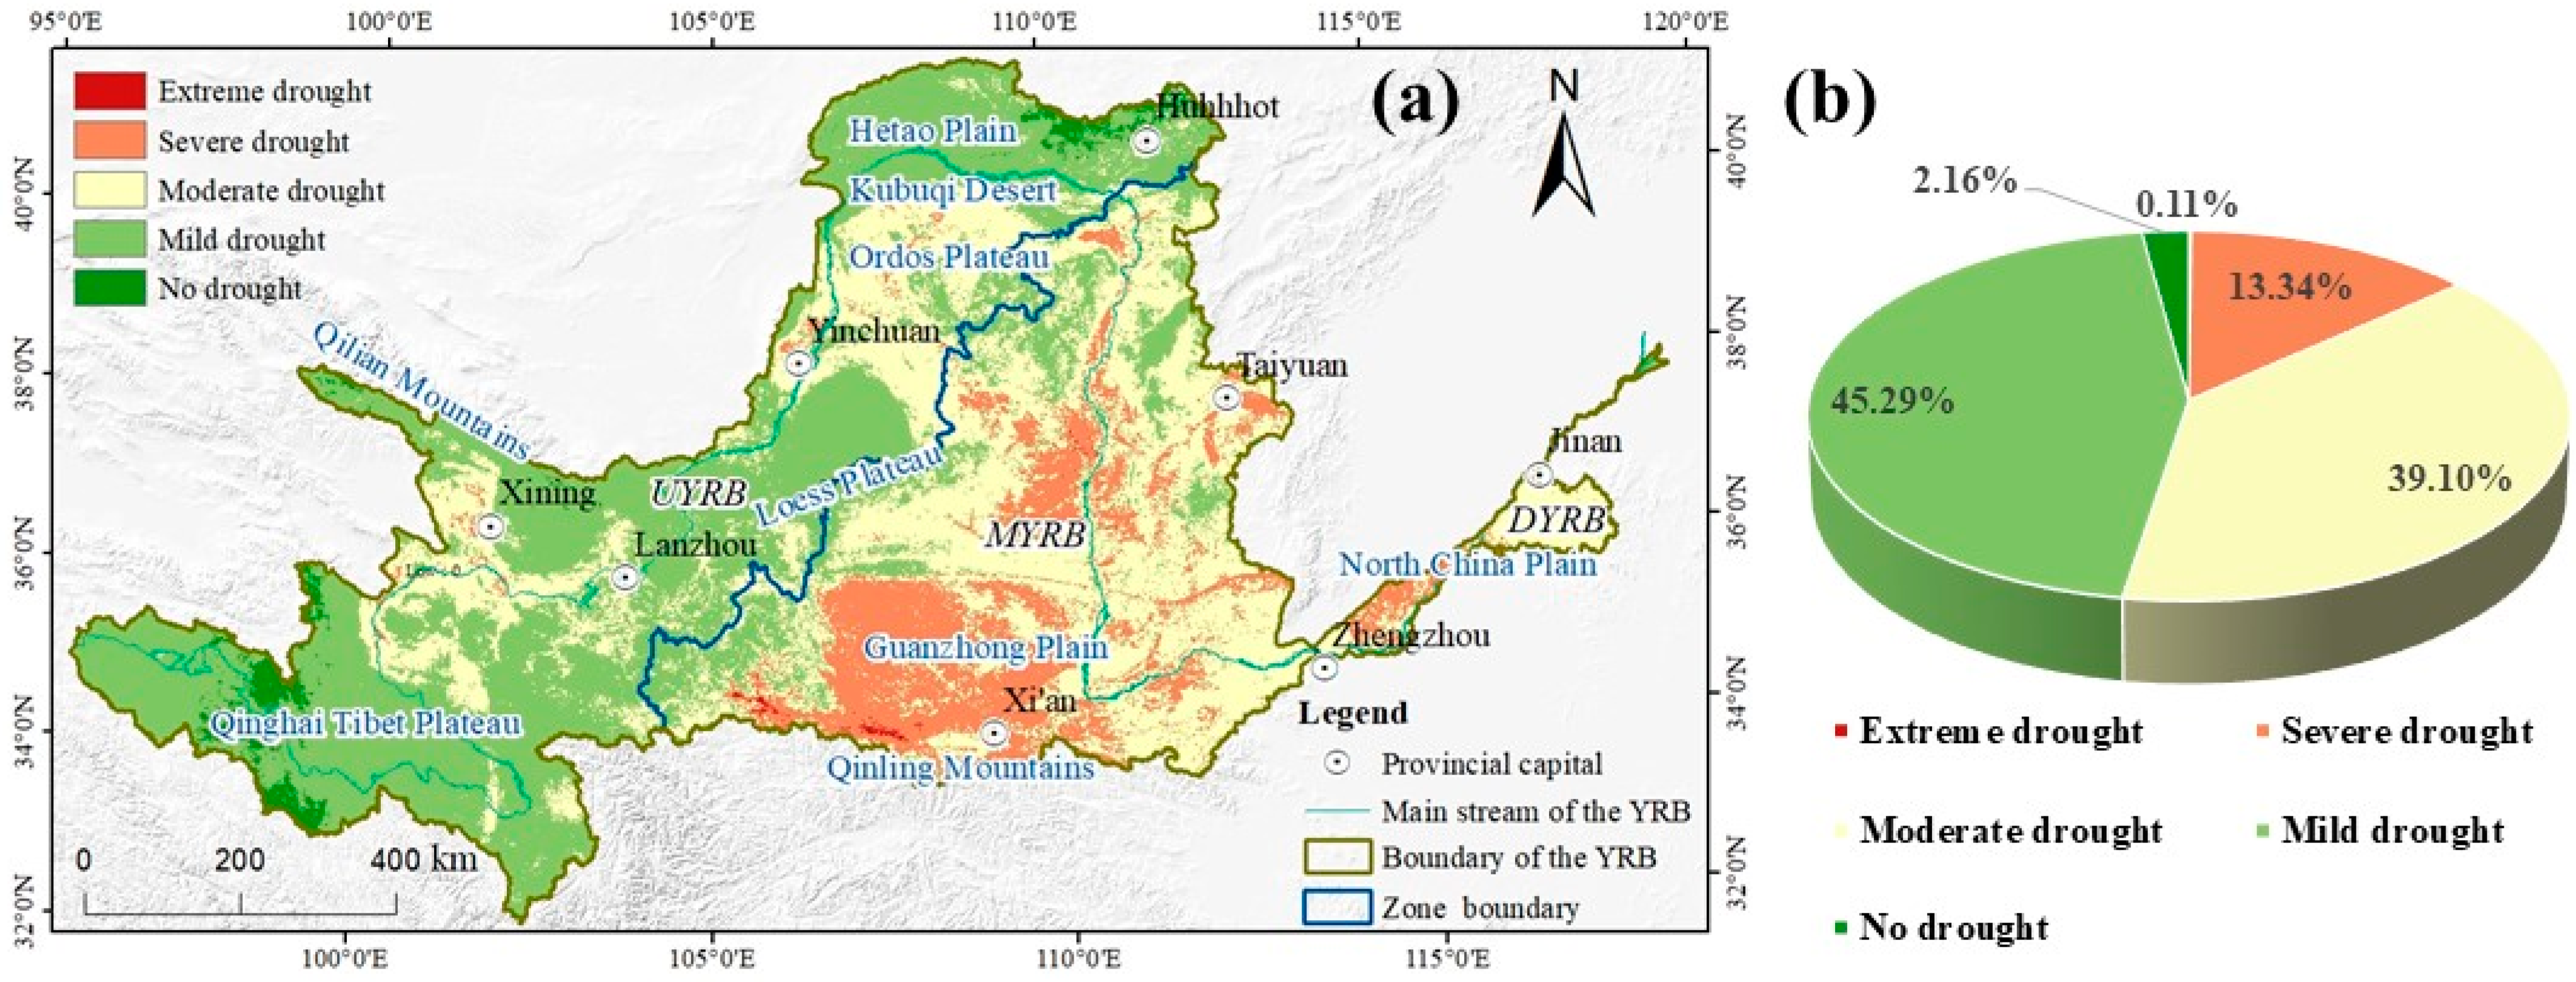
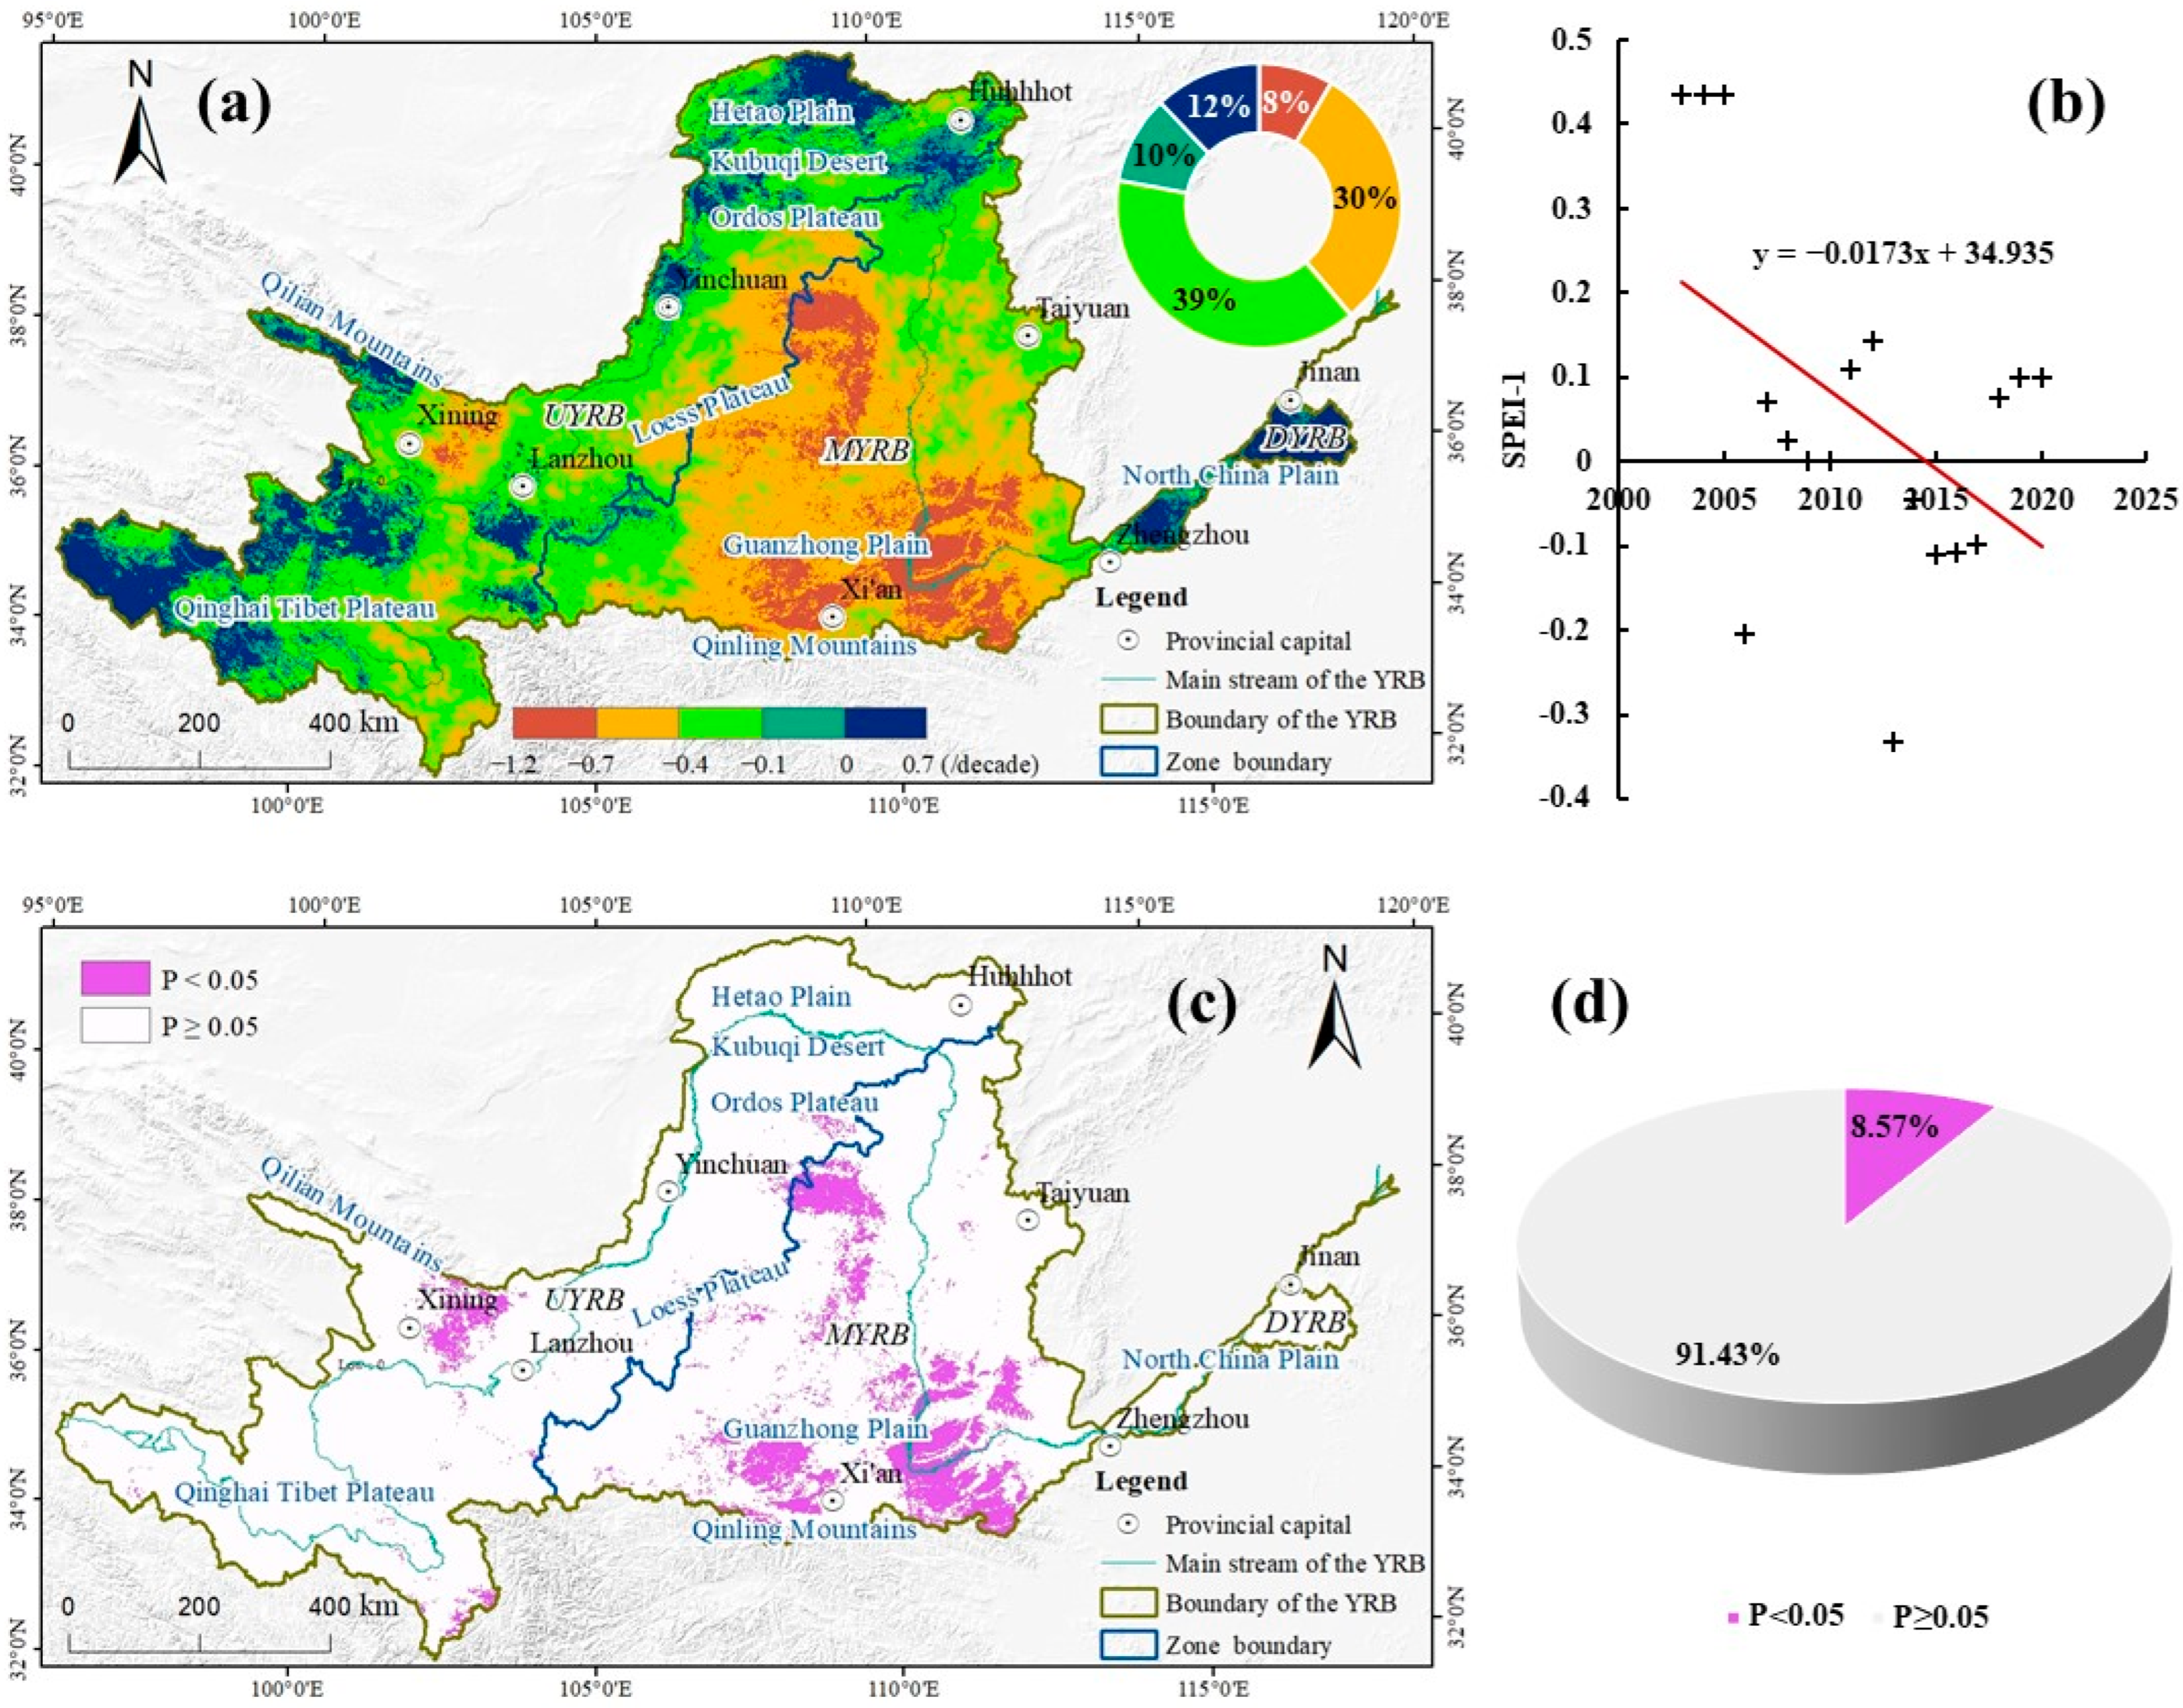
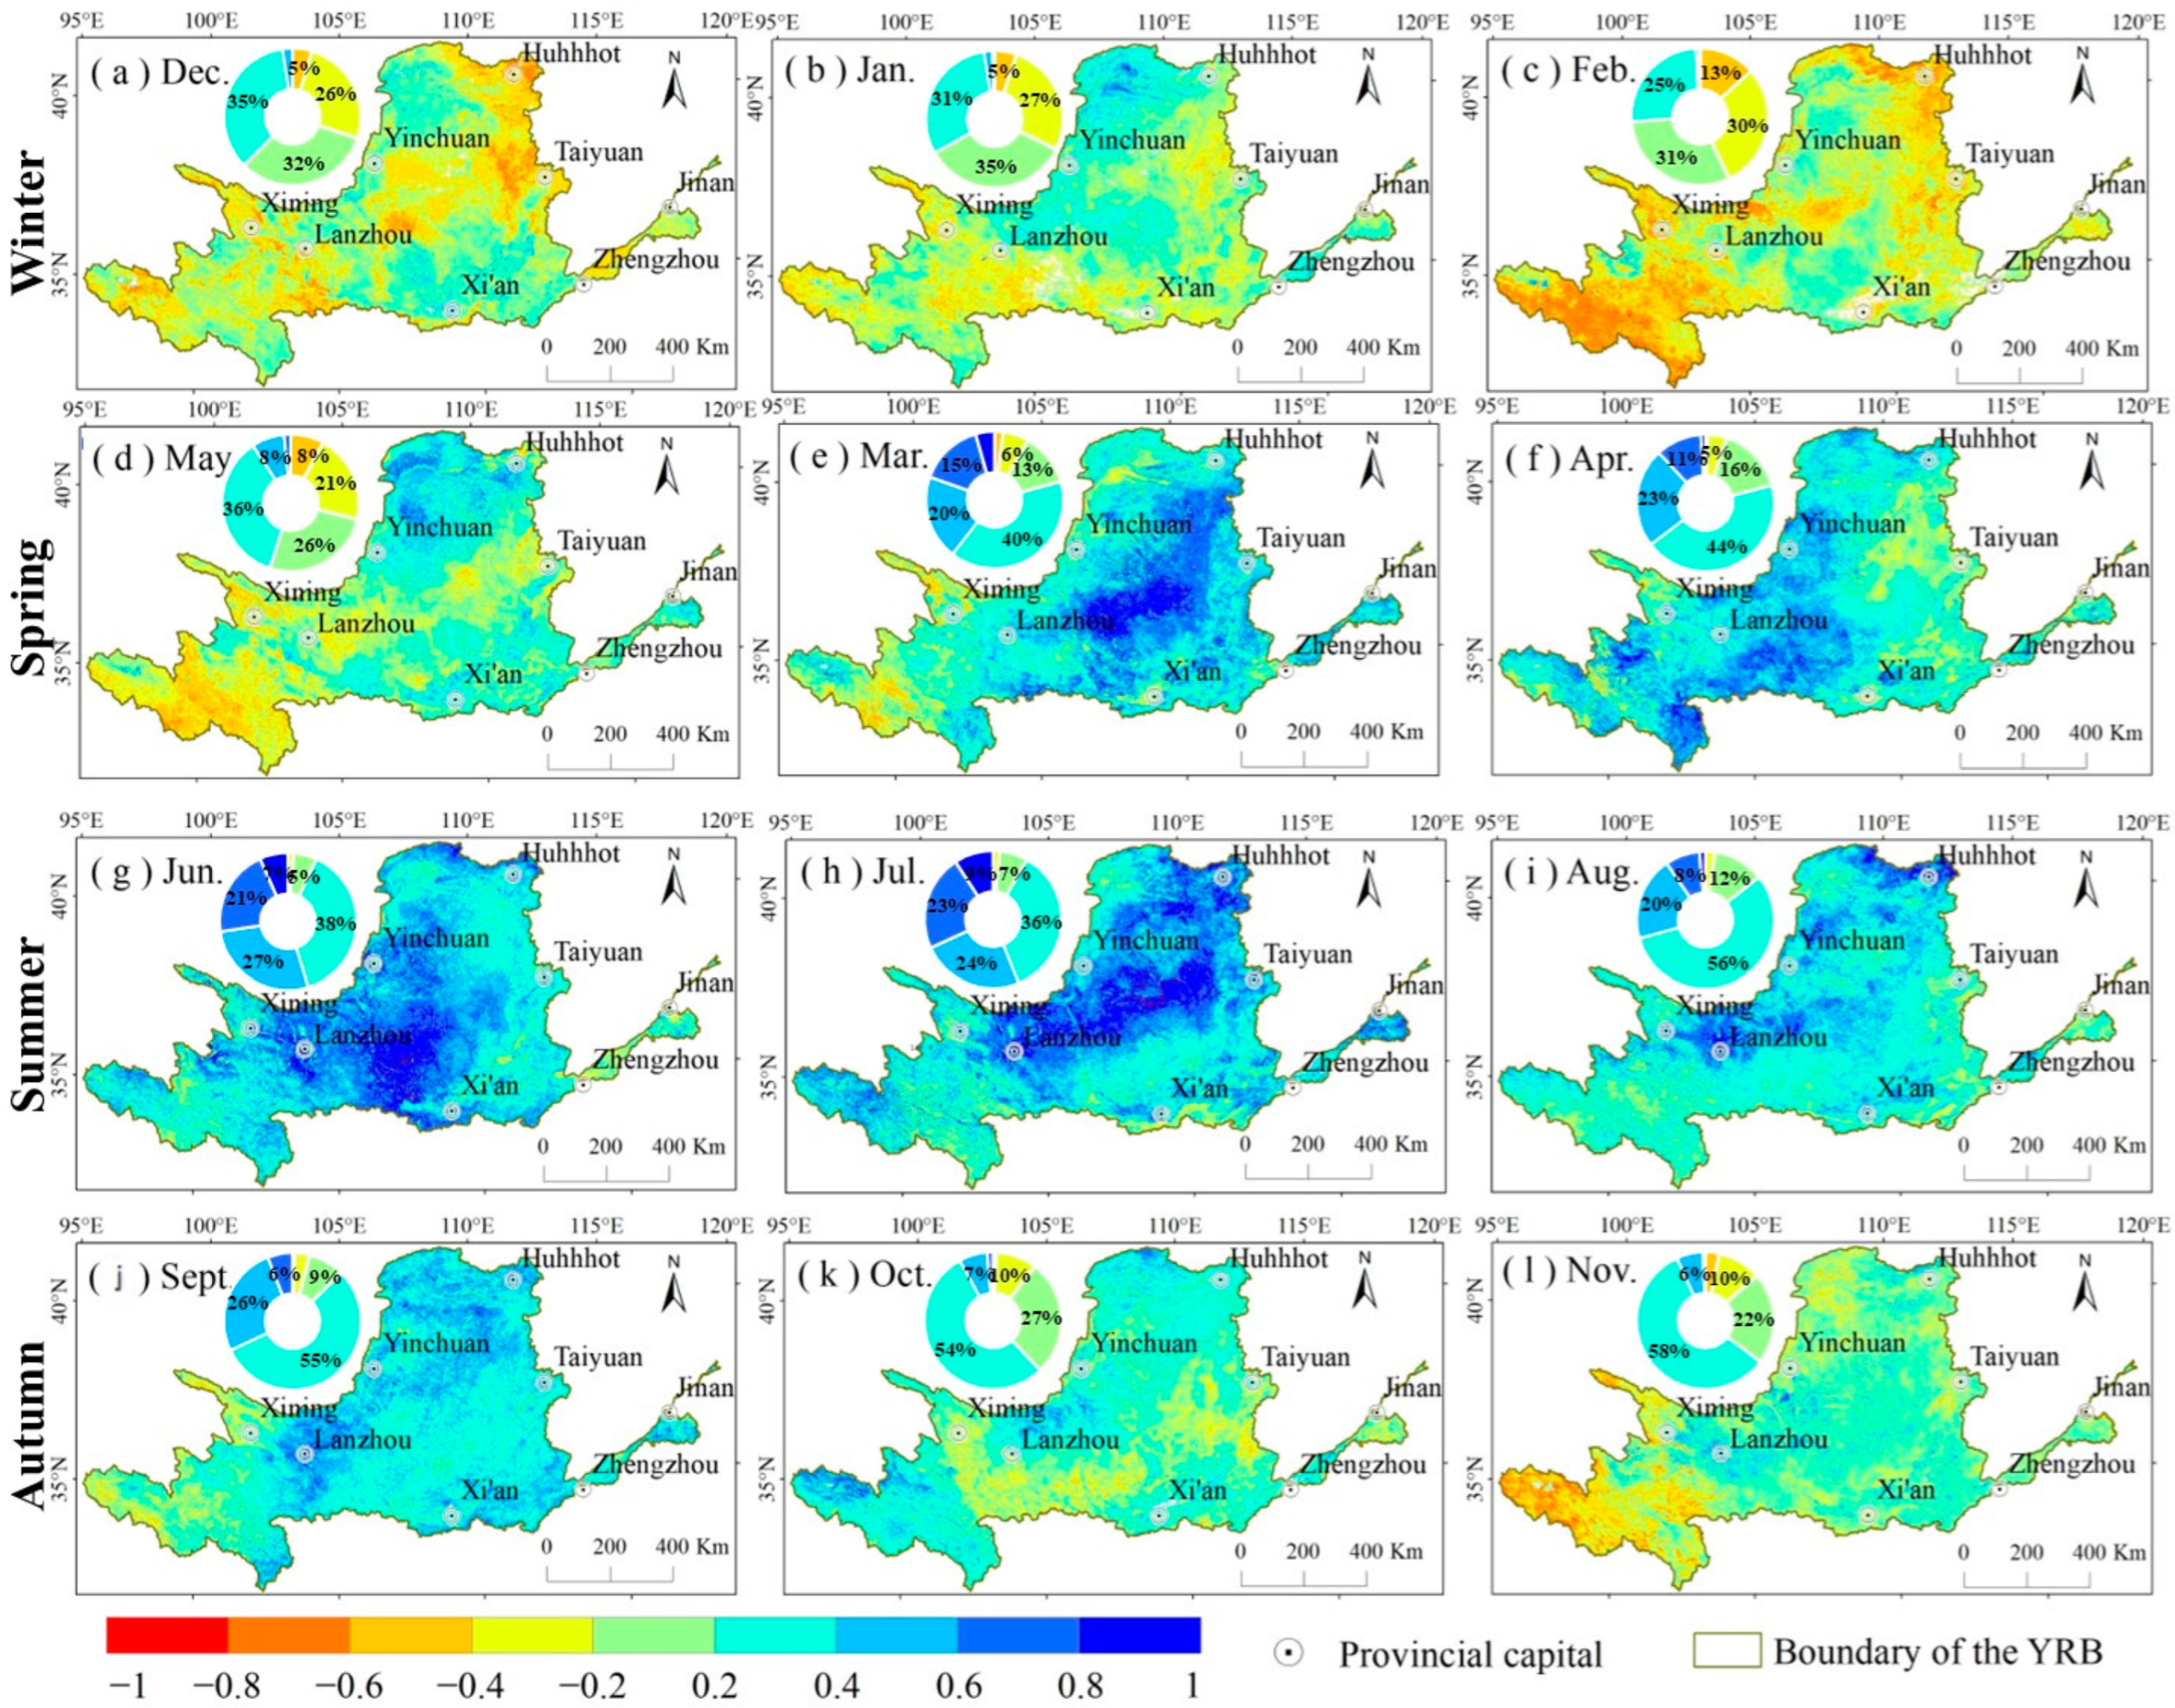
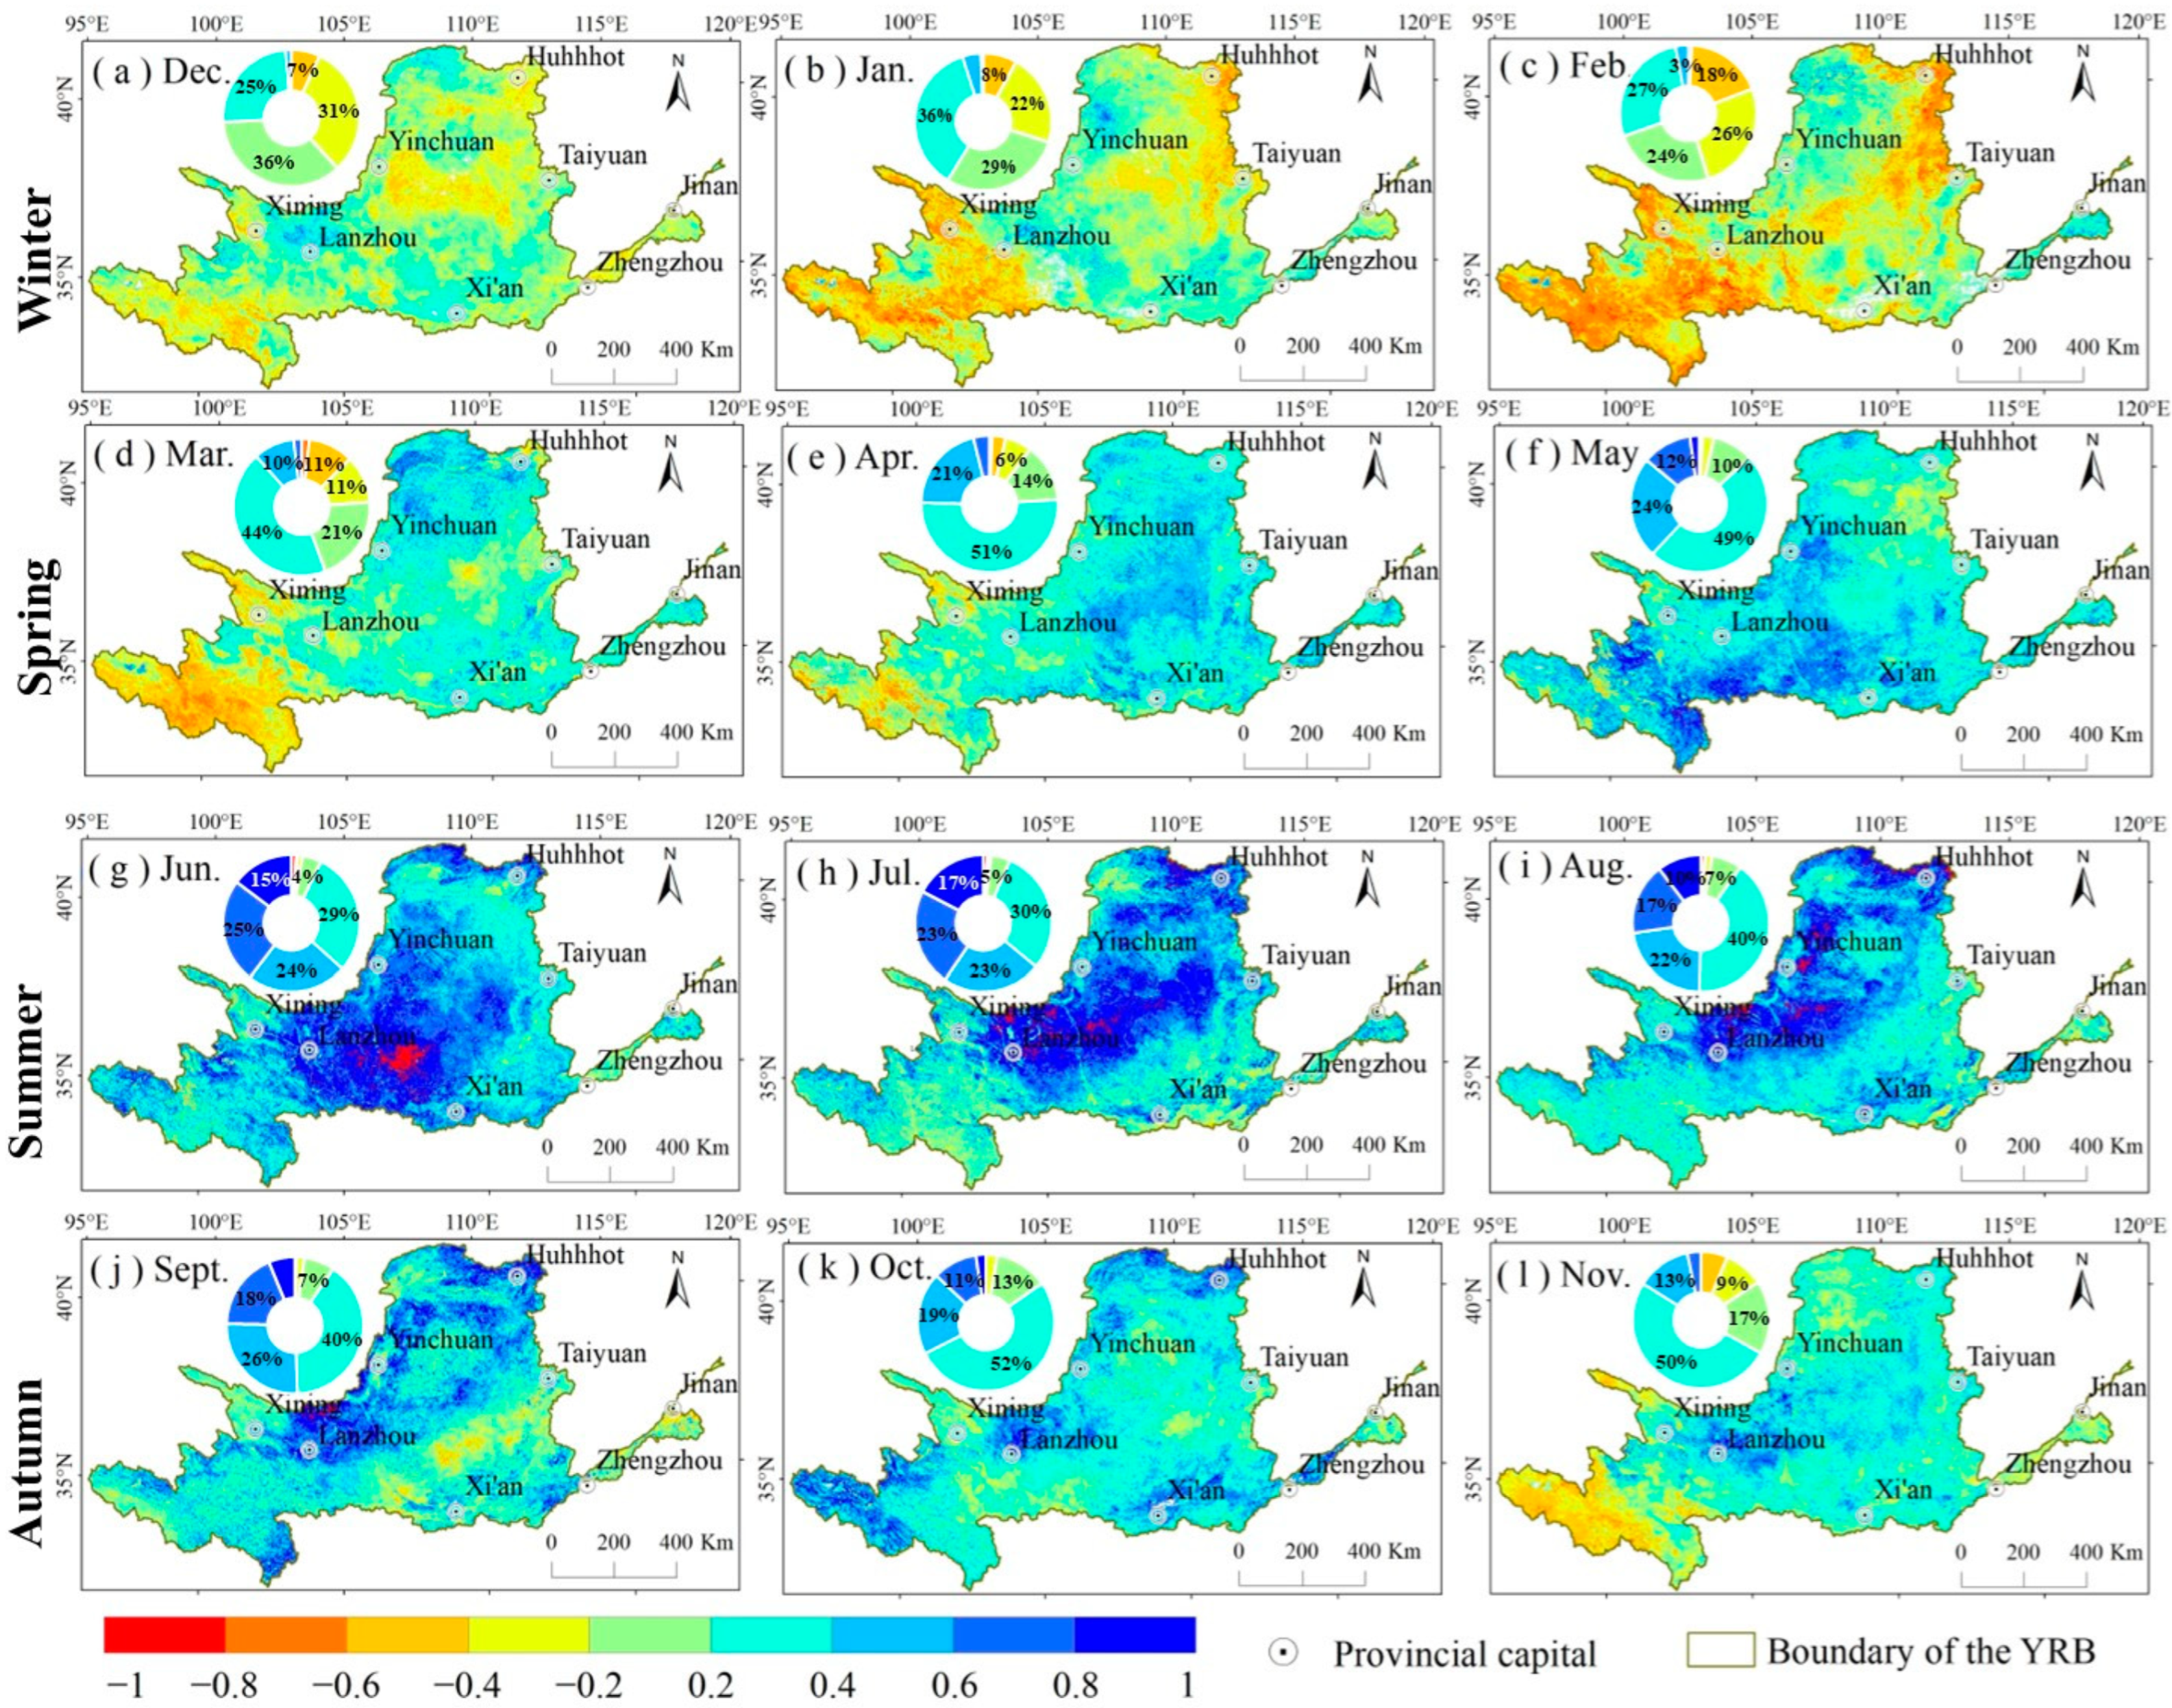
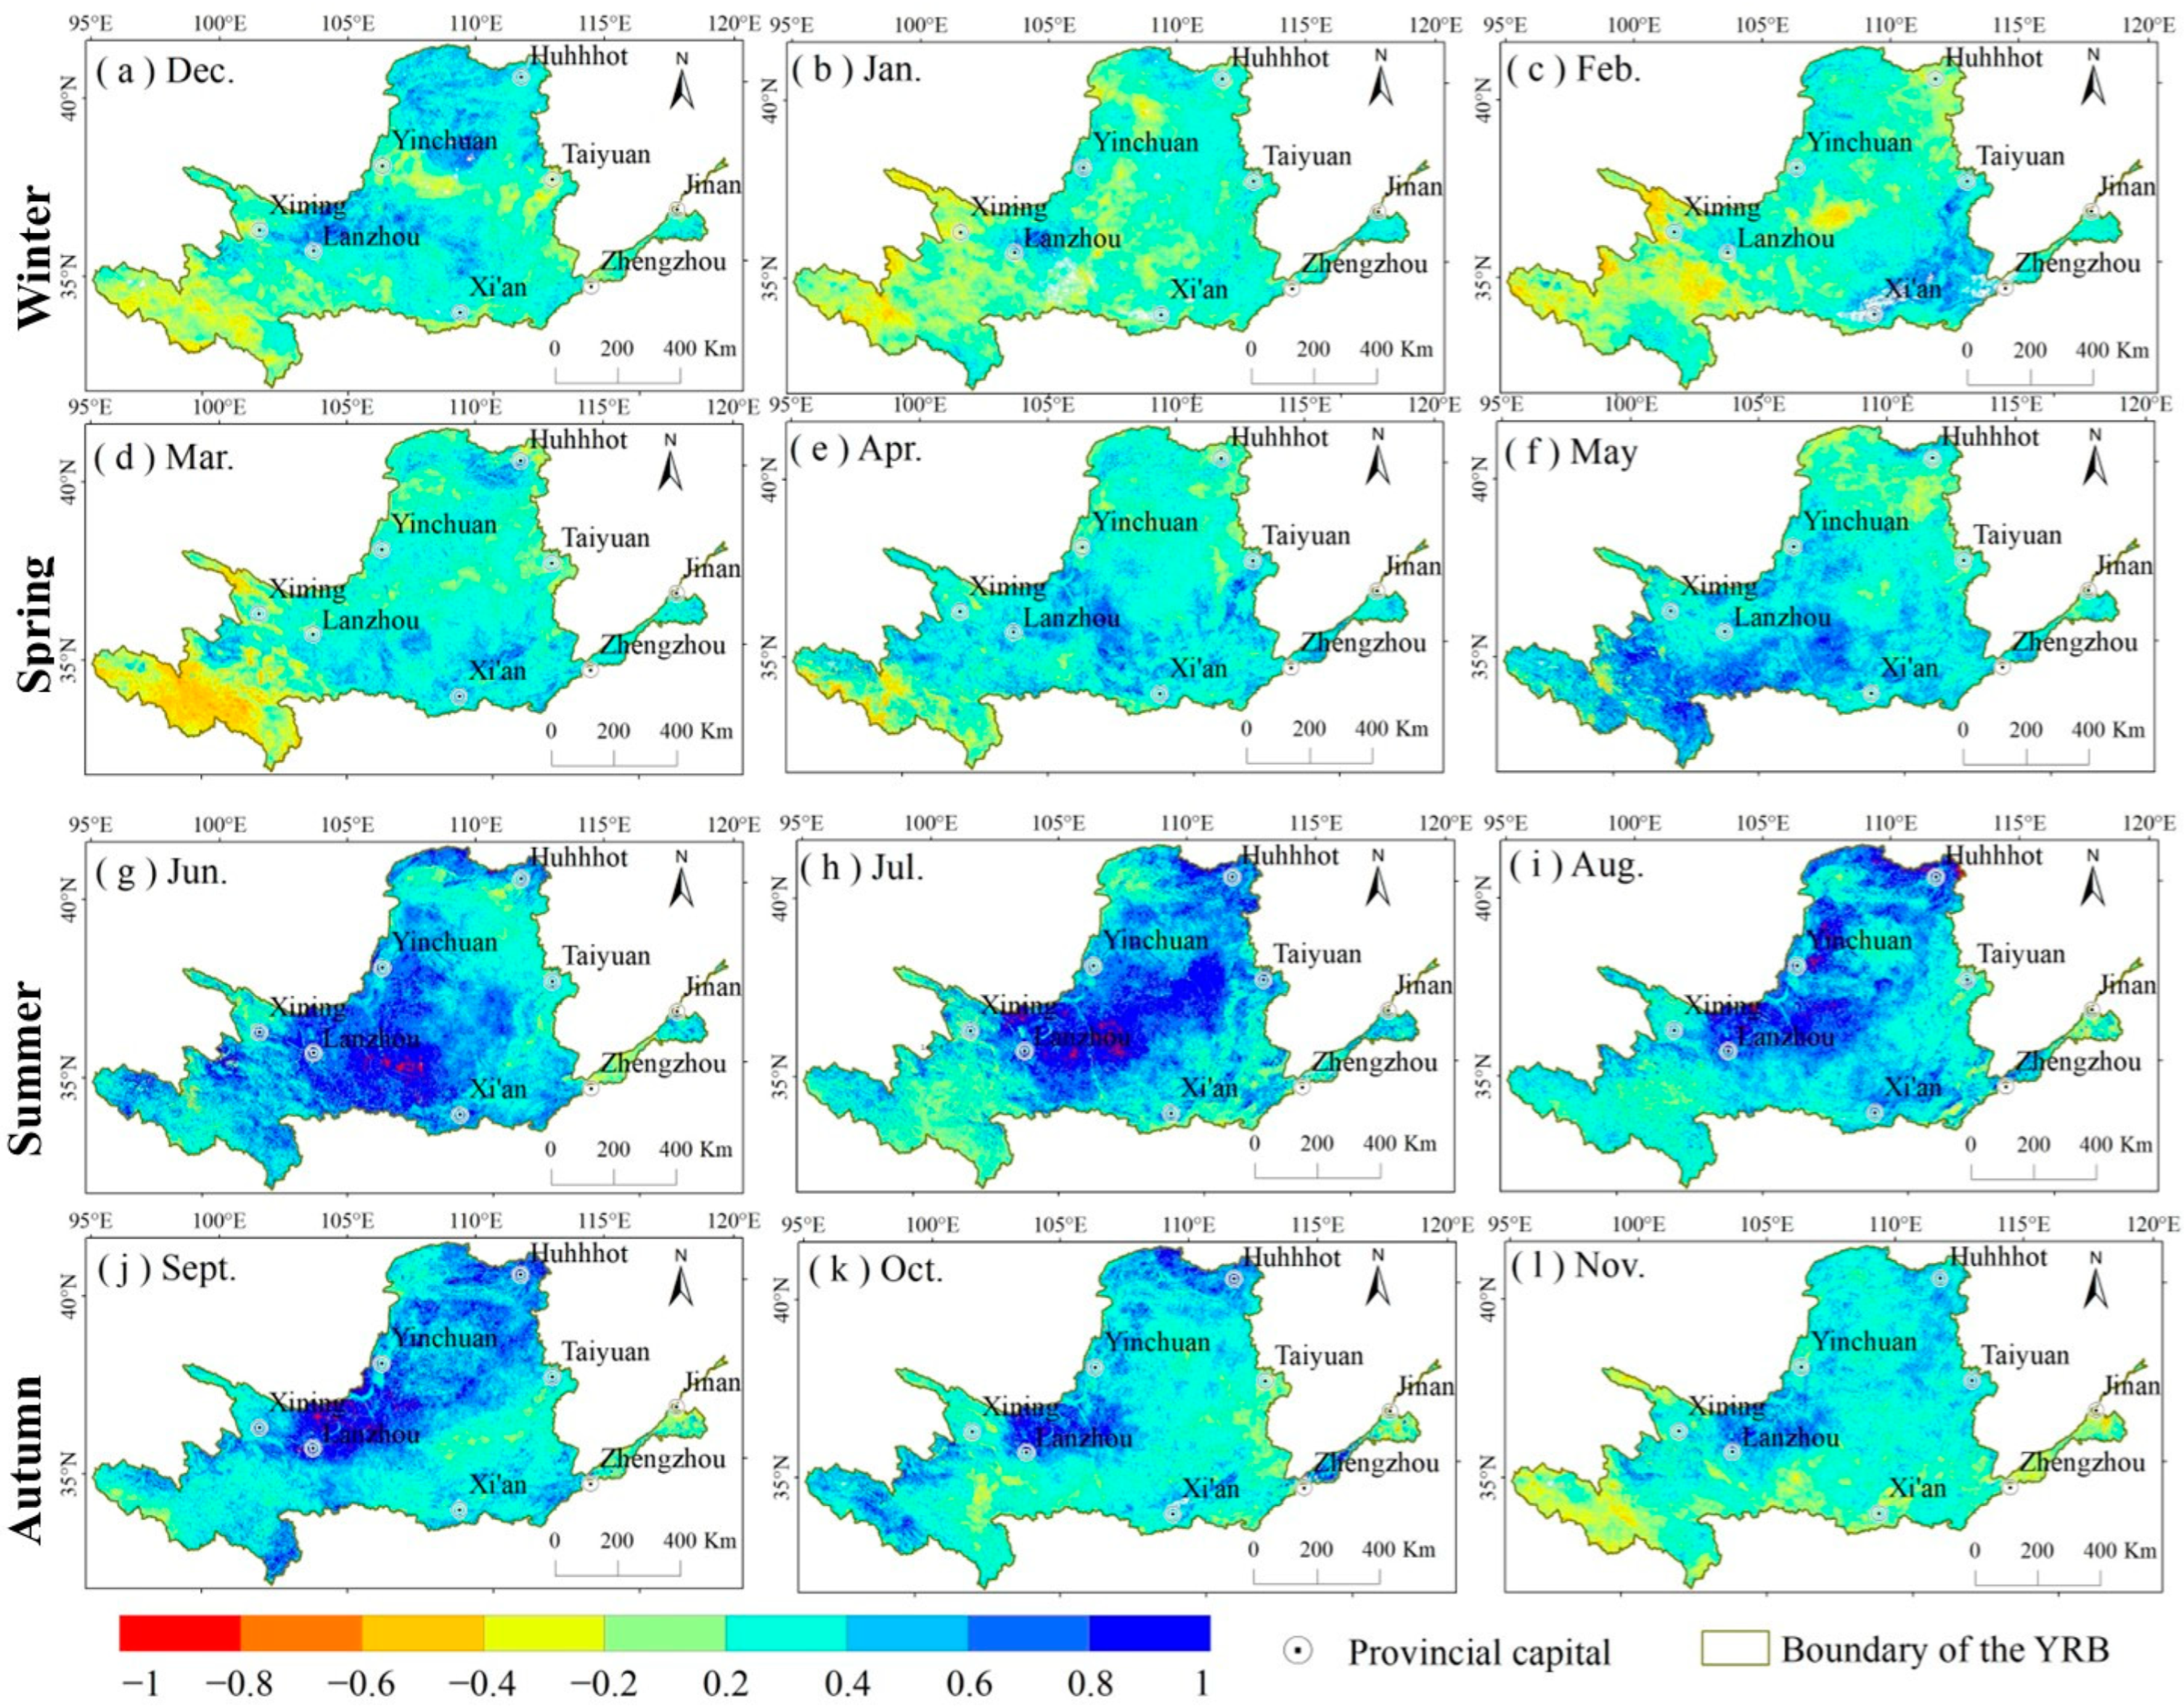
3.1. Spatio-Temporal Distribution Characteristics of SPEI

From 2003 to 2020, the spatial pattern of SPEI in the YRB displayed remarkable heterogeneity (Figure 2a). The SPEI exhibited lower values in the middle reaches of the Yellow River Basin (MYRB) and downstream of the Yellow River Basin (DYRB), while higher values were observed in the upper reaches of the Yellow River Basin (UYRB). Extreme drought affected only 0.11% of the total area (Figure 2b), primarily concentrated in the upper reaches of the Weihe River. Severe drought impacted 13.34% of the region, mainly encompassing the central plain area centered on Xi’an as well as areas within the loess plateau and southern part of the North China Plain, including cities such as Zhengzhou, western cities in Shanxi, and the Central Plain City Group. Moderate drought covered 39.1% of the area, predominantly found in the MYRB and DYRB and surrounding regions near Xining and Lanzhou in its upper reaches. Mild drought affected approximately 45.29% of landmasses, mainly distributed across its upper reaches, whereas areas free from drought constituted about 2.16%, primarily located at the source of YRB and Hetao Plain.
An analysis of the spatial trends of SPEI in the YRB from 2003 to 2020 (Figure 3a) reveals that the rate of change decreases from the middle to the periphery of the basin, with five levels of change rate. The area with the highest rate of decrease is concentrated in the Guanzhong Plain and the Loess Plateau of North Shaanxi, with a rate of change of −0.7 to −1.2/decade, accounting for 8% of the total basin area. The rate of change in the surrounding areas gradually decreases until it reaches zero. In the source areas of YRB, the Hetao Plain, and DYRB, the trend of SPEI reverses to an increase, with an increase rate of up to 0.7/decade. The trend of drought relief and moisture increase is observed, accounting for 12% of the total basin area.
Observing the temporal evolution depicted in Figure 3b, it is evident that SPEI exhibits a declining trend at a rate of −0.17 per decade, signifying a drying tendency on an annual scale throughout the entire watershed. The range of SPEI variations spans from −0.33 to 0.43. Among them, 2006 and 2013 were the most severe drought years, with SPEI values of −0.21 and −0.33, respectively, indicating extreme drought and severe drought. By conducting a significance test on the spatial trend of SPEI change (Figure 3c), it was found that the trend of SPEI change passed the significance test (P < 0.05) in the Guanzhong Plain, the mountain and valley basins around Xining, and the loess plateau of north Shaanxi, accounting for 8.57% of the watershed area (Figure 3d).

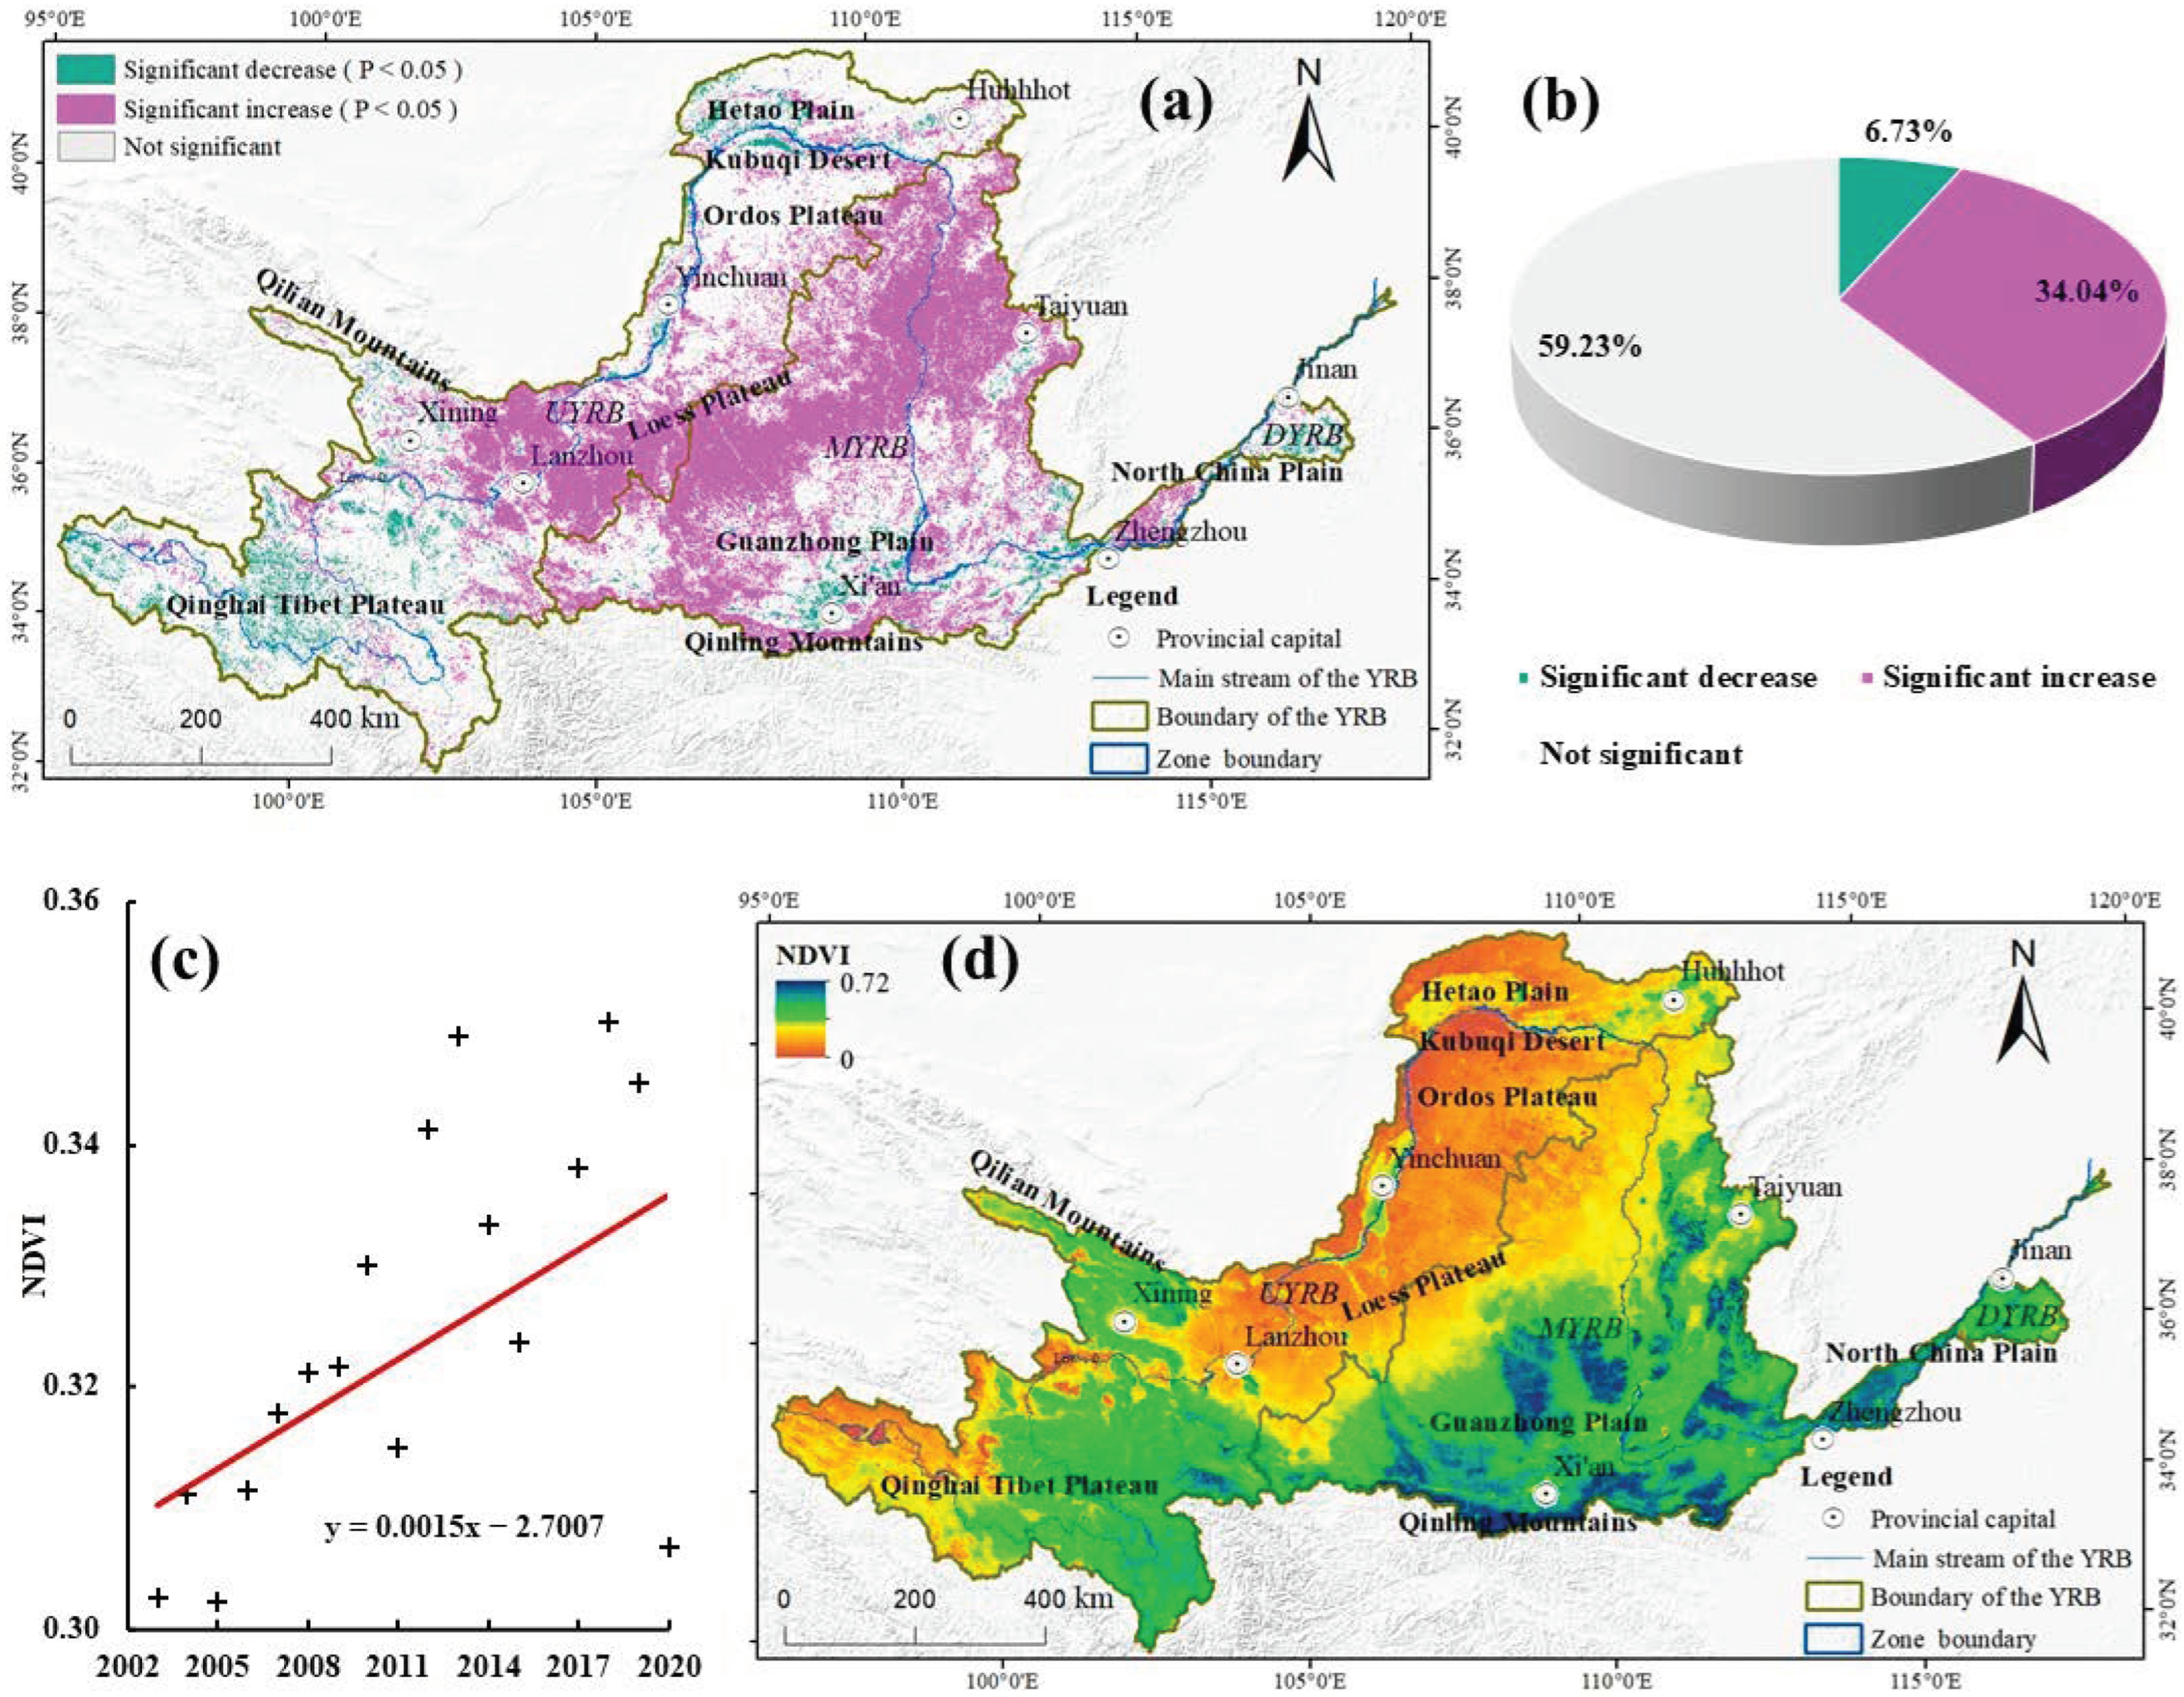
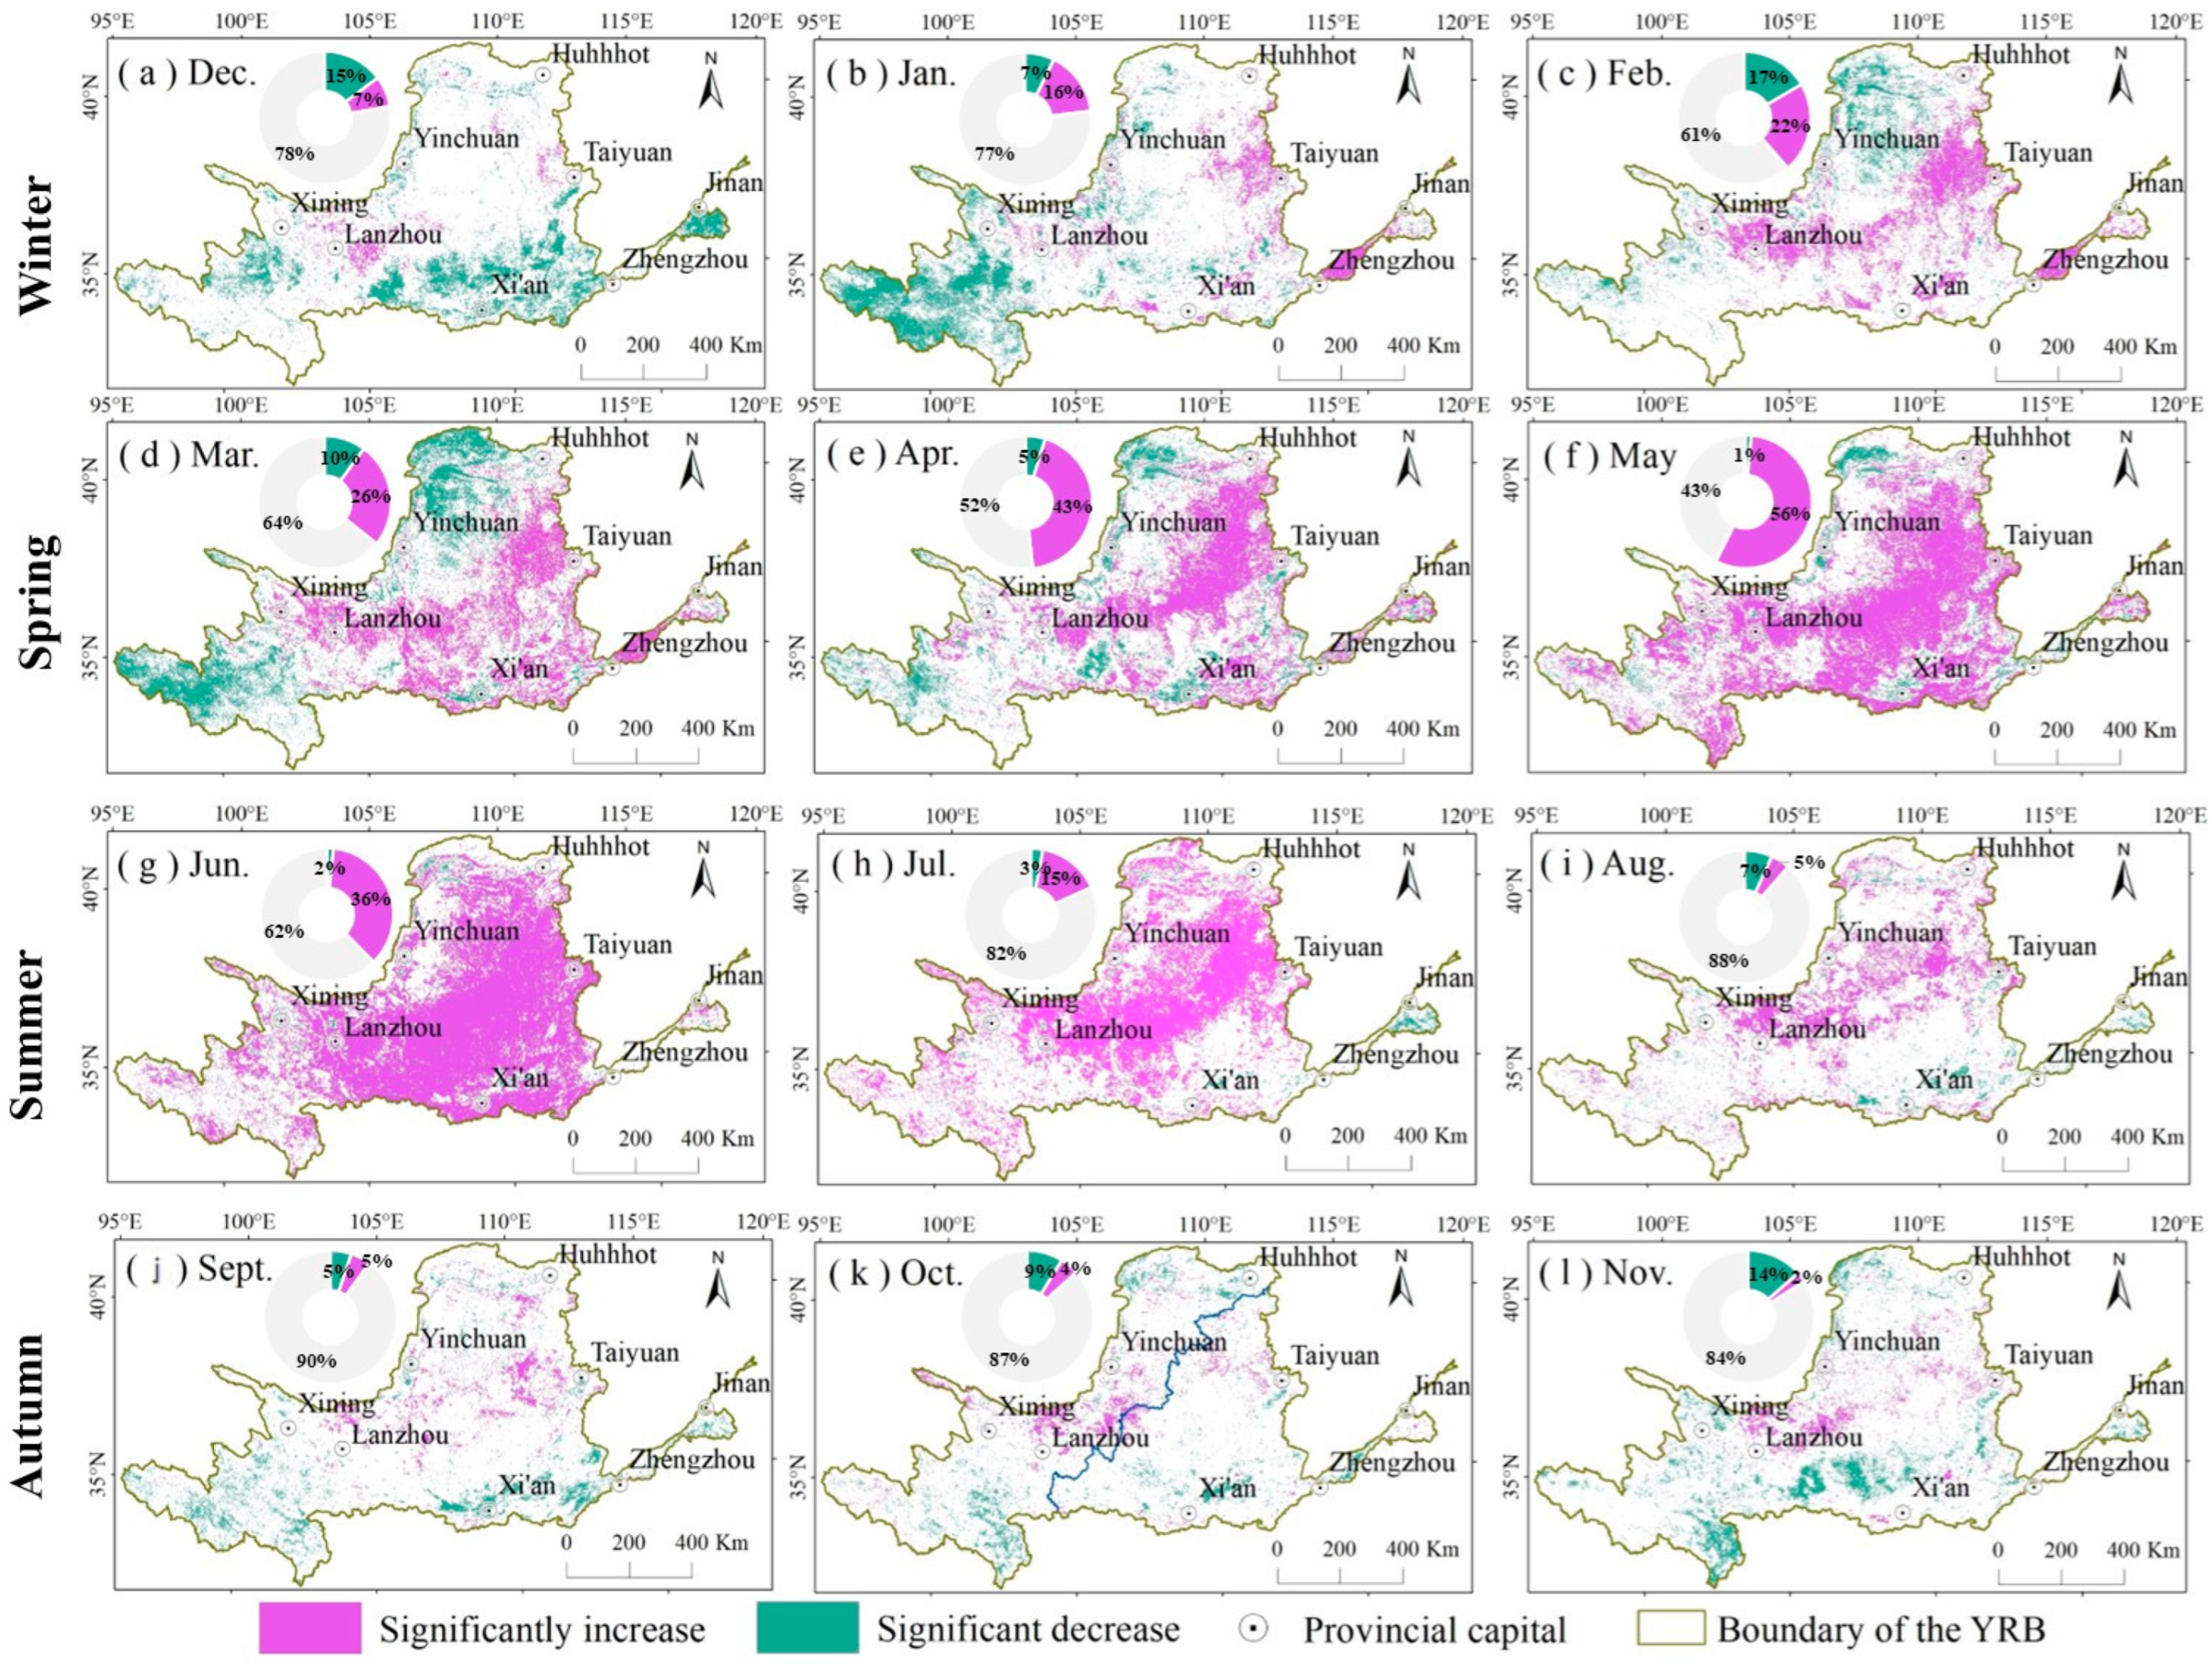
3.2. Spatial and Temporal Distribution Characteristics of NDVI

The spatial arrangement of yearly changes in NDVI within the YRB exhibits striking diversity with a discernible correlation to elevation (Figure 4a). Approximately 40.77% of these regions demonstrate statistically significant alterations (Figure 4b), among which approximately 34.04% display an increasing tendency primarily observed at altitudes below 2000 m with a minimum significance level set at or above 0.05; conversely, around 6.73% exhibit a declining pattern predominantly situated at higher elevations within the YRB’s origin area as well as sporadically across Guanzhong Plain, Hetao Plain, and Kubuqi Desert—all passing statistical tests with p-values less than 0.05.
From 2003 to 2020, the NDVI exhibited a continuous upward trend at a rate of 0.015/decade, indicating an increase in vegetation density or expansion of vegetation coverage. Based on the current status of vegetation coverage, NDVI ranges from 0 to 0.72 within the basin. The southern part of the basin shows relatively good vegetation coverage, including the source areas of YRB, Guanzhong Plain, western Shanxi, and southern North China Plain. In contrast, the northwestern part of the basin exhibits lower vegetation coverage, encompassing the highest altitude areas of the source region of YRB and the northwestern Loess Plateau.
The spatial distribution of monthly NDVI trends in the YRB is not the same. During the entire winter season, from December to February of the following year, vegetation is in a dormant state and grows slowly, so the areas with significant NDVI decline in December and January are larger than those with significant NDVI increase, with the areas of significant decline accounting for 15%, 7%, and 17%, respectively. In February, the temperature rises, causing the area of NDVI increase to recover to 16%. However, the overall area of non-significant change is at least 77% or more (Figure 5k,l,a). During the spring period, from March to May, the areas with significant NDVI increase gradually expand from 22% to 26%, eventually covering 44% of the entire basin, mainly distributed in the middle and lower reaches of the basin (Figure 5b–d). During the summer, the areas with significant NDVI increase decreased from 56% to 36% and finally decreased to 15% in August. The areas with significant NDVI increase in the autumn are relatively stable, accounting for 4–5%, while the areas with significant NDVI decreases account for 5–14%. It can be seen that the areas with significant NDVI increase in May, June, and July of 2003–2020 were the largest, and vegetation growth and vegetation coverage improved.

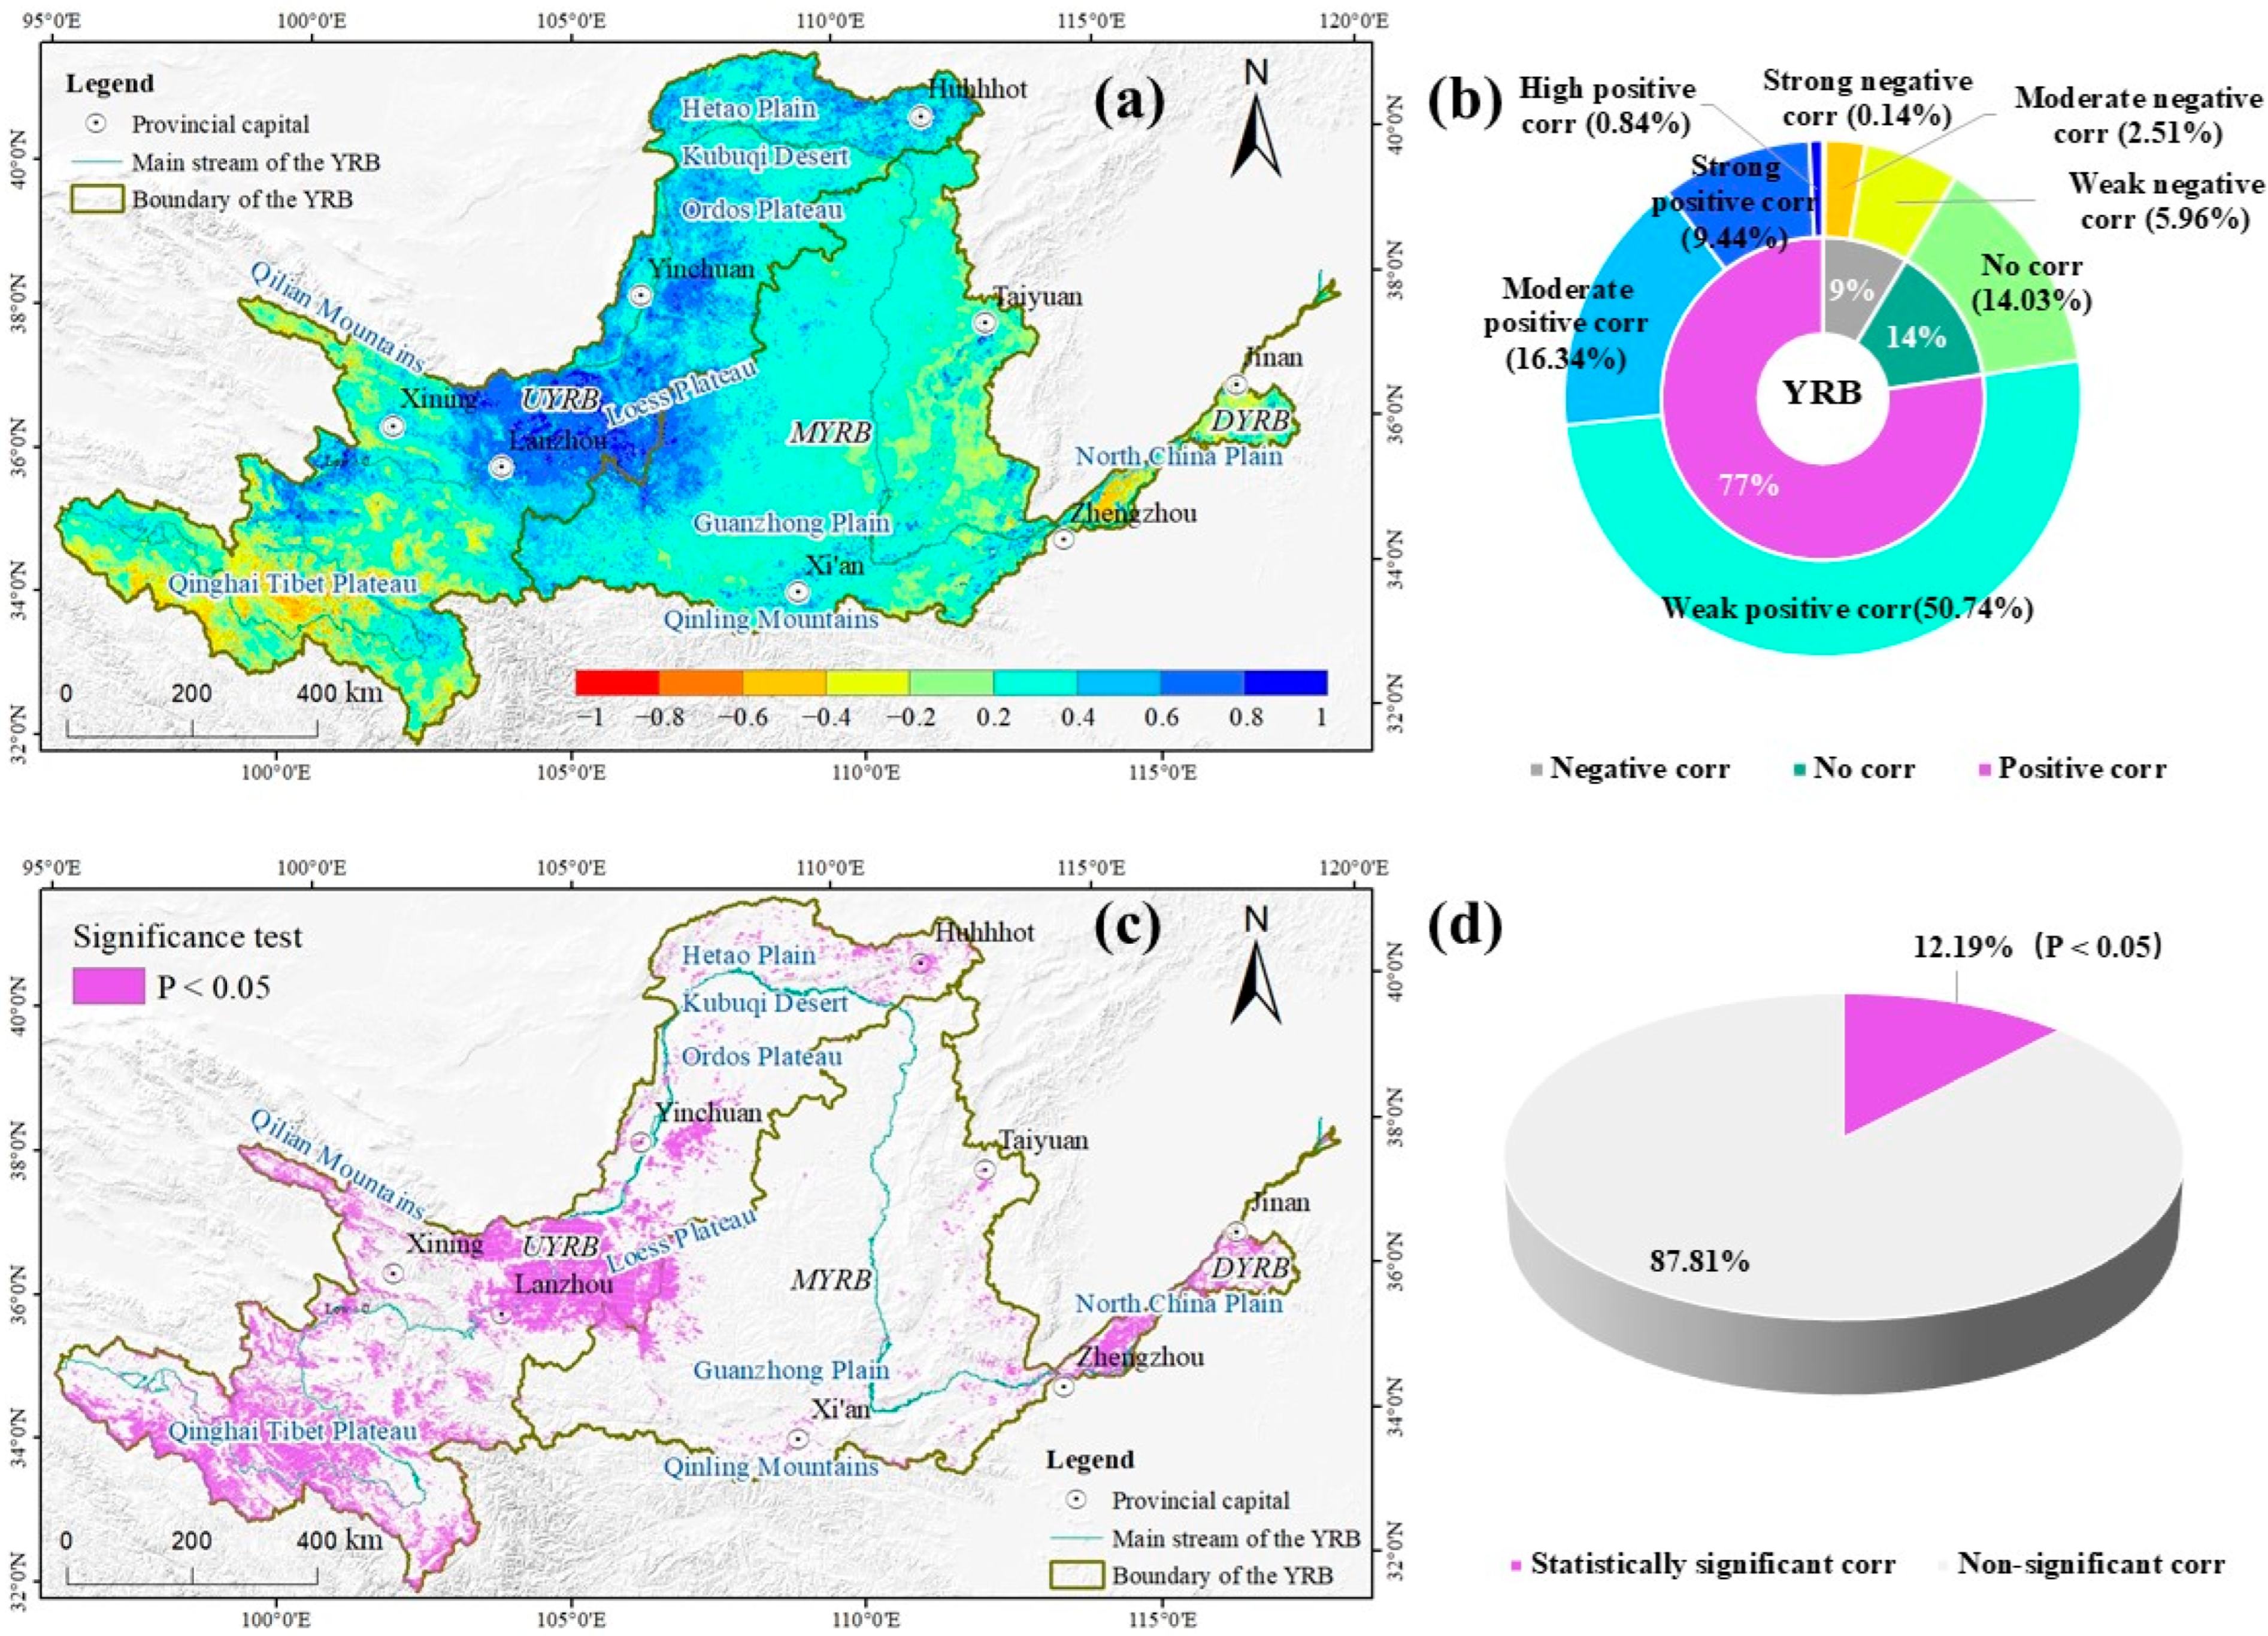
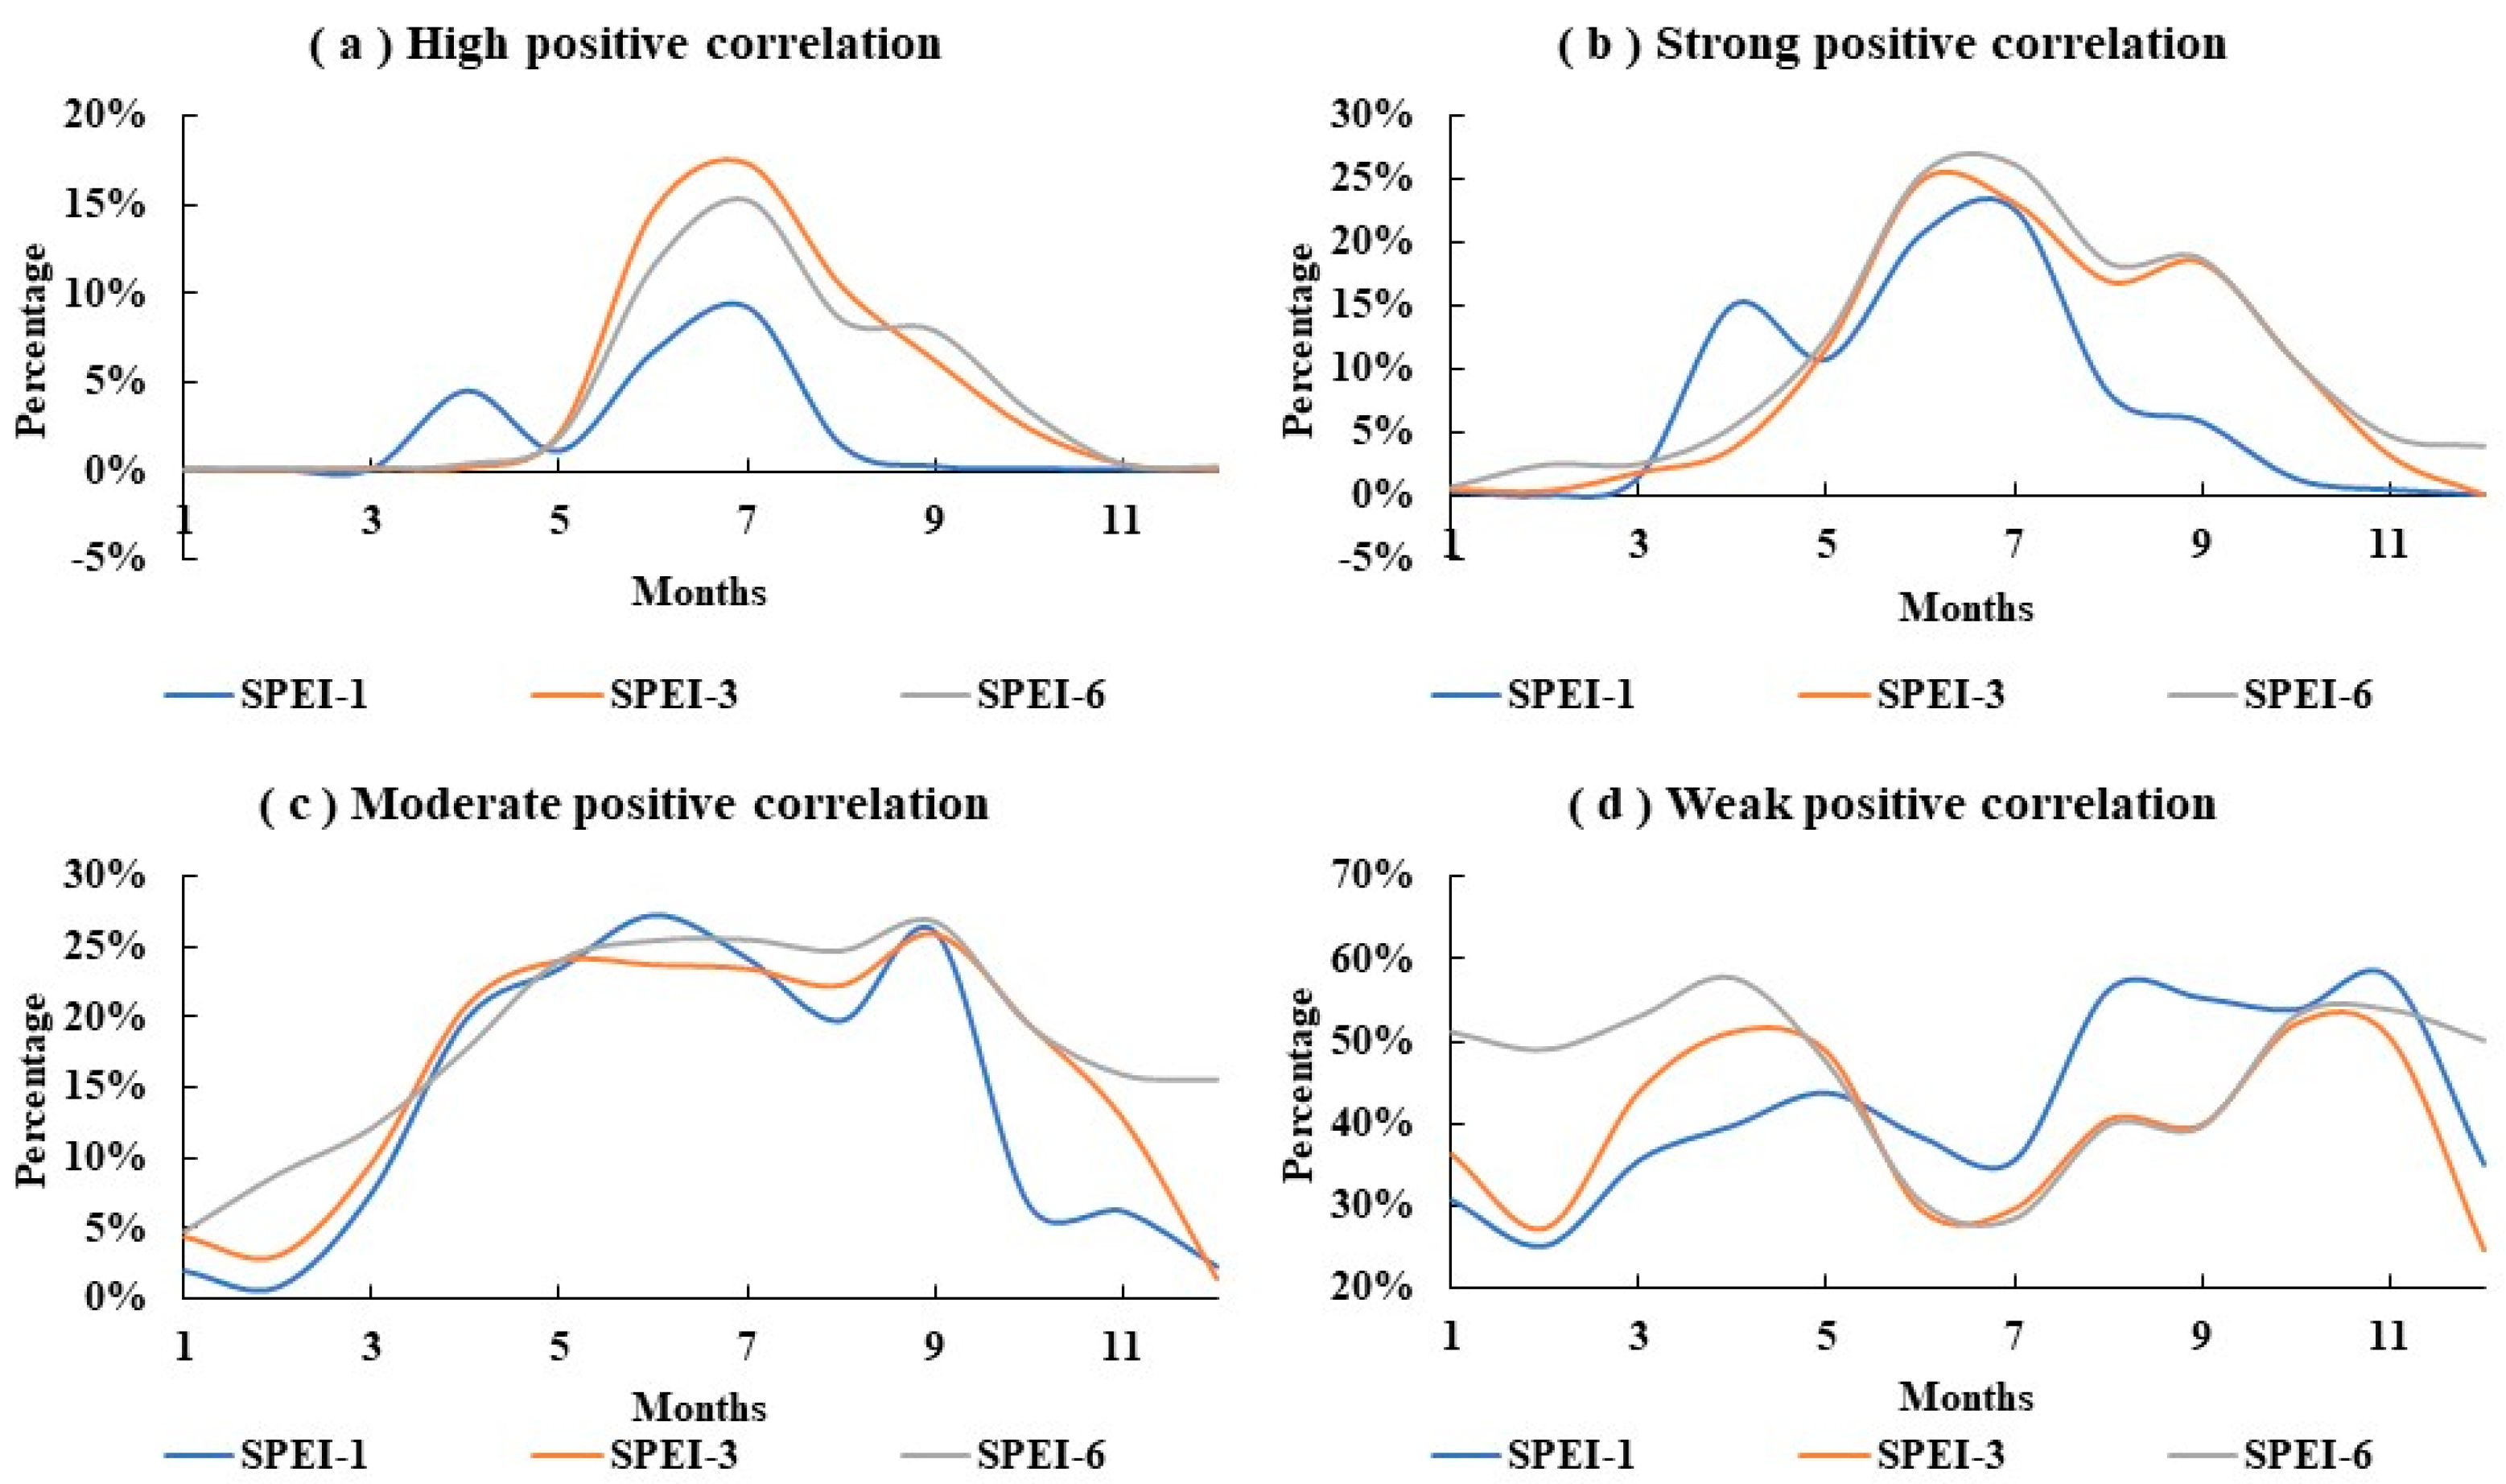
3.3. The Response of NDVI to SPEI

An intricate spatial examination of NDVI-SPEI correlation on an annual scale spanning from 2003 to 2020 (Figure 6a) unveils that approximately three-quarters of this region exhibits positive correlations (Figure 6b). This phenomenon is predominantly concentrated within elevations below 2000 m along the lower stretches of YRB, encompassing vast portions of its MYRB and DYRB. Notably, over one-tenth of this domain showcases a CC surpassing 0.6, primarily clustered around Lanzhou while sporadically dispersed across the Hexi Corridor and vicinity to Hohhot; meanwhile, an additional 16% manifests correlations falling between 0.4 and 0.6 across widely scattered locations situated on peripheries adjoining strongly correlated zones. The region exhibiting a weak positive correlation between NDVI and SPEI is the most extensive, encompassing 50.74% of the area and spanning across the middle reaches of the Loess Plateau and the Guanzhong Plain in the YRB. Conversely, areas where NDVI and SPEI display a negative correlation are relatively limited, accounting for only 9% of the total area and primarily located in the headwaters of the YRB as well as its lower reaches. These findings indicate that in arid and semi-arid regions, NDVI and SPEI tend to exhibit a positive correlation, while in humid and subhumid areas such as those found in both the headwaters of YRB and DYRB, this relationship is reversed. Furthermore, approximately 12.19% of these correlations are statistically significant (Figure 6c,d), predominantly distributed from the upper reaches to Lanzhou, Yinchuan, and Hetao Plain within YRB as well as the southern North China Plain. This suggests that NDVI in these specific areas is significantly influenced by SPEI.
To further understand the impact of SPEI on NDVI, we analyzed the spatial correlation between monthly SPEI-1, SPEI-3, and SPEI-6 and NDVI. During the three-month winter period (Figure 7a–c), the spatial distribution of the CC between SPEI-1 and NDVI showed significant differences, with fewer regions having a CC greater than 0.6 (0.15%, 0.08%, and 0.45%) and fewer regions having a CC less than −0.6 (0.02%, 0.03%, and 0.20%). The area of moderate negative correlation was 4.57%, 5.19%, and 13.19%, respectively. The area of negative correlation gradually increased in winter and reached its highest value in February, mainly distributed in the source area of the YRB, which may be related to the vegetation characteristics and semi-humid climate environment of the source area of the YRB. The vegetation growth is less controlled by water and more affected by heat. At the same time, we can see that the negative correlation area between SPEI-3 and NDVI expanded further in winter, and the area of moderate negative correlation increased most significantly, reaching 6.78%, 7.94%, and 18.19% (Figure 8a–c). However, the correlation between SPEI-6 and NDVI in winter has shown more positive correlation, with the area of moderate positive correlation accounting for 15.51%, 4.73%, and 8.81% (Figure 9a–c). The study found that SPEI-3 has the most significant impact on NDVI in the winter.
The positive correlation strength between spring SPEI and NDVI further intensifies and expands in the area. Throughout the spring, from March to May, the dominant relationship between SPEI-1 and NDVI is a positive correlation, with the areas of CC greater than 0.4 being 9.33%, 39.45%, and 35.35% (Figure 7d–f). The dominant relationship between SPEI-3 and NDVI, as well as the relationship between SPEI-6 and NDVI, is also a positive correlation, but the areas of CC greater than 0.4 decrease, being 2.04%, 3.97%, and 13.91% (Figure 8d–f), and 14.75%, 23.59%, and 38.49% (Figure 9d–f), possibly because spring temperatures have a greater impact on vegetation growth and SPEI-1 scale and SPEI-6 water supply are more sensitive to vegetation growth.
After the maximum positive correlation region between SPEI and NDVI in the summer, it began to decline in August, and the change in the region where the CC between SPEI-1 and NDVI was greater than 0.4 in each month of the summer was 54.57%, 55.93%, and 29.29%. The change in the region where the CC between SPEI-3 and NDVI was greater than 0.4 in each month of the summer was 39.61%, 40.49%, and 27.35%. The region where the CC between SPEI-6 and NDVI was greater than 0.4 rose to its maximum, at 62.31%, 66.85%, and 51.59% in each month of the summer. The results show that although there are significant differences in the correlation between different scales of SPEI and NDVI, the internal fluctuation trend in the summer is consistent, i.e., it began to rise in June, reached its peak in July, and then began to decline in August. The significant positive correlation regions are concentrated in the Loess Plateau region after the significance test.
The correlation between SPEI and NDVI in autumn continued to decline, with more than 40% of the area falling into a weak correlation. Upon observation, the decline in the correlation between SPEI-1 and NDVI was the most obvious, with weak correlation areas accounting for about 60% (Figure 9g–l). The weak correlation areas of SPEI-3 and NDVI, as well as SPEI-6 and NDVI, decreased to about 50%, while the corresponding strong correlation areas increased. The results show that SPEI-3 and SPEI-6 have a more significant impact on NDVI in the autumn.
The above results indicate that there are certain regular patterns in the correlation between different temporal scales of SPEI and NDVI, both spatially and temporally. Figure 10 illustrates the trends in the number of positive correlations at various levels. Strong and moderate positive correlations exhibit clear seasonal patterns, with peak values occurring in July. SPEI-3 has the most significant impact on NDVI, suggesting that a three-month accumulated drought has the greatest influence (Figure 10a,b). When expanding the area of negative correlation between different temporal scales of SPEI and NDVI, SPEI-1 has the most notable effect, indicating that a one-month accumulated drought has the strongest impact (Figure 10c,d). SPEI and NDVI show a negative correlation in certain regions (Figure 11), and from the negative correlation propagation process, the negative correlation between SPEI-3 and NDVI is the strongest, indicating that the impact of an accumulated 3-month drought on vegetation is the highest.

4. Discussion

4.1. The Impact Mechanism of SPEI on NDVI

The impact of drought on vegetation is both severe and far-reaching [21,44,45,46,47]. As a result of water scarcity, the process of plant photosynthesis decelerates [48,49,50,51], leading to desiccation and shedding of foliage [52,53], as well as stunted or halted growth [54]. Prolonged drought significantly hampers vegetation productivity [55,56,57] and serves as a pivotal factor in precipitating plant mortality [58,59,60,61]. Research indicates that various ecosystems (such as grasslands and forests) exhibit distinct sensitivities to water deficits during different seasons. The intricate response of vegetation to drought is shaped by the combined influences of water availability and thermal energy [62], while also being intricately linked with diverse regional climates and types of flora [63,64].
At the same time, drought causes soil to become dry and infertile, impacting plant growth and increasing the likelihood of vegetation diseases and pest infestations, thereby affecting the survival and reproduction of plants. In ecosystems, drought can also lead to a reduction in vegetation [65], soil structure damage, and ultimately land desertification. Studies have indicated that the sustained increase in transpiration demand over the past decade has shortened the growing season of ecosystems. Insufficient soil moisture levels cannot support increased atmospheric water demand during the summer, resulting in transpiration suppression that prevents vegetation from meeting higher transpiration demands; water scarcity inhibits vegetation growth [66]. Therefore, drought has a severe impact on vegetation, with significant consequences for both ecosystems and human society [67].
The relationship between SPEI and NDVI mainly reflects the impact of water conditions on plant growth and health. In general, when SPEI is high, it indicates that there is sufficient water supply, which is beneficial to plant growth and leads to an increase in NDVI. On the other hand, when SPEI is low, it indicates drought or water scarcity, which limits plant growth, resulting in a decrease in NDVI [68]. At the same time, NDVI reflects the health status of plant growth. Water scarcity can lead to plant stress [69], which in turn affects its photosynthesis and growth, resulting in a decrease in NDVI. The availability of water in different growing seasons can have a significant impact on the plant’s photosynthesis and growth rate. For example, in the dry season, NDVI may decrease due to insufficient water; in the wet season, when SPEI is high, NDVI will increase accordingly. The water conditions reflected by SPEI are also closely related to soil moisture [70]. When soil moisture is sufficient, plant roots can obtain more water and nutrients, which can promote a higher NDVI. Different ecosystems respond differently to water changes [71], such as forests, grasslands, and farmlands, and changes in SPEI may also affect the availability of water in these ecosystems and subsequently affect NDVI. At the same time, NDVI is also affected by human activities, such as climate change having a greater impact on vegetation turning green than human activities and human activities having a greater impact on vegetation degradation than climate change [72].

4.2. Response of NDVI to SPEI

Vegetation’s response to drought is reflected in its resilience and recovery capacity [30]. Short-term responses (e.g., 3–6 months) of vegetation to drought are more sensitive, while long-term responses (e.g., 12–24 months) of vegetation show resilience and recovery capacity [73]. High altitude and steep slopes enhance vegetation’s drought resistance, while vegetation in plain areas shows stronger recovery capacity after drought [74]. The order of vegetation death after drought events is roughly: temperate, subtropical, tropical, temperate, alpine climate zone, i.e., the alpine climate zone is less affected by drought events [74]. The YRB has an alpine climate zone, where most of the highland areas have an altitude of over 4600 m, with an extremely fragile ecological environment and decreasing evapotranspiration [75]. Drought causes the growth rate of the dominant and low-abundance species on high altitudes and steep slopes to be lower [76], which is consistent with the conclusions of this study. In the high-altitude areas of the YRB, vegetation has stronger resistance to drought, and its growth is less restricted by water, with the average CC in the region being approximately −0.3 to 0.4 (Figure 12). Some studies have indicated that the increase in atmospheric water demand will accelerate evaporation in the region, especially in temperate areas, causing vegetation growth to be impeded [77]. While vegetation also plays a role in mitigating drought, the changes in drought are still primarily driven by climate change [78], especially under the control of precipitation variability [79]. On the other hand, climate warming leads to an extension of the growing season in early spring and late autumn, which reduces the benefits of carbon sequestration [56,80]. Meanwhile, temperature rise and afforestation will further exacerbate the risk of drought spreading [81].

4.3. Uncertainty and Vegetation Management Recommendations

NDVI is a widely used vegetation index in remote sensing and ecological research, which mainly evaluates ecological environment changes by reflecting vegetation coverage and health status. SPEI is an index that evaluates climate drought and moisture, combining the effects of precipitation and temperature. The NDVI data are composed of 16-day-resolution remote sensing data, and the remote sensing data will be affected by factors such as cloud cover, atmosphere, solar altitude, surface characteristics of different objects, and sensor characteristics [28]. We use the maximum synthesis method to the greatest extent possible to eliminate these errors, but these errors cannot be avoided, so in the calculation of SPEI, we used measured data to calculate it as much as possible to ensure the accuracy of drought monitoring data [72].
Urbanization has a noticeable impact on drought distribution [82], therefore cities and surrounding areas in the Huanghe River Basin should supplement artificial irrigation measures to alleviate the inhibition of extreme drought on vegetation growth and development. The negative correlation between SPEI and NDVI in high-altitude arid and semi-arid areas is because these regions are adapted to drought, and temperature may have a more significant impact on vegetation growth. Global warming may have a certain degree of promotion in these areas [46]. For sensitive high-altitude areas, appropriate measures can be taken to promote the migration of species that are adapted to climate change, and the implementation of measures to increase species diversity is needed. For the humid and subhumid regions, SPEI and NDVI show a significant positive correlation. It is beneficial to strengthen drought monitoring in these areas for the protection of the ecological environment in the YRB.

5. Conclusions

This paper analyzes the impact of drought at different temporal scales on vegetation growth in the YRB, and the main conclusions are as follows:
(1) The process of urbanization exerts a discernible influence on the distribution of drought. Extreme drought predominantly occurs in the middle and upper reaches of the Weihe River, while severe drought is primarily concentrated in areas surrounding Xi’an, the Guanzhong Plain, the central part of the Loess Plateau, and the southern region of the North China Plain. These regions are characterized by city clusters such as the Chengdu-Chongqing metropolitan area, the Xi’an-Wuhan-Chengdu city cluster, and the Chengdu-Chongqing metropolitan area.
(2) The spatial trend of SPEI exhibits a gradual decline from the central and southern regions towards the boundaries of the river basin, with the most pronounced decrease concentrated in the Guanzhong Plain and the Loess Plateau, where the rate of decline reaches −0.7 to −1.2/decade. The drought trend is notably significant. Conversely, there is an upward trajectory in SPEI observed in the source regions of YRB, Hetao Plain, and DYRB, with the highest rate of increase reaching 0.7/decade. This indicates a mitigation of drought trends and a shift towards increased moisture.
(3) From 2003 to 2020, the NDVI showed an upward trend, indicating an increase in vegetation density or an expansion of vegetation coverage. From the current vegetation coverage, the southern part of the watershed has better vegetation coverage, including the source areas of YBB, Guanzhong Plain, western Shanxi, and the southern North China Plain. The vegetation coverage in the northwestern part of the watershed is low, including the highest altitude area of the source area in YRB and the northwestern part of the Loess Plateau.
(4) The impact of spring temperature on vegetation growth is profound, while the water supply from both the SPEI-1 scale and SPEI-6 exhibits heightened sensitivity towards vegetation growth. Furthermore, the initial expansion of a positive correlation between drought and NDVI occurs during June before reaching its zenith in July, followed by a gradual decline through August. Notably, areas demonstrating significant positive correlations successfully pass rigorous significance tests, with a concentration observed within the Loess Plateau region. As autumn progresses, there is a continued decrease in correlation between SPEI and NDVI, with over 40% of regions regressing into weaker correlations. Additionally, during this season, both SPEI-3 and SPEI-6 exert a more pronounced influence on NDVI compared to other periods, and it is worth noting that during the winter months, it is specifically SPEI-3 that exerts maximal influence on NDVI.
(5) According to the dynamic transmission laws of positive CC at various levels, it is evident that strong and moderate positive correlations exhibit distinct transmission patterns, reaching their peak values in July. The most significant positive impact on NDVI comes from SPEI-3. Among the areas showing a negative correlation between SPEI and NDVI, the influence of SPEI-1 is the most prominent.

Funding

This research was funded by the National Natural Science Foundation of China (Grant No. 41901110).

Data Availability Statement

The data acquisition method has been explained in the article.

Conflicts of Interest

The author declares no conflicts of interest.

References

  1. Novick, K.A.; Ficklin, D.L.; Stoy, P.C.; Williams, C.A.; Bohrer, G.; Oishi, A.C.; Papuga, S.A.; Blanken, P.D.; Noormets, A.; Sulman, B.N.; et al. The increasing importance of atmospheric demand for ecosystem water and carbon fluxes. Nat. Clim. Chang. 2016, 6, 1023–1027. [Google Scholar] [CrossRef]
  2. Huang, K.; Xia, J.; Wang, Y.; Ahlström, A.; Chen, J.; Cook, R.B.; Cui, E.; Fang, Y.; Fisher, J.B.; Huntzinger, D.N.; et al. Enhanced peak growth of global vegetation and its key mechanisms. Nat. Ecol. Evol. 2018, 2, 1897–1905. [Google Scholar] [CrossRef]
  3. Ciais, P.; Reichstein, M.; Viovy, N.; Granier, A.; Ogée, J.; Allard, V.; Aubinet, M.; Buchmann, N.; Bernhofer, C.; Carrara, A.; et al. Europe-wide reduction in primary productivity caused by the heat and drought in 2003. Nature 2005, 437, 529–533. [Google Scholar] [CrossRef] [PubMed]
  4. Wang, K.; Dickinson, R.E. A review of global terrestrial evapotranspiration: Observation, modeling, climatology, and climatic variability. Rev. Geophys. 2012, 50. [Google Scholar] [CrossRef]
  5. Piao, S.; Zhang, X.; Chen, A.; Liu, Q.; Lian, X.; Wang, X.; Peng, S.; Wu, X. The impacts of climate extremes on the terrestrial carbon cycle: A review. Sci. China Earth Sci. 2019, 62, 1551–1563. [Google Scholar] [CrossRef]
  6. Jiao, W.; Wang, L.; Smith, W.K.; Chang, Q.; Wang, H.; D’Odorico, P. Observed increasing water constraint on vegetation growth over the last three decades. Nat. Commun. 2021, 12, 3777. [Google Scholar] [CrossRef]
  7. Peterson, T.J.; Saft, M.; Peel, M.C.; John, A. Watersheds may not recover from drought. Science 2021, 372, 745–749. [Google Scholar] [CrossRef]
  8. Shu, Z.; Jin, J.; Zhang, J.; Wang, G.; Lian, Y.; Liu, Y.; Bao, Z.; Guan, T.; He, R.; Liu, C.; et al. 1.5 °C and 2.0 °C of global warming intensifies the hydrological extremes in China. J. Hydrol. 2024, 635, 131229. [Google Scholar] [CrossRef]
  9. Furtak, K.; Wolińska, A. The impact of extreme weather events as a consequence of climate change on the soil moisture and on the quality of the soil environment and agriculture—A review. Catena 2023, 231, 107378. [Google Scholar] [CrossRef]
  10. Cao, X.; Zheng, Y.; Lei, Q.; Li, W.; Song, S.; Wang, C.; Liu, Y.; Khan, K. Increasing actual evapotranspiration on the Loess Plateau of China: An insight from anthropologic activities and climate change. Ecol. Indic. 2023, 157, 111235. [Google Scholar] [CrossRef]
  11. Liu, Y.; Lin, Z.; Wang, Z.; Chen, X.; Han, P.; Wang, B.; Wang, Z.; Wen, Z.; Shi, H.; Zhang, Z.; et al. Discriminating the impacts of vegetation greening and climate change on the changes in evapotranspiration and transpiration fraction over the Yellow River Basin. Sci. Total Environ. 2023, 904, 166926. [Google Scholar] [CrossRef]
  12. Schumacher, D.L.; Keune, J.; Dirmeyer, P.; Miralles, D.G. Drought self-propagation in drylands due to land–atmosphere feedbacks. Nat. Geosci. 2022, 15, 262–268. [Google Scholar] [CrossRef]
  13. Yuan, W.; Zheng, Y.; Piao, S.; Ciais, P.; Lombardozzi, D.; Wang, Y.; Ryu, Y.; Chen, G.; Dong, W.; Hu, Z.; et al. Increased atmospheric vapor pressure deficit reduces global vegetation growth. Sci. Adv. 2019, 5, eaax1396. [Google Scholar] [CrossRef]
  14. Lucht, W.; Prentice, I.C.; Myneni, R.B.; Sitch, S.; Friedlingstein, P.; Cramer, W.; Bousquet, P.; Buermann, W.; Smith, B. Climatic Control of the High-Latitude Vegetation Greening Trend and Pinatubo Effect. Science 2002, 296, 1687–1689. [Google Scholar] [CrossRef]
  15. Zhu, Z.; Piao, S.; Myneni, R.B.; Huang, M.; Zeng, Z.; Canadell, J.G.; Ciais, P.; Sitch, S.; Friedlingstein, P.; Arneth, A.; et al. Greening of the Earth and its drivers. Nat. Clim. Chang. 2016, 6, 791–795. [Google Scholar] [CrossRef]
  16. Wang, Z.; Li, J.; Hou, J.; Zhao, K.; Wu, R.; Sun, B.; Lu, J.; Liu, Y.; Cui, C.; Liu, J. Enhanced evapotranspiration induced by vegetation restoration may pose water resource risks under climate change in the Yellow River Basin. Ecol. Indic. 2024, 162, 112060. [Google Scholar] [CrossRef]
  17. Li, X.; Xu, X.; Tian, W.; Tian, J.; He, C. Contribution of climate change and vegetation restoration to interannual variability of evapotranspiration in the agro–pastoral ecotone in northern China. Ecol. Indic. 2023, 154, 110485. [Google Scholar] [CrossRef]
  18. Kreuzwieser, J.; Rennenberg, H. Molecular and physiological responses of trees to waterlogging stress. Plant Cell Environ. 2014, 37, 2245–2259. [Google Scholar] [CrossRef]
  19. Lan, X.; Xie, Y.; Liu, Z.; Yang, T.; Huang, L.; Chen, X.; Chen, X.; Lin, K.; Cheng, L. Vegetation greening accelerated hydrological drought in two-thirds of river basins over China. J. Hydrol. 2024, 637, 131436. [Google Scholar] [CrossRef]
  20. Zhao, M.; Running, S.W. Drought-Induced Reduction in Global Terrestrial Net Primary Production from 2000 Through 2009. Science 2010, 329, 940–943. [Google Scholar] [CrossRef]
  21. Xu, W.; Yuan, W.; Wu, D.; Zhang, Y.; Shen, R.; Xia, X.; Ciais, P.; Liu, J. Impacts of record-breaking compound heatwave and drought events in 2022 China on vegetation growth. Agric. For. Meteorol. 2024, 344, 109799. [Google Scholar] [CrossRef]
  22. Xu, H.-j.; Wang, X.-p.; Zhao, C.-y.; Yang, X.-m. Diverse responses of vegetation growth to meteorological drought across climate zones and land biomes in northern China from 1981 to 2014. Agric. For. Meteorol. 2018, 262, 1–13. [Google Scholar] [CrossRef]
  23. Ye, J.; Gao, Z.; Wu, X.; Lu, Z.; Li, C.; Wang, X.; Chen, L.; Cui, G.; Yu, M.; Yan, G.; et al. Impact of increased temperature on spring wheat yield in northern China. Food Energy Secur. 2021, 10, 368–378. [Google Scholar] [CrossRef]
  24. Li, Y.; Huang, Y.; Li, Y.; Zhang, H.; Fan, J.; Deng, Q.; Wang, X. Spatiotemporal heterogeneity in meteorological and hydrological drought patterns and propagations influenced by climatic variability, LULC change, and human regulations. Sci. Rep. 2024, 14, 5965. [Google Scholar] [CrossRef]
  25. Wu, J.; Miao, C.; Zheng, H.; Duan, Q.; Lei, X.; Li, H. Meteorological and Hydrological Drought on the Loess Plateau, China: Evolutionary Characteristics, Impact, and Propagation. J. Geophys. Res. Atmos. 2018, 123, 11–569. [Google Scholar] [CrossRef]
  26. Apurv, T.; Sivapalan, M.; Cai, X. Understanding the Role of Climate Characteristics in Drought Propagation. Water Resour. Res. 2017, 53, 9304–9329. [Google Scholar] [CrossRef]
  27. Van Loon, A.F.; Tijdeman, E.; Wanders, N.; Van Lanen, H.A.J.; Teuling, A.J.; Uijlenhoet, R. How climate seasonality modifies drought duration and deficit. J. Geophys. Res. Atmos. 2014, 119, 4640–4656. [Google Scholar] [CrossRef]
  28. Zhan, C.; Liang, C.; Zhao, L.; Jiang, S.; Niu, K.; Zhang, Y. Drought-related cumulative and time-lag effects on vegetation dynamics across the Yellow River Basin, China. Ecol. Indic. 2022, 143, 109409. [Google Scholar] [CrossRef]
  29. Vicente-Serrano, S.M. Response of vegetation to drought time-scales across global land biomes. Proc. Natl. Acad. Sci. USA 2013, 110, 52–57. [Google Scholar] [CrossRef]
  30. Wu, D.; Vargas, G.G.; Powers, J.S.; McDowell, N.G.; Becknell, J.M.; Pérez-Aviles, D.; Medvigy, D.; Liu, Y.; Katul, G.G.; Calvo-Alvarado, J.C.; et al. Reduced ecosystem resilience quantifies fine-scale heterogeneity in tropical forest mortality responses to drought. Glob. Chang. Biol. 2021, 28, 2081–2094. [Google Scholar] [CrossRef]
  31. Jiang, X.; Fang, X.; Zhu, Q.; Jin, J.; Ren, L.; Jiang, S.; Yan, Y.; Yuan, S.; Liao, M. Time-series satellite images reveal abrupt changes in vegetation dynamics and possible determinants in the Yellow River Basin. Agric. For. Meteorol. 2024, 355, 110124. [Google Scholar] [CrossRef]
  32. Niu, H.; Xiu, Z.; Xiao, D. Impact of land-use change on ecological vulnerability in the Yellow River Basin based on a complex network model. Ecol. Indic. 2024, 166, 112212. [Google Scholar] [CrossRef]
  33. Shen, J.; Zhao, M.; Tan, Z.; Zhu, L.; Guo, Y.; Li, Y.; Wu, C. Ecosystem service trade-offs and synergies relationships and their driving factor analysis based on the Bayesian belief Network: A case study of the Yellow River Basin. Ecol. Indic. 2024, 163, 112070. [Google Scholar] [CrossRef]
  34. Ci, F.; Wang, Z.; Hu, Q. Spatial pattern characteristics and optimization policies of low-carbon innovation levels in the urban agglomerations in the Yellow River Basin. J. Clean. Prod. 2024, 439, 140856. [Google Scholar] [CrossRef]
  35. Wu, J.; Chen, X. Spatiotemporal trends of dryness/wetness duration and severity: The respective contribution of precipitation and temperature. Atmos. Res. 2019, 216, 176–185. [Google Scholar] [CrossRef]
  36. Vicente-Serrano, S.M.; Beguería, S.; López-Moreno, J.I. A Multiscalar Drought Index Sensitive to Global Warming: The Standardized Precipitation Evapotranspiration Index. J. Clim. 2010, 23, 1696–1718. [Google Scholar] [CrossRef]
  37. Liang, R.G. Spatial-Temporal Variation Characteristics and Influencing Factors of Drought in Karst Region of Southwest China Based on Remote Sensing. Master’s Thesis, Guizhou Normal University, Guiyang, China, 2022. [Google Scholar]
  38. Xue, H.; Li, Y.; Dong, G. Analysis of Spatial-temporal Variation Characteristics of Meteorological Drought in the Hexi Corridor Based on SPEI Index. Chin. J. Agrometeorol. 2022, 43, 932–934. [Google Scholar] [CrossRef]
  39. Zhang, X.; Duan, Y.; Duan, J.; Jian, D.; Ma, Z. A daily drought index based on evapotranspiration and its application in regional drought analyses. Sci. China Earth Sci. 2021, 65, 317–336. [Google Scholar] [CrossRef]
  40. Li, Y.; Qin, Y. The Response of Net Primary Production to Climate Change: A Case Study in the 400 mm Annual Precipitation Fluctuation Zone in China. Int. J. Environ. Res. Public Health 2019, 16, 1497. [Google Scholar] [CrossRef]
  41. Ding, Y.; Xu, J.; Wang, X.; Cai, H.; Zhou, Z.; Sun, Y.; Shi, H. Propagation of meteorological to hydrological drought for different climate regions in China. J. Environ. Manag. 2021, 283, 111980. [Google Scholar] [CrossRef]
  42. Ding, Y.; Xu, J.; Wang, X.; Peng, X.; Cai, H. Spatial and temporal effects of drought on Chinese vegetation under different coverage levels. Sci. Total Environ. 2020, 716, 137166. [Google Scholar] [CrossRef] [PubMed]
  43. Xu, Y.; Zhang, X.; Hao, Z.; Singh, V.P.; Hao, F. Characterization of agricultural drought propagation over China based on bivariate probabilistic quantification. J. Hydrol. 2021, 598, 126194. [Google Scholar] [CrossRef]
  44. Jiang, T.; Su, X.; Singh, V.P.; Zhang, G. Spatio-temporal pattern of ecological droughts and their impacts on health of vegetation in Northwestern China. J. Environ. Manag. 2022, 305, 114356. [Google Scholar] [CrossRef]
  45. Ge, W.; Han, J.; Zhang, D.; Wang, F. Divergent impacts of droughts on vegetation phenology and productivity in the Yungui Plateau, southwest China. Ecol. Indic. 2021, 127, 107743. [Google Scholar] [CrossRef]
  46. Wang, C.-P.; Huang, M.-T.; Zhai, P.-M. Change in drought conditions and its impacts on vegetation growth over the Tibetan Plateau. Adv. Clim. Chang. Res. 2021, 12, 333–341. [Google Scholar] [CrossRef]
  47. Chen, J.; Shao, Z.; Huang, X.; Zhuang, Q.; Dang, C.; Cai, B.; Zheng, X.; Ding, Q. Assessing the impact of drought-land cover change on global vegetation greenness and productivity. Sci. Total Environ. 2022, 852, 158499. [Google Scholar] [CrossRef]
  48. Wang, S.; Zhang, Y.; Ju, W.; Porcar-Castell, A.; Ye, S.; Zhang, Z.; Brümmer, C.; Urbaniak, M.; Mammarella, I.; Juszczak, R.; et al. Warmer spring alleviated the impacts of 2018 European summer heatwave and drought on vegetation photosynthesis. Agric. For. Meteorol. 2020, 295, 108195. [Google Scholar] [CrossRef]
  49. Frank, D.; Reichstein, M.; Bahn, M.; Thonicke, K.; Frank, D.; Mahecha, M.D.; Smith, P.; van der Velde, M.; Vicca, S.; Babst, F.; et al. Effects of climate extremes on the terrestrial carbon cycle: Concepts, processes and potential future impacts. Glob. Chang. Biol. 2015, 21, 2861–2880. [Google Scholar] [CrossRef]
  50. Sippel, S.; Reichstein, M.; Ma, X.; Mahecha, M.D.; Lange, H.; Flach, M.; Frank, D. Drought, Heat, and the Carbon Cycle: A Review. Curr. Clim. Chang. Rep. 2018, 4, 266–286. [Google Scholar] [CrossRef]
  51. Li, D.; Li, X.; Li, Z.; Fu, Y.; Zhang, J.; Zhao, Y.; Wang, Y.; Liang, E.; Rossi, S. Drought limits vegetation carbon sequestration by affecting photosynthetic capacity of semi-arid ecosystems on the Loess Plateau. Sci. Total Environ. 2024, 912, 168778. [Google Scholar] [CrossRef]
  52. Cao, S.; He, Y.; Zhang, L.; Chen, Y.; Yang, W.; Yao, S.; Sun, Q. Spatiotemporal characteristics of drought and its impact on vegetation in the vegetation region of Northwest China. Ecol. Indic. 2021, 133, 108420. [Google Scholar] [CrossRef]
  53. Song, W.; Song, R.; Zhao, Y.; Zhao, Y. Research on the characteristics of drought stress state based on plant stem water content. Sustain. Energy Technol. Assess. 2023, 56, 103080. [Google Scholar] [CrossRef]
  54. Li, Q.; Xue, Y. Simulated impacts of land cover change on summer climate in the Tibetan Plateau. Environ. Res. Lett. 2010, 5, 015102. [Google Scholar] [CrossRef]
  55. Jiang, W.; Wang, L.; Zhang, M.; Yao, R.; Chen, X.; Gui, X.; Sun, J.; Cao, Q. Analysis of drought events and their impacts on vegetation productivity based on the integrated surface drought index in the Hanjiang River Basin, China. Atmos. Res. 2021, 254, 105536. [Google Scholar] [CrossRef]
  56. Jha, S.; Srivastava, R. Impact of drought on vegetation carbon storage in arid and semi-arid regions. Remote Sens. Appl. Soc. Environ. 2018, 11, 22–29. [Google Scholar] [CrossRef]
  57. Zheng, L.; Lu, J.; Chen, X. Drought offsets the vegetation greenness-induced gross primary productivity from 1982 to 2018 in China. J. Hydrol. 2024, 632, 130881. [Google Scholar] [CrossRef]
  58. Gouveia, C.M.; Trigo, R.M.; Beguería, S.; Vicente-Serrano, S.M. Drought impacts on vegetation activity in the Mediterranean region: An assessment using remote sensing data and multi-scale drought indicators. Glob. Planet. Chang. 2017, 151, 15–27. [Google Scholar] [CrossRef]
  59. Scheiter, S.; Kumar, D.; Pfeiffer, M.; Langan, L. Modeling drought mortality and resilience of savannas and forests in tropical Asia. Ecol. Model. 2024, 494, 110783. [Google Scholar] [CrossRef]
  60. Holtmann, A.; Huth, A.; Bohn, F.; Fischer, R. Assessing the impact of multi-year droughts on German forests in the context of increased tree mortality. Ecol. Model. 2024, 492, 110696. [Google Scholar] [CrossRef]
  61. Socha, J.; Hawryło, P.; Tymińska-Czabańska, L.; Reineking, B.; Lindner, M.; Netzel, P.; Grabska-Szwagrzyk, E.; Vallejos, R.; Reyer, C.P.O. Higher site productivity and stand age enhance forest susceptibility to drought-induced mortality. Agric. For. Meteorol. 2023, 341, 109680. [Google Scholar] [CrossRef]
  62. Shen, C.; Ma, R. Estimating suitable hydrothermal conditions for vegetation growth for land use cover across China based on maximum-probability-density monthly NDVI. Remote Sens. Appl. Soc. Environ. 2023, 30, 100958. [Google Scholar] [CrossRef]
  63. Weng, Z.; Niu, J.; Guan, H.; Kang, S. Three-dimensional linkage between meteorological drought and vegetation drought across China. Sci. Total Environ. 2023, 859, 160300. [Google Scholar] [CrossRef]
  64. Jiang, L.; Guli·Jiapaer; Bao, A.; Guo, H.; Ndayisaba, F. Vegetation dynamics and responses to climate change and human activities in Central Asia. Sci. Total Environ. 2017, 599–600, 967–980. [Google Scholar] [CrossRef]
  65. Yuan, M.; Zhao, L.; Lin, A.; Wang, L.; Li, Q.; She, D.; Qu, S. Impacts of preseason drought on vegetation spring phenology across the Northeast China Transect. Sci. Total Environ. 2020, 738, 140297. [Google Scholar] [CrossRef]
  66. Rahmati, M.; Graf, A.; Poppe Terán, C.; Amelung, W.; Dorigo, W.; Franssen, H.-J.H.; Montzka, C.; Or, D.; Sprenger, M.; Vanderborght, J.; et al. Continuous increase in evaporative demand shortened the growing season of European ecosystems in the last decade. Commun. Earth Environ. 2023, 4, 236. [Google Scholar] [CrossRef]
  67. Li, Z.; Bai, X.; Tan, Q.; Zhao, C.; Li, Y.; Luo, G.; Chen, F.; Li, C.; Ran, C.; Zhang, S.; et al. Dryness stress weakens the sustainability of global vegetation cooling. Sci. Total Environ. 2024, 909, 168474. [Google Scholar] [CrossRef]
  68. Wu, C.; Zhong, L.; Yeh, P.J.F.; Gong, Z.; Lv, W.; Chen, B.; Zhou, J.; Li, J.; Wang, S. An evaluation framework for quantifying vegetation loss and recovery in response to meteorological drought based on SPEI and NDVI. Sci. Total Environ. 2024, 906, 167632. [Google Scholar] [CrossRef]
  69. Akula, N.N.; Abdelhakim, L.; Knazovický, M.; Ottosen, C.-O.; Rosenqvist, E. Plant responses to co-occurring heat and water deficit stress: A comparative study of tolerance mechanisms in old and modern wheat genotypes. Plant Physiol. Biochem. 2024, 210, 108595. [Google Scholar] [CrossRef]
  70. Zhao, H.; Huang, Y.; Wang, X.; Li, X.; Lei, T. The performance of SPEI integrated remote sensing data for monitoring agricultural drought in the North China Plain. Field Crop. Res. 2023, 302, 109041. [Google Scholar] [CrossRef]
  71. Liu, S.; Xue, L.; Xiao, Y.; Yang, M.; Liu, Y.; Han, Q.; Ma, J. Dynamic process of ecosystem water use efficiency and response to drought in the Yellow River Basin, China. Sci. Total Environ. 2024, 934, 173339. [Google Scholar] [CrossRef] [PubMed]
  72. Xu, Y.; Dai, Q.-Y.; Lu, Y.-G.; Zhao, C.; Huang, W.-T.; Xu, M.; Feng, Y.-X. Identification of ecologically sensitive zones affected by climate change and anthropogenic activities in Southwest China through a NDVI-based spatial-temporal model. Ecol. Indic. 2024, 158, 111482. [Google Scholar] [CrossRef]
  73. Zhang, Q.; Kong, D.; Singh, V.P.; Shi, P. Response of vegetation to different time-scales drought across China: Spatiotemporal patterns, causes and implications. Glob. Planet. Chang. 2017, 152, 1–11. [Google Scholar] [CrossRef]
  74. Xiao, L.; Zhou, J.; Wu, X.; Anas Khan, M.; Zhao, S.; Wu, X. The dominant influence of terrain and geology on vegetation mortality in response to drought: Exploring resilience and resistance. Catena 2024, 243, 108156. [Google Scholar] [CrossRef]
  75. Zhang, F.; Geng, M.; Wu, Q.; Liang, Y. Study on the spatial-temporal variation in evapotranspiration in China from 1948 to 2018. Sci. Rep. 2020, 10, 17139. [Google Scholar] [CrossRef]
  76. Hollunder, R.K.; Mariotte, P.; Carrijo, T.T.; Holmgren, M.; Luber, J.; Stein-Soares, B.; Guidoni-Martins, K.G.; Ferreira-Santos, K.; Scarano, F.R.; Garbin, M.L. Topography and vegetation structure mediate drought impacts on the understory of the South American Atlantic Forest. Sci. Total Environ. 2021, 766, 144234. [Google Scholar] [CrossRef]
  77. Konapala, G.; Mishra, A.K.; Wada, Y.; Mann, M.E. Climate change will affect global water availability through compounding changes in seasonal precipitation and evaporation. Nat. Commun. 2020, 11, 3044. [Google Scholar] [CrossRef]
  78. Padrón, R.S.; Gudmundsson, L.; Decharme, B.; Ducharne, A.; Lawrence, D.M.; Mao, J.; Peano, D.; Krinner, G.; Kim, H.; Seneviratne, S.I. Observed changes in dry-season water availability attributed to human-induced climate change. Nat. Geosci. 2020, 13, 477–481. [Google Scholar] [CrossRef]
  79. Liu, M.; Huang, J.; Sun, A.Y.; Wang, K.; Chen, H. What roles can water-stressed vegetation play in agricultural droughts? Sci. Total Environ. 2022, 803, 149810. [Google Scholar] [CrossRef]
  80. Buermann, W.; Forkel, M.; O’Sullivan, M.; Sitch, S.; Friedlingstein, P.; Haverd, V.; Jain, A.K.; Kato, E.; Kautz, M.; Lienert, S.; et al. Widespread seasonal compensation effects of spring warming on northern plant productivity. Nature 2018, 562, 110–114. [Google Scholar] [CrossRef] [PubMed]
  81. Li, Y.; Huang, S.; Wang, H.; Huang, Q.; Li, P.; Zheng, X.; Wang, Z.; Jiang, S.; Leng, G.; Li, J.; et al. Warming and greening exacerbate the propagation risk from meteorological to soil moisture drought. J. Hydrol. 2023, 622, 129716. [Google Scholar] [CrossRef]
  82. Huang, S.; Zhang, X.; Yang, L.; Chen, N.; Nam, W.-H.; Niyogi, D. Urbanization-induced drought modification: Example over the Yangtze River Basin, China. Urban Clim. 2022, 44, 101231. [Google Scholar] [CrossRef]
Figure 1. The geographical location (a) and digital elevation model (b) of the YRB.
Water 16 02416 g001
Figure 2. Spatial distribution of SPEI (a) and percentage of different SPEI grades (b).
Water 16 02416 g002
Figure 3. Spatial distribution of SPEI trend (a), trend of SPEI (b), significance test of SPEI trend (c), and percentage of significance test (d).
Water 16 02416 g003
Figure 4. The spatial distribution of significant changes in NDVI trend from 2003 to 2020 (a), the percentage of significant changes (b), the trend of NDVI (c), and the spatial distribution of NDVI (d).
Water 16 02416 g004
Figure 5. Significance test of monthly scale NDVI trend from 2003 to 2020.
Water 16 02416 g005
Figure 6. The spatial distribution of correlation between NDVI and SPEI from 2003 to 2020 (a), percentage of correlation grade (b), the spatial distribution of CC significance of NDVI and SPEI (c), and percentage of CC significance of NDVI and SPEI (d).
Water 16 02416 g006
Figure 7. The spatial distribution of the CC between SPEI-1 and NDVI.
Water 16 02416 g007
Figure 8. The spatial distribution of the CC between SPEI-3 and NDVI.
Water 16 02416 g008
Figure 9. The spatial distribution of the CC between SPEI-6 and NDVI.
Water 16 02416 g009
Figure 10. The process of spreading the area of positive correlation between SPEI and NDVI at different temporal scales.
Water 16 02416 g010
Figure 11. The process of spreading the area of negative correlation between SPEI and NDVI at different temporal scales.
Water 16 02416 g011
Figure 12. The zonal division of aridity in the YRB (a), the percentage area of different arid and humid zones, as well as the CC between SPEI and NDVI (b).
Water 16 02416 g012
Table 1. Classification of SPEI.
Drought GradeSPEI Value
Extreme droughtSPEI ≤ −2.00
Severe drought−2 < SPE I ≤ −1.5
Moderate drought−1.5 < SPEI ≤ −1
Mild drought−1 < SPEI ≤ −0.5
NormalSPEI ≥ −0.5
Table 2. Correlation coefficient grading.
Level of CCCC
High positive correlation0.8 ≤ CC < 1.0
Strong positive correlation0.6 ≤ CC < 0.8
Moderate positive correlation0.4 ≤ CC < 0.6
Weak positive correlation0.2 ≤ CC < 0.4
No correlation−0.2 < CC < 0.2
Weak negative correlation−0.4 < CC ≤ −0.2
Moderate negative correlation−0.6 < CC ≤ −0.4
Strong negative correlation−0.8 < CC ≤ −0.6
High negative correlation−1 < CC ≤ −0.8
Disclaimer/Publisher’s Note: The statements, opinions and data contained in all publications are solely those of the individual author(s) and contributor(s) and not of MDPI and/or the editor(s). MDPI and/or the editor(s) disclaim responsibility for any injury to people or property resulting from any ideas, methods, instructions or products referred to in the content.

