Article

Characterization of Nanoparticles in Drinking Water Using Field-Flow Fractionation Coupled with Multi-Angle Light Scattering and Inductively Coupled Plasma Mass Spectrometry

by
Talie Zarei
1,2,
Marcos B. A. Colombo
3,
Elmar C. Fuchs
1,2,*,
Herman L. Offerhaus
2,
Denis Gebauer
4 and
Luewton L. F. Agostinho
1,3
1
Wetsus, Centre of Excellence for Sustainable Water Technology, 8911 MA Leeuwarden, The Netherlands
2
Optical Sciences Group, Faculty of Science and Technology (TNW), University of Twente, 7522 NB Enschede, The Netherlands
3
Water Technology Research Group, NHL Stenden University of Applied Sciences, 8917 DD Leeuwarden, The Netherlands
4
Institute of Inorganic Chemistry, Leibniz University Hannover, 30167 Hannover, Germany
*
Author to whom correspondence should be addressed.
Water 2024, 16(17), 2419; https://doi.org/10.3390/w16172419
Submission received: 18 July 2024 / Revised: 21 August 2024 / Accepted: 23 August 2024 / Published: 27 August 2024

Abstract

:
The current absence of well-established and standardized methods for characterizing submicrometer- and nano-sized particles in water samples presents a significant analytical challenge. With the increasing utilization of nanomaterials, the potential for unintended exposure escalates. The widespread and persistent pollution of water by micro- and nanoplastics globally is a concern that demands attention, not only to reduce pollution but also to develop methods for analyzing these pollutants. Additionally, the analysis of naturally occurring nano entities such as bubbles and colloidal matter poses challenges due to the lack of systematic and consistent methodologies. This study presents Asymmetric Flow Field-Flow Fractionation (AF4) separation coupled with a UV-VIS spectrometer followed by Multi-Angle Light Scattering (MALS) for detection and size characterization of nanometric entities. It is coupled with an Inductively Coupled Plasma Mass Spectrometer (ICP-MS) for elemental analysis. Water samples from different sources, such as untreated mountain spring water, groundwater, and bottled drinking water, were analyzed. The system was calibrated using pure particle standards of different metallic compositions. Our study demonstrates the capability of AF4-UV-MALS-ICP-MS to detect metals such as Al, Ba, Cu, and Zn in particles of around 200 nm diameter and Mg associated with very small particles between 1.5 and 10 nm in different drinking water samples.

1. Introduction

Naturally occurring nano-sized particles are prevalent in water samples irrespective of their origin. However, due to their unique properties, metal, metal oxide, and metalloid nanoparticles are increasingly being applied in industrial applications and potentially reaching water bodies. In terms of production, nano silica (nSiO2), nano titania (nTiO2), and nano zinc oxide (nZnO) are in the highest demand. Pulit-Prociak et al. estimated the global production in 2014 to be at least 185,000 tons/year for nSiO2, 60,000 tons/year for nTiO2, and 32,000 tons/year for nZnO. Among metallic nanomaterials, nano silver (nAg) is the most produced, with an estimated 135 tons/year in 2014 [1]. In the food industry, nanoparticles such as nAg, nZn, and nCu are employed as antimicrobial agents in packaging [2]. Titanium dioxide (TiO2) has been used as a food additive. Although its use as a food coloring agent is still permitted in some regions, the European Union banned it in 2022 due to concerns over potential genotoxicity [3]. The paints and coatings industry utilizes various nanoparticles, including nSiO2, nAg, nCu, and nTiO2, primarily to delay aging. The natural degradation of white TiO2 pigment, initially added as microparticles, can cause the release of nTiO2 into the environment [4]. The cosmetics industry employs metal and oxide nanoparticles, notably nZnO and nTiO2, in sunscreens for their UV radiation-blocking properties [5]. Additionally, nAg particles are used for their antimicrobial properties in sensor development [6] and the production of electrically conductive materials [7]. The tunability of gold nanoparticles (nAu) makes them valuable for biomedical applications, including treatments against tumor cells and drug delivery [8]. Various types of nanoparticles are explored for environmental remediation, particularly those with adsorbent or catalytic properties, for removing micropollutants, heavy metals, and other contaminants from wastewater and drinking water [9,10]. Materials containing nanoparticles are not always disposed of properly, potentially entering wastewater or surface water directly [11,12]. Toxicological studies have demonstrated that metal or oxide nanoparticles can cause acute toxicity to microorganisms and some aquatic organisms. The effects of long-term exposure to engineered nanomaterials remain largely unknown [13].
The physical and chemical aspects of natural nanometric entities also require further research. DOLLOPs (Dynamically Ordered Liquid-Like Oxyanion Polymers) represent a notable example [14]. Research on DOLLOPs primarily focuses on their formation mechanisms as CaCO3 nucleation precursors [15,16]. Traditionally, the crystallization of CaCO3 is described using classical nucleation theory, suggesting the stochastic growth of unstable precursors until a critical nucleus of solid CaCO3 initiates crystal formation. However, recent theories propose that crystal precursors consist of stable nanometric-sized polymers of CaCO3, transforming into dense liquid nanodroplets upon initial liquid–liquid separation, gradually aggregating and forming a liquid-like intermediate phase before solid phase precipitation [14], which potentially can agglomerate on the surface of charged nanobubbles [17]. It has been suggested that such nanobubbles can also occur naturally, depending on the pH [18]. A deeper understanding of nano entities such as DOLLOPs could facilitate the development of novel water softening strategies or interventions to address issues related to hard water [19]. Furthermore, proteins, polysaccharides, lipids, and various macromolecules exist at the nanoscale and can adsorb onto metals (e.g., Fe, Mn, Al, Cu, Ni), forming colloids of diverse sizes [20,21,22]. Microorganisms play a significant role in converting metal oxides or ions into sulfide nanoparticles [23]. Silicate colloids, predominantly found in groundwater due to mineral erosion, are recognized for their ability to scavenge and transport toxic substances in aquatic environments [24]. Considering their widespread applications, increasing production rates, and associated environmental hazards, a thorough assessment of the fate and toxicity of nanoparticles in the environment is urgently needed.
In this study, we present Asymmetric Flow Field-Flow Fractionation (AF4) separation in combination with a UV-VIS spectrometer, followed by Multi-Angle Light Scattering (MALS) for the detection and size characterization of nanoscale entities. This setup is further connected to an Inductively Coupled Plasma Mass Spectrometer (ICP-MS) to enable elemental analysis of the various fractions. The analysis involves water samples from various sources, such as untreated mountain spring water, treated groundwater, and bottled drinking water, to represent different types of drinking water production plants. The system was calibrated using pure particle standards of various metallic compositions. Our study illustrates the capability of AF4-UV-MALS-ICP-MS to detect metals such as Al, Ba, Cu, and Zn in particles of approximately 200 nm in diameter. Additionally, the system was able to identify Mg associated with very small particles ranging from 1.5 to 10 nm in different drinking water samples.

2. Theory

2.1. Field Flow Fractionation

AF4, a Field Flow Fractionation technique, involves injecting the sample carried by an aqueous mobile phase into a narrow channel [25]. First, a focusing step concentrates the sample against a semipermeable membrane strip, achieved by a perpendicular crossflow. Smaller particles diffuse more easily against the crossflow, positioning them higher in the channel. Subsequently, during elution, the sample flows forward under a laminar flow with a parabolic velocity profile along the channel height. Smaller particles, positioned higher in the channel, emerge earlier. The retention time tR of the particles is expressible based on their diffusion coefficient D, cross flow Vx, detector flow Vd, and channel height w, as initially described by Giddings and Wahlund [26],
t R = w 2 6 D ln 1 + V x V d .
Additionally, the Stokes–Einstein relation,
D = k B T 6 π η r H ,
describes the diffusion D of spherical particles through a liquid based on the Boltzmann constant kB, absolute temperature T, dynamic viscosity η, and hydrodynamic radius rH. The retention time tR can be directly related to the hydrodynamic radius by inserting the Stokes–Einstein relation into Equation (1),
t R = w 2 π η r H k B T ln 1 + V x V d ,
describing how variations in crossflow can delay or accelerate particle elution. Other factors impacting AF4 operation include the membrane composition, particle surface charge, and mobile phase composition (pH and ionic strength), which influence the interactions between particles and the membrane, as well as electrical double-layer characteristics. Therefore, while primarily a physical separation method, AF4 necessitates consideration of various physicochemical factors to ensure method reliability and avoid potential issues.
After separation by AF4, the sample was first analyzed for UV absorption and subsequently entered a Multi-Angle Light Scattering (MALS) section employing a laser and multiple detectors positioned at various angles around the flow to measure the light scattered by the particles in the stream. MALS is a derivative of the Static Light Scattering (SLS) techniques that assess the angular dependence of light scattering to determine the particle’s radius of gyration (rg). Equation (4) presents a simplified expression for the relation between the radius and the angular scattering [27],
R θ K * c = M w 1 16 π 2 3 λ 2 r g 2 sin 2 θ 2 ,
where Rθ represents the Rayleigh ratio, indicative of the scattered light intensity exceeding that of the pure solvent, as a function of the scattering angle (θ). The optical constant K* is determined by the refractive properties of both the solvent and the sample, while Mw denotes the weight-average molar mass of the sample, c signifies the sample concentration, and λ represents the incident laser wavelength. Equation (4) applies to low concentrations, small particles, and low scattering angles only. For larger particles, the angular dependence must be accounted for differently, including the effects of the particle’s shape, and for higher concentrations, corrections for multiple scattering are necessary.

2.2. Calcium Carbonate Nucleation

Calcium carbonate plays a crucial role in biomineralization processes and geosciences in general, forming both biological (reefs and ocean sediments) as well as geological scales that bind a significant amount of CO2, affecting ocean chemistry and contributing to water hardness. It serves as a model for studying both classical [28] and nonclassical [29] mineral crystallization and has been researched for over a century. Despite this, early crystallization stages, particularly prenucleation, remain poorly understood. Amorphous calcium carbonate (ACC) is recognized as an intermediate in mineralization processes [30,31,32,33], with evidence suggesting that multiple ACC species exist. ACC, a transient precursor in biomineralization, is preceded by species forming immediately after ion contact, before nucleation, as postulated [34] and suggested by modeling [35]. Recent studies [14] reveal stable prenucleation ion clusters, even in undersaturated solutions, characterized by equilibrium thermodynamics and a multiple-binding model [15]. These clusters, composed of alternating calcium and carbonate ions, exhibit a dynamic topology of chains, branches, and rings. The existence of dynamic, flexible, and hydrated precursors explains the formation of liquid-like amorphous states and the non-classical growth behavior of ACC. These dynamically ordered liquid-like oxyanion polymer clusters (DOLLOPs) are crucial in calcium carbonate nucleation and may also influence the crystallization of other minerals.
Figure 1 shows a schematic of the different mechanisms and stages of calcium carbonate precipitation.
Simulations [36] suggest that water plays a key role in ACC nucleation, since their hydration is driven by thermodynamic stability, with water incorporation increasing as particle size grows. Although the enthalpy decreases consistently with increasing water levels in ACC particles, accounting for the entropic penalty of water removal from the bulk reveals a free energy minimum. The preferred stoichiometry of ACC depends on particle size; as the particles grow, the water content per formula unit of calcium carbonate also increases. This effect can lead to a drier core and wetter shell structure.
Overall, experimental and simulation data on the precipitation of calcium carbonate supports a nonclassical nucleation and growth mechanism. The transition from amorphous (ACC) to crystalline CaCO3 (Calcite, Aragonite, or Vaterite) may follow a classical or non-classical nucleation process triggered by environmental factors, representing a second growth stage.
A simple, general definition of water hardness is the amount of dissolved calcium and magnesium in the water, and for both ions, the nucleation pathways mentioned above might occur. Naturally, a determination of the concentration of both of these elements is of interest in the context of the analysis presented. However, the ICP-MS operating conditions in STD mode made detecting calcium problematic due to the isobaric interference of 40Ar+ on its most abundant isotope, 40Ca. Polyatomic interferences of 40Ar16O+ and 40Ca16O+ also occur with the main iron isotope, 56Fe [37]. These interferences prevent the signals of these metals from being measured accurately, which is why we focused our analysis on the ions that could be detected without any interference as a compromise for maintaining the higher sensitivity by applying STD mode over KED mode (which would have made the calcium detection plausible). Since the aqueous chemistry of magnesium and calcium ions concerning scaling is comparable and it is known that these ions can crystallize together as calcium magnesium carbonate also on the nanoscale [38], and because the CaCO3 compound is used as a representative system for studying the processes of nucleation and crystallization in general [39,40,41,42,43], we chose to use magnesium as a tracer for the possible presence of (calcium magnesium carbonate-)DOLLOPs. We are planning to apply different analysis conditions in the ICP-MS, such as collision/reaction cells, or to test alternative plasma conditions, to avoid these interferences in a subsequent work in the future.
In the present work, we present experimental data corroborating the existence of both magnesium-containing DOLLOPs and amorphous magnesium(calcium)carbonate in natural waters, as the presence of magnesium can be correlated to scatterers of a few or a few hundred nanometers in size, respectively.

3. Materials and Methods

3.1. AF4-UV-MALS-ICP-MS Instrumentation and Software

Size fractionation of aqueous samples was performed using an Eclipse Neon (Wyatt Technology, Goleta, CA, USA) equipped with a short separation channel (153 × 22 mm) set at a fixed height of 250 μm. The focusing position of particles in the channel was consistently set at 25% of the channel length for all experiments. A 1260 Infinity II HPLC system (Agilent Technologies, Santa Clara, CA, USA) with a pump, degasser, and auto-sampler was utilized to pump the mobile phase and sample injections into the AF4 channel. The mobile phase, filtered using VacuCap® filters (Pall Corporation, New York, NY, USA) with 0.1 μm Supor® membranes, was supplemented with an inline filter housing a 0.1 μm PVDF membrane (Merck Millipore, Burlington, VT, USA) post-HPLC pump. The separation channel was equipped with a 10 kDa Polyethersulfone (PES) membrane (Microdyn Nadir®, Wiesbaden, Germany) and was optimized for a multi-step consecutive method with 0.2 mM NH4HCO3 as the mobile phase and a sample volume of 750 μL. All samples were filtered using 1.2 μm glass fiber filters (VWR Scientific, Radnor, PA, USA) prior to the analysis.
A UV-VIS Variable Wavelength Detector (VWD), 1260 Infinity II (Agilent Technologies), was positioned as the first detector post-separation channel, and the UV absorption of the fractionated solute was measured at 280 nm using a deuterium lamp as the light source. A Dawn Neon™ MALS device (Wyatt Technology, Goleta, CA, USA) followed, for the determination of the particle radii. Data from light scattering and UV absorption measurements were processed using Astra 8.2.0 software (Wyatt Technology). Radius determination was based on the Debye fitting formalism [44] with a 2nd-degree polynomial fit.
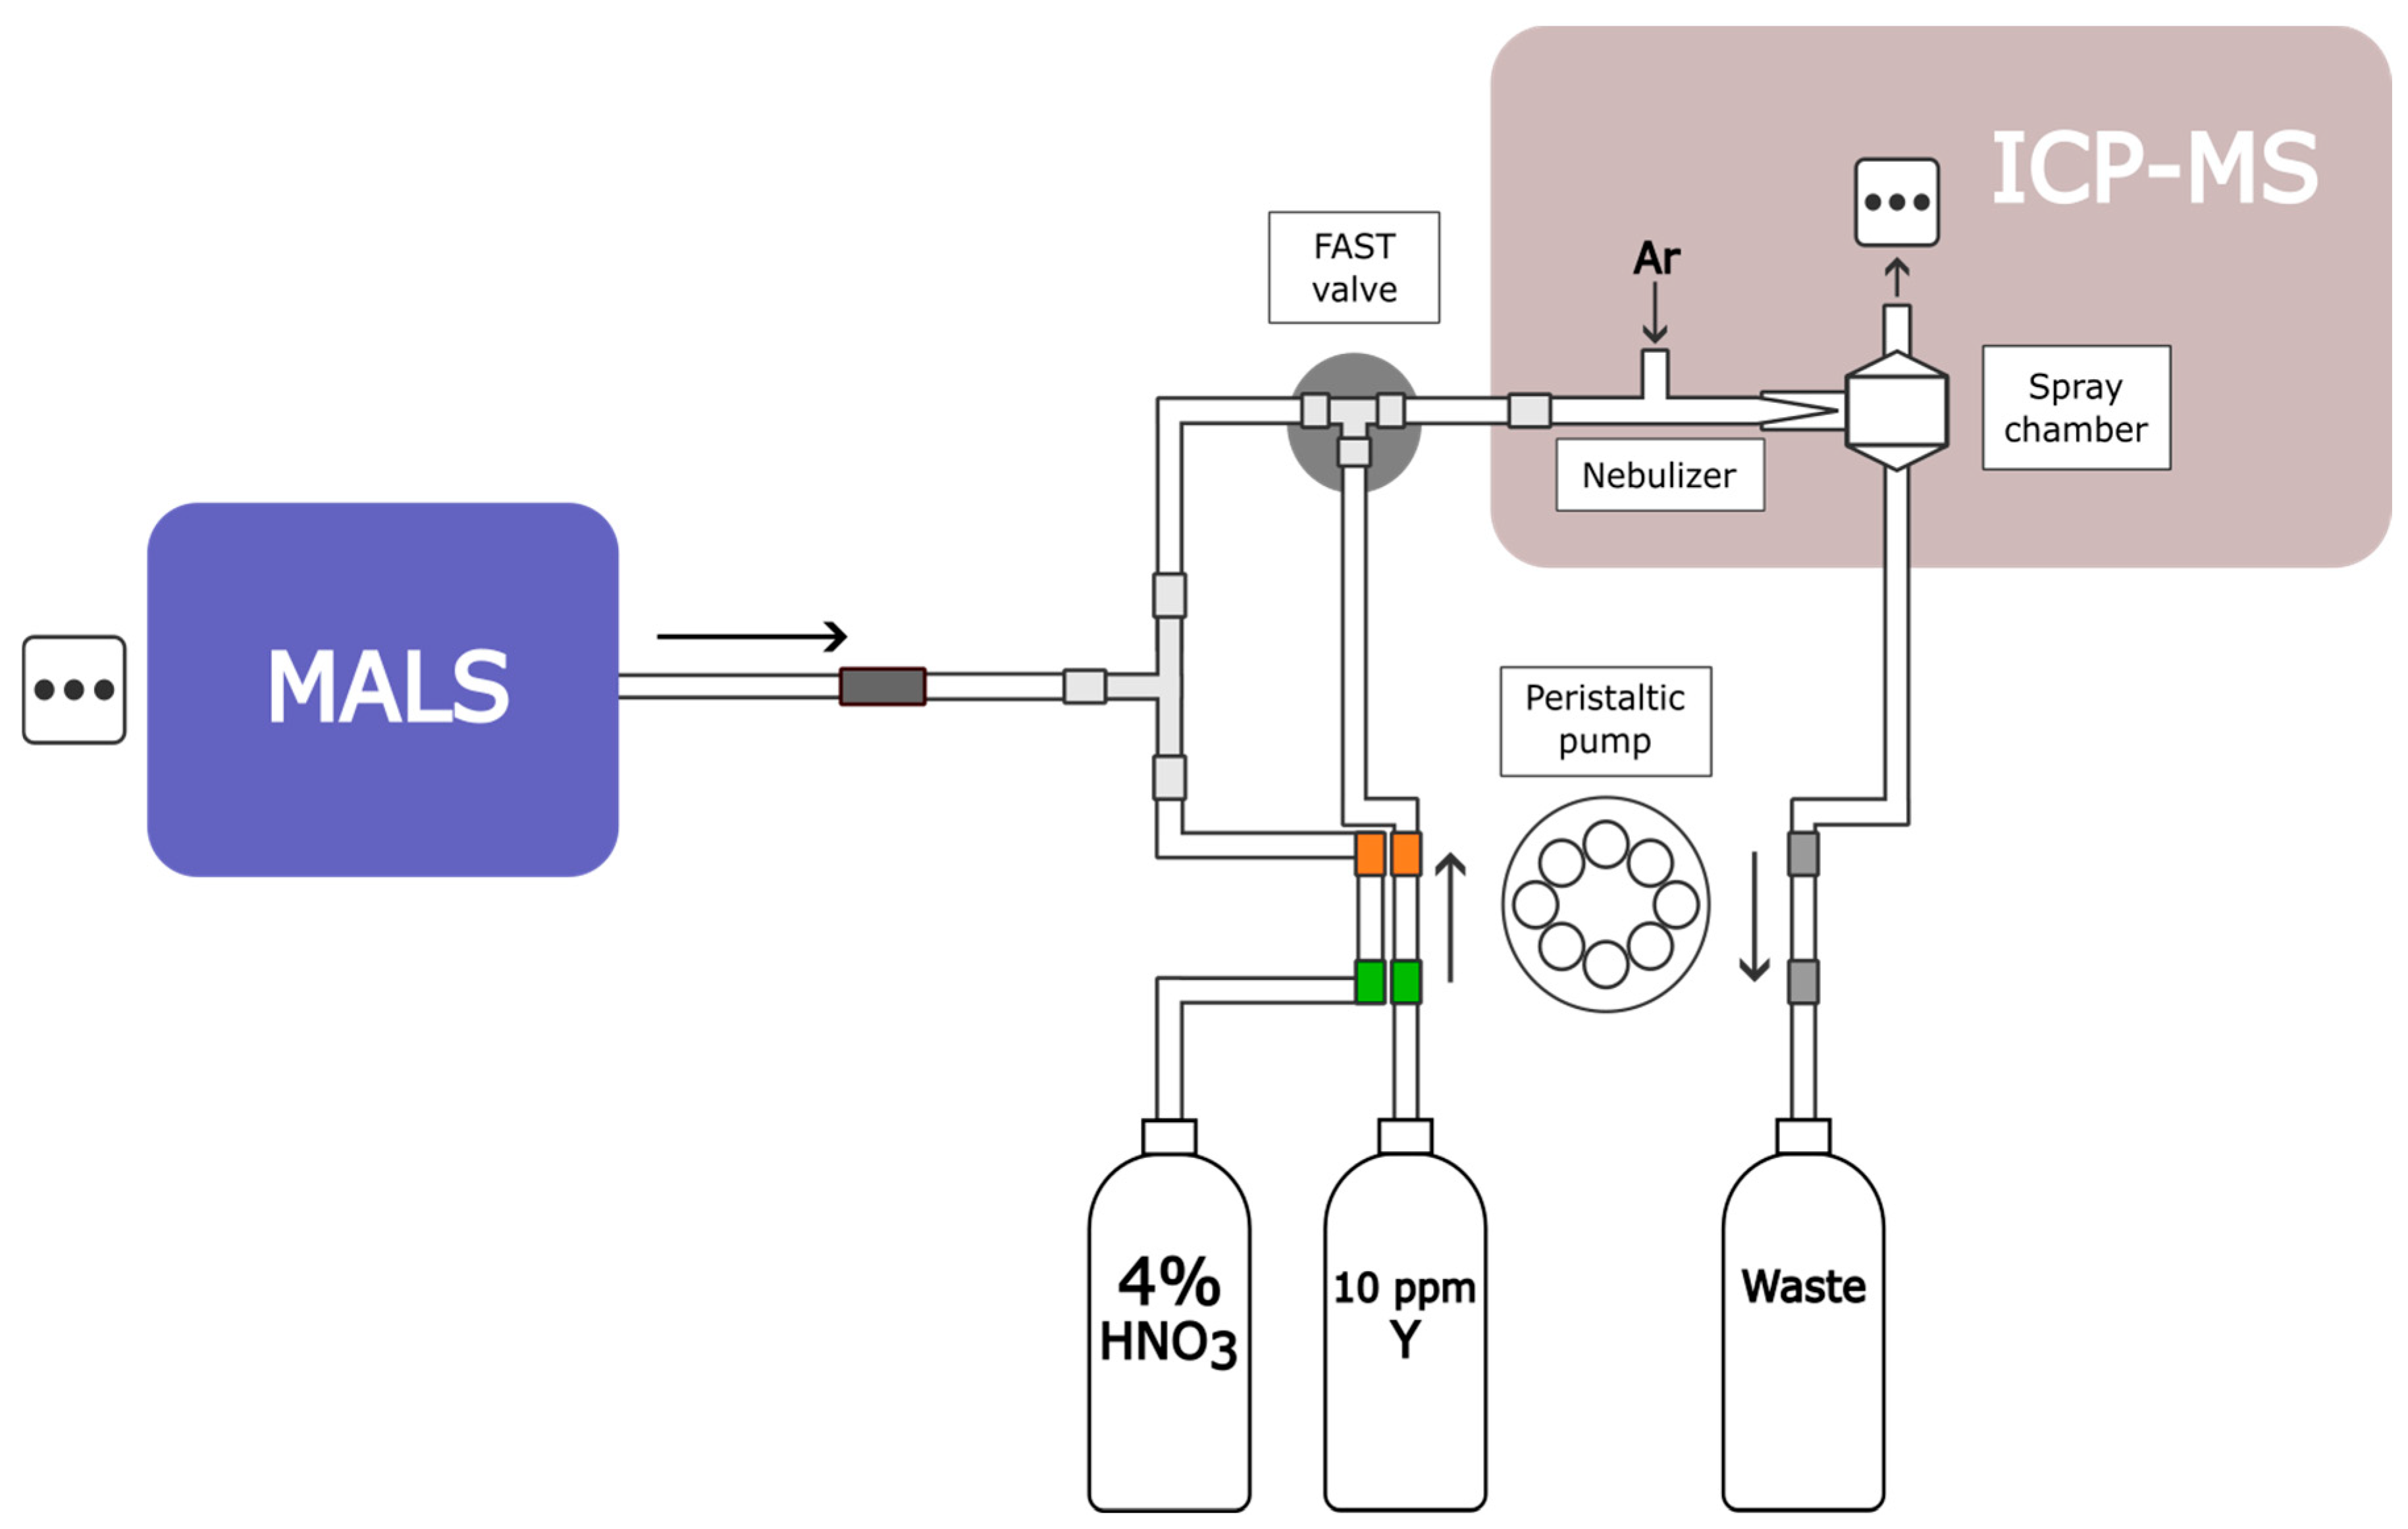
For online metal analysis with AF4-MALS, an iCAP® Q ICP-MS (Thermo Scientific, Waltham, WA, USA) was integrated as a third detector alongside the setup. To enhance sample ionization into the plasma, 4% HNO3 was introduced into the flow. Yttrium (10 ppm) served as an internal standard to monitor signal variability due to pressure differences or nebulization inconsistencies. Both acid and internal standards were added via the ICP-MS’s built-in peristaltic pump using solvent flex 3-stop tubing (Meinhard, Golden, CO, USA) with an internal diameter of 0.38 mm. The instrument operated in standard (STD) mode with no reaction or collision cells. The interface between MALS and ICP-MS is illustrated in Figure 2 and Figure 3, while the ICP-MS operating parameters are summarized in Table 1.
Pure nanoparticle dispersion standards were measured to assess the functionality of the AF4-UV-MALS-ICP-MS connection. Details of this procedure are provided as Supplementary Information in Section S1. The results of these experiments were used to optimize the measurements of the drinking water samples.

3.2. Water Sample Analysis

Water samples from undisclosed drinking water companies were analyzed for the following parameters: TOC and IC were determined using a Shimadzu TOC-L analyzer (Shimadzu, Kyoto, Japan). ICP-OES analysis was carried out using an ICP-OES iCAP PRO (Thermo Scientific). pH and EC were measured using an HQ40d multimeter (Hach, Ames, IA, USA) with IntelliCAL PHC101 and CDC401 probes, respectively. Turbidity was measured with a turbidimeter (2100Q IS, Hach) in Nephelometric Turbidity Units (NTUs). Color was measured using a UV-1800 (Shimadzu) spectrophotometer and evaluated according to the Hazen scale. Nanometric particle presence was determined using online ICP-MS (iCAP® Q ICP-MS (Thermo Scientific). Isotopes tracked during runs were the following: 7Li, 9Be, 11B, 23Na, 24Mg, 27Al, 29Si, 31P, 32S, 39K, 44Ca, 48Ti, 52Cr, 55Mn, 57Fe, 59Co, 60Ni, 63Cu, 66Zn, 75As, 77Se, 85Rb, 90Zr, 95Mo, 107Ag, 111Cd, 118Sn, 137Ba, 139La, 140Ce, 182W, 197W, and 208Pb. The samples were analyzed for the concentration of these isotopes, and the overall concentration of these elements was measured. Sample information is provided in Table 2 and Table 3.

4. Results and Discussion

The light-scattering fractograms of all samples measured with AF4-MALS are presented in Figure 4.
Across all samples, late-eluting particles, which have relatively large radii (≥90 nm), dominate the signals. The intensity of the peaks varies between samples, which can be attributed to variations in the particle concentration and differences in particle sizes. In one instance (untreated mountain spring water, C2), a population of scatterers eluted early, exhibiting a strong scattering signal. Given the fact that the elution time is proportional to the size of the particles and that the intensity of Rayleigh scattering is proportional to the sixth power of the radius, this signal either indicates a very large number of very small scatterers or larger scatterers that elute early. If the former was true, the fitting algorithm should have provided a size distribution of the peak (red dots above), which was not plausible here, therefore indicating that the scatterers might not be solid particles but (intrinsic) nanobubble-associated compounds with large slipping planes [18].
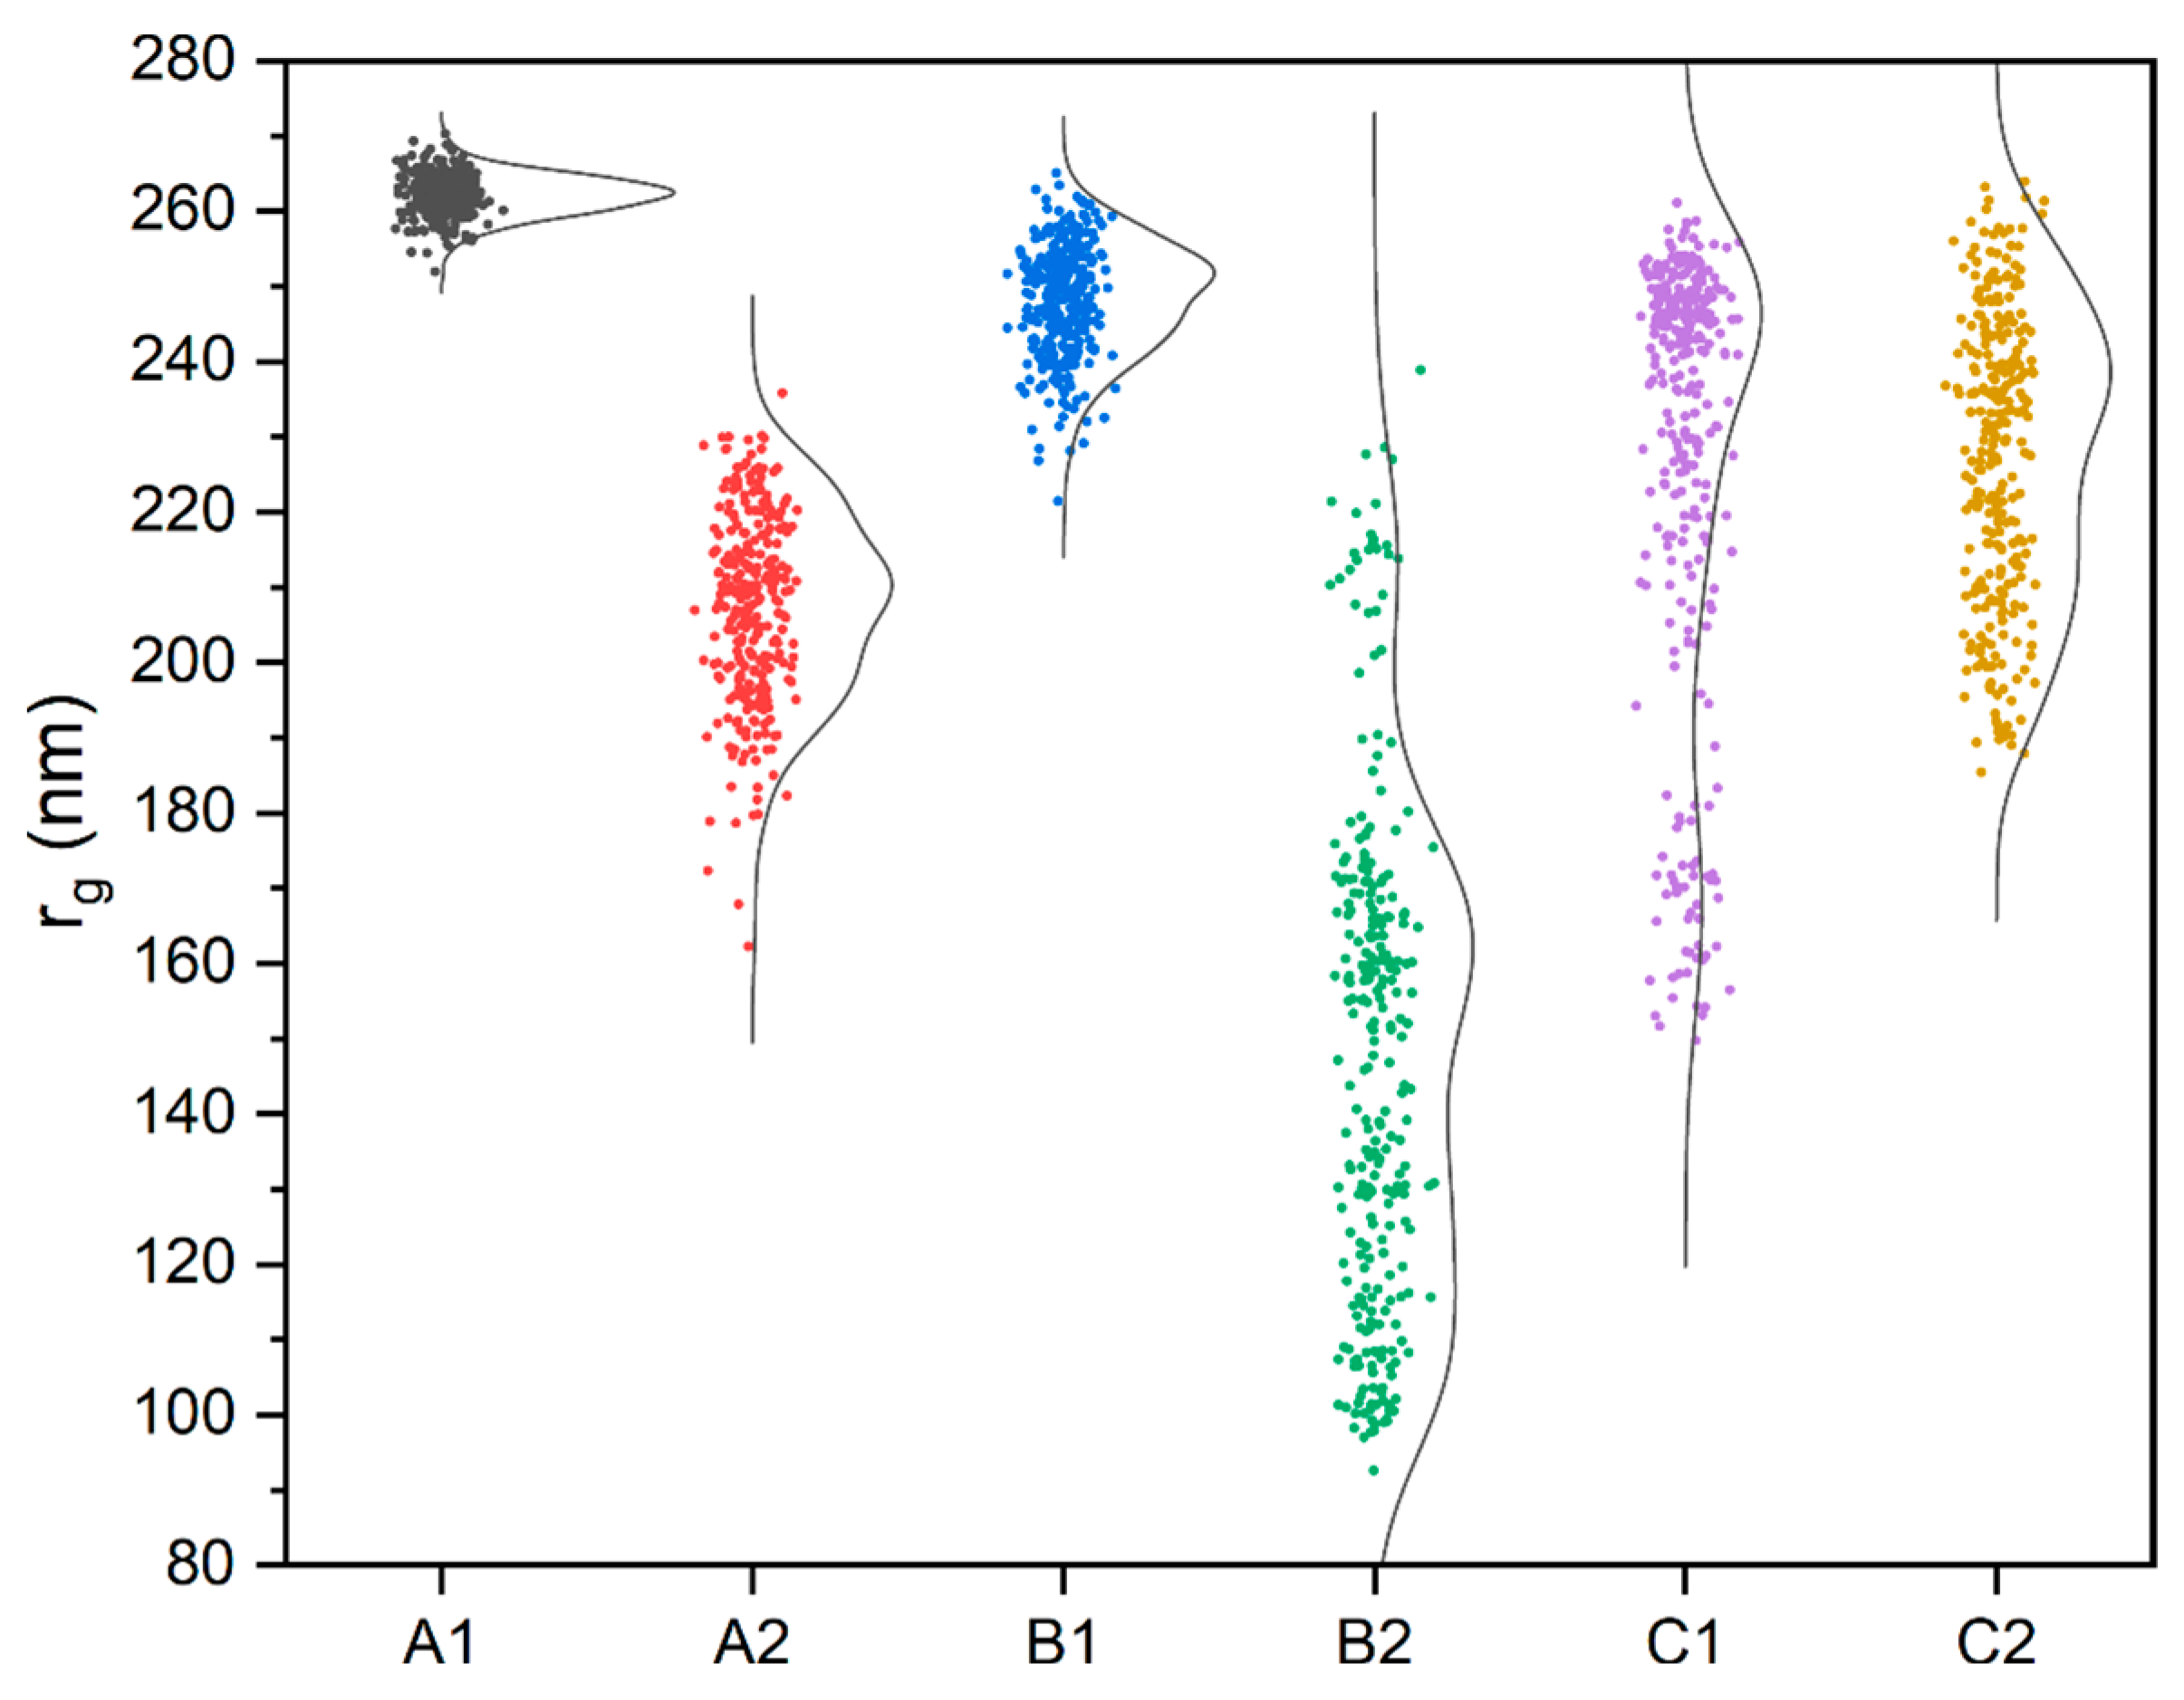
In general, the samples show a wide variation in their particle size distribution, as illustrated in Figure 5. Some samples, such as B2 (treated groundwater—cascade aeration → rapid sand filtration), display a broad range of particle sizes, ranging from 90 to 240 nm for the radius. Other samples, such as A1 (treated groundwater—cascade aeration → pellet softening → multilayer filtration), yield a narrow distribution with radii between 250 and 270 nm only.
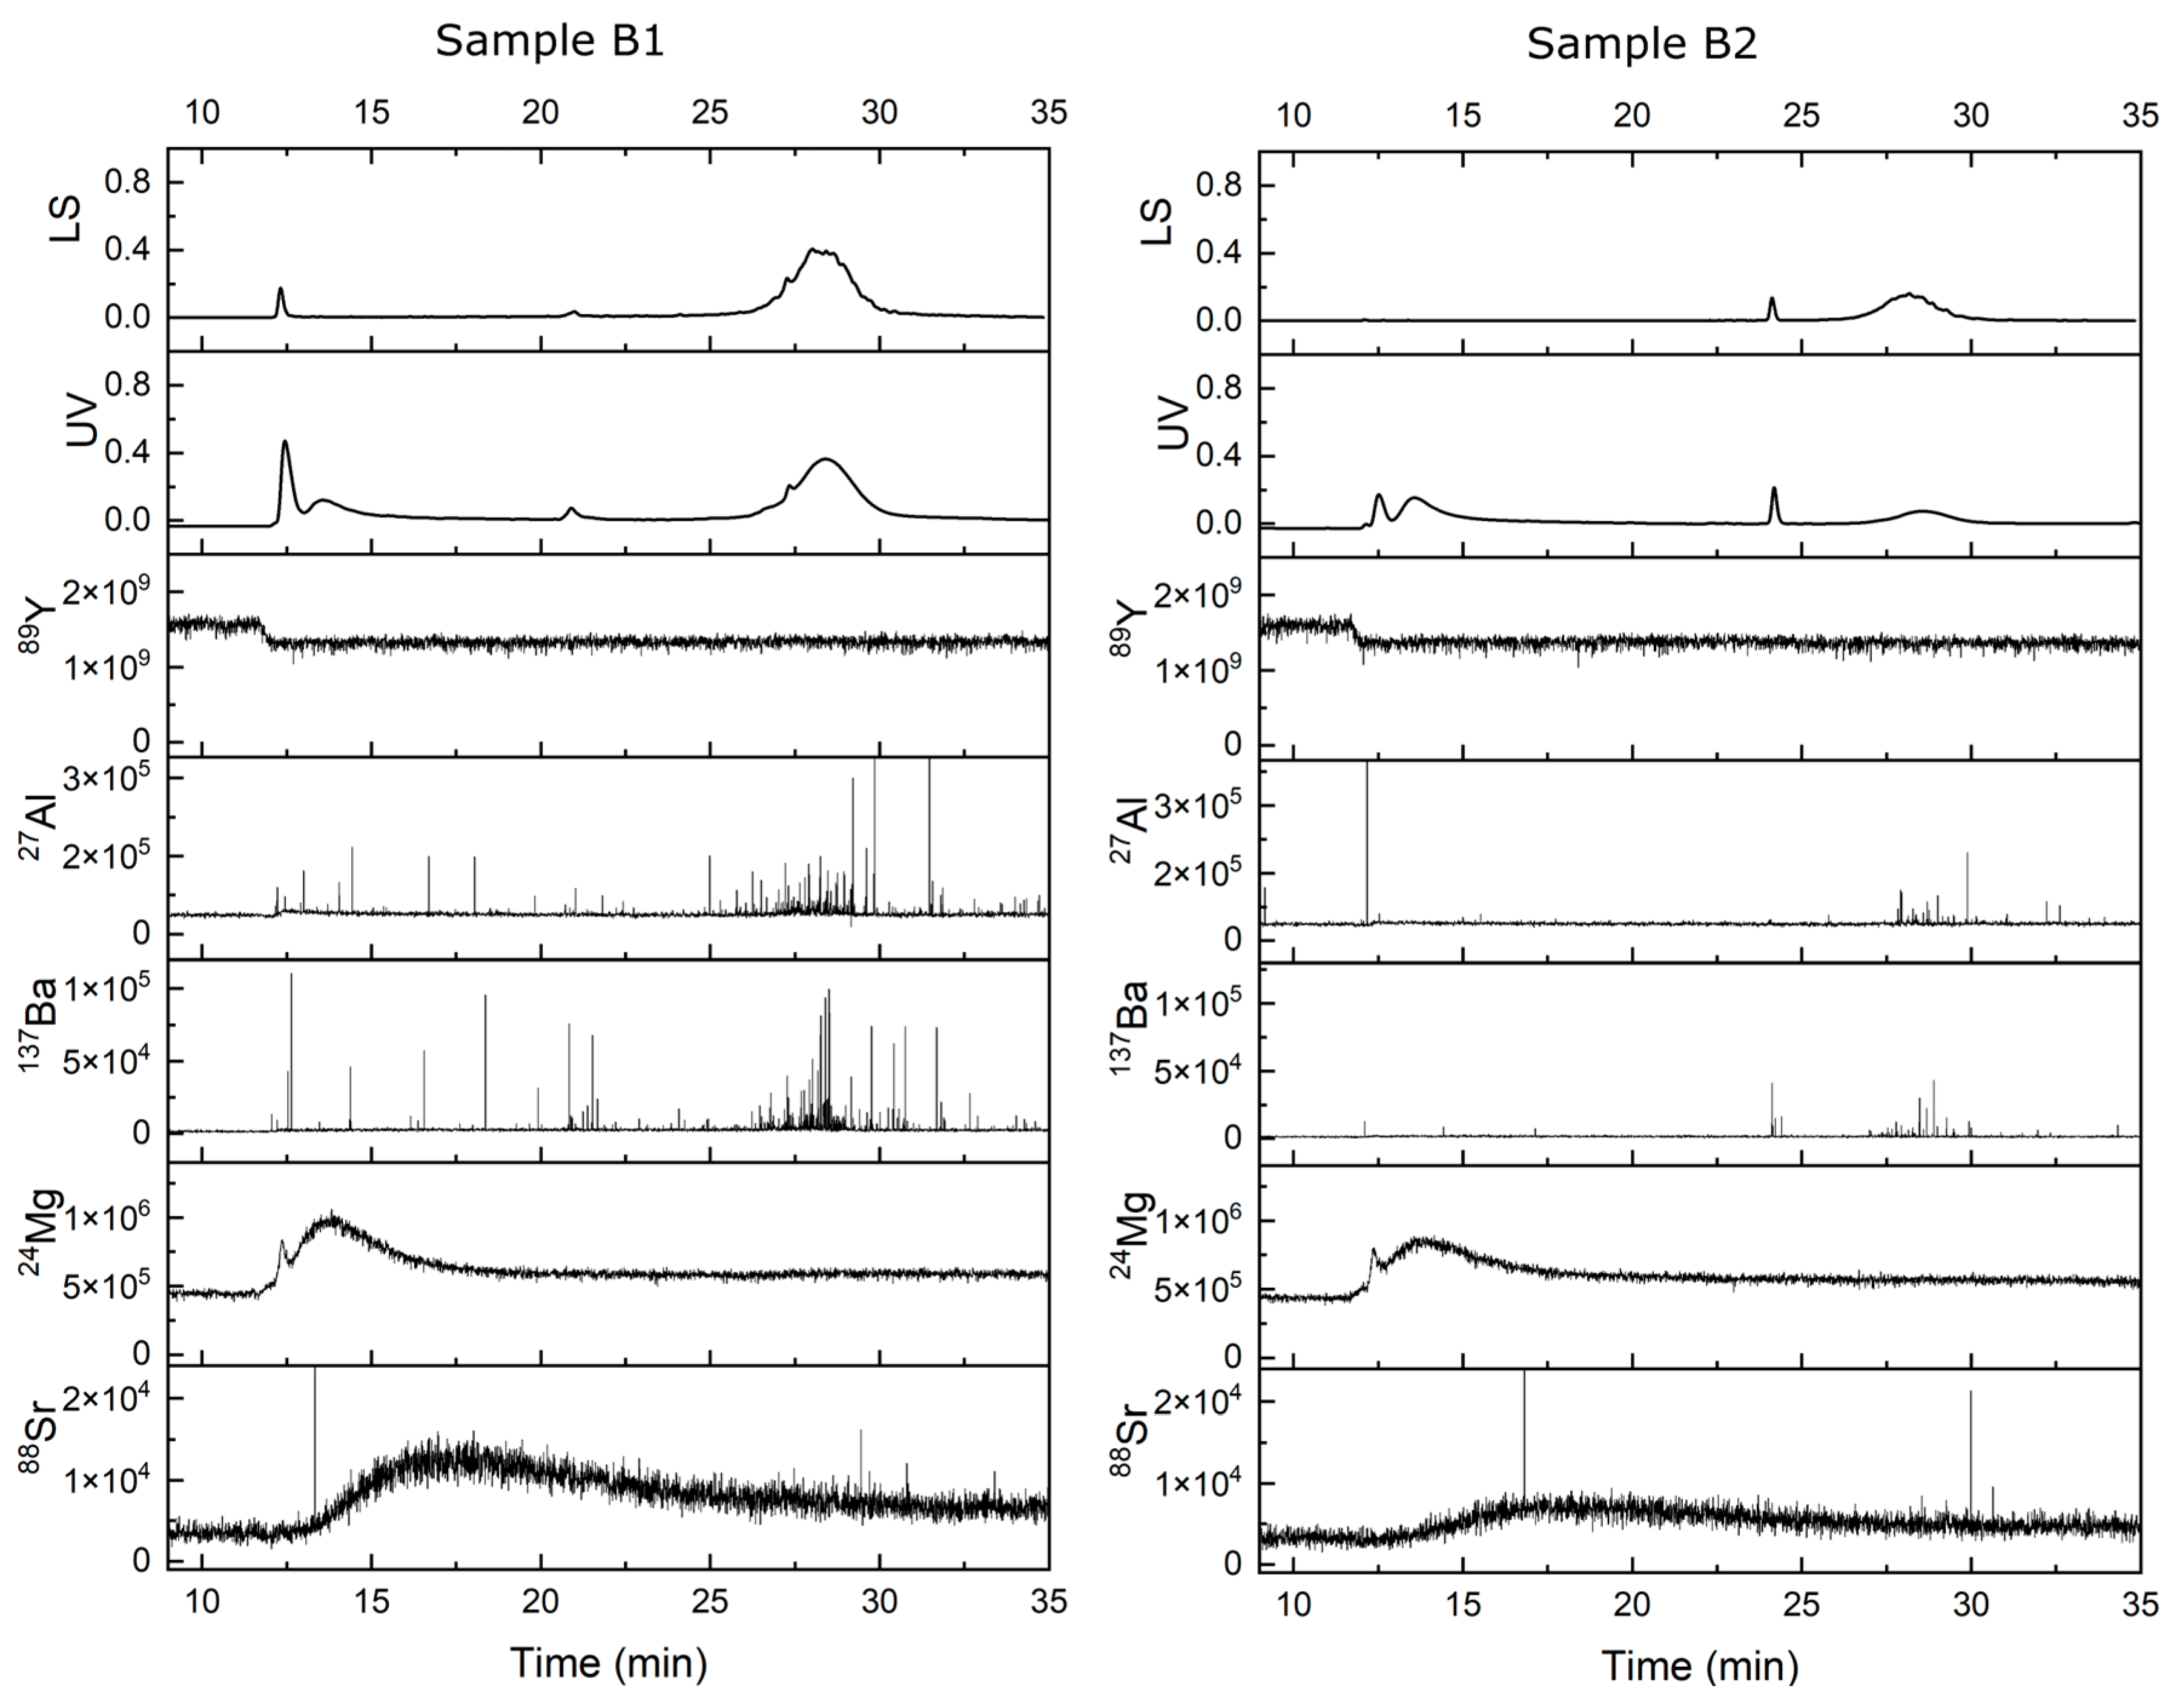
The combination of the AF4-UV-MALS with the ICP-MS allowed an elemental analysis of the different size fractions. Of the different isotopes tracked, 24Mg, 27Al, 88Sr, and 137Ba yielded signals associated with specific elution times in most samples. Additionally, 63Cu and 66Zn were detected at longer elution times in two samples. Fractograms alongside ICP-MS counts for the specified isotopes are presented in Figure 6, Figure 7 and Figure 8.
The fractograms generally indicate that most samples exhibit prominent peaks for 27Al and 137Ba eluted at approximately 27 to 30 min, aligning with the elution of the larger-sized population. These data suggest that Al and Ba are likely associated with nanometric particles and contribute to their composition, possibly bound to or incorporated in natural organic matter. This hypothesis is supported by the TOC analysis (the data are reported in the Supplementary Information, Section S2), which showed organic carbon concentrations ranging from 1.00 to 3.6 mgˑL−1 in most samples. Furthermore, UV absorption (280 nm) peaks coinciding with late LS peaks further suggest the presence of organic matter at these retention times. However, possible signal interferences in the ICP-MS analysis should also be considered. For instance, for 27Al, polyatomic interference with 12C15N+ ions [37] is possible. Given that the TOC analysis confirmed the presence of organic matter, additional analyses would be required to exclude this potential interference, which is beyond the scope of the present work.
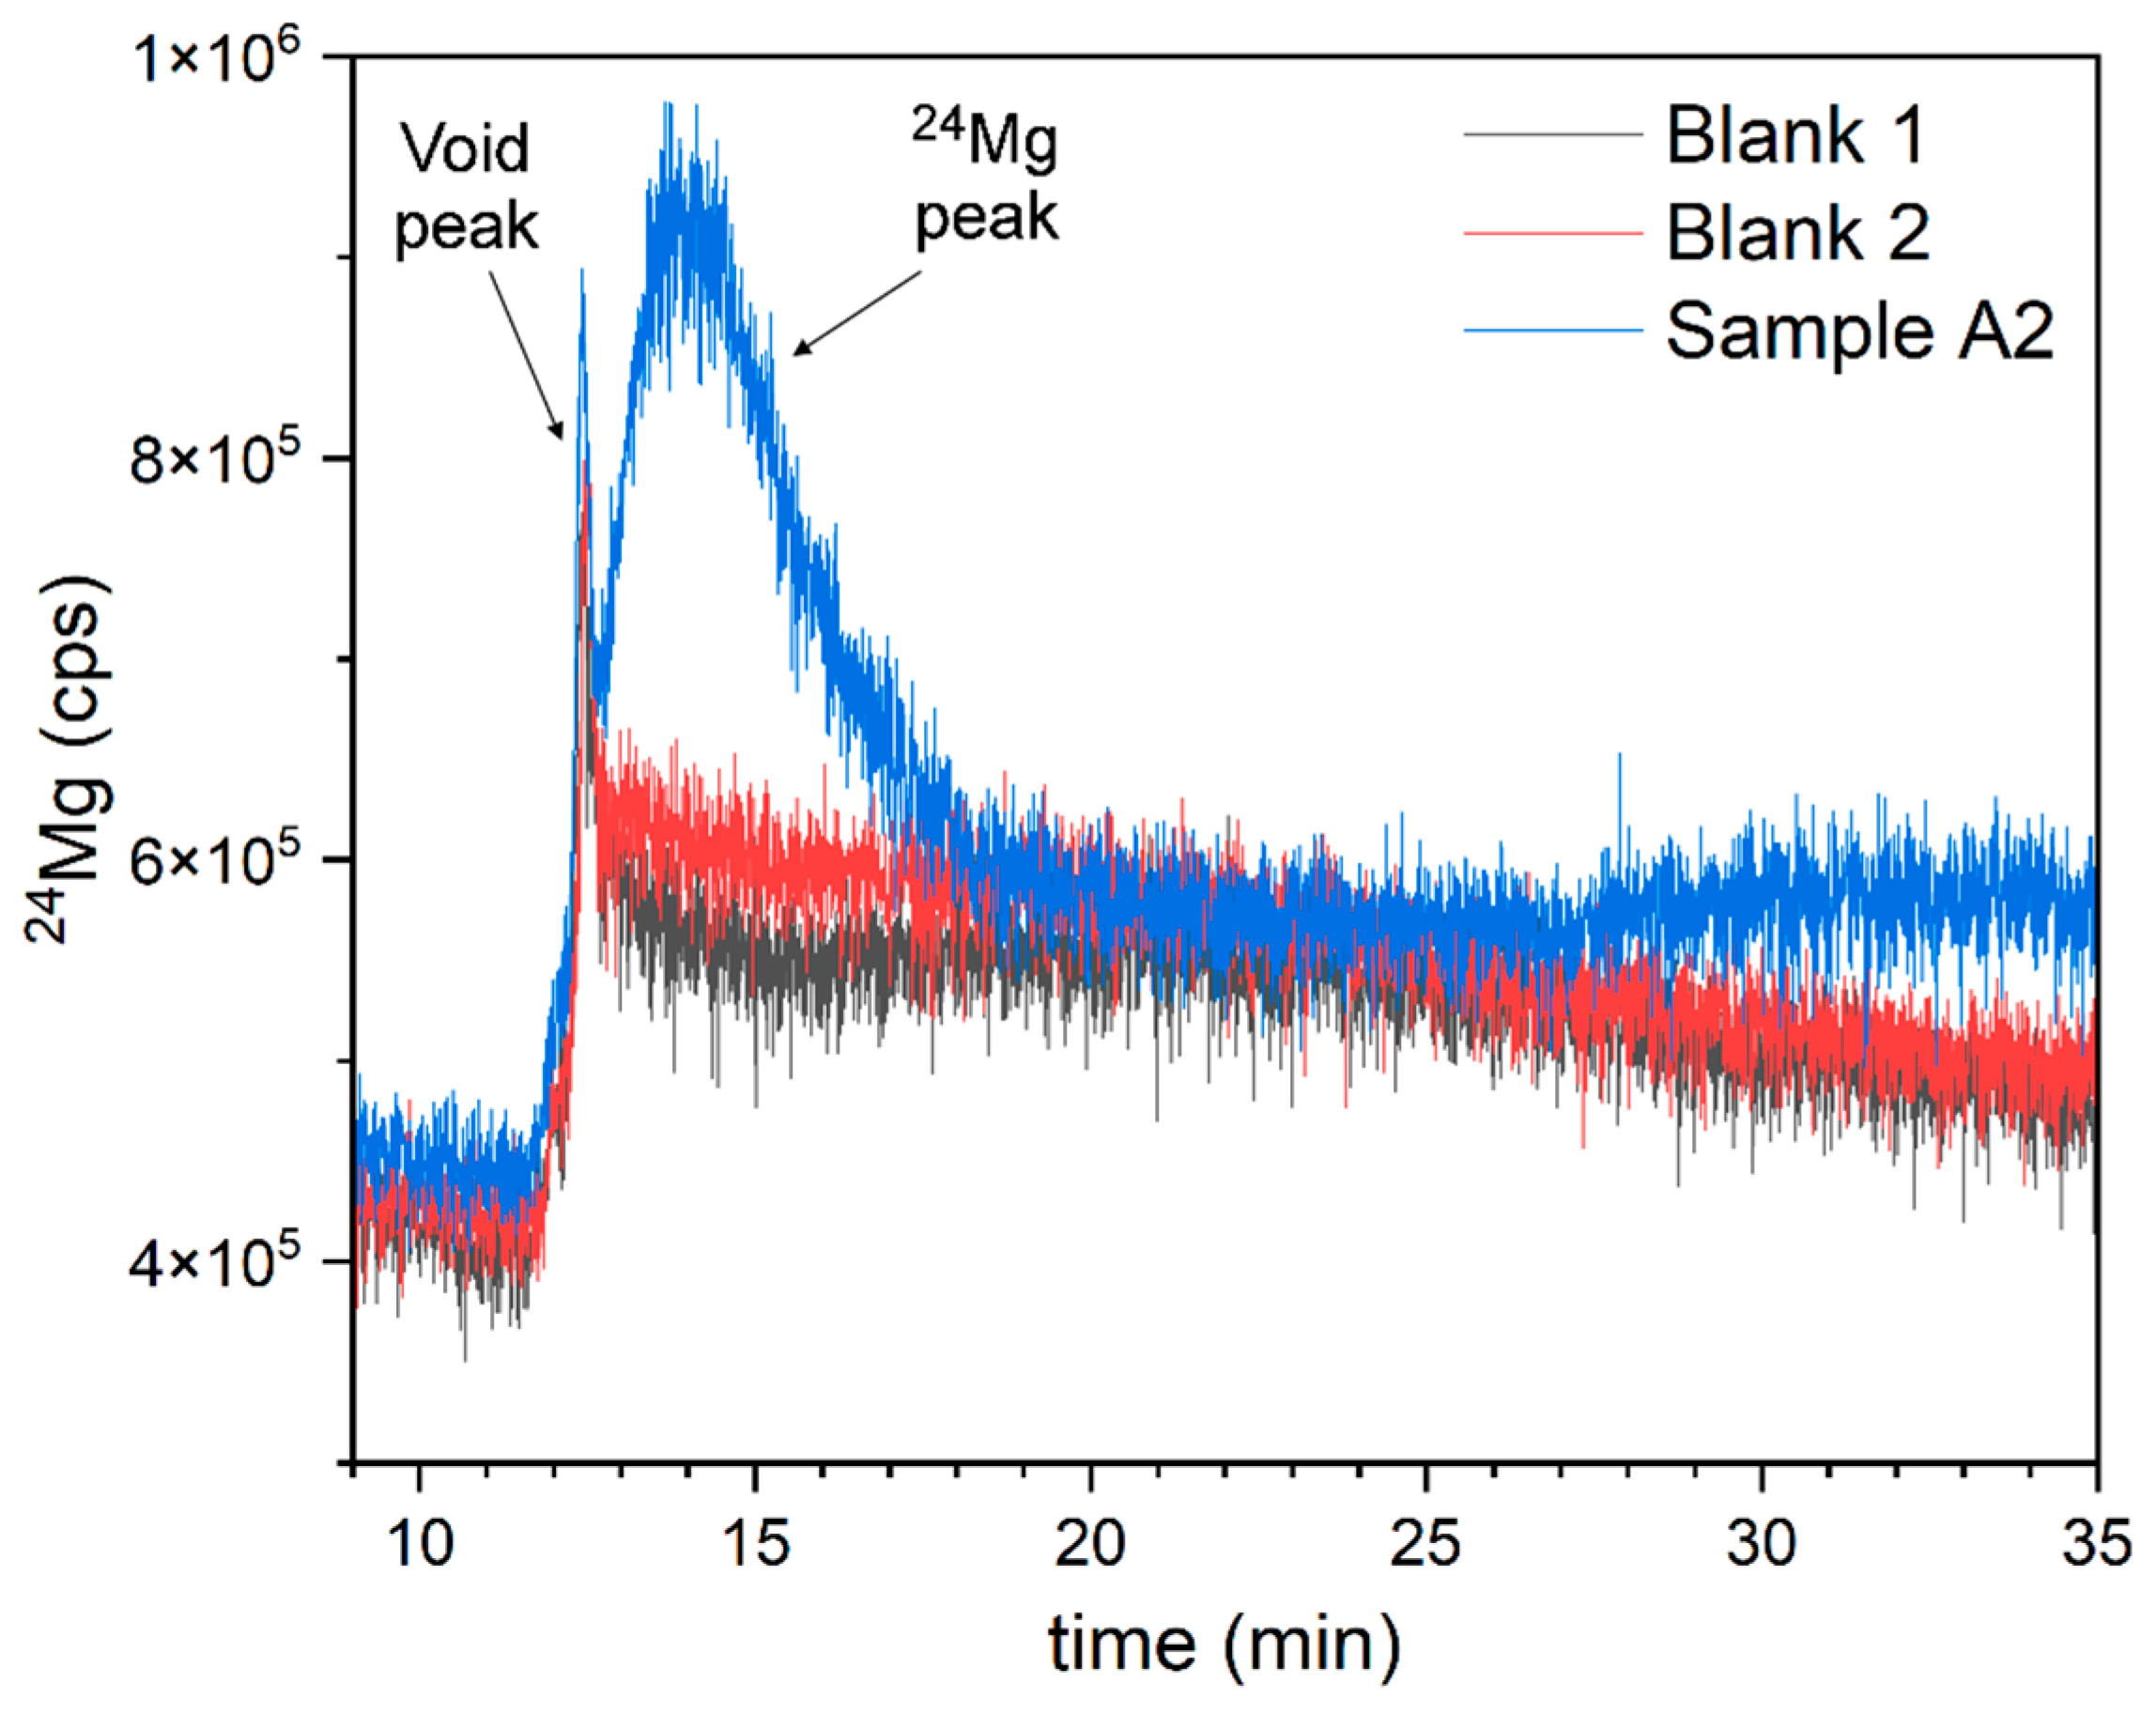
At lower retention times, a consistent peak of 24Mg is observed in all samples. A comparison with the blank (Figure 9) reveals a sharp void peak and a distinct 24Mg peak. This peak could be indicative of magnesium-containing DOLLOPs. It is interesting to note here that sample C2, untreated mountain spring water, shows the presence of magnesium at the same early dilution times where it yielded a MALS peak probably associated with bubbles (see also Figure 3). Assuming that the magnesium peak stems from DOLLOPs containing magnesium, this result could be an indication that DOLLOPs agglomerate on charged nanobubble surfaces, as suggested recently [17]. It should be mentioned here that Calcium ions, which should be predominantly present in this peak if that was the case, could not be measured in the current configuration due to interference with the 40Ar+ isotope from the argon used as the ICP plasma gas.
However, it is challenging to actually determine whether this peak is associated with nanometric particles or ionic Mg2+. The absence of an LS peak at this retention time in most samples suggests against the nanoparticle hypothesis, but the higher sensitivity of ICP-MS compared to LS detectors leaves open the possibility of very small particles or magnesium-containing DOLLOPs eluting undetected by MALS unless they agglomerate on charged bubbles. The ICP-MS configuration available could not distinguish between ionic and nanoparticle signals, limiting the ability to ascertain the nature of the 24Mg peak.
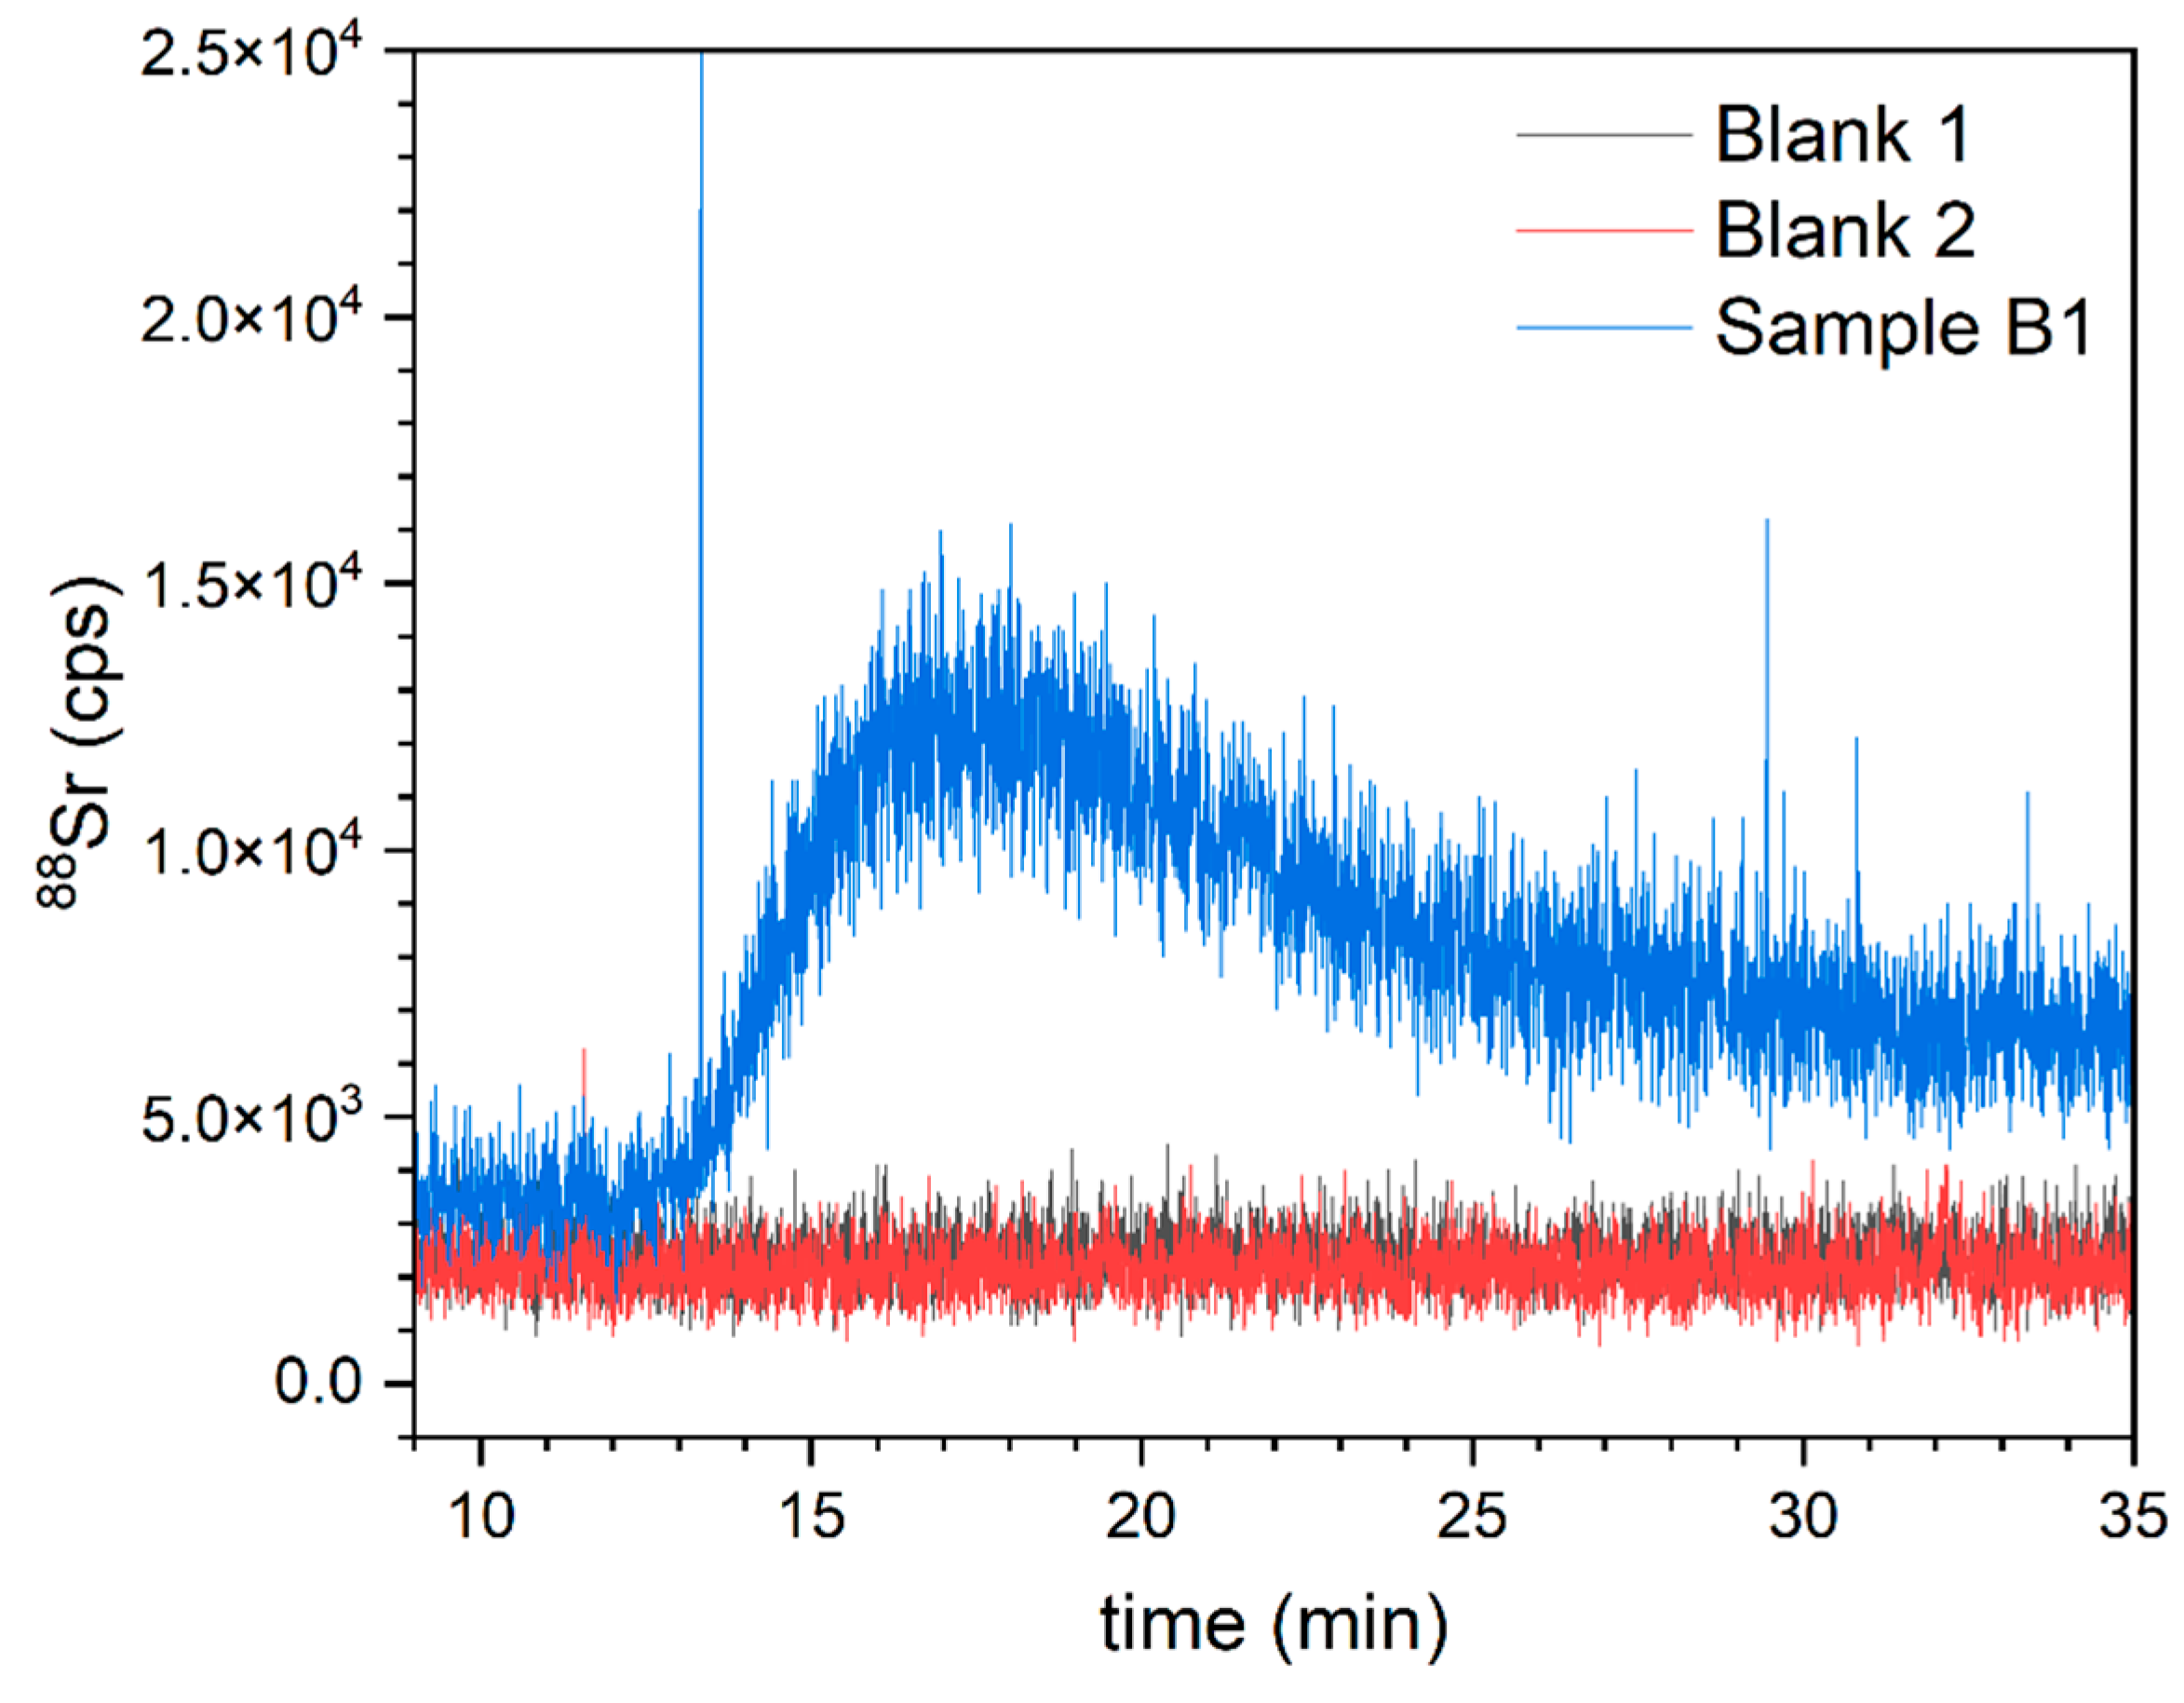
A similar trend is observed for 88Sr, suggesting that Strontium ions might be involved in the DOLLOP formation as well. An example from sample B1, treated groundwater, is shown in Figure 10.
The intensity of the 88Sr signals compared to the blanks was generally less pronounced than for 24Mg. Additionally, the 88Sr peaks appeared at slightly later elution times. In some cases (e.g., samples A2, aerated and treated groundwater, and C1, bottled drinking water), sharp peaks were observed alongside larger particles, similar to the signals for 27Al and 137Ba. The 63Cu and 66Zn signals for sample C1, bottled drinking water, are shown in Figure 11 and Figure 12.
Both metals appeared at later retention times, coinciding with the elution times of 27Al and 137Ba whenever detected. Quantitative analysis via ICP-OES (Table 3) confirmed the presence of all mentioned elements in the samples. However, in some cases (specifically, 27Al in samples A2, treated and aerated groundwater, and C1, bottled drinking water), signals detected by online ICP-MS were below the detection limit of ICP-OES. This raises the possibility of polyatomic interference for the 27Al signal, but it could also be due to the superior detection limits of ICP-MS compared to ICP-OES, allowing only the online ICP-MS to detect aluminum.

5. Conclusions

AF4-MALS is a powerful tool for the separation and characterization of submicrometric and nanoparticles in environmental water samples. Its operational flexibility allows for optimization to specific samples, accommodating unique characteristics such as concentration, surface charge, and size distribution. Although method development can be time-consuming due to the numerous variables involved, the potential for customization makes AF4-MALS a highly adaptable technique. Coupling AF4-MALS with detectors such as ICP-MS significantly enhances its effectiveness, enabling the precise identification of metallic nanoparticles and metal-associated colloidal matter. In this study, online ICP-MS provided valuable insights into the interactions of metallic particles as they traversed the AF4 channel, effectively differentiating particles by detecting specific metal isotope signals. While MALS accurately measures particle sizes, limitations can arise with very small particles (<10 nm) due to the small scattering intensity of these sizes. In general, our study successfully demonstrates the capability of AF4-MALS-ICP-MS to detect metals such as Al, Ba, Cu, Zn (associated with larger particles around 200 nm), and Mg (associated with very small particles between 1.5 and 10 nm) in different drinking water samples, thereby shedding light on the distribution and composition of (natural) nanometric components of drinking water. Additional Total Organic Carbon (TOC) analysis indicates the presence of natural organic matter, which is physically or chemically binding to these metals.
Overall, this study highlights the robust capabilities of AF4-MALS, particularly when coupled with ICP-MS, in providing comprehensive insights into the nature and interactions of nanoparticles in environmental water samples. The technique’s adaptability and precision underscore its potential for broader applications in environmental monitoring and analysis.

Supplementary Materials

The following supporting information can be downloaded at: https://www.mdpi.com/article/10.3390/w16172419/s1, Figure S1: Normalized Rayleigh Ratio Light scattering (LS) intensity of nAu at 90° against elution time using different NH4HCO3 concentrations yielding different retention times and signal intensities; Figure S2: Light scattering fractograms of pure nanoparticles from Table ST1, individually analyzed; Figure S3: UV absorption fractograms of pure nanoparticles from Table ST1, individually analyzed; Figure S4: Fractogram and radii measured by MALS of mixed nTiO2 and nAu standards with Debye and Zimm formalisms for extrapolation of the radius of the nTiO2 population. For the nAu peak, no good fit could be obtained, the plot showing an unsuccessful attempt on fitting with Debye 2nd order; Figure S5: AF4-UV-MALS-ICP-MS fractogram of the mixture of nTiO2 and nAu. 89Y is the internal standard; Figure S6: AF4-UV-MALS-ICP-MS fractogram of the mixture of nTiO2, nAu and nAg. 89Y is the internal standard; Table ST1: Pure nanoparticle standards used to test the AF4-MALS-ICP-MS system; Table ST2: Separation method used for AF4 runs with mixed nanoparticle standards. The 40 min long elution crossflow gradient contains a linear decrease; Table ST3: Additional parameters for the AF4 separation and MALS detection. Reference [37] is cited in the Supplementary Materials.

Author Contributions

Conceptualization, E.C.F., L.L.F.A., T.Z., D.G. and H.L.O.; methodology, L.L.F.A.; validation, M.B.A.C., T.Z. and L.L.F.A.; formal analysis, M.B.A.C. and T.Z.; investigation, M.B.A.C. and T.Z.; resources, E.C.F. and L.L.F.A.; data curation, M.B.A.C. and T.Z.; writing—original draft preparation, M.B.A.C., E.C.F. and T.Z.; writing—review and editing, all authors.; visualization, M.B.A.C.; supervision, E.C.F., L.L.F.A., D.G. and H.L.O.; project administration, E.C.F. and L.L.F.A.; funding acquisition, E.C.F. All authors have read and agreed to the published version of the manuscript.

Funding

This research has received funding from the European Union’s Horizon 2020 research and innovation program under the Marie Skłodowska-Curie grant agreement No. 665874.

Data Availability Statement

Data available from the authors upon reasonable request.

Acknowledgments

This work was performed in the cooperation framework of the Wetsus European Center of Excellence for Sustainable Water Technology (www.wetsus.eu accessed on 18 July 2024) within the Applied Water Physics theme. Wetsus is cofounded by the Dutch Ministry of Economic Affairs and Ministry of Infrastructure and Environment, The Province of Fryslan, and the Northern Netherlands Provinces. The authors would like to thank Jakob Woisetschläger for valuable discussions. During the preparation of this work, the authors used OpenAI (2024) ChatGPT (version 4.0) [Large language model] in order to structure the text and DeepL SE (2024) DeepL API [Document translation application programming interface] for a stylistic text translation. After using these tools, the authors reviewed and edited the content as needed and take full responsibility for the content of the publication.

Conflicts of Interest

The authors declare no conflicts of interest.

References

  1. Pulit-Prociak, J.; Banach, M. Silver nanoparticles: A material of the future? Open Chem. 2016, 14, 76–91. [Google Scholar] [CrossRef]
  2. Mallia, J.d.O.; Galea, R.; Nag, R.; Cummins, E.; Gatt, R.; Valdramidis, V. Nanoparticle food applications and their toxicity: Current trends and needs in risk assessment strategies. J. Food Prot. 2022, 85, 355–372. [Google Scholar] [CrossRef] [PubMed]
  3. EUR-Lex. Commission Regulation (EU) 2022/63 amending Annexes II and III to Regulation (EC) No 1333/2008 of the European Parliament and of the Council as regards the food additive titanium dioxide (E 171). Off. J. Eur. Union 2022, 11, OJ L11. Available online: http://data.europa.eu/eli/reg/2022/63/oj (accessed on 2 May 2023).
  4. Kaiser, J.-P.; Zuin, S.; Wick, P. Is nanotechnology revolutionizing the paint and lacquer industry? a critical opinion. Sci. Total. Environ. 2013, 442, 282–289. [Google Scholar] [CrossRef]
  5. Séby, F. Chapter eleven—Metal and metal oxide nanoparticles in cosmetics and skin care products. In Comprehensive Analytical; Milačič, R., Sčančar, J., Goenaga-Infante, H., Vidmar, J., Eds.; Part of volume ChemistryAnalysis and Characterisation of Metal-Based Nanomaterials; Elsevier: Amsterdam, The Netherlands, 2021; Volume 93, pp. 381–427. [Google Scholar] [CrossRef]
  6. Rossi, A.; Zannotti, M.; Cuccioloni, M.; Minicucci, M.; Petetta, L.; Angeletti, M.; Giovannetti, R. Silver nanoparticle-based sensor for the selective detection of nickel ions. Nanomaterials 2021, 11, 1733. [Google Scholar] [CrossRef] [PubMed]
  7. Ma, Z.; Jiang, Y.; Xiao, H.; Jiang, B.; Zhang, H.; Peng, M.; Dong, G.; Yu, X.; Yang, J. Sol-gel preparation of Ag-silica nanocomposite with high electrical conductivity. Appl. Surf. Sci. 2018, 436, 732–738. [Google Scholar] [CrossRef]
  8. Sztandera, K.; Gorzkiewicz, M.; Klajnert-Maculewicz, B. Gold nanoparticles in cancer treatment. Mol. Pharm. 2019, 16, 1–23. [Google Scholar] [CrossRef]
  9. Simeonidis, K.; Mourdikoudis, S.; Kaprara, E.; Mitrakas, M.; Polavarapu, L. Inorganic engineered nanoparticles in drinking water treatment: A critical review. Environ. Sci. Water Res. Technol. 2016, 2, 43–70. [Google Scholar] [CrossRef]
  10. Anjum, M.; Miandad, R.; Waqas, M.; Gehany, F.; Barakat, M. Remediation of wastewater using various nano-materials. Arab. J. Chem. 2019, 12, 4897–4919. [Google Scholar] [CrossRef]
  11. Zhang, Y.; Leu, Y.-R.; Aitken, R.J.; Riediker, M. Inventory of engineered nanoparticle-containing consumer products available in the Singapore retail market and likelihood of release into the aquatic environment. Int. J. Environ. Res. Public Health 2015, 12, 8717–8743. [Google Scholar] [CrossRef]
  12. Bundschuh, M.; Filser, J.; Lüderwald, S.; McKee, M.S.; Metreveli, G.; Schaumann, G.E.; Schulz, R.; Wagner, S. Nanoparticles in the environment: Where do we come from, where do we go to? Environ. Sci. Eur. 2018, 30, 6. [Google Scholar] [CrossRef] [PubMed]
  13. Fent, K. Ecotoxicology of engineered nanoparticles. In Nanoparticles in the Water Cycle; Frimmel, F.H., Niessner, R., Eds.; Springer: Berlin/Heidelberg, Germany, 2010; pp. 183–205. [Google Scholar] [CrossRef]
  14. Demichelis, R.; Raiteri, P.; Gale, J.D.; Quigley, D.; Gebauer, D. Stable prenucleation mineral clusters are liquid-like ionic polymers. Nat. Commun. 2011, 2, 590. [Google Scholar] [CrossRef] [PubMed]
  15. Gebauer, D.; Völkel, A.; Cölfen, H. Stable prenucleation calcium carbonate clusters. Science 2008, 322, 1819–1822. [Google Scholar] [CrossRef]
  16. Pouget, E.M.; Bomans, P.H.H.; Goos, J.A.C.M.; Frederik, P.M.; de With, G.; Sommerdijk, N.A.J.M. The initial stages of template-controlled CaCO3 formation revealed by Cryo-TEM. Science 2009, 323, 1455–1458. [Google Scholar] [CrossRef] [PubMed]
  17. EFitzgerald, E.; Kumar, A.; Poulose, S.; Coey, J.M.D. Interaction and Stability of Nanobubbles and Prenucleation Calcium Clusters during Ultrasonic Treatment of Hard Water. ACS Omega 2024, 9, 2547–2558. [Google Scholar] [CrossRef]
  18. Zarei, T.; Fuchs, E.C.; Agostinho, L.L.; Gebauer, D.; Woisetschläger, J.; Offerhaus, H.L. Intrinsic CO2 nanobubbles in alkaline aqueous solutions. Colloids Surf. A Physicochem. Eng. Asp. 2024, 701, 134895. [Google Scholar] [CrossRef]
  19. Sammer, M.; Kamp, C.; Paulitsch-Fuchs, A.H.; Wexler, A.D.; Buisman, C.J.N.; Fuchs, E.C. Strong gradients in weak magnetic fields induce DOLLOP formation in tap water. Water 2016, 8, 79. [Google Scholar] [CrossRef]
  20. MBaalousha, M.; Kammer, F.V.D.; Motelica-Heino, M.; Baborowski, M.; Hofmeister, C.; Le Coustumer, P. Size-Based Speciation of Natural Colloidal Particles by Flow Field Flow Fractionation, Inductively Coupled Plasma-Mass Spectroscopy, and Transmission Electron MicroscopyX-ray Energy Dispersive Spectroscopy Colloids-Trace Element Interaction. Environ. Sci. Technol. 2006, 40, 2156–2162. [Google Scholar] [CrossRef]
  21. Liao, P.; Li, W.; Jiang, Y.; Wu, J.; Yuan, S.; Fortner, J.D.; Giammar, D.E. Formation, aggregation, and deposition dynamics of nom-iron colloids at anoxic–oxic interfaces. Environ. Sci. Technol. 2017, 51, 12235–12245. [Google Scholar] [CrossRef]
  22. Allard, S.; Gutierrez, L.; Fontaine, C.; Croué, J.-P.; Gallard, H. Organic matter interactions with natural manganese oxide and synthetic birnessite. Sci. Total. Environ. 2017, 583, 487–495. [Google Scholar] [CrossRef]
  23. Sharma, V.K.; Filip, J.; Zboril, R.; Varma, R.S. Natural inorganic nanoparticles—Formation, fate, and toxicity in the environment. Chem. Soc. Rev. 2015, 44, 8410–8423. [Google Scholar] [CrossRef]
  24. Degueldre, C.; Pfeiffer, H.-R.; Alexander, W.; Wernli, B.; Bruetsch, R. Colloid properties in granitic groundwater systems. I: Sampling and characterisation. Appl. Geochem. 1996, 11, 677–695. [Google Scholar] [CrossRef]
  25. Plavchak, C.L.; Smith, W.C.; Bria, C.R.; Williams, S.K.R. New advances and applications in field-flow fractionation. Annu. Rev. Anal. Chem. 2021, 14, 257–279. [Google Scholar] [CrossRef]
  26. Wahlund, K.G.; Giddings, J.C. Properties of an asymmetrical flow field-flow fractionation channel having one permeable wall. Anal. Chem. 1987, 59, 1332–1339. [Google Scholar] [CrossRef] [PubMed]
  27. Andersson, M.; Wittgren, B.; Wahlund, K.-G. Accuracy in multiangle light scattering measurements for molar mass and radius estimations. Model calculations and experiments. Anal. Chem. 2003, 75, 4279–4291. [Google Scholar] [CrossRef] [PubMed]
  28. De Yoreo, J.; Vekilov, P.G. Principles of Crystal Nucleation and Growth. Rev. Mineral. Geochem. 2003, 54, 57. [Google Scholar] [CrossRef]
  29. Niederberger, M.; Cölfen, H. Oriented Attachment and Mesocrystals: Non-classical Crystallization Mechanisms Based on Nanoparticle Assembly. Phys. Chem. Chem. Phys. 2006, 8, 3271. [Google Scholar] [CrossRef]
  30. Rieger, J.; Frechen, T.; Cox, G.; Heckmann, W.; Schmidt, C.; Thieme, J. Precipitation and Growth of Crystalline Matter: Mesocrystals, Composites, and Morphosynthesis. Faraday Discuss. 2007, 136, 265. [Google Scholar] [CrossRef]
  31. Faatz, M.; Gröhn, F.; Wegner, G. Amorphous Calcium Carbonate: Synthesis and Potential Intermediate in Biomineralization. Adv. Mater. 2004, 16, 996. [Google Scholar] [CrossRef]
  32. Addadi, L.; Raz, S.; Weiner, S. Taking Advantage of Disorder: Amorphous Calcium Carbonate and Its Roles in Biomineralization. Adv. Mater. 2003, 15, 959. [Google Scholar] [CrossRef]
  33. Xu, A.W.; Ma, Y.R.; Cölfen, H. Biomimetic mineralization. J. Mater. Chem. 2007, 17, 415. [Google Scholar] [CrossRef]
  34. Sinn, C.G.; Dimova, R.; Antonietti, M. Isothermal Titration Calorimetry of the Polyelectrolyte/Water Interaction and Binding of Ca2+: Effects Determining the Quality of Polymeric Scale Inhibitors. Macromolecules 2004, 37, 3444. [Google Scholar] [CrossRef]
  35. Quigley, D.; Rodger, P.M. Metadynamics simulations of ice nucleation and growth. J. Chem. Phys. 2008, 128, 154518. [Google Scholar] [CrossRef]
  36. Raiteri, P.; Gale, J.D. Water is the key to nonclassical nucleation of Amorphous Calcium Carbonate. J. Am. Chem. Soc. 2010, 132, 17623–17634. [Google Scholar] [CrossRef]
  37. May, T.W.; Wiedmeyer, R.H. A table of polyatomic interferences in ICP-MS. At. Spectrosc. 1998, 19, 150–155. [Google Scholar]
  38. Han, I.; Rhee, C.; Kim, D. Investigations on Potential Applications of CaMg(CO3)2 Nanoparticles. Molecules 2022, 28, 316. [Google Scholar] [CrossRef] [PubMed] [PubMed Central]
  39. Gindele, M.B.; Vinod-Kumar, S.; Rochau, J.; Boemke, D.; Groß, E.; Redrouthu, V.S.; Gebauer, D.; Mathies, G. Colloidal pathways of amorphous calcium carbonate formation lead to distinct water environments and conductivity. Nat. Commun. 2024, 15, 80. [Google Scholar] [CrossRef] [PubMed]
  40. Du, H.; Amstad, E. Water: How does it influence the CaCO3 formation? Angew. Chem. Int. Ed. 2020, 59, 1798–1816. [Google Scholar] [CrossRef]
  41. Jin, B.; Liu, Z.M.; Tang, R.K. Recent experimental explorations of non-classical nucleation. CrystEngComm 2020, 22, 4057–4073. [Google Scholar] [CrossRef]
  42. Gebauer, D.; Kellermeier, M.; Gale, J.D.; Bergström, L.; Cölfen, H. Pre-nucleation clusters as solute precursors in crystallisation. Chem. Soc. Rev. 2014, 43, 2348–2371. [Google Scholar] [CrossRef] [PubMed]
  43. Jehannin, M.; Rao, A.; Cölfen, H. New horizons of nonclassical crystallization. J. Am. Chem. Soc. 2019, 141, 10120–10136. [Google Scholar] [CrossRef] [PubMed]
  44. Podzimek, S. Light Scattering, Size Exclusion Chromatography and Asymmetric Flow Field Flow Fractionation: Powerful Tools for the Characterization of Polymers, Proteins and Nanoparticles; John Wiley & Sons: Hoboken, NJ, USA, 2011. [Google Scholar]
Figure 1. Schematic of the pathways for classical and non-classical nucleation (not to scale). The intermediate and solidification steps of ACC are summarized as ACC [15].
Water 16 02419 g001
Figure 2. Block diagram of the AF4-UV-MALS system without ICP-MS connection.
Water 16 02419 g002
Figure 3. Block diagram of the connection of the MALS system to the ICP-MS.
Water 16 02419 g003
Figure 4. Fractograms with scattering signals and calculated radii of the scatterers from samples A1 (treated groundwater—cascade aeration → pellet softening → multilayer filtration), A2 (treated groundwater—limited aeration → rapid marble filtration → aeration → rapid sand filtration), B1 (treated groundwater—cascade aeration → rapid sand filtration), B2 (treated groundwater—cascade aeration → rapid sand filtration), C1 (bottled drinking water), and C2 (untreated mountain spring water).
Water 16 02419 g004
Figure 5. Column scatter plot of the radii measured by MALS in samples provided by drinking water companies. The vertical lines represent density distributions, indicating where the data points are most clustered.
Water 16 02419 g005
Figure 6. AF4-UV-MALS-ICP-MS fractograms of samples A1 and A2, treated groundwater (cascade aeration → pellet softening → multilayer filtration) and treated groundwater (limited aeration → rapid marble filtration → aeration → rapid sand filtration), respectively, including MALS scattering signals, UV absorption, and metal isotope counts from the ICP-MS.
Water 16 02419 g006
Figure 7. AF4-UV-MALS-ICP-MS fractograms of samples B1 and B2, treated groundwater (cascade aeration → rapid sand filtration), including MALS scattering signals, UV absorption, and metal isotope counts from the ICP-MS.
Water 16 02419 g007
Figure 8. AF4-UV-MALS-ICP-MS fractograms of samples C1 and C2, bottled drinking water and untreated mountain spring water, respectively, including MALS scattering signals, UV absorption, and metal isotope counts from the ICP-MS.
Water 16 02419 g008
Figure 9. 24Mg ICP-MS signals obtained for sample A2, compared to two blank runs using Milli-Q water.
Water 16 02419 g009
Figure 10. 88Sr ICP-MS signals obtained for sample B1, compared to two blank runs using Milli-Q water.
Water 16 02419 g010
Figure 11. 66Zn ICP-MS signals obtained for sample C1, bottled drinking water, compared to two blank runs using Milli-Q water.
Water 16 02419 g011
Figure 12. 63Cu ICP-MS signals obtained for sample C1, bottled drinking water, compared to two blank runs using Milli-Q water.
Water 16 02419 g012
Table 1. Operating parameters of the ICP-MS coupled to the AF4-MALS.
Plasma Torch RF Power/WPlasma Torch Nebulizer Flow/L min−1 Plasma Torch Auxiliary Flow/L min−1Plasma Torch Coolant Flow/L min−1 Quadrupole Dwell Time/sPeri-Pump Flow Rate/mL min−1
15501.070.8140.01~0.19
Table 2. List of samples provided by three undisclosed drinking water companies, with their total initial volume and information on their origin.
CompanySample LabelInformation on the Origin of the Water
AA1Treated groundwater (Cascade aeration → Pellet softening → Multilayer filtration)
A2Treated groundwater (Limited aeration → Rapid marble filtration → Aeration → Rapid sand filtration)
BB1Treated groundwater (Cascade aeration → Rapid sand filtration)
B2Treated groundwater (Cascade aeration → Rapid sand filtration)
CC1Bottled drinking water
C2Untreated mountain spring water (source for C1)
Table 3. Total organic carbon (TOC), inorganic carbon (IC), common metal ions, pH, conductivity, turbidity, and color of water samples A1, A2, B1, B2, C1, and C2.
AnalysisA1A2B1B2C1C2
TOC/mg L−13.62.31.63.11.03.0
IC/mg L−135.329.154.139.434.936.8
Al3+/µg L−16.3<5.005.3213.7<5.00<5.00
Ba2+/µg L−114.815.332.617.456.356.7
Cu2+/µg L−12.82.1968.93.8727.430.1
Mg2+/µg L−16560436096209510>10,000>10,000
Sr2+/µg L−1144129391289167174
Zn2+/µg L−12.11.932.322.025.452.77
pH7.687.617.827.907.857.63
EC/µS cm−1355.7402.0542.3514.3377.0394.0
Turbidity/NTUs110102
Color (Hazen)4410714
Disclaimer/Publisher’s Note: The statements, opinions and data contained in all publications are solely those of the individual author(s) and contributor(s) and not of MDPI and/or the editor(s). MDPI and/or the editor(s) disclaim responsibility for any injury to people or property resulting from any ideas, methods, instructions or products referred to in the content.