Article

REV and Three-Dimensional Permeability Tensor of Fractured Rock Masses with Heterogeneous Aperture Distributions

1
College of Civil Engineering and Architecture, Shandong University of Science and Technology, Qingdao 266590, China
2
School of Engineering, Nagasaki University, 1-14 Bunkyo-Machi, Nagasaki 8528521, Japan
3
College of Energy, Chengdu University of Technology, Chengdu 610059, China
*
Author to whom correspondence should be addressed.
Water 2024, 16(17), 2435; https://doi.org/10.3390/w16172435
Submission received: 21 June 2024 / Revised: 25 August 2024 / Accepted: 27 August 2024 / Published: 28 August 2024
(This article belongs to the Section Hydraulics and Hydrodynamics)

Abstract

:
This study performed a representative elementary volume (REV) and 3D equivalent continuum study of rock fractures based on fluid simulations of 3D discrete fracture networks (DFNs). A series of 3D DFNs with heterogeneous aperture distributions (the DFN-H model) and uniform apertures (the DFN-I model) were established, in which the fractures were oriented according to the geological field mapping of a high-level radioactive waste candidate site in China. The 3D DFNs of the different model sizes were extracted and rotated in a number of directions to check whether there was a tensor quality of the permeability at a certain scale. The results show that aperture heterogeneity increases the REV size and results in a necessarily larger model size to reach an equivalent continuum behavior, and this effect is more obvious when the fracture density is smaller. The shape of the 2D permeability contour is irregular, with some breaks when the model size is small. As the model size increases, its shape gradually tends to become smooth and approaches an ellipse. The shape of the permeability contours of the DFN-H model is slender compared to the DFN-I model, indicating a larger difference between the minimum and maximum values of the permeability. For the DFN-H model, there is no appropriate approximation for the equivalent permeability tensor over the studied model size range, whereas a good fit of the permeability ellipsoid is obtained for the DFN-I model, and the 3D directional permeability is calculated at this model scale. The corresponding magnitude and direction of the principal permeability are obtained, which can be viewed as the equivalent permeability tensor for the approximated continuum medium.

1. Introduction

One of the most difficult tasks in rock engineering is to accurately characterize the hydraulic properties of fractured rock masses for the purpose of engineering analysis. Due to various geological processes, a fractured rock mass comprises an intact rock matrix and discontinuities (e.g., joints, fractures, bedding planes, and faults). These discontinuities are often different in trace length, orientation, and aperture, which leads to inhomogeneity and anisotropy of the rock mass [1,2,3,4,5,6,7]. The permeability of the rock fracture is obviously larger than that of the matrix, and thus flow occurs mainly inside the connected fractures [8,9,10,11,12]. Knowledge of the detailed flow structure within fracture networks is significant with respect to characterizing the overall hydraulic response of fractured media.
The three-dimensional discrete fracture network (3D DFN) modelling approach has been applied to study flow behaviors through fractured rock masses [13,14,15]. In DFN models, fractures are represented by planar polygons or discs with different locations, orientations, sizes, and apertures. As a result, the model can represent the geometrical properties of each fracture individually, and explicitly characterize the contributions of each fracture to the flow. However, this approach requires huge computational costs when handling large-scale problems. Alternatively, the equivalent continuum method becomes attractive for a flow calculation averaged over a large domain [16,17,18,19]. In this method, the equivalent permeability is arranged to the volumetric grids to reflect the effect of fractures on the flow. Such an equivalent simplification of complex fracture systems enables an efficient calculation.
A premise for applying the equivalent continuum method is that there exists a representative elementary volume (REV) for evaluation of equivalent permeability tensors of the fracture system [20,21,22,23,24]. The REV is defined as a minimum domain size beyond which the rock mass properties remain constant. It is a fundamental concept for quantifying the scale dependency of hydraulic properties, as shown in Figure 1. However, there is no guarantee that REV size always exists for every fractured rock mass [25,26,27]. Therefore, research on the existence of the REV for a particular fracture medium is a crucial step to justify whether it is appropriate to apply the continuum method. If the REV exists, the equivalent continuum permeability tensor can be calculated from the fractured rock mass at a scale equal to or larger than the REV size.
Previous studies have indicated that the REV and the equivalent permeability tensor of the fractured rock masses are related to geometrical properties of fractures [29,30]. Wang et al. [19] applied a 3D conceptual linear pipe fracture network model to calculate the permeability tensor of a tunnel site. They found that the permeability tensor is significantly anisotropic, in which the principal directions are consistent with the existing fracture system in the site. Rong et al. [31] indicated that the permeability anisotropy is primarily influenced by the fracture orientation, and the REV size is primarily controlled by the fracture spacing, trace length, and the number of fracture sets. Feng et al. [32] concluded that the REV size decreases exponentially as the fracture length exponent increases. The above studies assumed that flow occurs in bonds connecting the center of a fracture to the center of the intersection of two adjacent fractures, and thus that individual fractures in the model have uniformly distributed apertures. Nevertheless, rock fractures naturally have heterogeneous apertures formed by two rough surfaces [33,34,35,36,37,38,39,40,41]. The influence of aperture heterogeneity on flow behavior through 3D fracture networks has been demonstrated at both laboratory scale [42,43,44,45] and field scale [46,47,48]. Ishibashi et al. [49] stated that modeling the fracture system with a uniform aperture field potentially leads to incorrect scenarios for developing the fractured reservoirs. Therefore, the effect of aperture heterogeneity on the REV and equivalent permeability tensor of 3D fracture networks should be further investigated.
To cope with this issue, a number of 3D DFNs with heterogeneous aperture distribution and uniform aperture distribution are established, in which the fractures are oriented according to the geological field mapping of a high-level radioactive waste candidate site in China. The numerical simulation results are utilized to examine the existence of the REV and the equivalent permeability tensor. The influences of fracture density, aperture distribution, and model size on the magnitude and direction of permeability tensor are systematically analyzed.

2. Model Generation

The DFNs are generated using the geometrical parameters of a high-level radioactive waste candidate site located in Beishan, of the Gansu province, China. The geological structure of this area is mainly composed of biotite monzonitic granite. Under various geological conditions, the granite rocks with fractures are well exposed on outcrops in a region of approximately 12 km2. Based on digital techniques, Guo et al. [50] identified two homogeneities—i.e., Homogeneity I and II—in this area. Homogeneity I contains two dominant discontinuity sets, and Homogeneity II contains three dominant discontinuity sets. The geometrical properties of discontinuity involving trace length, aperture, roughness, and orientation are measured using high-precision GPS-RTK equipment (Real Time Kinematic) [50]. The fracture networks in the present are generated based on the field results of Homogeneity I. Detailed statistics parameters of two dominant discontinuity sets in Homogeneity I are reported in the study of Guo et al. [50].
Since the REV is closely correlated with the number of fractures in the analyzed domain, three increasing fracture densities—i.e., P32 = 0.1, 0.2 and 0.3 m2/m3—are considered. The orientations of the two discontinuity sets in Homogeneity I follow the Fisher distribution with the parameters tabulated in Table 1. Digital processing for the discontinuity indicates that the local aperture of fractures is non-uniform due to the surface roughness. The fracture aperture in the present study is assumed to follow the truncated normal distribution, with a mean aperture of 1.82 mm and a variance of 1.15 mm. In many previous studies, due to computational limitations, the individual fractures in the DFN model are commonly assumed to be parallel plates having an identical mechanical aperture. To clarify the effect of this simplification on fluid flow in 3D DFNs, for each DFN model with heterogeneous aperture distributions (denoted as the DFN-H model), a corresponding DFN with the same geometrical structure but an identical mean aperture (denoted as the DFN-I model) is also established for comparison.
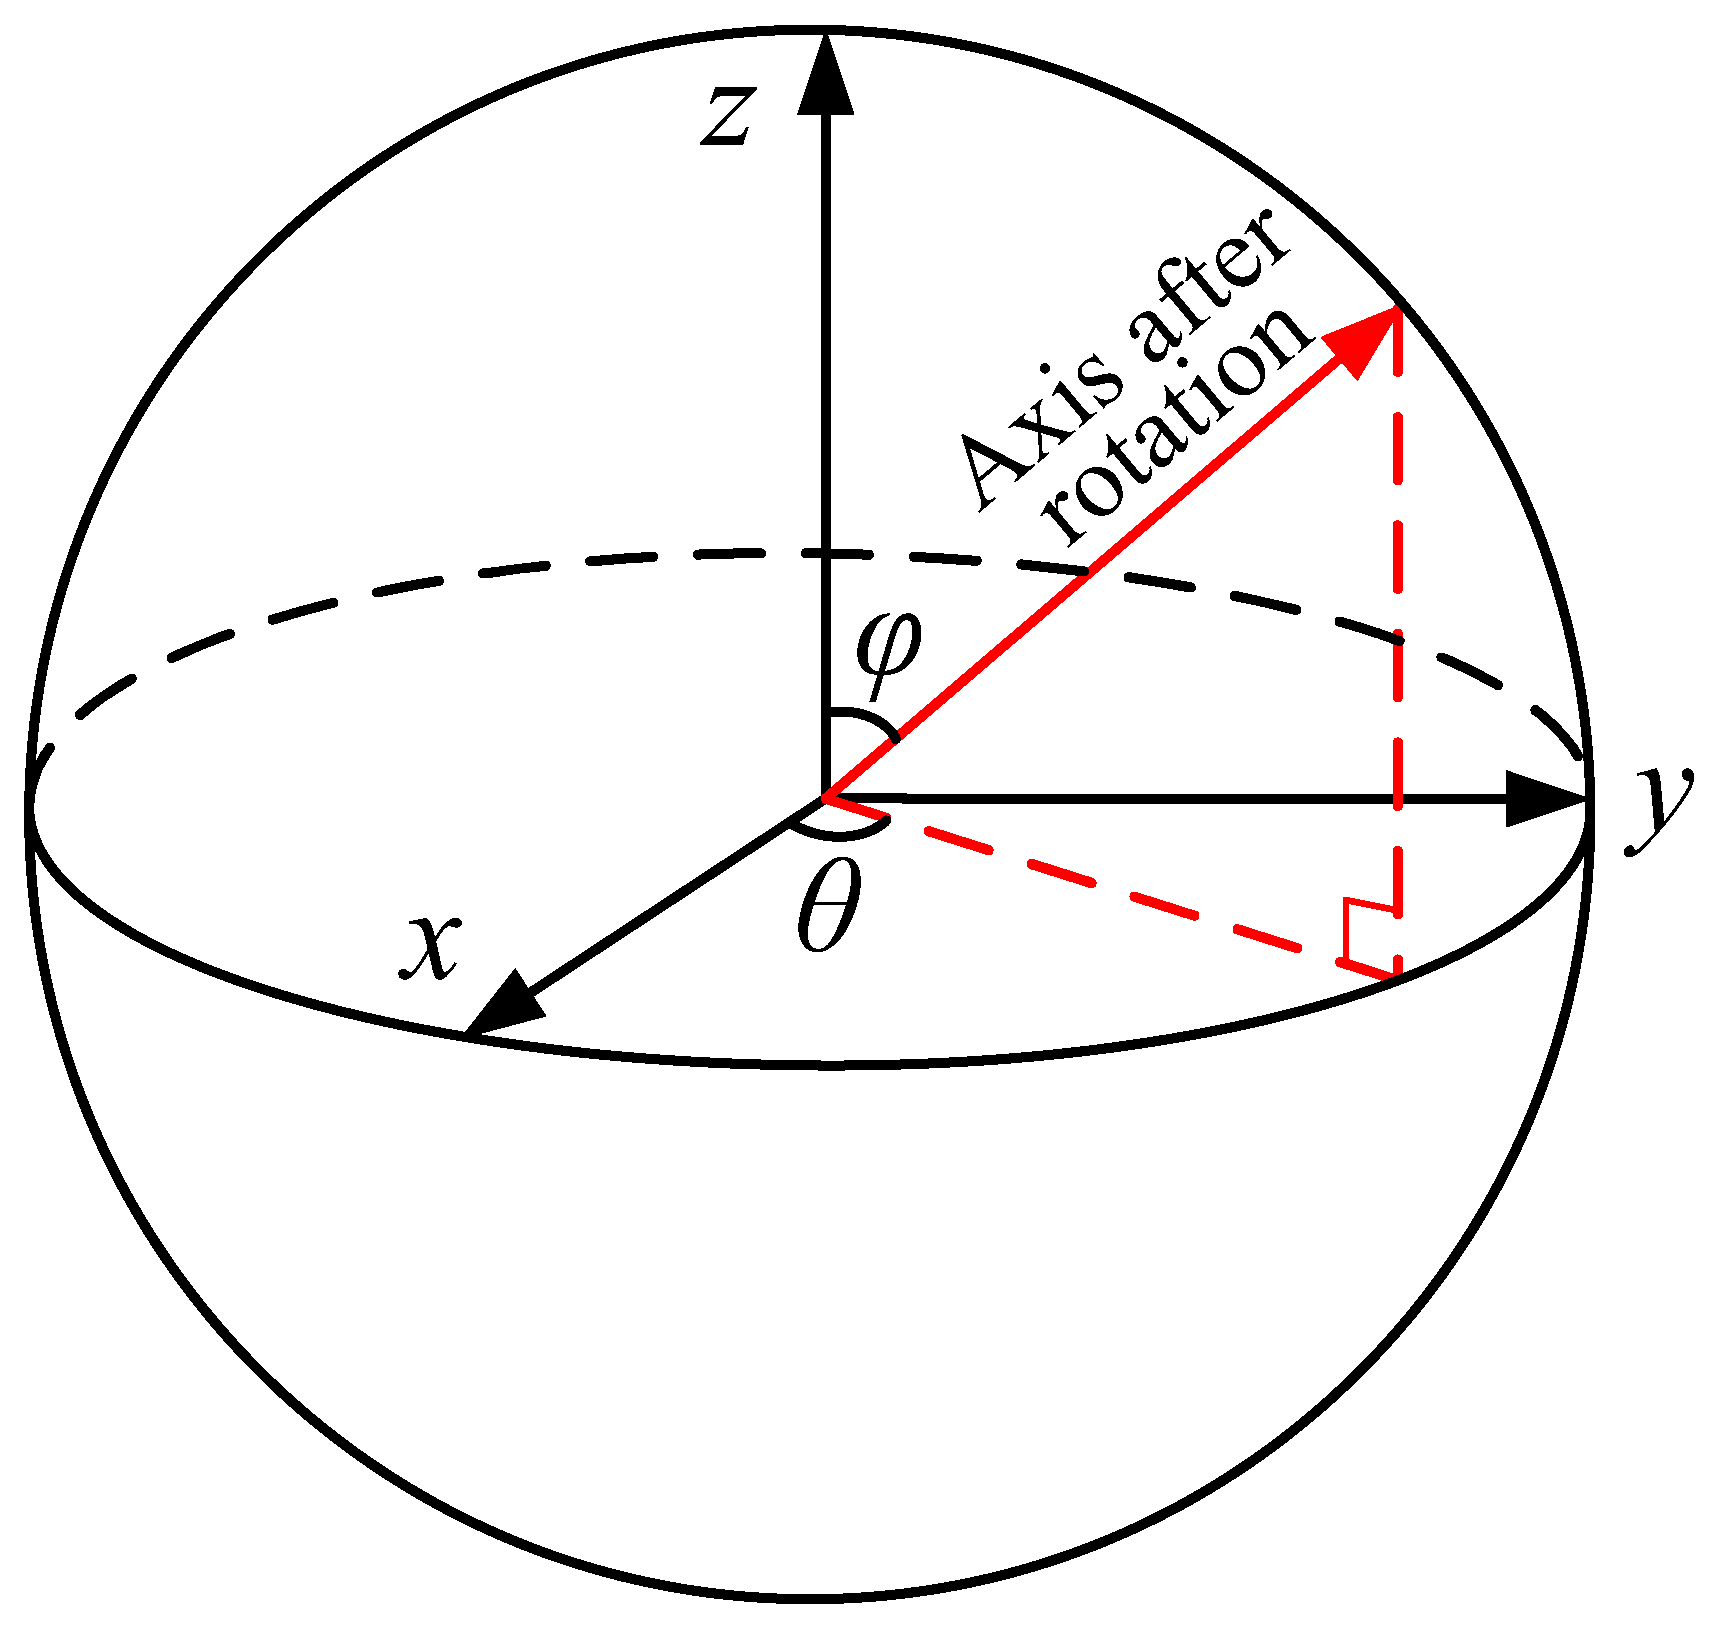
The study’s DFNs are established using the Monte Carlo method [51,52], in which the geometrical properties utilized follow the distributions defined above. In order to avoid randomness and boundary effects, three large “parent” DFNs of 150 × 150 × 150 m are firstly established using different random numbers, as shown in Figure 2. From each parent model, smaller DFN models, with sizes varying from 5 to 50 m, are extracted for REV studies. Each smaller model is then rotated in a number of directions to check whether there exists a tensor quality of the permeability at a certain scale. Figure 3 displays an example of the rotated DFNs extracted from the large parent model. The cubes in different colors indicate the DFNs extracted at the original configuration and at the rotation of α, respectively. In total, 26 different directions—indicated by the angles of θ and φ shown in Figure 4—are needed to cover the whole 3D space at every 45°. As the magnitudes of the permeability tensor are the same in two opposite directions, only 13 directions are considered for generaing the rotated DFN models.

3. Flow Calculations

The steady and laminar flow through single rock fractures can be modeled via the Reynolds equation, written in [53] as
x f ρ g b 3 12 μ h x f + y f ρ g b 3 12 μ h y f = 0
where xf and yf are the local coordinates for a fracture plane Ωf, ρ is the fluid density, b is the local aperture, μ is the dynamic viscosity, h is the hydraulic head, and g is the gravitational acceleration. To estimate the overall flow within the fracture network, the following continuity conditions are applied on the fracture intersections Sk [8]:
h k , f = h k ,   f F k f F k q k , f n k , f = 0
where hk is the hydraulic head on Sk, Fk is the set of fracture intersecting on Sk, hk,f is the trace of the head on Sk in Ωf, qk,f is the flow through intersection of Ωf, and nk,f is the normal vector to the fracture intersection Sk in Ωf.
To estimate the permeability in the selected direction, a unit hydraulic gradient was applied on two perpendicular faces of the model in that direction, and the other faces of the model were set to be no-flow boundaries. The directional permeability can be calculated as follows [35]:
K d m = μ A ρ g q m h m
where ∇h is the hydraulic gradient in the direction m, and q is the vector flux.
The following equation relates the permeability tensor K to the Kd(m) [25]:
Kd(m) = mT·K·m
From Equation (4) the following equation can be derived:
K d m i = m i 1 2 K 11 + m i 2 2 K 22 + m i 3 2 K 33 + 2 m i 1 m i 2 K 12 + 2 m i 2 m i 3 K 23 + 2 m i 1 m i 3 K 13
where K11, K12, K13, K22, K23, and K33 are six independent permeability tensor components. Kd(mi) is the ith directional permeability in the direction of mi= (mi1, mi2, mi3). When the permeability along N (N ≥ 6) directions is known, the linear equations with the six unknown quantities can be written in the following matrix form:
AX = b
with
A = m 11 , m 12 , m 13 , 2 m 11 m 12 , 2 m 12 m 13 , 2 m 11 m 13 m 21 , m 22 , m 23 , 2 m 21 m 22 , 2 m 22 m 23 , 2 m 21 m 23 m N 1 , m N 2 , m N 3 , 2 m N 1 m N 2 , 2 m N 2 m N 3 , 2 m N 1 m N 3
X = K 11 , K 22 , K 33 , K 12 , K 23 , K 13 T
b = K d m 1 , K d m 2 , , K d m N T
When a linear regression model is applied, the estimator K e = K 11 e , K 22 e , K 33 e , K 12 e , K 23 e , K 13 e T of the regression parameters X = K 11 , K 22 , K 33 , K 12 , K 23 , K 13 T obtained from the method of least squares has the form [54]
K e = A T A 1 A T b
The program proposed by the authors of this study was utilized to calculate the fluid flow behavior in 3D DFN models [55]. In this approach, the large parent DFNs were firstly generated with geometrical properties following the predefined distributions. The computational domain with different sizes and rotation angles was defined. The isolated fractures and the fractures outside the computational domain were deleted. Then each fracture was triangularly discretized while the discretization conformed at fracture intersections. Under this constraint, the relevant continuity conditions can be easily applied to the fracture intersections. Finally, the Galerkin method was applied to calculate the flow-through DFNs, considering the mass and flux continuity at fracture intersections. Based on the flow calculation of the model with different fracture densities, apertures, model sizes, and rotation angles, the permeability tensor as well as the REV size are estimated.

4. Results and Analysis

4.1. REV Based on Geometrical Indicators

It is known that flow calculation via 3D DFN is usually time-consuming. Geometrical indicators can be used for initial estimation of the REV size due to their efficiency. The average intersection length (Li), defined as the ratio of total intersection length to the number of intersections, is computed to examine the existence of REV. Figure 5 shows the variation of Li with L for DFNs of different fracture densities. For all cases, with increasing L, Li fluctuates first and then gradually tends to stability. The variance of Li between models generated using different random numbers decreases as P32 increases. The coefficient of variance (CV) of the models with five different random numbers is calculated and plotted in Figure 6. Figure 6 shows that the value of CV decreases with increasing L, indicating that the Li do not change much when the model size exceeds a certain value. Previous studies have shown that when the value of CV decreases to 0.2, the corresponding model size can be approximated as an REV size [21,22]. The calculated REV size is equal to 16.7 m, 10.1 m, and 8.5 m, respectively, for the DFNs with three increasing P32s, implying a decreasing REV size with increasing P32.

4.2. REV Based on Flow Indicators

Figure 7 displays the comparisons of preferential flow pathways along the overall flow direction of θ = 0° and φ = 90° in DFNs with different L, P32, and aperture distributions. For DFN-H models, there are pronounced channeling flow effects within the individual fractures as well as within the networks. At each individual fracture, fluids are mainly concentrated in the channels with large apertures while bypassing the barriers with small apertures. Regarding the network, fluids select some transmissive fractures within the connected networks from the inlet to outlet boundaries. Increasing L or P32 provides more alternative fracture connections, thus reducing the channeling flow effect at the network scale. Compared to the DFN-H models, the flow in the DFN-I models is less channelized in the individual fracture, but it shows essentially similar channeling at the network scale, which is induced by the complex topology of the fracture networks.
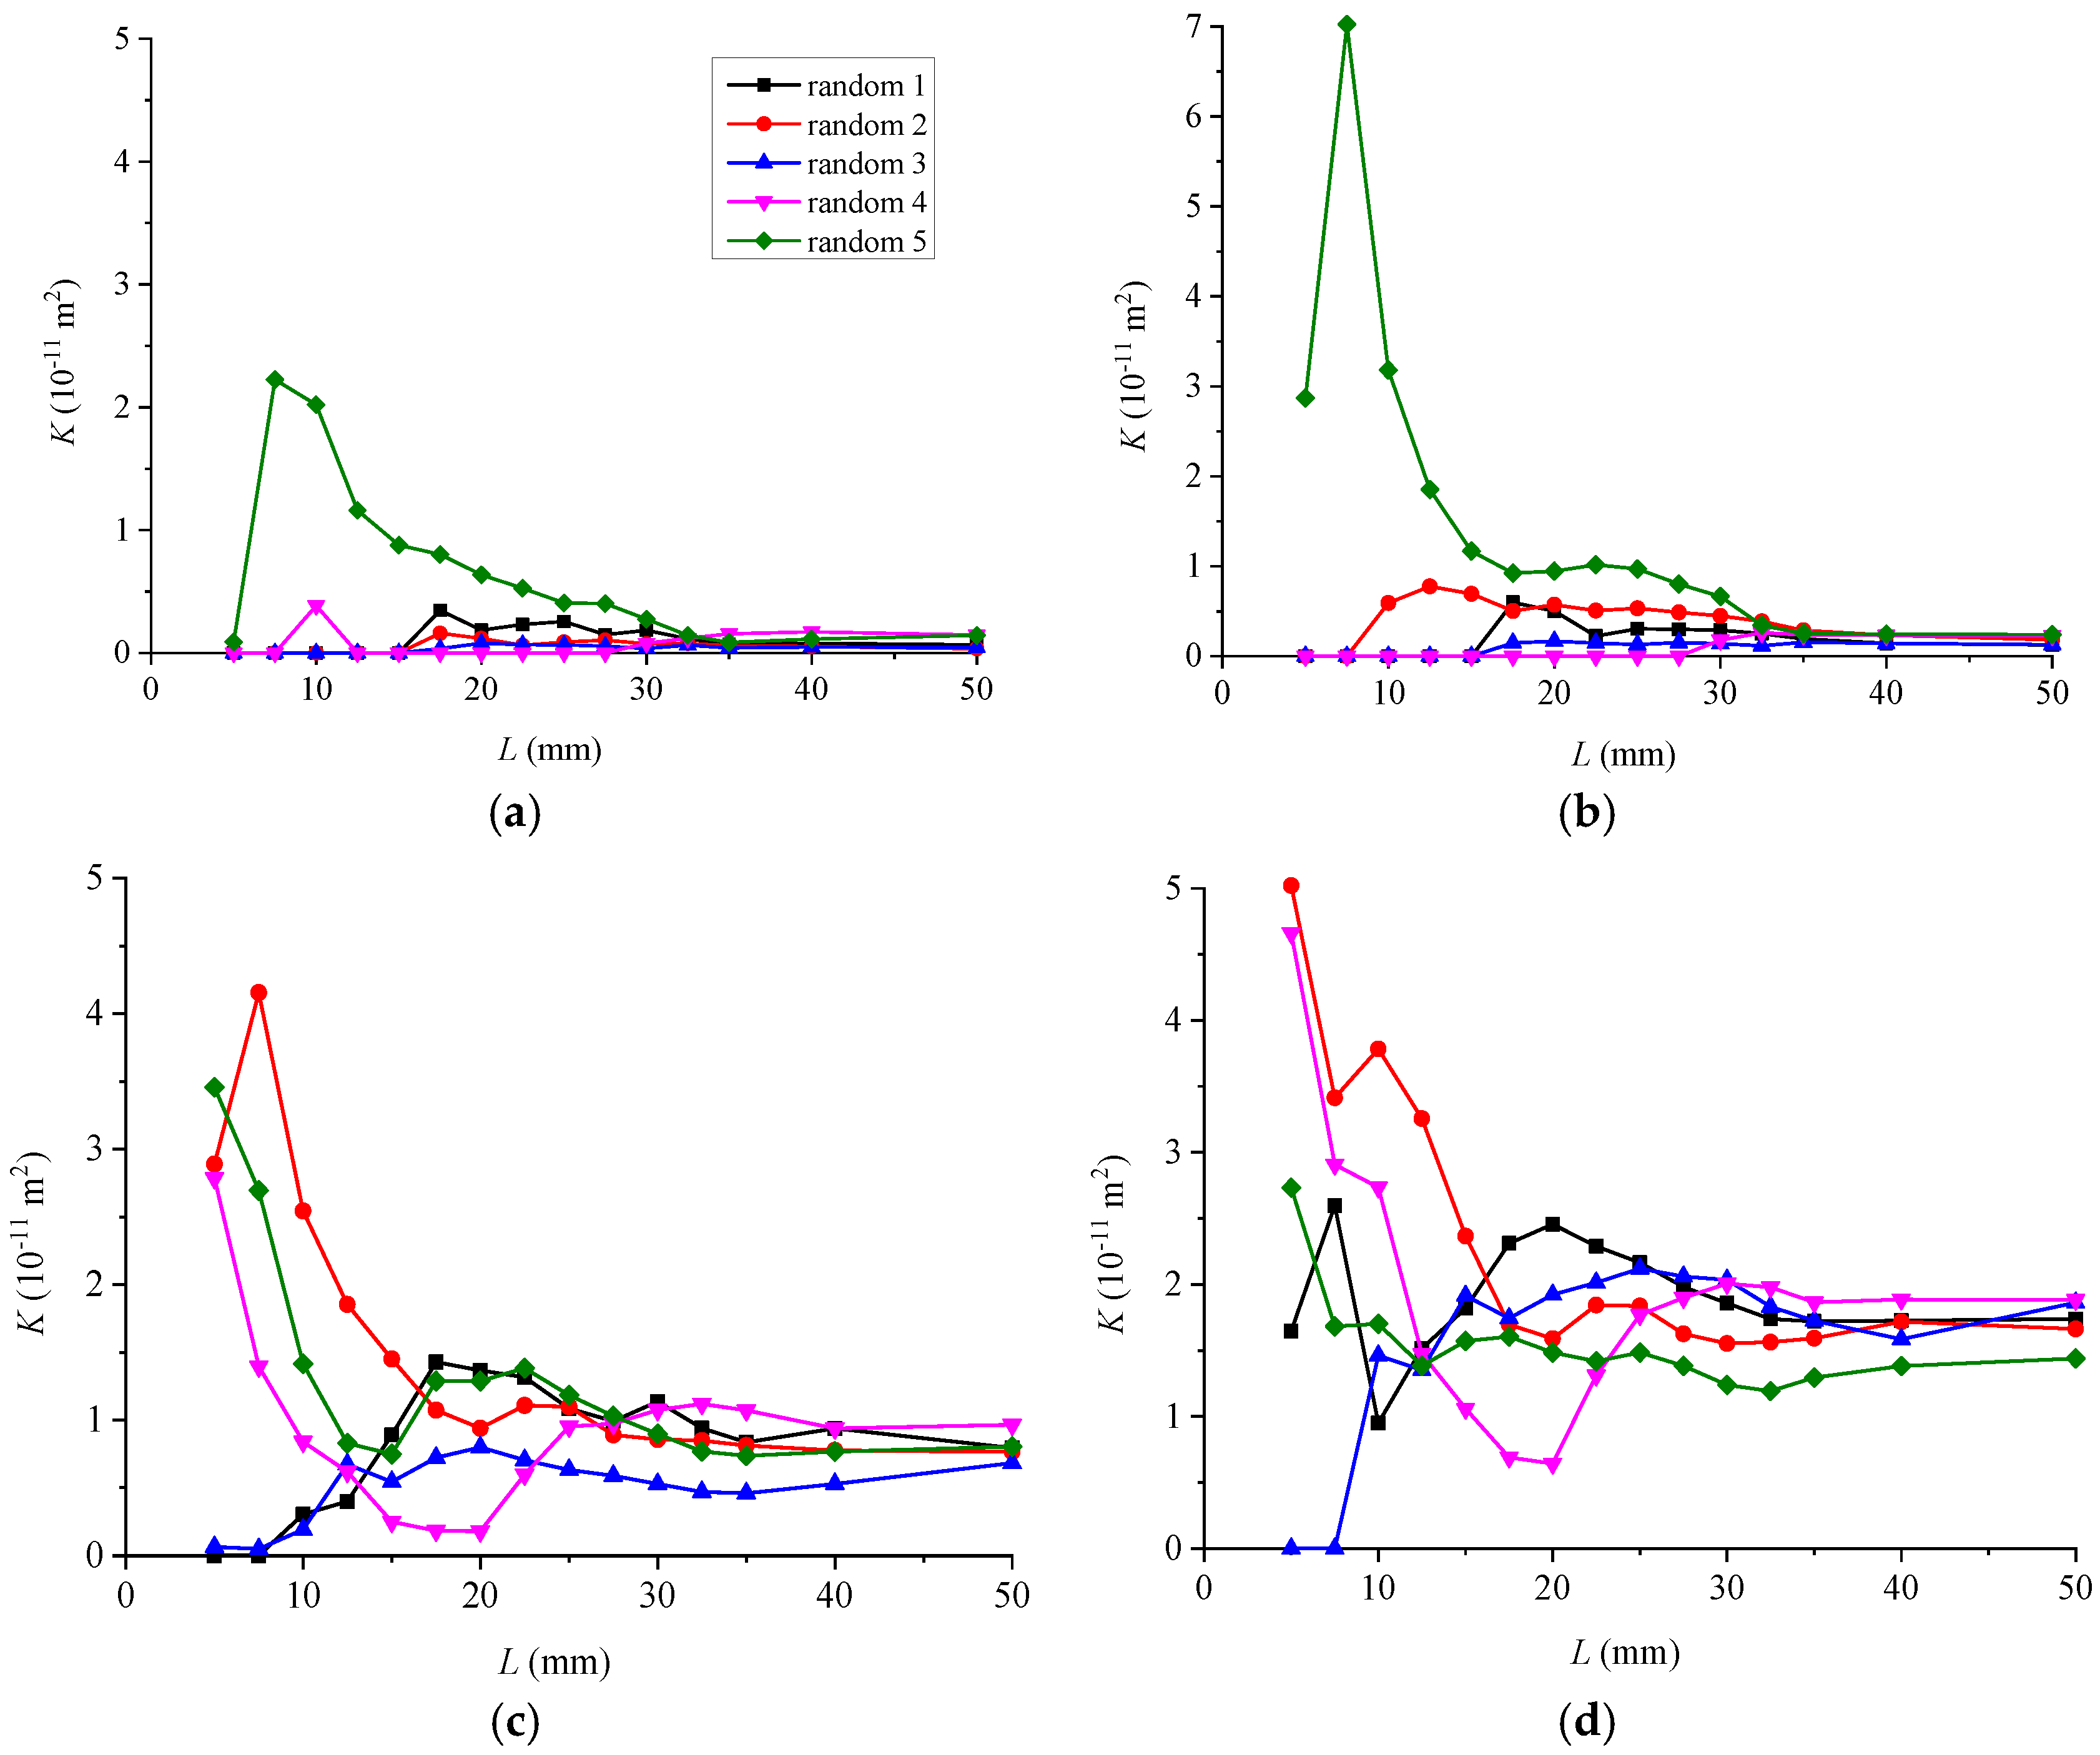
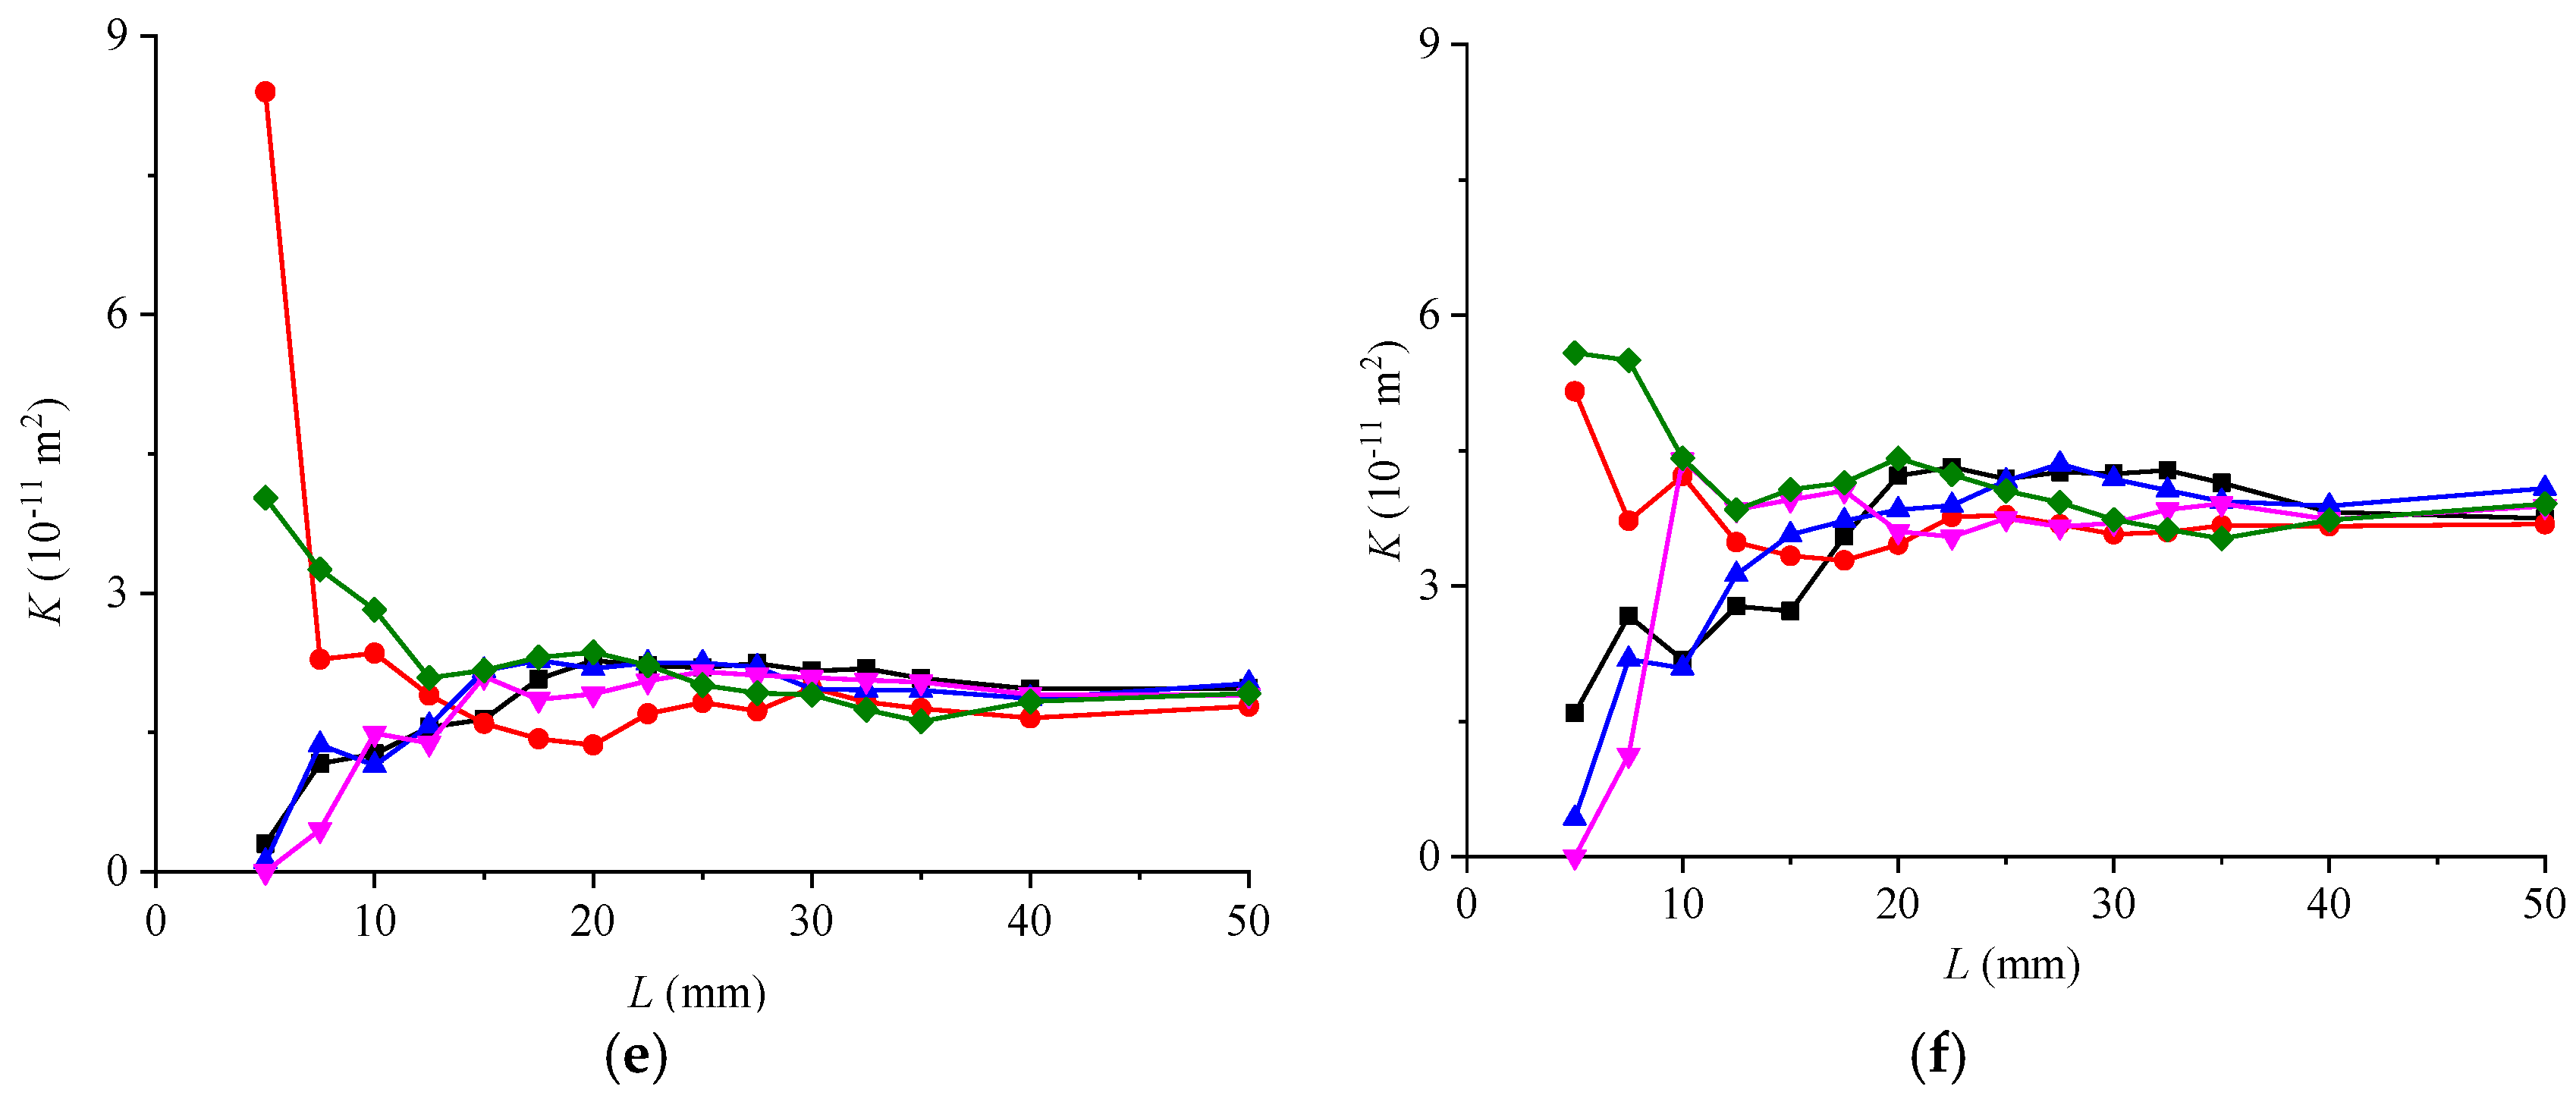
Figure 8 shows the calculated permeability in the direction of θ = 0° and φ = 90° for DFN models of different model sizes, fracture densities, and aperture distributions. The results show that, for all cases, K varies significantly when L is small, which is induced by the influence of the random numbers used to generate the DFN models. As L exceeds a certain value, K becomes almost constant, and this phenomenon is more obvious with increasing P32. Although the variation of K decreases significantly when L exceeds a certain value, the difference between the minimum and maximum values of K is still about 4 times greater for the DFN-H model with P32 = 0.1 m2/m3. This difference gradually decreases with increasing P32. The DFN-I model usually has a larger K compared to the DFN-H model, indicating that the aperture heterogeneity reduces the permeability of fracture networks.
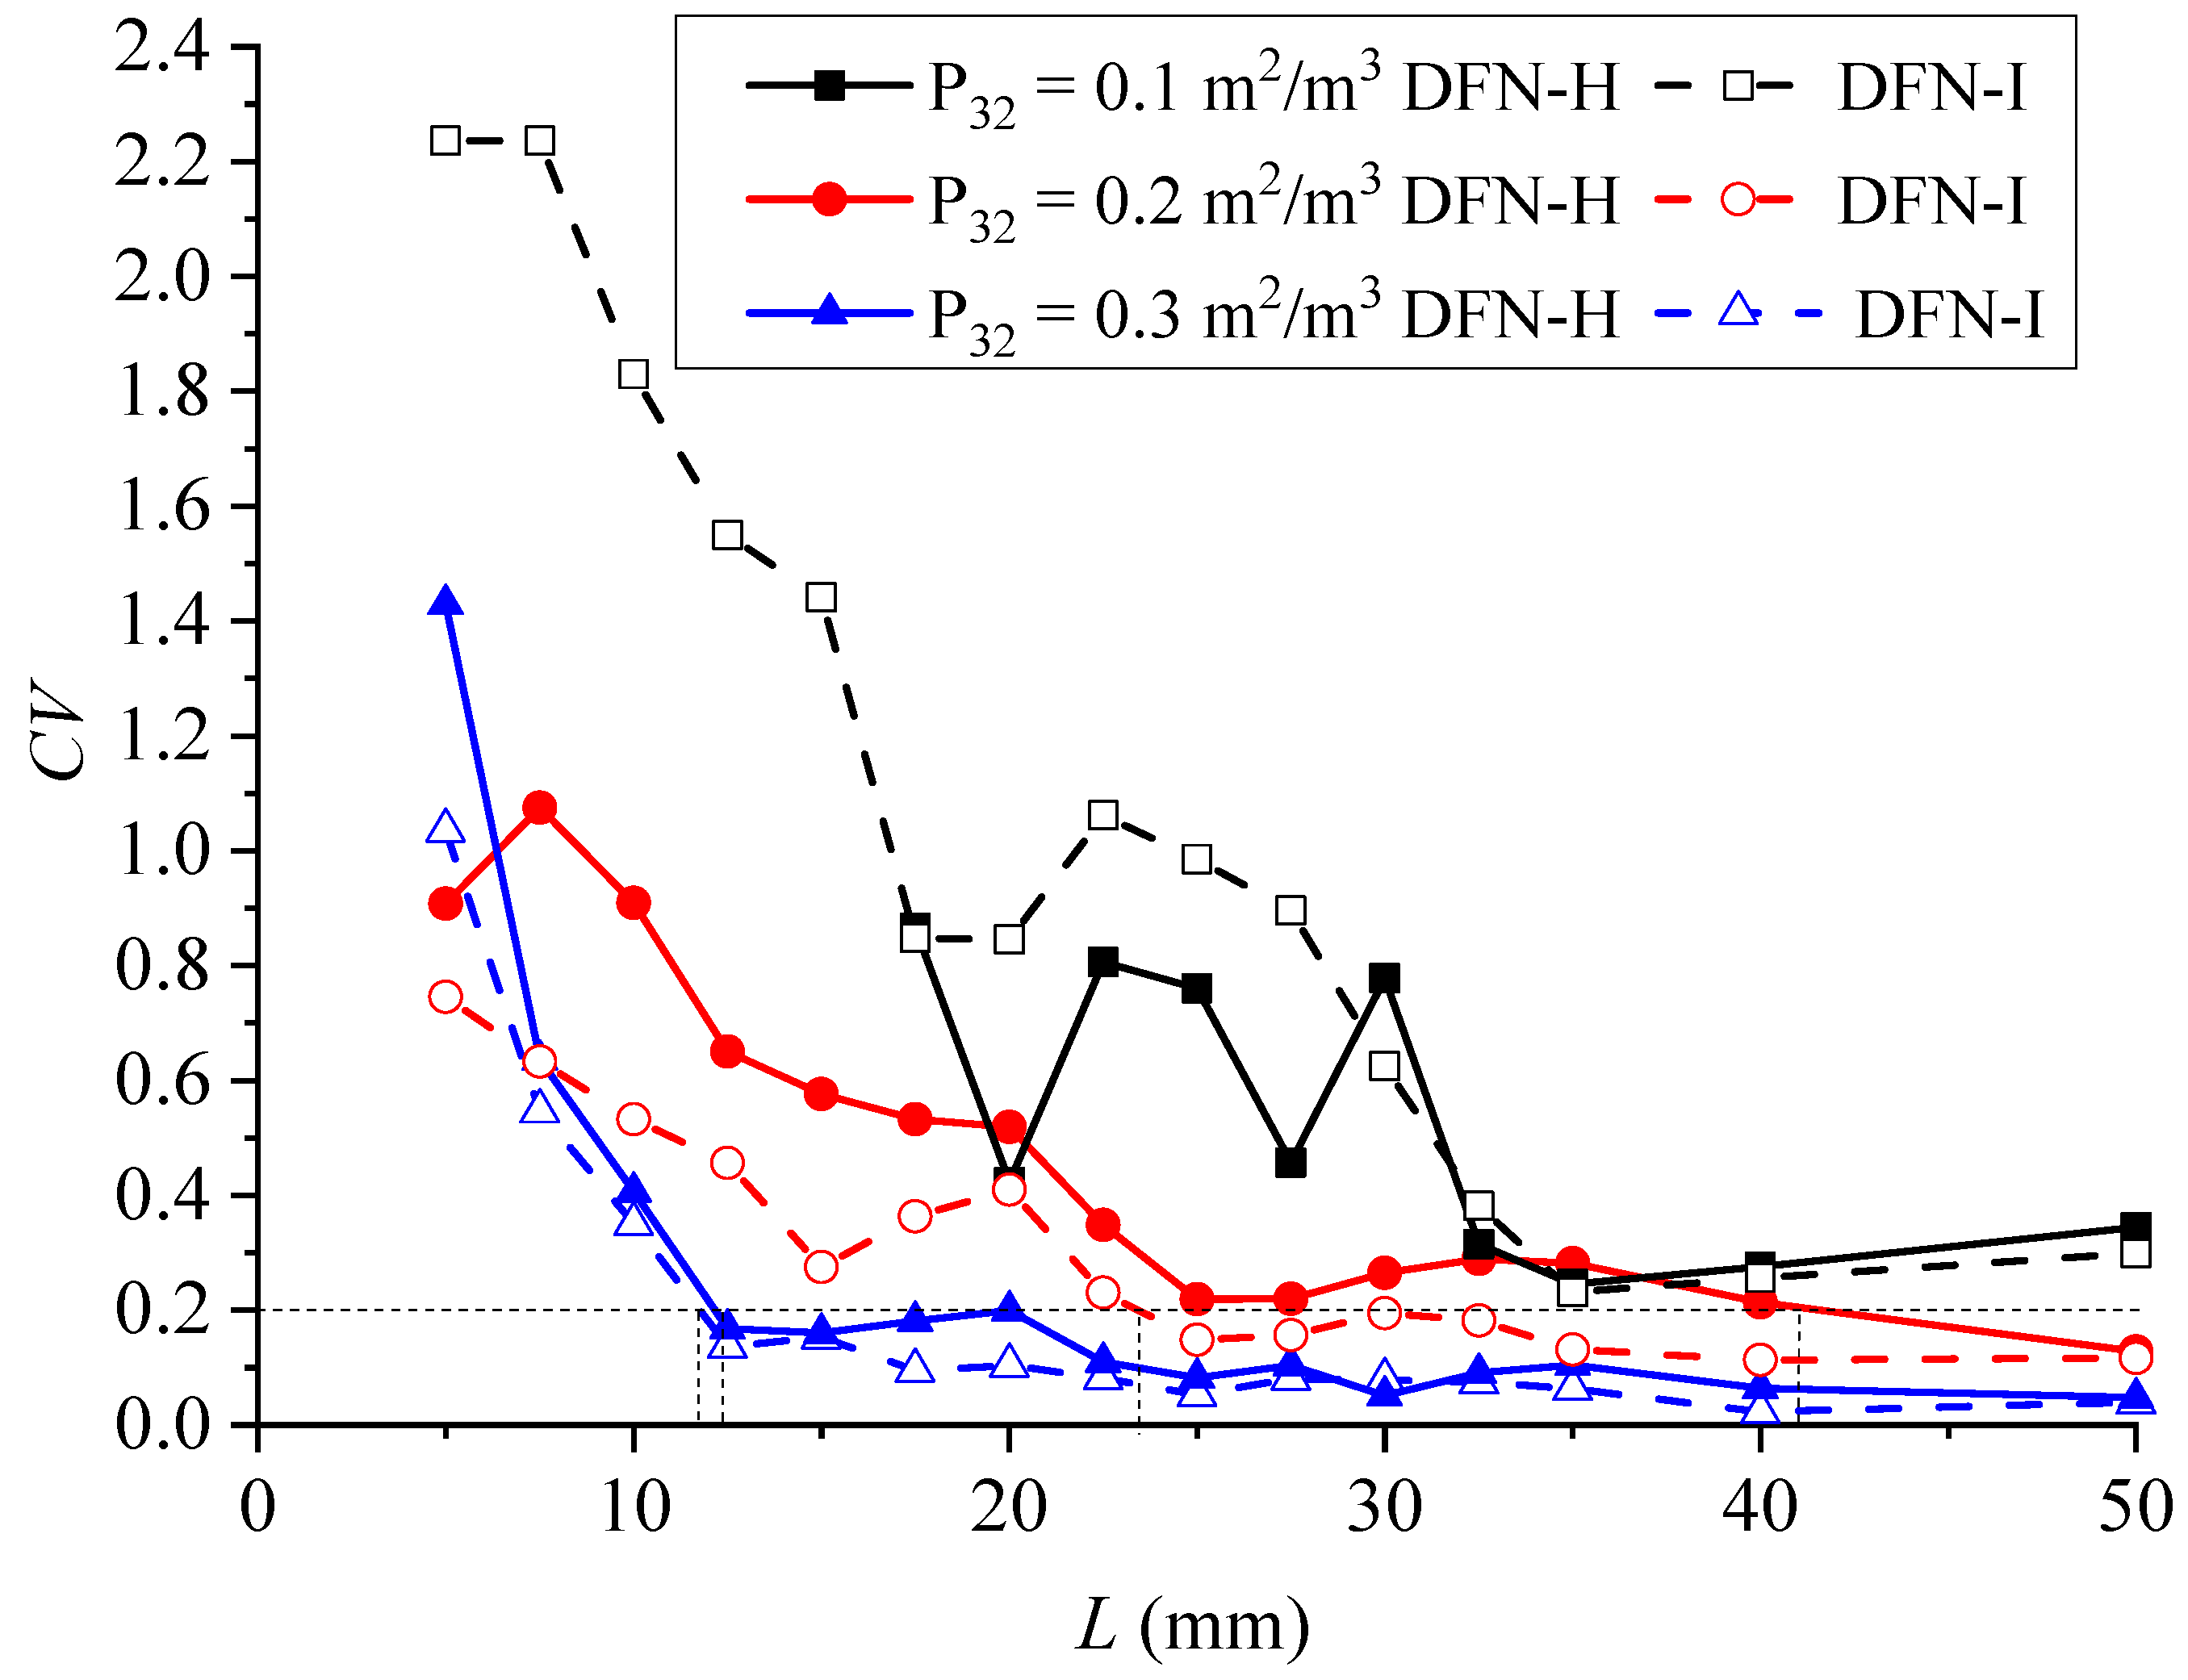
The CV of K for the models with five different random numbers is calculated and plotted in Figure 9. With increasing L, the CV decreases rapidly at first and then gradually tends to stability. The calculated CV for the DFN-I and DFN-H models with P32 = 0.1 m2/m3 is larger than 0.2 over the whole range of L, indicating that the REV does not exist within the calculated model size range. For DFN-H models with P32 = 0.2 and 0.3 m2/m3, the calculated REV size is 41.1 m and 12.2 m, respectively, when CV = 0.2. Compared to the calculated REV size based on the geometrical indicator of Li, the flow indicator of K indicates an obviously larger REV size, especially when P32 is small. For DFN-I models with P32 = 0.2 and 0.3 m2/m3, the calculated REV size is 23.4 m and 11.6 m, respectively, when CV = 0.2. Comparisons between the estimated REV size of DFN-I and DFN-H models indicate that the heterogeneous aperture distribution increases the REV size, and this effect is more obvious when P32 is smaller.

4.3. Permeability Anisotropy

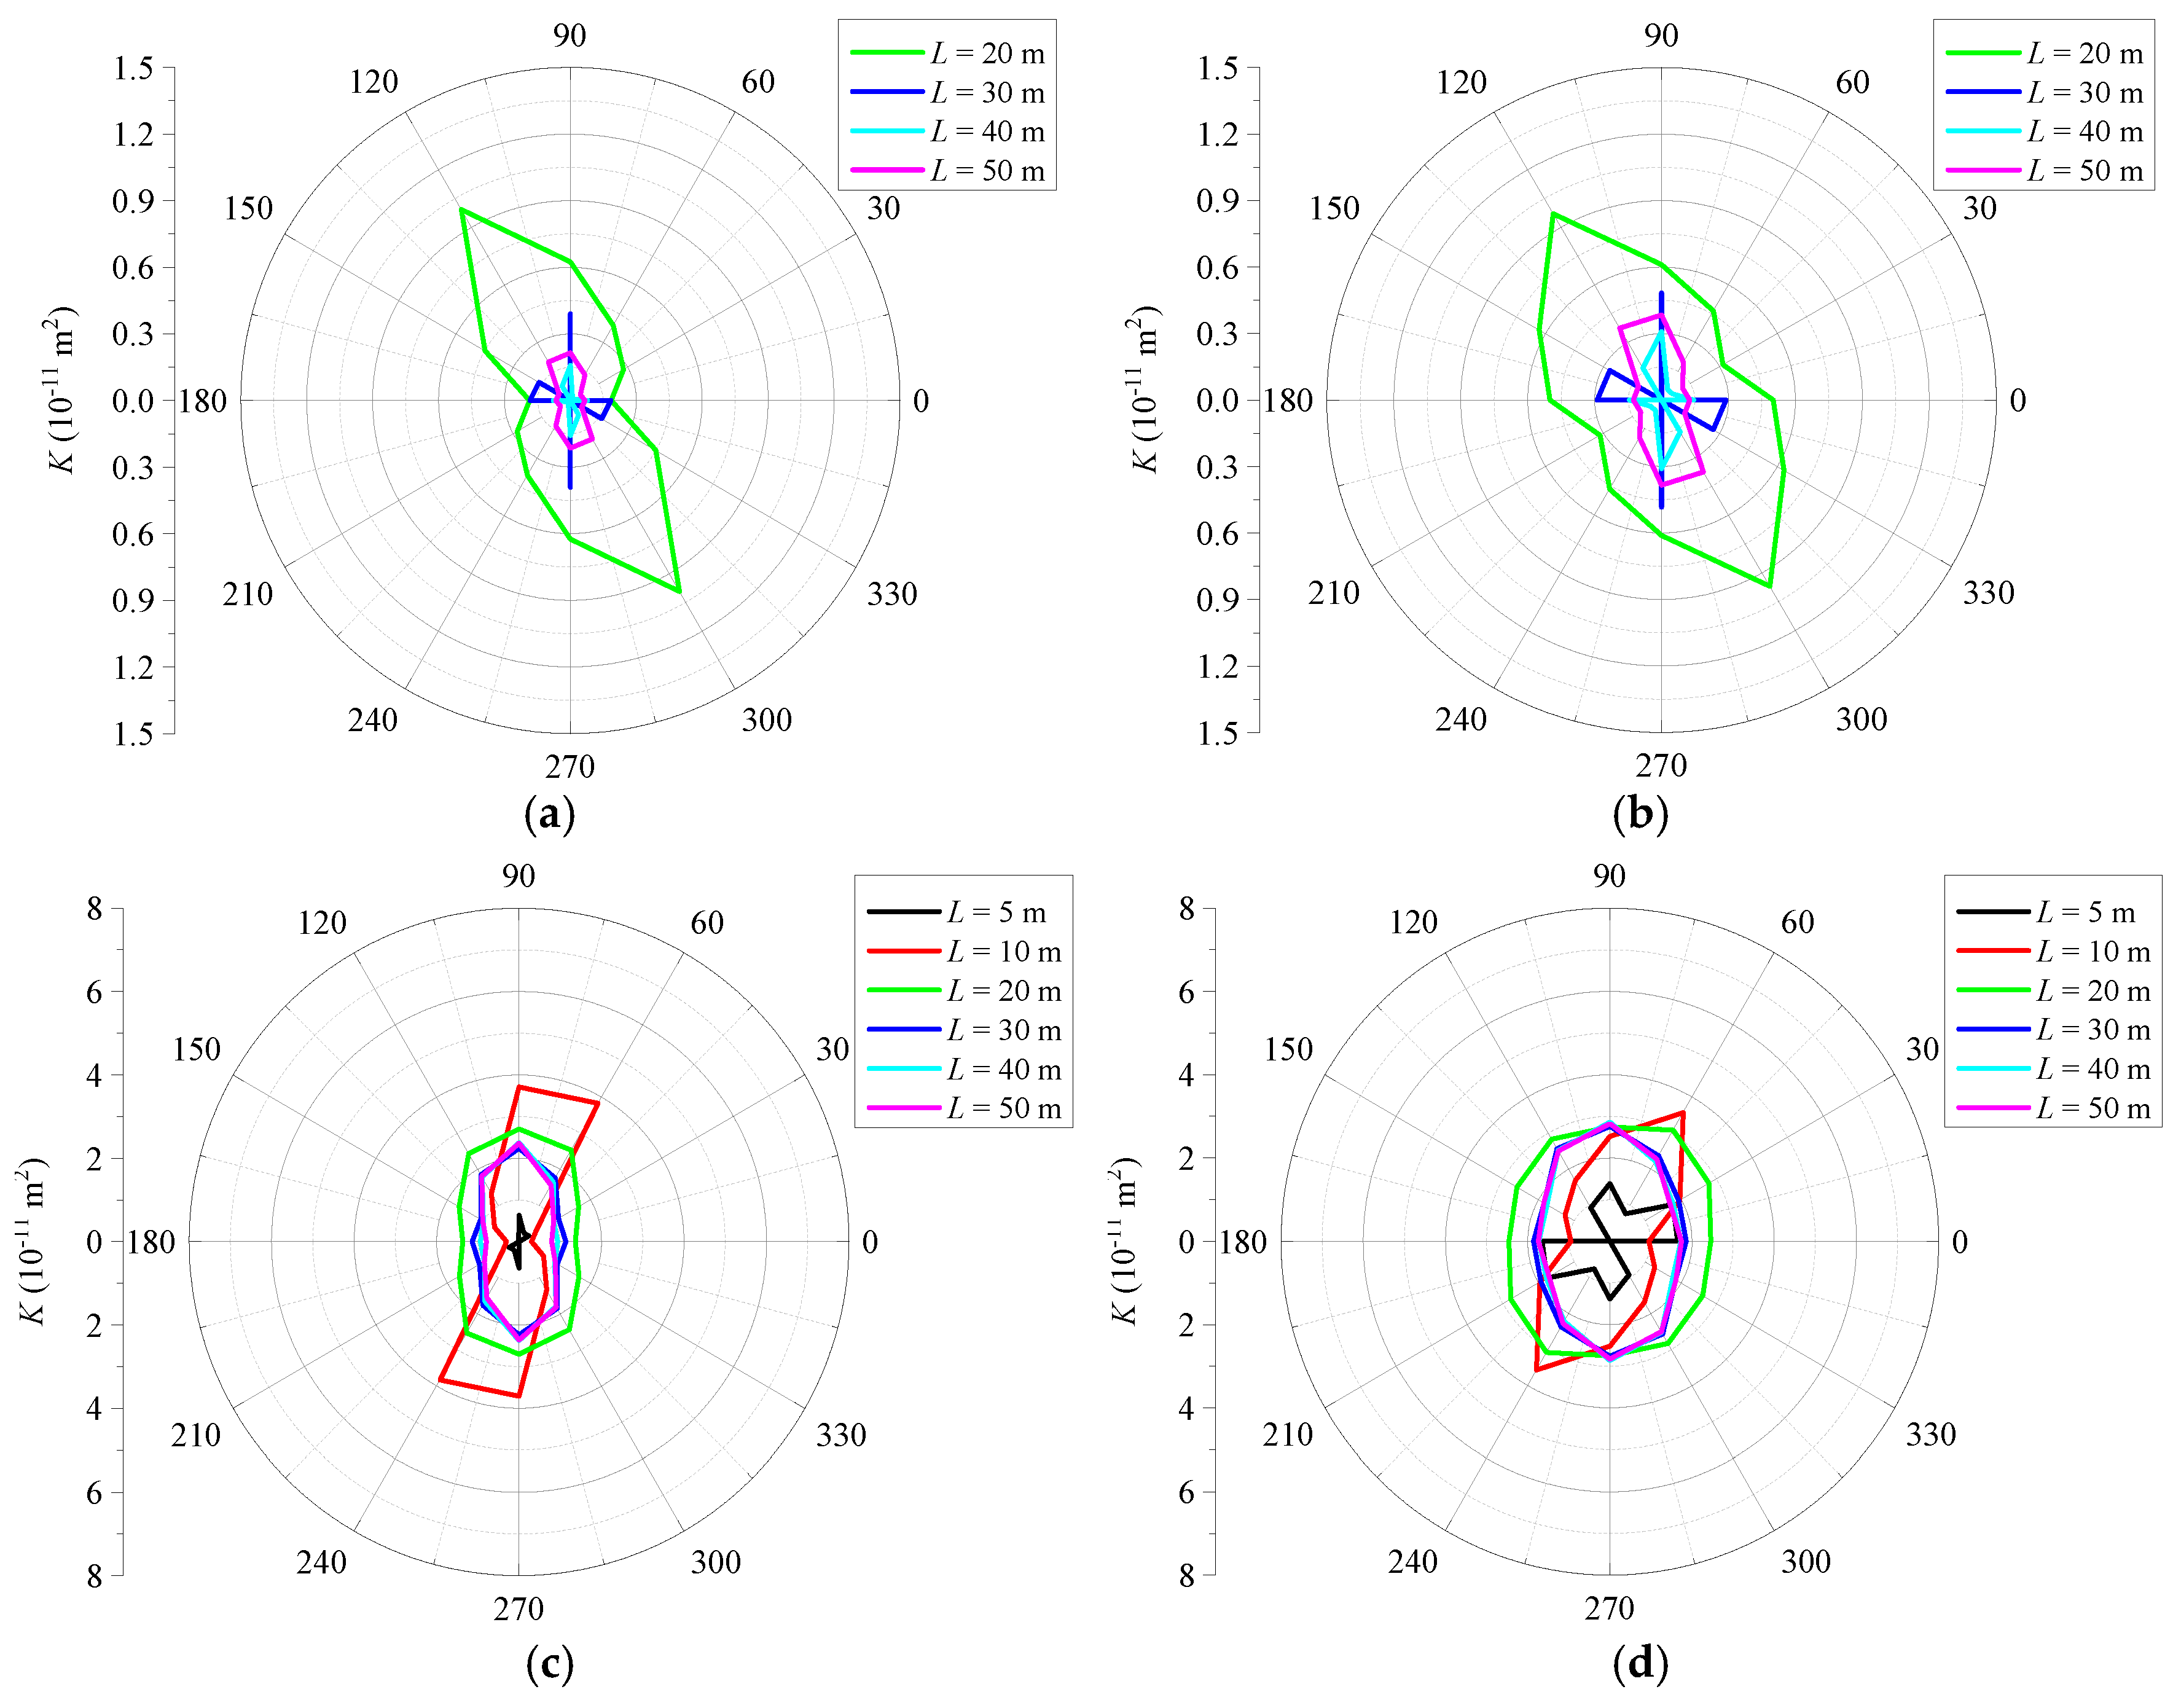
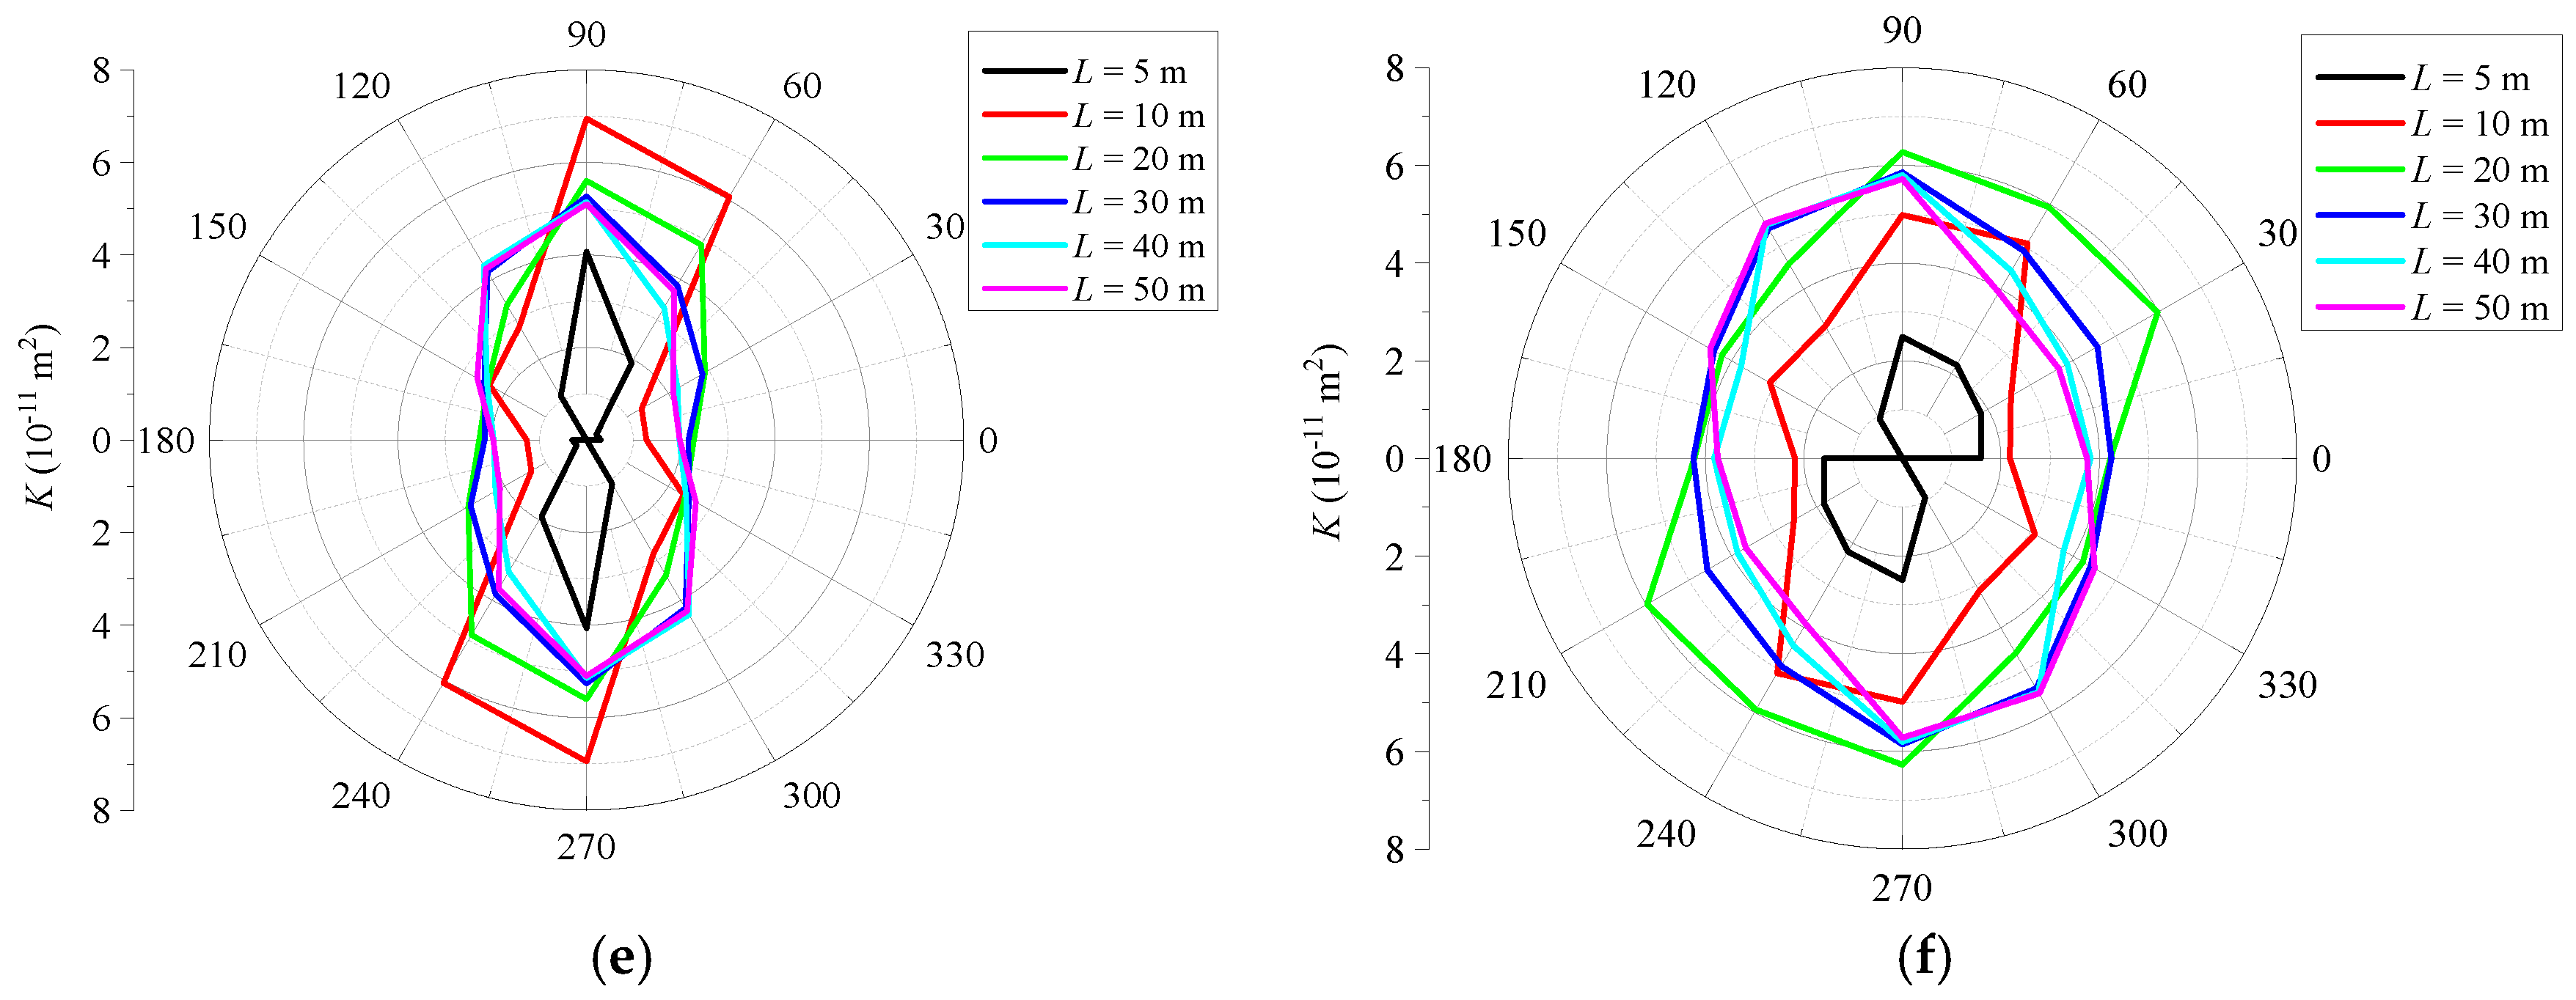
To calculate the magnitude and direction of the permeability tensor, Figure 10 shows the 2D directional permeability contours in the x-z plane (rotation along the y axis) for DFNs with different model sizes, fracture densities, and aperture distributions. Note that the rotation angle is decreased to 30° to fit the shape of the permeability contour precisely. For all cases in Figure 10, the shape of the permeability contour is irregular, with some breaks when L is small. With an increase in the L, its shape gradually tends to be smooth, approaching an ellipse, and the direction of the minimum or maximum magnitude of K remains almost constant. When P32 = 0.1 m2/m3, as shown in Figure 10a,b, the shape of the permeability contour is irregular, even for the model with a larger L. The maximum and minimum permeabilities fall into the orientation region of 90°~150° and 330°~30°, respectively. As the P32 increases from 0.2 m2/m3 to 0.3 m2/m3, the magnitude of K expands while its shape remains almost constant. The maximum permeability changes to a location in the range of 60°~120° and a minimum permeability in the range of 330°~30°. The effect of fracture density on the shape of the permeability contour shows a similar tendency to that of the model size. The permeability contour shape of the DFN-H model is slender compared to the DFN-I model, indicating a larger difference between the minimum and maximum value of K. To help quantitatively estimate the goodness of fit for an ellipse, a measure, RMS, is calculated according to the equation
R M S = 2 K 1 + K 2 1 N 1 N k g α k ¯ i j α 2
where kg(α) is the estimated permeability along every rotated direction, K1 and K2 are the major and minor principle permeabilities, respectively, and k ¯ ij(α) is the rotated average permeability. As indicated by Öhman and Niemi [56], an RMS < 0.2 is viewed as an acceptable fit for the fracture networks, implying the applicability of an equivalent continuum approximation for DFNs.
Figure 11 shows the calculated RMS for DFNs with different fracture densities, model sizes, and aperture distributions. When P32 = 0.1 m2/m3, the RMS exhibits a large variation greater than 0.3 for both DFN-I and DFN-H models at all model sizes up to 50 m, which indicates that there is no appropriate approximation for the equivalent permeability tensor over the studied model size range. As P32 increases, the RMS of the DFN-I and DFN-H models shows different decreasing tendencies. For the DFN-H model, although the RMS value decreases, it is still larger than 0.24. In contrast, for the DFN-I model, a good approximation of an ellipse can be obtained when L = 26.1 m and 18.6 m (RMS = 0.2) for P32 = 0.2 and 0.3 m2/m3, respectively. Comparisons between the DFN-I and DFN-H models show that the heterogeneous aperture distribution increases the flow anisotropy of DFNs, thus leading to a larger model size to reach an equivalent continuum behavior.
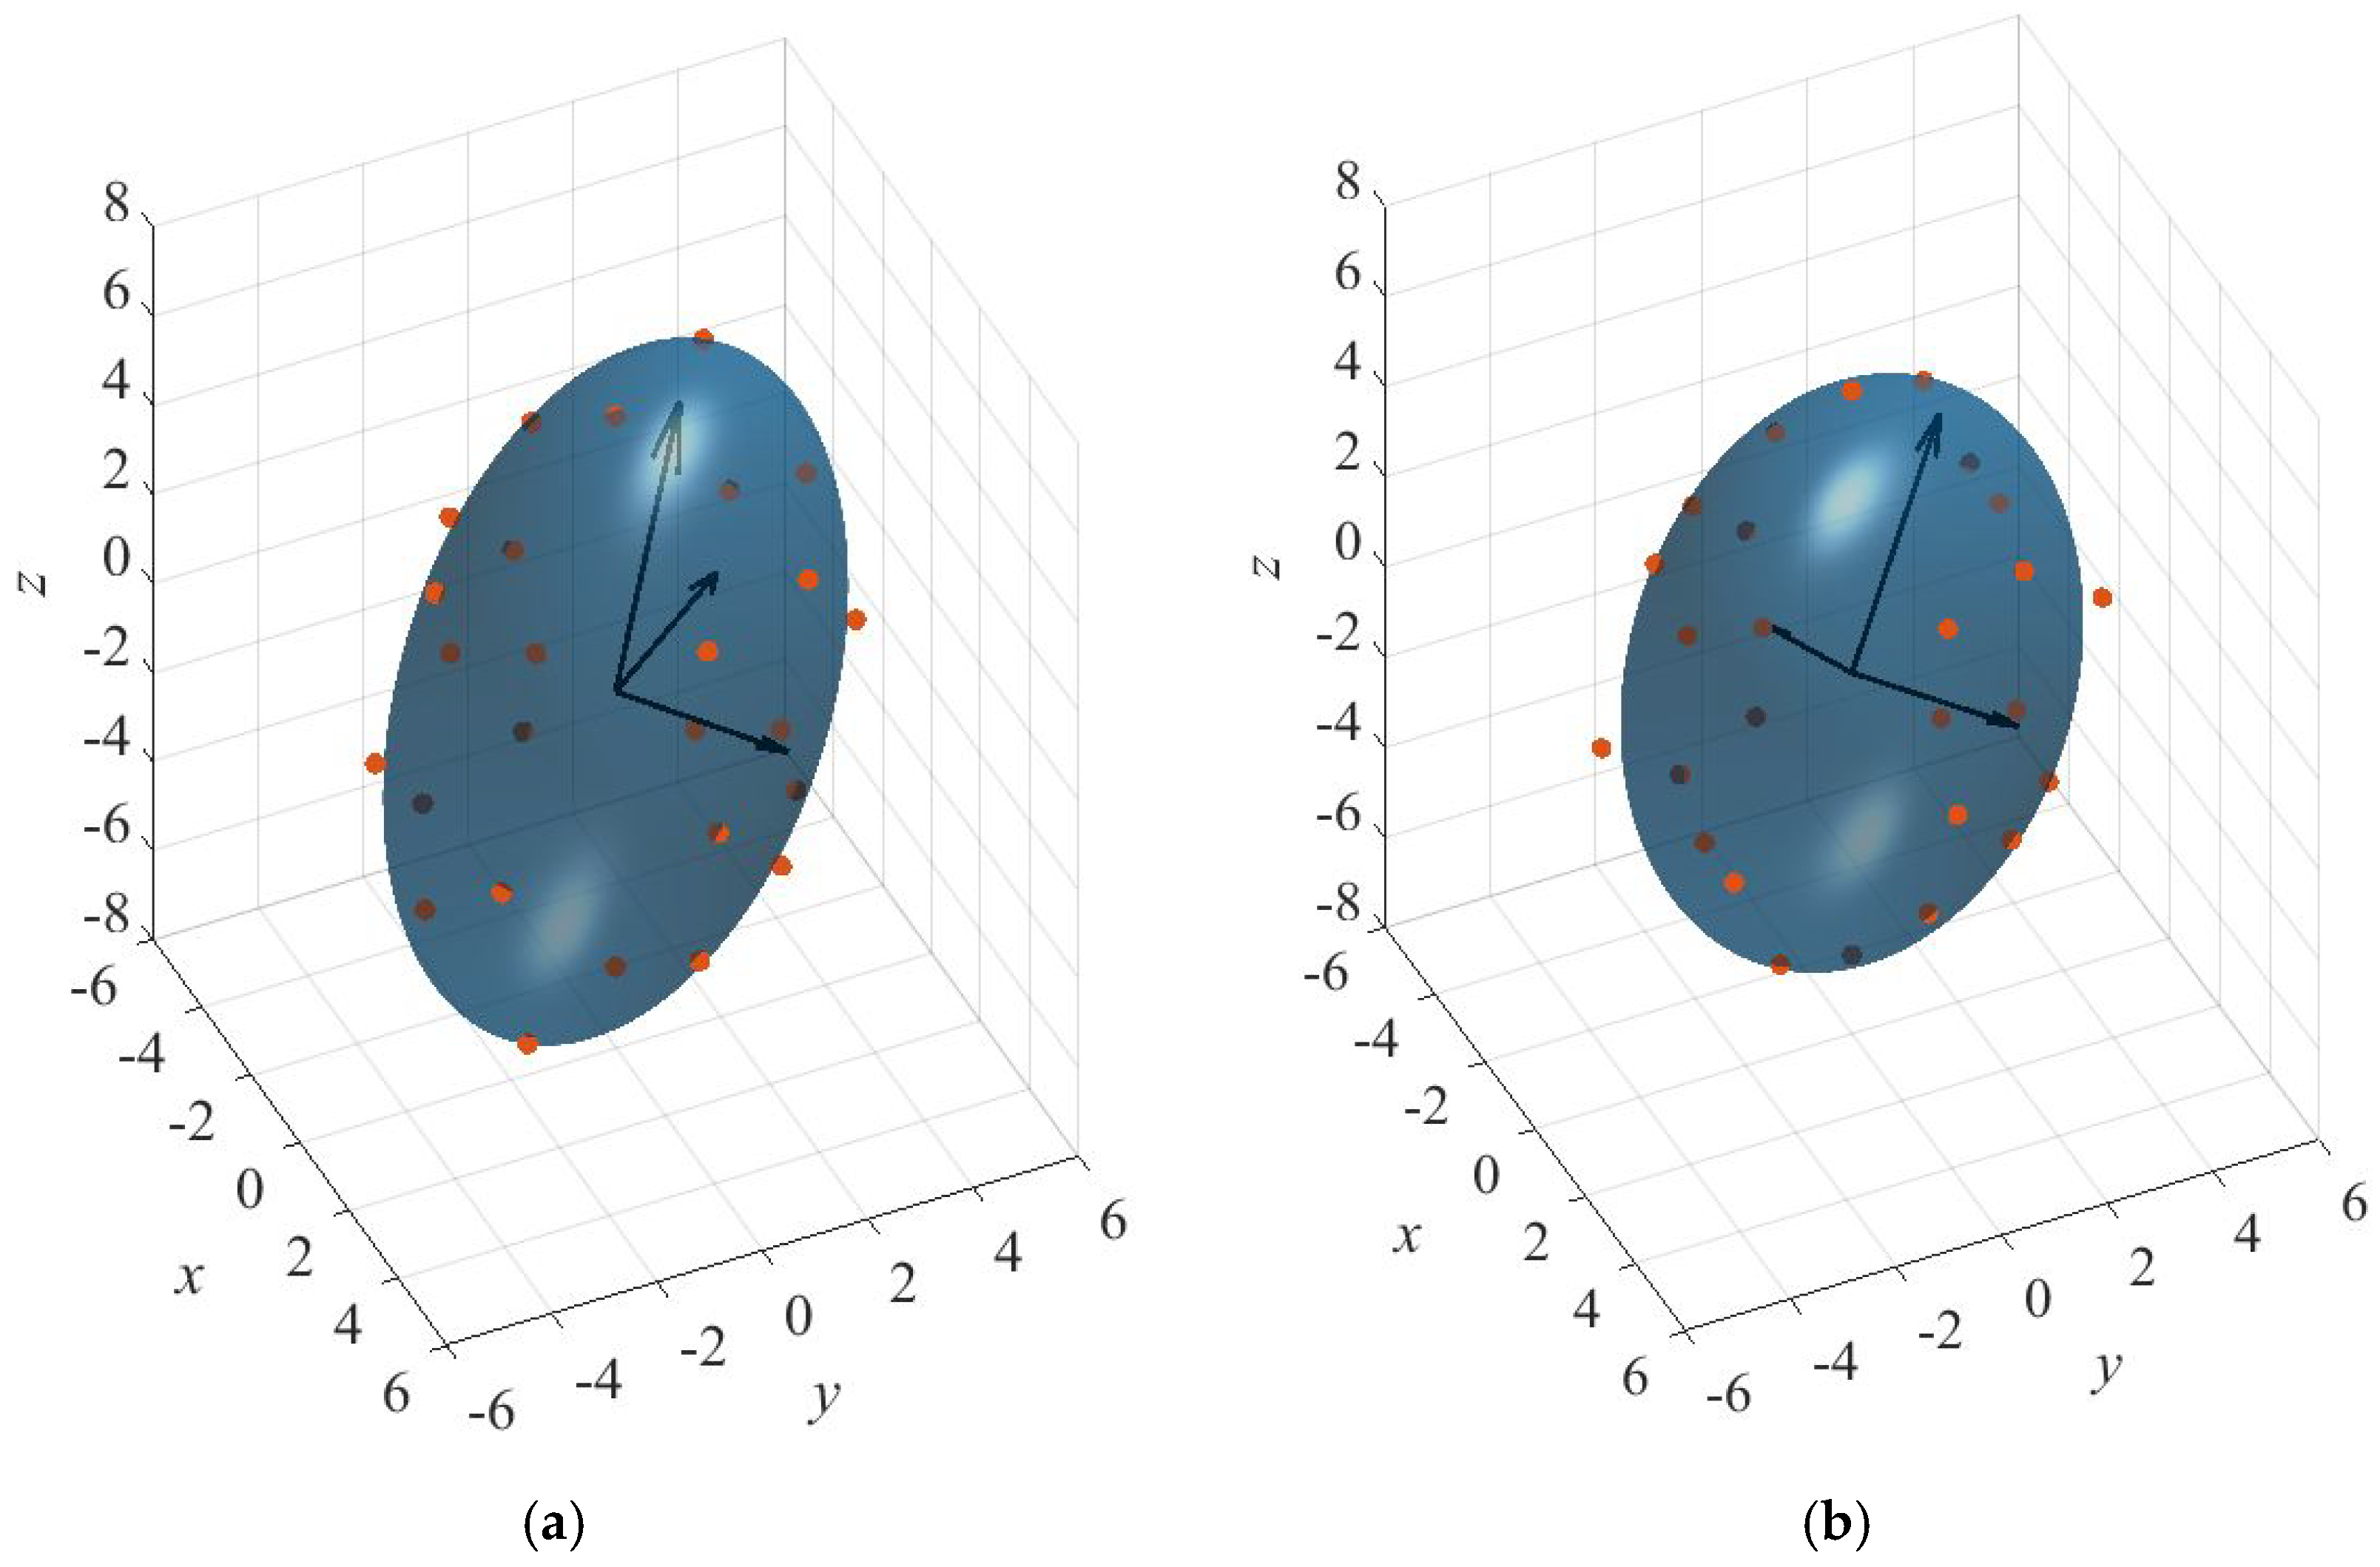
According to 2D analysis on the permeability contours, shown in Figure 10 and Figure 11, the equivalent permeability for the analyzed fracture networks with P32 = 0.2 m2/m3 and 0.3 m2/m3 can be approximately equal to the permeability tensor of DFN-I models estimated at L = 30 m and 20 m, respectively. In contrast, for the DFN-H model, the acceptable equivalent approximation does not exist over the studied model length range. As a result, the 3D directional permeability of the DFN-I models—both with L = 30 m and P32 = 0.2 m2/m3 and L = 20 and P32 = 0.3 m2/m3—are estimated, and the results along with fitted ellipsoids are displayed in Figure 12. The dots representing the actual permeability are close to the boundary of the fitted ellipsoid, indicating a satisfactory equivalent continuum behavior at the calculated REV size. The corresponding magnitudes and directions of the principal permeabilities of DFN-I models with different P32s are tabulated in Table 2. The estimated permeability tensor can be viewed as the equivalent permeability tensor for the approximated continuum medium.

5. Conclusions

This study conducted a systematic, numerical simulation to investigate REV and directional permeability based on two kinds of 3D DFNs, with heterogeneous apertures and uniform apertures. The REV sizes of the two kinds of DFN models were determined based on both geometrical and flow indicators. The effects of fracture aperture and density on the REV size and the permeability tensor (both magnitude and direction) were analyzed. The following conclusions were obtained:
  • Both the average intersection length and the permeability of DFNs generated with different random numbers vary significantly when the model size is small. As the model size exceeds a certain value, their magnitudes become almost constant, and this phenomenon is more obvious with increasing fracture density.
  • The calculated REV size based on the flow indicator of the permeability is obviously larger than that based on the geometrical indicator, especially when the fracture density is small. Aperture heterogeneity increases the REV size, and this effect is more obvious when the fracture density is smaller.
  • The shape of the 2D permeability contour is irregular, with some breaks, when the model size is small. As the model size increases, its shape gradually tends to be smooth and approaches an ellipse, with an almost unchanged direction of the minimum or maximum permeabilities. Compared to the DFNs with uniform apertures, the shape of the permeability contours of DFNs with heterogeneous apertures is slender, indicating a larger difference between the minimum and maximum values of the permeability.
  • There is no appropriate approximation of the equivalent permeability tensor over the studied model size range for the DFN-H models in this study. In contrast, for the DFN-I model, a good fit for the permeability ellipsoid is obtained, and the 3D directional permeability is calculated. The corresponding magnitude and direction of the principal permeability can be viewed as the equivalent permeability tensor for the approximated continuum medium.
Note that the effect of contact between the upper and lower surfaces on fluid flow is not considered in this study, which is mainly due to the difficulty of meshing the poorly predisposed geometry around the contact. In further studies, we will try to obtain a robust mesh for 3D DFNs and to quantify the contact effect on the REV and the permeability tensor.

Author Contributions

Conceptualization, N.H.; Methodology, N.H. and S.H. (Songcai Han); Software, S.H. (Songcai Han); Formal analysis, S.H. (Shengqun Han); Investigation, S.H. (Shengqun Han); Writing—original draft, N.H.; Writing—review & editing, S.H. (Songcai Han); Supervision, Y.J.; Project administration, Y.J. All authors have read and agreed to the published version of the manuscript.

Funding

This study has been partially funded by the Research Fund for Young Expert of Taishan Scholars Project in Shandong Province (No. tsqnz20221142), and the State Key Laboratory for GeoMechanics and Deep Underground Engineering, China University of Mining & Technology (No. SKLGDUEK2102).

Data Availability Statement

The data presented in this study are available from the corresponding author upon request.

Conflicts of Interest

The authors declare no conflict of interest.

References

  1. Bour, O.; Davy, P. On the connectivity of three-dimensional fault networks. Water Resour. Res. 1998, 34, 2611–2622. [Google Scholar] [CrossRef]
  2. Bonnet, E.; Bour, O.; Odling, N.E.; Davy, P.; Main, I.; Cowie, P.; Berkowitz, B. Scaling of fracture systems in geological media. Rev. Geophys. 2001, 39, 347–383. [Google Scholar] [CrossRef]
  3. Olson, J.E. Sublinear scaling of fracture aperture versus length: An exception or the rule? J. Geophys. Res. Solid Earth 2003, 108, 2413. [Google Scholar] [CrossRef]
  4. Neuman, S.P. Trends, prospects and challenges in quantifying flow and transport through fractured rocks. Hydrogeol. J. 2005, 13, 124–147. [Google Scholar] [CrossRef]
  5. Gale, J.F.; Laubach, S.E.; Olson, J.E.; Eichhubl, P.; Fall, A. Natural fractures in shale: A review and new observations Natural Fractures in Shale: A Review and New Observations. AAPG Bull. 2014, 98, 2165–2216. [Google Scholar] [CrossRef]
  6. Zhu, T.; Jing, H.; Su, H.; Yin, Q.; Du, M.; Han, G. Physical and mechanical properties of sandstone containing a single fissure after exposure to high temperatures. Int. J. Min. Sci. Technol. 2016, 26, 319–325. [Google Scholar] [CrossRef]
  7. Lin, Q.; Cao, P.; Wen, G.; Meng, J.; Cao, R.; Zhao, Z. Crack coalescence in rock-like specimens with two dissimilar layers and pre-existing double parallel joints under uniaxial compression. Int. J. Rock Mech. Min. Sci. 2021, 139, 104621. [Google Scholar] [CrossRef]
  8. Cacas, M.C.; Ledoux, E.; de Marsily, G.; Tillie, B.; Barbreau, A.; Durand, E.; Feuga, B.; Peaudecerf, P. Modeling fracture flow with a stochastic discrete fracture network: Calibration and validation: 1. The flow model. Water Resour. Res. 1990, 26, 479–489. [Google Scholar] [CrossRef]
  9. Bandis, S.C.; Lumsden, A.C.; Barton, N.R. Fundamentals of rock joint deformation. Int. J. Rock Mech. Min. Sci. Geomech. Abstr. 1983, 20, 249–268. [Google Scholar] [CrossRef]
  10. Liu, R.; Li, B.; Jiang, Y.; Huang, N. Mathematical expressions for estimating equivalent permeability of rock fracture networks. Hydrogeol. J. 2016, 24, 1623–1649. [Google Scholar] [CrossRef]
  11. Kirkby, A.; Heinson, G. Three-dimensional resistor network modeling of the resistivity and permeability of fractured rocks. J. Geophys. Res. Solid Earth 2017, 122, 2653–2669. [Google Scholar] [CrossRef]
  12. Monsalve, J.J.; Baggett, J.; Bishop, R.; Ripepi, N. Application of laser scanning for rock mass characterization and discrete fracture network generation in an underground limestone mine. Int. J. Min. Sci. Technol. 2019, 29, 131–137. [Google Scholar] [CrossRef]
  13. Cvetkovic, V.; Frampton, A. Solute transport and retention in three-dimensional fracture networks. Water Resour. Res. 2012, 48, W02509. [Google Scholar] [CrossRef]
  14. Berrone, S.; Pieraccini, S.; Scialo, S. On simulations of discrete fracture network flows with an optimization-based extended finite element method. SIAM J. Sci. Comput. 2013, 35, A908–A935. [Google Scholar] [CrossRef]
  15. Hu, Y.; Xu, W.; Zhan, L.; Zou, L.; Chen, Y. Modeling of solute transport in a fracture-matrix system with a three-dimensional discrete fracture network. J. Hydrol. 2022, 605, 127333. [Google Scholar] [CrossRef]
  16. Gan, Q.; Elsworth, D. A continuum model for coupled stress and fluid flow in discrete fracture networks. Geomech. Geophys. Geo-Energy Geo-Resour. 2016, 2, 43–61. [Google Scholar] [CrossRef]
  17. Berkowitz, B. Characterizing flow and transport in fractured geological media: A review. Adv. Water Resour. 2002, 25, 861–884. [Google Scholar] [CrossRef]
  18. Wang, Z.; Li, W.; Bi, L.; Qiao, L.; Liu, R.; Liu, J. Estimation of the REV size and equivalent permeability coefficient of fractured rock masses with an emphasis on comparing the radial and unidirectional flow configurations. Rock Mech. Rock Eng. 2018, 51, 1457–1471. [Google Scholar] [CrossRef]
  19. Wang, L.; Golfier, F.; Tinet, A.J.; Chen, W.; Vuik, C. An efficient adaptive implicit scheme with equivalent continuum approach for two-phase flow in fractured vuggy porous media. Adv. Water Resour. 2022, 163, 104186. [Google Scholar] [CrossRef]
  20. Neuman, S.P. Stochastic continuum representation of fractured rock permeability as an alternative to the REV and fracture network concepts. In Groundwater Flow and Quality Modelling; Springer: Dordrecht, The Netherlands, 1988; pp. 331–362. [Google Scholar]
  21. Baghbanan, A.; Jing, L. Hydraulic properties of fractured rock masses with correlated fracture length and aperture. Int. J. Rock Mech. Min. Sci. 2007, 44, 704–719. [Google Scholar] [CrossRef]
  22. Baghbanan, A.; Jing, L. Stress effects on permeability in a fractured rock mass with correlated fracture length and aperture. Int. J. Rock Mech. Min. Sci. 2008, 45, 1320–1334. [Google Scholar] [CrossRef]
  23. Lang, P.S.; Paluszny, A.; Zimmerman, R.W. Permeability tensor of three-dimensional fractured porous rock and a comparison to trace map predictions. J. Geophys. Res. Solid Earth 2014, 119, 6288–6307. [Google Scholar] [CrossRef]
  24. Zhang, J.; Liu, R.; Yu, L.; Li, S.; Wang, X.; Liu, D. An Equivalent Pipe Network Modeling Approach for Characterizing Fluid Flow through Three-Dimensional Fracture Networks: Verification and Applications. Water 2022, 14, 1582. [Google Scholar] [CrossRef]
  25. Wang, M.; Kulatilake, P.H.S.W.; Um, J.; Narvaiz, J. Estimation of REV size and three-dimensional hydraulic conductivity tensor for a fractured rock mass through a single well packer test and discrete fracture fluid flow modeling. Int. J. Rock Mech. Min. Sci. 2002, 39, 887–904. [Google Scholar] [CrossRef]
  26. Liu, R.; Yu, L.; Jiang, Y. Fractal analysis of directional permeability of gas shale fracture networks: A numerical study. J. Nat. Gas Sci. Eng. 2016, 33, 1330–1341. [Google Scholar] [CrossRef]
  27. Wang, T.; Sun, Z.; Zhang, K.; Jiang, C.; Xin, Y.; Mao, Q. Investigation on heat extraction performance of fractured geothermal reservoir using coupled thermal-hydraulic-mechanical model based on equivalent continuum method. Energies 2018, 12, 127. [Google Scholar] [CrossRef]
  28. Hudson, J.A.; Harrison, J.P. Engineering Rock Mechanics: An Introduction to the Principles; Elsevier: Amsterdam, The Netherlands, 2000. [Google Scholar]
  29. Hyman, J.D.; Karra, S.; Makedonska, N.; Gable, C.W.; Painter, S.L.; Viswanathan, H.S. dfnWorks: A discrete fracture network framework for modeling subsurface flow and transport. Comput. Geosci. 2015, 84, 10–19. [Google Scholar] [CrossRef]
  30. Liang, Z.; Wu, N.; Li, Y.; Li, H.; Li, W. Numerical study on anisotropy of the representative elementary volume of strength and deformability of jointed rock masses. Rock Mech. Rock Eng. 2019, 52, 4387–4402. [Google Scholar] [CrossRef]
  31. Rong, G.; Peng, J.; Wang, X.; Liu, G.; Hou, D. Permeability tensor and representative elementary volume of fractured rock masses. Hydrogeol. J. 2013, 21, 1655–1671. [Google Scholar] [CrossRef]
  32. Feng, S.; Wang, H.; Cui, Y.; Ye, Y.; Liu, Y.; Li, X.; Wang, H.; Yang, R. Fractal discrete fracture network model for the analysis of radon migration in fractured media. Comput. Geotech. 2020, 128, 103810. [Google Scholar] [CrossRef]
  33. Brown, S.R.; Kranz, R.L.; Bonner, B.P. Correlation between the surfaces of natural rock joints. Geophys. Res. Lett. 1986, 13, 1430–1433. [Google Scholar] [CrossRef]
  34. Brown, S.R. Fluid flow through rock joints: The effect of surface roughness. J. Geophys. Res. Solid Earth 1987, 92, 1337–1347. [Google Scholar] [CrossRef]
  35. Zimmerman, R.W.; Bodvarsson, G.S. Hydraulic conductivity of rock fractures. Transp. Porous Media 1996, 23, 1–30. [Google Scholar] [CrossRef]
  36. Glover, P.W.J.; Matsuki, K.; Hikima, R.; Hayashi, K. Synthetic rough fractures in rocks. J. Geophys. Res. Solid Earth 1998, 103, 9609–9620. [Google Scholar] [CrossRef]
  37. Isakov, E.; Ogilvie, S.R.; Taylor, C.W.; Glover, P.W. Fluid flow through rough fractures in rocks I: High resolution aperture determinations. Earth Planet. Sci. Lett. 2001, 191, 267–282. [Google Scholar] [CrossRef]
  38. Crandall, D.; Bromhal, G.; Karpyn, Z.T. Numerical simulations examining the relationship between wall-roughness and fluid flow in rock fractures. Int. J. Rock Mech. Min. Sci. 2010, 47, 784–796. [Google Scholar] [CrossRef]
  39. Yin, Q.; Ma, G.; Jing, H.; Wang, H.; Su, H.; Wang, Y.; Liu, R. Hydraulic properties of 3D rough-walled fractures during shearing: An experimental study. J. Hydrol. 2017, 555, 169–184. [Google Scholar] [CrossRef]
  40. Huang, N.; Liu, R.; Jiang, Y.; Li, B.; Yu, L. Effects of fracture surface roughness and shear displacement on geometrical and hydraulic properties of three-dimensional crossed rock fracture models. Adv. Water Resour. 2018, 113, 30–41. [Google Scholar] [CrossRef]
  41. Li, B.; Cui, X.; Zou, L.; Cvetkovic, V. On the relationship between normal stiffness and permeability of rock fractures. Geophys. Res. Lett. 2021, 48, e2021GL095593. [Google Scholar] [CrossRef]
  42. Ishibashi, T.; Watanabe, N.; Hirano, N.; Okamoto, A.; Tsuchiya, N. Beyond-laboratory-scale prediction for channeling flows through subsurface rock fractures with heterogeneous aperture distributions revealed by laboratory evaluation. J. Geophys. Res. Solid Earth 2015, 120, 106–124. [Google Scholar] [CrossRef]
  43. Huang, N.; Jiang, Y.; Liu, R.; Li, B.; Sugimoto, S. A novel three-dimensional discrete fracture network model for investigating the role of aperture heterogeneity on fluid flow through fractured rock masses. Int. J. Rock Mech. Min. Sci. 2019, 116, 25–37. [Google Scholar] [CrossRef]
  44. Huang, N.; Jiang, Y.; Liu, R.; Li, B. Experimental and numerical studies of the hydraulic properties of three-dimensional fracture networks with spatially distributed apertures. Rock Mech. Rock Eng. 2019, 52, 4731–4746. [Google Scholar] [CrossRef]
  45. Hyman, J.D.; Sweeney, M.R.; Frash, L.P.; Carey, J.W.; Viswanathan, H.S. Scale-Bridging in Three-Dimensional Fracture Networks: Characterizing the Effects of Variable Fracture Apertures on Network-Scale Flow Channelization. Geophys. Res. Lett. 2021, 48, e2021GL094400. [Google Scholar] [CrossRef]
  46. McKay, L.D.; Cherry, J.A.; Gillham, R.W. Field experiments in a fractured clay till: 1. Hydraulic conductivity and fracture aperture. Water Resour. Res. 1993, 29, 1149–1162. [Google Scholar] [CrossRef]
  47. Makedonska, N.; Hyman, J.D.; Karra, S.; Painter, S.L.; Gable, C.W.; Viswanathan, H.S. Evaluating the effect of internal aperture variability on transport in kilometer scale discrete fracture networks. Adv. Water Resour. 2016, 94, 486–497. [Google Scholar] [CrossRef]
  48. Guo, P.; Wang, M.; Gao, K.; He, M.; Wang, Y. Influence of fracture surface roughness on local flow pattern: Visualization using a microfluidic field experiment. Hydrogeol. J. 2020, 28, 2373–2385. [Google Scholar] [CrossRef]
  49. Ishibashi, T.; Watanabe, N.; Tamagawa, T.; Tsuchiya, N. Three-dimensional channeling flow within subsurface rock fracture networks suggested via fluid flow analysis in the Yufutsu fractured oil/gas reservoir. J. Pet. Sci. Eng. 2019, 178, 838–851. [Google Scholar] [CrossRef]
  50. Guo, L.; Li, X.; Zhou, Y.; Zhang, Y. Generation and verification of three-dimensional network of fractured rock masses stochastic discontinuities based on digitalization. Environ. Earth Sci. 2015, 73, 7075–7088. [Google Scholar] [CrossRef]
  51. Huang, X.-W.; Wang, Z.Z.; Jiang, P.-M.; LI, K.-Q.; Tang, C.-X. Meso-scale investigation of the effects of groundwater seepage on the thermal performance of borehole heat exchangers. Appl. Therm. Eng. 2024, 236, 121809. [Google Scholar] [CrossRef]
  52. Han, S.; Gao, Q.; Yan, X.; Li, L.; Wang, L.; Shi, X.; Yan, C.; Wang, D. Thermally-induced cracking behaviors of coal reservoirs subjected to cryogenic liquid nitrogen shock. J. Rock Mech. Geotech. 2024, 16, 2894–2908. [Google Scholar] [CrossRef]
  53. Xiong, X.; Li, B.; Jiang, Y.; Koyama, T.; Zhang, C. Experimental and numerical study of the geometrical and hydraulic characteristics of a single rock fracture during shear. Int. J. Rock Mech. Min. Sci. 2011, 48, 1292–1302. [Google Scholar] [CrossRef]
  54. Beck, J.V.; Arnold, K.J. Parameter Estimation in Engineering and Science; Wiley: Hoboken, NJ, USA, 1977. [Google Scholar]
  55. Huang, N.; Jiang, Y.; Li, B.; Liu, R. A numerical method for simulating fluid flow through 3-D fracture networks. J. Nat. Gas Sci. Eng. 2016, 33, 1271–1281. [Google Scholar] [CrossRef]
  56. Öhman, J.; Niemi, A. Upscaling of fracture hydraulics by means of an oriented correlated stochastic continuum model. Water Resour. Res. 2003, 39, SBH-3. [Google Scholar] [CrossRef]
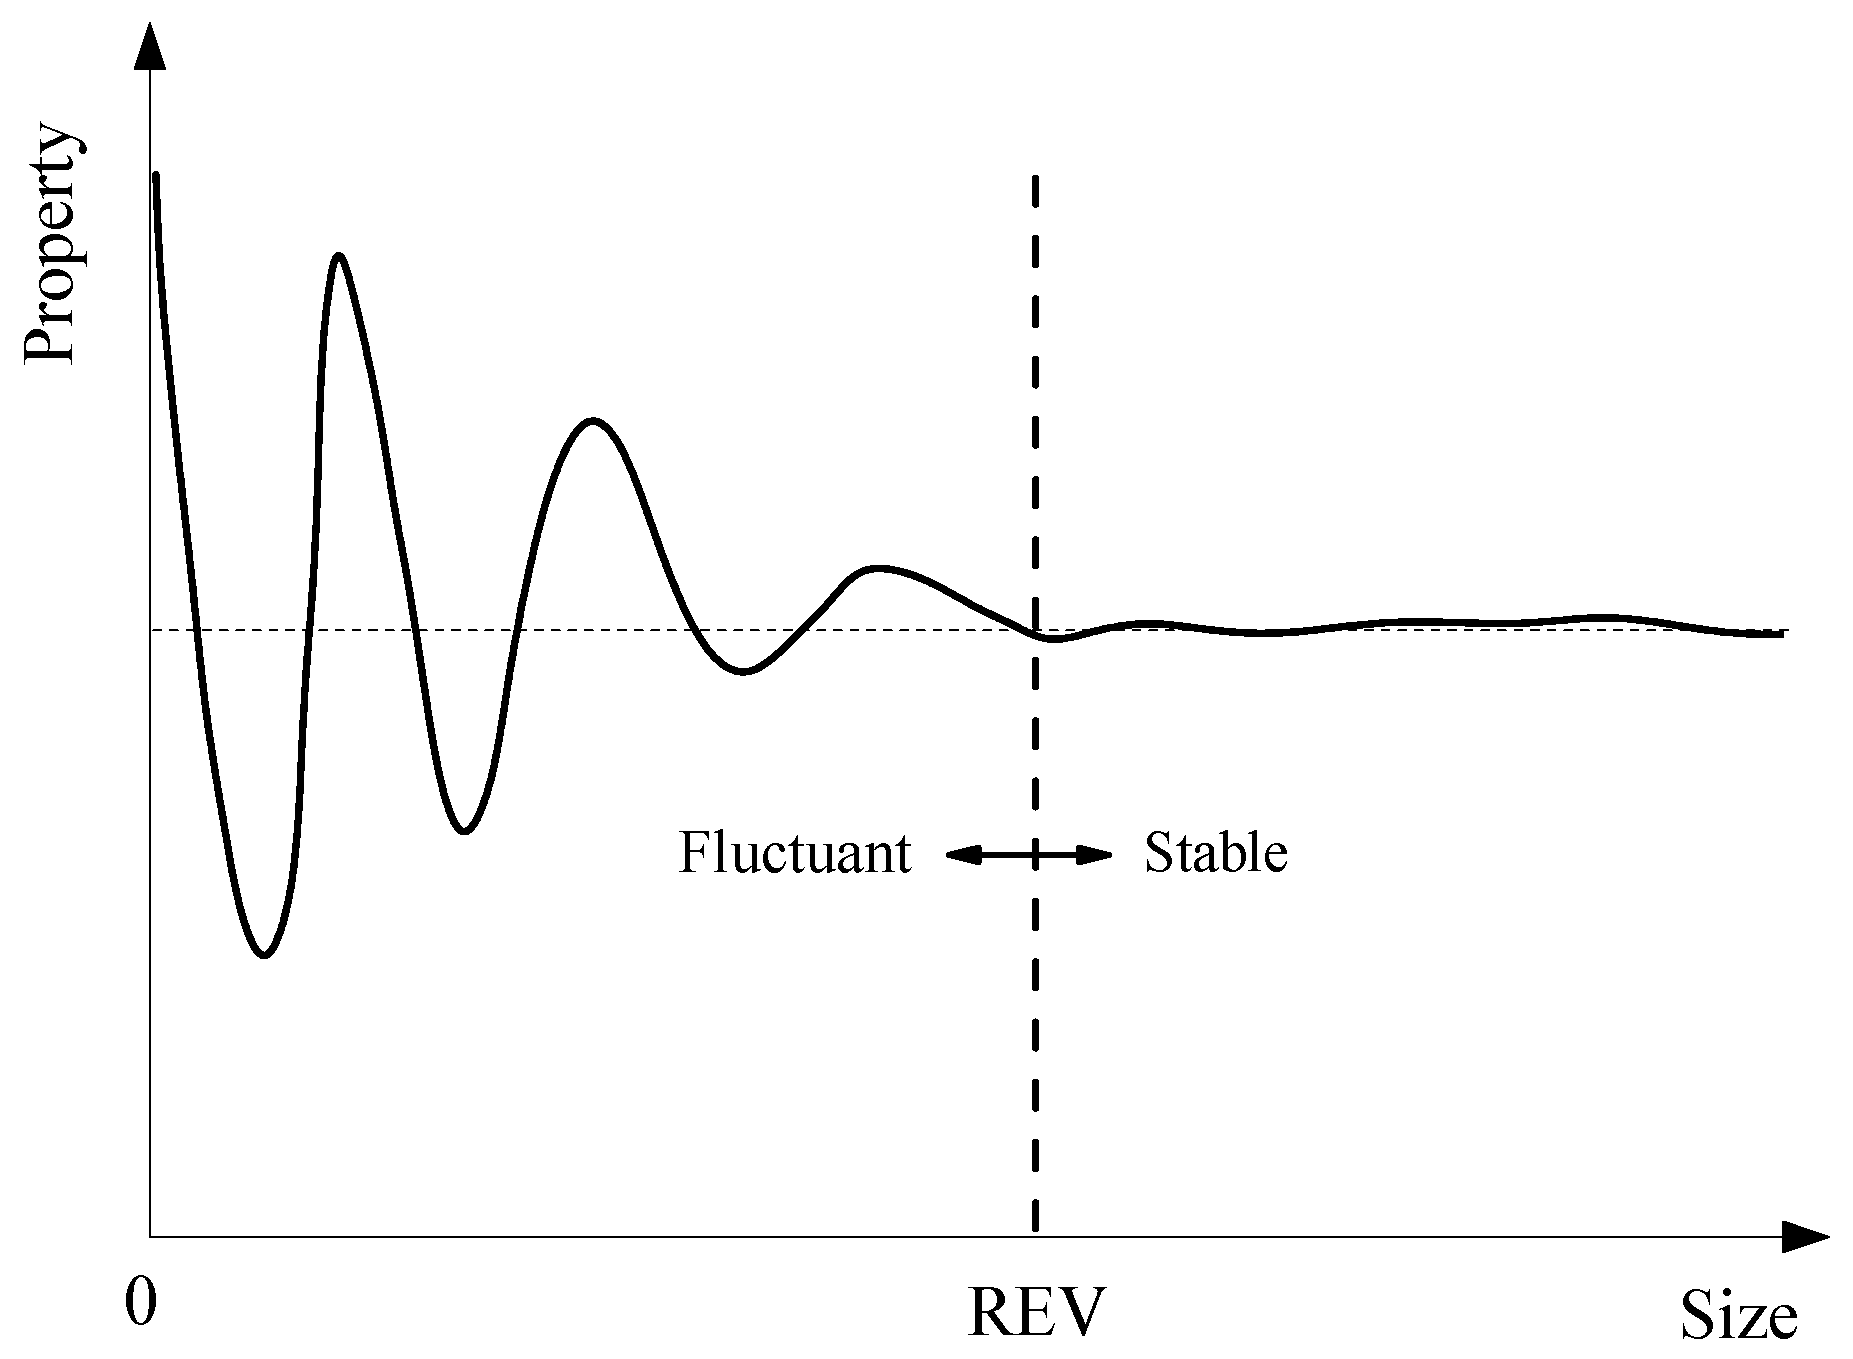
Figure 1. Size-dependency of the model property and the concept of REV (following [28]).
Water 16 02435 g001
Figure 2. Example of large ‘parent’ DFN models: (a) P32 = 0.1 m2/m3, (b) P32 = 0.2 m2/m3, and (c) P32 = 0.3 m2/m3. Note that colors identify two different fracture sets.
Water 16 02435 g002
Figure 3. Extraction of DFN models in different rotation angles along the y axis.
Water 16 02435 g003
Figure 4. Rotation in different directions to cover the whole space in 3D with 0 ≤ φ ≤ π and 0 ≤ θ ≤ 2π.
Water 16 02435 g004
Figure 5. Variation of average intersection length for DFN models of different model sizes, ranging from 5 to 50 m, and with different fracture densities: (a) P32 = 0.1 m2/m3, (b) P32 = 0.2 m2/m3, and (c) P32 = 0.3 m2/m3.
Water 16 02435 g005aWater 16 02435 g005b
Figure 6. Variation of CV versus DFN model size for three different cases of fracture densities: P32 = 0.1, 0.2, and 0.3 m2/m3, respectively.
Water 16 02435 g006
Figure 7. Preferential flow pathways along the overall flow direction of θ = 0° and φ = 90° in DFNs with different model sizes, fracture densities, and aperture distributions: (ac) DFN-H model with P32 = 0.1 m2/m3, and L = 10, 30, 50 m respectively; (df) DFN-H model with P32 = 0.2 m2/m3, and L = 10, 30, 50 m respectively; (gi) DFN-H model with P32 = 0.3 m2/m3, and L = 10, 30, 50 m respectively; and (jl) DFN-I model with P32 = 0.2 m2/m3, and L = 10, 30, 50 m respectively. The color intensity indicates the ratio of the local flow rate to the total flow rate, representing the relative contribution of each point to the overall flow. Note that ratios smaller than 10−4 that are displayed in the darkest color are viewed as having a negligible contribution.
Water 16 02435 g007
Figure 8. Variation of K for DFN models of different model sizes, fracture densities, and aperture distributions: (a) DFN-H model with P32 = 0.1 m2/m3, (b) DFN-I model with P32 = 0.1 m2/m3, (c) DFN-H model with P32 = 0.2 m2/m3, and (d) DFN-I model with P32 = 0.2 m2/m3, (e) DFN-H model with P32 = 0.3 m2/m3 and (f) DFN-I model with P32 = 0.3 m2/m3.
Water 16 02435 g008aWater 16 02435 g008b
Figure 9. Variation of CV versus model size for DFNs with different fracture densities and aperture distributions.
Water 16 02435 g009
Figure 10. 2D plots of directional permeability contours in the x-z plane (rotation along the y axis) for DFNs with different model sizes, fracture densities, and aperture distributions: (a) DFN-H model with P32 = 0.1 m2/m3, (b) DFN-I model with P32 = 0.1 m2/m3, (c) DFN-H model with P32 = 0.2 m2/m3, (d) DFN-I model with P32 = 0.2 m2/m3, (e) DFN-H model with P32 = 0.3 m2/m3 and (f) DFN-I model with P32 = 0.3 m2/m3.
Water 16 02435 g010aWater 16 02435 g010b
Figure 11. Variation of RMS versus model size for DFNs with different fracture densities and aperture distributions.
Water 16 02435 g011
Figure 12. 3D plots of directional permeability and fitted ellipsoids for DFN-I models: (a) L = 30 m, P32 = 0.2 m2/m3, and (b) L = 20 m, P32 = 0.3 m2/m3.
Water 16 02435 g012
Table 1. Statistics parameters of dominant discontinuity sets [50].
Dominant SetOrientationFisher Constant
Dip (°)Dip Direction (°)
181.24910.85
272116.71.59
Table 2. Magnitudes and directions of principal permeabilities of DFN-I models.
P32
(m2/m3)
L
(m)
K1K2K3
Magnitude × 10−11 m2DirectionMagnitude
×10−11 m2
DirectionMagnitude × 10−11 m2Direction
0.2306.959(−0.486, 0.502, −0.716)5.221(0.443, −0.564, −0.697)3.452(−0.754, −0.655, 0.051)
0.3206.447(−0.090, 0.251, 0.964)5.701(−0.681, 0.690, −0.243)3.579(0.727, 0.678, −0.109)
Disclaimer/Publisher’s Note: The statements, opinions and data contained in all publications are solely those of the individual author(s) and contributor(s) and not of MDPI and/or the editor(s). MDPI and/or the editor(s) disclaim responsibility for any injury to people or property resulting from any ideas, methods, instructions or products referred to in the content.