Article

Assessing the Impact of Urban Morphologies on Waterlogging Risk Using a Spatial Weight Naive Bayes Model and Local Climate Zones Classification

1
School of Architecture and Urban Planning, Guangzhou University, Guangzhou 510006, China
2
State Key Laboratory of Subtropical Building and Urban Science, Guangzhou 510640, China
3
School of Civil Engineering and Transportation, Guangzhou University, Guangzhou 510006, China
*
Authors to whom correspondence should be addressed.
Water 2024, 16(17), 2464; https://doi.org/10.3390/w16172464
Submission received: 9 August 2024 / Revised: 25 August 2024 / Accepted: 29 August 2024 / Published: 30 August 2024
(This article belongs to the Section Hydrology)

Abstract

:
Rapid urbanization has altered the natural surface properties and spatial patterns, increasing the risk of urban waterlogging. Assessing the probability of urban waterlogging risk is crucial for preventing and mitigating the environmental risks associated with urban waterlogging. This study aims to evaluate the impact of different urban spatial morphologies on the probability of urban waterlogging risk. The proposed assessment framework was demonstrated in Guangzhou, a high-density city in China. Firstly, a spatial weight naive Bayes model was employed to map the probability of waterlogging risk in Guangzhou. Secondly, the World Urban Database and Access Portal Tools (WUDAPT)-based method was used to create a local climate zone (LCZ) map of Guangzhou. Then, the range of waterlogging risk and the proportion of risk levels were analyzed across different LCZs. Finally, the Theil index was used to measure the disparity in waterlogging risk exposure among urban residents. The results indicate that 16.29% of the area in Guangzhou is at risk of waterlogging. Specifically, 13.06% of the area in LCZ 2 is classified as high risk, followed by LCZ 1, LCZ 8, and LCZ 10, with area proportions of 11.42%, 8.37%, and 6.26%, respectively. Liwan District has the highest flood exposure level at 0.975, followed by Haizhu, Yuexiu, and Baiyun. The overall disparity in waterlogging exposure in Guangzhou is 0.30, with the difference between administrative districts (0.13) being smaller than the difference within the administrative districts (0.17). These findings provide valuable insights for future flood risk mitigation and help in adopting effective risk reduction strategies at urban planning level.

1. Introduction

Rapid urbanization and intensive human activities have significantly altered the spatial morphology and underlying surface properties under natural conditions, leading to a series of ecological problems and environmental degradation [1,2,3]. Especially, urban waterlogging has become an environmental problem that cannot be ignored in recent years. The global urbanization rate is expected to increase from 29 to 56% since 1950 to 68% by 2050, with significant risks of urban waterlogging risk [4]. Numerous studies have shown that the process of urbanization changes local microclimates, increases peak rainfall and surface runoff, and consequently raises the risk of urban flooding [5]. Meanwhile, with global climate change, the frequency of extreme weather events, including heavy rainfall, is increasing significantly each year [6,7]. According to the IPCC report, under high-emission scenarios, the frequency of extreme rainfall events may double or increase even more [8]. Extreme rainfall exacerbates the risk of urban flooding, posing serious threats to the safety of residents and causing damage to urban infrastructure. For instance, in Beijing in 2012, flood disasters resulted in 79 deaths and economic losses amounting to 11.6 billion RMB [9]. Similar economic losses were recorded in Shenzhen (2019) and Wuhan (2020) due to extreme rainfall [10]. Therefore, it is essential to comprehensively and systematically understand the spatial distribution of urban flood risk and the impact mechanisms of urban morphology on urban flooding, providing valuable insights for urban planners in formulating flood prevention measures.
There has been some research on the role of urban morphology in urban flooding. For example, Wang et al. used the Boost-SHAP method and highlighted that building volume has the greatest impact on urban flooding [11]. Li et al. found that landscape metrics contribute 67.23% to flood risk, while building metrics account for 21.03% [12]. However, under the dual influence of human activities and climate change, the frequency of urban flooding is gradually increasing, and the severity of its impacts is becoming more pronounced. Global climate change has led to a rise in global temperatures, with an increase of approximately 1.1 °C observed from 2011 to 2020 compared to 1850–1900 [8]. Global warming intensifies atmospheric activities and alters existing atmospheric circulation patterns, resulting in an increase in both the intensity and frequency of extreme rainfall events. Additionally, urbanization, characterized by changes in natural spatial morphology and anthropogenic heat emissions, hampers the rapid dissipation of urban heat, altering local climates and creating urban heat islands, which exacerbate the impact of climate on rainfall. Numerous studies have demonstrated that urbanization significantly influences extreme rainfall amounts and intensities [13,14,15]. For instance, Gu et al. found a positive correlation between summer urban heat island intensity and precipitation [16]. In the study of extreme rainfall in urban agglomerations in eastern China, Fu et al. found that the hourly extreme precipitation intensity in cities was higher than that in rural areas, with a maximum difference of 1.79 mm/h [17]. The expansion of urbanization inevitably increases the area of urban construction, with the trend and speed of impervious surface coverage growing annually. The rate of change in impervious surfaces in Iowa, USA, increased from 2.42% during 1940–1961 to 4.17% during 1990–2002 [18]. In Beijing, impervious surface coverage increased from approximately 8.73% in 1980 to 22.22% in 2015 [19]. The replacement of natural soil with impervious surfaces reduces the ground’s ability to absorb rainfall, altering surface runoff mechanisms and peaks, exceeding the drainage capacity of urban stormwater systems, and leading to urban flooding. The 2D/3D spatial changes induced by urbanization contribute to the increased risk of urban flooding by affecting both rainfall and drainage dynamics.
Urban morphology can be divided into 2D (e.g., impervious surfaces, building density) and 3D (e.g., building height, canyon ratio) forms, both of which jointly influence the level of urban flood risk. Numerous previous studies have explored the impact of urban morphology on urban flood risk [20,21]. For instance, Wang et al. used the XGBoost-SHAP model to quantify the impact of urban morphology on urban flooding in Shenzhen, finding that average building volume had the greatest impact, contributing 9.70% [11]. Lin et al. predicted future urban flood-prone areas by coupling the Maximum Entropy and FLUS models, identifying impervious surfaces and the green space ratio as key spatial drivers of urban flooding [22]. However, urban planning requires an overall perspective to assess the impact of different spatial morphologies on flooding. The local climate zone (LCZ) theory proposed by Oke and Stewart provides a method for classifying the built environment based on significant differences in local climate induced by urban physical forms [23]. This theory divides the urban built environment into 17 types, each representing a unique urban composite morphology. Since its introduction, LCZ classification has been widely used in urban planning, environmental assessment, and economic research [24,25,26]. Most environmental assessments using LCZ focus on thermal environment exploration. For example, Bechtel et al. evaluated the applicability of the LCZ method in exploring surface urban heat islands in 50 cities [27]. Zhou et al. explored the impact of urban morphology on the spatial distribution of seasonal land surface temperature based on LCZ’s 2D/3D forms [28]. Yang et al. assessed the impact of urban spatial morphology on LST based on LCZ [29]. Therefore, applying LCZ to the assessment of urban flooding is a pioneering exploration. It not only directly reflects the impact of urban morphology on surface runoff but also potentially indicates the influence of local microclimates on flood risk. It is worth noting that the accuracy of LCZ classification directly determines the credibility of the research results. Remote sensing and GIS-based methods are commonly used for LCZ classification. However, GIS-based methods require accurate and comprehensive urban information data, which are often unavailable for most cities, limiting the applicability of this method. In contrast, remote sensing-based methods provide free and accessible data, making LCZ classification globally feasible. The introduction of the World Urban Database and Access Portal Tools (WUDAPT) method establishes an open-access data and globally consistent approach, offering a quick LCZ classification method by combining remote sensing images with the random forest model [30]. This method facilitates a deeper assessment of the impact of urban morphology on urban flooding.
The identification of urban flood disasters has attracted significant attention from scholars, with accurate assessment of flood-prone areas being a key research focus. Typically, scenario simulation assessment methods based on hydrological and hydrodynamic models are commonly used to evaluate urban flood disasters, such as the Storm Water Management Model (SWMM) [31]. This method dynamically simulates the flood risk in an area by designing rainfall scenarios of specific frequency and intensity. However, modeling under high spatial and temporal resolution conditions presents challenges, especially in complex urban environments. This process requires high-quality urban data and substantial computational power, limiting its applicability over large areas. Emerging machine learning methods can effectively overcome the drawbacks of scenario simulation methods. With efficient computation and strong spatial generalization capabilities, machine learning has been widely applied in identifying and predicting urban flood risks [32,33,34]. Nonetheless, a suitable machine learning model is crucial for assessing urban flood risk, as some models have data limitations. For instance, random forests may generate similar decision trees when faced with limited data features [35] and support vector machines are sensitive to data noise [36]. The naive Bayes model is a specific application of Bayesian network machine learning, which, based on the probability distribution and joint probability of random variables in Bayesian networks, simplifies multidimensional conditions into a multiplicative distribution of multiple conditions to evaluate the potential occurrence of events [37]. The NBM exhibits good robustness to missing and noisy data and can provide reasonable predictions with small sample sizes. However, the assumption of feature independence in naive Bayes does not always hold in practice. The improved weighted naive Bayes (WNB) method can overcome this limitation by assigning weights to attributes based on risk factors, reducing the independence assumption among features. Tang et al. successfully assessed urban flood risk in Guangzhou, China, using a spatial framework combining WNB and GIS, revealing a more accurate spatial pattern of urban flooding [38]. Similarly, Liu et al. coupled WNB and GIS models to assess flood disasters in northern Queensland, demonstrating superior performance compared to the Naive Bayes model [39]. In summary, the WNB model can produce more realistic results and improve model accuracy, aiding in obtaining more precise spatial patterns in urban flood risk assessments and providing valuable support for developing flood mitigation strategies.
Quantitative analysis of the differences in risk exposure among residents in different neighborhoods can enhance social equity. Equitable access to urban public environments is a crucial aspect of determining the level of urban governance and the well-being of residents. Urban public environments encompass not only green spaces and infrastructure but also potential environmental hazards such as urban heat risk, extreme frost events, and urban flood risk [40,41,42]. Different built-up areas exhibit varying capacities to cope with extreme rainfall, resulting in disparities in the flood risk faced by residents. Therefore, this study proposes a comprehensive assessment framework that combines LCZ classification and the WNB model to evaluate urban flood risk variations in different built environments. Building on this foundation, the study further investigates the differences in flood hazard exposure among neighborhoods within the study area. The primary novelty of this study can be outlined as follows: (1) developing an urban waterlogging risk probability distribution map using the spatial WNB model; (2) investigating the differences in waterlogging risk probabilities across different LCZs; and (3) analyzing the variations in waterlogging hazard exposure among different neighborhoods. This study enhances the accuracy of spatial flood risk assessments by employing the WNB model and innovatively applies the LCZ classification to urban flood disaster evaluation, exploring the impact of urban morphology on flood hazards. The results can identify potential flood-prone areas, providing valuable insights for urban planning and aiding policymakers in developing appropriate strategies to mitigate urban flood risk and enhance social equity.

2. Study Area and Data Sources
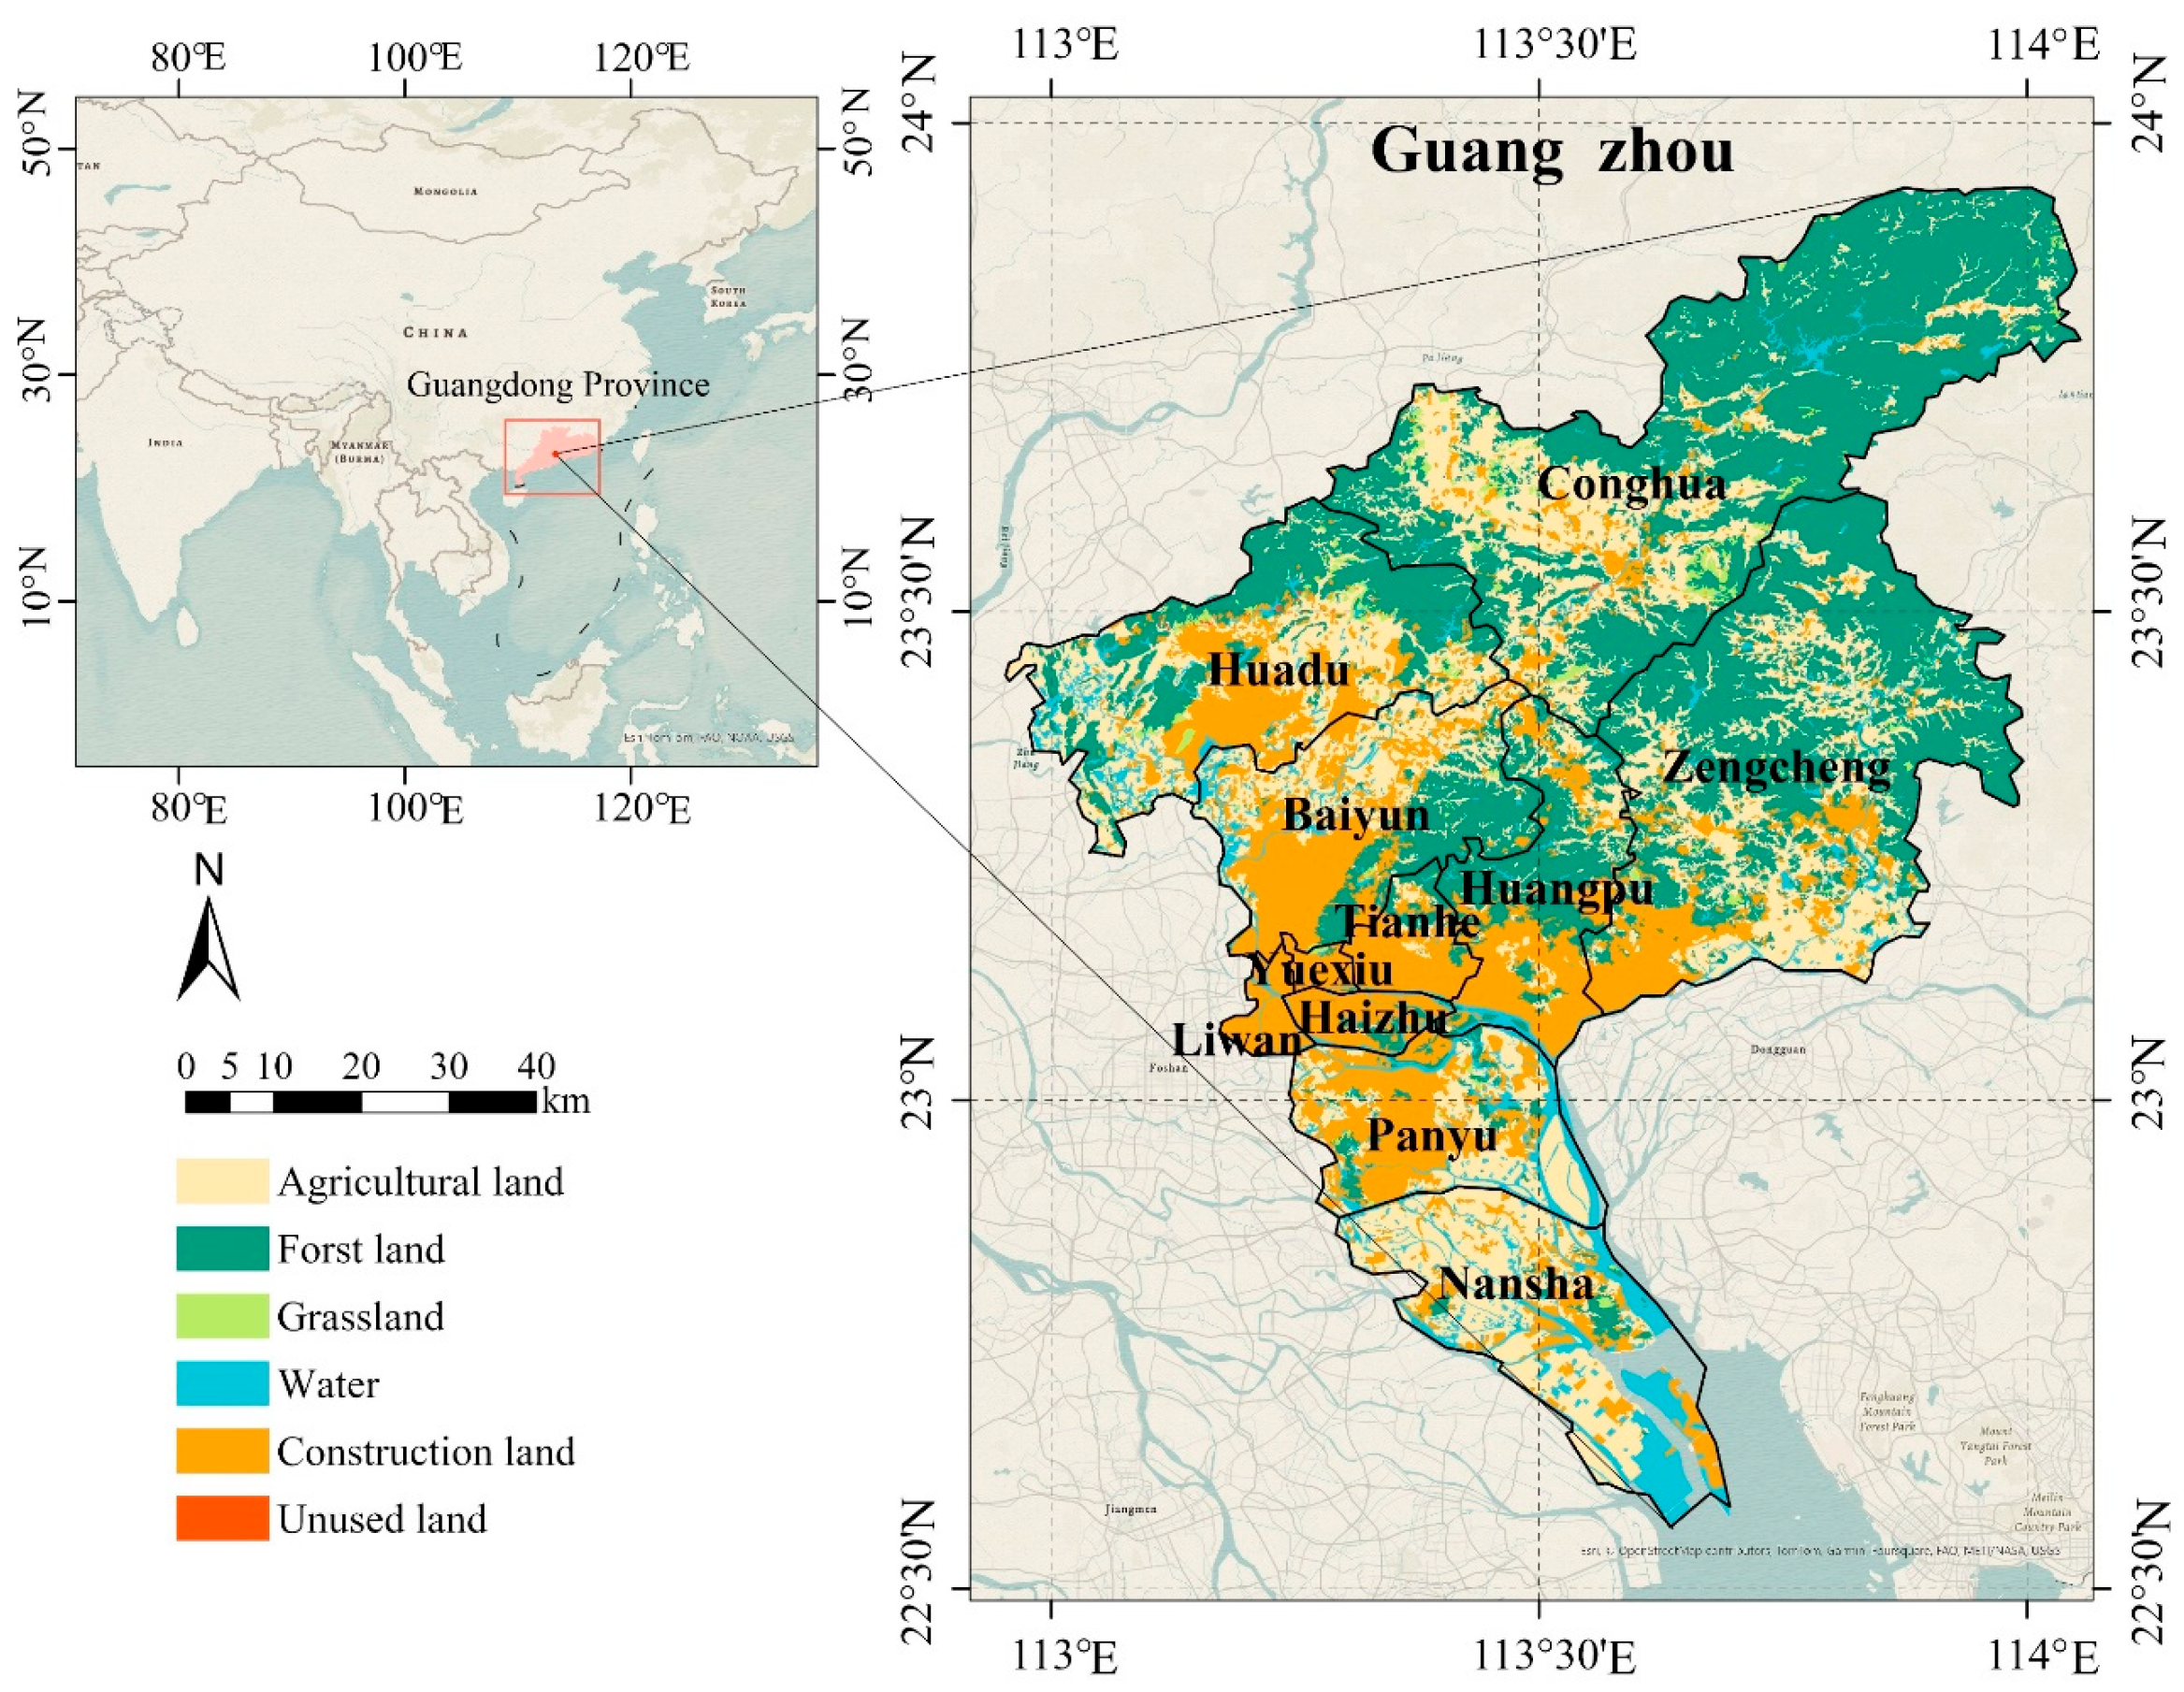
2.1. Study Area

Guangzhou is located in the central part of Guangdong Province, China, within the Pearl River Delta, spanning from 112°57′ to 114°3′ E longitude and 22°26′ to 23°56′ N latitude. It comprises 11 administrative districts: Yuexiu (YX), Tianhe (TH), Haizhu (HZ), Liwan (LW), Huangpu (HP), Baiyun (BY), Panyu (PY), Nansha (NS), Huadu (HD), Conghua (CH), and Zengcheng (ZC), with a total area of 7434.40 km2 (Figure 1). Guangzhou is a hilly region with higher terrain in the northeast and lower terrain in the southwest, facing the sea and backed by mountains. It has a South Asian tropical monsoon climate, characterized by mild temperatures and significant maritime influence, with an annual rainfall exceeding 1800 mm. As the central city of South China, Guangzhou has experienced rapid economic growth and urbanization. By 2021, the resident population reached 18.81 million, with an urbanization rate of 86.48% [43]. Identifying the spatial distribution of flood probability in Guangzhou is crucial for addressing flood risks caused by extreme weather events and promoting the city’s sustainable development.

2.2. Data Sources

To assess the probability of waterlogging occurrence, this study utilized urban flood-prone points published by the Guangzhou Water Authority (https://swj.gz.gov.cn/index.html) (accessed on 2 April 2024) and urban flood-related news reports from social media platform “Toutiao” (https://www.toutiao.com) (accessed on 2 April 2024) as waterlogging points. During the period from 2015 to 2020, a total of 907 flood events were identified in Guangzhou. Based on the recommendations of Tehrany et al. [44], the parameters selected as spatial risk variables for this study include Slope (SLOPE), Elevation (DEM), road density (RD), fractional vegetation cover (FVC), distance to the waterway (DW), impervious surface fraction (ISF), and soil water retention (SWR). Table 1 summarizes the sources of the relevant data.

2.3. Spatial Distribution of Urban Morphology Factors
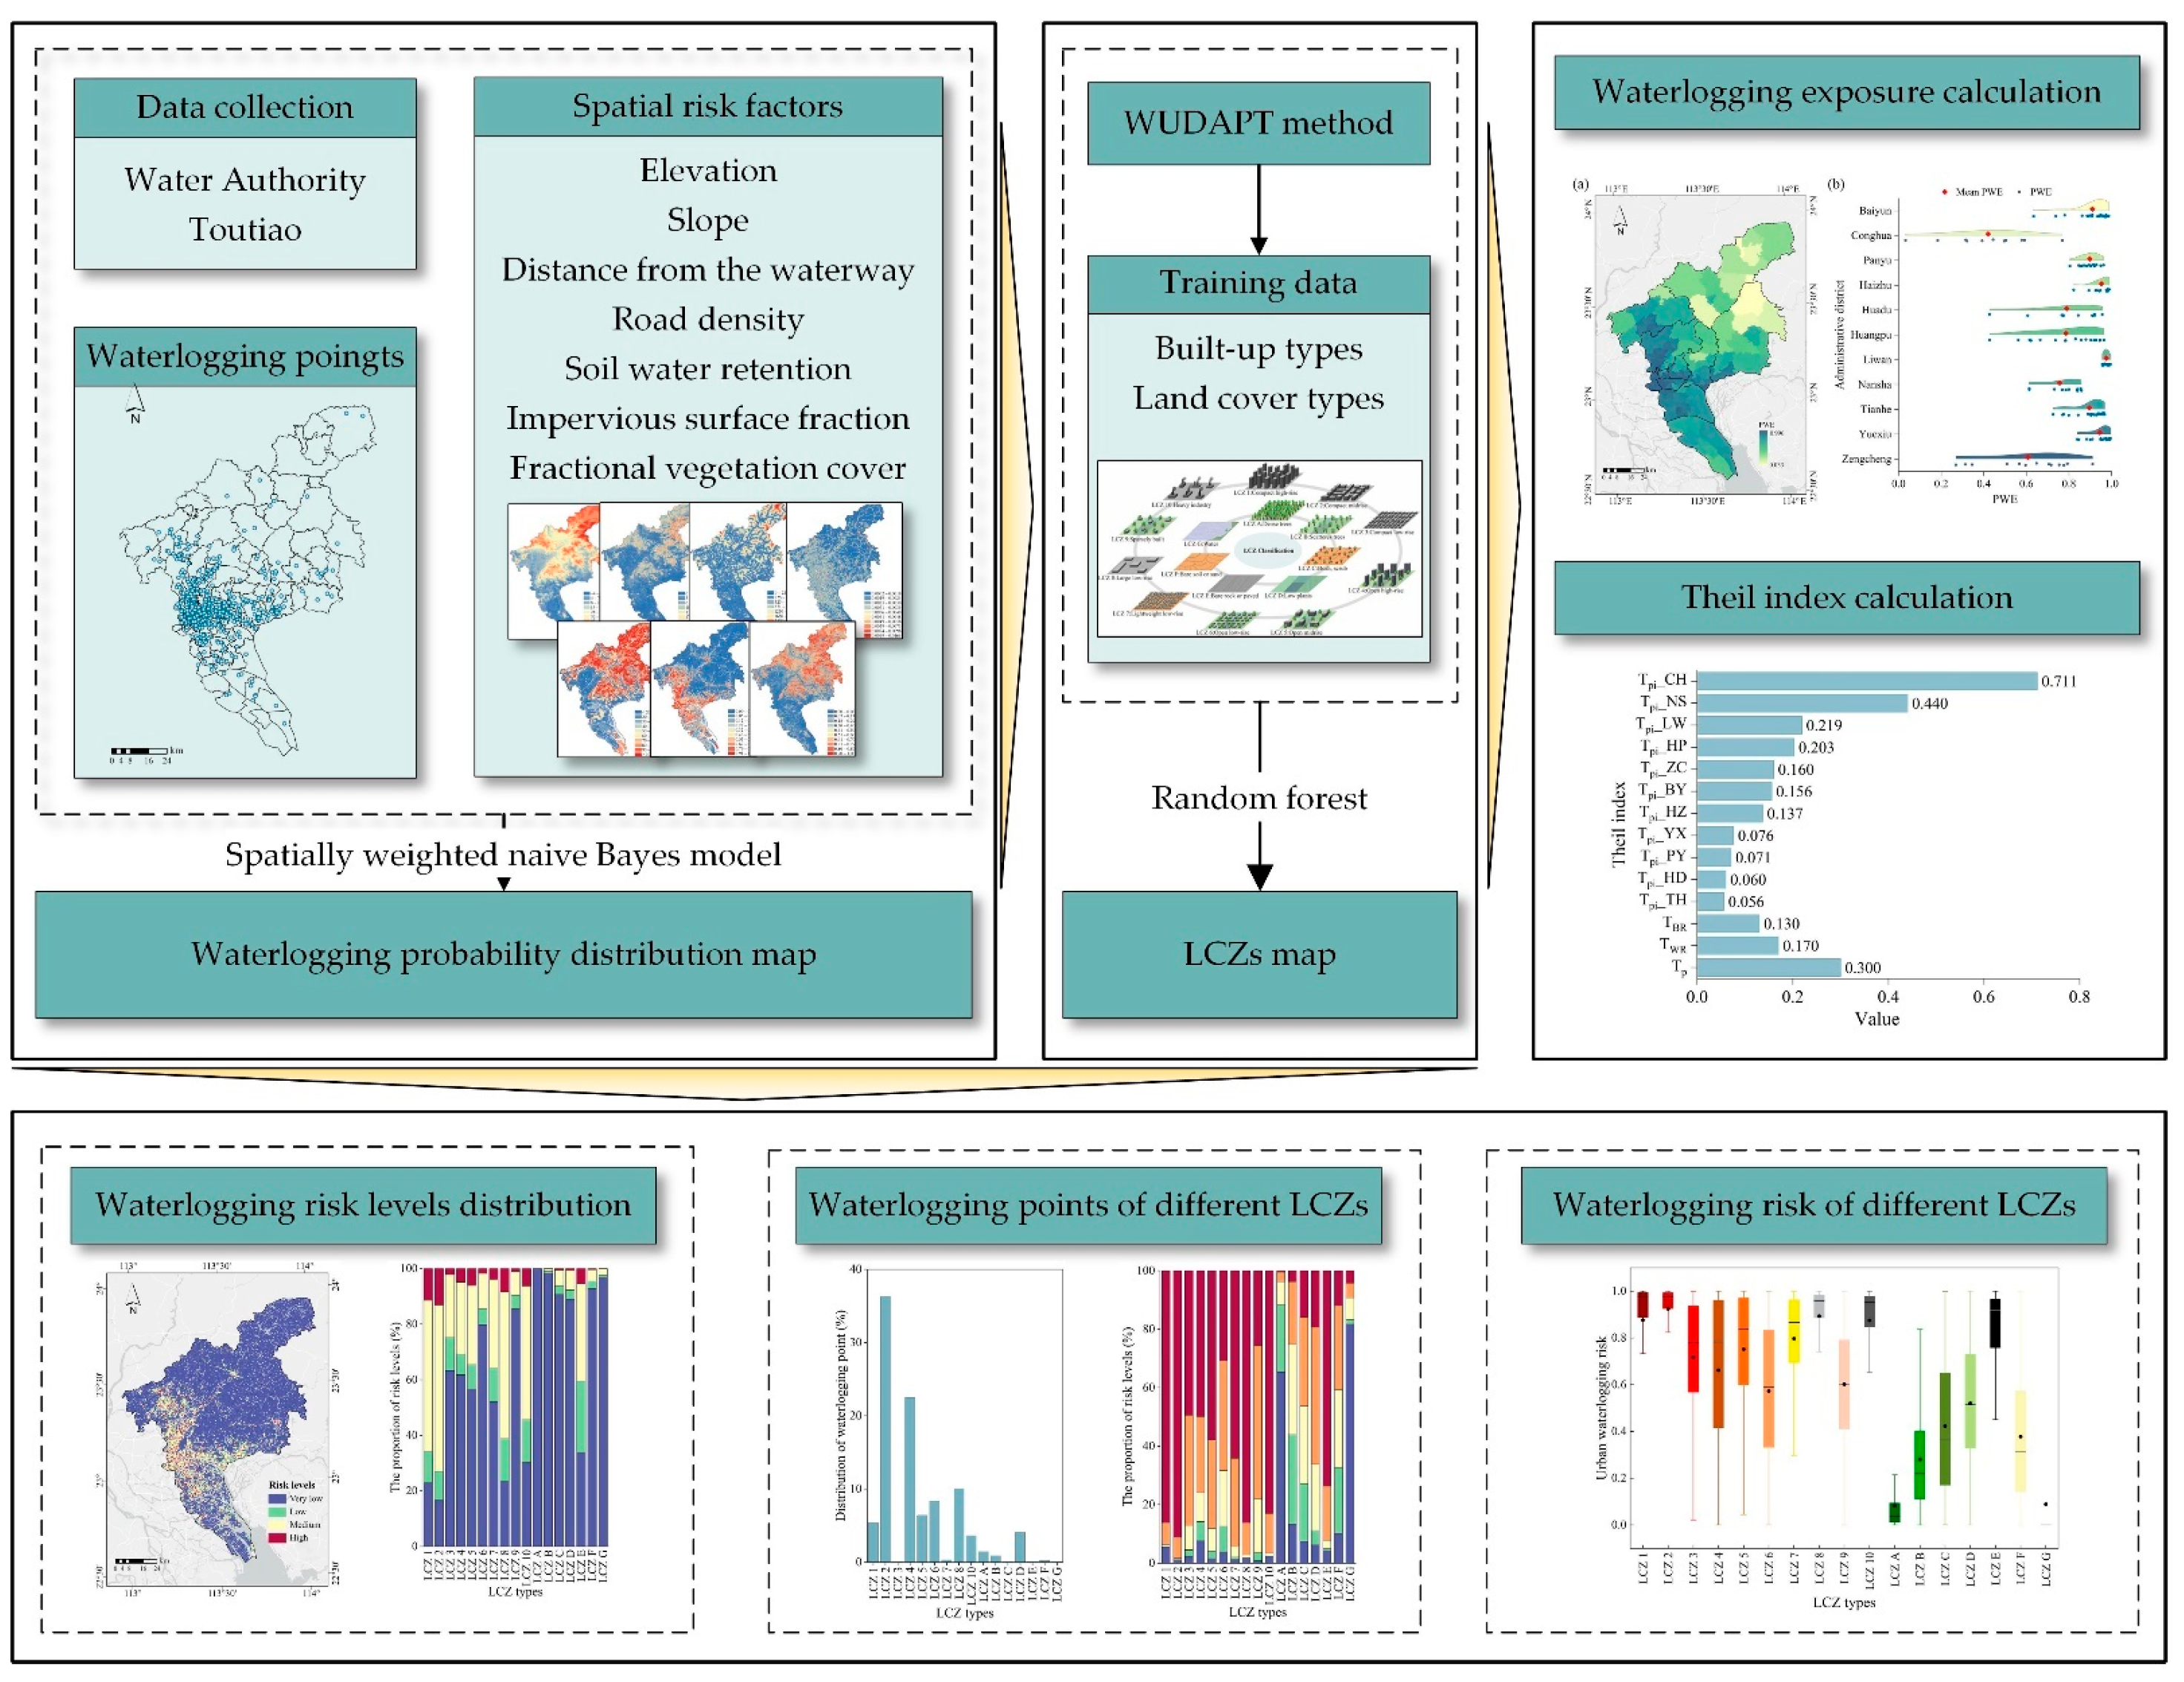
Figure 2 presents the calculated results and spatial distribution of the seven spatial variables, classified into ten levels using the geometric classification method in ArcGIS Pro. DEM data were obtained from the Digital Elevation Model, which was used to calculate the slope (Slope) of Guangzhou’s terrain. The northern part of Guangzhou is hilly with significant surface relief and higher elevations, making it unsuitable for urban development. The southern part has a gentle terrain, concentrated urban construction areas, and populated regions, which are potential waterlogging-prone areas (Figure 2a,b). DW represents the distance from each point to the nearest waterway, sourced from the OpenStreetMap waterway data and calculated using the Euclidean distance method (Figure 2c). The results show that DW values are higher in the north and lower in the south, with waterways concentrated in the southern region. RD indicates the ratio of the total length of roads within each grid to the grid area, calculated using the spatial analysis tools in ArcGIS Pro. The results reveal the highest road density in the central region of Guangzhou (Figure 2d). SWR represents soil water retention capacity, which is related to soil type. SWR was calculated using the curve number method proposed by McCuen et al. [46], based on land-use data from the land-use database, with the formula given in Equation (1). FVC indicates the percentage of vertical projection of vegetation, reflecting the condition of plant growth. It was calculated using the Landsat-8 Operational Land Imager product, covering the period from 1 January 2019 to 31 December 2019, with the formula given in Equation (2). Finally, the spatial distribution of ISF is shown in Figure 2f, with high ISF concentrated in urban built-up areas, where rainfall quickly converts to surface runoff, increasing water flow velocity.
S W R = 25400 C N 254
F V C = N D V I N D V I m i n N D V I m a x N D V I m i n
CN represents a function related to vegetation vigor, land cover, soil type, and the Normalized Difference Vegetation Index (NDVI). NDVI stands for Normalized Difference Vegetation Index and reflects the condition of plant development.

3. Methodology

This study comprises three parts, aiming to investigate the relationship between urban waterlogging risk and urban morphology. Figure 3 illustrates the waterlogging risk assessment process. Firstly, the study collected urban waterlogging occurrence points in Guangzhou over the past five years (2015–2020) along with seven spatial risk factors (DEM, Slope, DW, RD, SWR, ISF, FVC) (Figure 2). A spatial weight naive Bayes model was then used to generate a waterlogging probability risk map for Guangzhou. Subsequently, the concept of local climate zones (LCZs) was introduced. Using the WUDAPT-based method, training samples of different urban morphologies within the study area were delineated. Through random forest classification, Guangzhou was divided into 17 different neighborhood types, reflecting various urban spatial morphologies. Spatial and statistical analysis methods were applied to investigate the relationship between urban morphology and waterlogging risk according the LCZ classification map and the urban waterlogging probability map. Finally, the study examined the disparities in waterlogging risk exposure among residents. The Theil index was used to measure the differences in residents’ exposure to urban waterlogging risk [47]. This study framework provides valuable insights for identifying potential waterlogging risk areas in future urban development.

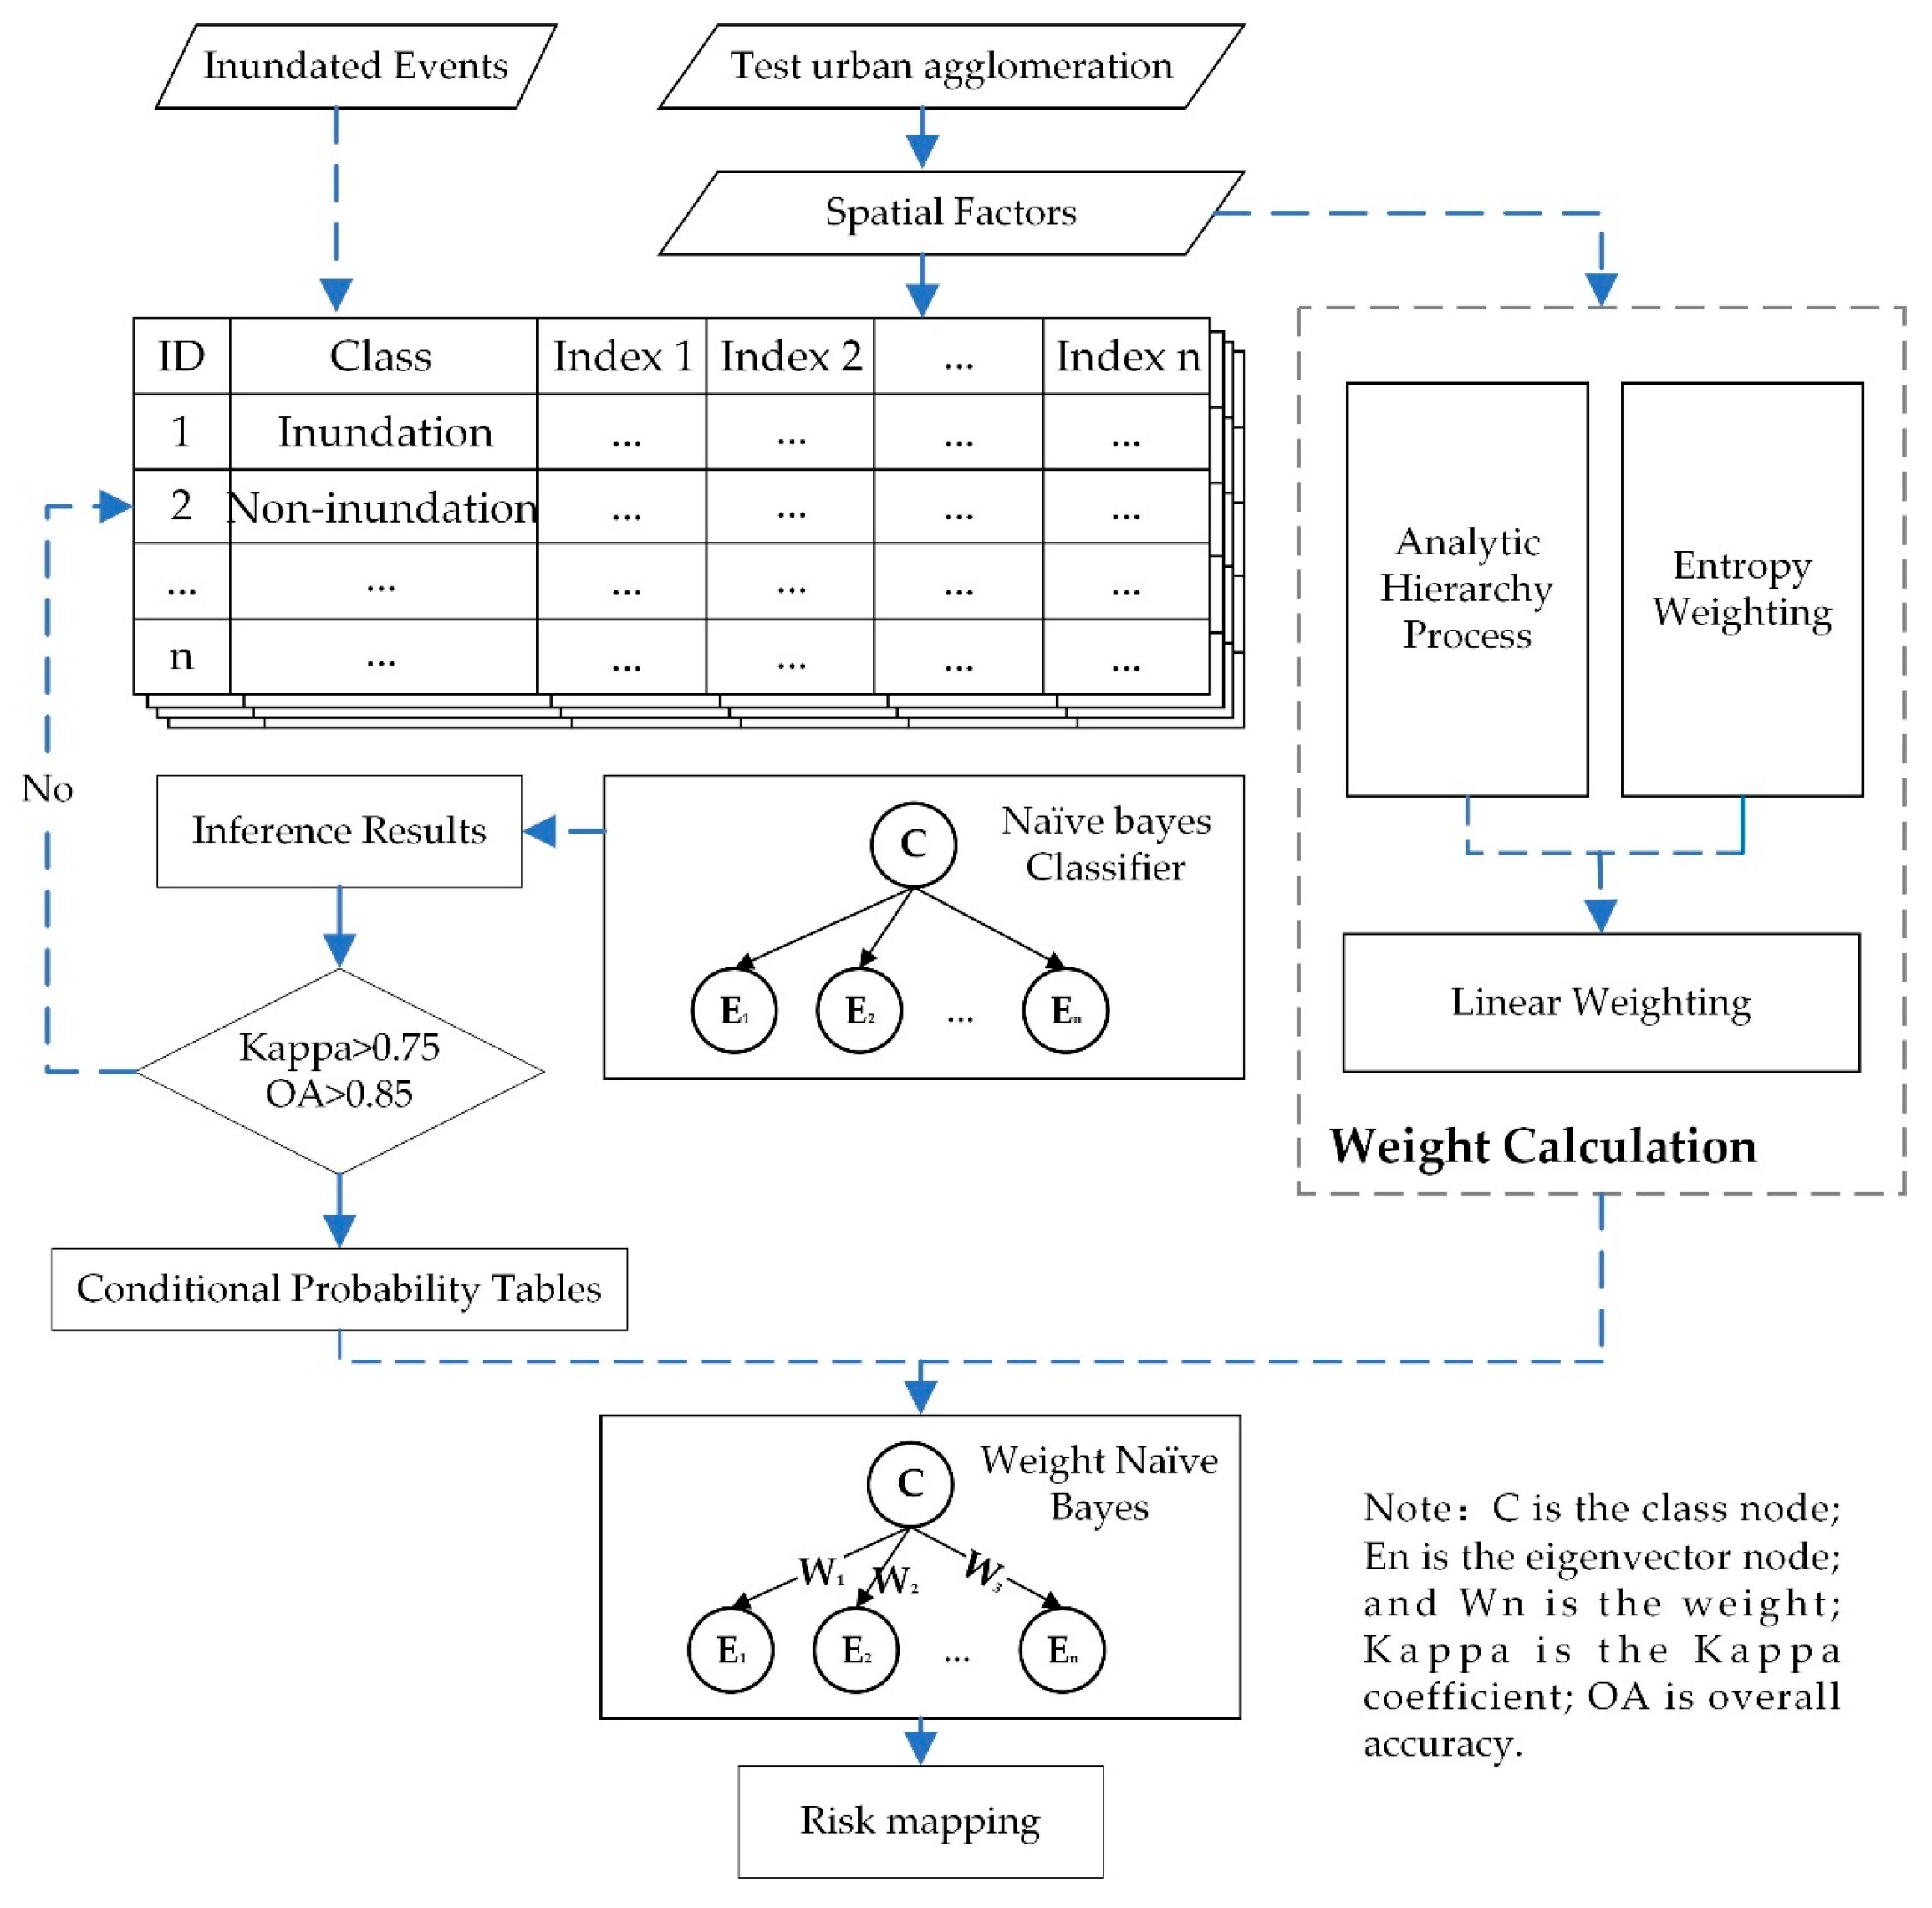
3.1. Spatially Weighted Naive Bayes Model

The spatial weight naive Bayes (WNB) model is an improved version of the naive Bayes model that uses spatial information to enhance classification performance. Traditional naive Bayes models assume that features are conditionally independent. In contrast, the spatial weight naive Bayes model incorporates spatial weights in calculating the conditional probability of each feature. This approach considers not only the feature values of individual samples but also the feature information of their spatial neighbors, thereby improving the correlation of geographic phenomena. The study employs a linear weighting method that integrates the entropy weight method and the analytic hierarchy process to calculate the integrated weights (Equation (3)) [48]. This method is combined with the naive Bayes model to construct the weighted naive Bayes model. Finally, spatial information is introduced to calculate the urban flood risk distribution.
First, the spatial factors in Section 2.3 (DEM, Slope, DW, RD, SWR, ISF, FVC) were projected onto the same coordinate system, and spatial risk weights were calculated using a linear weighting method. The next step was constructing the WNB model. Obtaining a reasonable prior probability is crucial for the success of WNB modeling. The study area was divided into over 70,000 grids, but only 907 flood points were identified. If all grids were included in the sample simultaneously, the prior probability of urban flooding would be extremely low, preventing the model from yielding accurate results. To avoid underestimating the prior probability, we employed an iterative approach and small-sample sampling method. The study set the number of iterations at 10,000, and for each iteration, 3000 grids were randomly selected from both inundated and non-inundated areas to ensure appropriate sampling. The threshold evaluation criteria for the validation sampling table were set at 0.85 (overall accuracy) and 0.75 (kappa coefficient). Finally, samples exceeding these evaluation criteria were used to calculate conditional probabilities, and spatial risk weights were combined to infer the flood risk of regional grids. Figure 4 shows the flow of the WNB model in this study.
W i = a H i + 1 a Z i
where W i , H i , Z i represent the integrated weight, subjective weight, and objective weight of the i -th spatial factor, respectively, and 1 ≤ i ≤ 7.

3.2. Local Climate Zones Classification

Local climate zones (LCZs) are classifications developed by Oke and Stewart [23] to categorize urban areas based on physical differences in surface structure and land cover. This classification divides cities into 17 distinct types from a landscape perspective. LCZs 1–10 are described as “built-up types”, while LCZs A–G are described as “land cover types”, with each type exhibiting stable temperature differences (Figure 5). LCZs are formally defined as an area with uniform surface cover, structure, material, and human activities, spanning horizontal scales from hundreds to thousands of meters. Each LCZ has a characteristic range of screen-level temperatures, which is most pronounced in dry, calm, clear nights and simple terrain areas.
Properly classifying LCZ types can accurately reflect the urban built environment. Remote sensing satellite imagery is a widely used method for LCZ classification, utilizing spatial information and spectral data from images. The World Urban Database and Access Portal Tools (WUDAPT) is a global initiative aimed at developing a rapid LCZ classification method. WUDAPT offers an online platform that uses the LCZ generator, allowing users to quickly obtain LCZ classification maps using free data sources, such as training files delineated from Google Earth. WUDAPT’s methods have been successfully applied in various urban and environmental studies. This study applied WUDAPT to classify LCZs in Guangzhou, following the workflow proposed by Bechtel et al. [49,50,51].
Initially, training samples were manually labeled in Google Earth based on experience and classified into different directories according to the LCZ categories provided by WUDAPT. A total of 17 LCZs were identified in Guangzhou. The classified sample set was then submitted through the WUDAPT online portal. The portal uses a random forest algorithm to classify the study area. Finally, the classification results were downloaded from the website, which provided overall classification accuracy and accuracy for different LCZ types. The detailed process is provided by https://www.wudapt.org/ (accessed on 14 September 2023).
The benefits of the WUDAPT method are evident. Firstly, it offers an online method where the required data and results are free and publicly accessible. Secondly, WUDAPT can be used globally, overcoming the limitations of GIS-based classification methods due to the lack of urban data. Lastly, the online platform allows users to reference, collect, and further process classification cases from other researchers. Results from WUDAPT can be applied to other studies, such as urban heat environment research, public health, and urban planning.

3.3. Environmental Equity Calculation

This study uses the Theil index to measure the equity of flood risk exposure among residents across different neighborhoods in the study area. The Theil index, proposed by Dutch economist Henri Theil based on the concept of entropy, is a statistical measure of income or wealth inequality and reflects income disparities [47]. The index has also been extended to environmental applications, often used to measure environmental equity [52]. In this study, we use the Population-Weighted Exposure Index (PWE) to comprehensively measure the waterlogging risk faced by residents (WLR). This method is commonly used to assess the relationship between residents and environmental exposure [53], as given in Equation (4).
P W E = i = 1 n P o p i × W L R i   i = 1 n P o p i
Here, P W E represents the population-weighted exposure to waterlogging risk, n denotes the number of grids, and P o p represents the population within each grid, with data sourced from https://www.worldpop.org/ (accessed on 20 September 2023).
The Theil index T is used to calculate the equity of waterlogging risk among residents, as expressed in Equation (5). A higher Theil index indicates greater disparity. The index allows for first-order decomposition, dividing the overall disparity in Guangzhou into between-administrative district and within-administrative district differences. The city is divided into 11 administrative regions (Yuexiu, Tianhe, Haizhu, Liwan, Huangpu, Baiyun, Panyu, Nansha, Huadu, Conghua, and Zengcheng) to calculate between-administrative district disparities, and neighborhoods within each region to represent within-administrative district disparities. The formula for the total disparity Theil index is given in Equation (6).
T = i = 1 n y i log y i p i
T p = i j Y i j T log Y i j / Y P i j / P
where Y i j represents the total waterlogging risk for the j -th neighborhood in the i -th administrative district, Y i is the total flood risk for the i -th administrative district, and Y is the total waterlogging risk for the study area. P i j denotes the population of the j -th neighborhood in the i -th administrative district, P i is the total population of the i -th administrative district, and P is the total population of the study area.
The between-neighborhood disparity within the i -th administrative district can be expressed using Equation (7), which further decomposes the overall disparity into between-administrative district and within-administrative district disparities, as shown in Equation (8):
T p i = j Y i j Y i log Y i j / Y P i j / P
T p = i Y i Y T p i + i Y i Y log Y i / Y P i / P = T W R + T B R
where T W R represents the within-administrative district disparity, and T B R represents the between-administrative district disparity.

3.4. Waterlogging Risk Classification

In ArcGIS Pro 3.1, the natural breaks method tool was used to classify waterlogging risk into five levels, with levels 1–4 determined as being at very low levels. The fifth level was further divided into three sub-levels using a normal distribution method: the interval (0, μ) was classified as low risk, the interval (μ, 0) was classified as high risk, and the remaining interval [“μ − σ” to “μ + σ”] was classified as medium risk. Ultimately, the waterlogging risk was categorized into four levels: very low, low, medium, and high.

4. Results and Discussion

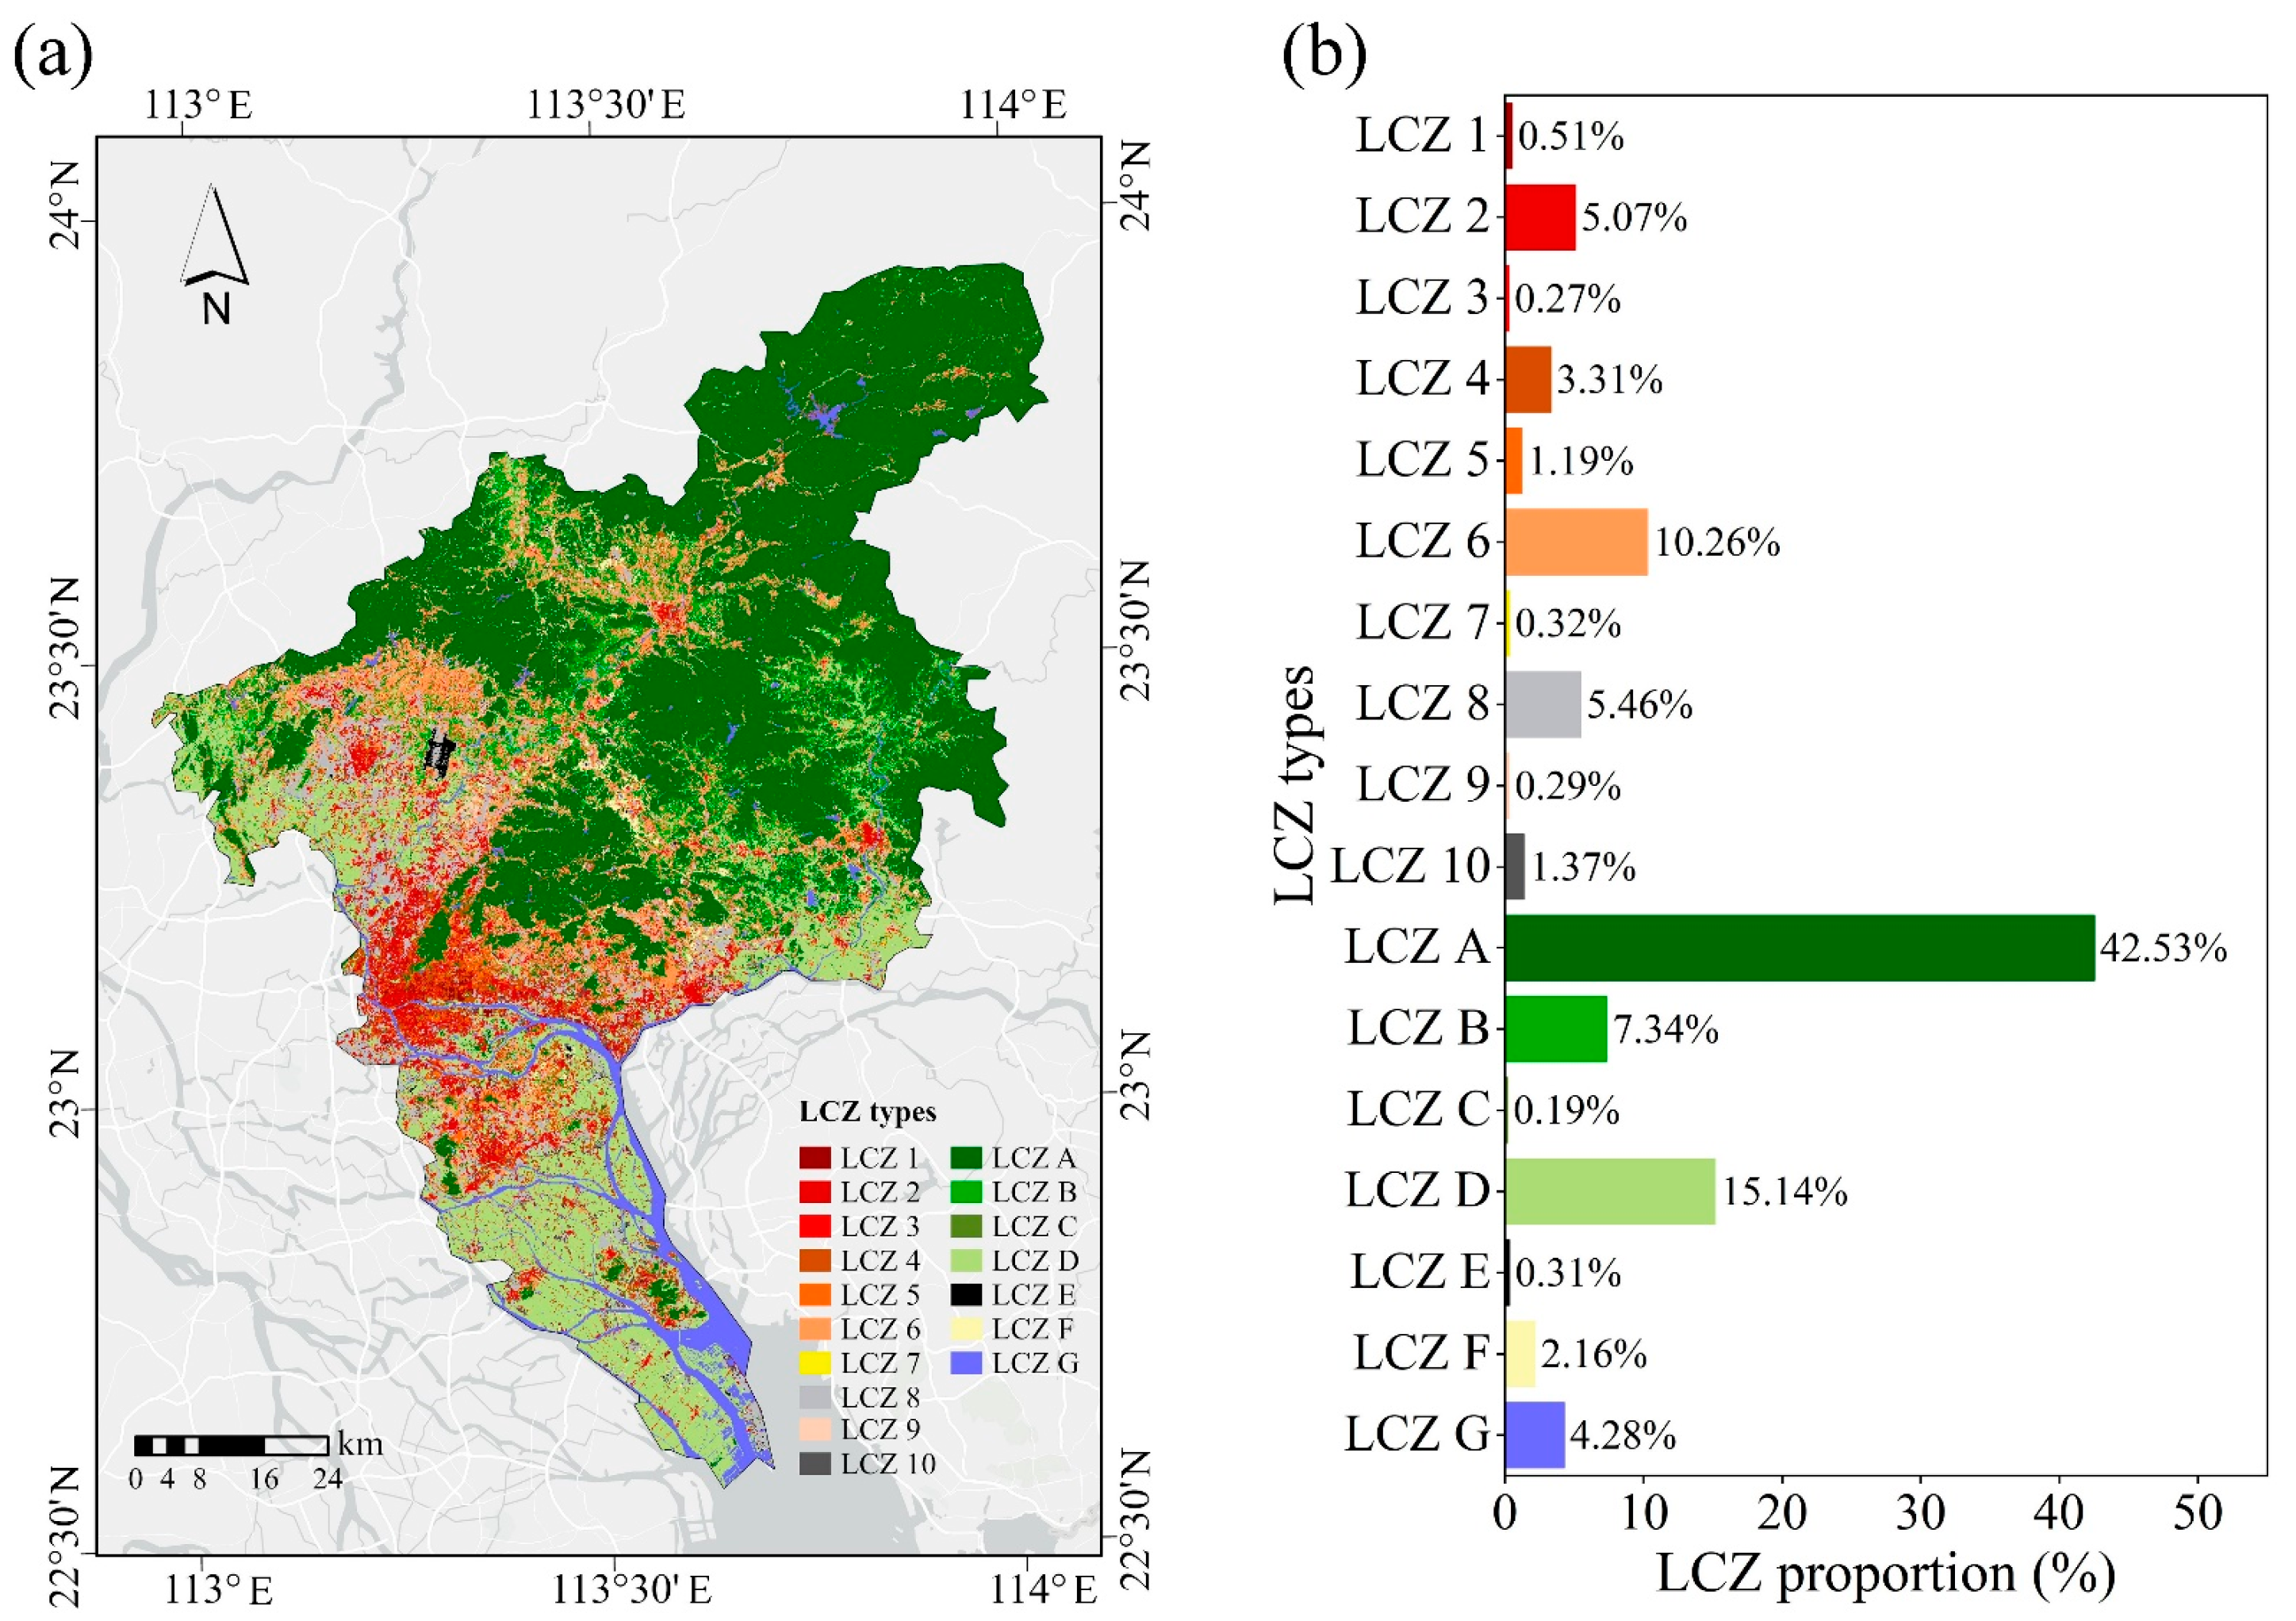
4.1. LCZs Classification Results

In this study, the overall accuracy of the LCZ classification using the WUDAPT method reached 0.86, yielding satisfactory classification results. Figure 6 shows the LCZ classification results. Seventeen LCZ types were identified in the study area. From the overall spatial distribution, built-up types are primarily concentrated in the central part of Guangzhou, while land cover types are distributed in the northern and southern parts (Figure 6a). The built-up areas are mainly located in the central urban area, with urban subcenters forming clusters, such as Conghua, Zengcheng, and Huadu in the north. The northern region is dominated by LCZ A, characterized by hilly terrain with extensive vegetation cover. The southern region is primarily composed of LCZ D and LCZ G, where farmland and water systems are most widespread.
Statistical results (Figure 6b) show that within the built-up types, LCZ 6 has the largest area proportion at 10.26%, followed by LCZ 8, LCZ 2, and LCZ 4, with area proportions of 5.46%, 5.07%, and 3.31%, respectively. Among the land cover types, LCZ A has the highest area proportion at 42.53%, followed by LCZ D, LCZ B, and LCZ G, with area proportions of 15.14%, 7.34%, and 4.28%, respectively. Overall, the most common neighborhood type in Guangzhou is low-rise open areas, and besides forests and farmland, green spaces are most commonly represented by urban parks dominated by deciduous trees.

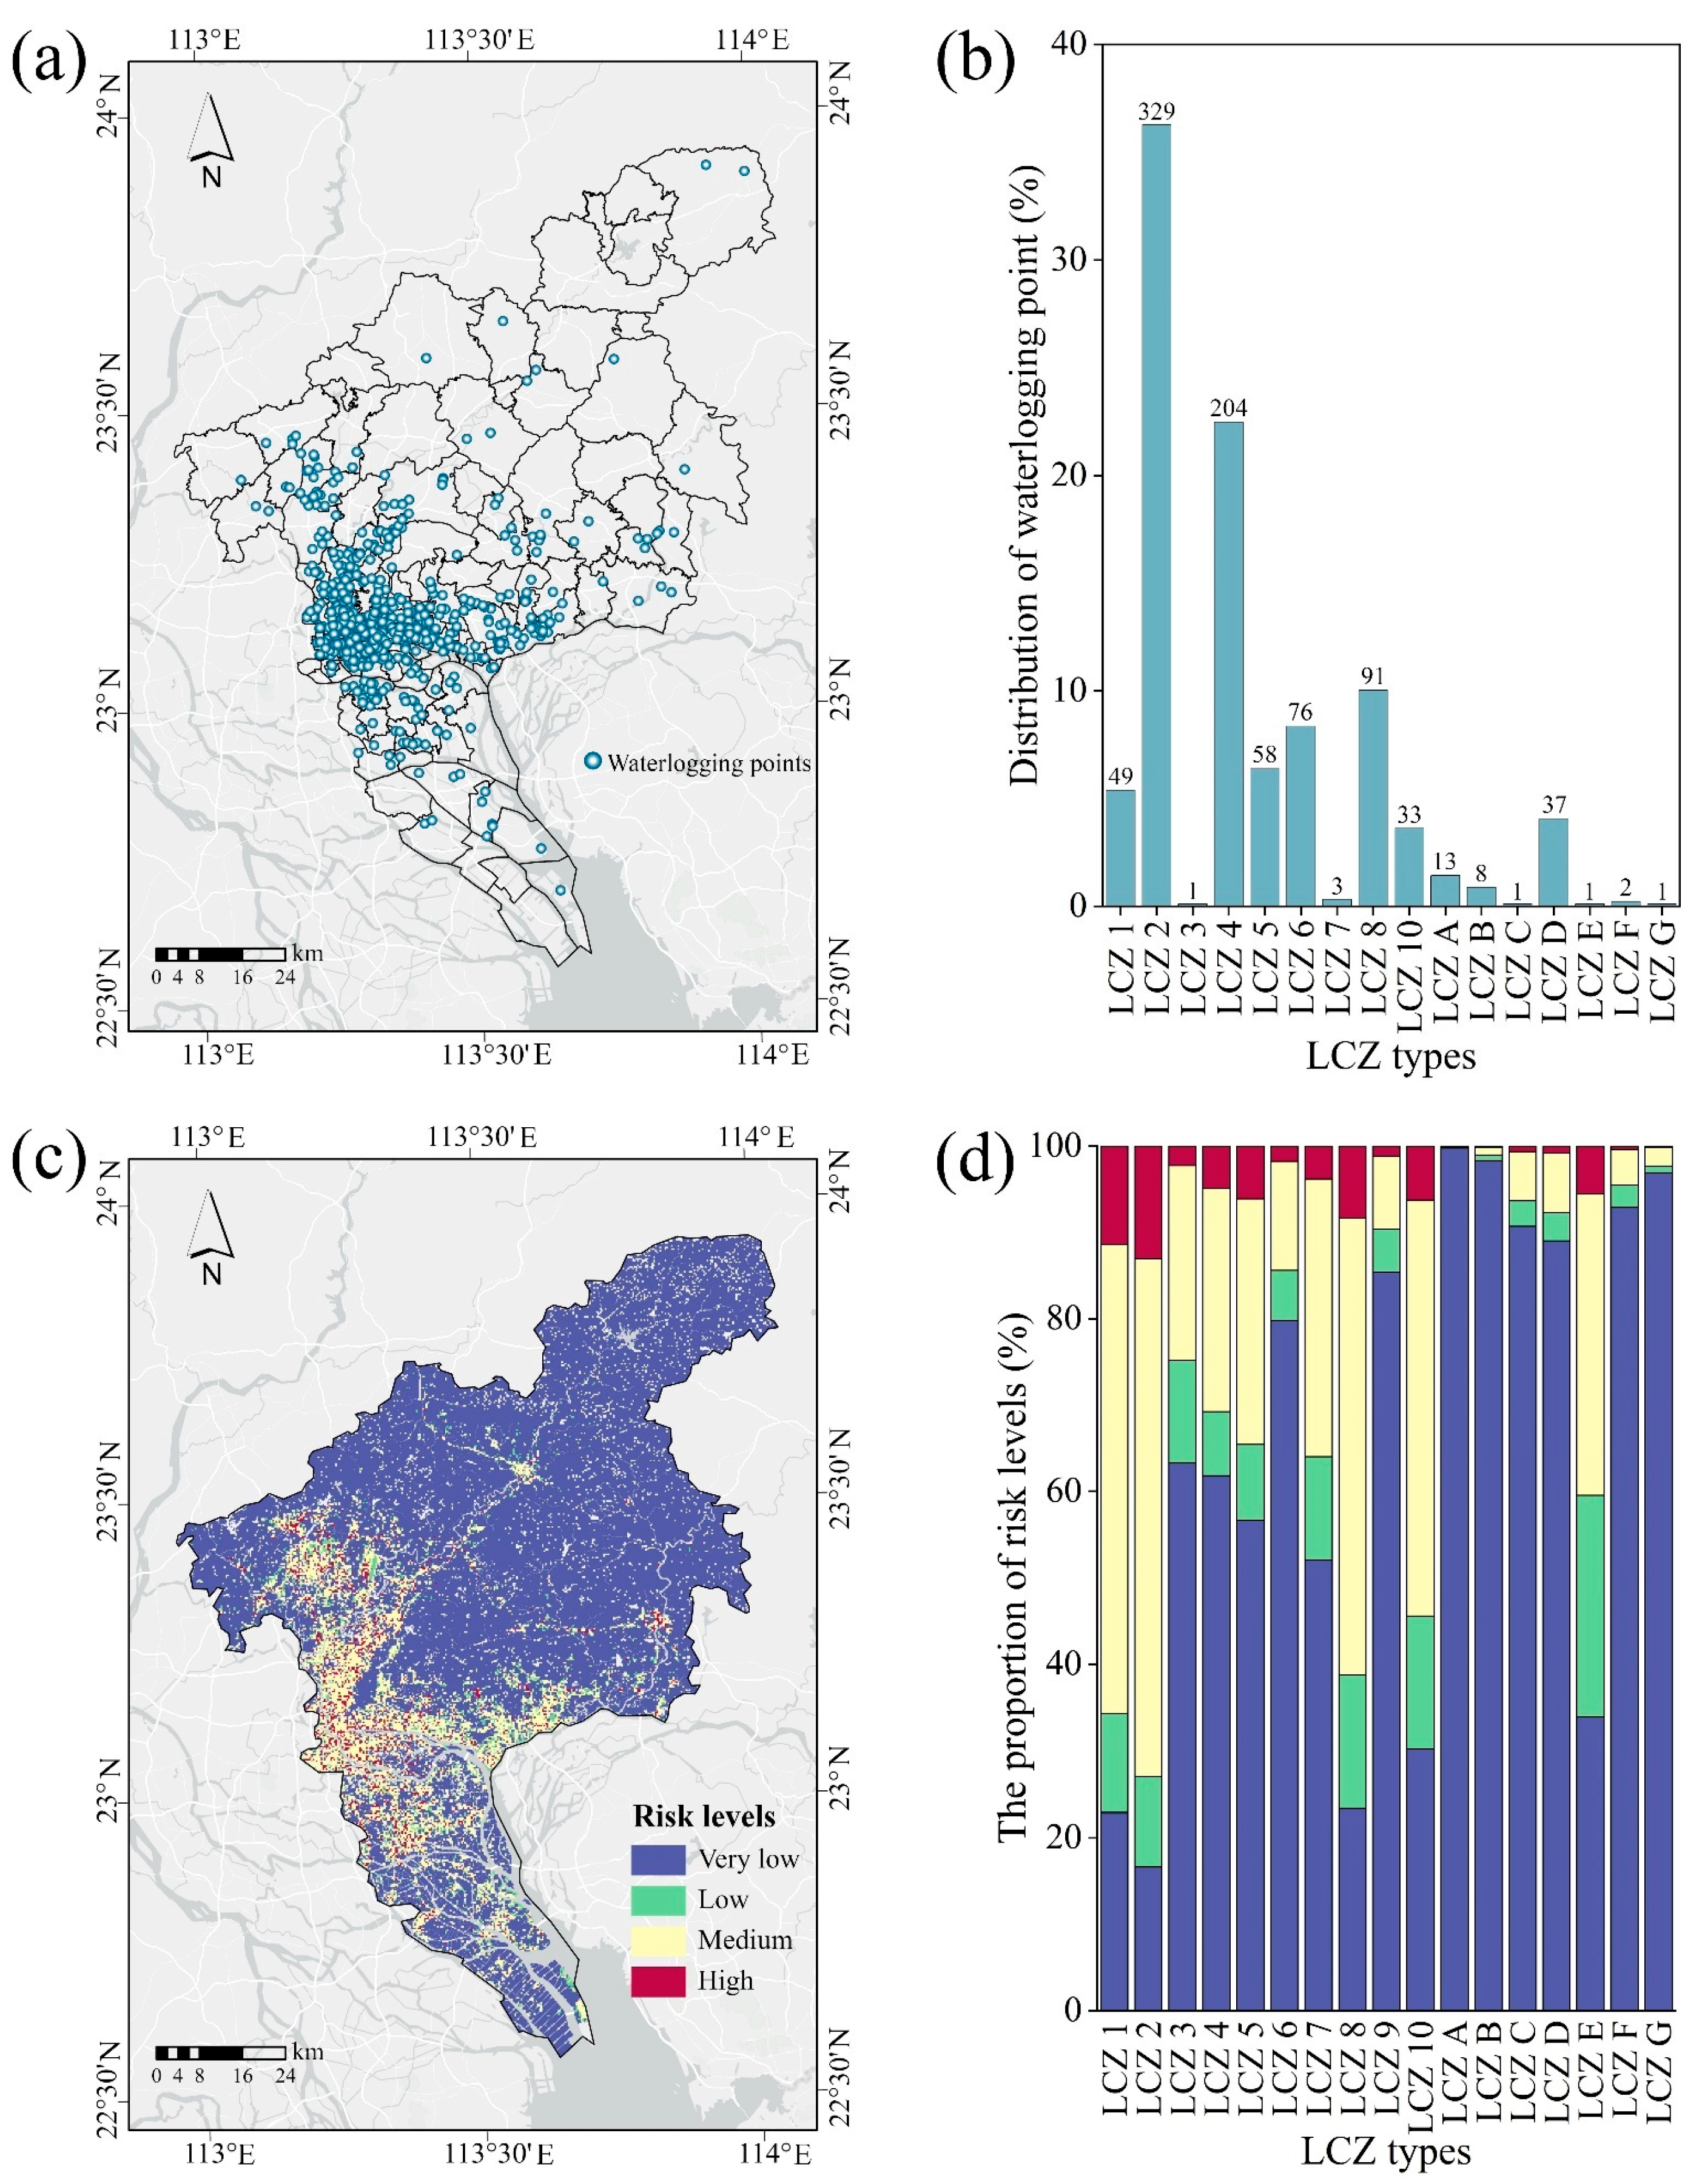
4.2. Spatial Distribution of Waterlogging Point and Risk Levels

According to data collected from the Guangzhou Water Authority and Toutiao, a total of 907 waterlogging locations were identified in Guangzhou from 2015 to 2020, as shown in Figure 7a. The waterlogging points are mainly concentrated in the central urban area, with a few distributed in the southern and northern parts. Among these, LCZ 2, characterized by dense mid-rise buildings, identified 329 waterlogging points, accounting for 36.27% of the total waterlogging occurrences. This is followed by LCZ 4, LCZ 8, and LCZ 6, which identified 204, 91, and 76 waterlogging points (Figure 7b), accounting for 22.49%, 10.03%, and 8.38% of the total waterlogging occurrences, respectively. Although LCZ 6 has the highest area proportion among the built-up types, LCZ 2 has the most identified waterlogging points, indicating that a higher proportion of impervious surfaces increases the likelihood of waterlogging.
Figure 7c shows that the northern and southern parts of Guangzhou have the lowest risk levels, with almost no waterlogging risk, while the risk is mainly concentrated in the central urban area. The very low-risk areas account for 83.74% of the total area, representing regions where waterlogging is almost unlikely to occur. Among the areas with potential risk, the medium risk areas have the highest proportion at 10.98%, followed by low-risk and high-risk areas, accounting for 3.42% and 1.86% of the total area, respectively. Figure 7d shows significant differences in waterlogging risk levels among different neighborhood types. LCZ 2, characterized by high-density mid-rise buildings, faces the highest waterlogging risk, with high-risk areas accounting for 13.06% and medium-risk areas for 59.89%. LCZ 1 follows, with high-risk areas accounting for 11.42% and medium-risk areas for 54.27%. These results indicate that densely built-up areas with high proportions of impervious surfaces, represented by LCZ 1 and LCZ 2, are more prone to waterlogging. In contrast, LCZ A and LCZ B, which are dominated by permeable surfaces, have high-risk proportions of only 0.13% and 1.01%, respectively, indicating a very low waterlogging risk. This reflects the good infiltration capacity of green spaces, which reduces surface runoff and waterlogging risk.

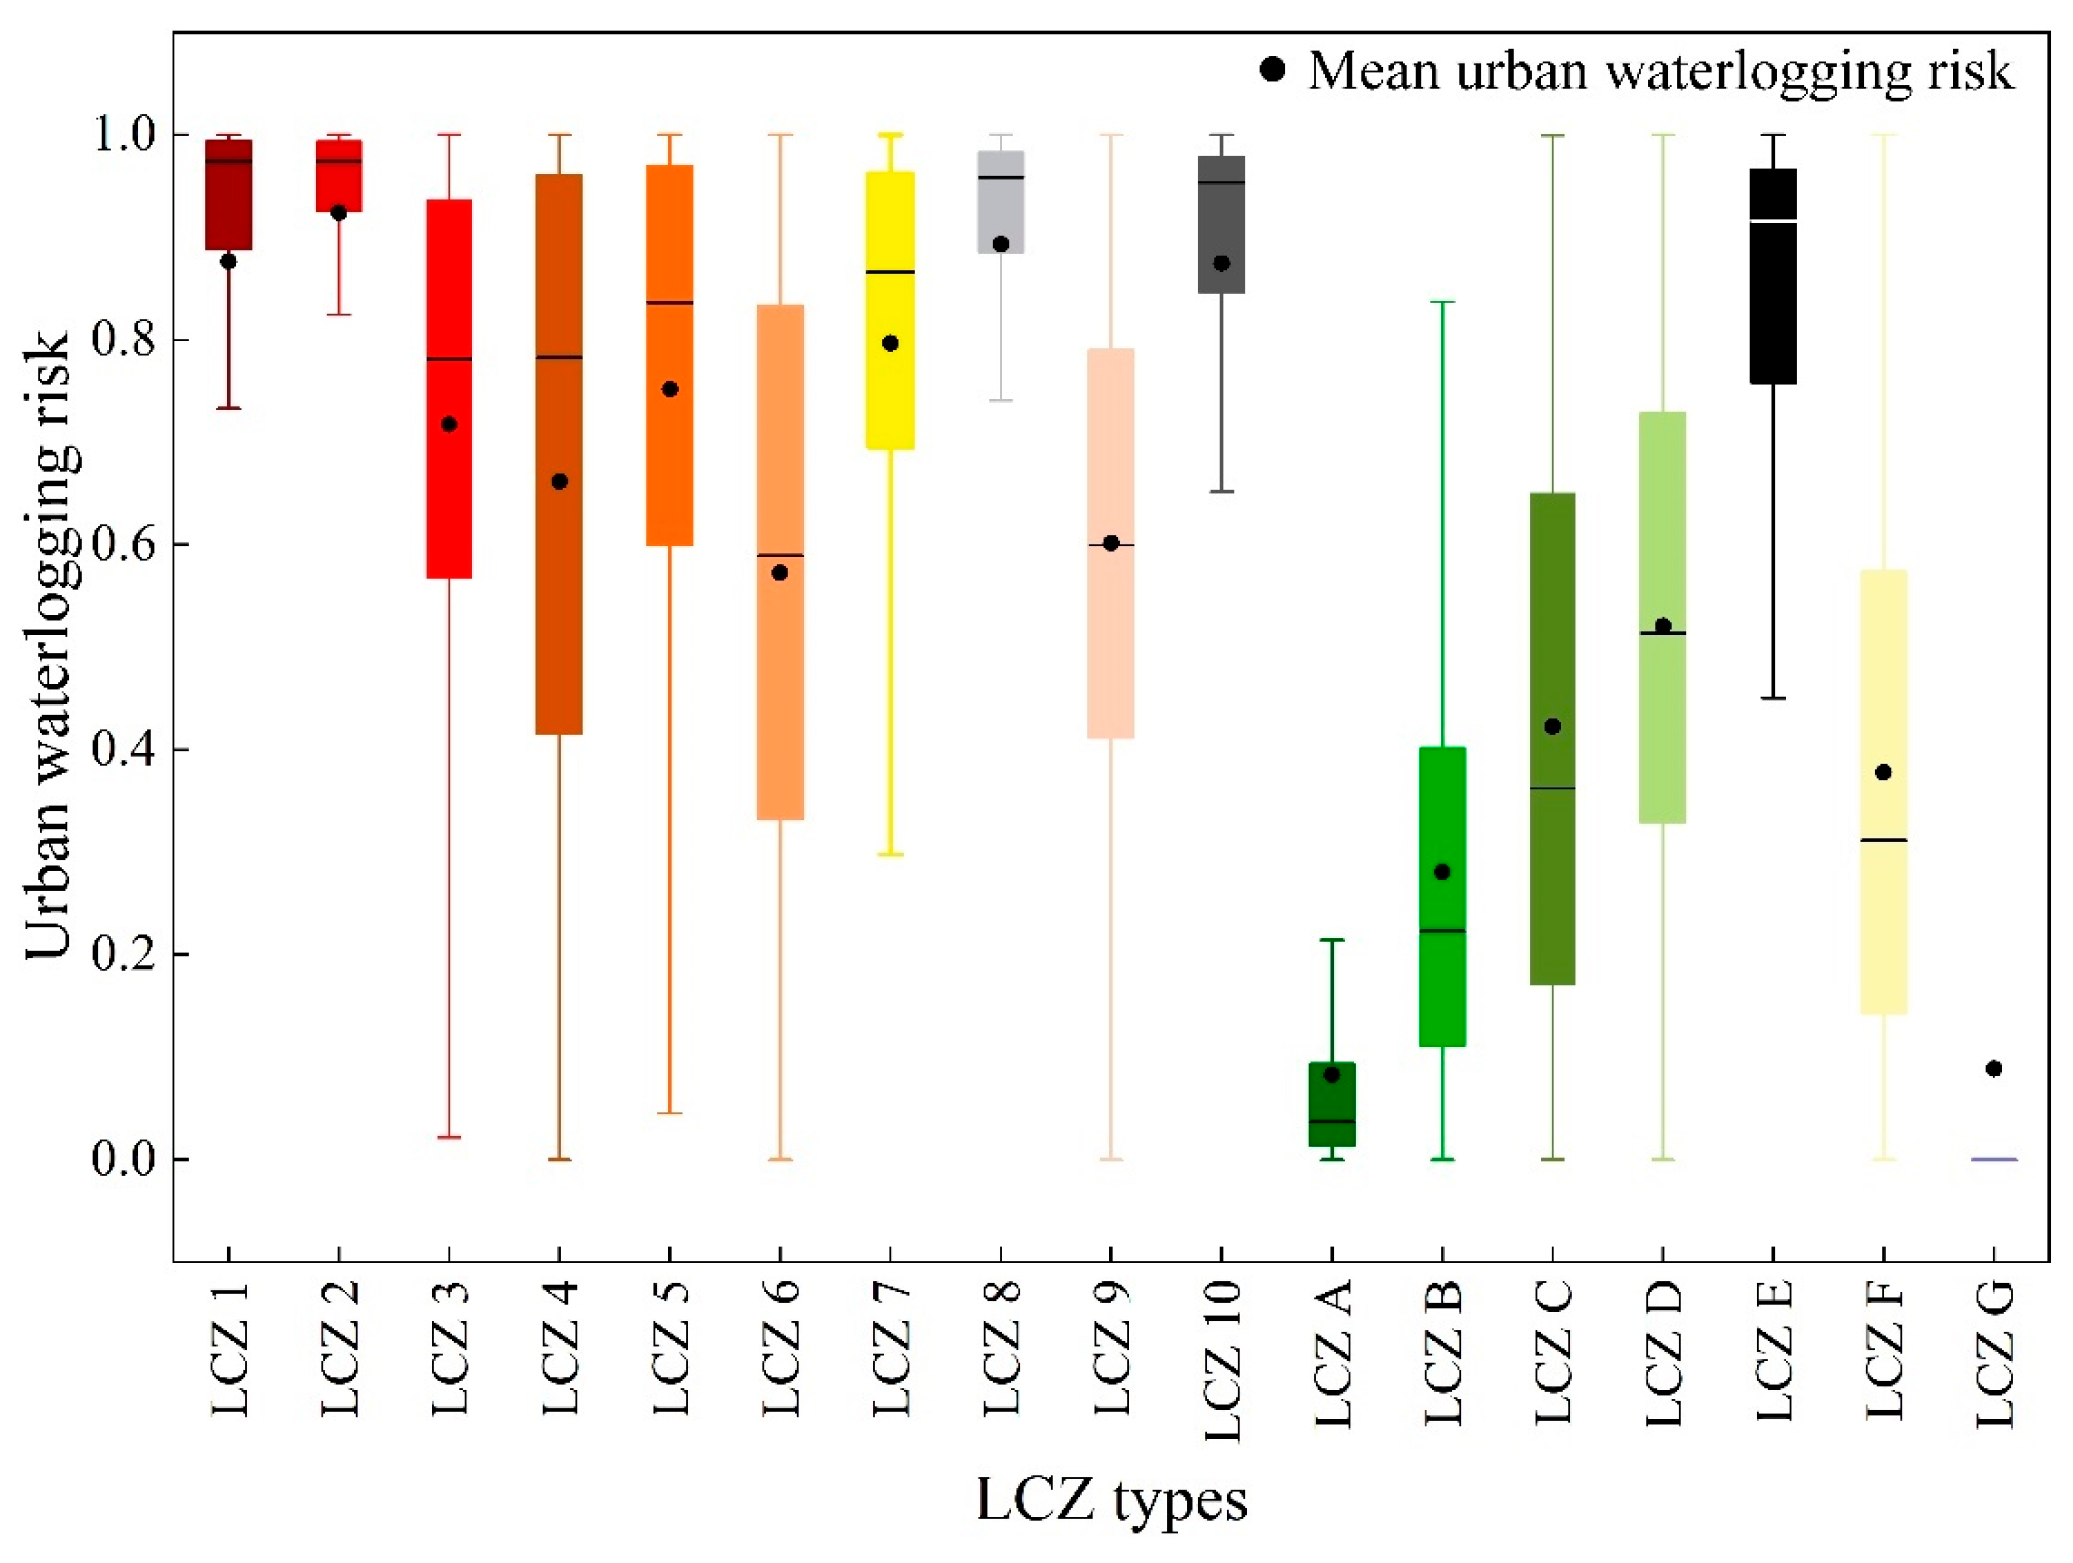
4.3. Urban Waterlogging Risk in Different LCZs

Figure 8 presents the range of waterlogging risks across different LCZs after normalization. Overall, with the exception of LCZ E, the waterlogging risks for built-up types are significantly higher than those for land cover types. Among the built-up types, neighborhood types with low-permeability paving (LCZ 1, LCZ 2, LCZ 8, LCZ 10) generally have higher average waterlogging risks compared to those with high-permeability paving (LCZ 4, LCZ 5, LCZ 6, LCZ 9). Additionally, the range of waterlogging risks for low-permeability paved neighborhood types is smaller than that for high-permeability paved types. LCZ 4 has the smallest range with an interquartile range of 0.068, while LCZ 4 has the largest range with an interquartile range of 0.546.
Notably, among the land cover types, LCZ E, which is characterized by bare rock or paved surfaces with high impermeability, shows a much higher waterlogging risk compared to other land cover types. Furthermore, from LCZ A to LCZ D, as the proportion of permeable paving and vegetation decreases, the waterlogging risk gradually increases, indicating that permeable paving and vegetation help reduce urban waterlogging risk. This trend also reflects the geographical context: LCZ A is mainly found in hilly areas and urban parks, whereas LCZ D is located in relatively flat areas where rainwater is more likely to accumulate, increasing the risk of waterlogging.

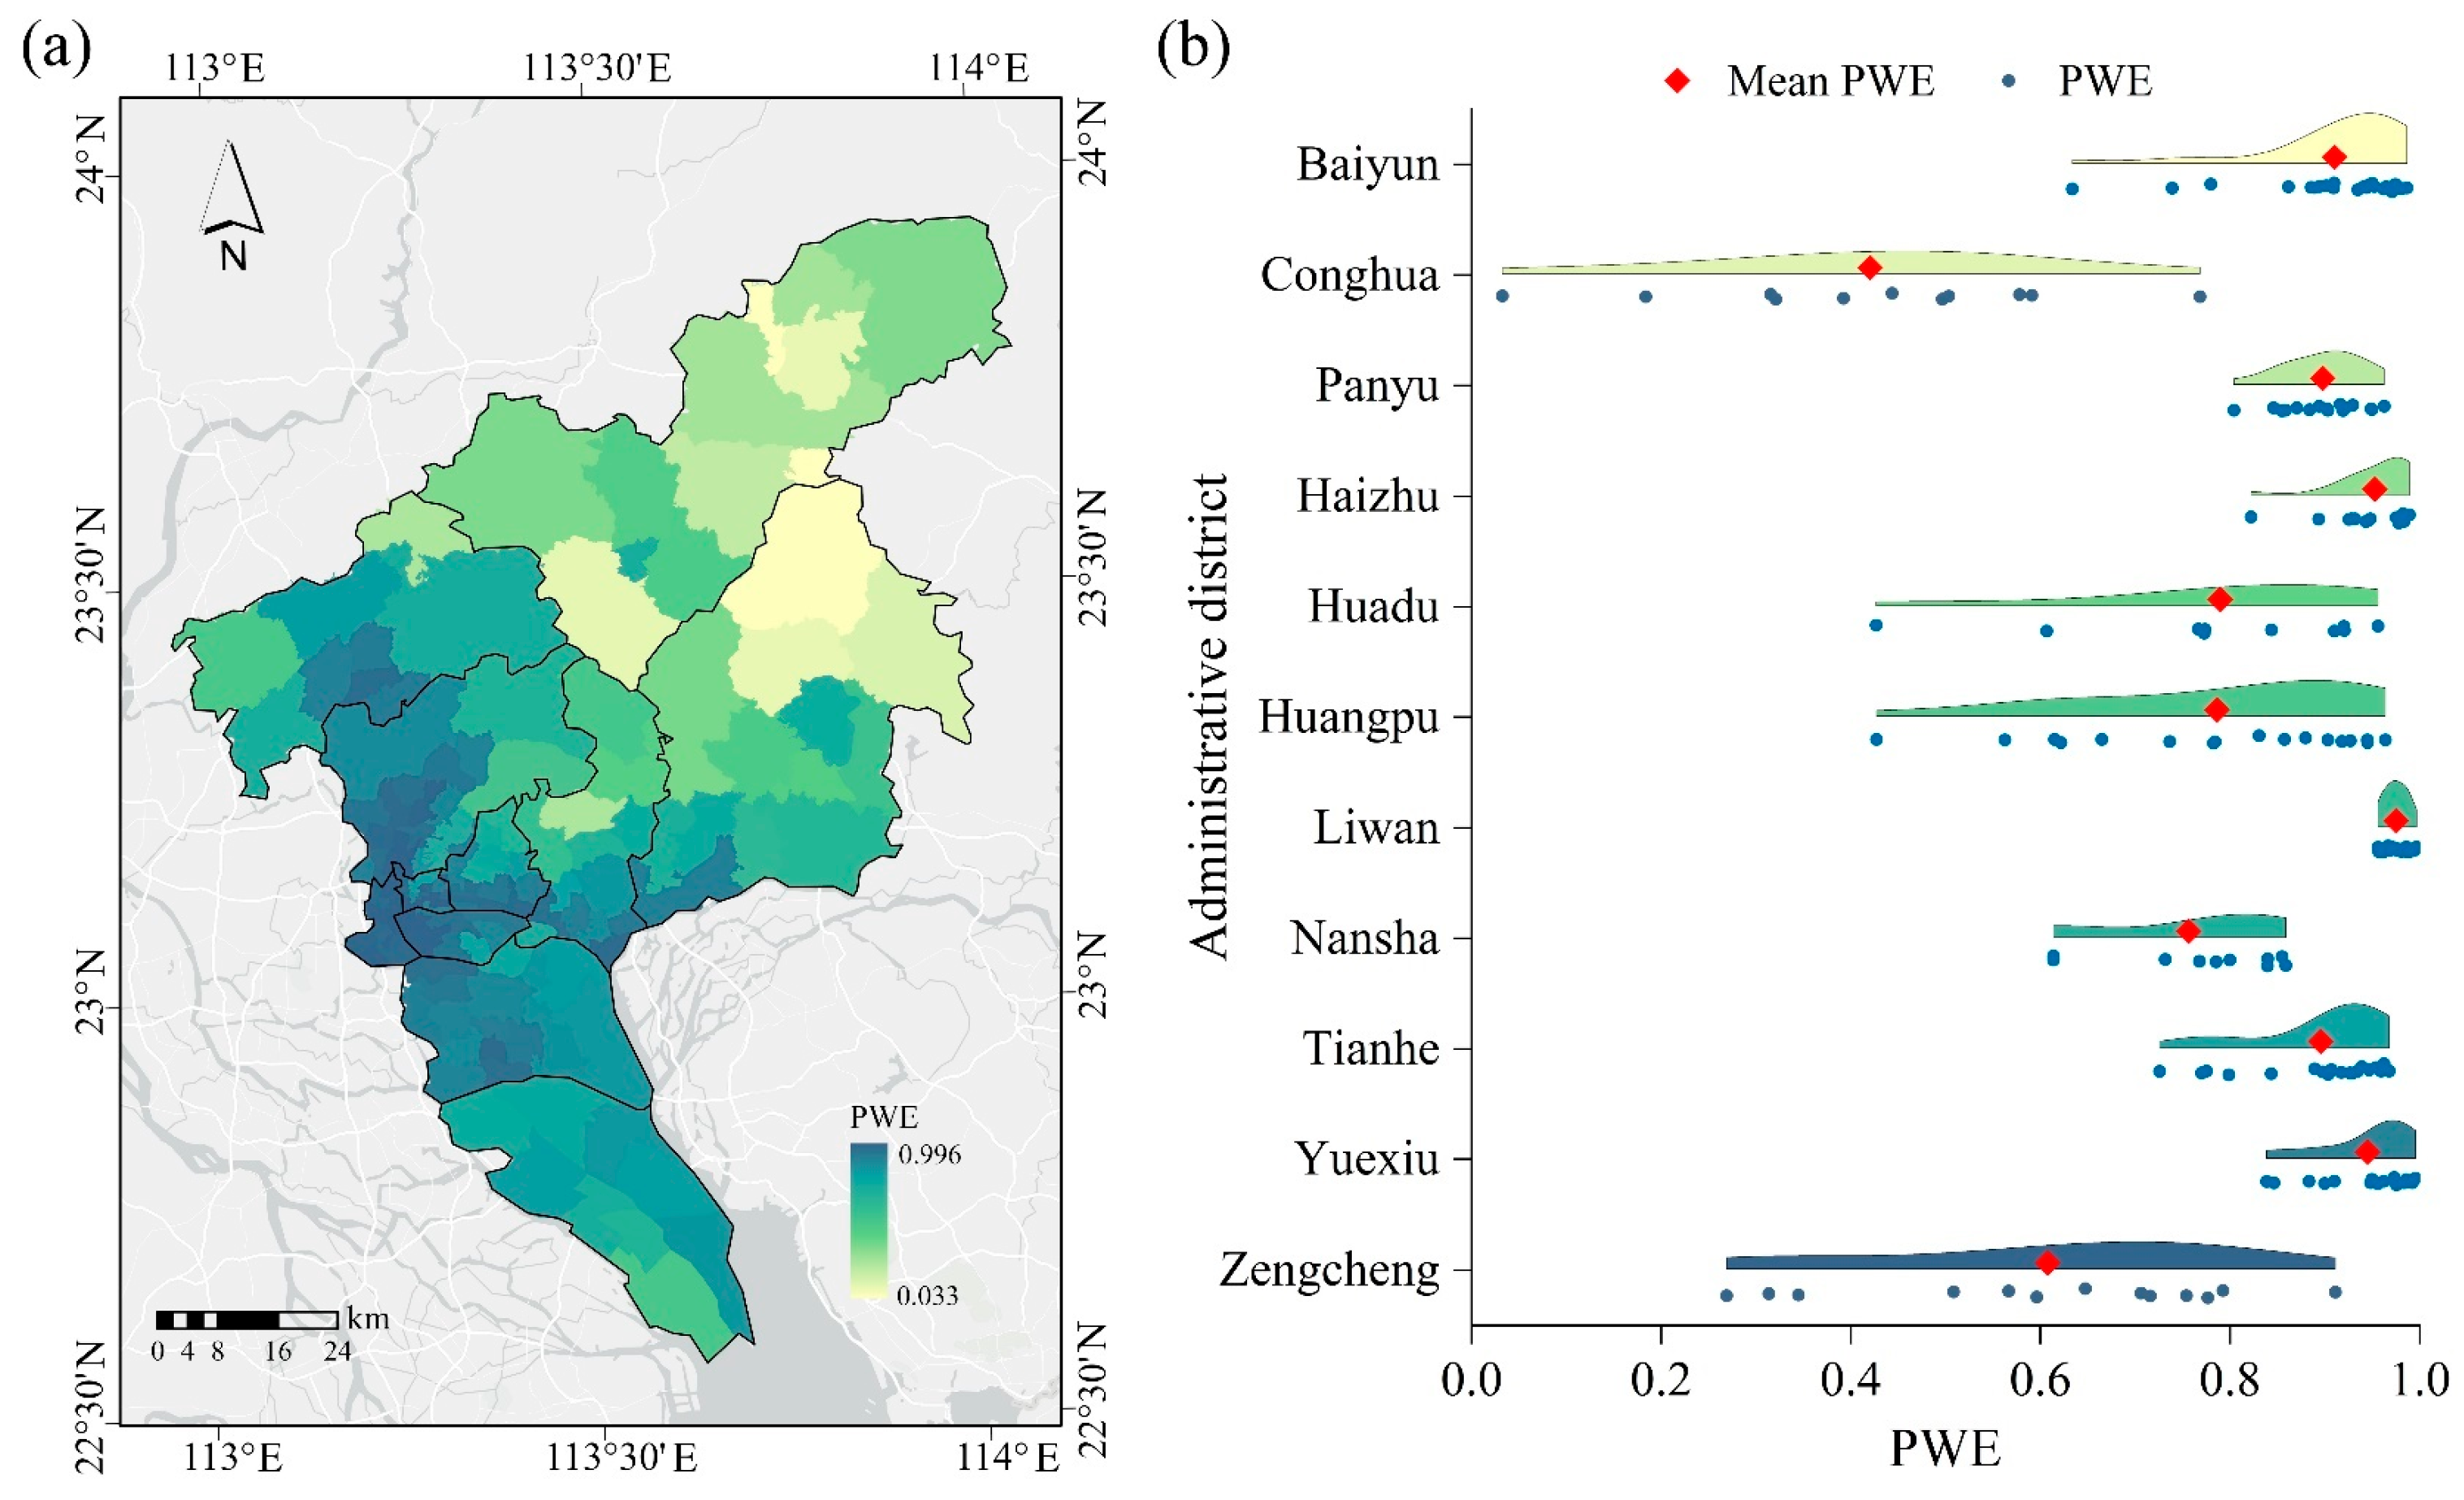
4.4. Waterlogging Exposure Distribution in Different Streets

The study calculated the normalized population-weighted exposure (PWE) to waterlogging risk for different streets in Guangzhou, as shown in Figure 9a. The results indicate that areas dominated by built-up types exhibit higher PWE values. High PWE is concentrated in central areas, such as Liwan, southern Yuexiu, southern Tianhe, and western Haizhu. Low PWE is mainly found in the northern areas, such as Conghua and Zengcheng. PWE decreases gradually from the city center to the suburban centers.
Statistical results (Figure 9b) show that the average PWE for administrative units is highest in Liwan District, with an average PWE of 0.975. This is followed by Haizhu, Yuexiu, Baiyun, Panyu, Tianhe, Huadu, Huangpu, Nansha, Zengcheng, and Conghua, with average PWEs of 0.952, 0.944, 0.910, 0.897, 0.895, 0.789, 0.786, 0.756, 0.607, and 0.420, respectively. Additionally, the distribution of PWE within Liwan District is more concentrated, ranging from 0.956 to 0.996. Conversely, Conghua exhibits the largest range of PWE distribution, from 0.032 to 0.768. Notably, within the same administrative district, streets with PWE values above the average tend to have a more concentrated distribution of PWE, while those with PWE values below the average display a broader range of PWE distribution. This trend is evident in districts such as Baiyun, Tianhe, and Yuexiu.

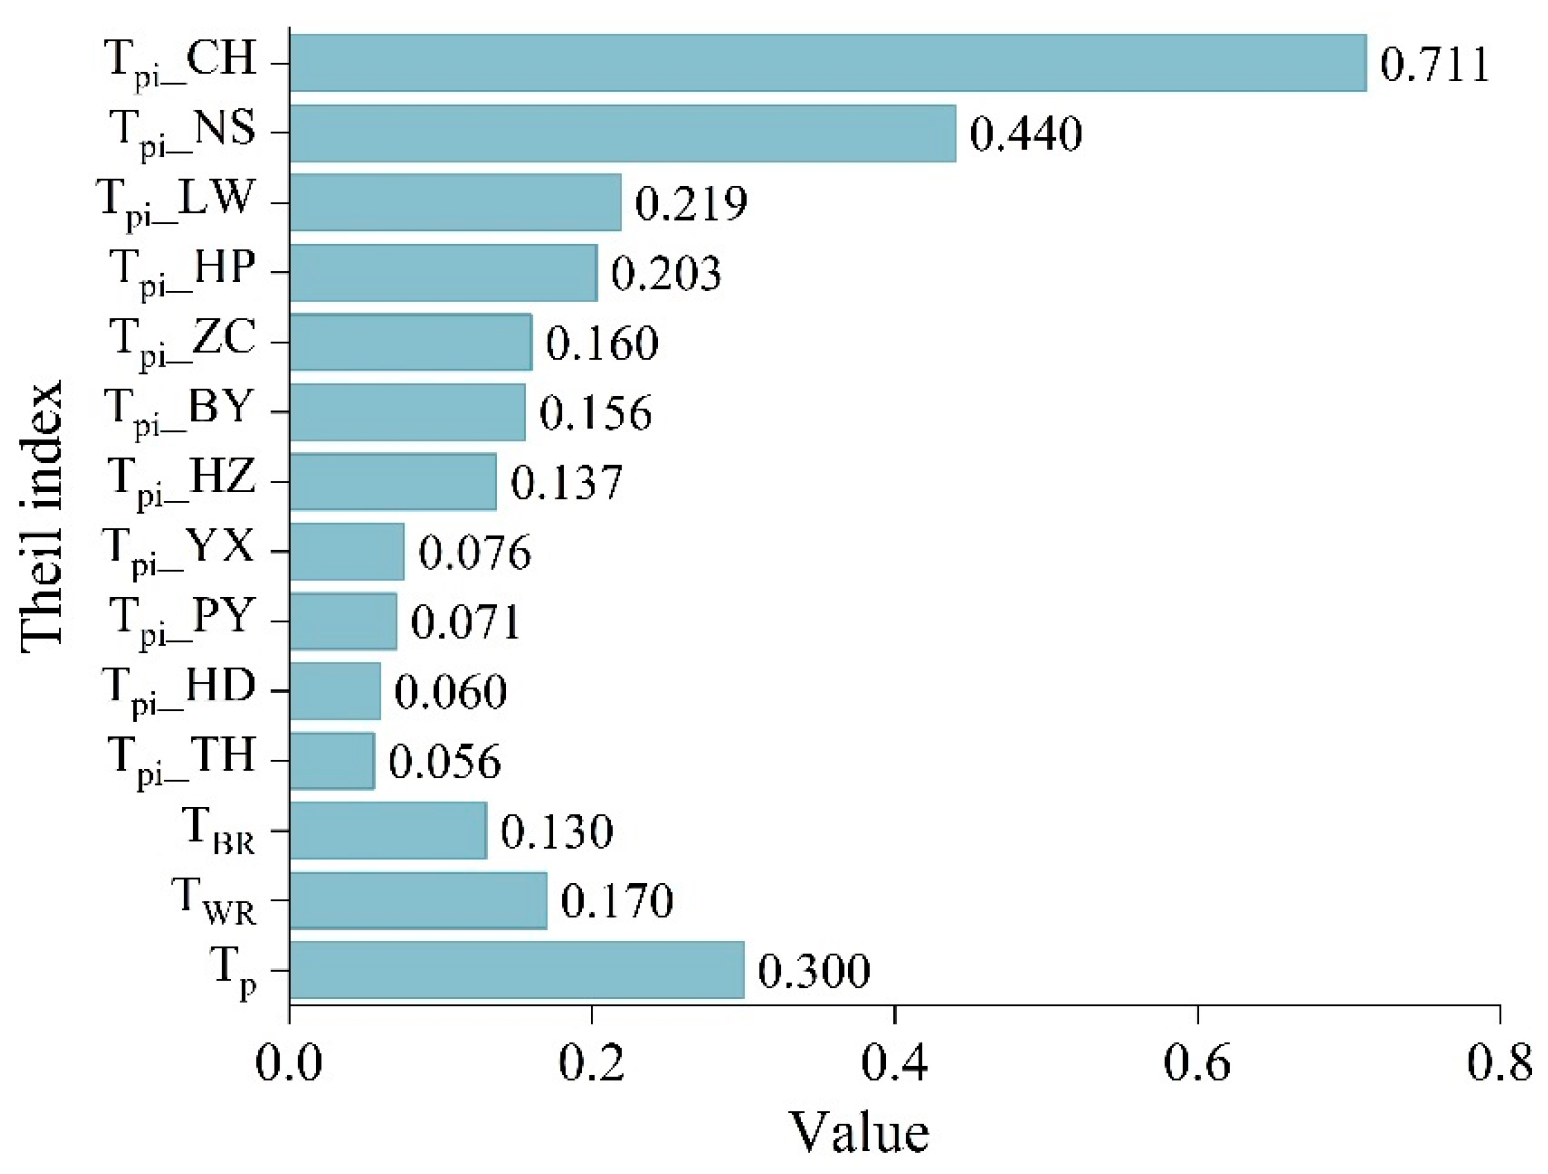
4.5. Theil Index of Different Streets

The Theil index calculation results for Guangzhou are shown in Figure 10. Overall, the total difference in PWE (Tp) for Guangzhou is 0.30. The difference between different administrative districts (TBR) is 0.13, and the difference between streets within the same district (TWR) is 0.17, indicating that the inter-district differences in Guangzhou are lower than the intra-district differences.
Among the districts, Conghua exhibits the largest disparity between its various streets, with a Tpi of 0.711. This is followed by Nansha, Liwan, Huangpu, Zengcheng, Baiyun, Haizhu, Yuexiu, Panyu, Huadu, and Tianhe, with Tpi of 0.440, 0.219, 0.203, 0.160, 0.156, 0.137, 0.076, 0.071, 0.060, and 0.056, respectively. Four districts have Tpi higher than the TWR, while the rest are lower. Despite Liwan’s more concentrated PWE range (Figure 9b), it exhibits higher disparities. Conversely, Huadu, with a broader PWE range distribution, shows lower street disparities, reflecting the impact of population quantity and distribution on exposure levels.

4.6. Discussion

To comprehensively assess the relationship between urban morphology and urban waterlogging risk, this study established an evaluation framework as shown in Figure 3 and successfully applied it to Guangzhou. This model proposes a practical method to map the waterlogging risk in Guangzhou and corresponding urban morphology types by identifying waterlogging risks and delineating urban block types. It further calculates the differences in waterlogging risk exposure among residents in different streets, promoting urban environmental equity. Technically, the results demonstrate that using the spatial weight naive Bayes (WNB) model combined with the WUDAPT method can effectively and accurately map waterlogging risk and LCZ classification. By incorporating geographic spatial information weights into the naive Bayes model, it is possible to effectively calculate the relationship between spatial driving factors and urban waterlogging risk. This method transforms point data of waterlogging incidents into regional waterlogging risk levels, highlighting potential areas of urban waterlogging. The advantages of the WNB method in flood risk prediction have been demonstrated across multiple studies, showing superior performance compared to conventional machine learning models, and being able to better show the spatial distribution of waterlogging risk [38,39,54]. Additionally, the WUDAPT method, which integrates remote sensing data and random forest classification, provides a global LCZ classification approach. It avoids the limitations of GIS classification methods, which are restricted to cities with comprehensive urban data. In this study, the classification accuracy reached 0.86, which shows a slight improvement compared to the accuracy of 0.855 achieved by Zou et al. in Guangzhou using a GIS-based method for mapping LCZs [26], and our approach did not require detailed urban data, meeting the research requirements. In addition, when compared to the overall accuracy of 82.84% achieved in the LCZ classification by Xu et al., this study demonstrates the precision of our results [55].
In this study, different LCZs reflect various urban built environments, involving 2D/3D morphological indicators that potentially affect urban waterlogging risk. Although LCZ 6, characterized by open arrangement of low-rise buildings, was identified as the most widespread built-up type in Guangzhou, covering 10.26% of the total area, it only recorded 91 waterlogging points, ranking fourth among all built-up types. Conversely, LCZ 2 recorded the highest number of waterlogging points, with a total of 329 (Figure 7b). In terms of the proportion of high-risk areas in different LCZ types, the highest are LCZ 2, LCZ 1, LCZ 8, and LCZ 10 (Figure 7d). These LCZ types share similar 2D morphological characteristics, mainly consisting of impervious surfaces with little or no vegetation cover. In built-up areas facing heavy rainfall, impervious surfaces cannot absorb rainwater, leading to surface runoff and, if the urban drainage system cannot handle the volume, resulting in urban waterlogging. This finding aligns with the research by Huang et al., which also indicates that high-rise, mid-rise buildings, and densely built areas are associated with higher flood risk [56]. Interestingly, LCZ E, a land cover type characterized by featureless landscapes of rock or paved cover with few or no trees or plants, corroborates this viewpoint. Despite being a land cover type, LCZ E is almost entirely impervious. The high-risk area of LCZ E accounts for 5.57% of its total area, the highest among all land cover types. Overall, land cover types with pervious surfaces have lower waterlogging risk areas compared to built-up types with impervious surfaces. Figure 8 shows that as impervious surfaces increase and vegetation cover decreases, the urban waterlogging risk gradually rises. This is consistent with numerous studies that have indicated that urbanization increases flood risk, showing a positive relationship between flood risk and the proportion and spatial distribution of impervious surfaces [57,58,59].
Moreover, environmental equity is becoming an increasingly important focus of social development. Reflecting China’s people-oriented development philosophy, it ensures that vulnerable groups in the environment receive more attention. This evaluation framework incorporates assessments of residents’ exposure to waterlogging risk and the fairness of this exposure in the results of urban waterlogging risk. The results show that areas with higher built-up levels have higher PWE, meaning residents face a greater waterlogging risk. These areas also tend to have higher population density, increasing the number of people exposed to waterlogging risk. Differences between districts in Guangzhou are smaller than those between different streets within the same district. Areas with greater variation in built environments generally have larger disparities in environmental equity, such as Conghua, which is predominantly forested, with an inter-street disparity reaching 0.711. Additionally, equity disparities are also related to population distribution patterns. Even in Liwan, where PWE distribution among different streets is the most concentrated, the inter-street disparity still reaches 0.219.
Despite the advanced nature of this evaluation method, it still has uncertainties and limitations. LCZ types represent comprehensive block morphology, consisting of multiple spatial morphological factors. While the WUDAPT method overcomes some drawbacks of GIS methods, it cannot obtain precise individual spatial morphological factors for each block, making it challenging to further quantitatively assess the impact of 2D/3D morphology on urban waterlogging risk. Future research needs to refine our methods to achieve more accurate results.

5. Conclusions

This study proposes an urban waterlogging assessment model that measures the relationship between different urban block types and waterlogging risk, and further evaluates the environmental equity differences between different streets. The main conclusions of the study are as follows: (1) The built-up area of Guangzhou is primarily concentrated in the central urban area, with built-up types and land cover types accounting for 28.05% and 71.95% of the total area, respectively. Among the built-up types, LCZ 6 has the largest area proportion at 10.26%, followed by LCZ 8 (5.46%), LCZ 2 (5.07%), and LCZ 4 (3.31%). Among the land cover types, LCZ A has the largest area at 42.63%, followed by LCZ D at 15.14% (Figure 6). (2) A total of 907 waterlogging points were identified in the study area, most of which are concentrated in built-up areas (Figure 7). LCZ 2 identified the most waterlogging points, with 329, followed by LCZ 4 with 204. In terms of risk levels, 16.29% of Guangzhou’s area faces waterlogging risk (referring “low” to “high”). In LCZ 2, 13.06% of the area is a high waterlogging risk, followed by LCZ 1, LCZ 8, and LCZ 10, with high-risk areas accounting for 11.42%, 8.37%, and 6.26%, respectively. These LCZ types are characterized by impervious surfaces as the dominant ground cover. Among the land cover types, as the proportion of impervious surfaces increases and vegetation decreases, the waterlogging risk also gradually increases (from LCZ A to LCZ E) (Figure 7). This reflects that the proportion of impervious surfaces significantly influences urban waterlogging risk levels. (3) The central urban area has higher waterlogging exposure levels, with the highest average PWE in Liwan at 0.975, followed by Haizhu, Yuexiu, and Baiyun. Administrative districts with more diverse built environments have a wider range of PWE, such as Conghua and Zengcheng, which have both built-up areas and extensive vegetation. Additionally, the Theil index for Guangzhou is 0.30, with intra-district disparities (0.17) being greater than inter-district disparities (0.13). Conghua has the lowest equity index with a Tpi of 0.711, while Tianhe has the highest equity index with a Theil index of 0.056.
This study effectively and accurately explores the relationship between urban waterlogging risk and urban morphology, identifying equity differences among blocks. The study provides valuable insights for urban planners and city decision-makers, aiding in the formulation of urban suitability strategies under flood risk, ensuring that residents enjoy an equally fair urban environment.

Author Contributions

Conceptualization, B.Z. and Y.N.; methodology, B.Z., Y.N. and R.L.; validation, M.W., J.L. and C.F.; formal analysis, B.Z. and Y.N.; investigation, Y.N. and R.L.; resources, M.W. and J.L.; data curation, M.W. and C.F.; writing—original draft preparation, B.Z.; writing—review and editing, C.F. and J.L.; visualization, Y.N. and R.L.; supervision, M.W. and C.F.; project administration, M.W., X.Z. and C.F.; funding acquisition, C.F. All authors have read and agreed to the published version of the manuscript.

Funding

This research was funded by Guangdong Basic and Applied Basic Research (No. 2023A1515012138), the Open Foundation of the State Key Laboratory of Subtropical Building and Urban Science (No. 2023KA01), the Guangdong Philosophy and Social Science Planning Project (No. GD24YGL28), and the Science and Technology Program of Guangzhou University (No. PT252022006). This paper is also supported by the Guangzhou University Graduate Innovation Ability Development Program.

Data Availability Statement

We. The datasets generated and analyzed during the current study are available from the corresponding author on reasonable request.

Conflicts of Interest

The authors declare that they have no known competing financial interests or personal relationships that could have appeared to influence the work reported in this paper.

Nomenclature

LCZLocal climate zones
DEMDigital Elevation Model
DWDistance to the waterway
FVCFractional vegetation cover
ISFImpervious surface fraction
PWEPopulation-weighted exposure
RDRoad density
SWRSoil water retention
WNBWeighted naive Bayes
WUDAPTWorld Urban Database and Access Portal Tools

References

  1. Liang, L.; Song, Y.; Shao, Z.; Zheng, C.; Liu, X.; Li, Y. Exploring the Causal Relationships and Pathways between Ecological Environmental Quality and Influencing Factors: A Comprehensive Analysis. Ecol. Indic. 2024, 165, 112192. [Google Scholar] [CrossRef]
  2. Guo, Y.; Zhao, S.; Zhao, X.; Wang, H.; Shi, W. Evaluation of the Spatiotemporal Change of Ecological Quality under the Context of Urban Expansion—A Case Study of Typical Urban Agglomerations in China. Remote Sens. 2024, 16, 45. [Google Scholar] [CrossRef]
  3. Mehmood, U. Assessing the Impacts of Eco-Innovations, Economic Growth, Urbanization on Ecological Footprints in G-11: Exploring the Sustainable Development Policy Options. J. Knowl. Econ. 2024. [Google Scholar] [CrossRef]
  4. World Population Prospects 2022: Methodoology of the United Nations Population Estimates and Projections. 2022. Available online: https://population.un.org/wpp/ (accessed on 20 July 2024).
  5. Tang, Z.; Wang, P.; Li, Y.; Sheng, Y.; Wang, B.; Popovych, N.; Hu, T. Contributions of Climate Change and Urbanization to Urban Flood Hazard Changes in China’s 293 Major Cities since 1980. J. Environ. Manag. 2024, 353, 120113. [Google Scholar] [CrossRef]
  6. Ombadi, M.; Risser, M.D.; Rhoades, A.M.; Varadharajan, C. A Warming-Induced Reduction in Snow Fraction Amplifies Rainfall Extremes. Nature 2023, 619, 305–310. [Google Scholar] [CrossRef]
  7. Myhre, G.; Alterskjær, K.; Stjern, C.W.; Hodnebrog, Ø.; Marelle, L.; Samset, B.H.; Sillmann, J.; Schaller, N.; Fischer, E.; Schulz, M.; et al. Frequency of Extreme Precipitation Increases Extensively with Event Rareness under Global Warming. Sci. Rep. 2019, 9, 16063. [Google Scholar] [CrossRef]
  8. Intergovernmental Panel on Climate Change (IPCC). Climate Change 2021—The Physical Science Basis: Working Group I Contribution to the Sixth Assessment Report of the Intergovernmental Panel on Climate Change; Cambridge University Press: Cambridge, UK, 2023. [Google Scholar]
  9. Zhang, D.L.; Lin, Y.; Zhao, P.; Yu, X.; Wang, S.; Kang, H.; Ding, Y. The Beijing Extreme Rainfall of 21 July 2012: “Right Results” but for Wrong Reasons. Geophys. Res. Lett. 2013, 40, 1426–1431. [Google Scholar] [CrossRef]
  10. Qi, Y.; Chan, F.K.; Thorne, C.; O’Donnell, E.; Quagliolo, C.; Comino, E.; Pezzoli, A.; Li, L.; Griffiths, J.; Sang, Y.; et al. Addressing Challenges of Urban Water Management in Chinese Sponge Cities via Nature-Based Solutions. Water 2020, 12, 2788. [Google Scholar] [CrossRef]
  11. Wang, M.; Li, Y.; Yuan, H.; Zhou, S.; Wang, Y.; Adnan Ikram, R.M.; Li, J. An XGBoost-SHAP Approach to Quantifying Morphological Impact on Urban Flooding Susceptibility. Ecol. Indic. 2023, 156, 111137. [Google Scholar] [CrossRef]
  12. Li, Z.; Wang, Z.; Wu, L.; Huang, W.; Peng, W. Evaluating the Effect of Building Patterns on Urban Flooding Based on a Boosted Regression Tree: A Case Study of Beijing, China. Hydrol. Process. 2023, 37, e14932. [Google Scholar] [CrossRef]
  13. Qian, Y.; Chakraborty, T.C.; Li, J.; Li, D.; He, C.; Sarangi, C.; Chen, F.; Yang, X.; Leung, L.R. Urbanization Impact on Regional Climate and Extreme Weather: Current Understanding, Uncertainties, and Future Research Directions. Adv. Atmos. Sci. 2022, 39, 819–860. [Google Scholar] [CrossRef] [PubMed]
  14. Liu, J.; Niyogi, D. Meta-Analysis of Urbanization Impact on Rainfall Modification. Sci. Rep. 2019, 9, 7301. [Google Scholar] [CrossRef] [PubMed]
  15. Zhang, W.; Villarini, G.; Vecchi, G.A.; Smith, J.A. Urbanization Exacerbated the Rainfall and Flooding Caused by Hurricane Harvey in Houston. Nature 2018, 563, 384–388. [Google Scholar] [CrossRef]
  16. Gu, Y.; Li, D. A Modeling Study of the Sensitivity of Urban Heat Islands to Precipitation at Climate Scales. Urban Clim. 2018, 24, 982–993. [Google Scholar] [CrossRef]
  17. Fu, Y.; Jiang, S.; Mao, Y.; Wu, G. Urbanization Reshapes Extreme Precipitation Metrics in Typical Urban Agglomerations of Eastern China. Atmos. Res. 2024, 300, 107253. [Google Scholar] [CrossRef]
  18. Li, C.; Sun, N.; Lu, Y.; Guo, B.; Wang, Y.; Sun, X.; Yao, Y. Review on Urban Flood Risk Assessment. Sustainability 2023, 15, 765. [Google Scholar] [CrossRef]
  19. Wang, Y.; Xie, X.; Liang, S.; Zhu, B.; Yao, Y.; Meng, S.; Lu, C. Quantifying the Response of Potential Flooding Risk to Urban Growth in Beijing. Sci. Total Environ. 2020, 705, 135868. [Google Scholar] [CrossRef]
  20. Mei, C.; Shi, H.; Liu, J.; Song, T.; Wang, J.; Gao, X.; Wang, H.; Li, M. Analyzing Urban Form Influence on Pluvial Flooding via Numerical Experiments Using Random Slices of Actual City Data. J. Hydrol. 2024, 633, 130916. [Google Scholar] [CrossRef]
  21. Bruwier, M.; Mustafa, A.; Aliaga, D.G.; Archambeau, P.; Erpicum, S.; Nishida, G.; Zhang, X.; Pirotton, M.; Teller, J.; Dewals, B. Influence of Urban Pattern on Inundation Flow in Floodplains of Lowland Rivers. Sci. Total Environ. 2018, 622–623, 446–458. [Google Scholar] [CrossRef]
  22. Lin, J.; He, P.; Yang, L.; He, X.; Lu, S.; Liu, D. Predicting Future Urban Waterlogging-Prone Areas by Coupling the Maximum Entropy and FLUS Model. Sustain. Cities Soc. 2022, 80, 103812. [Google Scholar] [CrossRef]
  23. Stewart, I.D.; Oke, T.R. Local Climate Zones for Urban Temperature Studies. Bull. Am. Meteorol. Soc. 2012, 93, 1879–1900. [Google Scholar] [CrossRef]
  24. Zhang, L.; Nikolopoulou, M.; Guo, S.; Song, D. Impact of LCZs Spatial Pattern on Urban Heat Island: A Case Study in Wuhan, China. Build. Environ. 2022, 226, 109785. [Google Scholar] [CrossRef]
  25. Fan, C.; Zou, B.; Li, J.; Wang, M.; Liao, Y.; Zhou, X. Exploring the Relationship between Air Temperature and Urban Morphology Factors Using Machine Learning under Local Climate Zones. Case Stud. Therm. Eng. 2024, 55, 104151. [Google Scholar] [CrossRef]
  26. Zou, B.; Fan, C.; Li, J. Quantifying the Influence of Different Block Types on the Urban Heat Risk in High-Density Cities. Buildings 2024, 14, 2131. [Google Scholar] [CrossRef]
  27. Bechtel, B.; Demuzere, M.; Mills, G.; Zhan, W.; Sismanidis, P.; Small, C.; Voogt, J. SUHI Analysis Using Local Climate Zones—A Comparison of 50 Cities. Urban Clim. 2019, 28, 100451. [Google Scholar] [CrossRef]
  28. Zhou, L.; Yuan, B.; Hu, F.; Wei, C.; Dang, X.; Sun, D. Understanding the Effects of 2D/3D Urban Morphology on Land Surface Temperature Based on Local Climate Zones. Build. Environ. 2022, 208, 108578. [Google Scholar] [CrossRef]
  29. Yang, J.; Ren, J.; Sun, D.; Xiao, X.; Xia, J.; Jin, C.; Li, X. Understanding Land Surface Temperature Impact Factors Based on Local Climate Zones. Sustain. Cities Soc. 2021, 69, 102818. [Google Scholar] [CrossRef]
  30. Ching, J.; Mills, G.; Bechtel, B.; See, L.; Feddema, J.; Wang, X.; Ren, C.; Brousse, O.; Martilli, A.; Neophytou, M.; et al. WUDAPT: An Urban Weather, Climate, and Environmental Modeling Infrastructure for the Anthropocene. Bull. Am. Meteorol. Soc. 2018, 99, 1907–1924. [Google Scholar] [CrossRef]
  31. Palla, A.; Gnecco, I. Hydrologic Modeling of Low Impact Development Systems at the Urban Catchment Scale. J. Hydrol. 2015, 528, 361–368. [Google Scholar] [CrossRef]
  32. Mosavi, A.; Ozturk, P.; Chau, K. Flood Prediction Using Machine Learning Models: Literature Review. Water 2018, 10, 1536. [Google Scholar] [CrossRef]
  33. Rafiei-Sardooi, E.; Azareh, A.; Choubin, B.; Mosavi, A.H.; Clague, J.J. Evaluating Urban Flood Risk Using Hybrid Method of TOPSIS and Machine Learning. Int. J. Disaster Risk Reduct. 2021, 66, 102614. [Google Scholar] [CrossRef]
  34. Seydi, S.T.; Kanani-Sadat, Y.; Hasanlou, M.; Sahraei, R.; Chanussot, J.; Amani, M. Comparison of Machine Learning Algorithms for Flood Susceptibility Mapping. Remote Sens. 2023, 15, 192. [Google Scholar] [CrossRef]
  35. Adnan, M.N. Improving the Random Forest Algorithm by Randomly Varying the Size of the Bootstrap Samples. In Proceedings of the 2014 IEEE 15th International Conference on Information Reuse and Integration (IEEE IRI 2014), Redwood City, CA, USA, 13–15 August 2014; pp. 303–308. [Google Scholar]
  36. Li, H.-X.; Yang, J.-L.; Zhang, G.; Fan, B. Probabilistic Support Vector Machines for Classification of Noise Affected Data. Inf. Sci. 2013, 221, 60–71. [Google Scholar] [CrossRef]
  37. Tang, X.; Li, J.; Liu, M.; Liu, W.; Hong, H. Flood Susceptibility Assessment Based on a Novel Random Naïve Bayes Method: A Comparison between Different Factor Discretization Methods. CATENA 2020, 190, 104536. [Google Scholar] [CrossRef]
  38. Tang, X.; Shu, Y.; Lian, Y.; Zhao, Y.; Fu, Y. A Spatial Assessment of Urban Waterlogging Risk Based on a Weighted Naïve Bayes Classifier. Sci. Total Environ. 2018, 630, 264–274. [Google Scholar] [CrossRef]
  39. Liu, R.; Chen, Y.; Wu, J.; Gao, L.; Barrett, D.; Xu, T.; Li, X.; Li, L.; Huang, C.; Yu, J. Integrating Entropy-Based Naïve Bayes and GIS for Spatial Evaluation of Flood Hazard. Risk Anal. 2017, 37, 756–773. [Google Scholar] [CrossRef]
  40. Ebi, K.L.; Vanos, J.; Baldwin, J.W.; Bell, J.E.; Hondula, D.M.; Errett, N.A.; Hayes, K.; Reid, C.E.; Saha, S.; Spector, J. Extreme Weather and Climate Change: Population Health and Health System Implications. Annu. Rev. Public Health 2021, 42, 293–315. [Google Scholar] [CrossRef]
  41. Demuzere, M.; Orru, K.; Heidrich, O.; Olazabal, E.; Geneletti, D.; Orru, H.; Bhave, A.G.; Mittal, N.; Feliu, E.; Faehnle, M. Mitigating and Adapting to Climate Change: Multi-Functional and Multi-Scale Assessment of Green Urban Infrastructure. J. Environ. Manag. 2014, 146, 107–115. [Google Scholar] [CrossRef]
  42. Hsu, A.; Sheriff, G.; Chakraborty, T.; Manya, D. Disproportionate Exposure to Urban Heat Island Intensity across Major US Cities. Nat. Commun. 2021, 12, 2721. [Google Scholar] [CrossRef]
  43. Guangzhou Statistics Bureau. Available online: https://tjj.gz.gov.cn/ (accessed on 29 July 2024).
  44. Tehrany, M.S.; Pradhan, B.; Mansor, S.; Ahmad, N. Flood Susceptibility Assessment Using GIS-Based Support Vector Machine Model with Different Kernel Types. Catena 2015, 125, 91–101. [Google Scholar] [CrossRef]
  45. Zhang, X.; Liu, L.; Wu, C.; Chen, X.; Gao, Y.; Xie, S.; Zhang, B. Development of a Global 30 m Impervious Surface Map Using Multisource and Multitemporal Remote Sensing Datasets with the Google Earth Engine Platform. Earth Syst. Sci. Data 2020, 12, 1625–1648. [Google Scholar] [CrossRef]
  46. McCuen, R.H. A Guide to Hydrologic Analysis Using SCS Methods; Prentice-Hall, Inc.: Hoboken, NJ, USA, 1982. [Google Scholar]
  47. Johnston, J.H. Theil. Economics and Information Theory. Econ. J. 1969, 79, 601–602. [Google Scholar] [CrossRef]
  48. Zeng, J.; Huang, G. Set Pair Analysis for Karst Waterlogging Risk Assessment Based on AHP and Entropy Weight. Hydrol. Res. 2017, 49, 1143–1155. [Google Scholar] [CrossRef]
  49. Creutzig, F.; Lohrey, S.; Bai, X.; Baklanov, A.; Dawson, R.; Dhakal, S.; Lamb, W.F.; McPhearson, T.; Minx, J.; Munoz, E.; et al. Upscaling Urban Data Science for Global Climate Solutions. Glob. Sustain. 2019, 2, e2. [Google Scholar] [CrossRef]
  50. Bechtel, B.; Alexander, P.J.; Böhner, J.; Ching, J.; Conrad, O.; Feddema, J.; Mills, G.; See, L.; Stewart, I. Mapping Local Climate Zones for a Worldwide Database of the Form and Function of Cities. ISPRS Int. J. Geo-Inf. 2015, 4, 199–219. [Google Scholar] [CrossRef]
  51. Brousse, O.; Georganos, S.; Demuzere, M.; Dujardin, S.; Lennert, M.; Linard, C.; Snow, R.W.; Thiery, W.; van Lipzig, N.P.M. Can We Use Local Climate Zones for Predicting Malaria Prevalence across Sub-Saharan African Cities? Environ. Res. Lett. 2020, 15, 124051. [Google Scholar] [CrossRef]
  52. Li, S.; Wen, R.; Li, J.; Yang, H.; Chen, T.; Zhu, N. Impact of Land Use Landscape Pattern on Carbon Emission Performance in Five Major Urban Agglomerations in China. Econ. Geogr. 2023, 43, 91–102. [Google Scholar] [CrossRef]
  53. Liu, M.; Wang, Y.; Liu, R.; Ding, C.; Zhou, G.; Han, L. How Magnitude of PM2.5 Exposure Disparities Have Evolved across Chinese Urban-Rural Population during 2010–2019. J. Clean. Prod. 2023, 382, 135333. [Google Scholar] [CrossRef]
  54. Tang, X.; Shu, Y.; Liu, W.; Li, J.; Liu, M.; Yu, H. An Optimized Weighted Naïve Bayes Method for Flood Risk Assessment. Risk Anal. 2021, 41, 2301–2321. [Google Scholar] [CrossRef]
  55. Xu, X.; Qiu, W.; Li, W.; Huang, D.; Li, X.; Yang, S. Comparing Satellite Image and GIS Data Classified Local Climate Zones to Assess Urban Heat Island: A Case Study of Guangzhou. Front. Environ. Sci. 2022, 10, 1029445. [Google Scholar] [CrossRef]
  56. Huang, S.; Gan, Y.; Chen, N.; Wang, C.; Zhang, X.; Li, C.; Horton, D.E. Urbanization Enhances Channel and Surface Runoff: A Quantitative Analysis Using Both Physical and Empirical Models over the Yangtze River Basin. J. Hydrol. 2024, 635, 131194. [Google Scholar] [CrossRef]
  57. Du, S.; Shi, P.; Van Rompaey, A.; Wen, J. Quantifying the Impact of Impervious Surface Location on Flood Peak Discharge in Urban Areas. Nat. Hazard. 2015, 76, 1457–1471. [Google Scholar] [CrossRef]
  58. Xu, T.; Xie, Z.; Zhao, F.; Li, Y.; Yang, S.; Zhang, Y.; Yin, S.; Chen, S.; Li, X.; Zhao, S.; et al. Permeability Control and Flood Risk Assessment of Urban Underlying Surface: A Case Study of Runcheng South Area, Kunming. Nat. Hazard. 2022, 111, 661–686. [Google Scholar] [CrossRef]
  59. Feng, B.; Zhang, Y.; Bourke, R. Urbanization Impacts on Flood Risks Based on Urban Growth Data and Coupled Flood Models. Nat. Hazard. 2021, 106, 613–627. [Google Scholar] [CrossRef]
Figure 1. The geographic location of Guangzhou, China.
Water 16 02464 g001
Figure 2. The spatial distribution of seven risk factors.
Water 16 02464 g002
Figure 3. The framework of assessing the relationship between urban morphology and waterlogging.
Water 16 02464 g003
Figure 4. The flowchart of spatial weight naive Bayes model.
Water 16 02464 g004
Figure 5. Classification of local climatic zones [23].
Water 16 02464 g005
Figure 6. WUDAPT based classification result: (a) LCZ mapping, (b) proportion of LCZ types.
Water 16 02464 g006
Figure 7. The spatial distribution of (a) waterlogging points, (c) waterlogging risk levels, and the proportion of (b) waterlogging points, (d) waterlogging risk levels within different LCZs.
Water 16 02464 g007
Figure 8. Boxplot diagram of urban waterlogging risk.
Water 16 02464 g008
Figure 9. The distribution of PWE: (a) spatial distribution, and (b) statistical distribution in different administrative districts.
Water 16 02464 g009
Figure 10. The results of the Theil index.
Water 16 02464 g010
Table 1. Date acquisition.
ThemeSourcesResolutionApplication
WaterloggingGuangzhou Water Authority (https://swj.gz.gov.cn/index.html)
Toutiao (https://www.toutiao.com/)
pointWaterlogging risk mapping
DEMResource and Environmental Science Data Platform (https://www.resdc.cn/) (accessed on 6 April 2024)30 mDEM, SLOPE mapping
WaterwayOpenStreetMap (https://www.openstreetmap.org/) (accessed on 6 April 2024)PolygonDW calculating
RoadOpenStreetMap (https://www.openstreetmap.org/)PolylineRD calculating
Soil typeResource and Environmental Science Data Platform (https://www.resdc.cn/)30 mSWR calculating
Fractional vegetation coverLandsat 8 Operational Land Imager_Thermal Infrared Sensor30 mFVC mapping
Impervious surface fractionZhang et al. [45]30 mISF mapping
Disclaimer/Publisher’s Note: The statements, opinions and data contained in all publications are solely those of the individual author(s) and contributor(s) and not of MDPI and/or the editor(s). MDPI and/or the editor(s) disclaim responsibility for any injury to people or property resulting from any ideas, methods, instructions or products referred to in the content.

