

Identifying Water–Energy–Carbon Links in Urban Water Sectors: A Case Study of Incheon Metropolitan City, Republic of Korea

 , ,
, , 
Abstract
1. Introduction
2. Materials and Methods
2.1. Urban Water Sectors (UWSs)
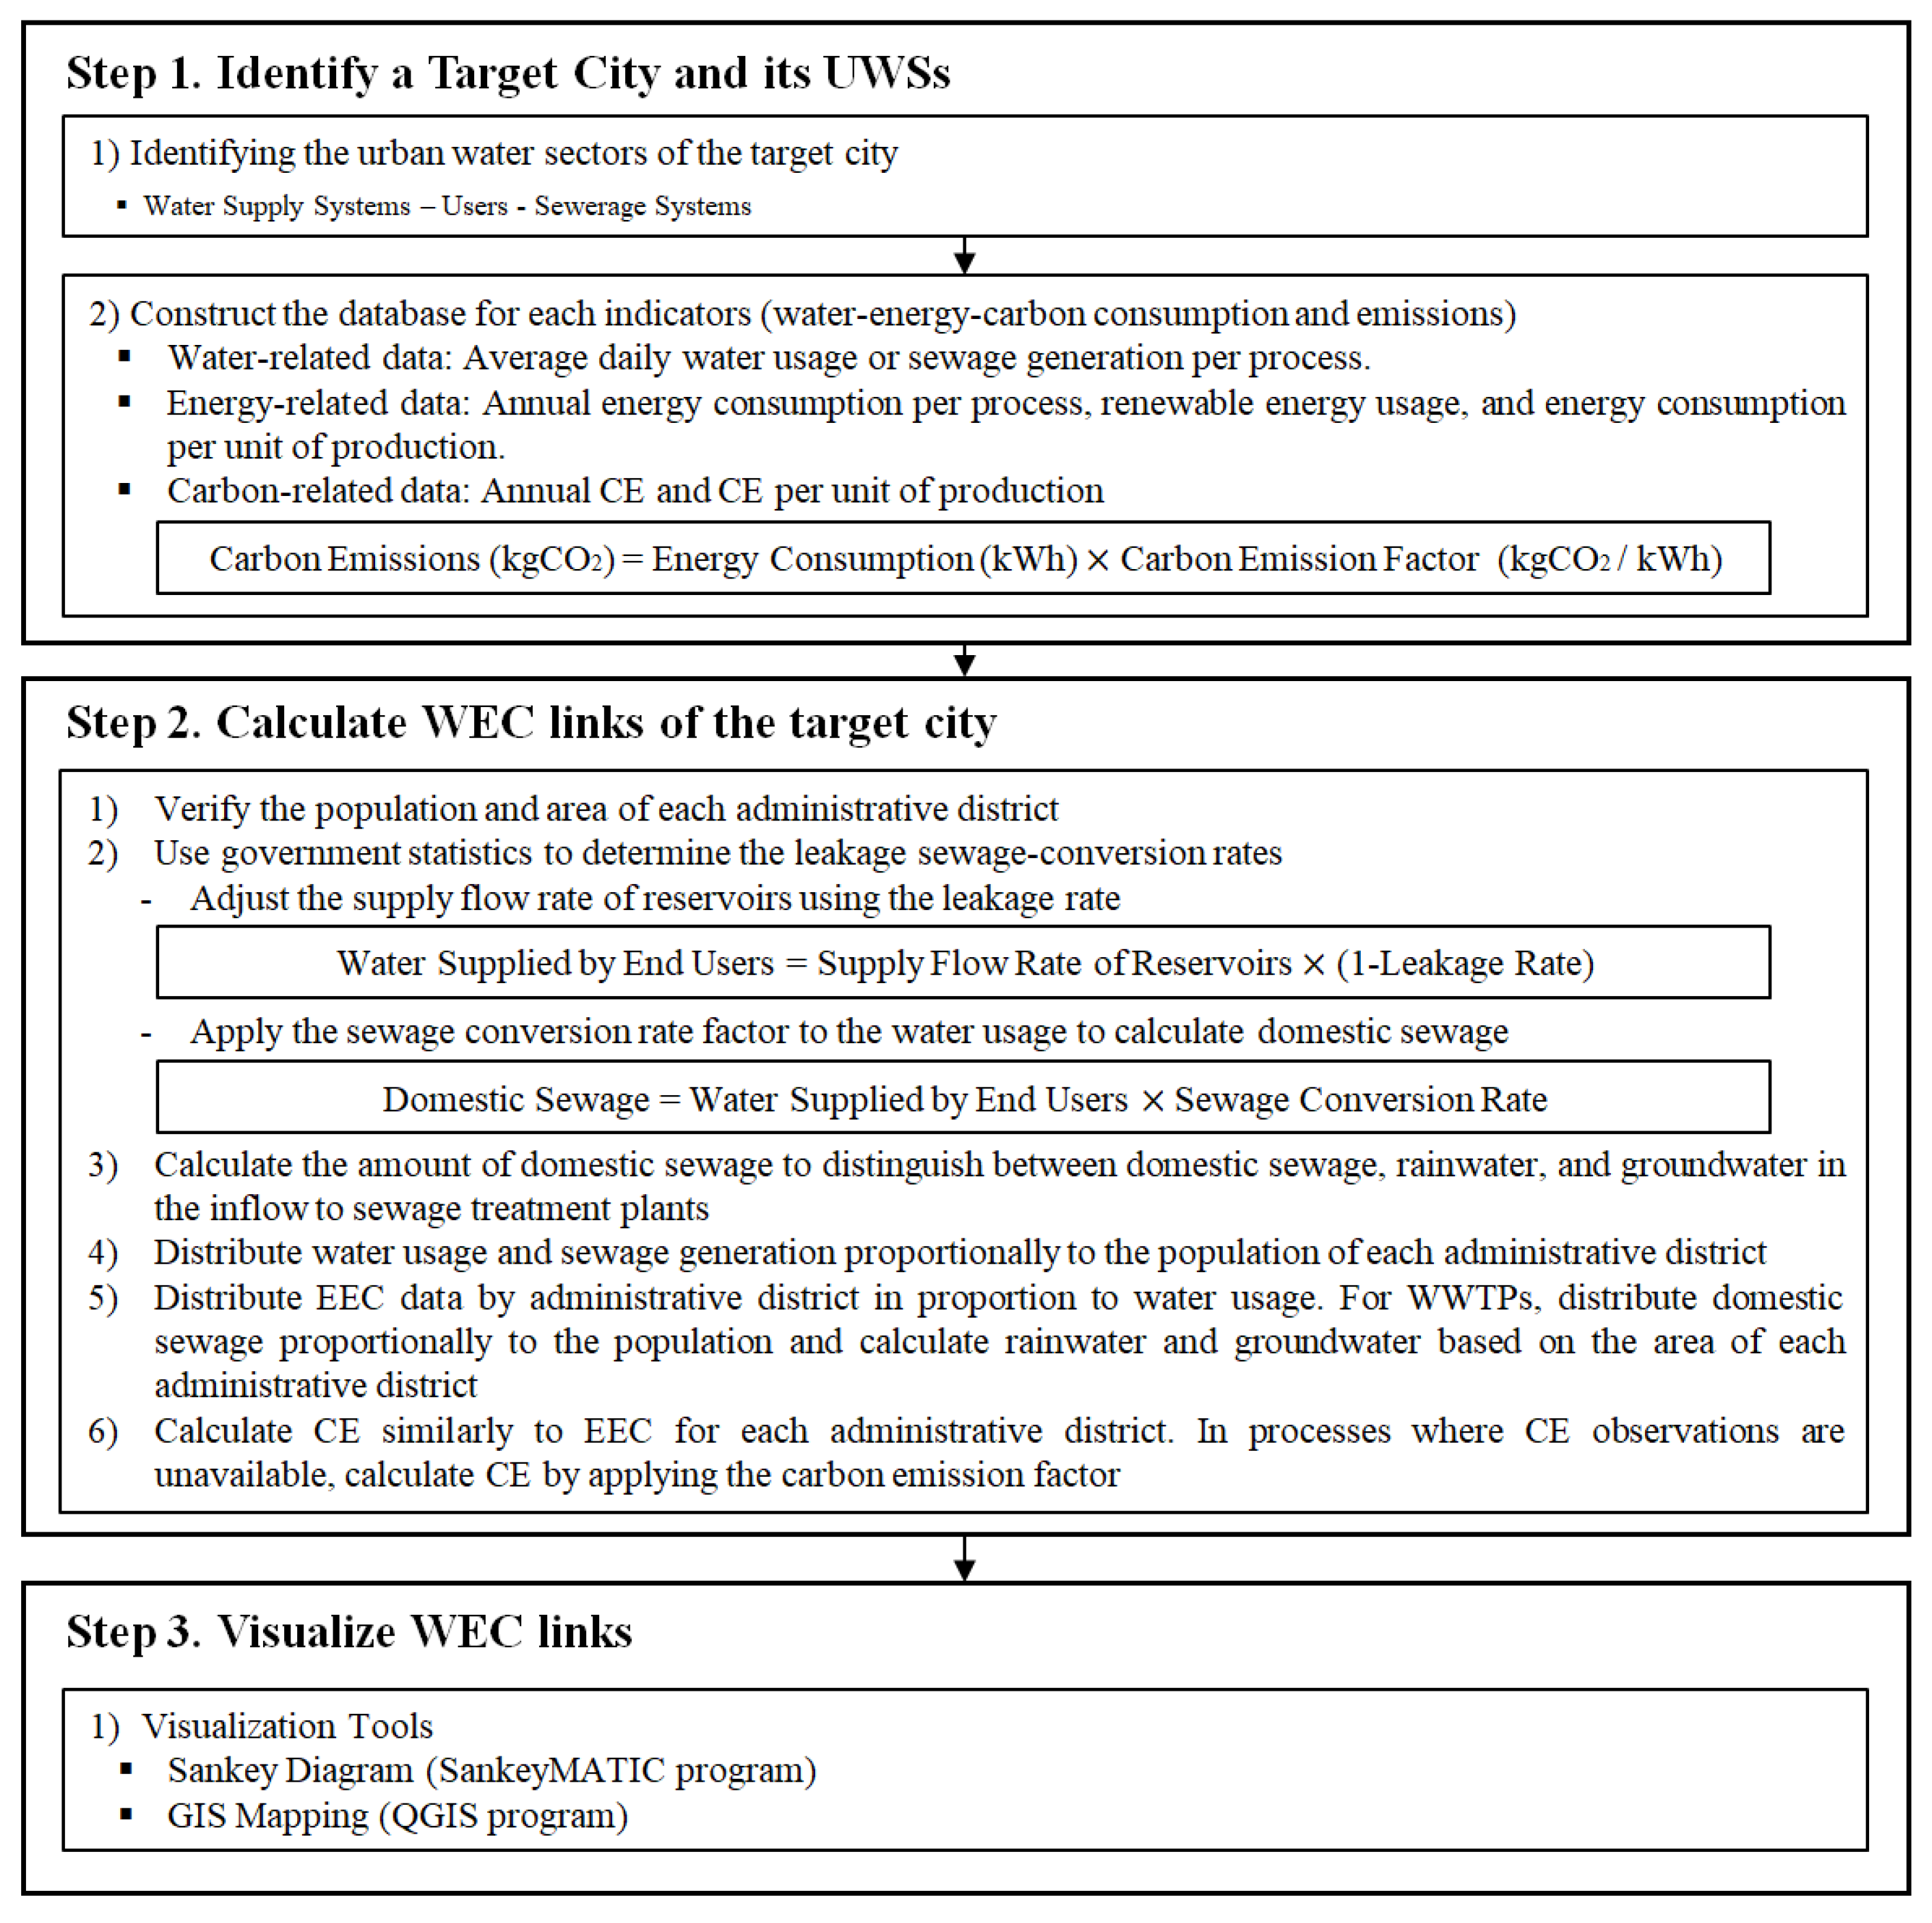
2.2. Study Procedure and Methodology
2.2.1. Step 1: Identify the Target City and Its UWSs
2.2.2. Step 2: Calculate WEC Links of the Target City
2.2.3. Step 3: Visualize WEC Links
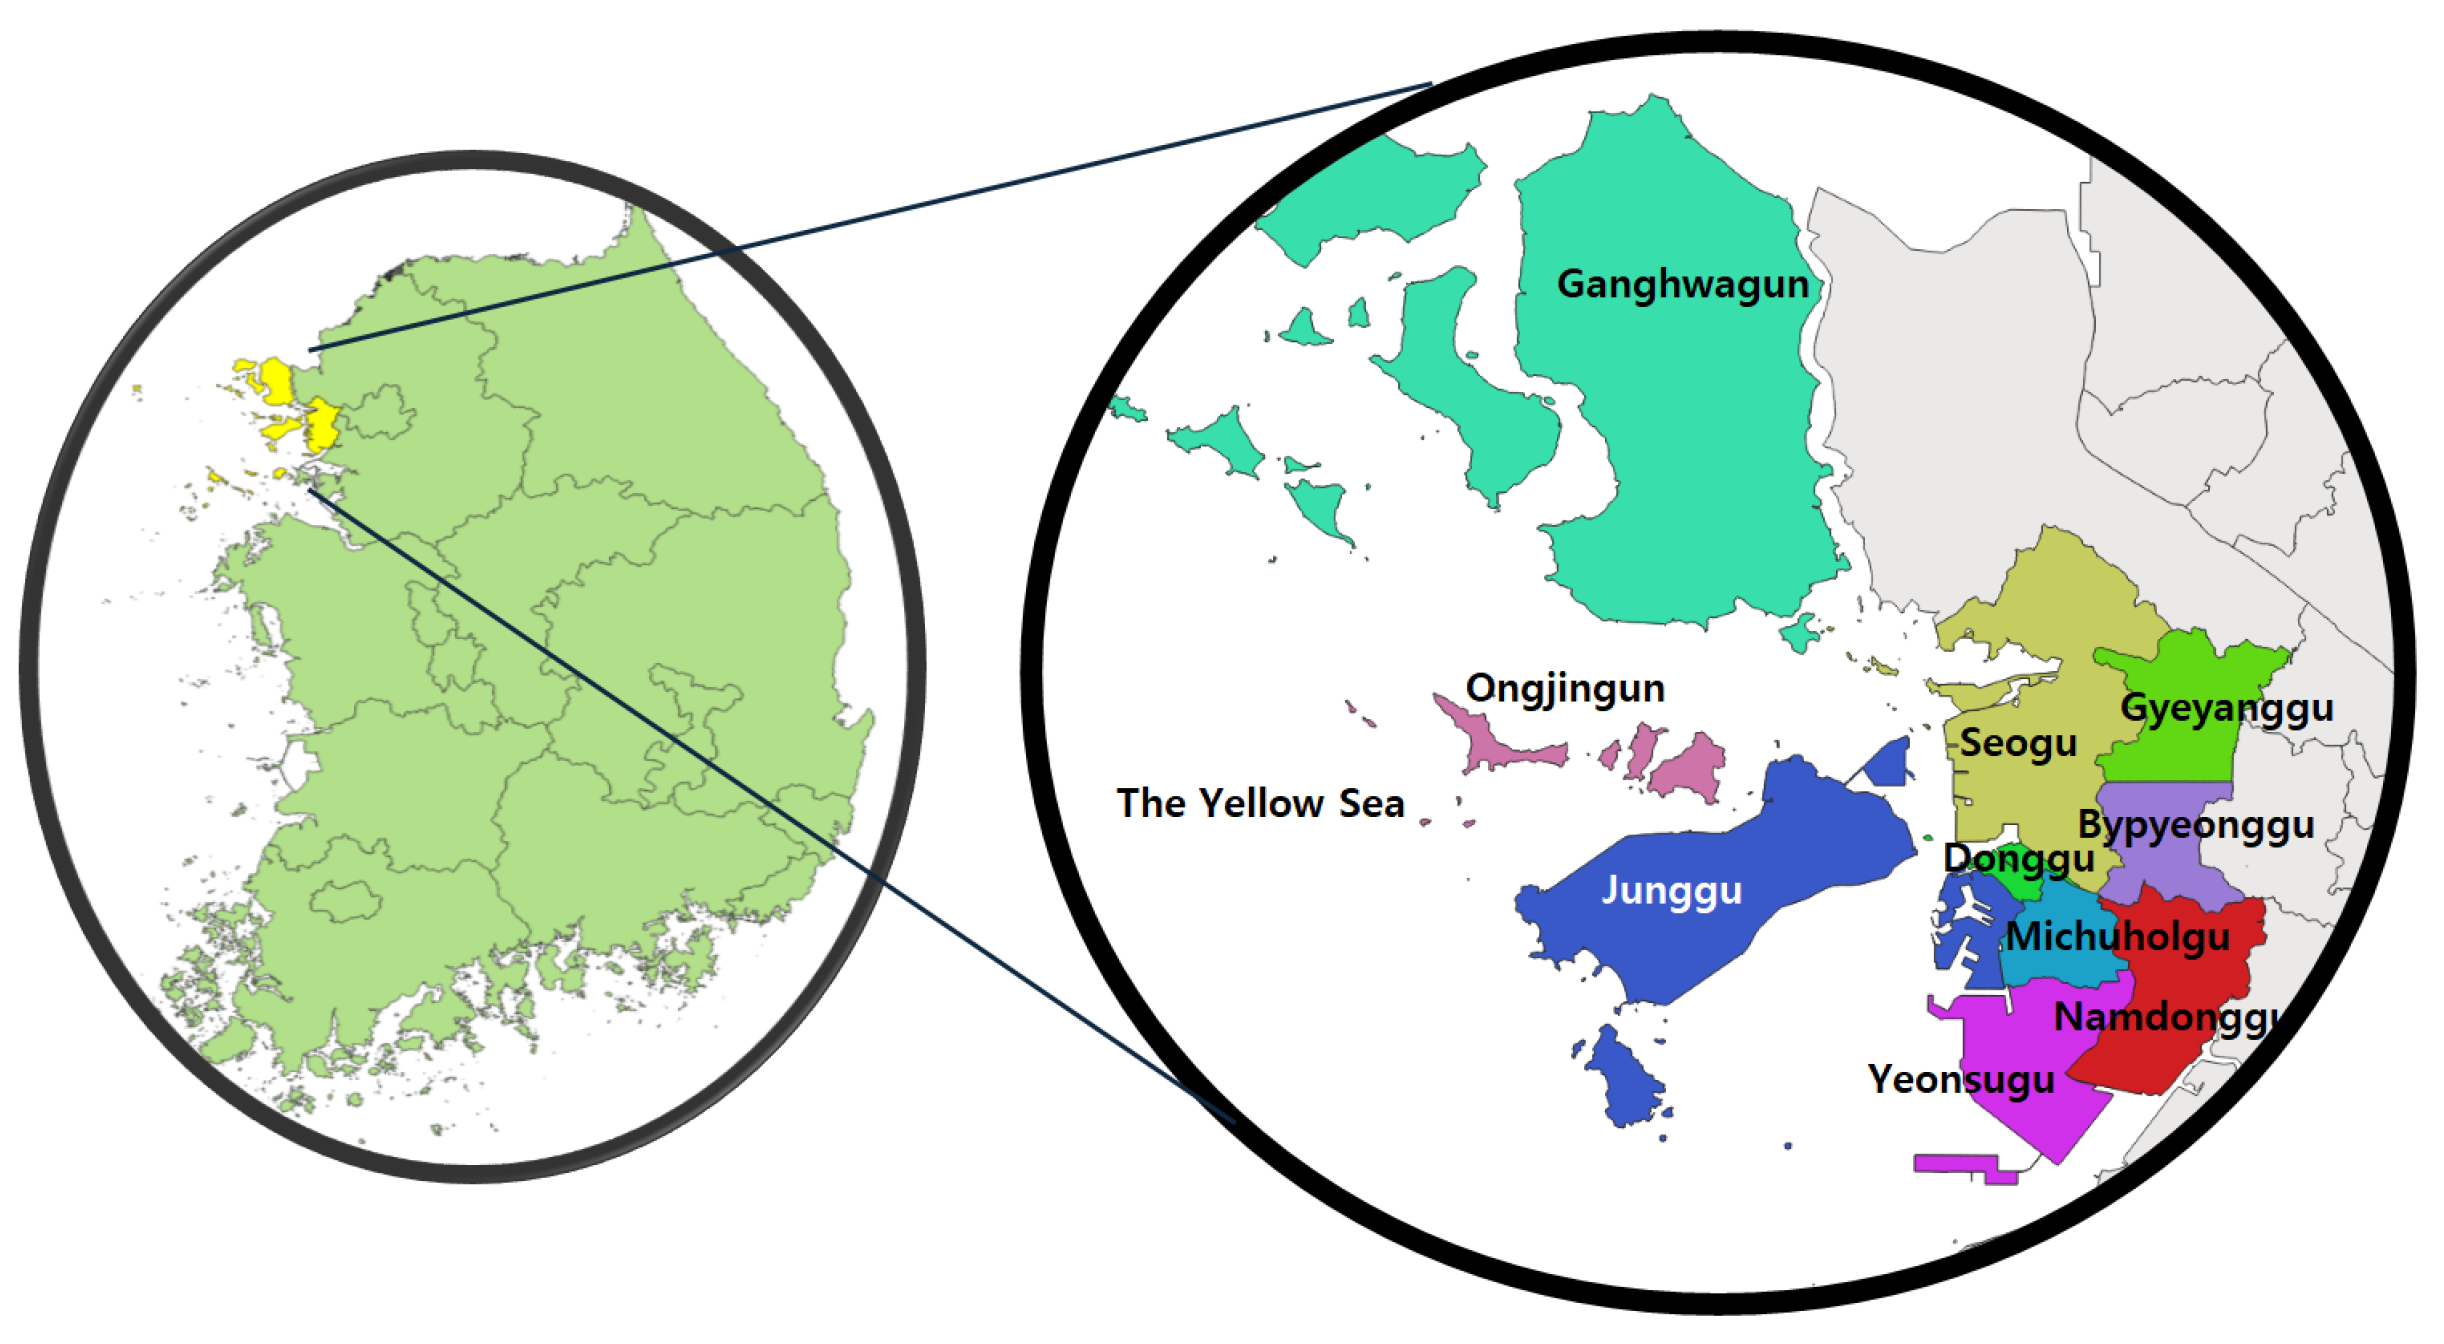
2.3. Case Study
2.3.1. UWSs in IMC
2.3.2. Location of Facilities
2.3.3. Data Acquisition
3. Results
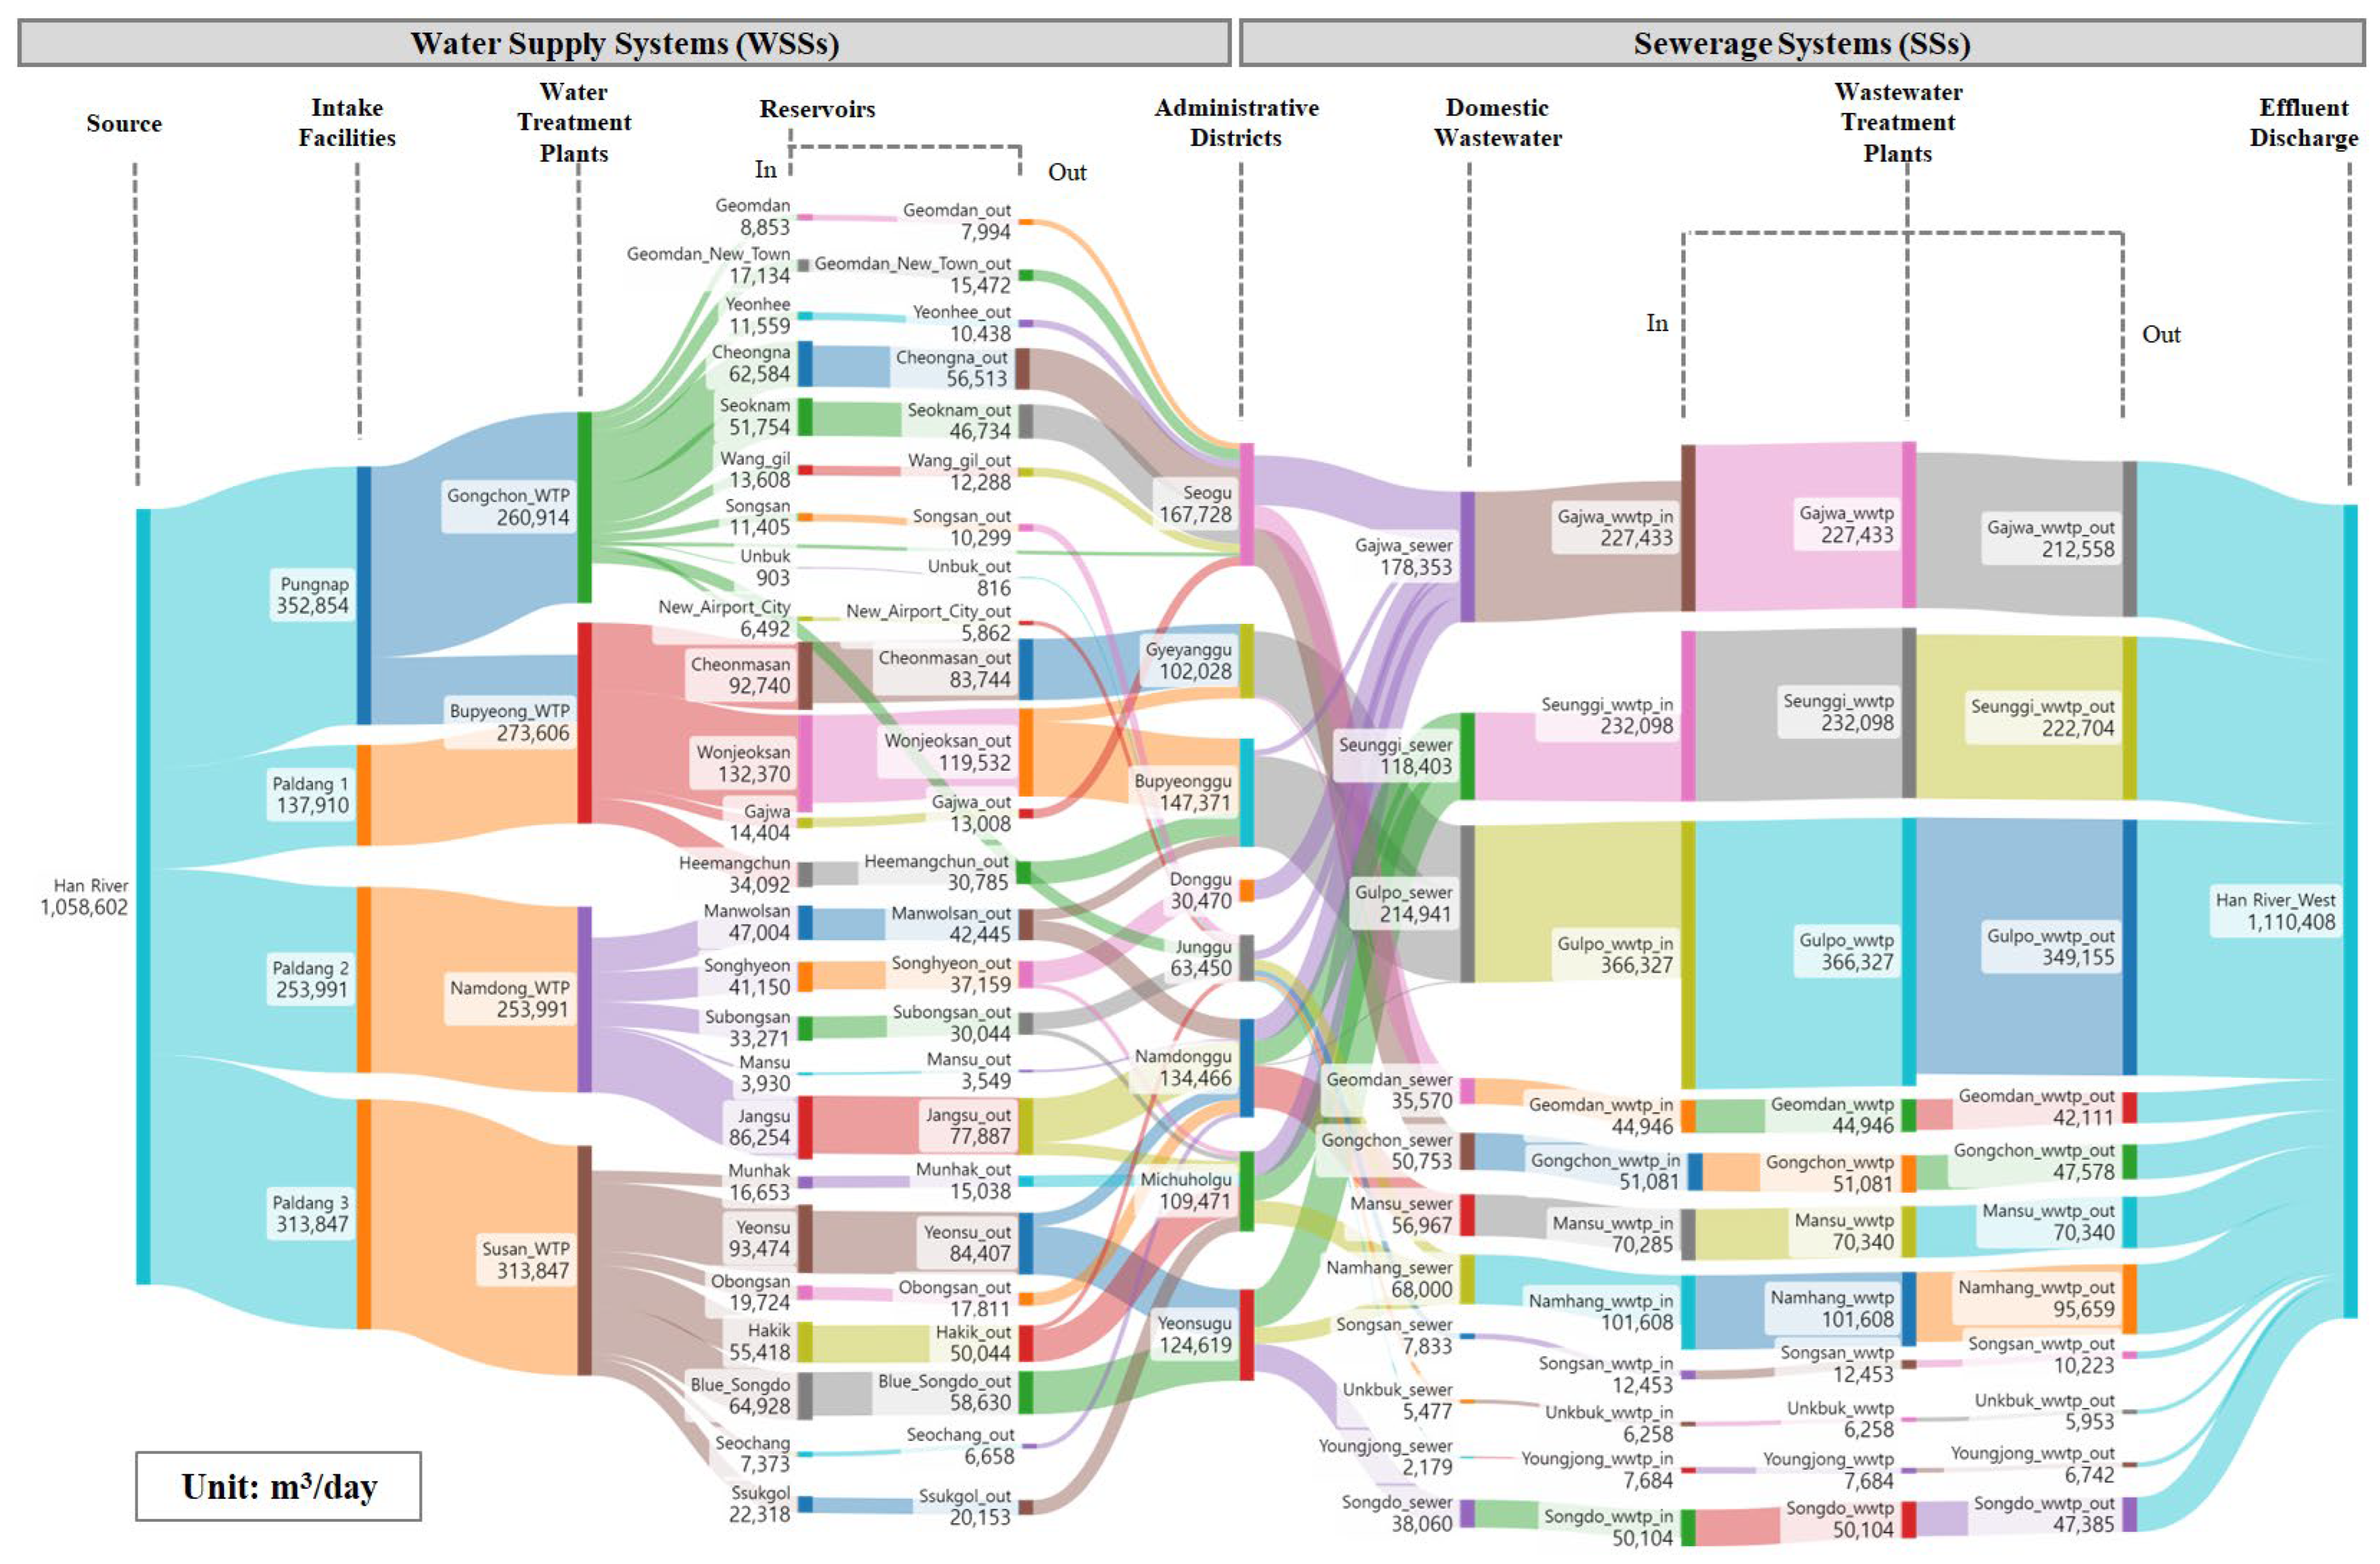
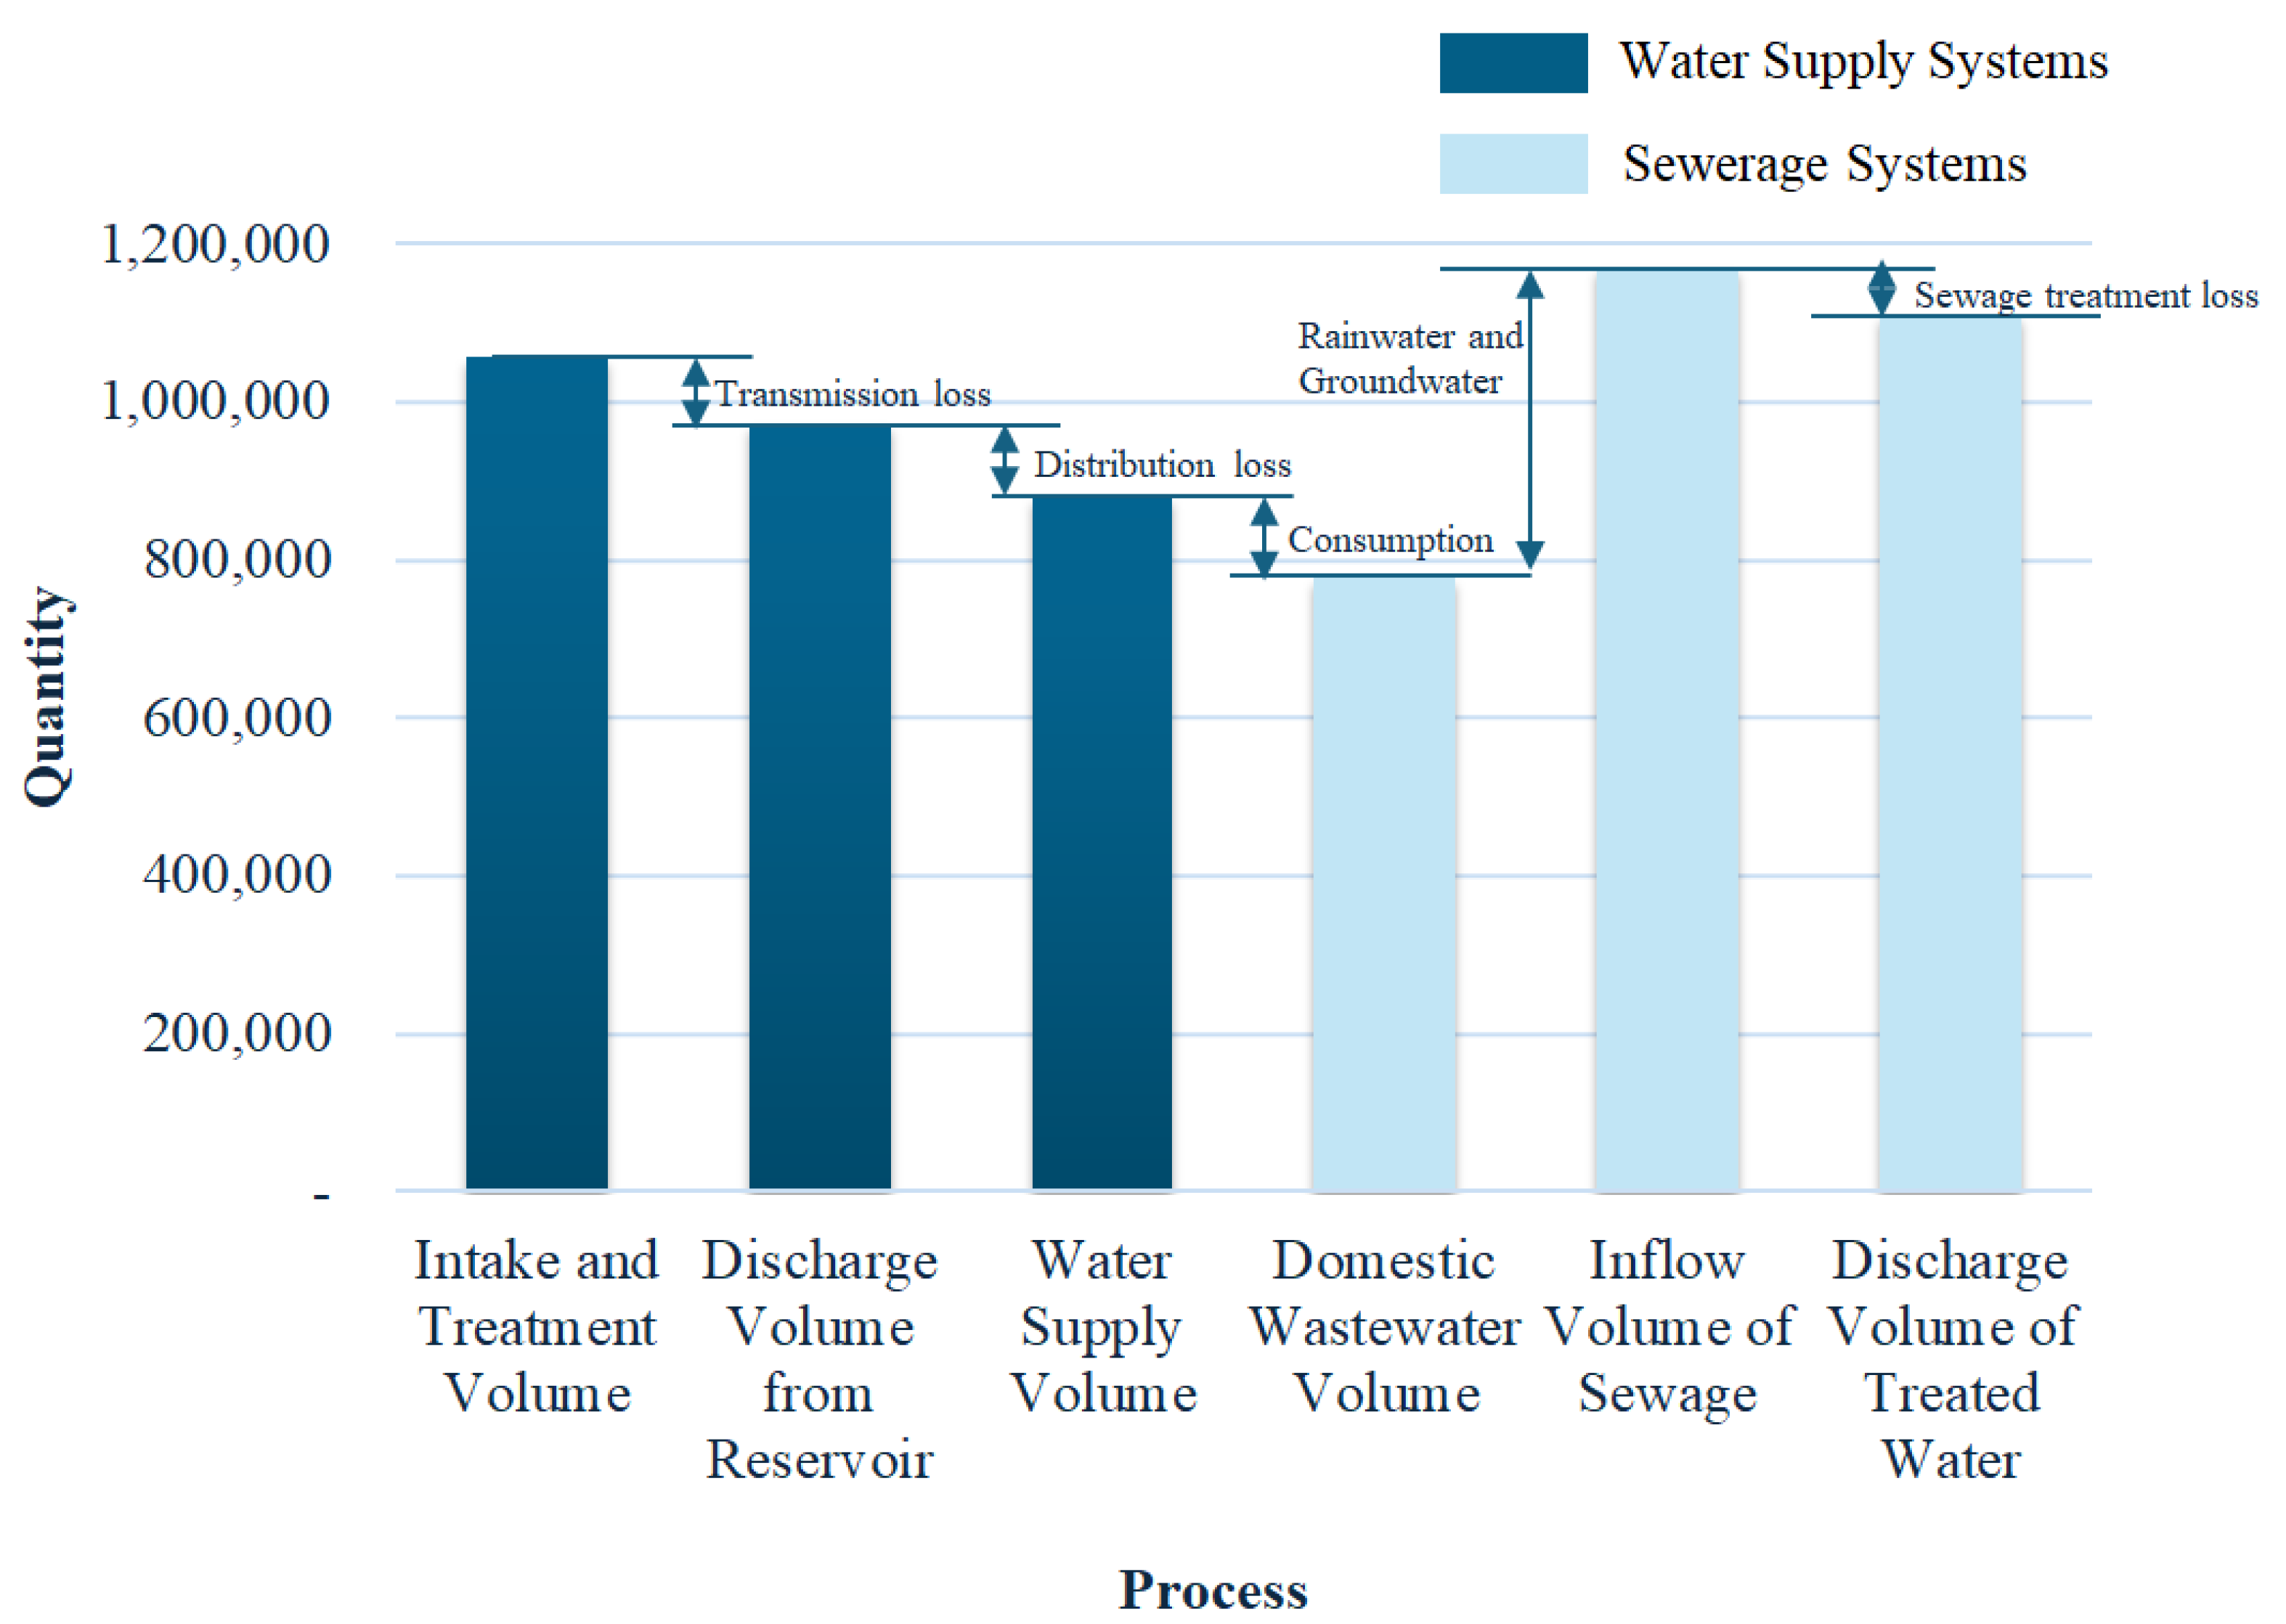
3.1. Water
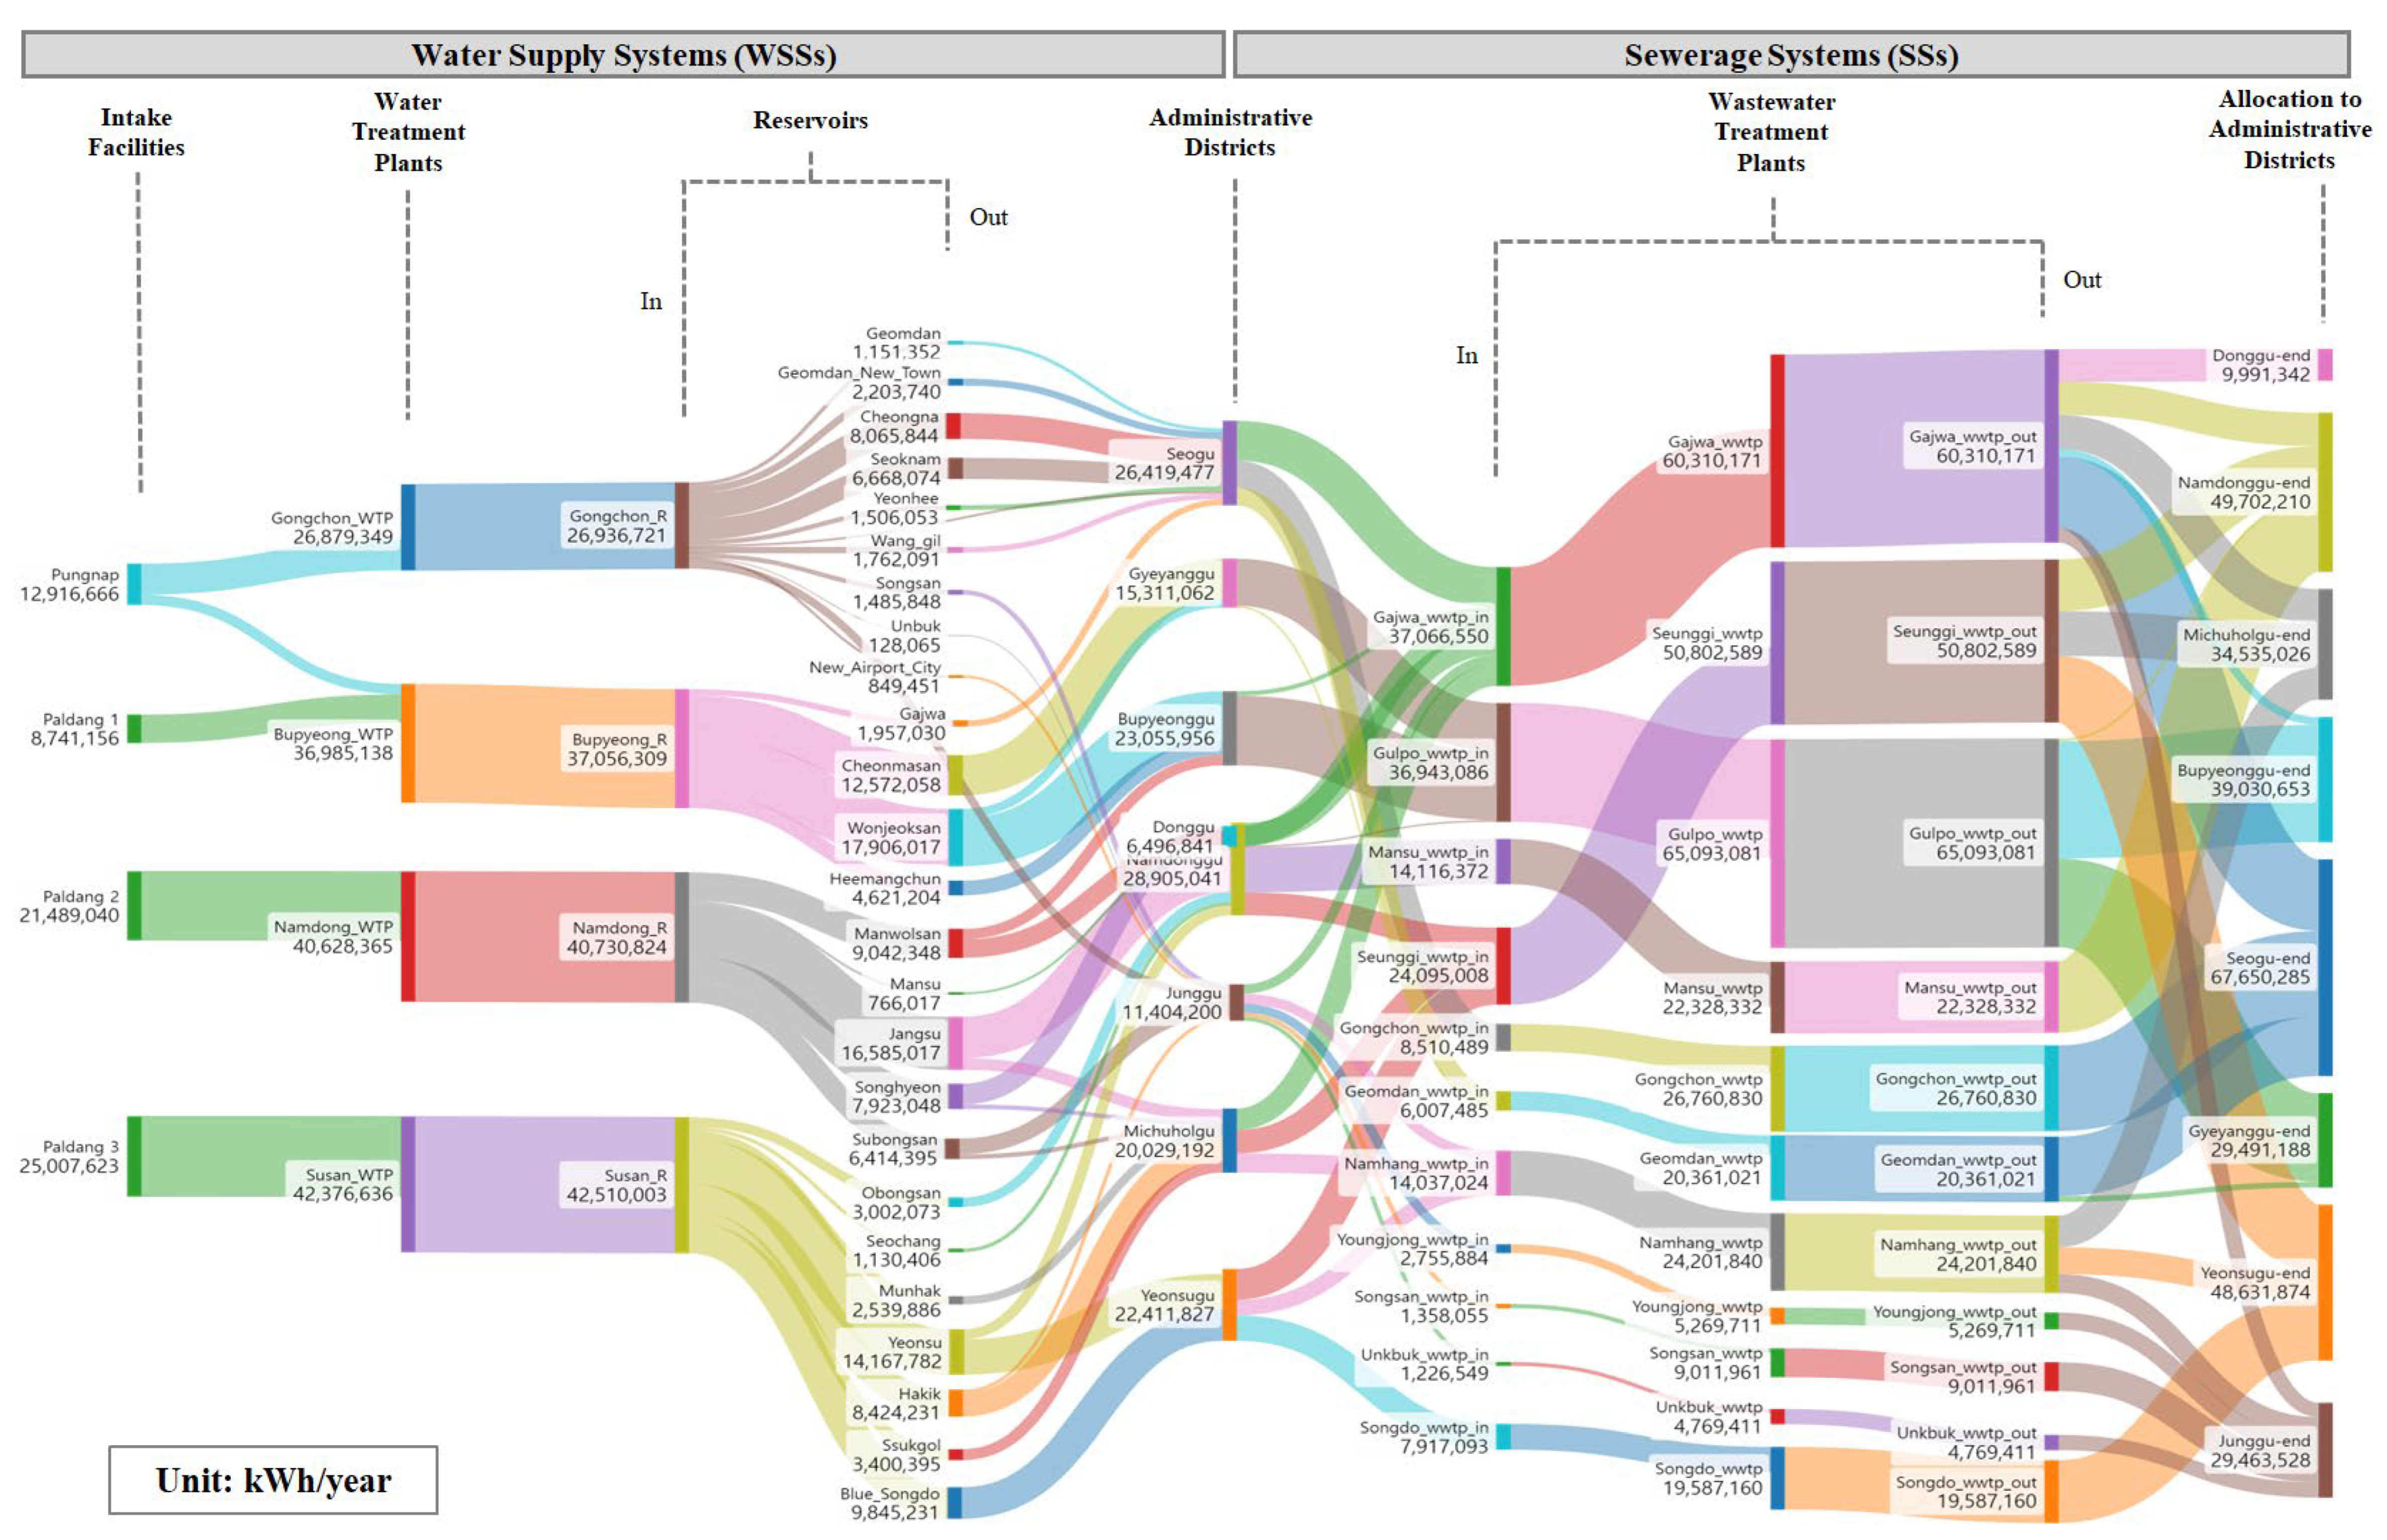
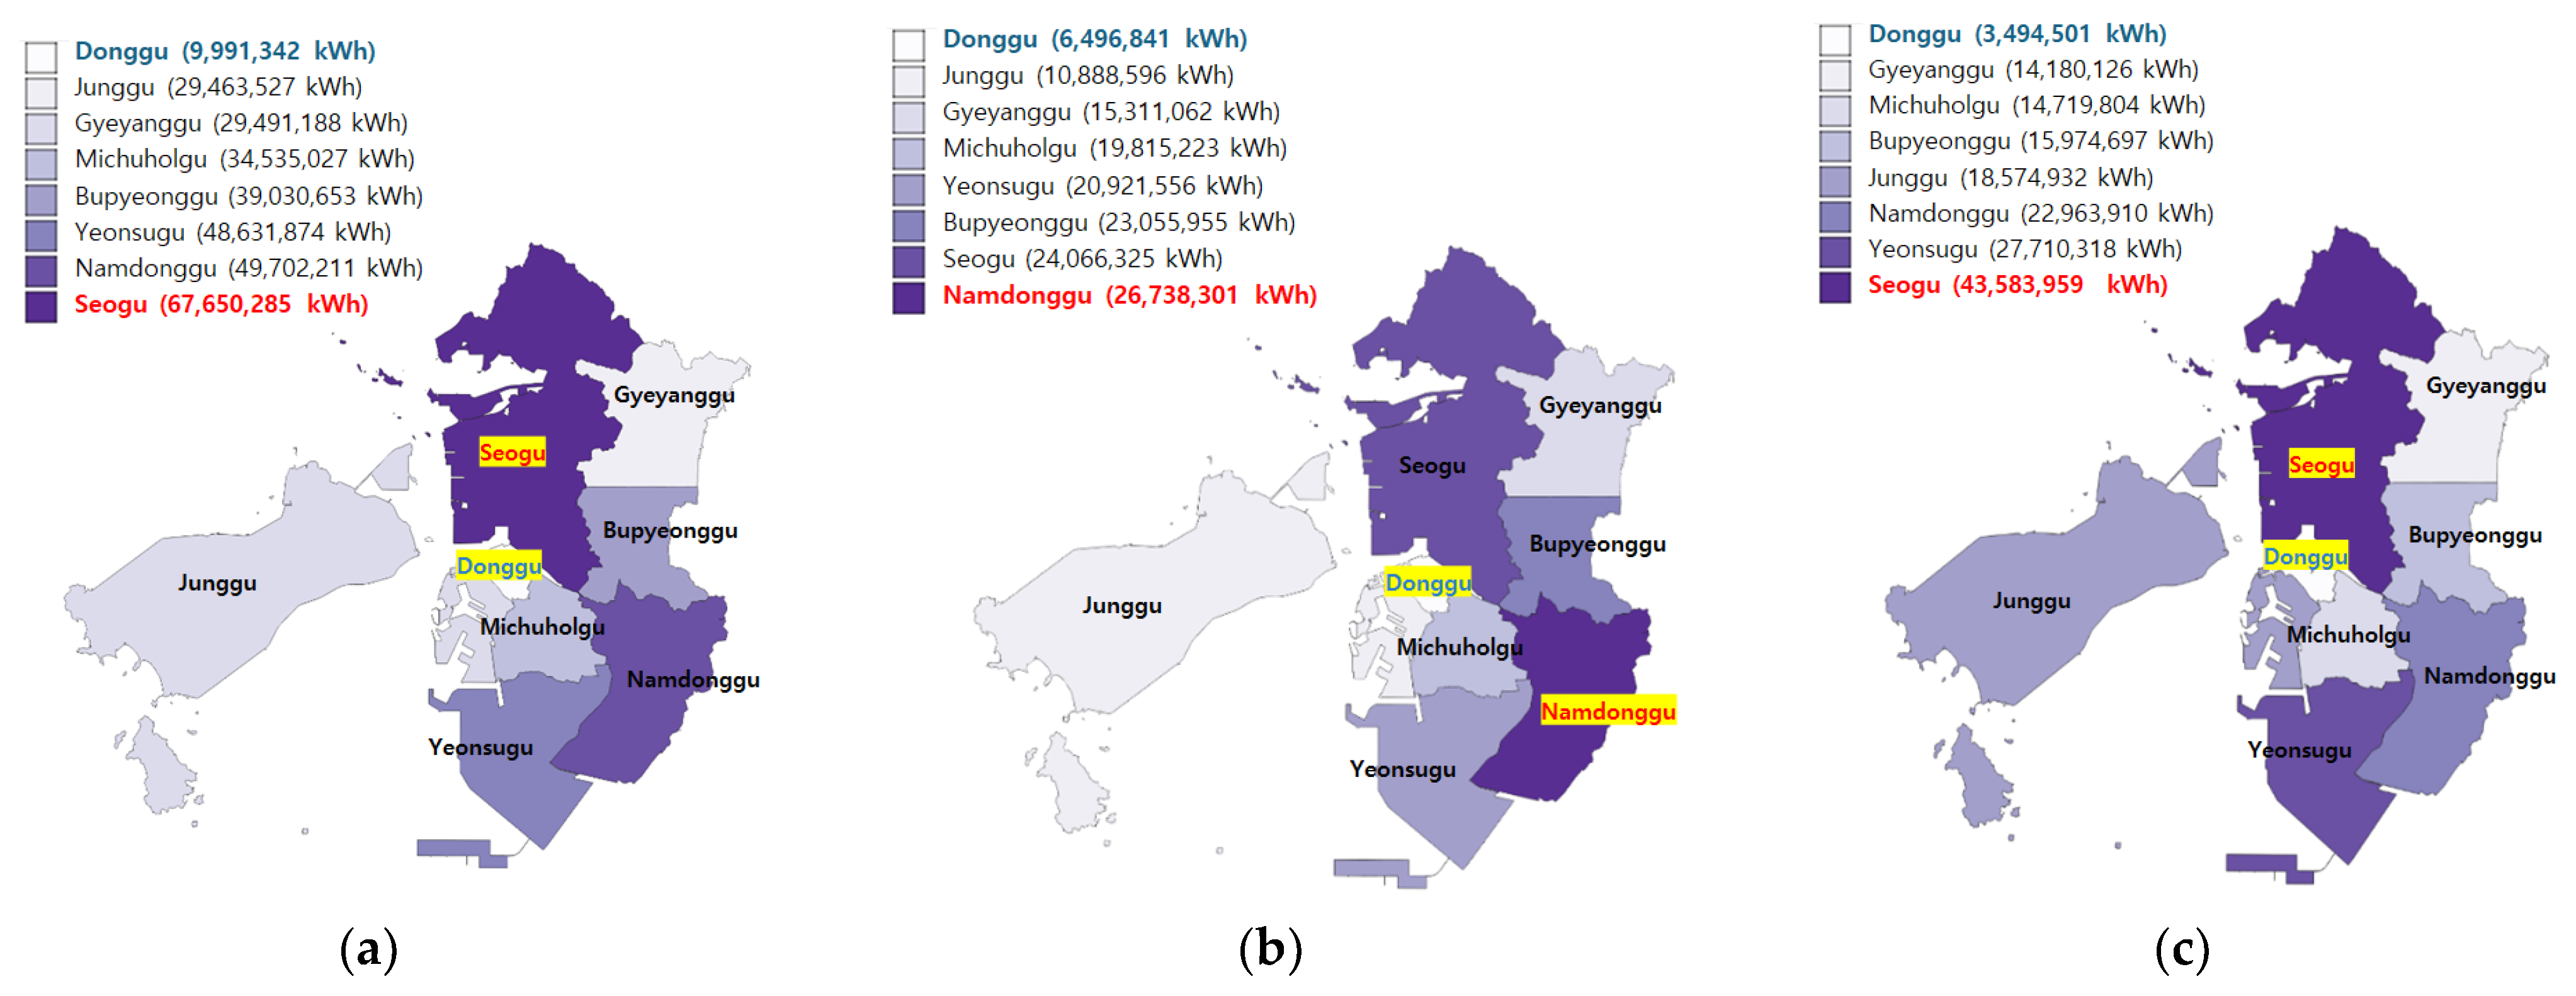
3.2. Energy
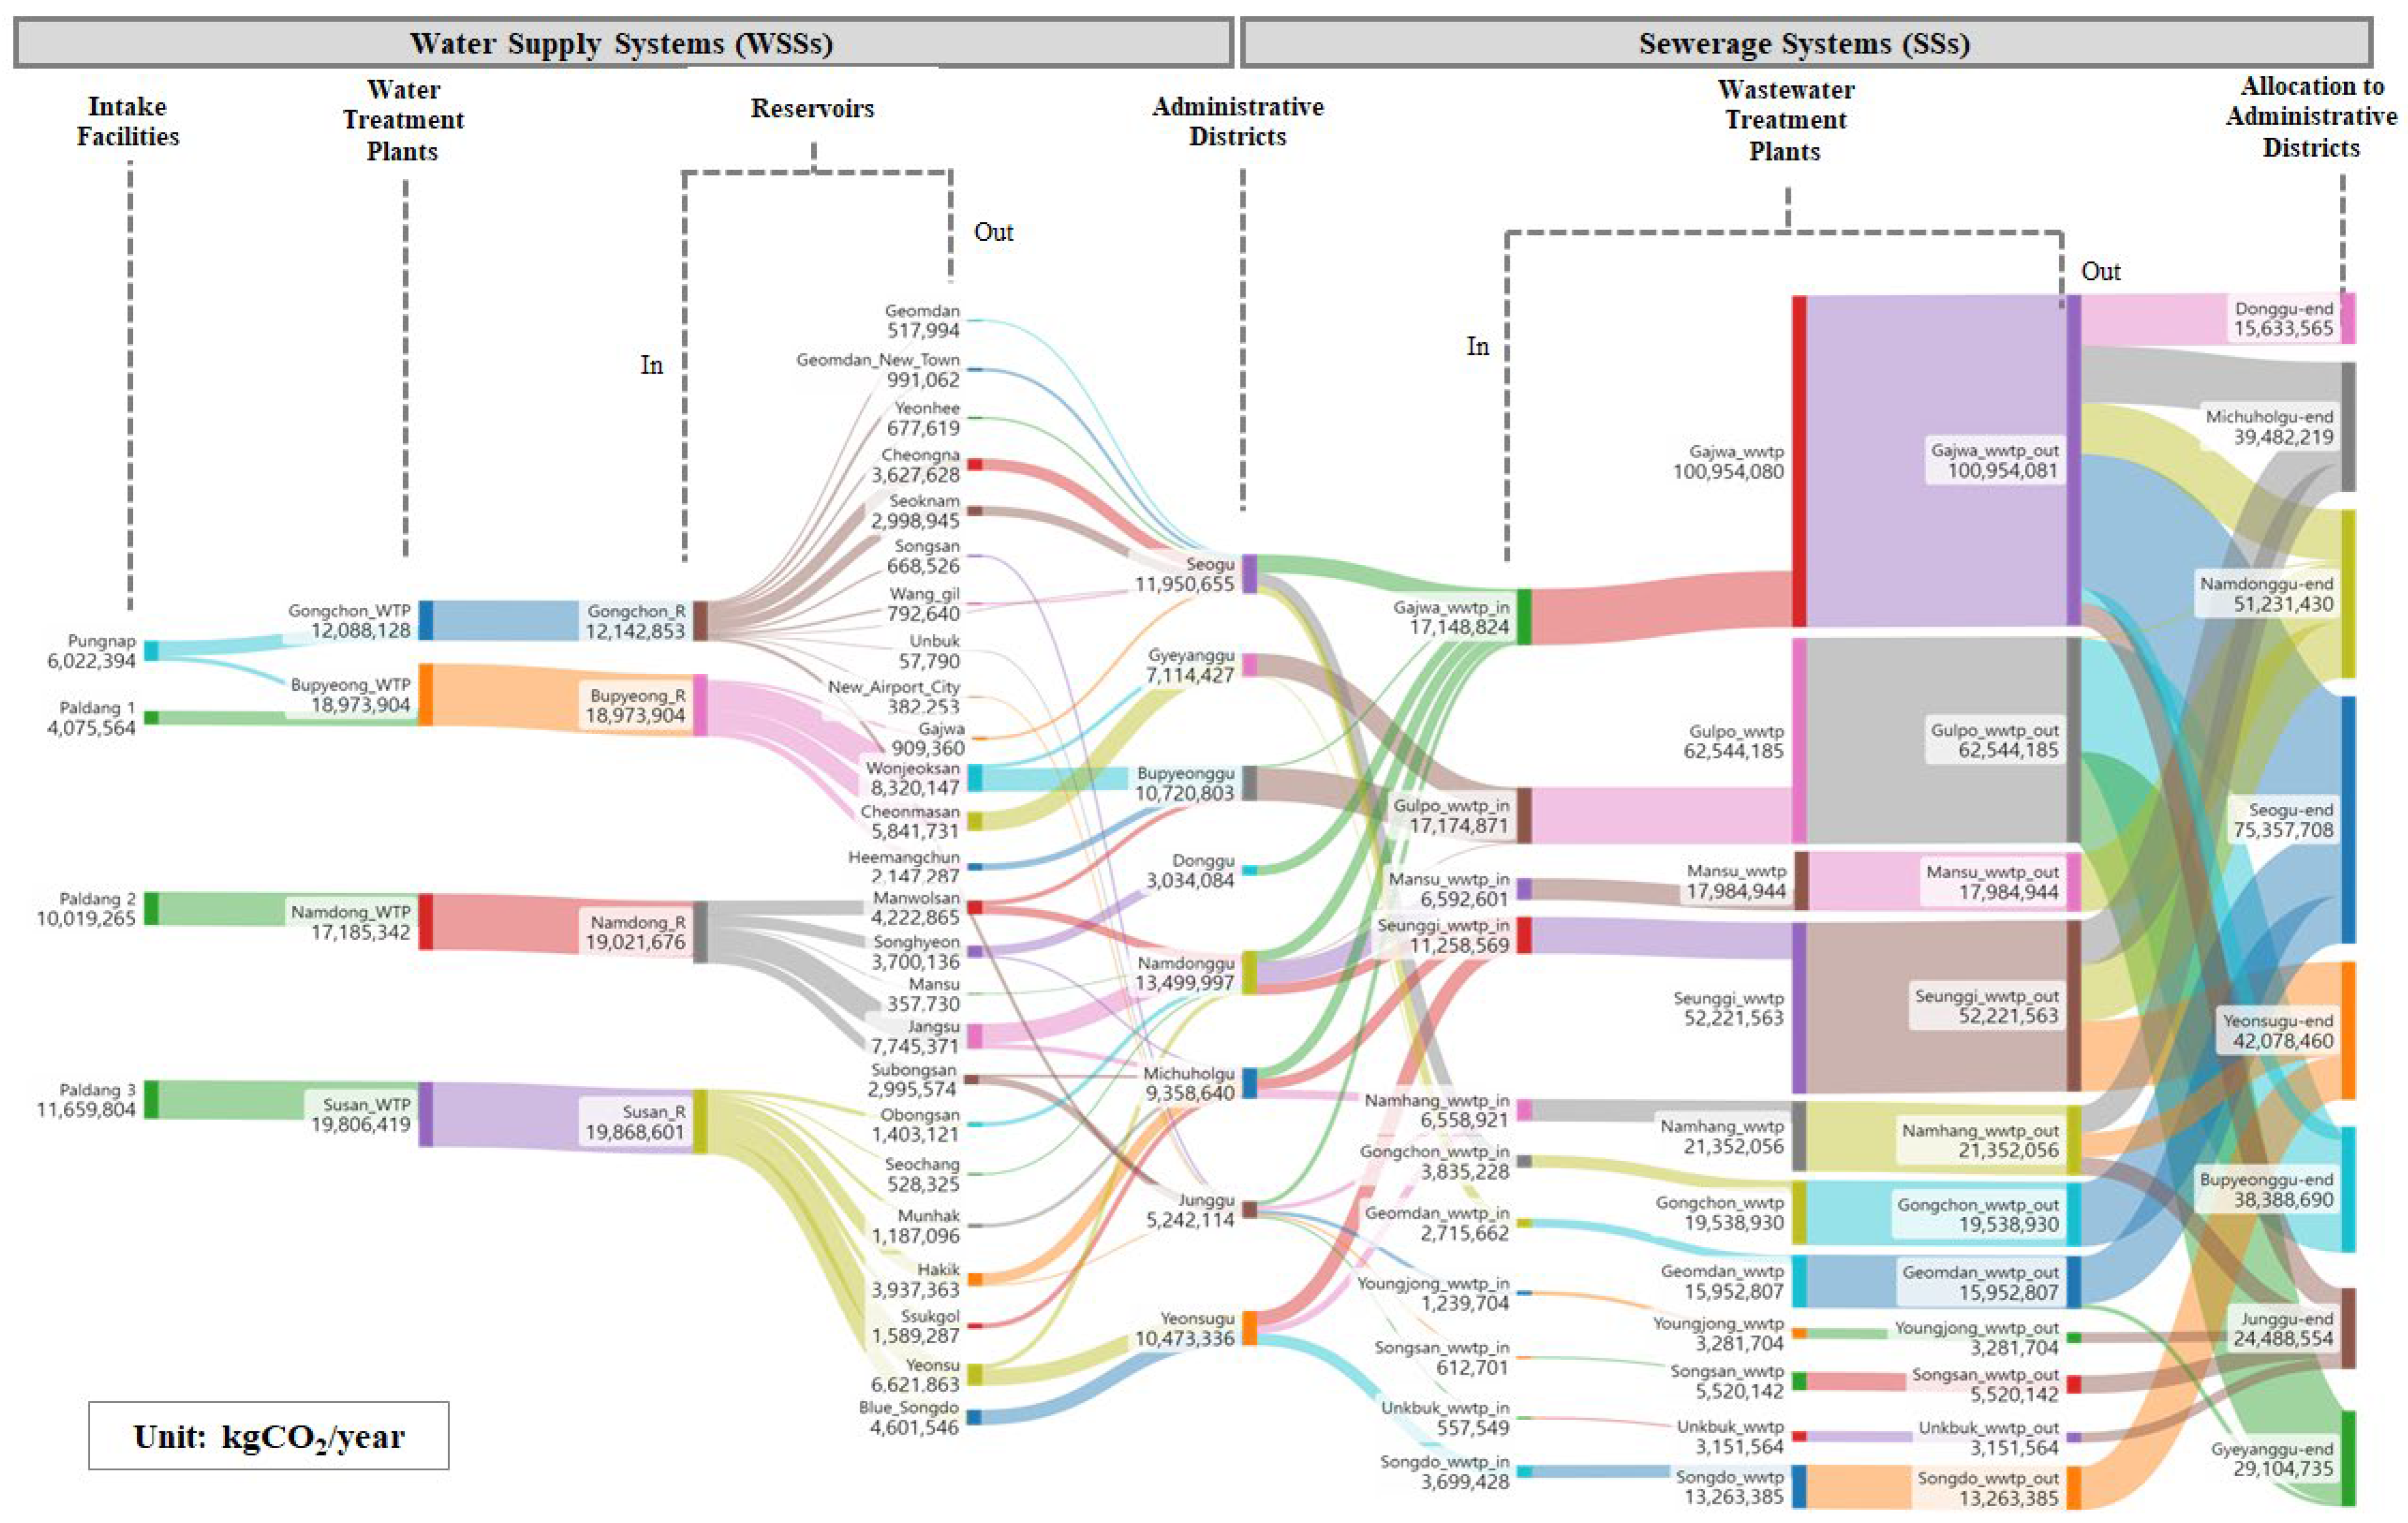
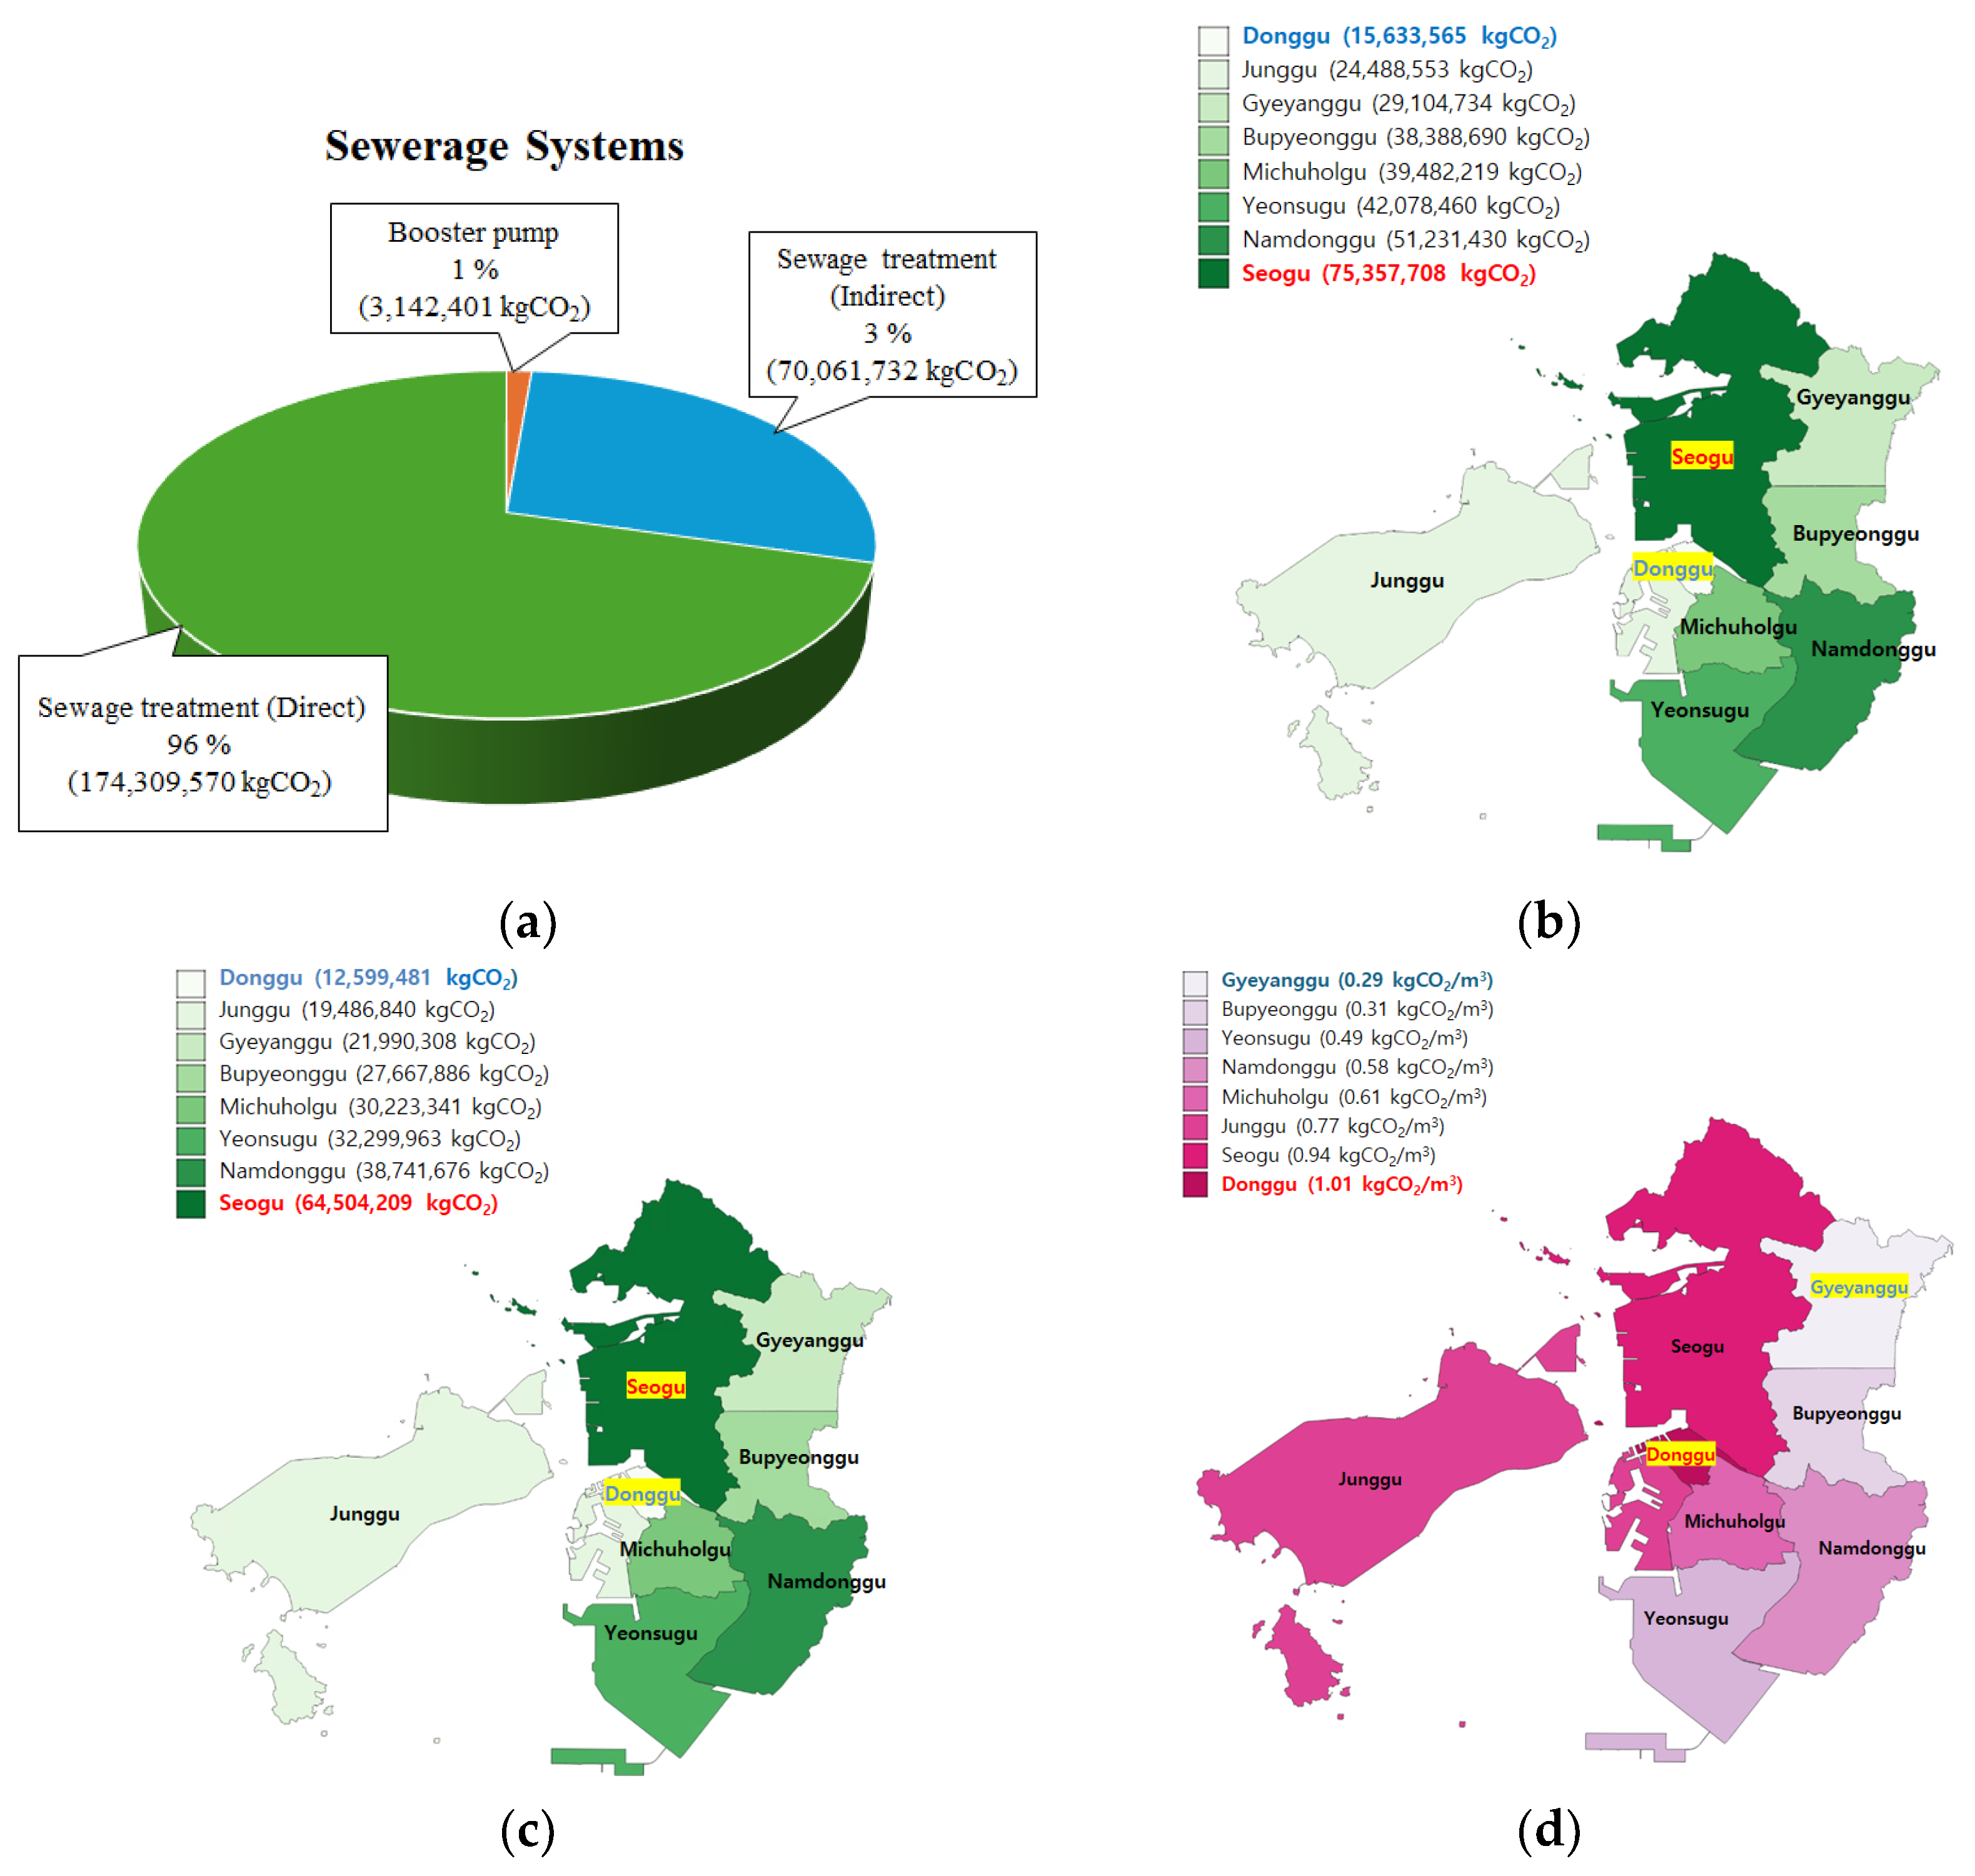
3.3. Carbon
4. Discussion
4.1. Water
4.2. Energy
4.3. Carbon
5. Conclusions
Author Contributions
Funding
Data Availability Statement
Conflicts of Interest
References
- Intergovernmental Panel on Climate Change. Global Warming of 1.5 °C. 2018. Available online: https://www.ipcc.ch/sr15/ (accessed on 4 September 2023).
- IEA. Fuel Share of CO2 Emissions from Fuel Combustion. 2019. Available online: https://www.iea.org/data-and-statistics/charts/fuel-share-of-co2-emissions-from-fuel-combustion-2019 (accessed on 4 September 2023).
- WWAP (World Water Assessment Programme). The United Nations World Water Development Report 2017, Wastewater: The Untapped Resource; United Nations Educational, Scientific and Cultural Organization (UNESCO): Paris, France, 2017. [Google Scholar]
- IEA (International Energy Agency). World Energy Outlook 2022. Paris, IEA. Licence: CC BY 4.0 (Report); CC BY NC SA 4.0 (Annex A). Available online: www.iea.org/reports/world-energy-outlook-2022 (accessed on 4 September 2023).
- Ministry of Knowledge Economy. 2011 Energy Census Report; Ministry of Knowledge Economy: Sejong, Republic of Korea, 2012.
- Racoviceanu, A.I.; Karney, B.W.; Kennedy, C.A.; Colombo, A.F. Life-cycle energy use and greenhouse gas emissions inventory for water treatment systems. J. Infrastruct. Syst. 2007, 13, 261–270. [Google Scholar] [CrossRef]
- Sowby, R.B.; Capener, A. Reducing carbon emissions through water conservation: An analysis of 10 major US cities. Energy Nexus 2022, 7, 100094. [Google Scholar] [CrossRef]
- Duan, C.; Chen, B. Energy-Water-carbon nexus at urban scale. Energy Procedia 2016, 104, 183–190. [Google Scholar] [CrossRef]
- Meng, F.; Liu, G.; Liang, S.; Su, M.; Yang, Z. Critical review of the Energy-Water-Carbon Nexus in Cities. Energy 2019, 171, 1017–1032. [Google Scholar] [CrossRef]
- Tian, P.; Lu, H.; Reinout, H.; Li, D.; Zhang, K.; Yang, Y. Water-energy-carbon nexus in China’s intra and inter-regional trade. Sci. Total Environ. 2022, 806, 150666. [Google Scholar] [CrossRef] [PubMed]
- Li, R.; Zhao, R.; Xie, Z.; Xiao, L.; Chuai, X.; Feng, M.; Zhang, H.; Luo, H. Water–energy–carbon nexus at campus scale: Case of North China university of water resources and electric power. Energy Policy 2022, 166, 113001. [Google Scholar] [CrossRef]
- Venkatesh, G.; Chan, A.; Brattebø, H. Understanding the water-energy-carbon nexus in urban water utilities: Comparison of four city case studies and the relevant influencing factors. Energy 2014, 75, 153–166. [Google Scholar] [CrossRef]
- Sharif, M.N.; Haider, H.; Farahat, A.; Hewage, K.; Sadiq, R. Water–energy nexus for water distribution systems: A literature review. Environ. Rev. 2019, 27, 519–544. [Google Scholar] [CrossRef]
- Filion, Y.R. Impact of urban form on energy use in water distribution systems. J. Infrastruct. Syst. 2008, 14, 337–346. [Google Scholar] [CrossRef]
- Liu, F.; Tait, S.; Schellart, A.; Mayfield, M.; Boxall, J. Reducing carbon emissions by integrating urban water systems and renewable energy sources at a community scale. Renew. Sustain. Energy Rev. 2020, 123, 109767. [Google Scholar] [CrossRef]
- Rani, A.; Snyder, S.W.; Kim, H.; Lei, Z.; Pan, S.-Y. Pathways to a net-zero-carbon water sector through energy-extracting wastewater technologies. NPJ Clean Water 2022, 5, 49. [Google Scholar] [CrossRef]
- Friedrich, E.; Pillay, S.; Buckley, C.A. Carbon footprint analysis for increasing water supply and sanitation in South Africa: A case study. J. Clean. Prod. 2009, 17, 1–12. [Google Scholar] [CrossRef]
- Hu, G.; Ou, X.; Zhang, Q.; Karplus, V.J. Analysis on energy–water nexus by sankey diagram: The case of Beijing. Desalination Water Treat. 2013, 51, 4183–4193. [Google Scholar] [CrossRef]
- Curmi, E.; Fenner, R.; Richards, K.; Allwood, J.M.; Bajželj, B.; Kopec, G.M. Visualising a Stochastic model of Californian water resources using sankey diagrams. Water Resour. Manag. 2013, 27, 3035–3050. [Google Scholar] [CrossRef]
- Lehrman, B. Visualizing water infrastructure with sankey maps: A case study of mapping the Los Angeles Aqueduct, California. J. Maps 2018, 14, 52–64. [Google Scholar] [CrossRef]
- QGIS Development Team. QGIS Geographic Information System. QGIS Association. 2023. Available online: https://www.qgis.org (accessed on 4 September 2023).
- Steve Bogart. sankeyMATIC. 2023. Available online: https://sankeymatic.com/ (accessed on 4 September 2023).
- Ministry of Environment National Water Supply Information System. Available online: https://www.waternow.go.kr/web/board/STAT/34057/?page=1&pMENUID=9 (accessed on 4 September 2023).
- Incheon Metropolitan City. Available online: https://www.incheon.go.kr/water/index (accessed on 4 September 2023).
- Ministry of Environment Water Supply and Wastewater—Environmental Policy. Available online: https://www.me.go.kr/home/web/policy_data/read.do?menuId=10264&seq=7285 (accessed on 4 September 2023).
- Environmental Corporation of Incheon. Available online: https://www.eco-i.or.kr/main/main.asp (accessed on 4 September 2023).
- Chini, C.M.; Stillwell, A.S. The state of US urban water: Data and the energy-water nexus. Water Resour. Res. 2018, 54, 1796–1811. [Google Scholar] [CrossRef]
- Lam, K.L.; Kenway, S.J.; Lant, P.A. Energy use for water provision in cities. J. Clean. Prod. 2017, 143, 699–709. [Google Scholar] [CrossRef]


| Data Classification | Water Supply Systems | Sewerage Systems | ||||
|---|---|---|---|---|---|---|
| Intake Facilities | WTPs | Reservoirs | WWTPs | |||
| ① | Water | Usage (m³/day) | Intake volume | Treated volume | Discharge volume | Inflow and outflow volume |
| ② | Energy | Annual energy consumption (kWh) | Annual electric energy consumption (EEC) | Annual EEC | Annual EEC | Annual EEC |
| Renewable energy usage | Renewable energy usage | |||||
| ③ | Energy consumption per unit production (kWh/m³) | EEC per unit production | ||||
| ④ | Carbon | Annual carbon emissions (CEs) (kgCO2) | Annual CEs | |||
| ⑤ | CEs per unit production (kgCO2/m³) | CEs per unit production | ||||
| Indicators | Junggu | Donggu | Muchuholgu | Yeonsugu | Namdonggu | Bupyeonggu | Gyeyanggu | Seogu |
|---|---|---|---|---|---|---|---|---|
| Population | 147,535 | 61,486 | 416,551 | 408,946 | 529,200 | 489,118 | 298,802 | 566,676 |
| Population density (population/km2) | 1052 | 8540 | 16,796 | 7449 | 9268 | 15,285 | 6553 | 4848 |
| Household | 62,254 | 25,984 | 175,389 | 146,830 | 210,772 | 197,396 | 116,818 | 210,245 |
| Businesses | 13,589 | 7875 | 28,017 | 19,802 | 41,071 | 32,420 | 18,712 | 36,650 |
| Manufacturing businesses | 58 | 77 | 300 | 159 | 1772 | 518 | 238 | 1400 |
| Hotels | 93 | - | 1 | 3 | 13 | 1 | 6 | 11 |
| Medical institutions | 115 | 92 | 475 | 393 | 729 | 745 | 367 | 533 |
| Public sports facilities | 116 | 45 | 161 | 65 | 139 | 116 | 78 | 153 |
| Residential land-plot ratio (number of plots/area) | 8715 (5) | 2679 (16) | 19,139 (19) | 17,094 (10) | 20,817 (20) | 22,611 (26) | 12,848 (12) | 23,493 (8) |
| Commercial land-plot ratio (number of plots/area) | 5808 (15) | 231 (19) | 5549 (27) | 7897 (49) | 4224 (35) | 5490 (48) | 411 (10) | 5016 (9) |
| Industrial land-plot ratio (number of plots/area) | 96 (0) | 255 (3) | 570 (4) | 3 (0) | 1286 (2) | 2479 (12) | 570 (15) | 3739 (3) |
| Buildings | 17,819 | 9960 | 34,875 | 8264 | 26,941 | 23,306 | 12,738 | 32,216 |
| Average floor area per building | 819 | 413 | 884 | 4351 | 1241 | 1356 | 895 | 1178 |
| Average number of floors per building | 2.3 | 2.3 | 3.0 | 5.7 | 3.4 | 3.2 | 2.9 | 3.2 |
| Units per building | 60,347 | 23,789 | 171,483 | 162,402 | 202,671 | 200,038 | 119,343 | 215,871 |
Disclaimer/Publisher’s Note: The statements, opinions and data contained in all publications are solely those of the individual author(s) and contributor(s) and not of MDPI and/or the editor(s). MDPI and/or the editor(s) disclaim responsibility for any injury to people or property resulting from any ideas, methods, instructions or products referred to in the content. |
© 2024 by the authors. Licensee MDPI, Basel, Switzerland. This article is an open access article distributed under the terms and conditions of the Creative Commons Attribution (CC BY) license (https://creativecommons.org/licenses/by/4.0/).
Share and Cite
Min, K.; Lee, G.; Kim, H.; Hwang, T.; Kim, E.; Lee, J.; Kang, D. Identifying Water–Energy–Carbon Links in Urban Water Sectors: A Case Study of Incheon Metropolitan City, Republic of Korea. Water 2024, 16, 2473. https://doi.org/10.3390/w16172473
Min K, Lee G, Kim H, Hwang T, Kim E, Lee J, Kang D. Identifying Water–Energy–Carbon Links in Urban Water Sectors: A Case Study of Incheon Metropolitan City, Republic of Korea. Water. 2024; 16(17):2473. https://doi.org/10.3390/w16172473
Chicago/Turabian StyleMin, Kyoungwon, Gyumin Lee, Hyunjung Kim, Taemun Hwang, Eunju Kim, Juwon Lee, and Doosun Kang. 2024. "Identifying Water–Energy–Carbon Links in Urban Water Sectors: A Case Study of Incheon Metropolitan City, Republic of Korea" Water 16, no. 17: 2473. https://doi.org/10.3390/w16172473
APA StyleMin, K., Lee, G., Kim, H., Hwang, T., Kim, E., Lee, J., & Kang, D. (2024). Identifying Water–Energy–Carbon Links in Urban Water Sectors: A Case Study of Incheon Metropolitan City, Republic of Korea. Water, 16(17), 2473. https://doi.org/10.3390/w16172473