Abstract
Abstract: The increasing population has subjected rivers and streams to high levels of both industrial and domestic pollution. Significant environmental challenges have been brought about by their effects, particularly with regard to biota, ecosystem processes, soil quality, and groundwater pollution. This study examined the effects of human activity by applying pollution index models to evaluate the input of toxic elements in river sediments. Prior to sediment quality analysis, the total amount of arsenic (As), lead (Pb), cadmium (Cd), mercury (Hg), thorium (Th), and uranium (U) was determined in the concentration range of 1.09–10.0 mg/kg, 8.53–475 mg/kg, 0.12–0.16 mg/kg, 4.85–77.5 mg/kg, 3.14–5.9 mg/kg and 0.93–2.86 mg/kg, respectively. The enrichment factor, contamination factor, pollution load index, and geo-accumulation index revealed alarmingly high levels of Pb and Hg contamination at some sampling points, which are related to possible human input, ranging from severe enrichment to considerable contamination. The low ranges of pollution indices of some toxic elements suggest enrichment through the natural weathering process and atmospheric deposition. The Pearson correlation coefficient revealed a significant correlation between Pb-Fe and As-Fe, suggesting the possibility of acid mine contamination. Continual monitoring of river sediment is essential to minimize the impact of toxic elements to sustain sediment health and quality.
1. Introduction
Sediment determines the physical environment of the ecological systems of rivers. The degree of water clarity, channel structure, and natural terrain can be altered by variations in the quantity and spatial distribution of different types of sediment. Extreme fluctuations in the physical and chemical characteristics disrupt the natural terrain and biological balance of aquatic biomes. The flow and upstream sediment supply have an impact on river sediment transportation, and changes in both variables affect the rate of sediment transport, as well as the locations where sediment is deposited or withdrawn [1]. Comprehension of the processes of sedimentation and erosion pertaining to the diverse settings within a river is crucial for the management of sediment and sediment-associated habitats in rivers [2]. Interrelated physical, chemical, and biological processes regulate sediment ecosystems and influence a sediment’s capacity to sustain a diverse, active, and well-functioning biological population [3,4]. Therefore, the quality of sediment has become a crucial factor in maintaining the health of benthic ecosystems and safeguarding aquatic biome environments. Sediment contamination is a debilitating issue for the scientific community because of the substantial amount of anthropogenic inputs that aquatic biomes are constantly receiving. The considerable amount of widespread pollutants stimulates changes in ecological equilibrium and degrades water and sediment quality [2,5]. The hydrological setting and morphology of rivers, wetlands, floodplains, estuaries, or coastal lagoons influence the accumulation of suspended particles and other related pollutants along water streams. Additionally, these pollutants have the ability to become a component of bottom sediment, which frequently propagates several miles downstream from chemical sources [6,7].
Among the common environmental contaminants that have a significant impact on human health, the environment, and ecosystems are hazardous metals and metalloids, which are released through a variety of anthropogenic and natural processes. The scale and production capacity of numerous industries, including the coal, building materials, metallurgy, and chemical industries, are rising swiftly in tandem with the rapid expansion of industrial economies in many countries [8]. Like many developing countries worldwide, South Africa has experienced an immense increase in the demand for potable water resources due to a range of activities, including mining, urban stormwater, agricultural runoff, industrial discharges, and wastewater discharge, which are also the main contributors to aquatic biome and water resource contamination [9]. South Africa is among the leading mineral-rich nations, ranking fifth globally in terms of the contribution of mining to gross development product [10]. Despite their significance in achieving economic growth, prosperity, and progress on a national and international scale, mining and other sectors have demonstrated adverse environmental consequences [9,11]. For instance, the processes of gold (Au) mining has exposed the environmental waters to significant concentrations of radionuclides and other toxic elements [12]. The ambient environmental surface and aquatic biomes may become increasingly contaminated with hazardous metals and metalloids such as arsenic (As), uranium (U), thorium (Th), lead (Pb), mercury (Hg), and cadmium (Cd) as a consequence of mining activities. The distribution of these hazardous elements is often diverse in riverbed sediment and water, and their amount transferred across the sediment–water interface depends on the physicochemical properties of the sediment and water [13]. Moreover, their abundance in mining waste has the potential to constitute substantial amounts of sulphides, which enter aquatic environments through acid mine drainage and runoffs. As a result, sedimentation results in colloidal material that supplies the essential transportation and reservoirs for these pollutants [14]. In aquatic reservoirs, As, Pb, Hg, Cd, U, and Th are non-biodegradable and may accumulate in sediments. Their toxicity, bioavailability, and solubility can vary based on their chemical form, with mobility being one of the key mechanisms causing elemental contamination that could be detrimental to human health and the biota [14,15].
Historical contamination still poses a significant threat to many aquatic biomes because contaminated sediment has been associated with impacts on both benthic and water column species [2,9]. Despite that, the underlying sediment may act as a reservoir to preserve the quality of the water by forming a long-lasting contaminant sink partitioned between pore water and sediment or suspended particulate [16]. It could act as a contamination source under variable environmental conditions. For instance, numerous physicochemical processes, including sorption, oxidation-reduction, hydrolysis, temperature, salinity, and pH, may influence the chemistry of sediments. Consequently, the release of adsorbed contaminants in various chemical forms with high mobility and bioaccumulation rates increases the amount of toxic elements in both water and sediment. The water flow, size, and content of geological material can also have an impact on these processes [1,14,17]. In addition, the constantly shifting relationship between metals in sediments and water flow is reflected in extreme hydrometeorology, whereas rising river flows as a result of climate change are causing silt from riverbeds to wash into the rivers’ upper reaches. As such, subterranean pollution deposits have the potential to gradually change the composition and quality of water [13]. The prompt enrichment of hazardous metals and other pollutants in lake sediments is driven by both the effects of sediment adsorption and pollution source discharge, which pose a major threat to the aquatic ecosystem. For instance, As, Pb, Hg, Cd, U, and Th have exhibited acute and long-term toxicity to the benthic community, water column species, and human health, even at extremely low levels. Therefore, to assess the level of contamination and implement pollution control, it is essential to investigate hazardous element pollution in sediment and identify risk zones [13,18]. The scientific community has established systematic methods for the assessment and control of sediment quality as a result of the aquatic biome’s acquisition of toxic elements from various sources of contamination. Along with quantifying the concentration of trace elements, pollution indices are critical tools for the assessment of sediment quality and may have a major role in forecasting the sustainability of aquatic biomes in the future [3,8]. The aim of the study was to assess the sediment quality of the heavily contaminated perennial Juskei River in South Africa. Selected hazardous elements were quantified using inductively plasma coupled mass spectrometry for the determination of the degree of contamination through the assessment of pollution index parameters, such as contamination factor (CF), enrichment factor (EF), geo-accumulation index (Igeo), and pollution load index (PLI).
2. Methodology
2.1. Study Area
Employment prospects in the mining sector have influenced South Africa’s population growth since the discovery of Au in the 18th century [12]. Mining activity has been concentrated in the Witwatersrand area in Johannesburg, South Africa, which is well known for its significant Au reserves. Witwatersrand is also known as the ridge of white waters, referring to the numerous springs in the area that meander through the area forming tributaries of the Juskei River, which originates in Johannesburg [5]. The Juskei River is significant for the economy and ecology since it forms the largest contributing factor of eutrophication problems in the downstream of Hartbeespoort Dam, which is utilized for recreational reasons, farming activities, and domestic use. The Juskei River is significantly affected by large volumes of runoff from a wide variety of human activities in upstream and downstream urban areas, such as agricultural runoff, industrial activities, mining operations, and domestic waste, and by the failure of sewage and wastewater infrastructures and poor drainage of wastewater entering the watershed. Statistical reports have revealed deterioration in the performance of wastewater treatment systems, which results in heavily contaminated rivers due to the discharge of municipal effluent that does not meet the specified treatment levels [19,20]. River sediment in the proximity of South African mining sites and within urban areas has been identified as having high concentrations of toxic elements, microorganisms, organic waste, and chemical pollutants [21,22]. Therefore, management of aquatic biomes has prompted the need to assess the sediment quality of the Juskei River, which forecasts the provision of several benefits that are the cornerstone of water security and other policies.
2.2. Sample Collection and Preparation
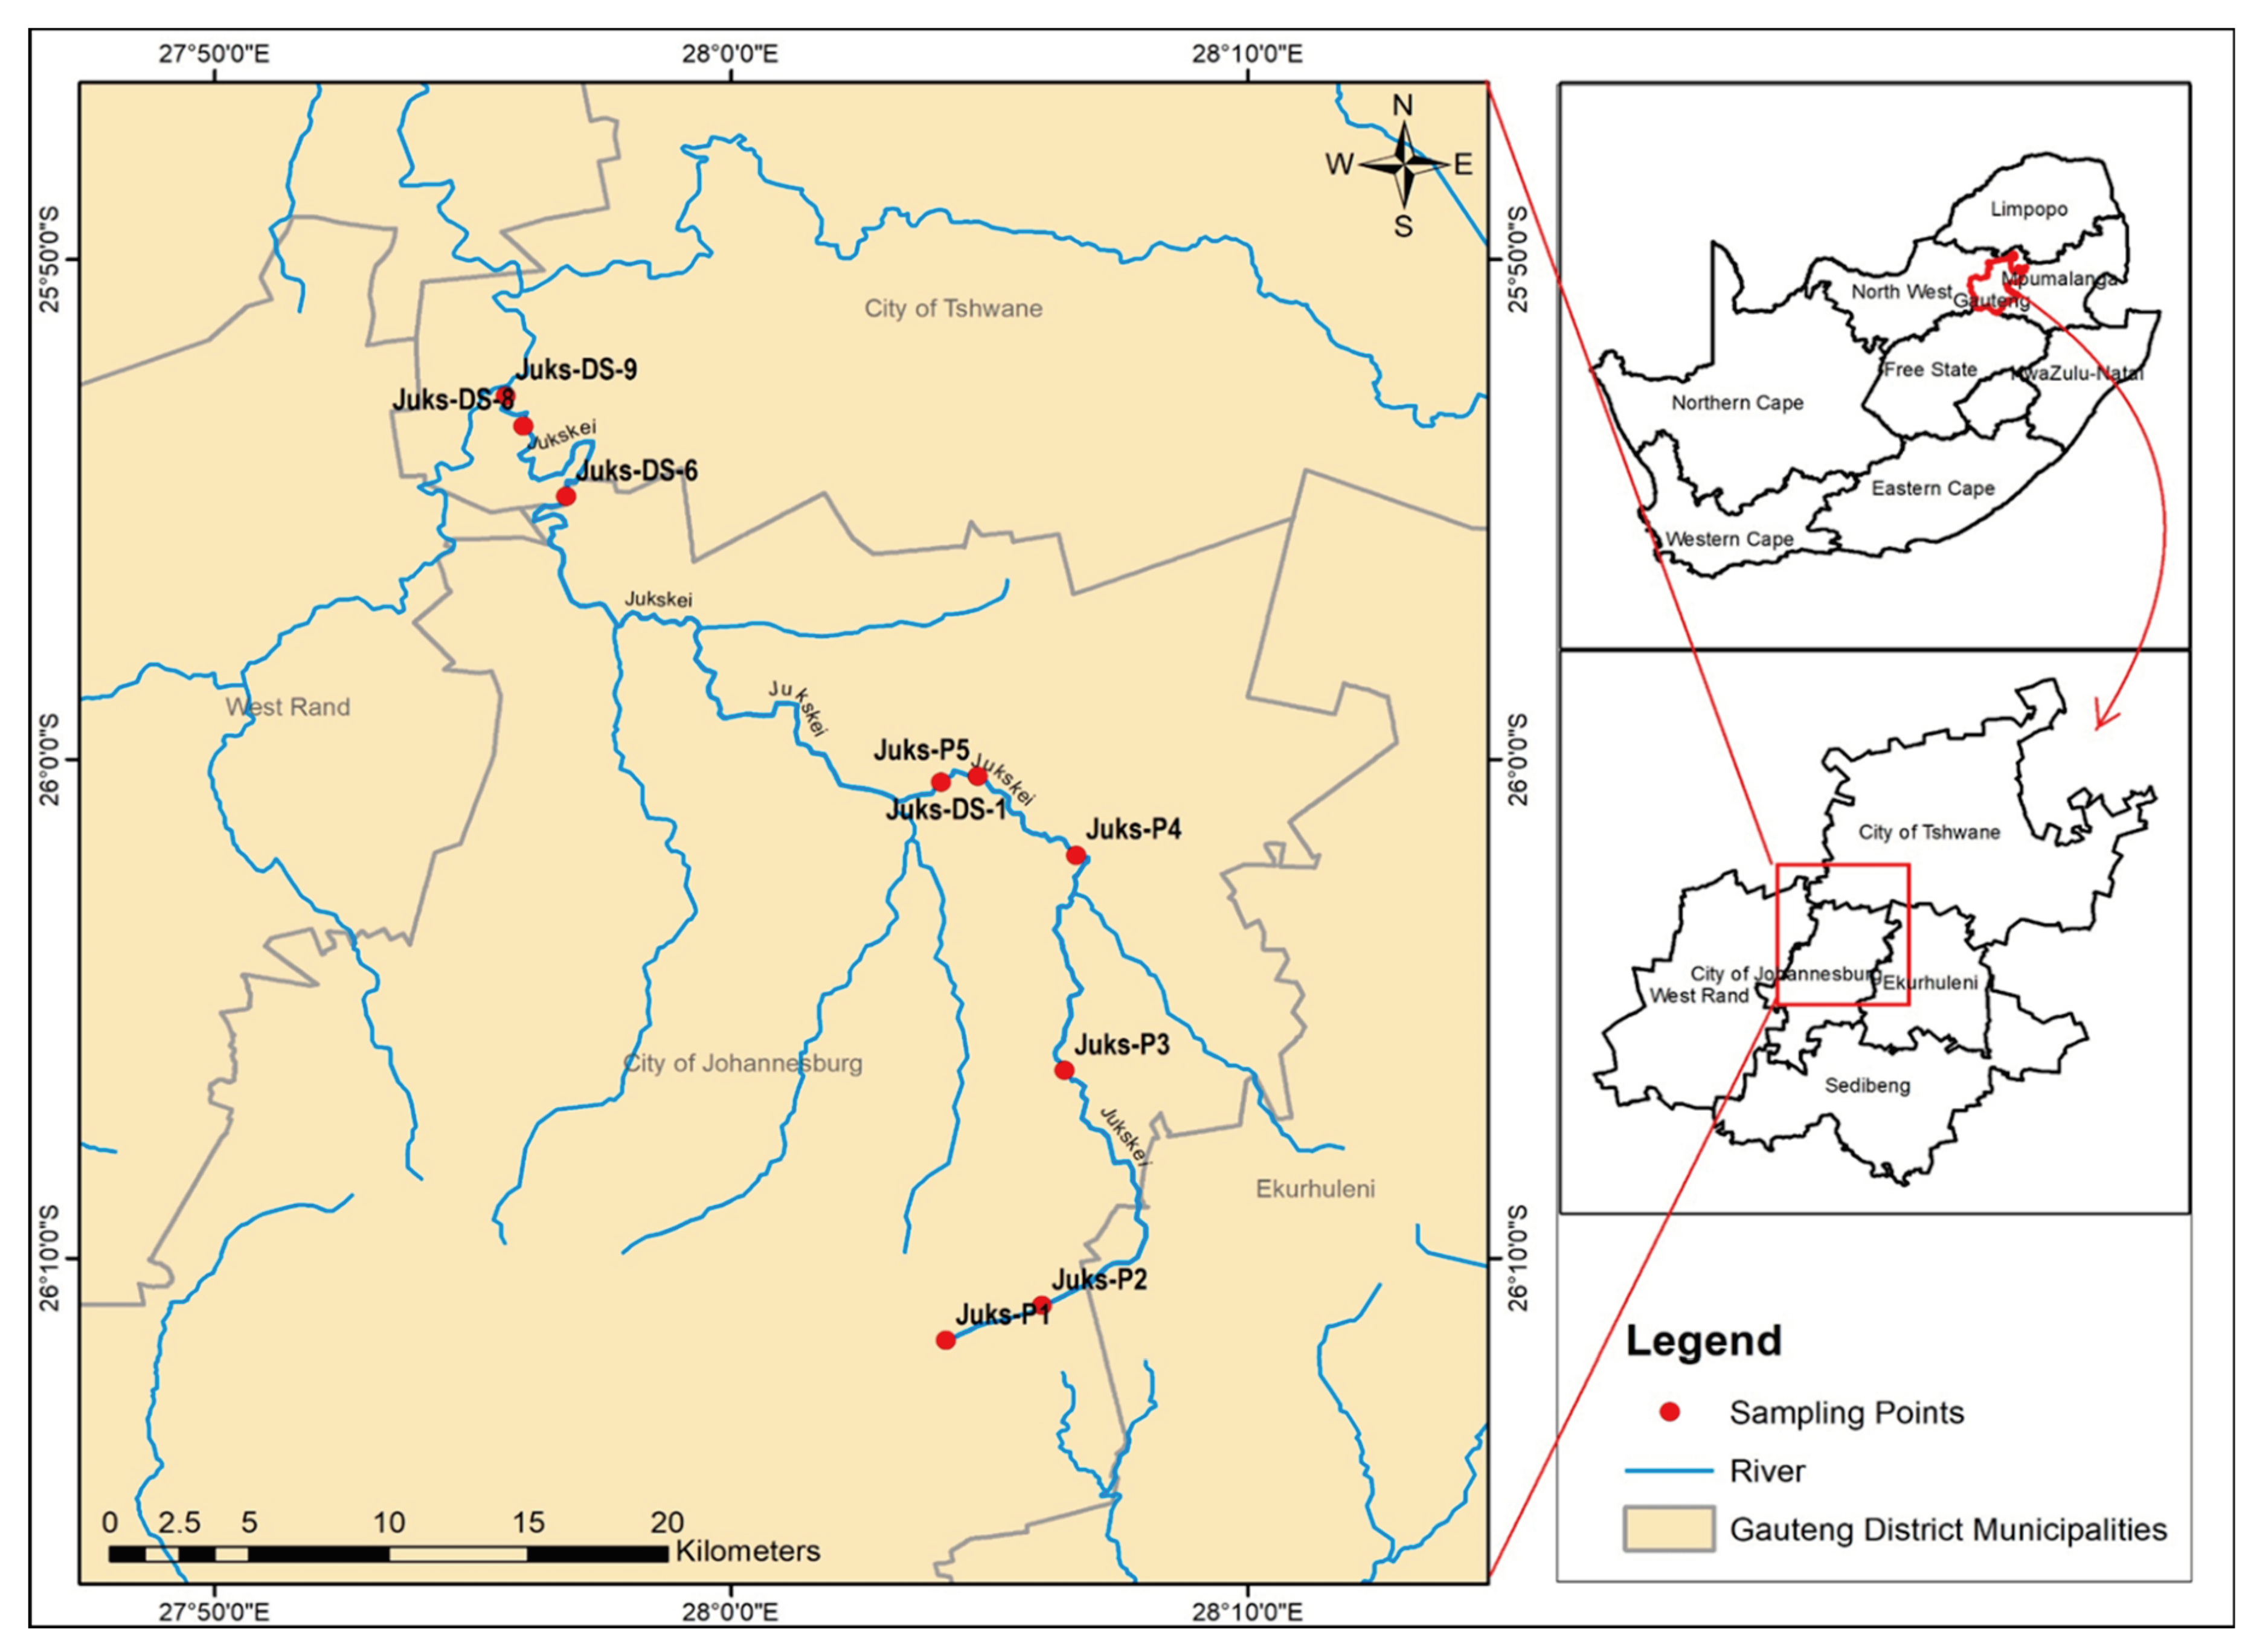
A Sediment collection campaign was conducted during the rainy season using a convenience sampling method. The sampling points on the map (Figure 1) were selected based on the accessibility of the river. Samples were scooped using snapper sediment and a telescopic rod sampling system and decanted into pre-cleaned high-density polyethylene round bottles of 500 mL. In the laboratory, the sediment was air-dried and pulverized to achieve a particle distribution size greater than a 75 μm aperture, and approximately 500 mg of homogenized samples was digested for the mineralization of selected toxic elements.
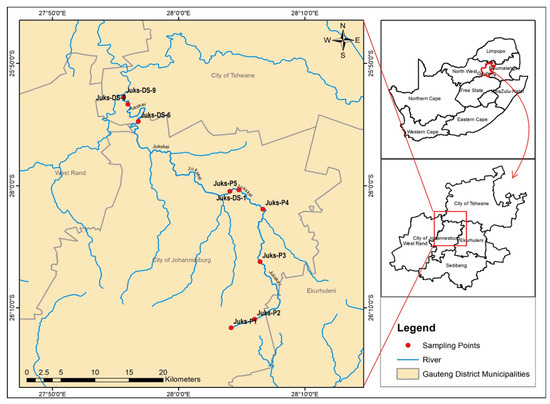
Figure 1.
Sampling map of the Juskei River.
2.3. Reagents and Instrumentation
Chemicals of high purity, which include 77% HClO4 (Merck, Darmstadt, Germany), 30% H2O2 (Merck, Darmstadt, Germany), 37% suprapur HCl (Merck, Darmstadt, Germany), 99.99% Scandium oxide (Hangzhou, China), and 40% HF (Herenba, India), were employed for sample digestion. The calibration curves for the selected elements and the internal standards, rhenium and indium, were prepared using 1000 mg/L stock solutions purchased from Inorganic Ventures (Christiansburg, VA, USA). The certified reference material (CRM) Oreas 121 (Bayswater North, VIC, Australia) was used for quality control check of the analytical procedure. The instruments were optimized and calibrated for accurate analysis of the samples. The 7800inductively coupled plasma mass spectrometry (ICP-MS) (Chico, CA, USA) supplied with argon and helium gas of 99.9% purity was employed for the quantitative determination of toxic elements. Ultra-pure de-ionized water with a resistivity of 18 mΩcm, purified using the Milli-Q Direct 16 purification system (Darmstadt, Germany), was used for the preparation of standards and sample dilutions.
2.4. Mineralization of Analytes of Interest
Approximately 500 mg was weighed directly into the Teflon digestion vessels followed by the addition of HNO3, HClO4, and HF for the two-stage refluxing process on the hotplate. After the digestion vessels were completely dry, they were allowed to cool, followed by the reconstitution step using H2O2 and HCl. The reaction was left to reach room temperature. Then, the samples were transferred to a 50 mL volumetric flask and diluted to the mark with de-ionized water. The Oreas 121 CRM was used to assess the reproducibility and accuracy of the method. Analytes of interest were determined using ICP-MS. The instrumental operating parameters are presented in Table 1. Analytical figures of merit, such as linearity, precision, accuracy, and repeatability of the procedure and quality control checks, were monitored within the scope of International Organization for Standardization (ISO) 17025 accreditation. The ISO 17025 accreditation offers laboratory’s capacity to provide testing and calibration analysis under the implementation of an appropriate quality management system [23].

Table 1.
Optimal parameters of ICP-MS.
2.5. Sediment Quality Assessment
The EF, PLI, CF, and Igeo were the selected pollution index parameters to evaluate the degree of contamination, and formulae were adopted from Kowalski et al. [7] and Vineethkumar et al. [3]. Iron (Fe) is a metal with low variability of occurrence. Therefore, it was used as a reference metal in both the geochemical or baseline background and the analyzed samples to evaluate the impact of human activity on the accumulation of toxic elements in the sediment using enrichment and contamination factor calculations. The background or reference values are pre-requisites for calculating pollution index parameters [23,24]. Table 2 summarizes the background values used.
Table 2.
Reference values for the elements [23,24].
The EF, PLI, CF and Igeo of selected toxic elements were calculated using Equations (1)–(4), respectively. The impact of human activity on the accumulation of toxic elements was assessed based on the range of the degree of contamination [3,14,15,25] of each parameter presented in Table 3, Table 4 and Table 5, respectively.
Table 3.
Enrichment factor assessment in relation to sediment quality [14,15].
Table 4.
Category of contamination factor [3,25].
Table 5.
Classification of geo-accumulation index.
From the equation above, (Cx/Cref)sediment is the ratio of the concentration of the element x to that of the reference element in the sediment sample; (Cx/Cref)background is the ratio of the concentration of the element x to that of reference element.
When assessing the sediment quality of PLI, every element with an EF greater than 1 is regarded polluted, whereas an EF less than 1 indicates unpolluted sediment. The PLI was calculated from Equation (2), where CFn is the CF of the nth metal and n is the number of metals assessed.
Pollution load index (PLI) = (CF1 × CF2 × CF3 × ... CFn) 1/n
The values that define the CF were calculated using Equation (4), where (Cx)sediment is defined as the concentration of the element x in the sample and (Cx)reference is the concentration of the reference element. The range determining the degree of contamination was evaluated based on Table 4.
Igeo (Equation (4)) was employed to estimate the concentration of toxic element accumulation in the sediment above the baseline concentration. In order to compensate for the variations due to lithogenic effects, a 1.5 background matrix factor is used. Table 5 provides the Igeo classification.
Igeo = log(Cn/1.5Bn)
From the equation above,
- Cn is the concentration of element x in the sediment sample;
- Bn is the background or reference value of element n.
3. Results and Discussion
Analysis was performed adhering to the requirements of the ISO 17025 accredited Analytical Chemistry Facility and RadioAnalysis and Calibration Laboratories. Analytical figures of merit were within the acceptable range of the validated and accredited methods.
3.1. Assessment of Selected Toxic Elements
The rapid advancement of human industrialization and economic growth has led to an increase in the pollution of various environmental matrices with heavy metals. Because of their subtle nature, persistent toxicity, and propensity for accumulation, toxic elements have prompted the need for quantitative determination in order to achieve effective environmental pollution monitoring and risk assessment [26]. The total level concentration, radioactivity, and Pearson’s correlation were determined in the Juskei River samples.
3.1.1. Total Quantification of Selected Toxic Elements
The concentrations of As, Pb, Hg, Cd, U, and Th (Table 6) were notable in all the samples collected from the Juskei River. Fe was detected with the highest concentration of 1598 mg/kg, followed by Pb, Th, U, Cd, and Hg, with relative concentrations of 53.4 mg/kg, 4.57 mg/kg, 1.40 mg/kg, and Hg 22.2 μg/kg, respectively. The observed concentration of these hazardous elements is of concern for the river that meanders around the residential and industrial areas of Gauteng. The different concentrations distributed among the sampling sites can be attributed to different activities. Juks-P2 has a high concentration of Pb, which may be due to the mishandling of waste from many industries and other human activities. For instance, minibuses and taxis are the main source of transport in Johannesburg; as a result, there is a mushrooming of many informal vehicle maintenance facilities. Paints, oil, and petrol, three extremely dangerous and poisonous chemicals, have been used in these workplaces on a progressively growing basis. Because these shops and vehicle repair companies are tiny and have few resources, hazardous materials are frequently handled carelessly and disposed of into the environment incorrectly and thus end up accumulating in the river sediments [27].
Table 6.
Quantities of for ultra-low toxic elements obtained by ICP MS.
The Pb compounds originating from these workshops pose significant hazards to human health and the environment. Prolonged exposure to lead compounds in humans can lead to elevated blood pressure, cardiovascular issues, and kidney damage. Pregnant women who are exposed to elevated levels of lead may experience low birth weight, early delivery, miscarriage, and stillbirth. The concentration observed for other elements is of concern because Hg, Th, U, As, and Cd do not provide any nutritional value to humans. Even at low concentrations, Hg poses significant problems [26]. The Witwatersrand region of Gauteng has been the epicenter of Au mining since the 18th century. Liquid Hg has been used to extract pure Au and silver (Ag) from the mineral ores because it creates a stable amalgam with Au and Ag. Heat causes Hg to evaporate during amalgamation, resulting in pure Au and Ag [28]. Hg poisoning results in improper functioning of the kidneys and central nervous system [29]. The significant contribution of U and Th that are found in the Juskei River is the result of the legacy of Au mining. Mine dumps and acid mine drainage are the biggest threat in Gauteng [12,30].
3.1.2. Radioactivity Determination of Thorium and Uranium
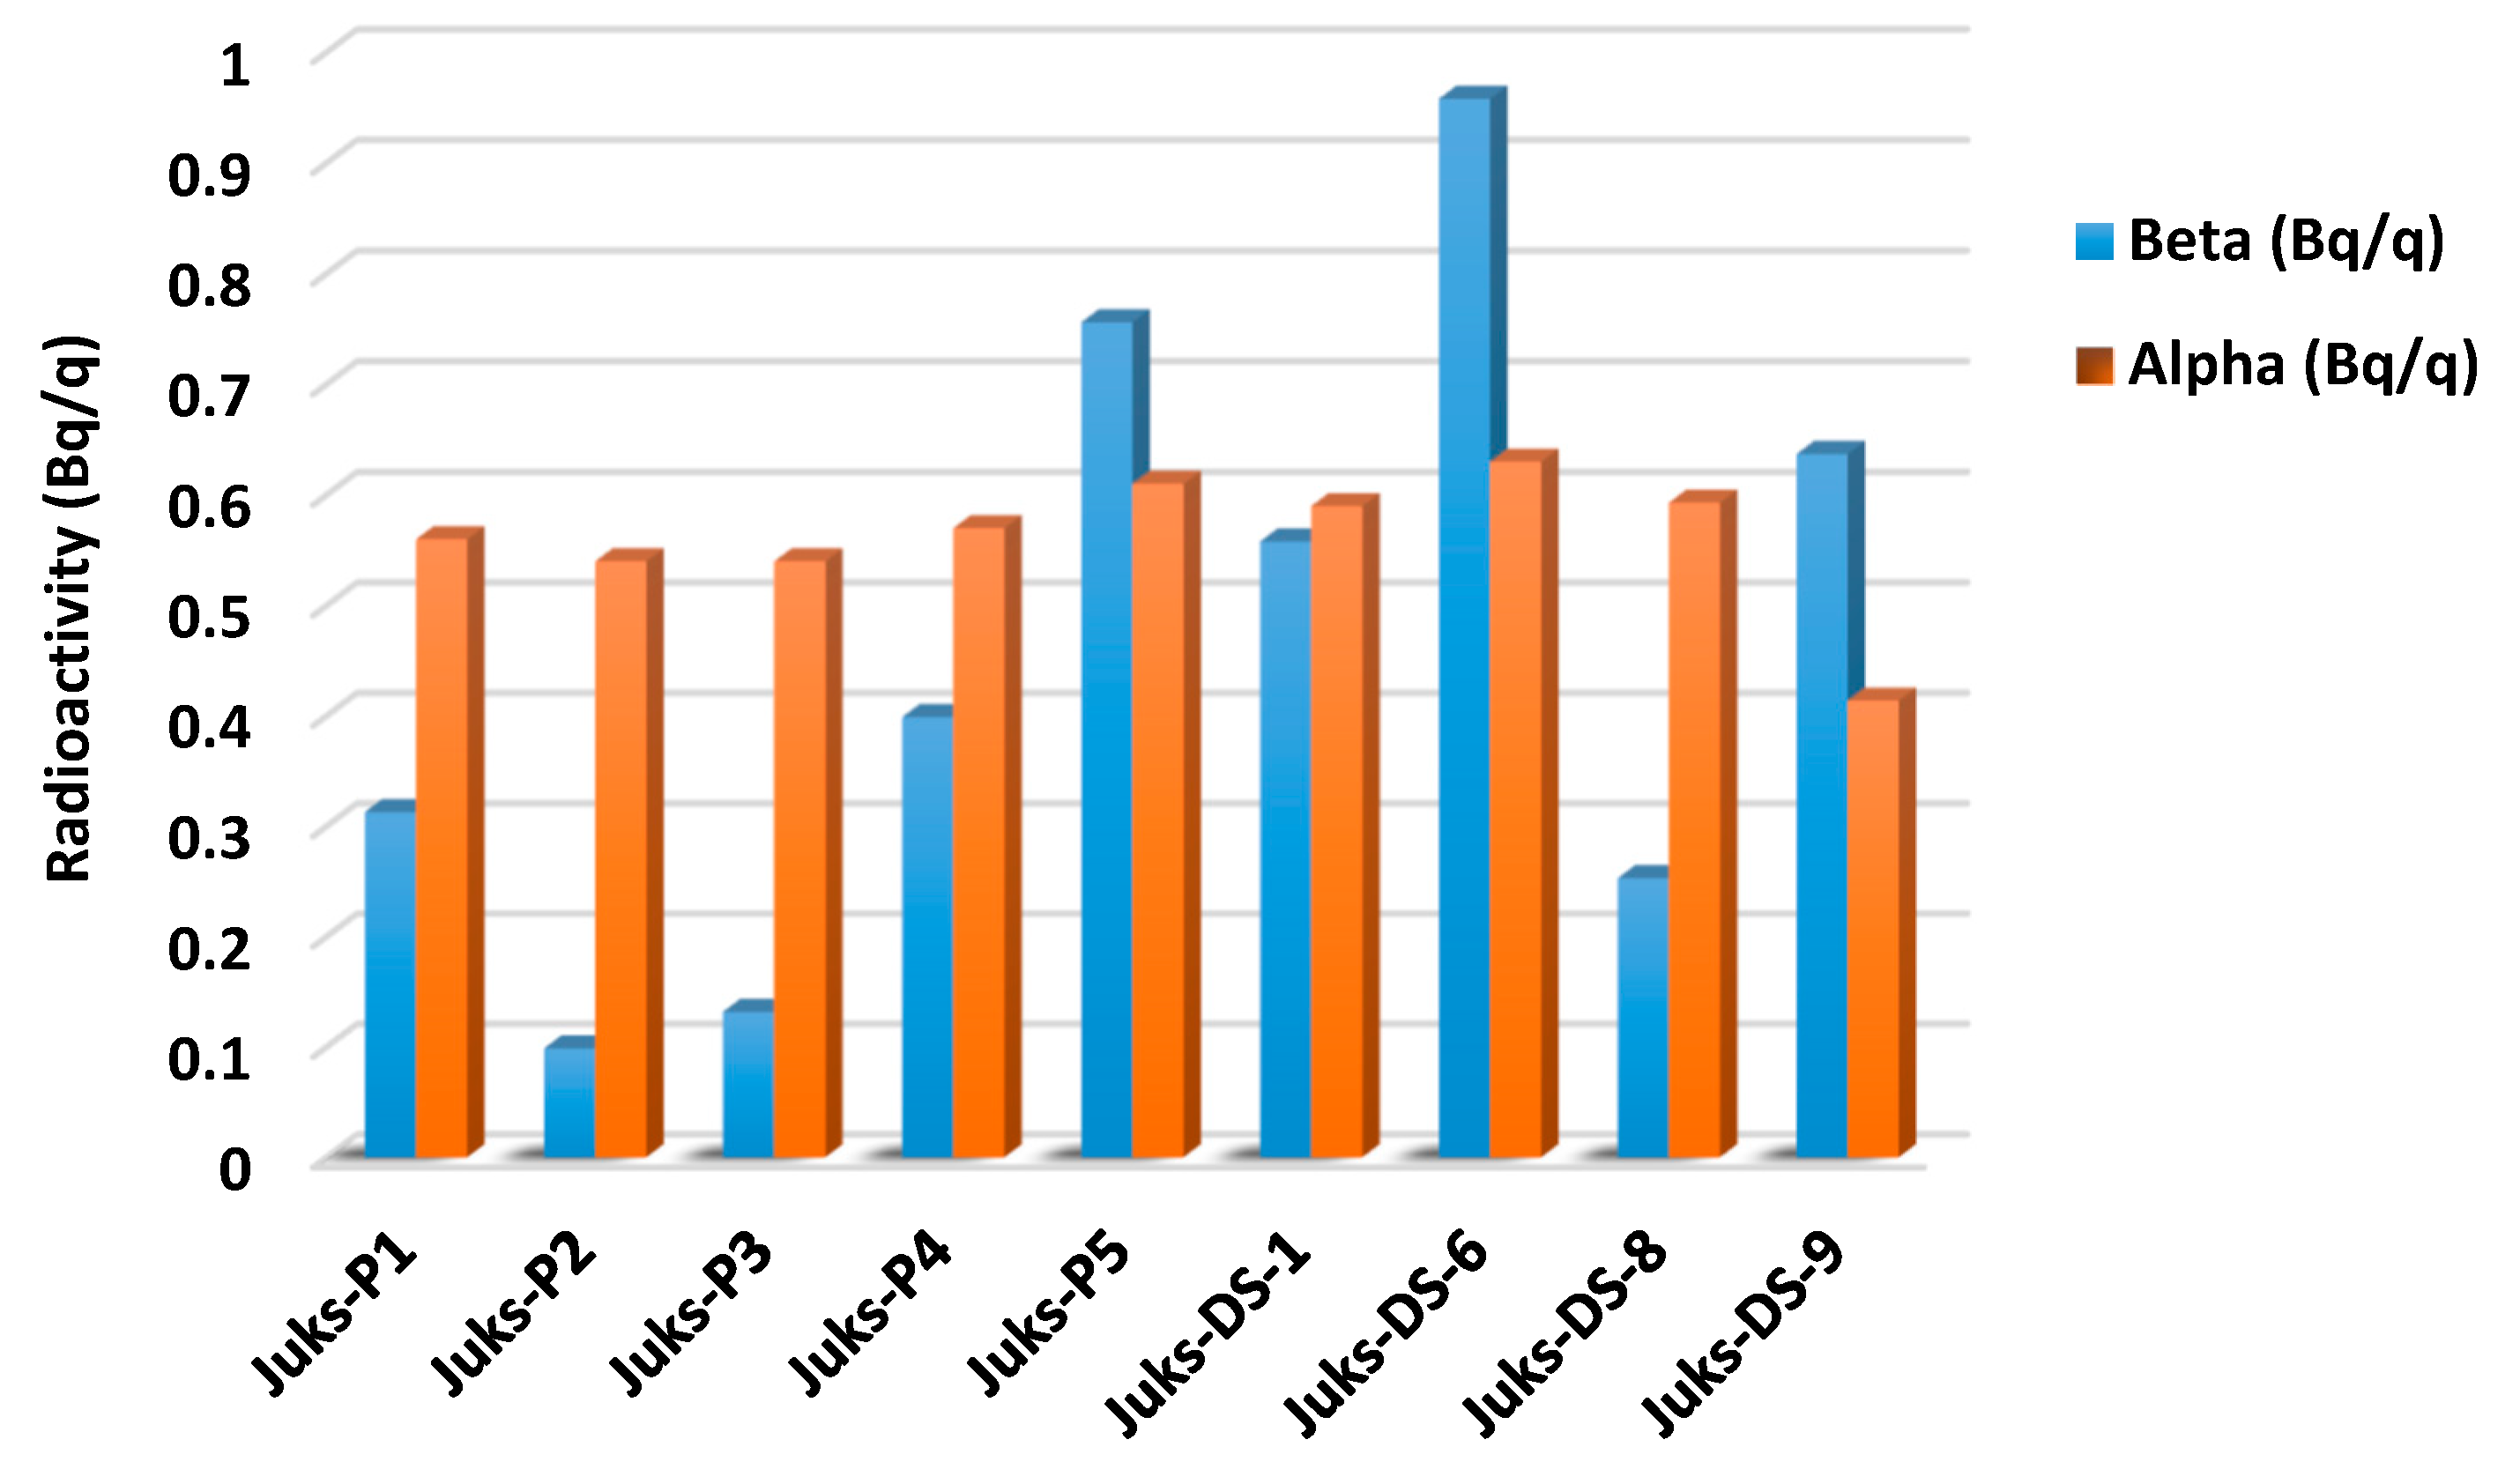
An increase in ambient natural background radiation can be caused by radiation pollution of the environment from both artificial and natural sources. The rise in radioactive environmental contamination from anthropogenic and natural sources, leading to radiation exposure of humans and aquatic biomes, has rendered measuring the gross alpha and beta radiation concentrations of various environmental matrices increasingly relevant [31,32]. The amount of the radionuclide elements Th and U ranging between 3.46–5.88 mg/kg and 1.26–2.86 mg/kg was imperative to determine gross alpha and beta radioactivity, which serves as the foundation for evaluating radioactive material and suggesting stringent radiation safety guidelines [32,33,34]. The sampling points Juks-P5, Juks-DS-6, and Juks-DS-9 exhibited considerable amounts of gross beta radioactivity, whereas the gross alpha beta was notable at Juks-P5, Juks-DS-6, and Juks-DS-8, as observed in Figure 2. These notable amounts in the river sediment can be attributed to various sources, such as natural weathering, atmospheric depositions, anthropogenic activities, and traffic emissions. The amount of Th and U as well as their overall beta and alpha radioactivity suggested a possible reflection of radioactive contamination of the Juskei River while also showing significant hazard to the benthic community of the river sediment [35].
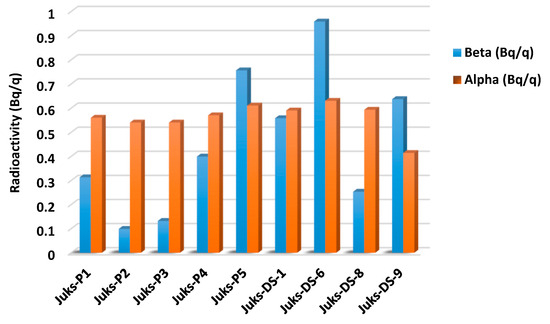
Figure 2.
The gross beta and alpha radioactivity of radionuclide elements.
3.1.3. Pearson Correlation Coefficient
The Pearson correlation coefficient is an important criterion used to measure the strength of a linear association between two elements to determine the same type of pollution sources and delivery pathway. It was calculated by plotting the graphs of pairs of toxic elements’ concentrations from Table 7 and obtaining the regression coefficient (r). The r values equating to 1 for each pair exhibit strong correlation, which can deviate to no correlation when the value is zero. The correlation analysis (Table 7) obtained using the Pearson correlation coefficient shows a moderate correlation between As and Pb, indicated by the value 0.3241. This may indicate that the same type of contamination source is responsible for the contamination of the Juskei River.
Table 7.
Pearson correlation matrix.
Statistical analysis also shows that there is a weak correlation between As and Hg and also between Hg and Cd. Even though there is a weak correlation between Hg and Cd, this possible association might be due to artisanal gold mining that is rampant in Gauteng. Hg is used in the processing of gold, and it has been reported that artisanal mining is the source of anthropogenic Hg release to the environment [21]. The other negative impact of mining is the generation of large amounts of Cd-rich wastes, including acid mine drainages tailings, slags, and dust [18]. Acid mine drainage contains a high amount of pyrite, and the impact of acid mine drainage on the lives and the environment in Gauteng and beyond is affecting the livelihood of many people. Acid mine drainage contains Fe, As, Pb, Cd, and U, among other elements [20]. Correlation analysis reveals a significantly high degree of correlation between Fe and As, and Pb and Fe, with the values of 0.5068 and 0.6521, respectively. From Table 7, it is important to note that Cd and Fe as well as Pb and Cd, with the values of 0.374 and 0.3831, respectively, were significantly correlated on the Pearson correlation test with moderate strength. This may indicate that their anthropogenic sources might be the same considering that these metals are present in the mine effluents and have a significant impact on the quality of freshwater resources [36]. Moreover, the p-values obtained using ANOVA calculations for Pb-Fe, As-Fe, and Pb-Cd were 1.40 × 10⁻⁷ and 1.32 × 10⁻⁷ and-0.143, respectively, showing a significant correlation to their emission source. A p < 0.05 is deemed statistically significant, and the correlation between Pb and Cd is insignificant with p = 0.143. Based on the literature, a p > 0.05 indicates that Pb and Cd do not have a significant correlation.
3.2. Pollution Indices for Sediment Quality Assessment
A sediment quality assessment of the Juskei River using pollution indicators, such as EF, PLI, CF, and Igeo, is required to consider the accumulation of toxic elements. The pollution indicators serve as key tools in the overall assessment of the degree of sediment contamination.
3.2.1. Enrichment Factor and Contamination Factor
The EF and CF are frequently used complementary metrics for assessing sediment quality. The EF is mostly used to determine how much an element’s presence in a sample has been enhanced by human activity in comparison to its average natural abundance. Meanwhile, the ratio of the element’s pre-industrial reference value to the hazardous element content in sediment can be used to compute the CF [3,32]. As observed in Table 8 and Table 9, Pb shows severe EF at sampling point Juks-P2 and minimal enrichment at sampling points Juks-DS-1 and Juks-DS-6, with a considerable contamination factor within the entire sampling points. The EF and CF of Pb and Hg suggest anthropogenic input. Additionally, a great concern is the sampling point Juks-1, which has an enrichment of 1.98, even though it is marginally lower than 2. Enrichment factor results showed that there is high Hg activity in the Juskei River. The samples Juks-P4, Juks-DS-8, and Juks-DS-9 showed an EF of over 1. Hg and Pb contamination are observed to be a significant problem for Juskei. The values of CF are based on moderate contamination, and for sample Juks-P1, Hg CF is classified as considerable contamination. These findings indicate that special attention must be paid to efforts to reduce toxic metal pollution. Conversely, the pollution indices of other toxic elements, indicating no to minimal enrichment and contamination factors, suggest that natural processes are involved. Nonetheless, As is found in all sampling points, which indicates the possibility of anthropogenic sources. With 21 nations reporting environmental contamination from As, chronic As pollution is acknowledged as a global issue [37]. Some of the anthropogenic sources include coal-fired power stations and pesticides.
Table 8.
Enrichment factor for toxic elements in the Juskei River.
Table 9.
Contamination factors for toxic elements in the Juskei River.
In the area that Juskei transverse closely there is coal fired powered power station. In the seminal study by Rother [38], the proliferation of legal and illegal uses of pesticides, especially by users who do not have scientific knowledge to understand the risks and health hazards associated with the uses of pesticides, is explored in detail. The presence of Cd in the river sediments might be decoded as the worrying trend of runaway sewage polluting the Juskei River, as reported by Webster et al. [22]. The burning of fossil fuels releases Cd into the atmosphere. It is used in batteries, paints, plastics, and electroplating, among other products. Phosphorous fertilizers and sewage sludge are also anthropogenic sources of cadmium emissions into the environment [39]. It is reported that one cigarette contains 1–2 mg Cd, and most of it is absorbed by the body. Because cations, in particular Zn2+ and Ca2+, have comparable valence and radius, Cd2+ can mimic them, which contributes to some of their toxicity. This element, which can be replaced by Cd, is essential to the functioning of the body. All the metals and metalloids discussed above offer no nutritional value, and even at ultra-low concentrations, they can pose a risk to the environment and humans. The accumulation of these elements in the sediments reveals that anthropogenic sources might be the source of pollution rather than natural sources, considering that potential sources exist around the Juskei River and also along the streams that are tributaries of the Juskei mentioned above.
3.2.2. Pollution Loan Index and Geo-Accumulation Index
The PLI usually quantifies toxic element pollution to provide insight into the contamination status of sediment relative to toxic elements. The amount of toxic elements found in sediment in relation to their natural background values is shown by the Igeo indicator [3,32]. For every sampling point, the PLI was determined, and as presented in Table 10, pollution is indicated by a PLI value > 1, whereas no pollution is indicated by a PLI value < 1. The PLI values for sampling points Juk-P2 and Juks-P5 were 1.08 and 1.00, respectively, which indicate significant pollution in the upstream part of the river. As indicated above, there are several tributaries of the Juskei River, which is evidenced by pollution from these two sampling points, whereas the other seven sampling points do not show pollution. Table 11 shows the calculated Igeo values. It is clear from these values that all elements fall into Class “o” at all sample sites, with the exception of lead, suggesting no contamination. The Igeo values for lead show that the Juks-P3, Juks-P4, Juks-P5, Juks-DS-1, Juks-DS-6, and Juks-DS-9 sampling points range from uncontaminated to moderately contaminated, with the Juks-P1 and Juks-DS-8 sampling points showing moderate lead contamination. Sampling point Juks-P2 shows Class 6, which is extreme Pb contamination.
Table 10.
Pollution load index for toxic elements in the Juskei River.
Table 11.
Geo-accumulation I(geo) of toxic elements in the Juskei river.
4. Conclusions
The study shows that human activities have an impact on the distribution and enrichment of toxic chemicals in the Juskei River. The low enrichment and contamination factors of some of these elements suggest enrichment through natural weathering processes and atmospheric deposition. Nonetheless, Pb and Hg contribution strongly indicates anthropogenic input through industrial activities, disposal of sewage, use of fertilizers from agricultural fields, domestic waste, acid mine drainage, and urban wastes in the river system. The Juskei River’s sediment quality is not toxic by nature, as demonstrated by the pollution indices, and neither of the toxic elements’ levels have surpassed the permissible levels. The pollution indices show that there is significant Pb pollution in the Juskei River, which necessitates close monitoring of the river sediment samples on a regular basis to assess the impact of toxic elements in the research area.
Author Contributions
Conceptualization, M.R.L.; Investigation, N.N. and M.H.M.; Resources, A.M., L.C. and J.T.; Writing—original draft, N.M.; Supervision, M.R.L., L.C. and J.T.; Funding acquisition, M.R.L. All authors have read and agreed to the published version of the manuscript.
Funding
This research was funded by the Water Research Commission (C2023-2024-01320), Mintek internal Science Vote (ASR-002517 and ASR-024032).
Data Availability Statement
The authors will provide the raw data without undue delay in order to substantiate the conclusions of this article.
Conflicts of Interest
The authors declare that they have no conflicts of interest.
References
- Pandey, S.; Kumari, N. Assessment of Morphology and Soil Erosion Risk in Agrarian Watershed of Jharkhand India Using RUSLE, GIS and MCDA-AHP. J. Indian Soc. Remote. Sens. 2024, 1–20. [Google Scholar] [CrossRef]
- Chapman, P.M.; Wang, F.; Caeiro, S.S. Assessing and managing sediment contamination in transitional waters. Environ. Int. 2013, 55, 71–91. [Google Scholar] [CrossRef]
- Vineethkumar, V.; Sayooj, V.V.; Shimod, K.P.; Prakash, V. Estimation of pollution indices and hazard evaluation from trace elements concentration in coastal sediments of Kerala, Southwest Coast of India. Bull. Natl. Res. Cent. 2020, 44, 1–16. [Google Scholar] [CrossRef]
- Birch, G. A review of chemical-based sediment quality assessment methodologies for the marine environment. Mar. Pollut. Bull. 2018, 133, 218–232. [Google Scholar] [CrossRef] [PubMed]
- Gqomfa, B.; Maphanga, T.; Shale, K. The impact of informal settlement on water quality of Diep River in Dunoon. Sustain. Water Resour. Manag. 2022, 8, 1–18. [Google Scholar] [CrossRef]
- Rangel-Buitrago, N.; Rizzo, A.; Neal, W.J.; Mastronuzzi, G. Sediment pollution in coastal and marine environments. Mar. Pollut. Bull. 2023, 192, 115023. [Google Scholar] [CrossRef]
- Kowalska, J.B.; Mazurek, R.; Gąsiorek, M.; Zaleski, T. Pollution indices as useful tools for the comprehensive evaluation of the degree of soil contamination–A review. Environ. Geochem. Health 2018, 40, 2395–2420. [Google Scholar] [CrossRef]
- Zhang, L.; Shao, H. Heavy Metal Pollution in Sediments from Aquatic Ecosystems in China. CLEAN–Soil Air Water 2013, 41, 878–882. [Google Scholar] [CrossRef]
- Biswas, N.; Ghosh, A.; Mitra, S.; Majumdar, G. Environmental issues associated with mining and minerals processing. Compr. Mater. Process. 2024, 8, 77–86. [Google Scholar] [CrossRef]
- Rejuvenating South Africa’s economy—The Role of the Energy Sector, no. January 2022. Available online: https://www.inclusivesociety.org.za/post/rejuvenating-south-africa-s-economy-the-role-of-the-energy-sector (accessed on 28 August 2024).
- Letsoalo, M.R.; Godeto, T.W.; Magadzu, T.; Ambushe, A.A. Quantitative Speciation of Arsenic in Water and Sediment Samples from the Mokolo River in Limpopo Province, South Africa. Anal. Lett. 2018, 51, 2763–2777. [Google Scholar] [CrossRef]
- Raji, I.B.; Hoffmann, E.; Ngie, A.; Winde, F. Assessing uranium pollution levels in the rietspruit river, far west rand goldfield, South Africa. Int. J. Environ. Res. Public Health 2021, 18, 8466. [Google Scholar] [CrossRef]
- Swain, C.K. Environmental pollution indices: A review on concentration of heavy metals in air, water, and soil near industrialization and urbanisation. Discov. Environ. 2024, 2, 5. [Google Scholar] [CrossRef]
- Olivarez, M.B.; Tovar, M.A.M.; Sánchez, J.V.; Betancourt, M.L.G.; Romero, F.M.; Arteaga, A.M.R.; Chávez, G.E.M.; Noreña, H.A.S. Mobility of Heavy Metals in Aquatic Environments Impacted by Ancient Mining-Waste. In Water Quality—Factors and Impacts; IntechOpen: London, UK, 2022. [Google Scholar] [CrossRef]
- Dintsi, B.S.; Letsoalo, M.R.; Ambushe, A.A. Bioaccumulation and Human Health Risk Assessment of Arsenic and Chromium Species in Water–Soil–Vegetables System in Lephalale, Limpopo Province, South Africa. Minerals 2023, 13, 930. [Google Scholar] [CrossRef]
- Letsoalo, M.R.; Mamo, M.A.; Ambushe, A.A. Synchronous Extraction and Quantitative Speciation of Arsenic and Chromium in Sediments by High-Performance Liquid Chromatography—Inductively Coupled Plasma—Mass Spectrometry (HPLC-ICP-MS). Anal. Lett. 2020, 54, 1943–1967. [Google Scholar] [CrossRef]
- Letsoalo, M.R.; Mamo, M.A.; Ambushe, A.A. Simultaneous quantitative speciation of selected toxic elements in water using high performance liquid chromatography coupled to inductively coupled plasma-mass spectrometry (HPLC-ICP-MS). Phys. Chem. Earth, Parts A/B/C 2021, 124, 103011. [Google Scholar] [CrossRef]
- Li, Y.; Cheng, X.; Liu, K.; Yu, Y.; Zhou, Y. A new method for identifying potential hazardous areas of heavy metal pollution in sediments. Water Res. 2022, 224, 119065. [Google Scholar] [CrossRef]
- Chetty, S.; Pillay, L.; Humphries, M.S. Gold mining’s toxic legacy: Pollutant transport and accumulation in the Klip River catchment, Johannesburg. South Afr. J. Sci. 2021, 117, 87–97. [Google Scholar] [CrossRef]
- Moshupya, P.M.; Mohuba, S.C.; Abiye, T.A.; Korir, I.; Nhleko, S.; Mkhosi, M. In Situ Determination of Radioactivity Levels and Radiological Doses in and around the Gold Mine Tailing Dams, Gauteng Province, South Africa. Minerals 2022, 12, 1295. [Google Scholar] [CrossRef]
- Hoorzook, K.B.; Pieterse, A.; Heine, L.; Barnard, T.G.; van Rensburg, N.J. Soul of the jukskei river: The extent of bacterial contamination in the jukskei river in gauteng province, South Africa. Int. J. Environ. Res. Public Health 2021, 18, 8537. [Google Scholar] [CrossRef]
- Webster, J.; Iqani, M. Johannesburg’s shitty little river: Faecal discourse and discontent regarding the Jukskei. A J. Afr. Stud. 2024, 50, 109127. [Google Scholar] [CrossRef]
- Understanding and Implementing ISO/IEC 17025 A Primer. 2009. p. 64. Available online: https://www.demarcheiso17025.com (accessed on 28 August 2024).
- Guan, Y.; Shao, C.; Ju, M. Heavy metal contamination assessment and partition for industrial and mining gathering areas. Int. J. Environ. Res. Public Health 2014, 11, 7286–7303. [Google Scholar] [CrossRef]
- Cohen, D.; Rutherford, N. Technical Report on the Development of a Geochemical Atlas of Cyprus. Geol. Surv. Cyprus Lefkosia 2011, 1 1–104. Available online: https://www.moa.gov.cy/moa/gsd/gsd.nsf/38c34d0122ca5340c22585f300382a45/25e685022ae4ef99c2258601001e081d/$FILE/Geochemical%20Atlas%20of%20Cyprus%20FinalReport_Volume%201_Text.pdf (accessed on 28 August 2024).
- Al-Dahar, R.K.; Rabee, A.M.; Mohammed, R.J. Calculation of soil pollution indices with elements in residential areas of Baghdad city. Bionatura 2023, 8, 1–7. [Google Scholar] [CrossRef]
- Zhou, X.; Wu, Z.; Chen, B.; Zhou, Z.; Liang, Y.; He, M.; Hu, B. Quantification of trace heavy metals in environmental water, soil and atmospheric particulates with their bioaccessibility analysis. Talanta 2024, 276, 126284. [Google Scholar] [CrossRef] [PubMed]
- Uddin, K.; Majumder, A.K.; Hossain, S.; Al Nayeem, A. Pollution and Perceptions of Lead in Automobile Repair Shops in Dhaka, Bangladesh. J. Health Pollut. 2019, 9, 190609. [Google Scholar] [CrossRef] [PubMed]
- Whiteside, T.G.; Esparon, A.J.; Bartolo, R.E. A semi-automated approach for quantitative mapping of woody cover from historical time series aerial photography and satellite imagery. Ecol. Informatics 2020, 55, 101012. [Google Scholar] [CrossRef]
- Basu, N.; Bastiansz, A.; Dórea, J.G.; Fujimura, M.; Horvat, M.; Shroff, E.; Weihe, P.; Zastenskaya, I. Our evolved understanding of the human health risks of mercury. AMBIO 2023, 52, 877–896. [Google Scholar] [CrossRef] [PubMed]
- Bwapwa, J.K. A Review of Acid Mine Drainage in a Water-Scarce Country: Case of South Africa. Environ. Manag. Sustain. Dev. 2017, 7, 1. [Google Scholar] [CrossRef]
- Radiobiology Textbook; Springer Nature: Dordrecht, The Netherlands, 2023.
- Rahman, M.S.; Ahmed, Z.; Seefat, S.M.; Alam, R.; Islam, A.R.M.T.; Choudhury, T.R.; Begum, B.A.; Idris, A.M. Assessment of heavy metal contamination in sediment at the newly established tannery industrial Estate in Bangladesh: A case study. Environ. Chem. Ecotoxicol. 2021, 4, 1–12. [Google Scholar] [CrossRef]
- Saad, H.; Al-Azmi, D. Radioactivity concentrations in sediments and their correlation to the coastal structure in Kuwait. Appl. Radiat. Isot. 2002, 56, 991–997. [Google Scholar] [CrossRef]
- Choudhury, T.R.; Ferdous, J.; Haque, M.; Rahman, M.; Quraishi, S.B. Assessment of heavy metals and radionuclides in groundwater and associated human health risk appraisal in the vicinity of Rooppur nuclear power plant, Bangladesh. J. Contam. Hydrol. 2022, 251, 104072. [Google Scholar] [CrossRef]
- Masindi, V.; Foteinis, S.; Renforth, P.; Ndiritu, J.; Maree, J.; Tekere, M.; Chatzisymeon, E. Challenges and avenues for acid mine drainage treatment, beneficiation, and valorisation in circular economy: A review. Ecol. Eng. 2022, 183, 106740. [Google Scholar] [CrossRef]
- Patel, K.S.; Pandey, P.K.; Martín-Ramos, P.; Corns, W.T.; Varol, S.; Bhattacharya, P.; Zhu, Y. A review on arsenic in the environment: Contamination, mobility, sources, and exposure. RSC Adv. 2023, 13, 8803–8821. [Google Scholar] [CrossRef] [PubMed]
- Rother, H.-A. Pesticide labels: Protecting liability or health?—Unpacking “misuse” of pesticides. Curr. Opin. Environ. Sci. Health 2018, 4, 10–15. [Google Scholar] [CrossRef]
- Khan, Z.; Elahi, A.; Bukhari, D.A.; Rehman, A. Cadmium sources, toxicity, resistance and removal by microorganisms-A potential strategy for cadmium eradication. J. Saudi Chem. Soc. 2022, 26, 101569. [Google Scholar] [CrossRef]
Disclaimer/Publisher’s Note: The statements, opinions and data contained in all publications are solely those of the individual author(s) and contributor(s) and not of MDPI and/or the editor(s). MDPI and/or the editor(s) disclaim responsibility for any injury to people or property resulting from any ideas, methods, instructions or products referred to in the content. |
© 2024 by the authors. Licensee MDPI, Basel, Switzerland. This article is an open access article distributed under the terms and conditions of the Creative Commons Attribution (CC BY) license (https://creativecommons.org/licenses/by/4.0/).