Article

The Influence of the Morphological Characteristics of Mining-Induced Ground Fissures on the Spatiotemporal Distribution of Soil Moisture

1
State Key Laboratory of Water Resources Protection and Utilization in Coal Mining, Beijing 102299, China
2
Satellite Application Center for Ecology and Environment, Ministry of Ecology and Environment of People’s Republic of China, Beijing 100094, China
3
School of Mining and Geomatics Engineering, Hebei University of Engineering, Handan 056038, China
4
China Academy of Safety Science and Technology, Beijing 100012, China
5
Shendong Coal Group Co., Ltd., Yulin 719315, China
*
Author to whom correspondence should be addressed.
Water 2024, 16(17), 2496; https://doi.org/10.3390/w16172496
Submission received: 4 July 2024 / Revised: 21 August 2024 / Accepted: 27 August 2024 / Published: 2 September 2024
(This article belongs to the Special Issue The Research on Effects of Mining on Groundwater Environment)

Abstract

:
In order to study the influence of fissure morphology on soil moisture-content changes under different fissure types, this study established HYDRUS 2.0 numerical models of stepped fissures and planar fissures with different fissure widths and depths based on the experimental condition parameters obtained from physical simulation tests. Then, we simulated the spatial and temporal variation rules of soil moisture around the fissures. The results showed a high level of agreement between the HYDRUS numerical simulations and actual measurements, indicating that the model accurately reflects the movement of soil moisture near fissures. The study found that ground fissures affected the spatial distribution of soil moisture, leading to an increased rate of moisture loss in the deep soil near the fissure walls. Moreover, larger fissures had greater horizontal and vertical effects on soil moisture. The soil moisture content is lower closer to the fissure walls. As the soil depth increased, the influence of the fissures gradually diminished. For planar fissure with a depth of 50 cm, the soil moisture content was 30.6%, 17.8%, and 8.4% lower at depths of 10, 30, and 50 cm, respectively, compared to a fissure with a depth of 10 cm. For a stepped fissure with a depth of 50 cm, the soil moisture content was 29.2%, 20.9%, and 13.9% lower at depths of 10, 30, and 50 cm, respectively, compared to a fissure with a depth of 10 cm. Under the same conditions of fissure width and depth, stepped fissures exhibit faster moisture loss, and the larger the fissure, the more significant the additional moisture loss compared to planar fissures.

1. Introduction

Coal mining often lead to surface subsidence, which can result in the formation of ground fissures that pose significant risks to buildings, roads, bridges, underground pipelines, and other engineering facilities [1]. The morphological features of fissures alter the composition of the surface soil, causing it to fracture and revealing the underlying soil to the environment. This not only harms the root system of the vegetation but also has the potential to cause modifications in soil properties and a decline in water-holding capacity [2,3]. In regions with scarce water resources, re-establishing vegetation can be a difficult task, which in turn impedes the sustainable development of mining and ecosystem preservation [2]. Understanding the moisture distribution characteristics of ground fissures is crucial from both scientific and engineering perspectives and offers valuable insights for ecological restoration in areas experiencing subsidence.
Several studies have investigated the effects of ground fissures on soil moisture. Some studies have indicated that soil moisture content in ground fissure areas is significantly lower than that in non-subsided areas. Ground fissures can lead to expansion of the soil fissure surface and a decline in the water-holding capacity of the soil [4,5]. For instance, Chen et al. simulated subsidence fissures using differently sized models on horizontal soil columns to investigate the impact of fissures on moisture diffusion in non-continuous homogeneous soil [6]. They found that fissures changed the diffusion of soil moisture, and the rate of soil moisture diffusion correlated negatively with fissure width. Additionally, Du et al. measured the soil moisture content and surface shear strength in the vertical fissure direction [7]. Their results indicated that soil moisture content was positively correlated with the distance from measurement points to fissures, suggesting that the presence of surrounding fissures reduces the soil’s ability to retain moisture. Conversely, the soil shear strength is positively correlated with the distance from the fissure, indicating that the presence of fissures affects the surrounding soil structure and reduces its shear strength, thus accelerating soil erosion. Xu conducted field measurements of soil moisture content at different distances from fissures and found that the range of soil moisture content affected by fissures was about 120 cm, and moisture loss had a significant influence on crop yield [8]. To quantify the factors affecting soil moisture migration in the field environment, Wang et al. monitored soil moisture in the fissured areas of western sandy regions and found that the reduction in soil moisture content around fissures of different sizes varied and affected the aboveground biomass of nearby vegetation [9].
Although previous research has explored the preliminary aspects of moisture distribution around fissures, it is unclear how different types of fissures affect soil moisture migration. Fissures can be generally categorized into two types based on their surface shape: planar and stepped. Planar fissures refer to fissures in which both sides of the ground are at the same height, whereas stepped fissures refer to fissures in which there is a relative height difference on both sides. Despite these studies, there is a notable gap in understanding the differential effects of planar and stepped fissures on soil moisture migration. Specifically, there is a need for comprehensive research that compares the moisture migration patterns in soils adjacent to planar and stepped fissures, evaluates the influence of fissure type on soil moisture content over time, quantifies the spatial extent of the impact of each type of fissure on soil moisture distribution, and studies the mechanisms behind the observed differences in soil moisture dynamics associated with the two types of fissures.
Moreover, previous research on moisture distribution around fissures frequently employed field sampling methods, whereas other studies rely on physical models to simulate fissures and collect data for analysis. However, environmental factors can significantly influence field sampling, making it challenging to study the impact of fissures on moisture distribution while controlling for variables. This study utilized a combination of numerical and physical simulation experiments to study planar and stepped ground fissures and established HYDRUS numerical models to investigate the effects of fissure morphology on soil moisture migration.

2. Materials and Methods

2.1. HYDRUS Model Creation

The experimental part of this study was operated in a Windows 11 PC environment(Hewlett Packard, Palo Alto, CA, USA). The system comprised an Intel i9-13900HX CPU, 16 GB of RAM, and an 8 GB NVIDIA RTX 4060 GPU. The numerical simulation software was Hydrus 2.0 The numerical simulation process mainly included model selection, selecting simulation transport types, setting simulation duration and iteration parameters, selecting moisture characteristic curves, soil types, generating models and irregular triangular grids, setting initial conditions and boundary properties, and calculating and generating results.
(1)
Numerical simulation parameter measurement.
This study conducted physical simulation experiments to obtain the necessary parameters, such as soil and evaporation conditions, for establishing the HYDRUS numerical model. The physical experiment was conducted on stepped ground fissure, which is easy to simulate by fissure simulation device [10]. The length, width, and height of the simulation device were 150 × 65 × 90 cm, and it was filled with sand (70 cm depth, bulk density of 1.5 g/cm3, maximum soil moisture holding capacity of 21.6%). By removing the left support plate, the overlying soil naturally collapses to produce simulated ground fissure. The dimension of the fissure produced was measured with a steel ruler, with the fissure step height measured 24.6 cm, the fissure width measured 11.8 cm, and the fissure depth measured 48.1 cm. Moisture detection sensors (EC-5 sensor with EM50 data collector, Decagon) were installed at the observation points (Figure 1), and we observed changes in soil moisture and recorded daily changes in climate. The collected parameters and fissure dimensions were used for the subsequent establishment of the HYDRUS numerical model.
(2)
Selection of water flow model and water characteristic curve.
Assuming soil homogeneity and neglecting root water absorption, while taking into account the hysteresis effect of unsaturated soil water, a two-dimensional saturated unsaturated water flow model can be utilized to simulate the movement of soil water by setting the direction of the main permeability coefficient as the coordinate axis direction [11]. The fundamental equation for soil water movement can be expressed as follows:
θ t = x K θ ψ x + z K θ ψ z + K θ z
θ is the soil volumetric moisture content, cm3/cm3; K ( θ ) refers to the soil permeability coefficient, cm/d, when the corresponding moisture content is θ; ω is the negative pressure of soil water; Z is the vertical coordinate, cm; point 0 is taken on the ground, and upward is positive; X is the horizontal coordinate; and T is a time variable, d.
This experiment does not consider aspects such as solute transport, thermal transport, and root water absorption. The Van Genuchten Manuhem model (VG model) was selected for the soil moisture characteristic curve [12]. The specific expression and related parameter meanings of the VG model are as follows:
K θ = K s θ e l 1 1 θ e 1 m m 2
θ e = θ ( h ) θ r θ s θ r = 1 + a h n m
  • K s : Soil saturated hydraulic conductivity.
  • θ r : Soil residual volume moisture content.
  • θ e : Relative saturation of soil.
  • θ s : Soil saturation volume moisture content.
  • a, n: Empirical functions determined by experiments.
  • m: 1-1/n.
  • h: Negative pressure head (cm).
(3)
Model time and output settings.
The simulation was set to run for 20 days, with a starting time step of 0.0001 days, a minimum time step of 0.00001 days, and a maximum time step of 5 days. The output of the simulation was set to be every day to obtain a graph of soil moisture-content changes over 20 days.
(4)
Initial conditions and hydraulic parameter settings of soil.
The initial soil moisture content of the HYDRUS model was set to the average initial moisture content of the measured data, which was 19.7%. The hydraulic properties of the soil were obtained based on the measured data and are presented in Table 1.
(5)
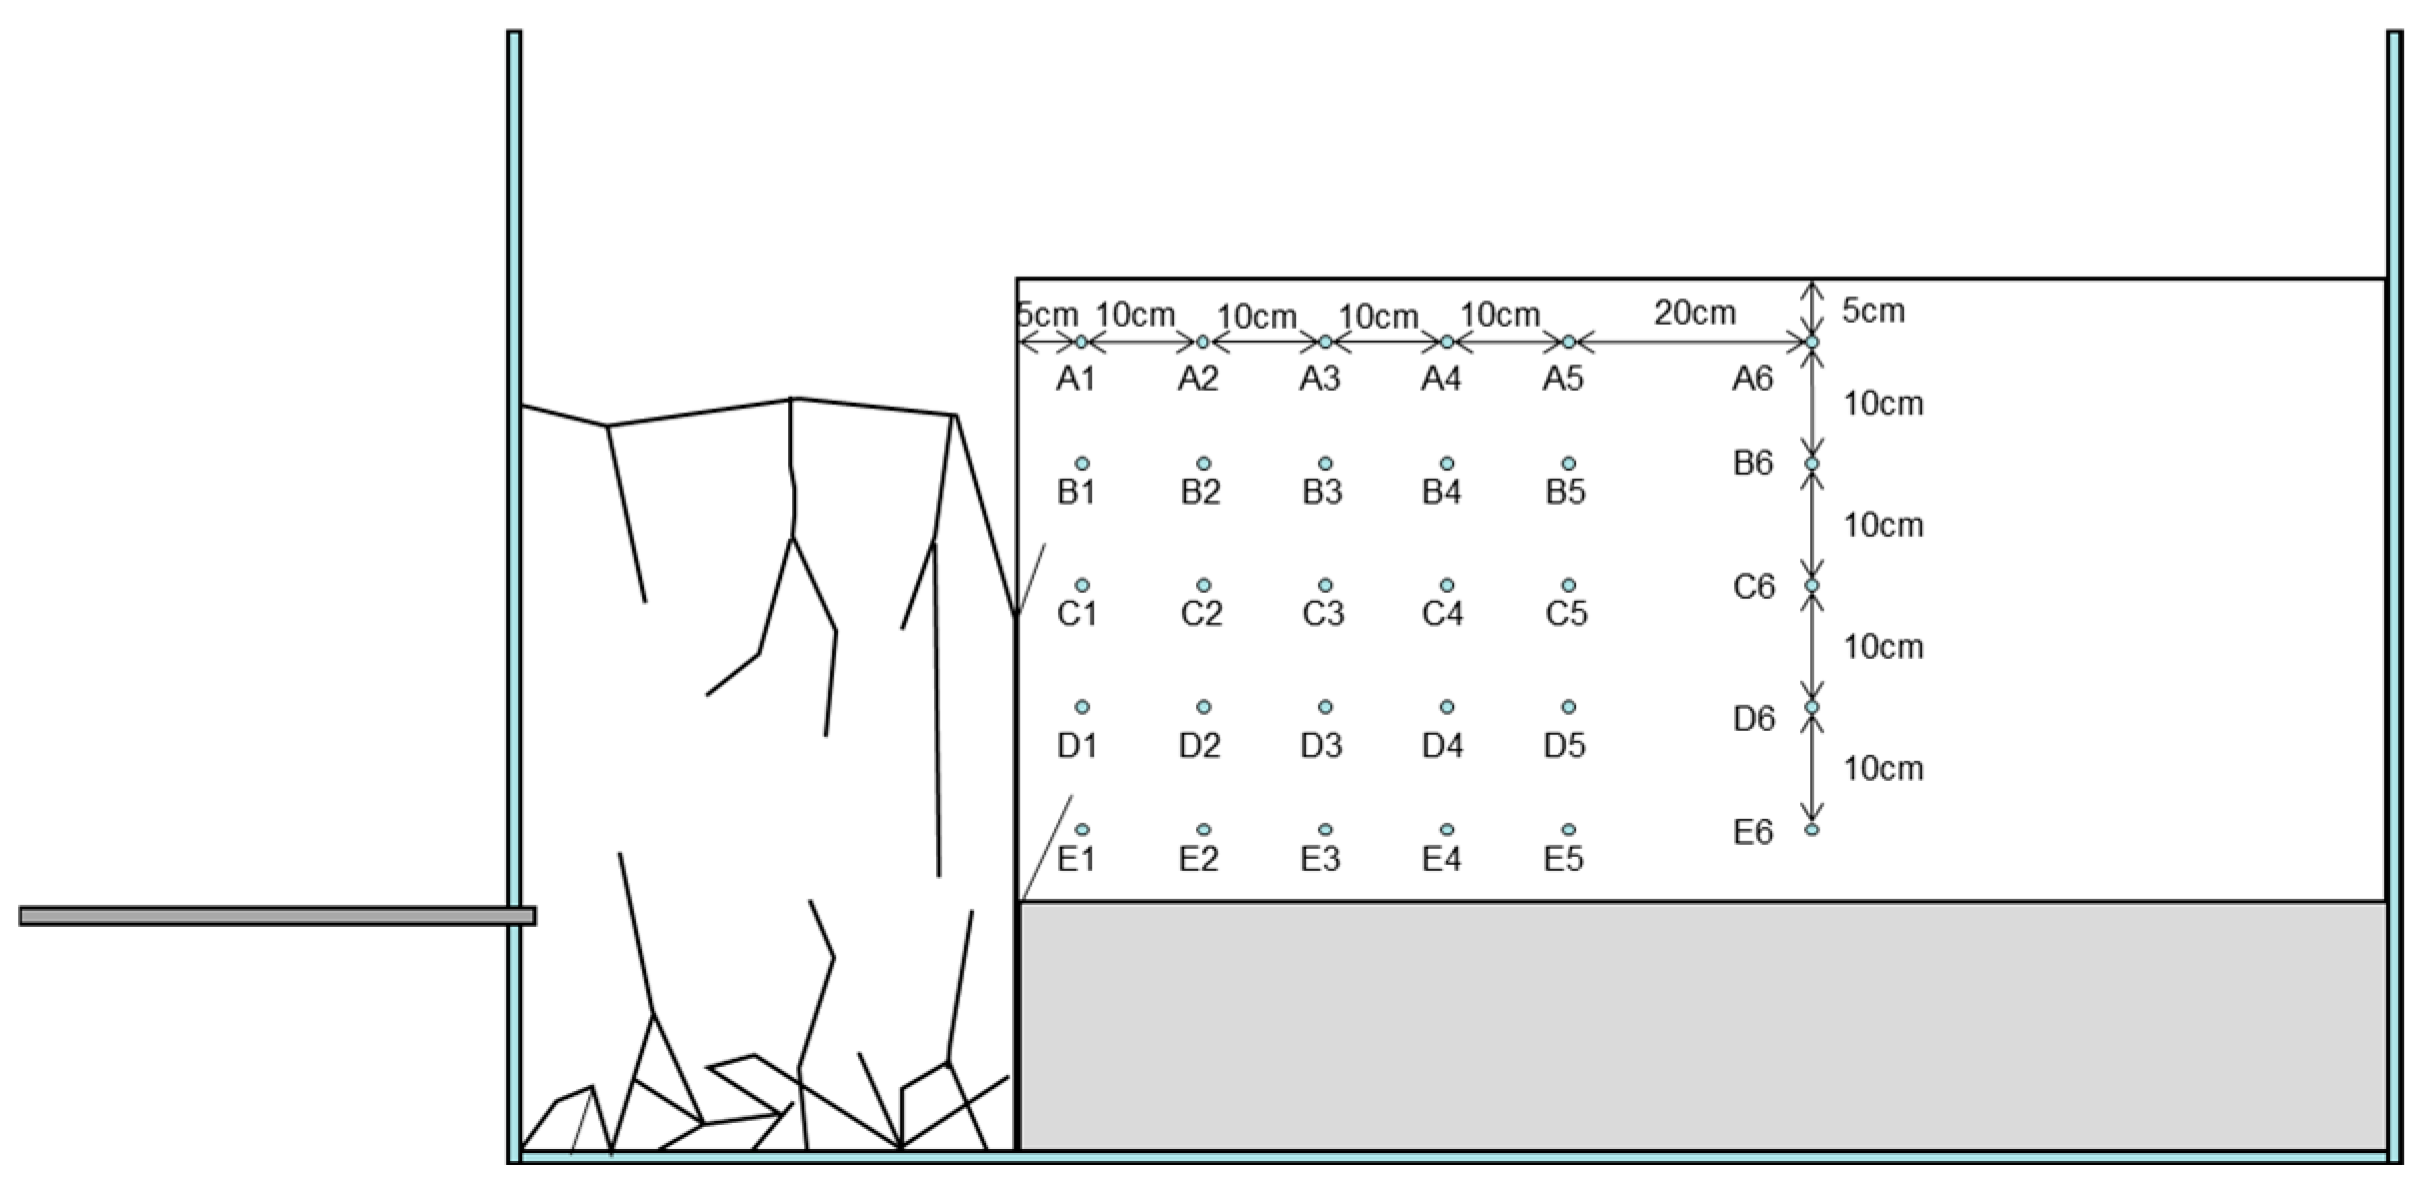
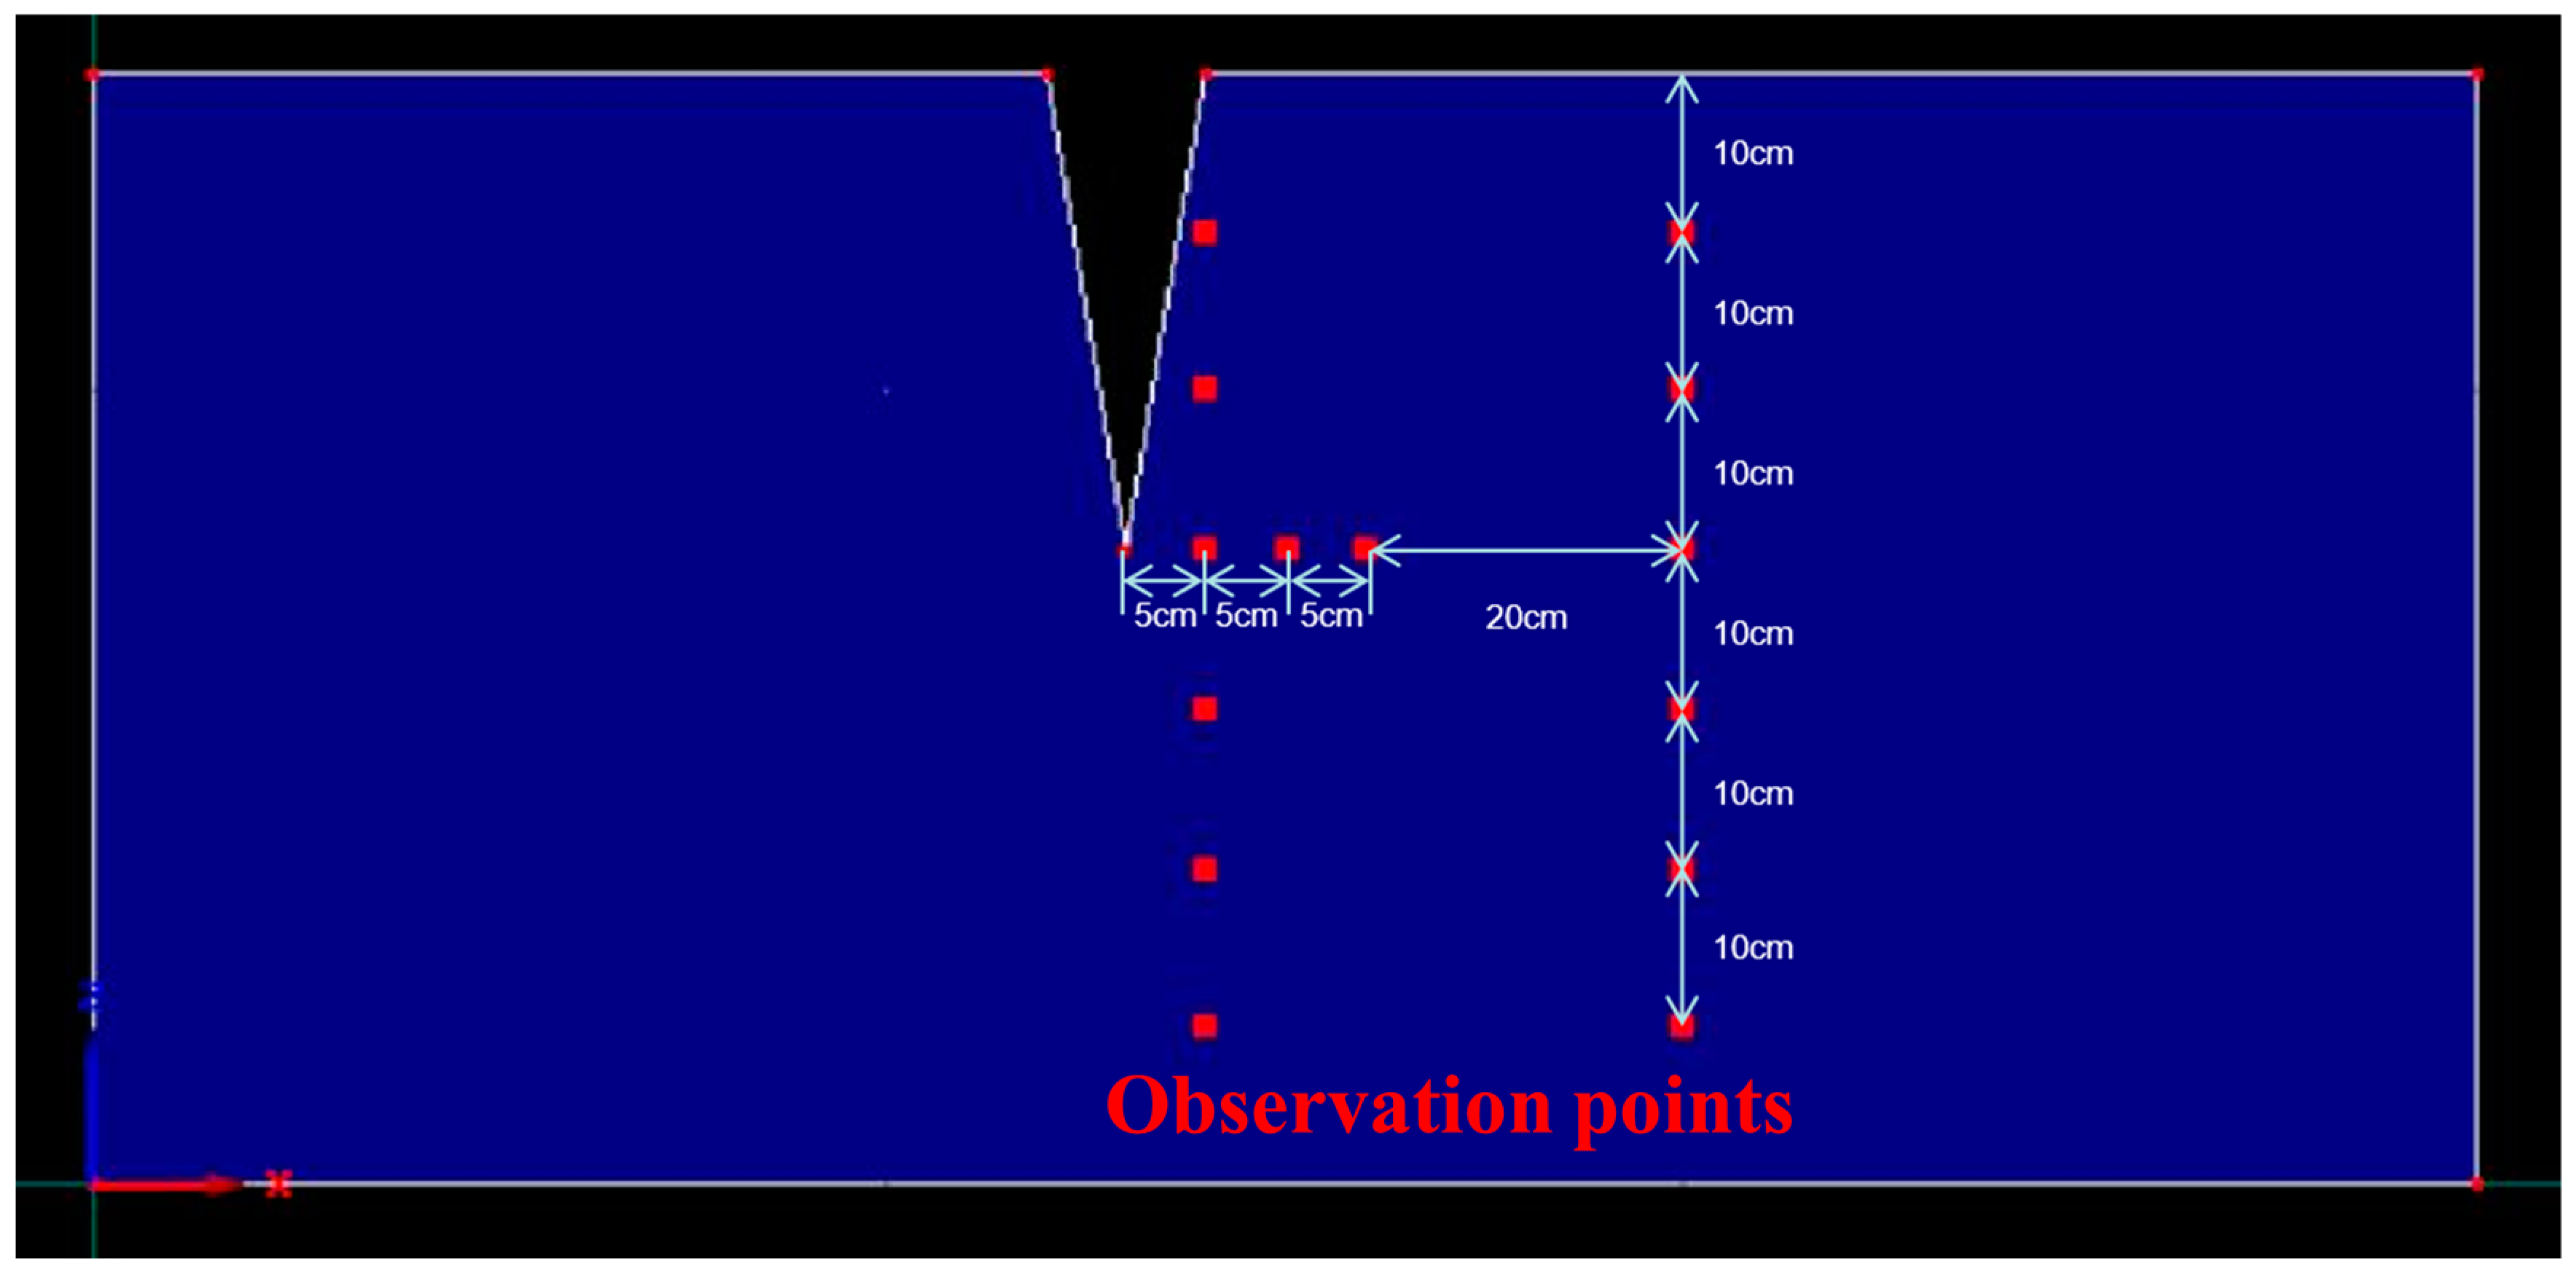
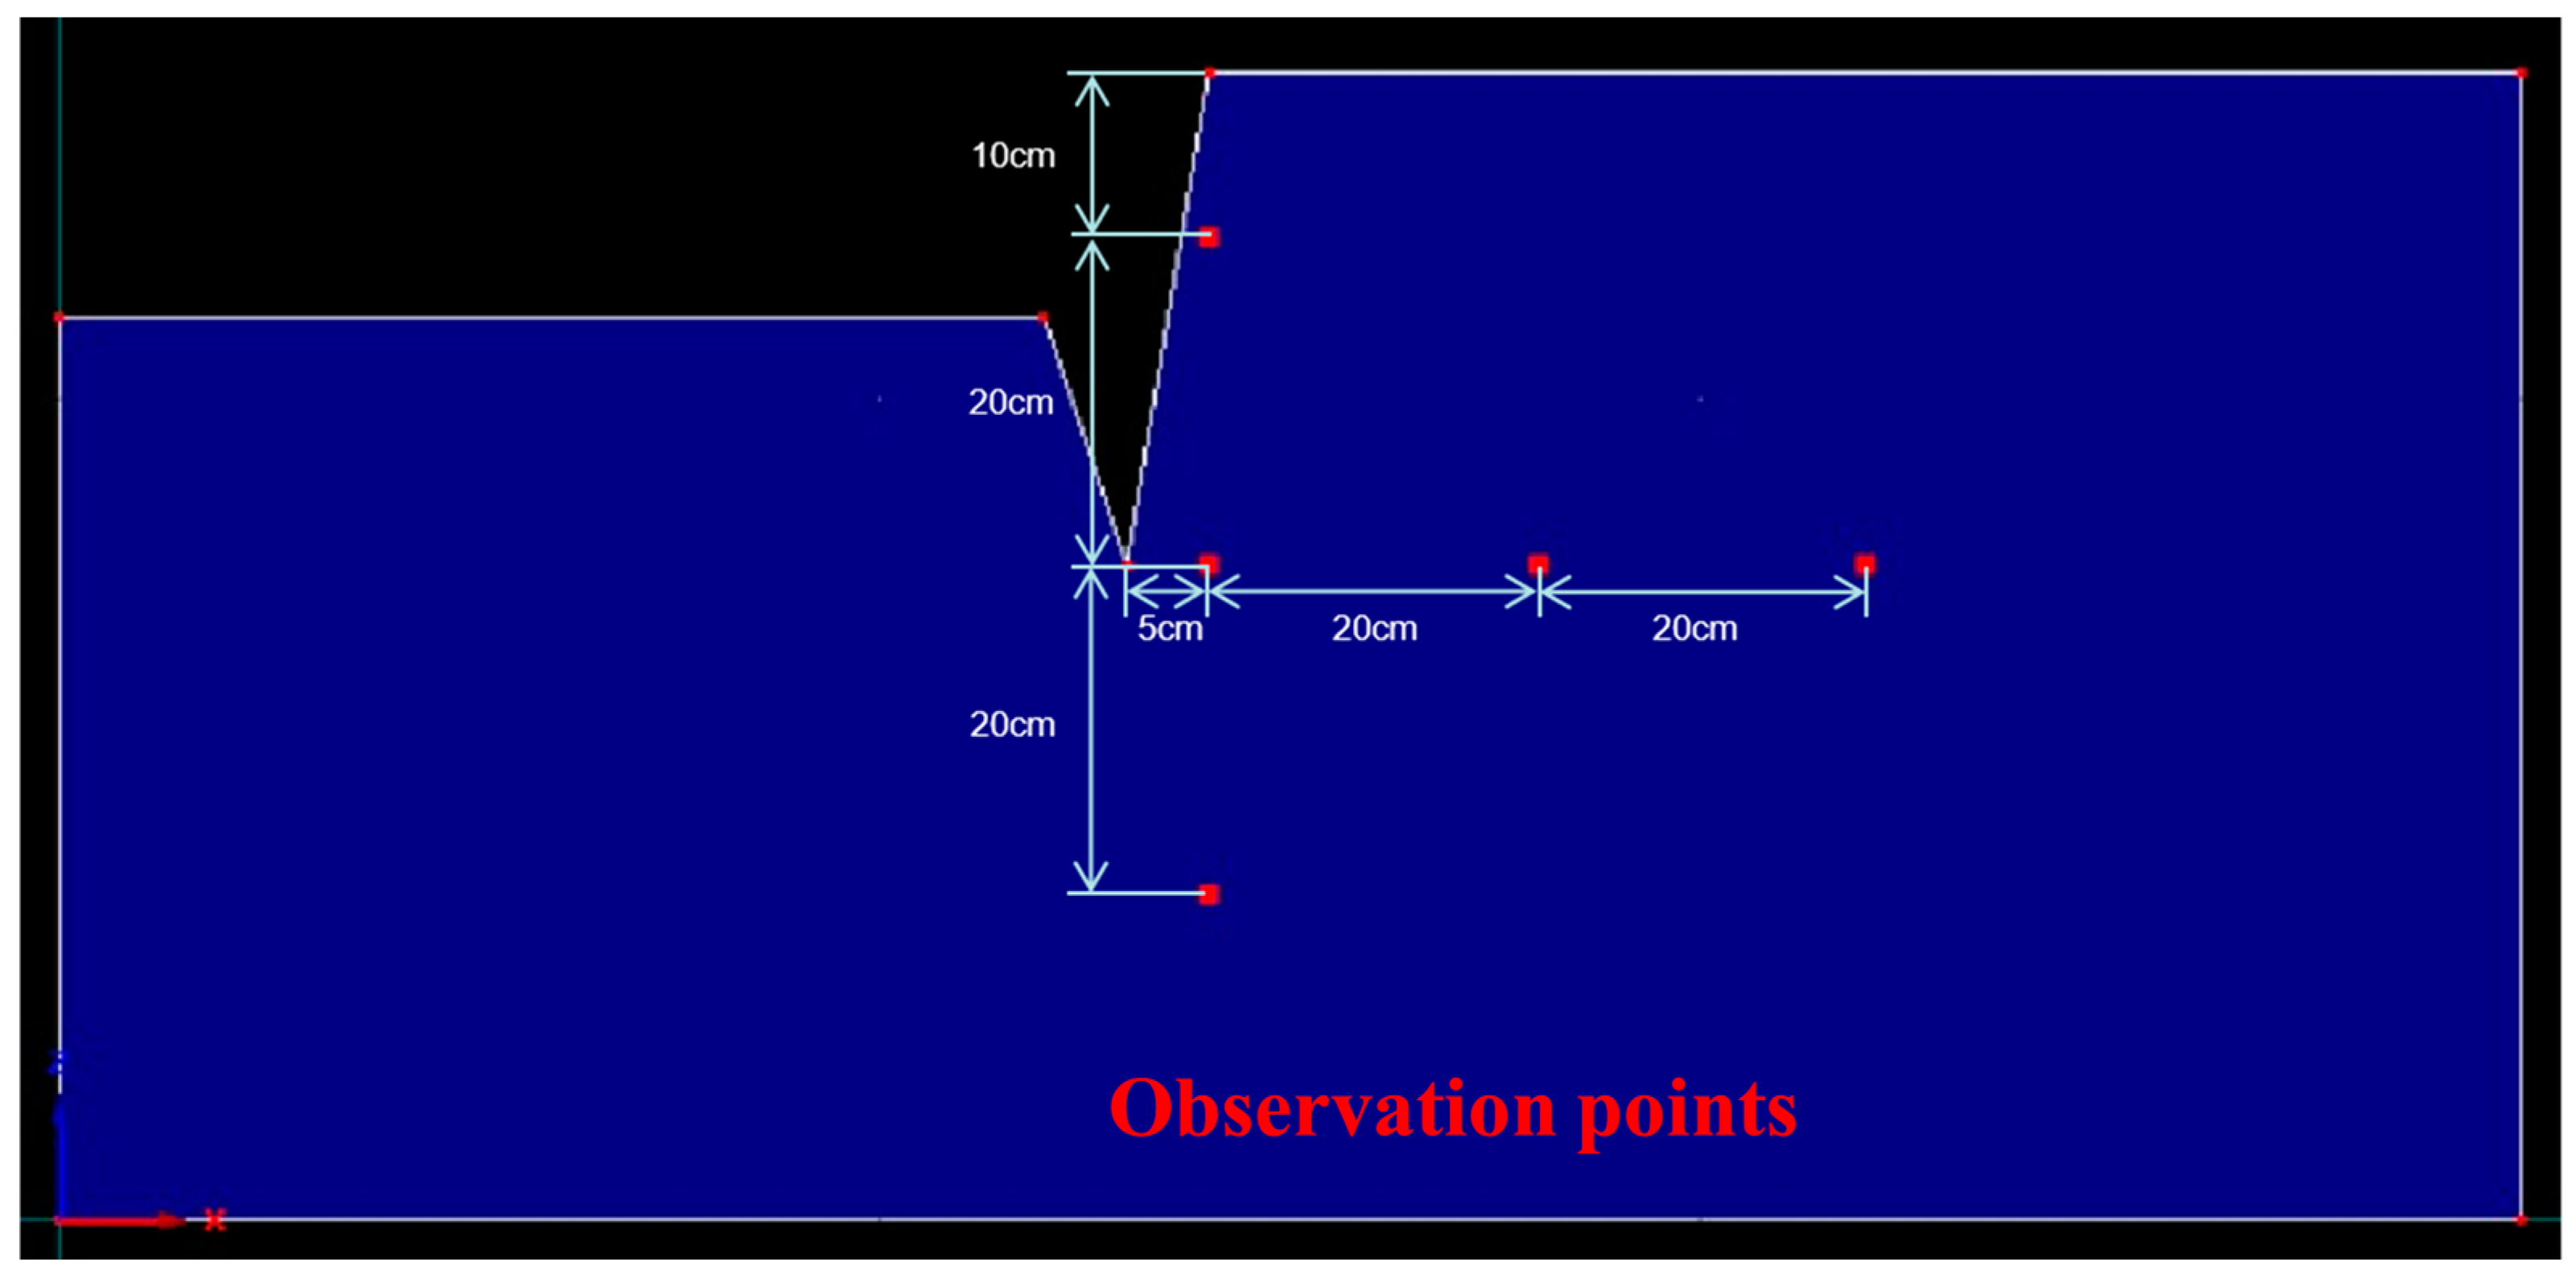
The addition of observation points and the setting of boundary conditions.
The HYDRUS numerical model was created based on the measured fissure morphology. As shown in Figure 2, the boundary of the fissure simulation device was in contact with the atmosphere, so the upper boundary of the HYDRUS model was set as an atmospheric boundary. The lower boundary of the HYDRUS model was set as a free drainage boundary, while the left and right sides were designated as impermeable boundaries.
During the 20-day simulation, the evaporation of the soil boundary of the fissure simulation device was recorded and entered into the HYDRUS model, as shown in Table 2. The evaporation intensity ET0 was estimated using the Hargreaves method [12], as follows:
ET 0 = C 0 Ra T mean + 17.8 T max T min 0.5
where Tmean is the daily average temperature (°C); Tmax is the daily maximum temperature (°C); Tmin is the daily minimum temperature (°C); Ra is the solar radiation at the atmospheric edge; and C0 is the conversion coefficient. When Ra is measured in mm/d, C0 = 2.3 × 10⁻³; when Ra is measured in MJ/(m2∙d), C0 = 2.3 × 10⁻³.

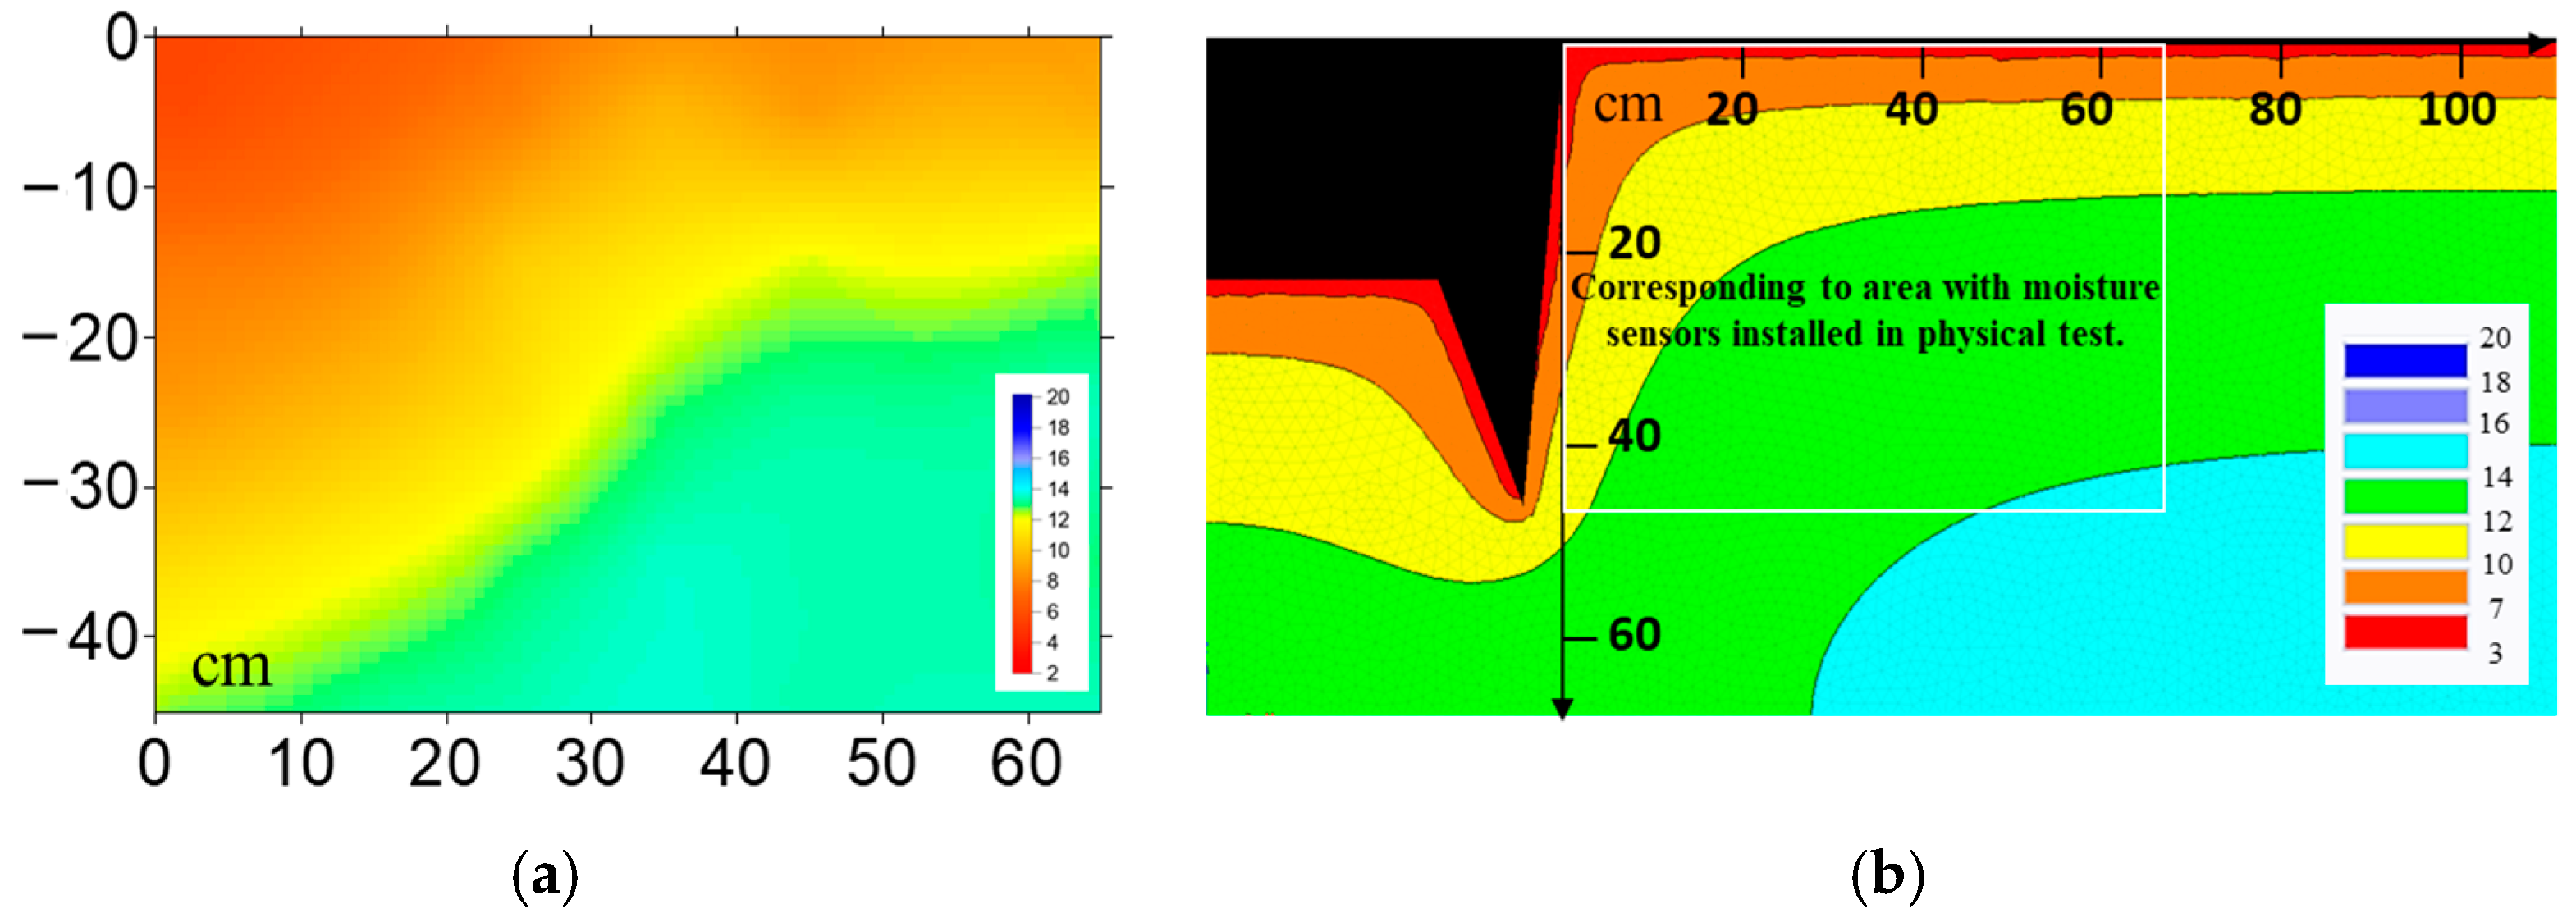
2.2. Accuracy Evaluation of HYDRUS Simulated Data and Measured Data

To assess the accuracy of the numerical model in replicating the actual soil moisture-change pattern, the root-mean-square error equation and the relative error equation were employed [13]. The specific equation used is as follows:
R M S E = 1 n i = 1 n S i O i 2
R E = i = 1 n S i i = 1 n O i 1
  • RMSE: Root-mean-square error.
  • RE: Relative error.
  • S: The moisture content value simulated by HYDRUS.
  • O: The measured moisture content value.
  • n: The number of samples participating in the evaluation.
The RMSE can serve as an indicator of the average magnitude of the absolute discrepancies between the estimated soil moisture content and the actual soil moisture content, and it can also signify the extent of similarity between the two measurements. The RE represents the general level of disparity between the estimated and actual soil moisture-content values. The accuracy assessment of the HYDRUS simulated data and measured data is presented in Table 3, taking into account the observation points A1−E1 and A6−E6 as examples.
Twenty days after the physical ground fissure formed, the distribution of soil moisture changed in the area surrounding it. Overall, the trend of moisture distribution changes between the numerical simulation results and the physical simulation results is consistent (Figure 3). In the distant region from the fissure, the soil moisture content increased with depth. However, the contour lines of soil moisture around the fissure exhibited an S-shaped pattern, with significantly lower moisture content on the walls of the fissure compared to the same depth in the distant area. At the same depth, the closer to the fissure wall, the lower the soil moisture content was. The lowest point was found at the upper-left corner of the fissure.

2.3. Simulating the Influence of Different Fissure Morphologies on Soil Moisture

After verification, this study extended the simulations to include both planar and stepped fissures, varying their widths and depths to study the perturbation effects on soil moisture. Numerous numerical models were developed with an overall model size of 150 × 70 cm. The simulation period was established at 20 days, and the initial soil moisture content was uniformly set at 19.7%. The evaporation rate was set at an average of 0.57 cm/d, which was derived from the measured data of the fissure simulation device during the 20−day period. The hydraulic parameters of the soil were consistent with the measured data presented in Table 1.

2.3.1. Simulating Planar Fissures of Different Widths

As shown in Figure 4, the fissure models PW10, PW20, and PW30 were established, with corresponding fissure widths of 10, 20, and 30 cm, and the depth of the fissures was uniformly set at 30 cm. The location of the observation points is shown in Figure 3. The simulation period was set as 20 days to analyze the variation of soil moisture.
Observation points were added to the PW10 model to analyze the impact of fissures on the surrounding soil moisture change. Observation points were also added to the bottom of the PW10, PW20, and PW30 fissures at horizontal distances of 5, 10, and 15 cm, respectively, to analyze the effect of fissure width on soil moisture change. The location of the observation points is shown in Figure 5. The simulation period was set as 20 days to analyze the variation of soil moisture.
The concept of IDMC (influence degree of moisture content) was introduced to quantify the extent to which alterations in a fissure’s morphological characteristics, such as width and depth, influence the water content (%). Its calculation process is as follows:
IDMC = 1 n × I max I 1 max I 1 min + I 2 max I 2 min + + I nmax I nmin
  • I 1 m a x : The maximum moisture content of fissures with different shapes at the same location on the first day.
  • I 1 m i n : The minimum moisture content of fissures with different shapes at the same location on the first day.
  • I n m a x : The maximum moisture content of fissures with different shapes at the same location on the nth day.
  • I n m i n : The minimum moisture content of fissures with different shapes at the same location on the nth day.
  • I m a x : The maximum moisture content of fissures with different shapes at the same location.
  • n: Number of days participating in the operation.

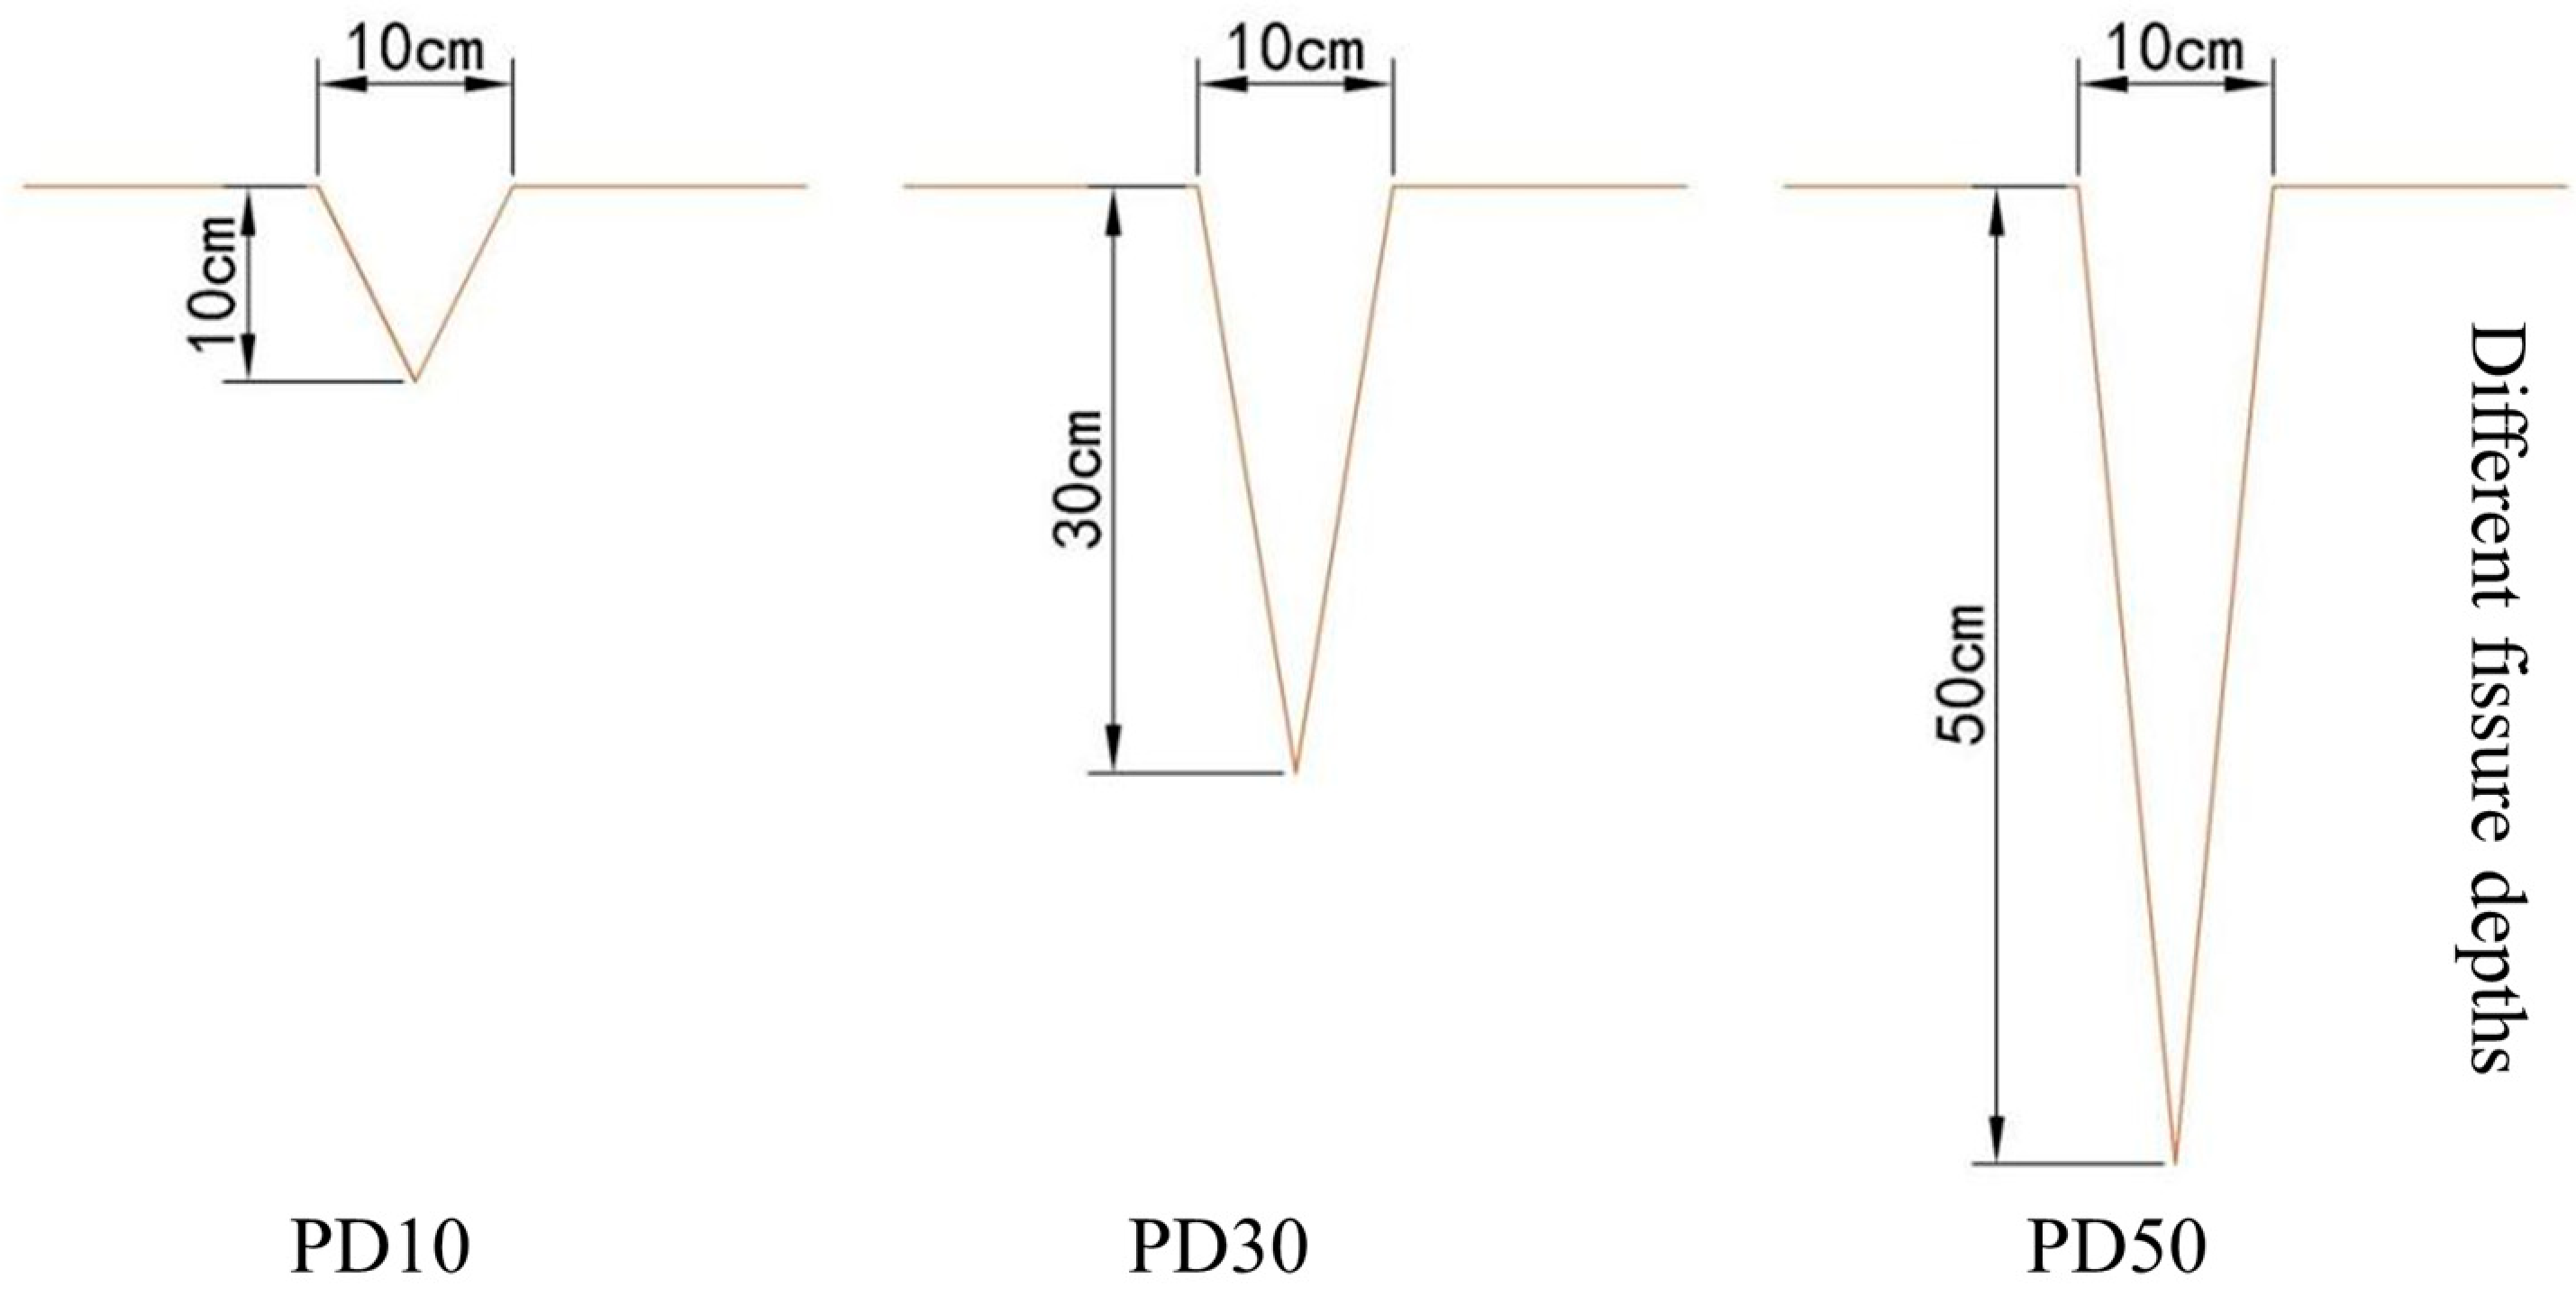
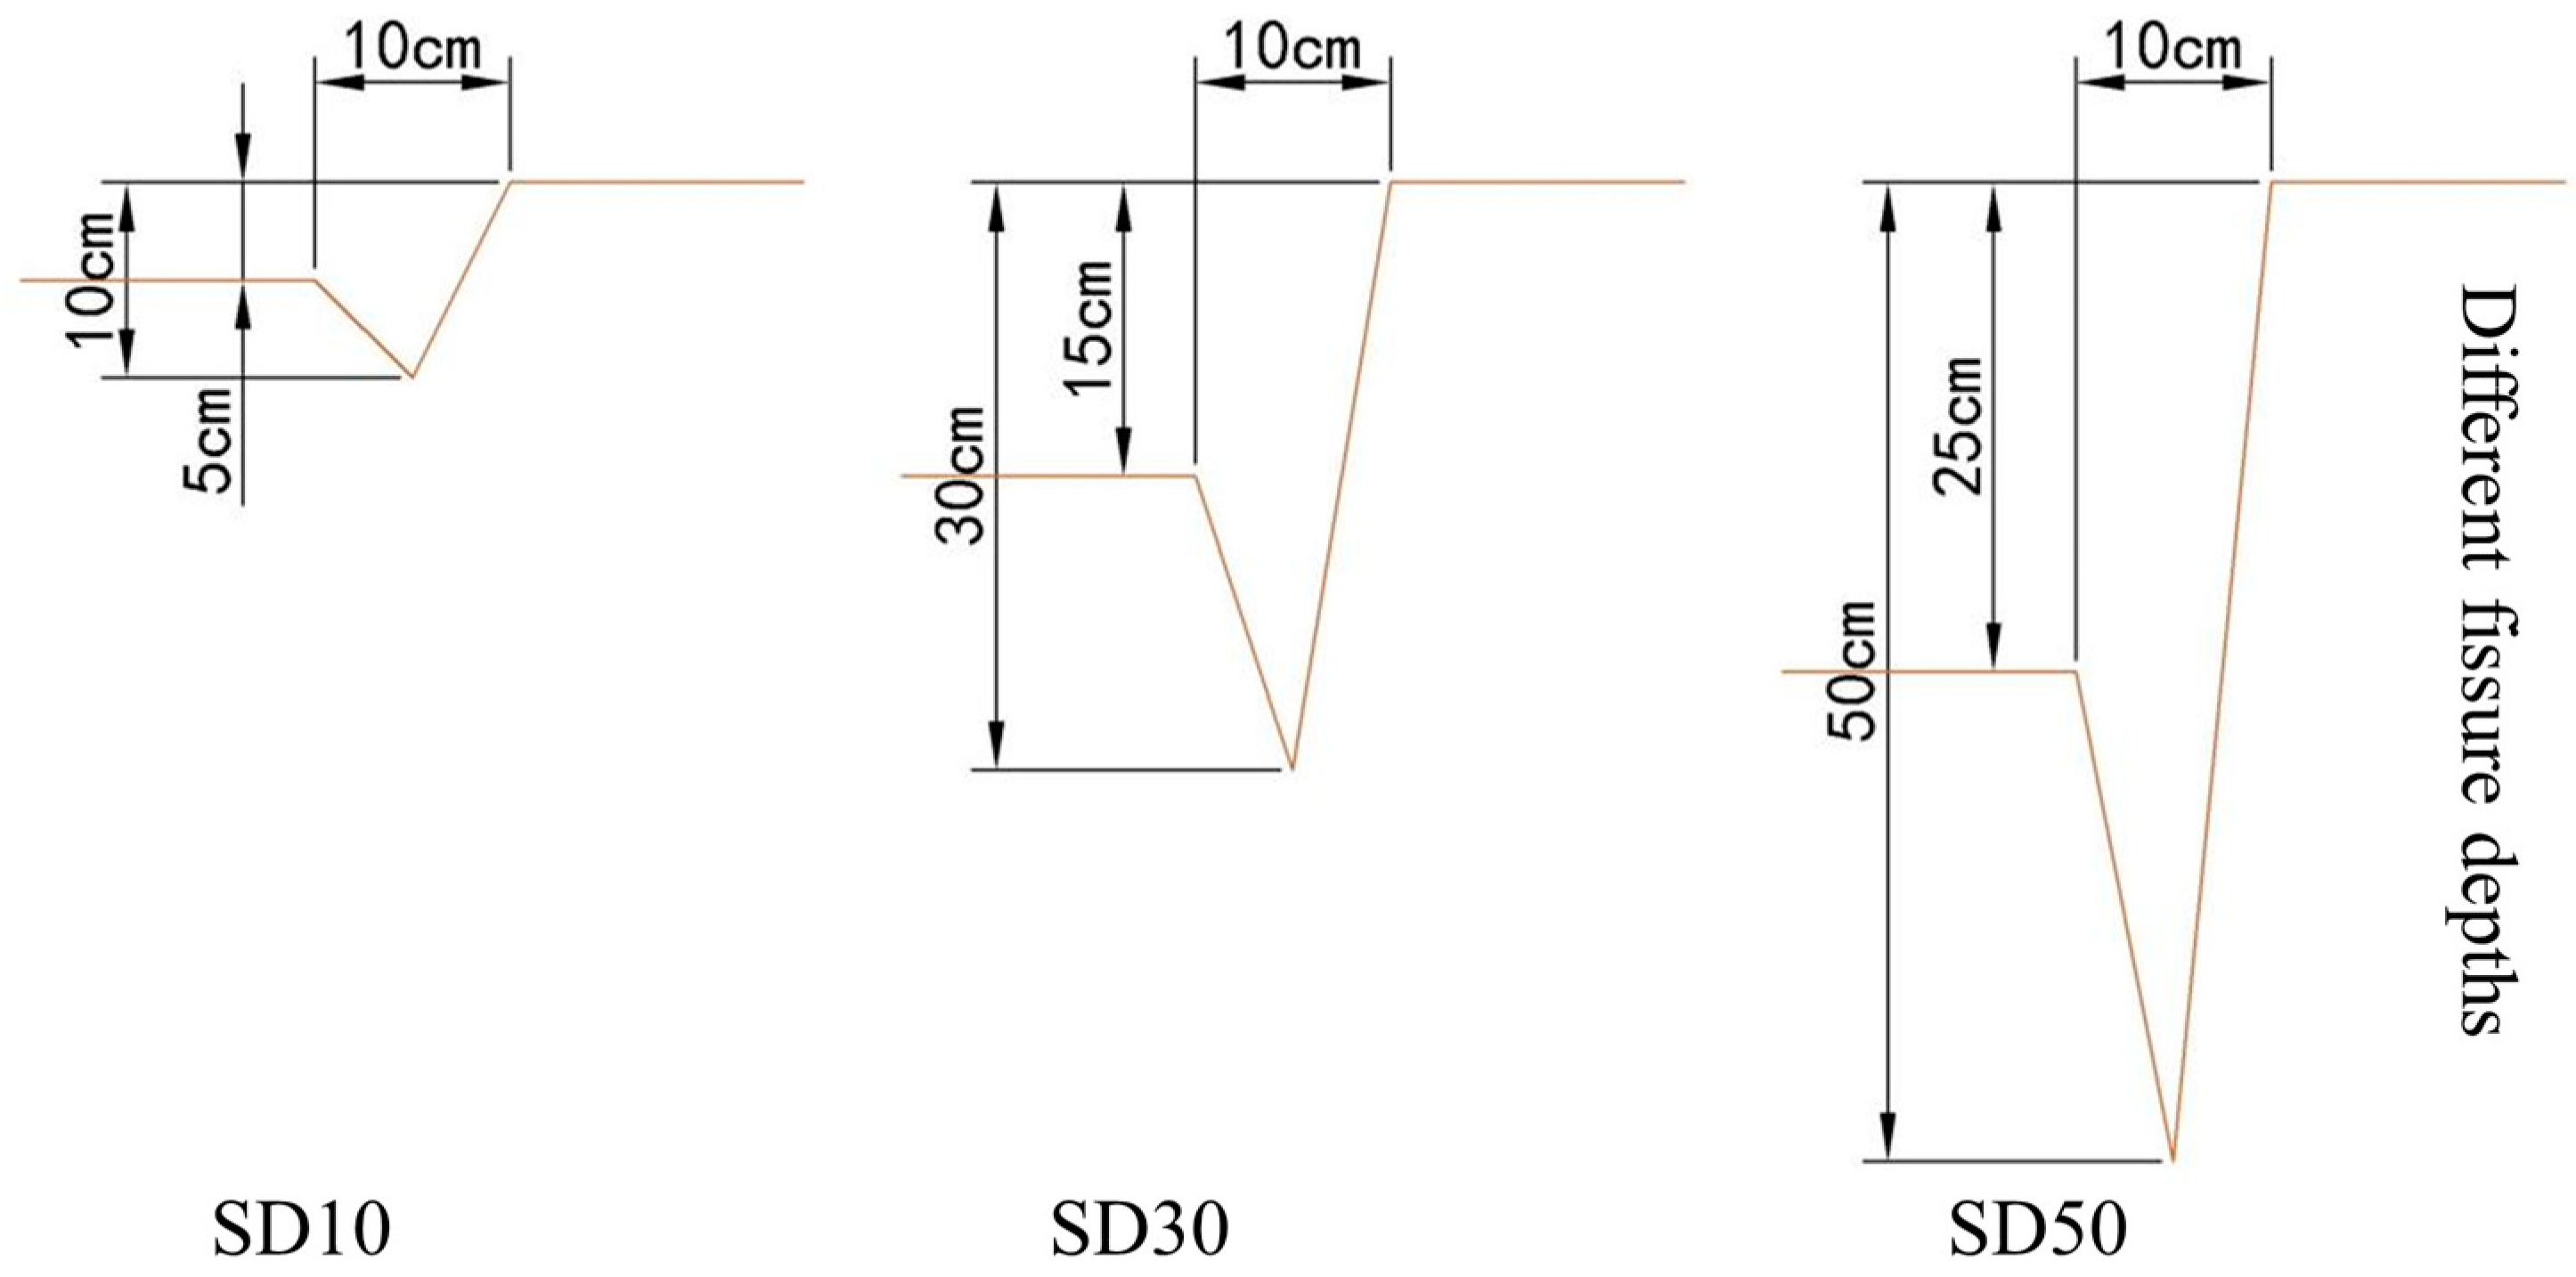
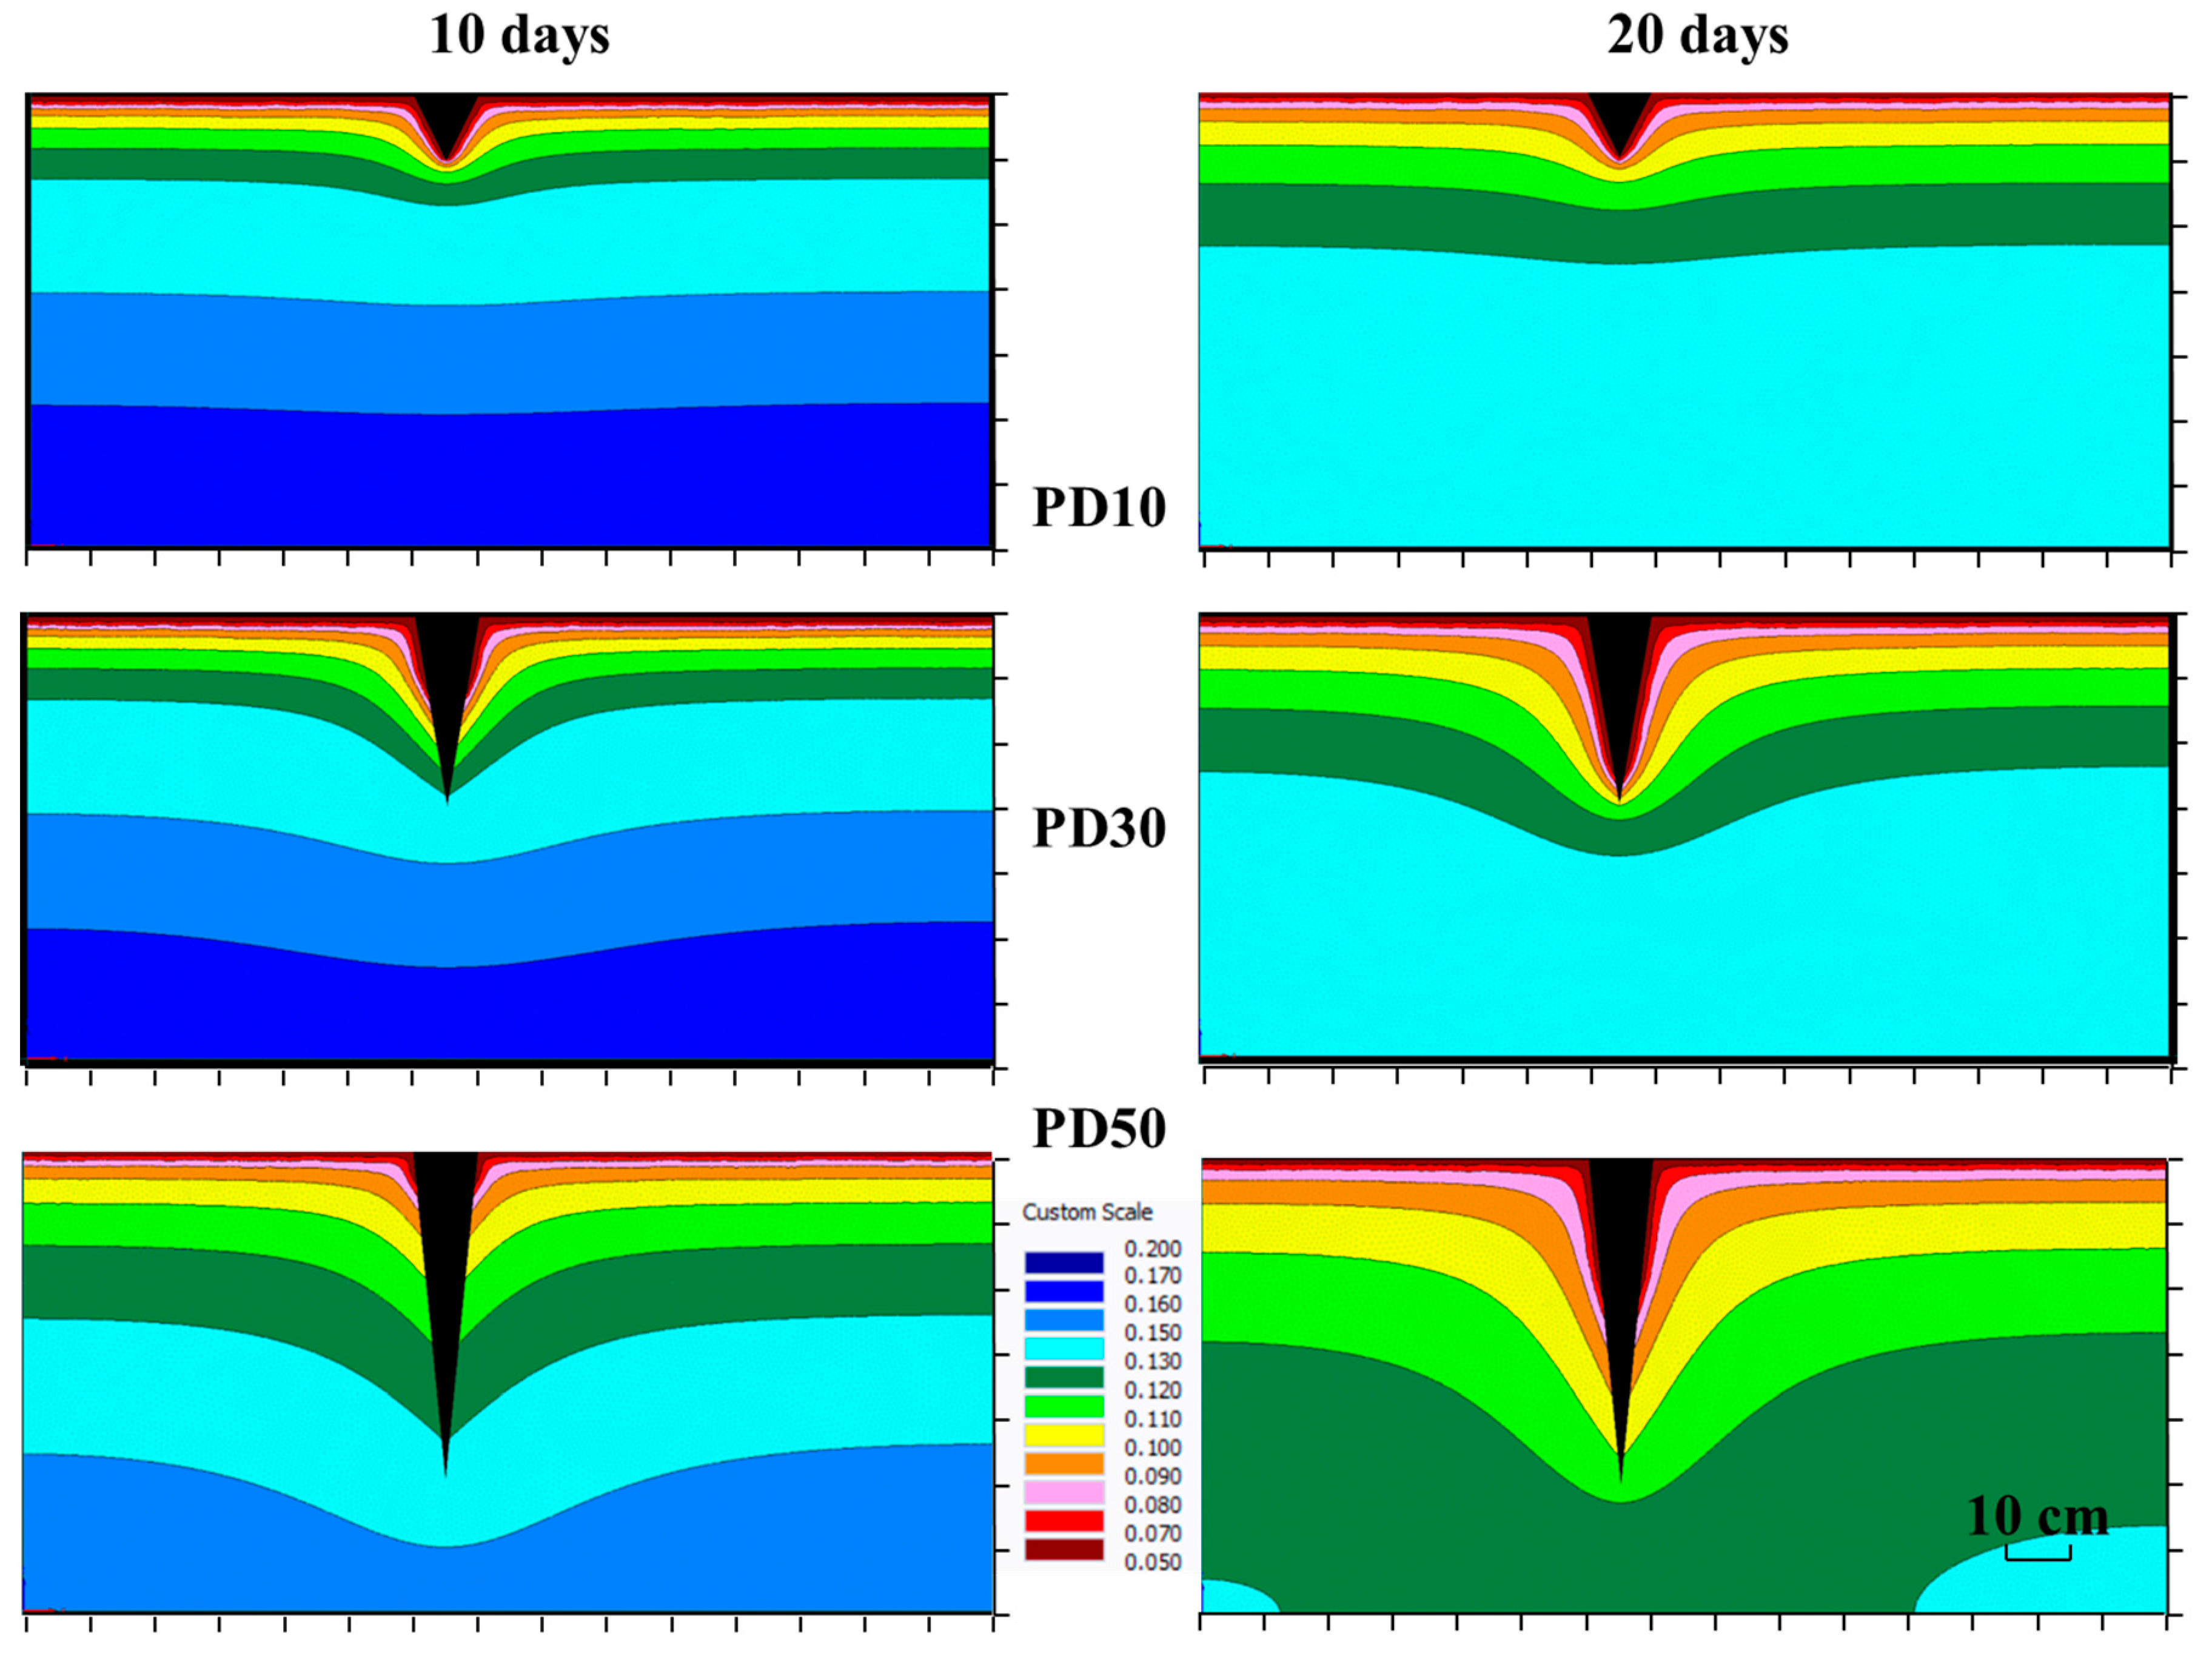
2.3.2. Planar Fissures with Different Depths

As shown in Figure 6, fissure models PD10, PD30, and PD50 were established, with corresponding fissure depths of 10, 30, 50 cm, and the fissure width was uniformly set to 10 cm. We added observation points at distances of 10, 30, 50 cm from the ground near fissures PD10, PD30, and PD50. As PD30 and PW10 models are the same size, the positions of the observation points are shown in Figure 5.

2.3.3. Stepped Fissures with Different Widths

As shown in Figure 7, the fissure models SW10, SW20, and SW30 were established, with corresponding fissure widths of 10, 20, 30 cm, and the depth of the fissures was uniformly set at 30 cm. In contrast to the planar fissures, we increased the spacing of observation points and added three observation points at the same position 5, 25, 45 cm below the bottom of the fissure. Taking SW10 as an example, the location of the observation points is shown in Figure 8.
Figure 9 shows the establishment of fissure models SD10, SD30, and SD50, with corresponding fissure depths of 10, 30, 50 cm, and the fissure width is uniformly set at 10 cm. Observation points were added at positions 10, 30, 50 cm above the soil surface near the SD10, SD30, and SD50 fissures, respectively. Due to the similarity of the SD30 and SW10 models, the location of the observation points was referenced from Figure 8.

3. Results and Analysis

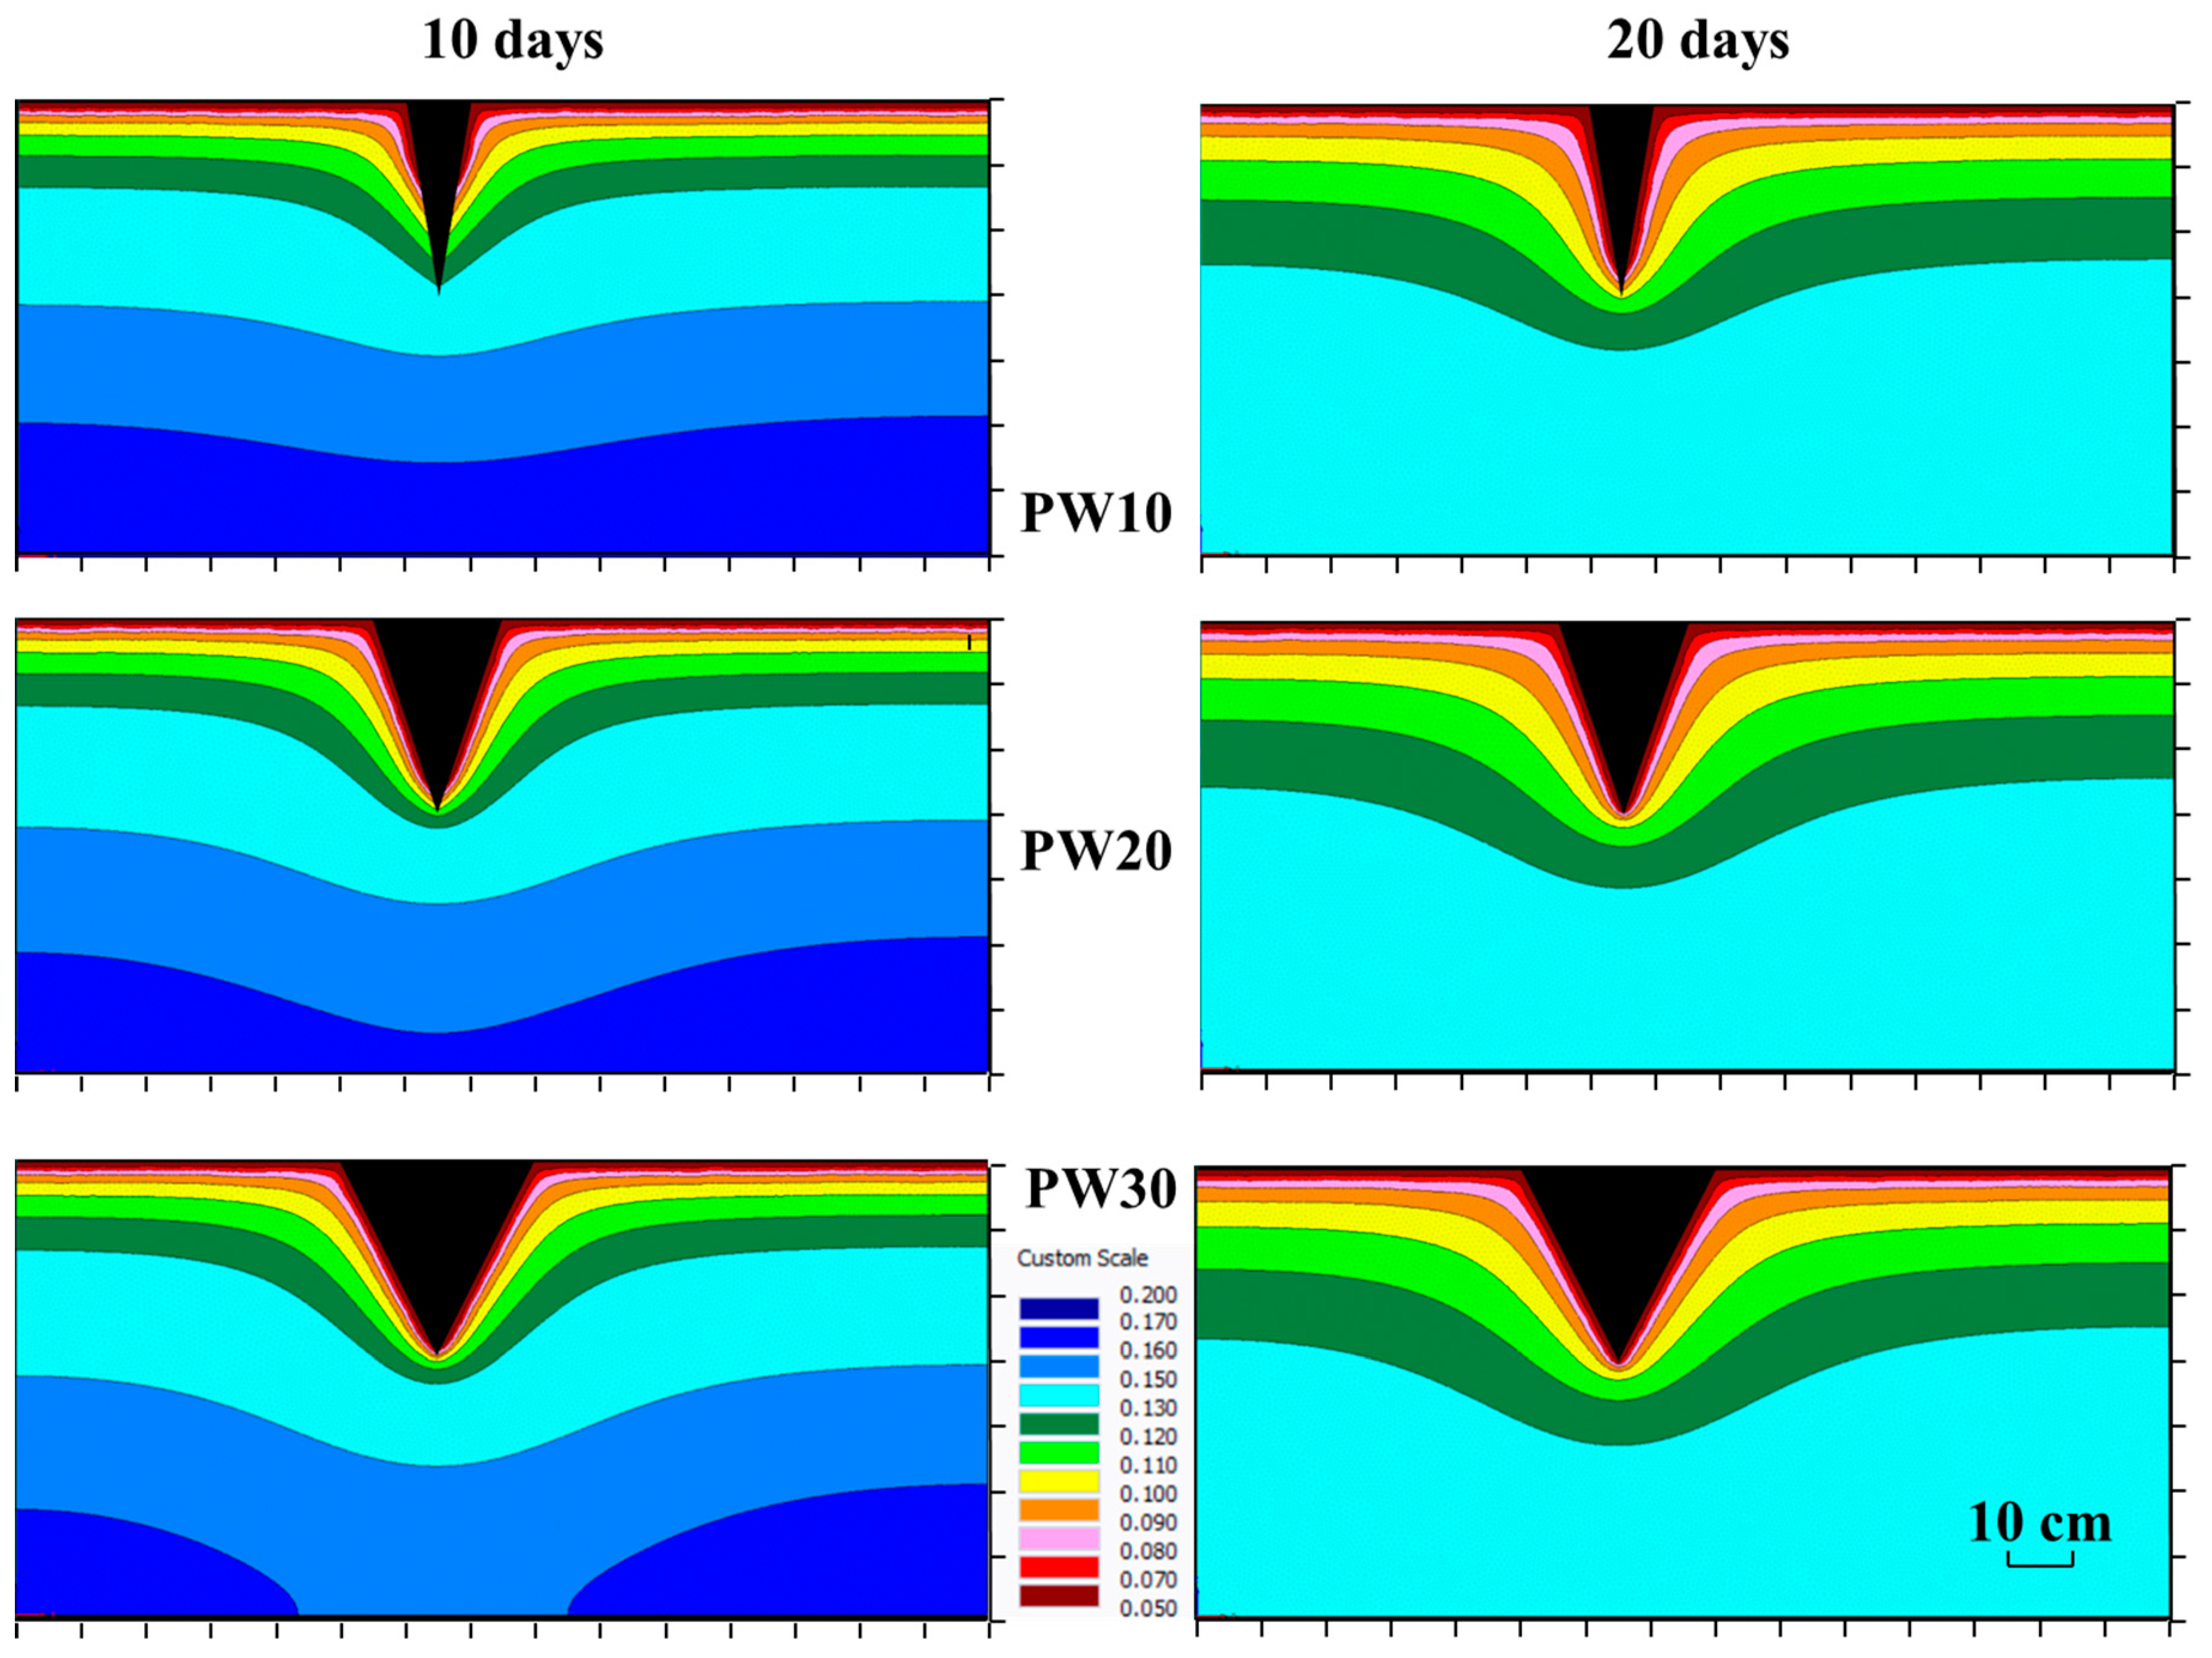
3.1. The Effect of Planar Fissures with Different Widths on Soil Moisture Transport

The soil moisture content varies depending on the distance from the soil surface and the width of the fissure. As shown in Figure 10, the soil moisture content decreases as the distance to the soil surface or the fissure decreases. Additionally, the effect of fissure width on soil moisture-content reduction varies. For the range of moisture content from 11% to 12% observed on the 10th day, it is evident that the light-green moisture range of the narrowest fissure, PW10, has not yet reached the bottom of the fissure, while the mid-width PW20 has just reached the bottom, and the widest fissure, PW30, has already exceeded the bottom depth. This indicates that wider fissures have a greater reduction in soil moisture content and a more significant effect. Horizontally, the impact range increases with fissure width: PW30 > PW20 > PW10. By the 20th day, the spatial distribution of soil moisture for fissures PW20 and PW30 is similar, but the soil moisture content of PW30 is lower relative to PW20. However, PW10 still shows significant differences compared to the previous two fissures.
The graph depicted in Figure 11a illustrates the fluctuation in soil moisture content at the bottom of a fissure. It is evident that from the first to the fifth day, PW30 had the lowest moisture content, followed by PW20, which had less moisture than PW10. From day six to day fourteen, PW20 and PW30 remained relatively close and significantly lower than PW10. From day fifteen to day twenty, PW30 again had the lowest moisture content, followed by PW20 and then PW10. The minimum soil moisture contents recorded for PW30, PW20, and PW10 were 6.7%, 8.6%, and 11.1%, respectively. The reduction in soil moisture content in PW30 compared to PW10 was 39.6%, indicating that wider fissure widths may result in more rapid soil moisture loss. Figure 11b demonstrates that the IDMC of the fissure-bottom monitoring point for the planar fissure is 11.36%, which suggests that the fissure width has a considerable impact on soil moisture loss in that area.

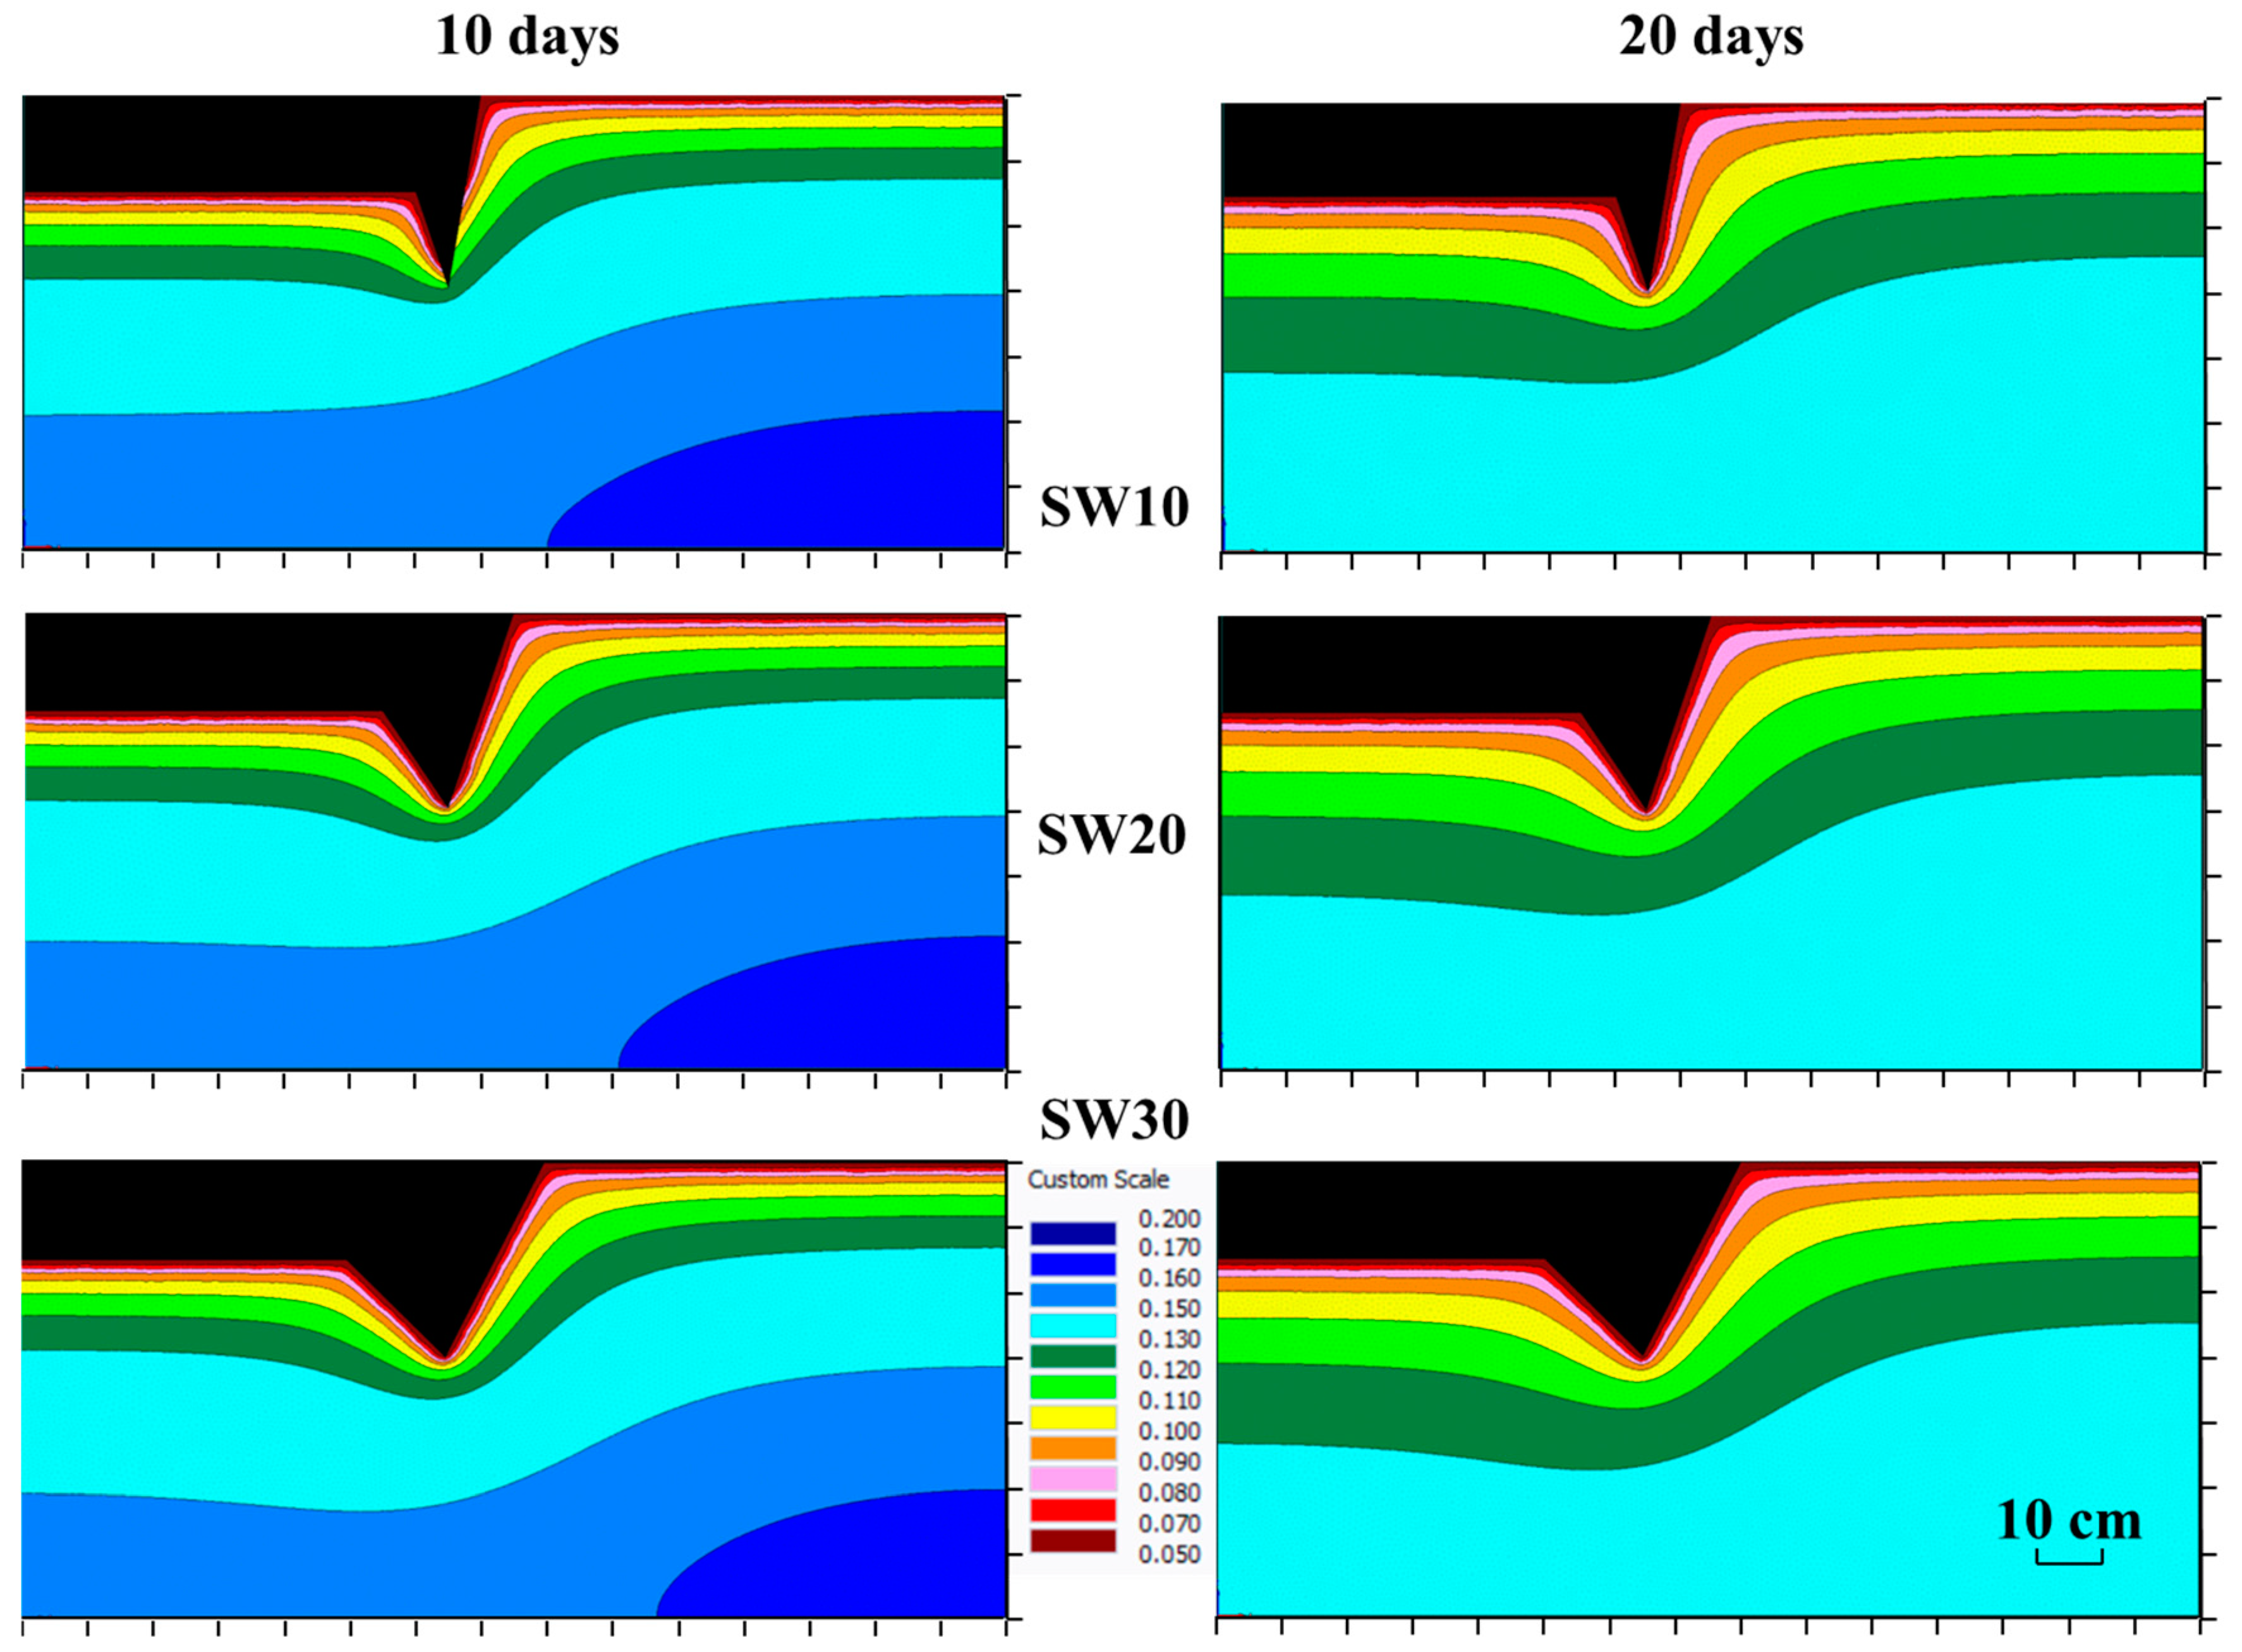
3.2. The Effect of Stepped Fissures with Different Widths on Soil Moisture Transport

Concerning the impact of stepped fissures of varying widths on soil moisture transport, as depicted in Figure 12, fissures accelerate the loss of soil moisture, and the range of soil moisture affected in the upper and lower strata is not symmetrical. The wider the stepped fissure, the greater the acceleration effect of soil moisture loss. On the tenth day, the range of moisture content between 9% and 10% had not yet reached the depth of the bottom of the fissure for PW30, while PW20 had already reached the bottom, and the widest fissure, PW30, had already exceeded the depth of the bottom. By the twentieth day, the spatial distribution of soil moisture for PW20 and PW30 was similar, but PW30 had slightly lower soil moisture content compared to PW20. In contrast, PW10 still showed significantly lower soil moisture levels compared to the other two fissures.
Figure 13 depicts the variations in soil moisture content at the base of the fissure. It can be seen that for the first six days, SW30 was less than SW20, which in turn was less than SW10. From the seventh to the twelfth day, PW20 and PW10 were relatively close and significantly higher than PW30. From the thirteenth to the twentieth day, the three fissures showed differences again, with PW30 being the lowest, followed by PW20 and PW10 at the end of the experiment. The soil moisture content at the deepest point in PW30, PW20, and PW10 was 6.1%, 6.4%, and 9.1%, respectively. PW30 reduces the soil moisture content by 33.5% compared to PW10, indicating that wider fissure widths may accelerate the loss of soil moisture. Figure 11b illustrates that the IDMC of the fissure-bottom monitoring point for the stepped fissure is 17.04%, which is 33.31% greater than the IDMC of the same-sized planar fissure. This suggests that the fissure width has a substantial impact on the soil moisture loss in that region, and the effect is more pronounced than that of the planar fissure.

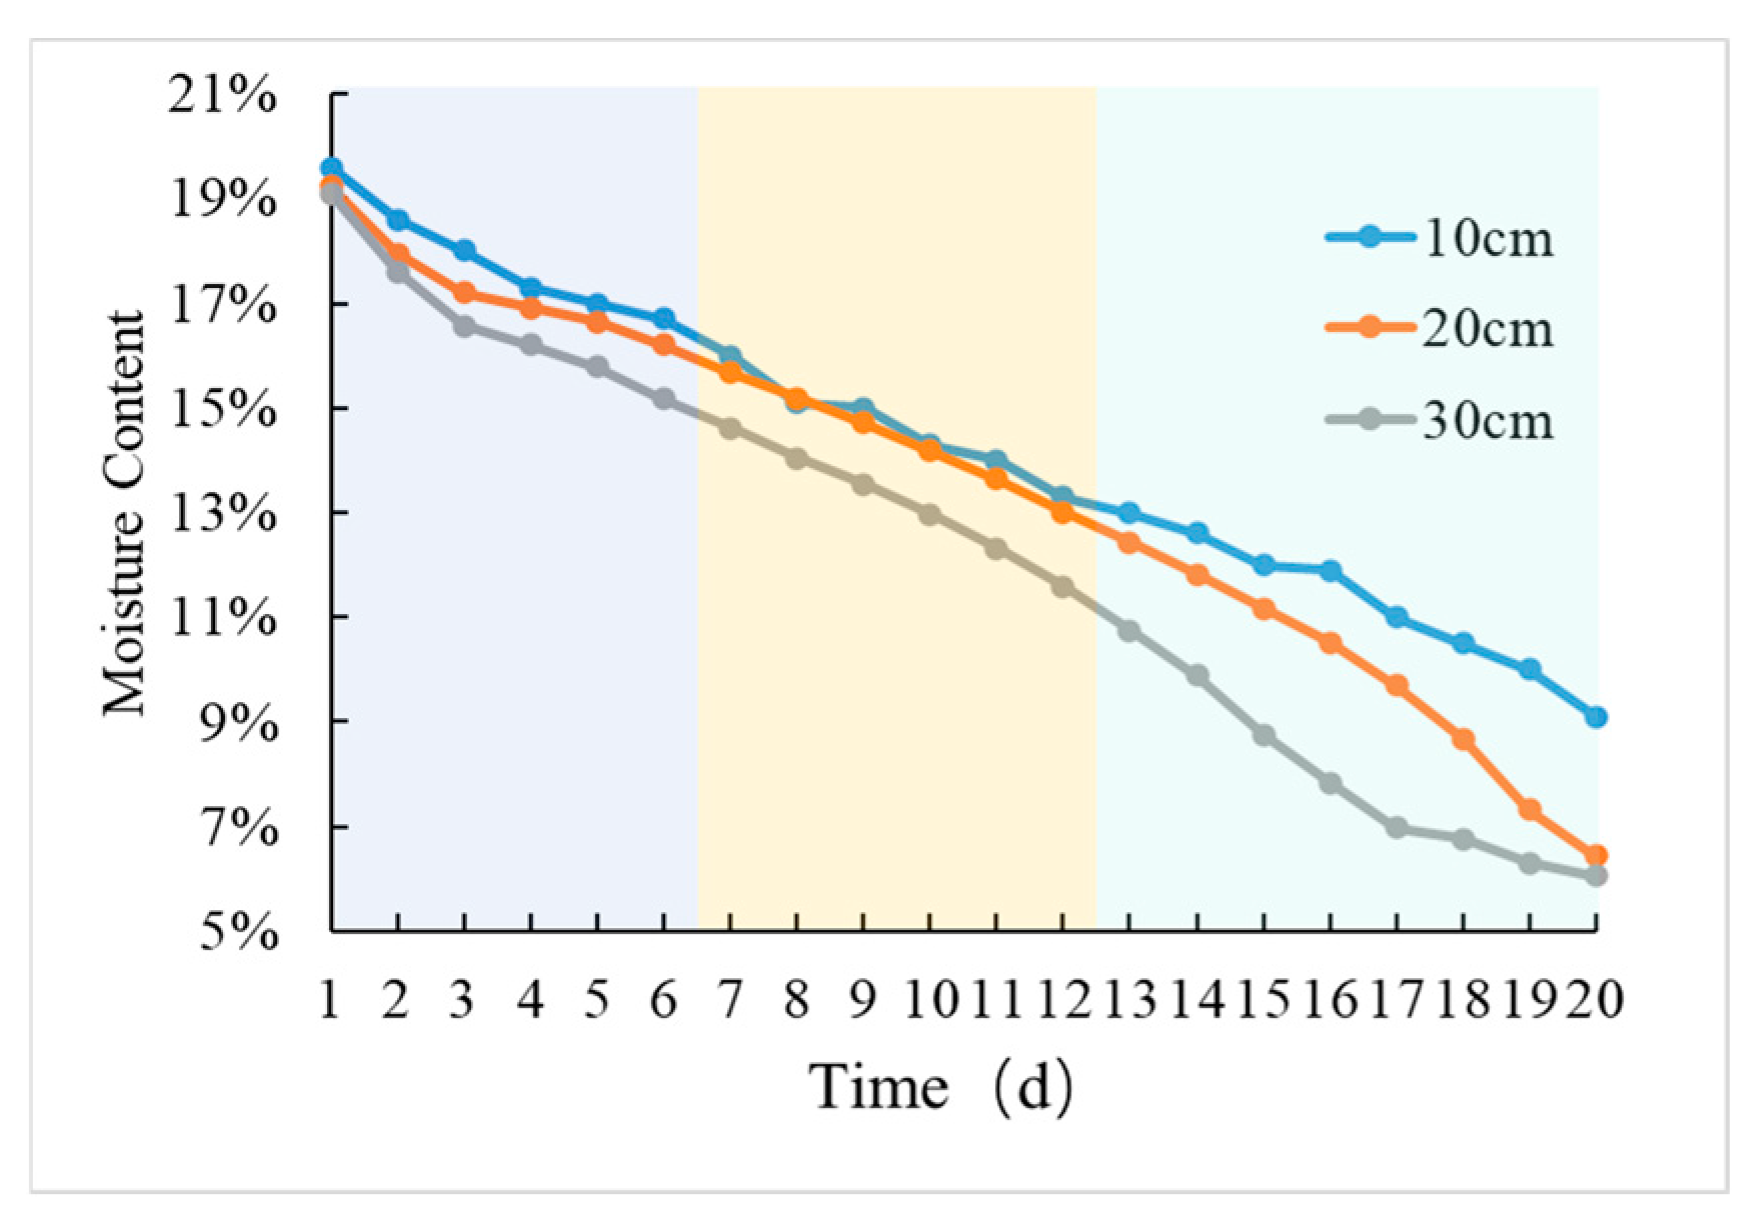
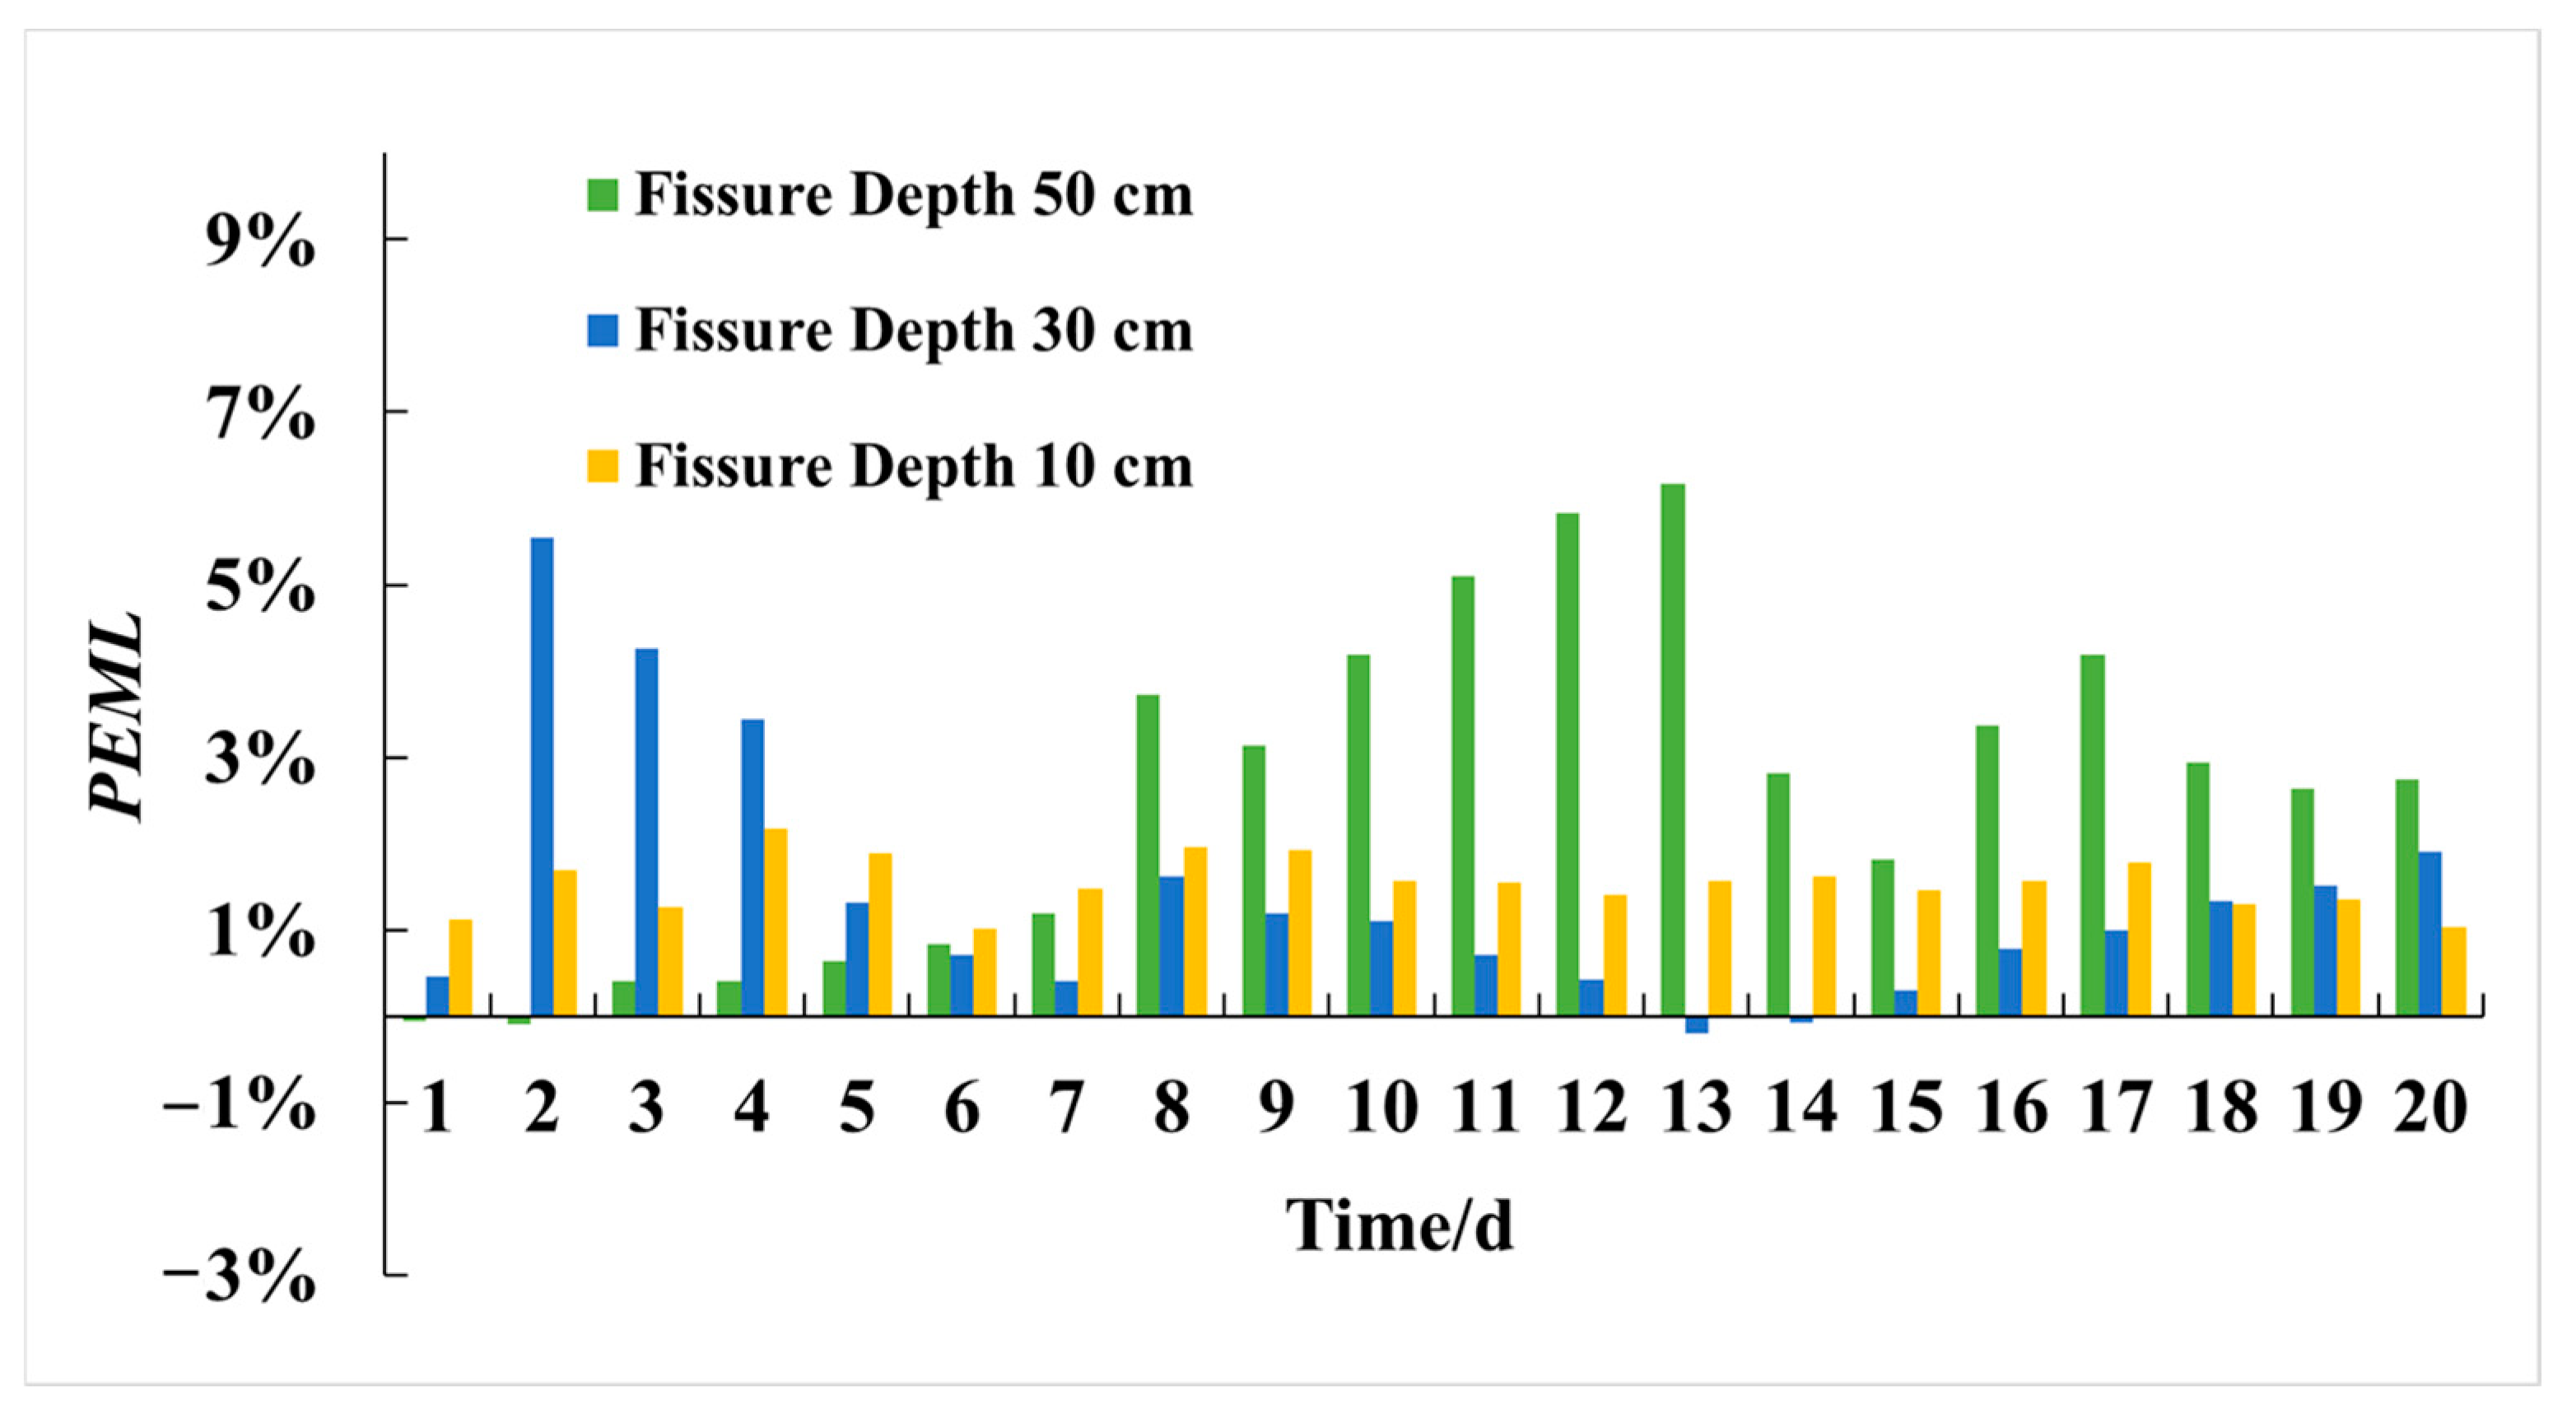
3.3. The Influence of Planar Fissures at Different Depths on Soil Moisture Transport

As shown in Figure 14, the influence of fissure depth on soil moisture is more extensive than that of width. The deeper the fissure, the greater its impact on soil moisture. On the tenth day, PD50 has a significant effect on the moisture content of deep soil, and the soil moisture contour shows a noticeable curve. The impact depth of PD10 is primarily within a range of 15 cm on the surface. Over time, within 20 days, the impact depth of PD50 far surpasses the depth of the fissure itself, while the soil-moisture impact depth of PD30 reaches approximately 40 cm, and PD10 exceeds 20 cm. In the horizontal direction, it can also be observed that the wider the fissure, the greater its range of influence.
Figure 15 illustrates the soil moisture variations at different monitoring depths for ground fissures. As depicted in Figure 15a–c, each fissure demonstrates a trend in which the deeper the soil depth, the slower the soil moisture loss is. Compared to PD30 and PD50, the soil moisture-content decline curve of PD10 is notably more gradual, especially at a depth of 50 cm, where the moisture decline is significantly reduced, and the soil moisture-content curve is nearly flat. On the 20th day, the soil moisture content at different depths was found to be PD50 < PD30 < PD10. Specifically, the soil moisture content at PD50 was lower than PD10 by 30.6%, 17.8%, and 8.4% at depths of 10 cm, 30 cm, and 50 cm, respectively. Additionally, as depicted in Figure 15d, the IDMC at all depths was above 6%, with the highest value at a depth of 10 cm, reaching 16.9%. This indicates that the depth of fissures has a substantial impact on moisture loss at various monitoring locations, and the deeper the soil, the lesser the impact.

3.4. Impact of Stepped Fissures at Different Depths on Soil Moisture Transport

As depicted in Figure 16, the soil moisture content demonstrates an asymmetric impact in terms of spatial distribution. Specifically, the moisture content in the footwall region of the step is notably lower than that in the hanging wall region. Moreover, as the depth of the step increases, the influence on soil moisture content becomes more extensive. For example, the impact range for SD10 is approximately 20 cm, while SD30 extends to around 50 cm, and SD50 exceeds 70 cm at the same depth. Additionally, it is observed that the deeper the fissure, the lower the soil moisture content becomes, and the more rapid the rate of moisture loss.
As shown in Figure 17, observation points were set at different depths of stepped fissures to observe soil moisture changes. As demonstrated in Figure 17a–c, all fissures display a slower rate of soil moisture loss as the depth increases. Comparable to planar fissures, the soil moisture decline curve for SD10 is relatively gradual compared to SD30 and SD50. On the 20th day, the soil moisture content at different depths follows the trend of SD50 < SD30 < SD10, with SD50 having lower soil moisture content than SD10 by 29.2%, 20.9%, and 13.9% at depths of 10, 30, and 50 cm, respectively.
Furthermore, Figure 17d showed that IDMC is above 9% at all depths, with the highest value of 15.3% observed at a depth of 10 cm. This suggests that fissure depth has a significant impact on moisture content loss at various monitoring locations, and this impact decreases with increasing soil depth.

3.5. Impact Differences of Different Ground Fissure Morphologies on Soil Moisture

The proportion of excess soil moisture loss (PEML) is defined as the difference in moisture loss between stepped fissures and planar fissures under the same environmental and fissure scale conditions, expressed as a percentage. This definition is intended to reflect the additional moisture loss incurred by stepped fissures relative to planar fissures. The calculation method for PEML is as follows:
P E M L = I s I P I P × 100 %
  • I s : The soil moisture content of stepped fissures.
  • I P : The soil moisture content of planar fissures.
As depicted in Figure 18, PEML typically presents positive values, with only a few cases of negative values that do not surpass 1%. This suggests that stepped ground fissures of the same size have a more significant impact on soil moisture loss compared to planar fissures. By evaluating the PEML values of three distinct-sized fissures, it becomes apparent that the larger the fissure scale, the higher the PEML. This implies that under large-scale fissuring, the soil moisture-loss effect of stepped fissures is significantly greater than that of planar fissures.

4. Discussion

4.1. Technical Advantages of Studying the Effect of Fissures on Soil Moisture Based on HYDRUS

Modeling is an effective and commonly used technical method to study environmental variables. The Van Genuchten hydraulic model is one of the most classic soil hydraulic models widely used in soil water-related studies under different slopes, wetlands, and geological disaster conditions [14,15,16]. In this study, we, based on the Van Genuchten hydraulic model, utilized the HYDRUS software to simulate the moisture distribution of the ground fissures. The outcomes indicated that the numerical simulation findings are consistent with the measured results. In particular, the lower RMSE value of the simulation results indicated that the changing law of the numerical simulation results of soil moisture is very similar to that of the actual measurement results.
This research found that fissure morphology features, estimated Van Genuchten hydraulic model parameters, and meteorological factors are crucial in determining the accuracy of simulation outcomes. Compared to other research methods, HYDRUS numerical simulation is capable of estimating various parameters for longer periods, such as larger fissure scales with different widths and depths, as well as increased model depth. This allows for the collection of more data and the revelation of soil moisture distribution laws under the influence of ground fissures. In field engineering and research, the HYDRUS numerical simulation method can still provide significant reference value, even when changes occur in fissure scale, soil texture, and meteorological conditions, as the basic soil moisture movement laws remain similar. However, it should be noted that soil stratification can affect test results in large-scale field experiments. Therefore, soil stratification must be taken into account when establishing the model. Additionally, different soil depths often have different soil moisture-content levels, and the initial soil moisture-content distribution must be set in the initial conditions of the model to increase the accuracy of the numerical simulation results.

4.2. Impact of Mining-Induced Fissures on Soil Moisture Transport

The process of evaporating saturated or nearly saturated soil moisture is composed of three distinct phases. When the content of soil moisture is abundant, it has the capability to evaporate directly into the atmosphere, which marks the initial stage of this process and is referred to as the stage of rapid and stable evaporation [17,18]. As the initial phase proceeds, the moisture content of the surface soil gradually diminishes, while the soil moisture from deeper levels migrates to the surface, initiating the second phase of soil evaporation. The intensity of evaporation progressively decreases with the decline in the moisture content of the surface soil. When the moisture content of both the surface and lower soil layers decreases and the water supply from the lower layers is insufficient, a dry soil layer emerges on top, transitioning to the third stage, namely the water-vapor diffusion stage. In this stage, soil moisture from deeper layers evaporates and diffuses through the dry top layer in the form of water-vapor diffusion. The evaporation rate in the water-vapor diffusion stage is exceptionally slow, and the soil moisture content attains a stable state [19]. The results of this research demonstrate that the presence of both planar and stepped fissures causes a reduction in the soil moisture content in the vicinity of the fissures. The degree of variation in the moisture content is closely related to the distance from the fissure’s surface. As this distance increases, the rate of moisture loss accelerates. This phenomenon can be attributed to the alteration of the water migration pattern in the deep soil caused by the fissures. The fissures create a cross-section in the soil that introduces new evaporation surfaces for the deep soil moisture. The moisture on the fissure walls comes into direct contact with the atmosphere and evaporates, leading to the dissipation of moisture. As the soil moisture evaporates, the moisture content of the fissure walls gradually decreases, entering the second stage of evaporation. Soil moisture near the fissure walls experiences water potential pressures in both the surface and fissure wall directions, resulting in an increased rate of moisture loss.

4.3. Impact of Fissure Morphological Factors on Soil Moisture Transport

The morphology of fissures plays a significant role in determining the impact of fissures on soil moisture. Studies have demonstrated that larger fissure scales lead to a greater influence on soil moisture. This is because both stepped and planar fissures expand the interface between deep soil and the atmosphere, thereby hastening the evaporation of soil moisture. Different morphological characteristics of fissures may have varying effects on soil moisture. For instance, fissure width and depth can boost the airflow speed at the fissure location, which may further accelerate the rate of evaporation for soil moisture. Particularly in field conditions, wind is a vital environmental factor that cannot be overlooked [20,21,22]. A broader fissure width has a direct impact on the rate of soil moisture evaporation along its walls, as a result of the influence of wind. Moreover, in field conditions, larger fissures have a larger illuminated area and receive more radiation, which may also contribute to an increased evaporation rate of soil moisture on the fissure walls [20]. However, studies have shown that expanding the fissure width has a relatively small effect on the depth of soil moisture. On the other hand, fissure depth plays a significant role in determining the depth of soil moisture disturbance, demonstrating that the greater the depth, the greater the degree of soil moisture disturbance.
Different types of fissures display unique morphological features. Stepped fissures possess a considerable area of exposed soil fissuring surfaces, which facilitates better soil evaporation conditions in comparison to planar fissures of the same size. This study demonstrated that for the same size, the soil moisture content of stepped fissures was lower than that of planar fissures at all stages, and the greater the fissure scale, the more pronounced this difference became.
The findings of this study have significant practical applications for the management of soil moisture in areas impacted by mining-induced fissures. By comprehending the particular consequences of fissure type and extent on soil moisture content, tailored interventions can be devised to mitigate the consequences of fissures on water resources. For instance, prioritizing the filling of stepped fissures over planar fissures might help minimize soil evaporation and improve overall soil moisture retention. Moreover, the insights gained from this study can inform the development of more efficient soil-moisture management strategies. By evaluating the impact of wild fissures on water resources and establishing priority management levels, it is possible to optimize governance efforts and reduce associated costs. This method not only enhances the efficiency of resource allocation but also contributes to the sustainable management of soil moisture in fissure-affected areas.

5. Conclusions

This study aimed to investigate the influence of specific fissure types on soil moisture distribution. The HYDRUS model was employed to simulate the effects of planar and stepped fissures on soil moisture content, using validated parameters. The study examined how fissure morphology impacts soil moisture distribution by manipulating fissure width and depth. Unlike previous research that has primarily focused on the general effects of fissures on soil properties, this study offers a more comprehensive understanding of how specific fissure characteristics affect moisture distribution. The main findings are as follows:
(1) Fissure Impact on Soil Moisture: Fissures cause a reduction in soil moisture in the immediate vicinity, with higher moisture levels observed at greater horizontal distances from the fissure and lower moisture levels observed near the surface in the vertical direction.
(2) Width and Depth Effects: The moisture content around the fissure tends to decrease as the width of the fissure expands, and the impact of fissure width on moisture content decreases with increased horizontal distance from the fissure. The moisture content also decreases with increasing fissure depth, with the influence of depth changes on moisture content being greater the closer to the surface. At depths of 10, 30, and 50 cm, the soil moisture content of PD50 was 30.6%, 17.8%, and 8.4% lower than that of PD10, respectively, while the soil moisture content of SD50 was 29.2%, 20.9%, and 13.9% lower than that of SD10 at the same depths.
(3) Comparison of Fissure Types: For the same width and depth of fissures, stepped fissures lose water at a faster rate than planar fissures. Additionally, the larger the scale of the fissures, the more pronounced the difference in water loss between stepped and planar fissures becomes.
Future Research Directions
(1) Soil Type Variability: Investigating the influence of different soil types on the disturbance effects of fissures would enhance our understanding of the variability in soil moisture responses.
(2) Field Condition Complexity: Considering the complexities of water transport in actual field soils, including the presence of plant roots and other soil solutes, would provide a more realistic assessment of fissure impacts.
These findings contribute to the development of effective strategies for the prevention and control of mining-induced fissures and support ecological restoration efforts in subsidence areas. By providing a comprehensive analysis of soil moisture distribution patterns, this study offers valuable information to policymakers and environmental managers.

Author Contributions

Conceptualization, J.Z.; Software, J.Z.; validation, Z.S.; formal analysis, Z.S.; data curation, M.C.; writing—original draft, S.Y. and Z.G.; writing—review & editing, J.Z., N.G., Y.G. and R.H.; project administration, M.C.; funding acquisition, Z.S. and J.Z. All authors have read and agreed to the published version of the manuscript.

Funding

This work was supported by Open Fund of State Key Laboratory of Water Resource Protection and Utilization in Coal Mining (Grant No. GJNY-20-113-15); The Science and Technology Innovation Project of CHN ENERGY (Grant No. GJNY-22-92); National Natural Science Foundation of China’s Youth Fund Project (Grant No. 52204183).

Data Availability Statement

The original contributions presented in the study are included in the article, further inquiries can be directed to the corresponding author.

Conflicts of Interest

Y.G. and R.H. are employed by the Shendong Coal Group Co., Ltd. The remaining authors declare that the research was conducted in the absence of any commercial or financial relationships that could be construed as a potential conflict of interest.

References

  1. Liu, H.; Deng, K.; Zhu, X.; Jiang, C. Effects of mining speed on the developmental features of mining-induced ground fissures. Bull. Eng. Geol. Environ. 2019, 78, 6297–6309. [Google Scholar] [CrossRef]
  2. Bi, Y.; Xie, L.; Wang, J.; Zhang, Y.; Wang, K. Impact of host plants, slope position and subsidence on arbuscular mycorrhizal fungal communities in the coal mining area of north-central China. J. Arid Environ. 2019, 163, 68–76. [Google Scholar] [CrossRef]
  3. Mi, J.; Yang, Y.; Hou, H.; Zhang, S.; Ding, Z.; Hua, Y. Impacts of ground fissures on soil properties in an underground mining area on the Loess Plateau, China. Land 2022, 11, 162. [Google Scholar] [CrossRef]
  4. Wu, L.; Tian, J.; Tang, Y.; Zhu, Z. Effects of collapse-fissure on soil moisture in arid and semi-arid mining area. South North Water Divers. Water Technol. 2019, 17, 115–120. [Google Scholar]
  5. Li, X.; Wang, S.; Liu, T.; Ma, F. Engineering geology, ground surface movement and fissures induced by underground mining in the jinchuan nickel mine. Eng. Geol. 2004, 76, 93–107. [Google Scholar] [CrossRef]
  6. Chen, J.; Zhu, Z.; Wu, L. Physical model test on moisture diffusion in discontinuous homogeneous soil with collapse-fissure. Chin. J. Geol. Hazards Prev. 2018, 29, 66–72. [Google Scholar]
  7. Du, G.; Chen, X.; Qie, C.; Yang, D. Impacts of Cracks on Soil Moisture and Surface Shear Strength in Semi-Arid Mining Area. J. Ecol. Rural. Environ. 2016, 32, 1673–4831. [Google Scholar]
  8. Xu, C.; Shouchen, M.; Zhang, H.; Wang, R.; Guan, Z. Effect of cracks on soil characteristics and crop growth in subsided coal mining areas. Chin. J. Eco-Agric. 2015, 23, 597–604. [Google Scholar]
  9. Wang, Q.; Dong, S.; Wang, H.; Yang, J.; Wang, X.; Zhao, C.; Zhang, X. Influence of mining subsidence on soil water movement law and its regulation in blown-sand area of Western China. J. Coal Sci. 2021, 46, 1532–1540. [Google Scholar] [CrossRef]
  10. Zhang, J.; Bi, Y.; Song, Z.; Xiao, L.; Christie, P. Arbuscular mycorrhizal fungi alter root and foliar responses to fissure-induced root damage stress. Ecol. Indic. 2021, 127, 107800. [Google Scholar] [CrossRef]
  11. Bi, Y.; Wu, Y.; Zhang, J.; Pang, S. Simulation of soil water and salt movement in mining ground fissure zone based on HYDRUS. J. Coal Sci. 2020, 45, 360–367. [Google Scholar]
  12. Van Genuchten, M.T. A closed-form equation for predicting the hydraulic conductivity of unsaturated soils. Soil Sci. Soc. Am. J. 1980, 44, 892–898. [Google Scholar] [CrossRef]
  13. Wang, W.; Lu, Y. Analysis of the mean absolute error (MAE) and the root mean square error (RMSE) in assessing rounding model. In IOP Conference Series: Materials Science and Engineering, Proceedings of the 2017 the 5th International Conference on Mechanical Engineering, Materials Science and Civil Engineering, Kuala Lumpur, Malaysia, 15–16 December 2017; AIP Publishing: Melville, NY, USA, 2018; p. 012049. [Google Scholar]
  14. Šimůnek, J.; Van Genuchten, M.T.; Šejna, M. Recent developments and applications of the HYDRUS computer software packages. Vadose Zone J. 2016, 15, 1–25. [Google Scholar] [CrossRef]
  15. Pucher, B.; Langergraber, G. Simulating vertical flow wetlands using filter media with different grain sizes with the HYDRUS Wetland Module. J. Hydrol. Hydromech. 2018, 66, 227–231. [Google Scholar] [CrossRef]
  16. Šimůnek, J.; Van Genuchten, M.T.; Kodešová, R. Thematic issue on HYDRUS software applications to subsurface fluid flow and contaminant transport. J. Hydrol. Hydromech. 2018, 66, 129–132. [Google Scholar] [CrossRef]
  17. Wang, X. Vapor Flow Resistance of Dry Soil Layer to Soil Water Evaporation in Arid Environment: An Overview. Water 2015, 7, 4552–4574. [Google Scholar] [CrossRef]
  18. Wang, C.; Fu, B.; Zhang, L.; Xu, Z. Soil moisture–plant interactions: An ecohydrological review. J. Soils Sediments 2019, 19, 1–9. [Google Scholar] [CrossRef]
  19. Huang, C. Pedology; China Agriculture Press: Beijing, China, 2000. [Google Scholar]
  20. Huang, X. Study on the Effect of the Wind and the Light to the Soil Moisture Evaporation and Moist-Locking Measures; Lanzhou University of Technology: Lanzhou, China, 2011. [Google Scholar]
  21. Li, X.; Wang, F.; Hu, L.; Mu, X. Impact of wind-speed and straw-mulching on soil water evaporation. Agric. Res. Arid. Areas 2011, 29, 186–190. [Google Scholar]
  22. McVicar, T.R.; Roderick, M.L.; Donohue, R.J.; Li, L.T.; Van Niel, T.G.; Thomas, A.; Grieser, J.; Jhajharia, D.; Himri, Y.; Mahowald, N.M. Global review and synthesis of trends in observed terrestrial near-surface wind speeds: Implications for evaporation. J. Hydrol. 2012, 416, 182–205. [Google Scholar] [CrossRef]
Figure 1. Distribution of soil moisture observation points.
Water 16 02496 g001
Figure 2. Boundary conditions and the location of the observation points.
Water 16 02496 g002
Figure 3. Comparison of soil moisture distribution between physical test and HYDRUS simulation. (a) Moisture of physical test. (b) Moisture of HYDRUS simulation.
Water 16 02496 g003
Figure 4. Dimensions of the PW10, PW20, and PW30 fissures.
Water 16 02496 g004
Figure 5. Location of the observation points of the PW10.
Water 16 02496 g005
Figure 6. Dimensions of the PD10, PD30, and PD50 fissures.
Water 16 02496 g006
Figure 7. Dimensions of the SW10, SW20, and SW30 fissures.
Water 16 02496 g007
Figure 8. Location of the observation point locations of SW10.
Water 16 02496 g008
Figure 9. Dimensions of the SD10, SD30, and SD50 fissures.
Water 16 02496 g009
Figure 10. The spatiotemporal variation of soil moisture content in planar ground fissures with different widths.
Water 16 02496 g010
Figure 11. The variation of soil moisture content at the bottom of planar fissures with fissure width. (a) The soil moisture content at the bottom of the ground fissure. (b) IDMC at the bottom point of the ground fissure.
Water 16 02496 g011
Figure 12. The spatiotemporal variation of soil moisture content in different width stepped ground fissures.
Water 16 02496 g012
Figure 13. The variation of soil moisture content at the bottom of stepped fissures with different fissure width.
Water 16 02496 g013
Figure 14. The spatial distribution changes of soil moisture caused by planar fissures of different depths.
Water 16 02496 g014
Figure 15. Soil moisture changes at monitoring points set at different depths for ground fissures at different depths. (a) PD10. (b) PD30. (c) PD50. (d) IDMC at different depths of observation points from the ground.
Water 16 02496 g015
Figure 16. The spatial distribution changes of soil moisture caused by different depths of stepped ground fissures.
Water 16 02496 g016
Figure 17. The soil moisture changes at monitoring points set at different depths for fissures in steps of varying depths. (a) SD10. (b) SD30. (c) SD50. (d) IDMC of observation points at different depths from the ground.
Water 16 02496 g017
Figure 18. The percentage change trend of soil moisture loss increases in stepped ground fissures compared to planar ground fissures.
Water 16 02496 g018
Table 1. Hydrodynamic parameters of the soil.
Qr (−)Qs (−)Alpha (1/cm)n (−)Ks (cm/day)
0.04970.39350.03421.751104.87
Note(s): Qr: Soil water-holding capacity; Qs: saturated soil moisture content; Alpha and n: parameters a (L − 1) and n in the VG model, respectively; Ks: saturated hydraulic conductivity.
Table 2. Daily evaporation data.
Time (d)Evaporation Intensity (cm/d)Time (d)Evaporation Intensity (cm/d)
10.68110.58
20.43120.4
30.74130.65
40.84140.54
50.62150.5
60.57160.47
70.65170.6
80.47180.63
90.55190.77
100.51200.71
Table 3. Accuracy assessment of HYDRUS simulated data and measured data.
PointRMSEREPointRMSERE
A12.049.34%A60.842.03%
B12.4919.91%B61.136.29%
C12.2316.08%C61.669.11%
D12.6518.15%D62.4815.66%
E11.195.93%E62.1012.56%
Mean2.1213.88% 1.649.13%
Disclaimer/Publisher’s Note: The statements, opinions and data contained in all publications are solely those of the individual author(s) and contributor(s) and not of MDPI and/or the editor(s). MDPI and/or the editor(s) disclaim responsibility for any injury to people or property resulting from any ideas, methods, instructions or products referred to in the content.

