


The Impact of Sandbars on Bank Protection Structures in Low-Land Reaches: Case of Ganges and Brahmaputra-Jamuna


 ,
,
Abstract
1. Introduction
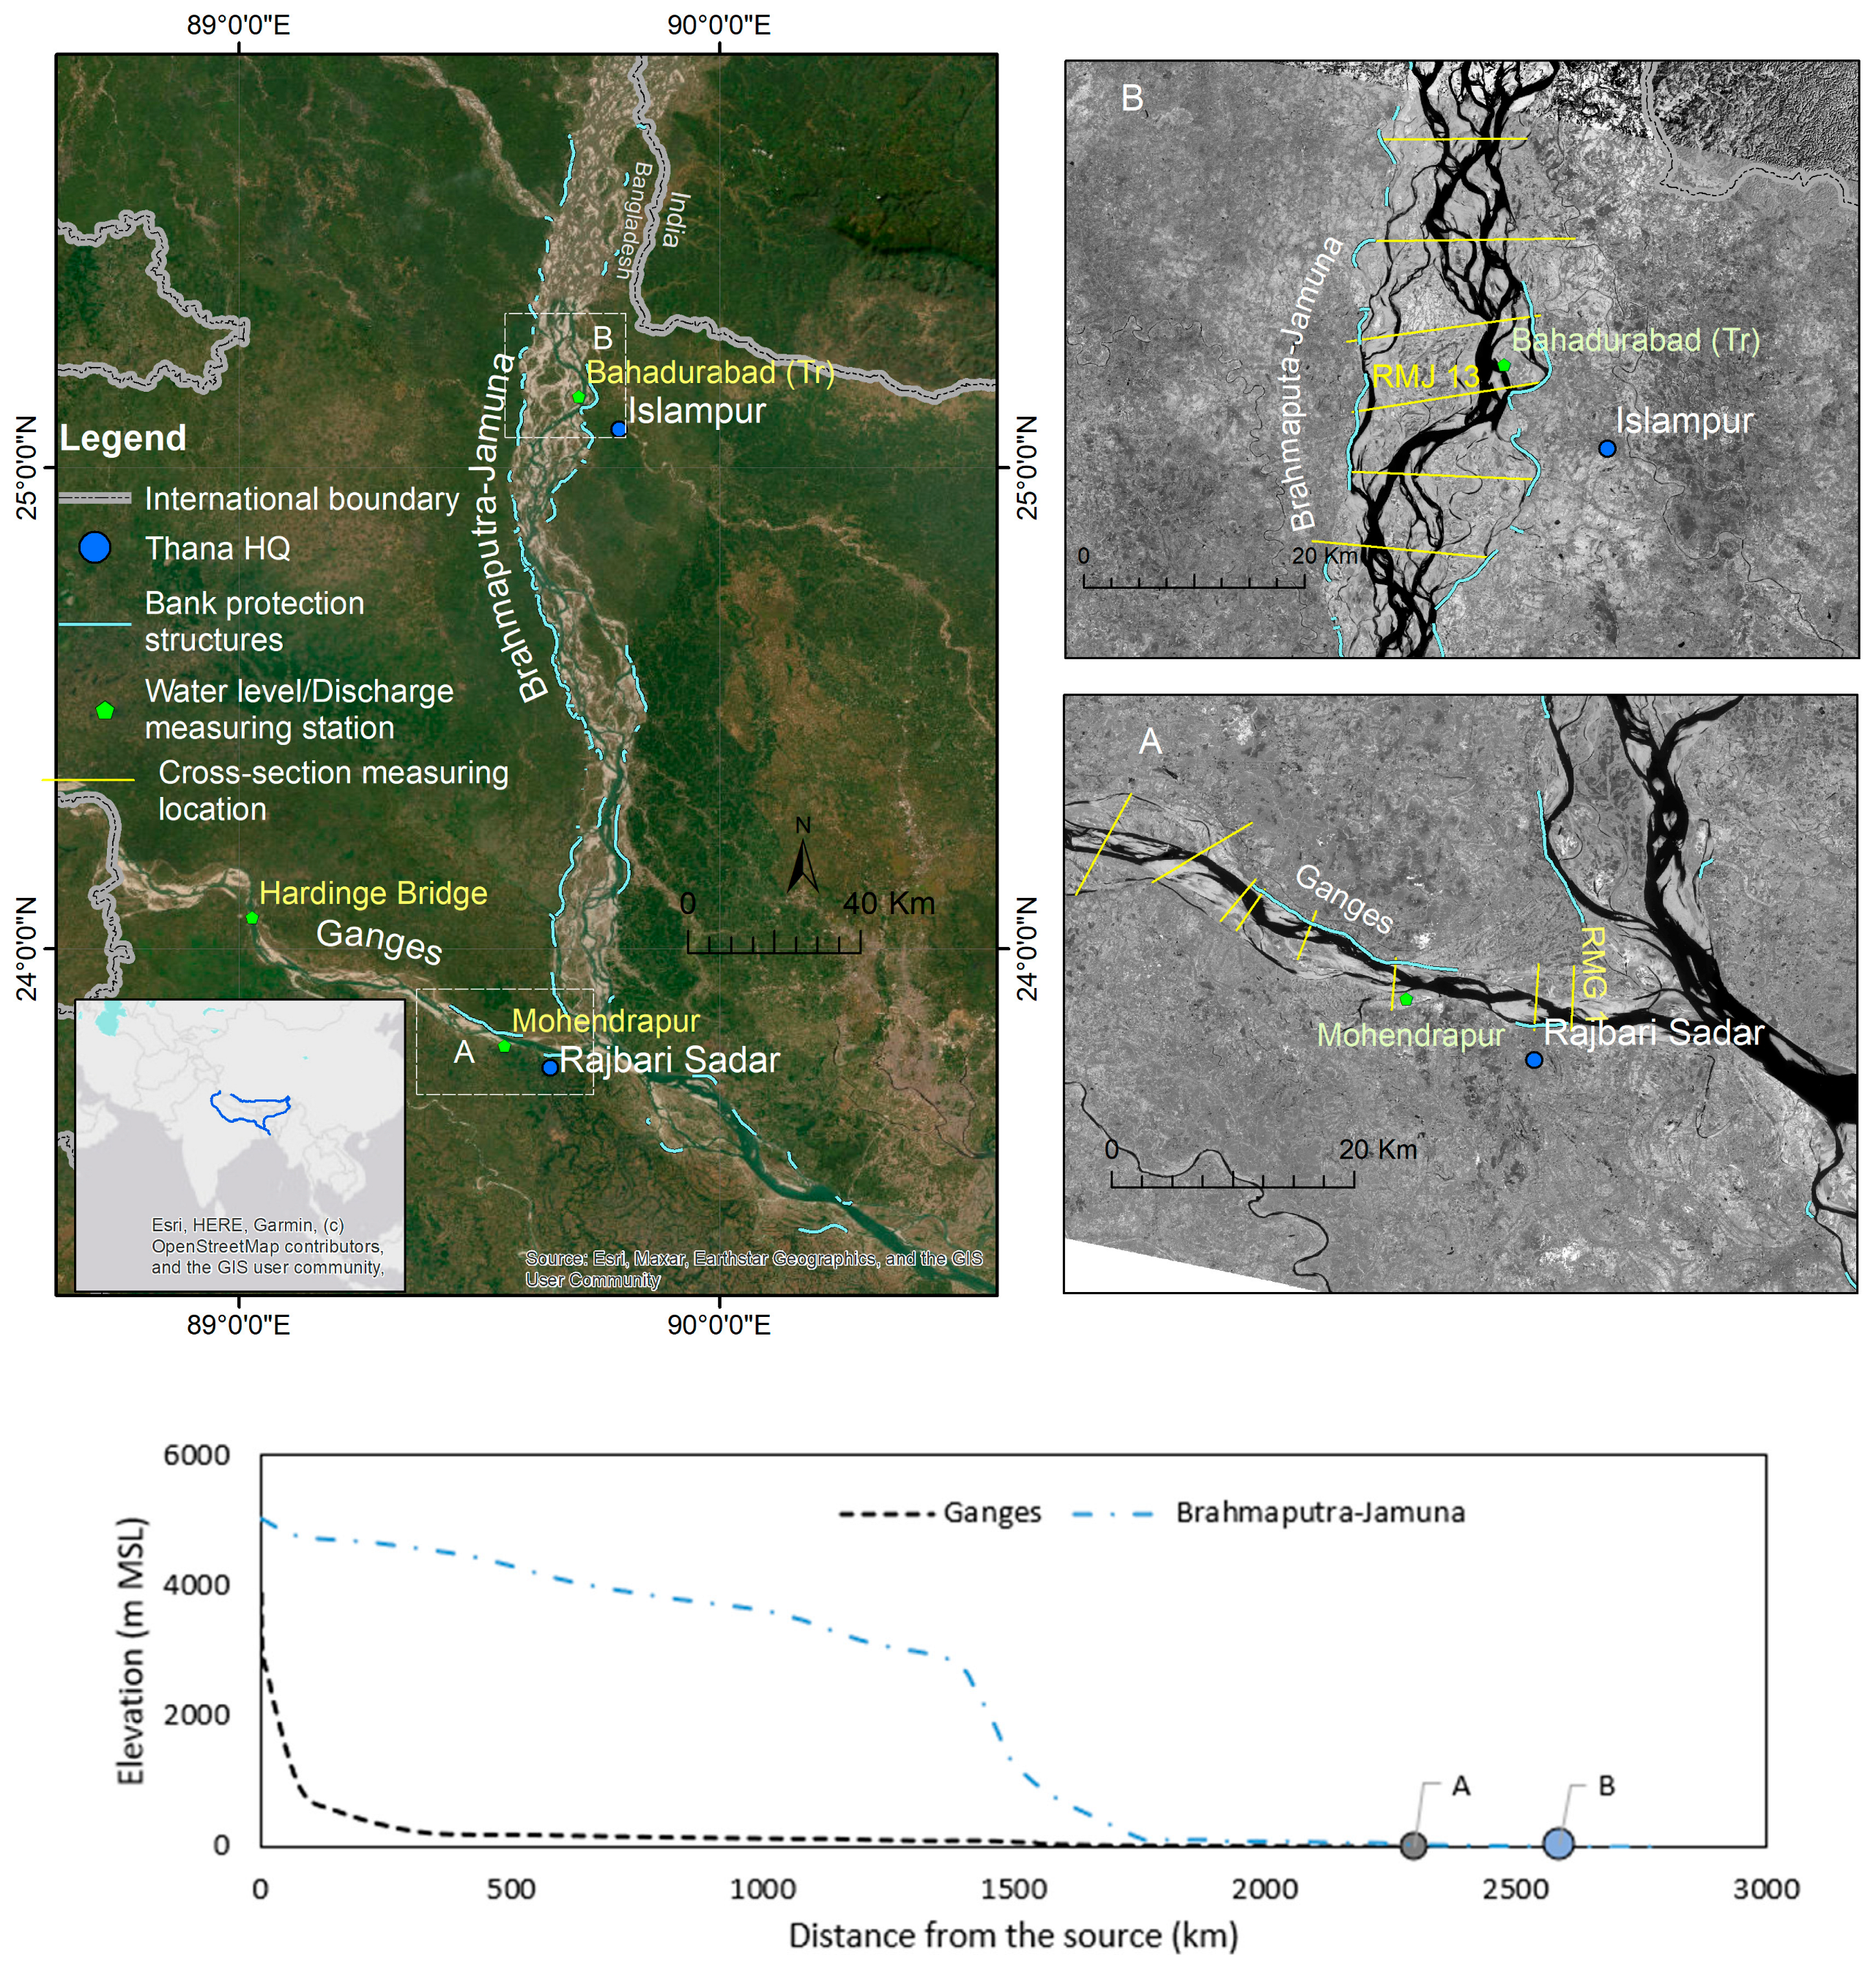
2. Study Area
3. Methodology
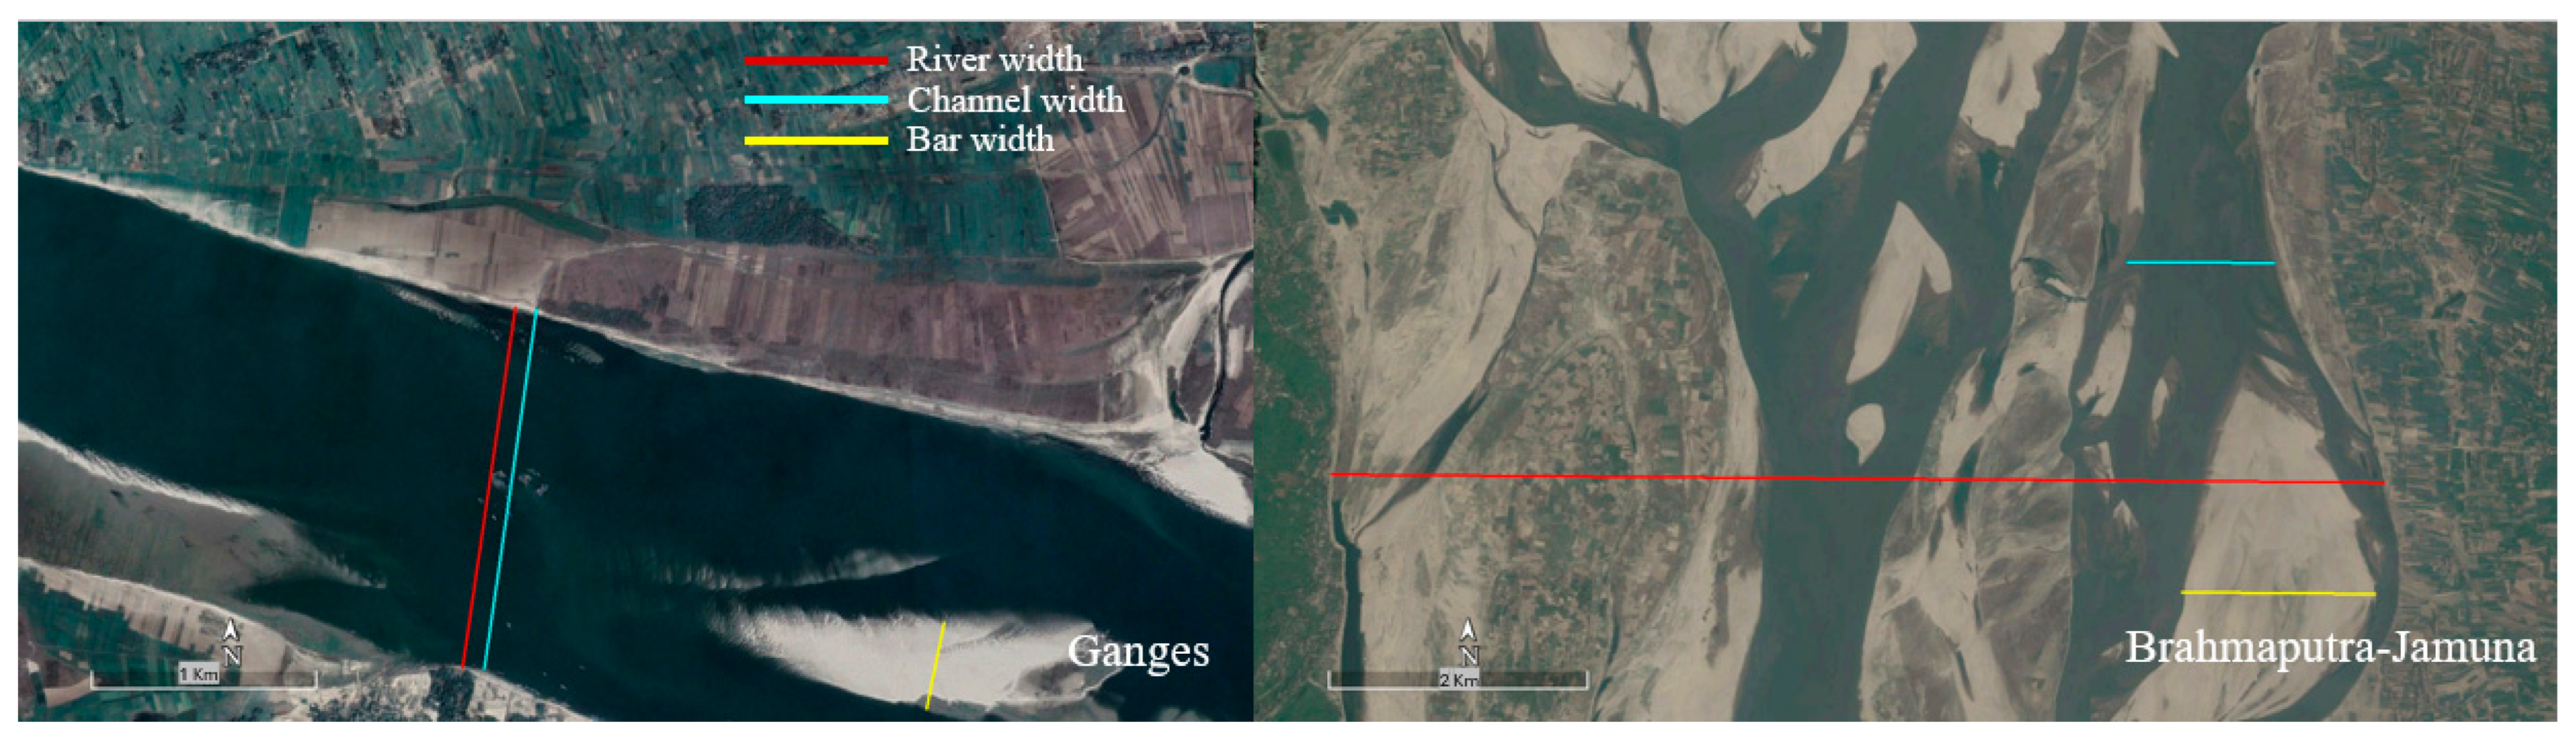
3.1. Satellite Image Analysis
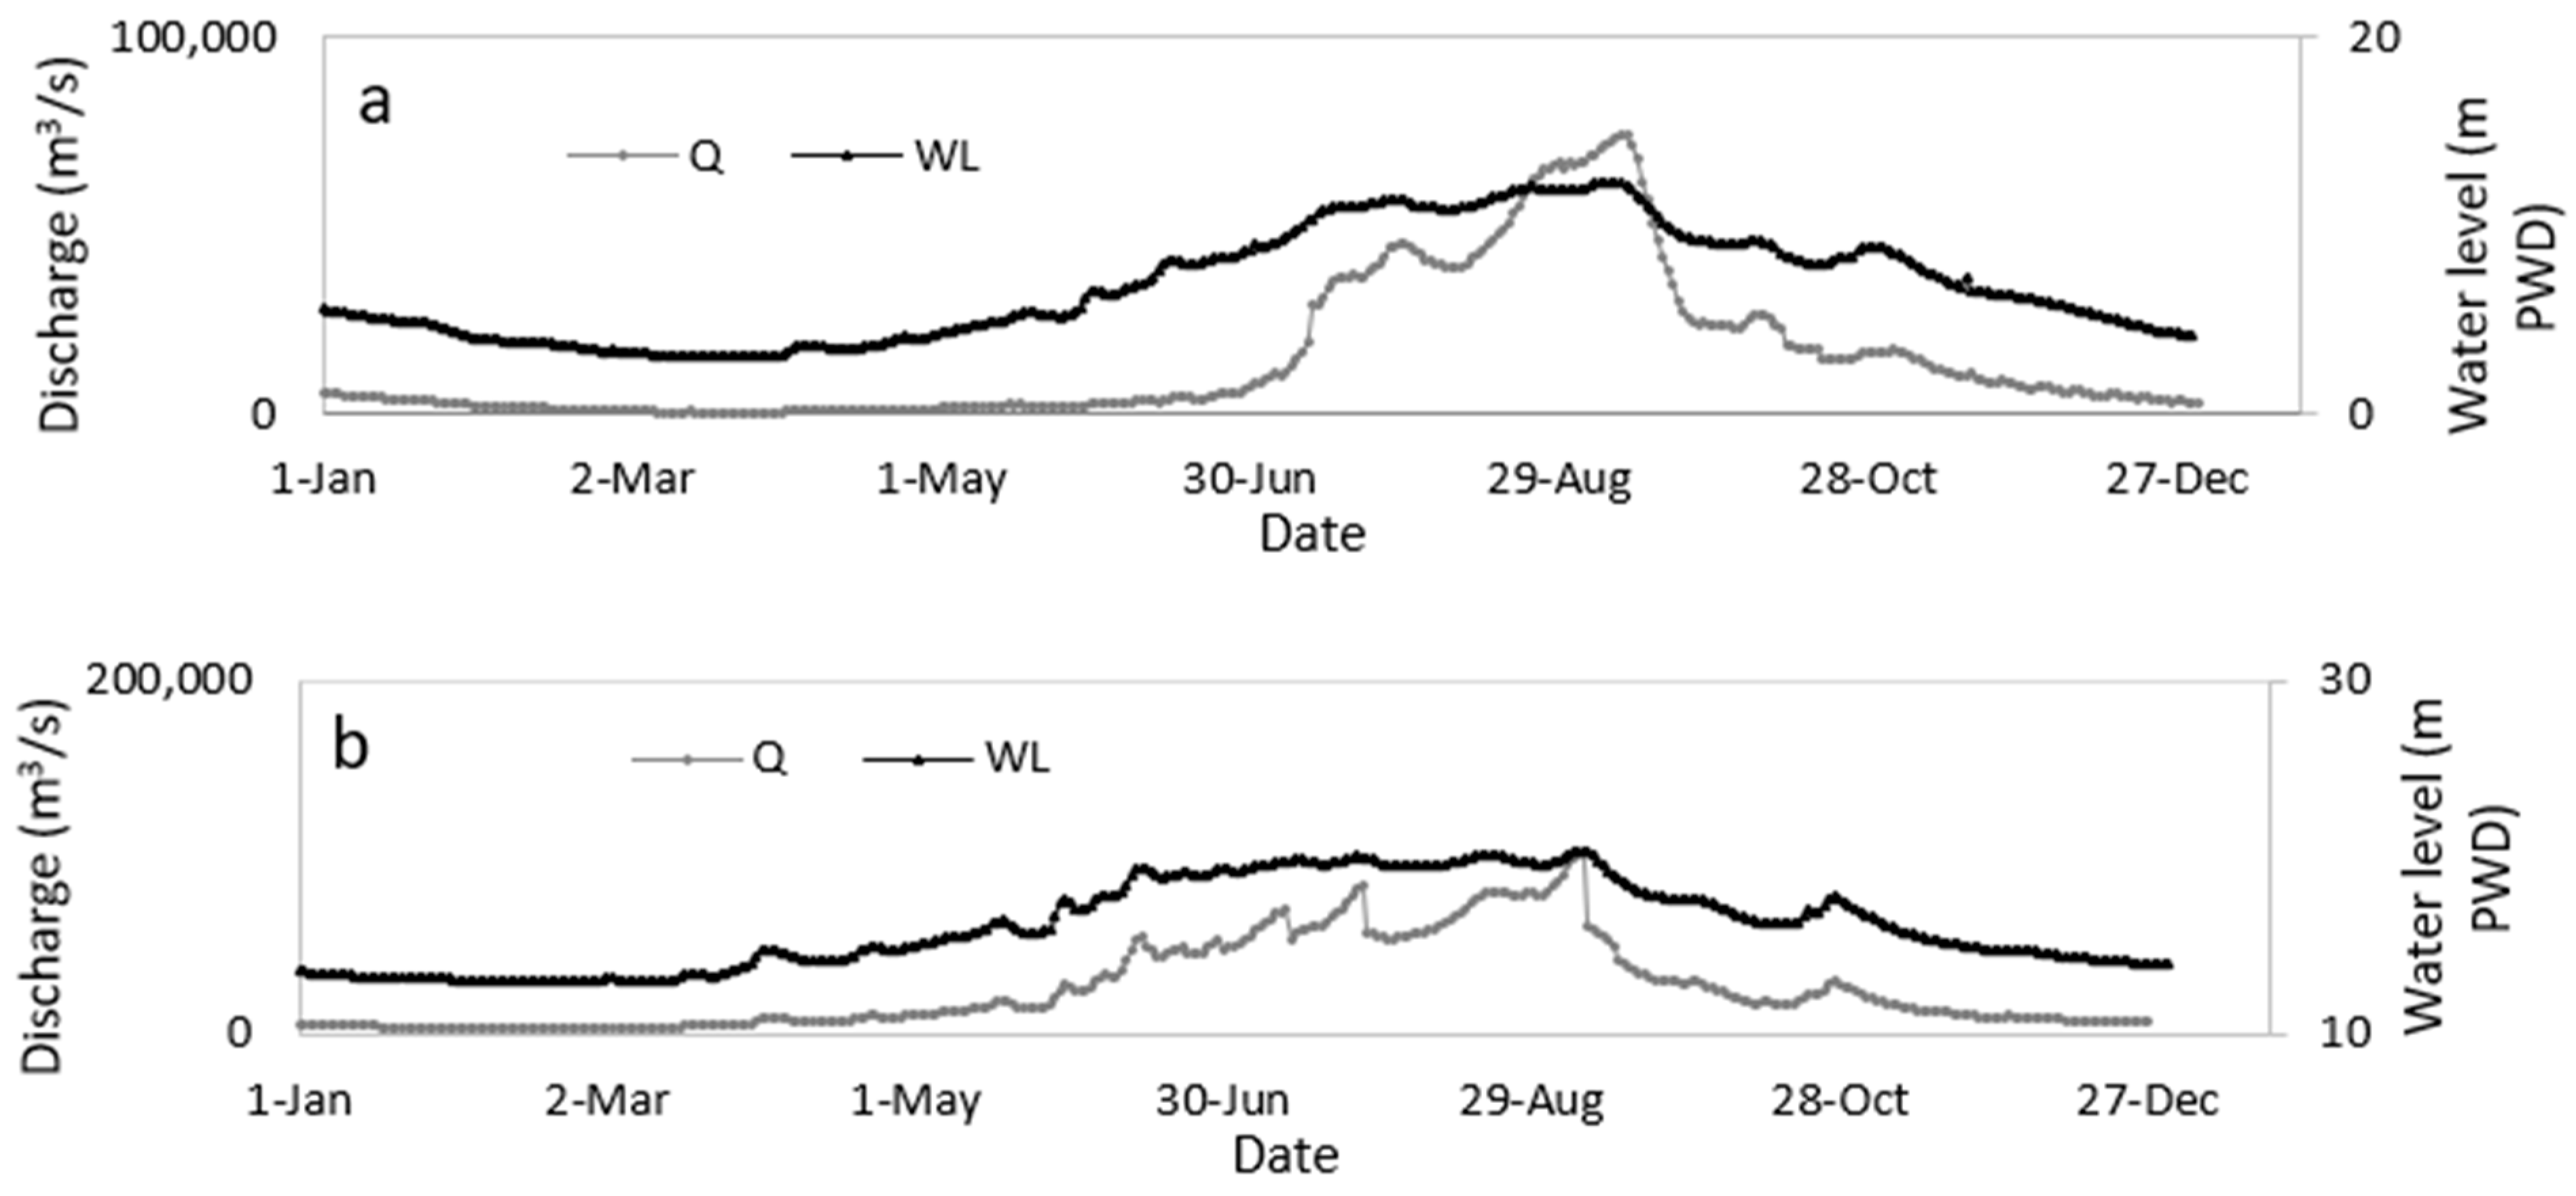
3.2. Time Series Hydraulic Data Analysis
3.3. 2D Numerical Simulation
3.3.1. Governing Equations
3.3.2. Model Schematization and Boundary Conditions
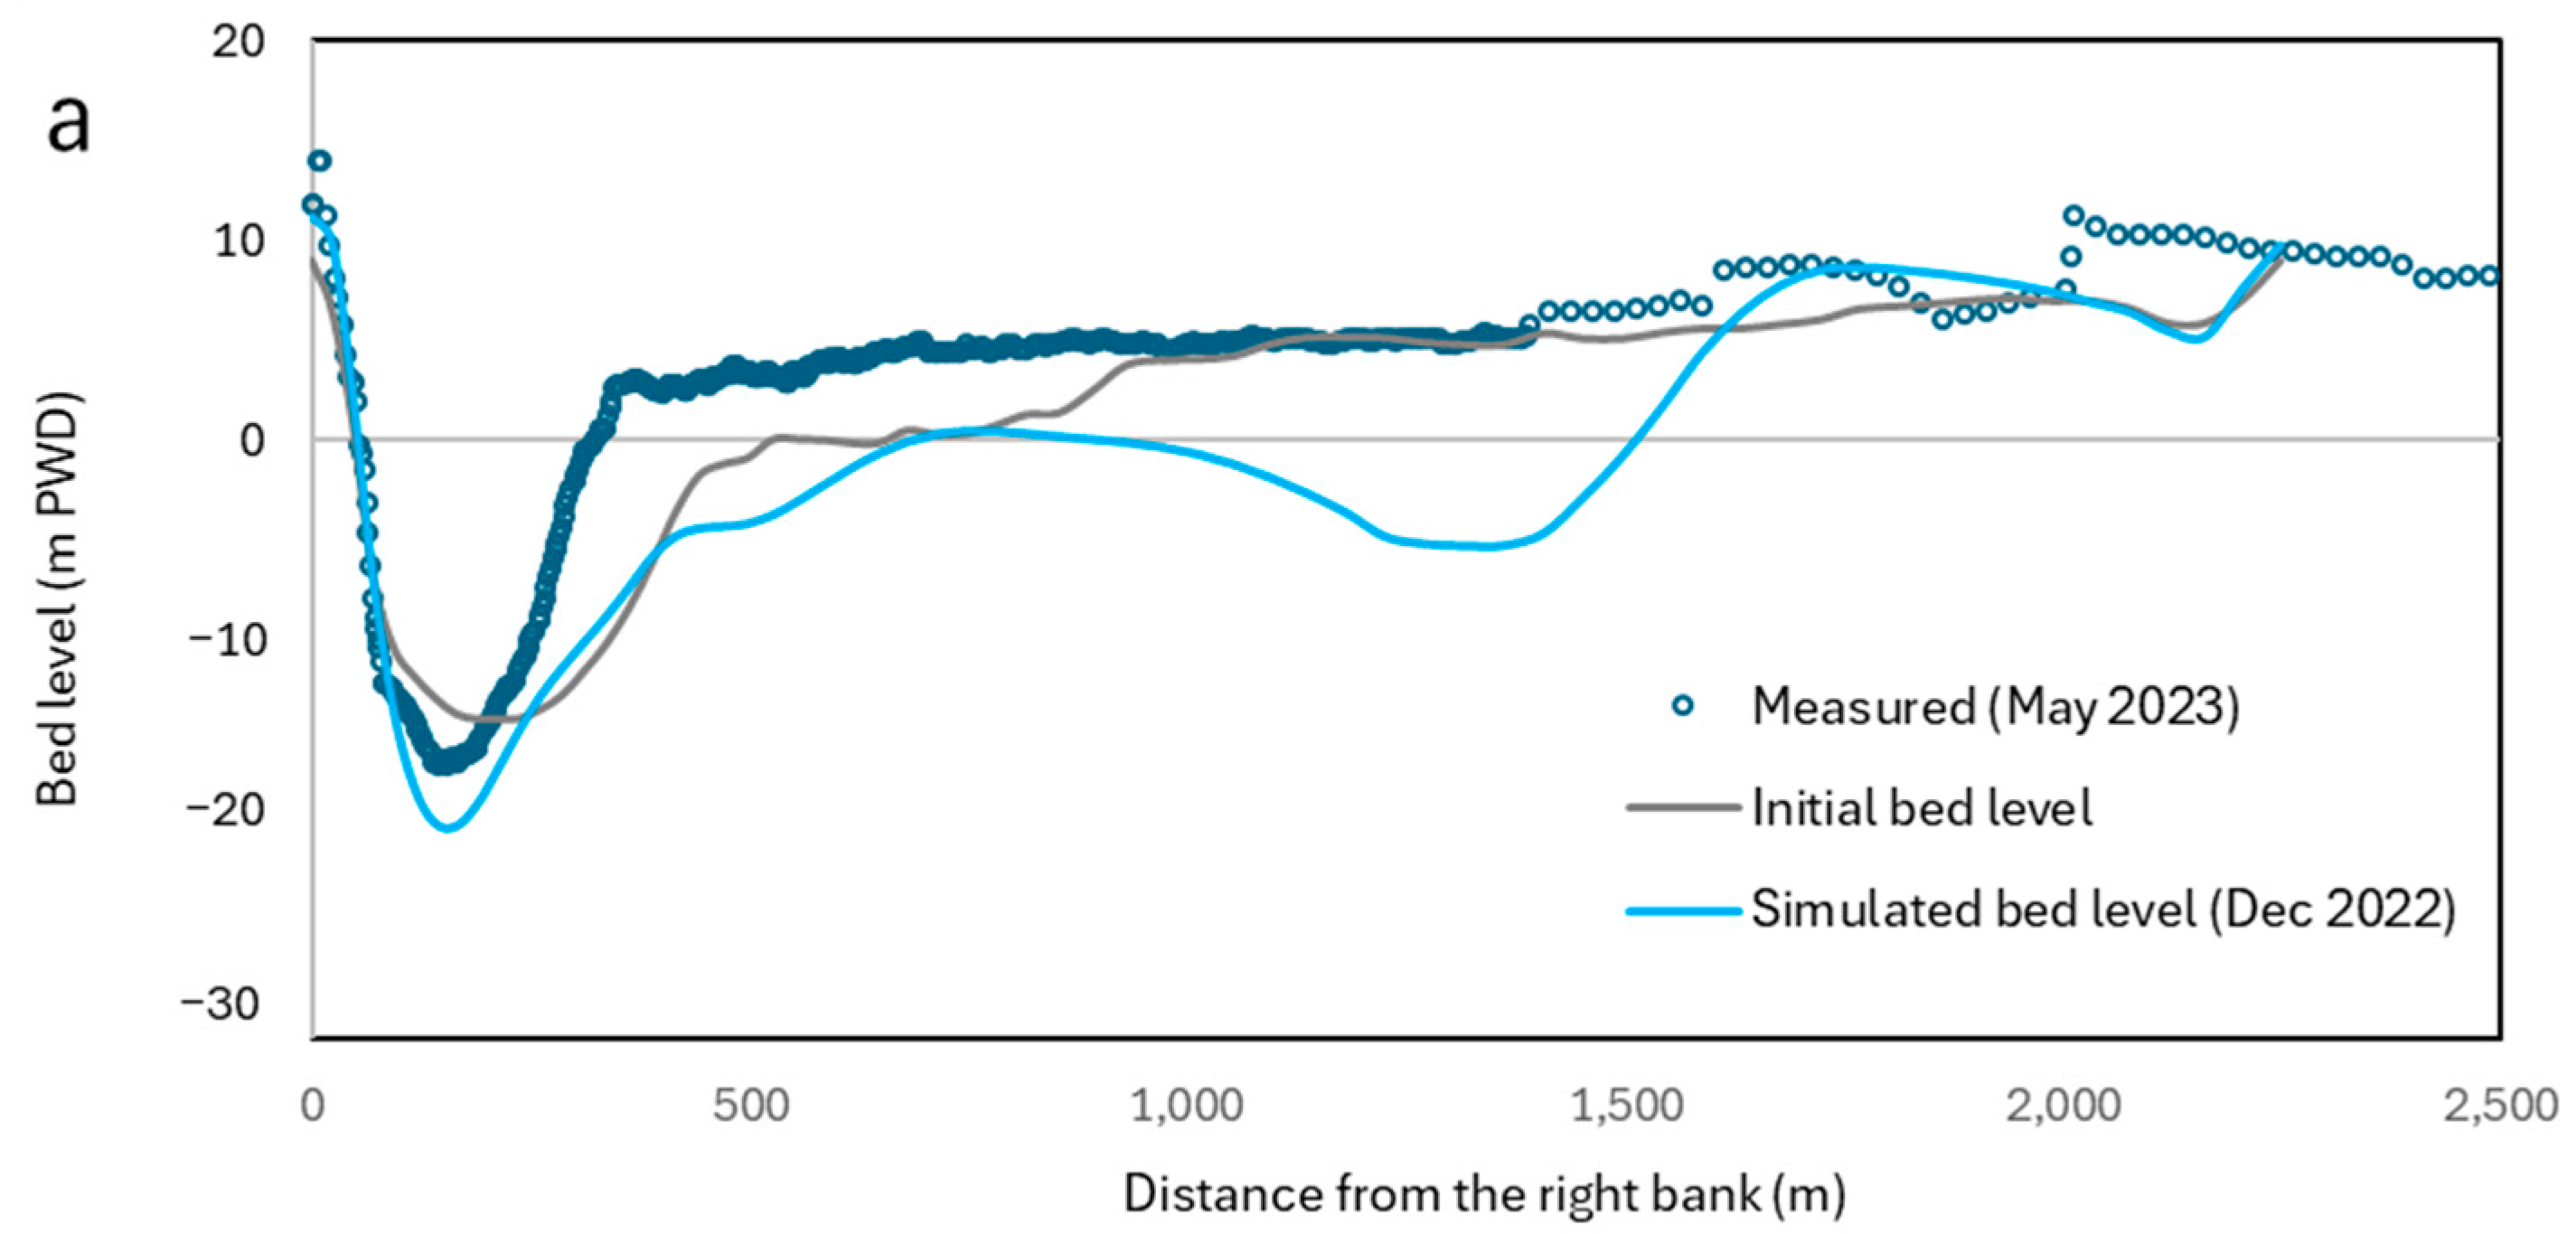
3.3.3. 2D Numerical Model Validation
4. Results
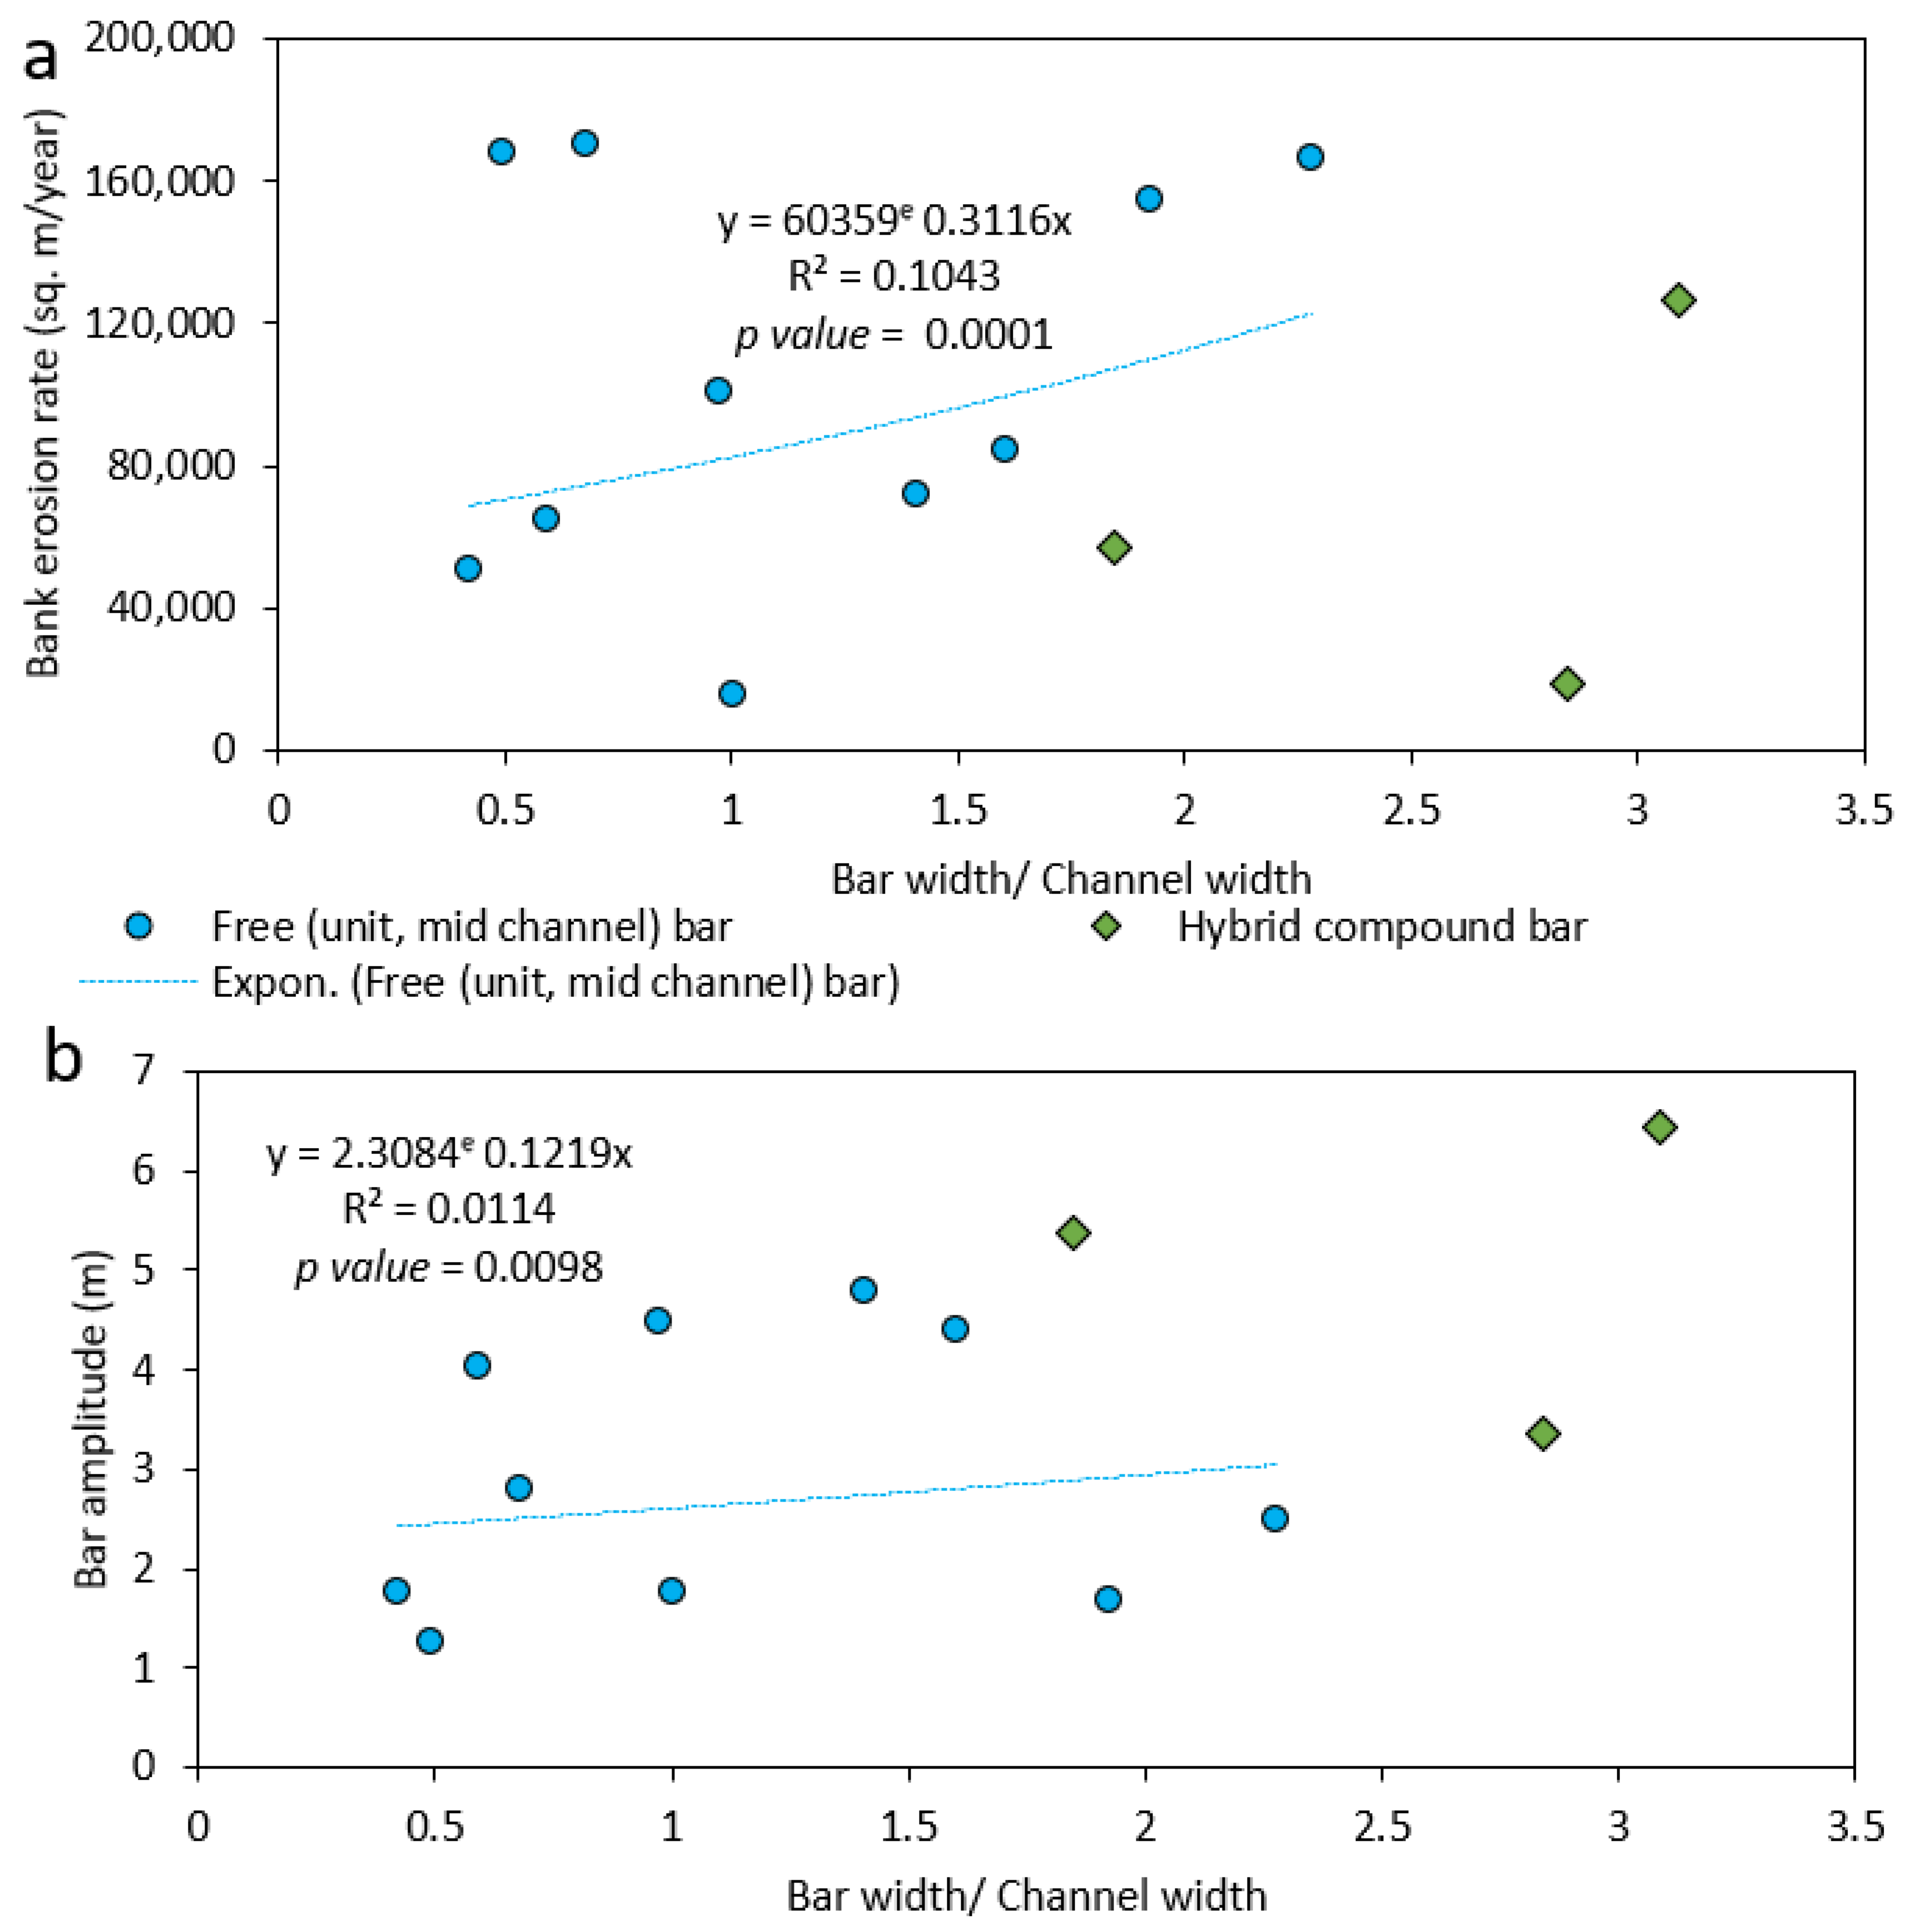
4.1. Channel-Bar Dynamics and Bank Erosion
4.1.1. Meandering River: Ganges
4.1.2. Braided River: Brahmaputra-Jamuna
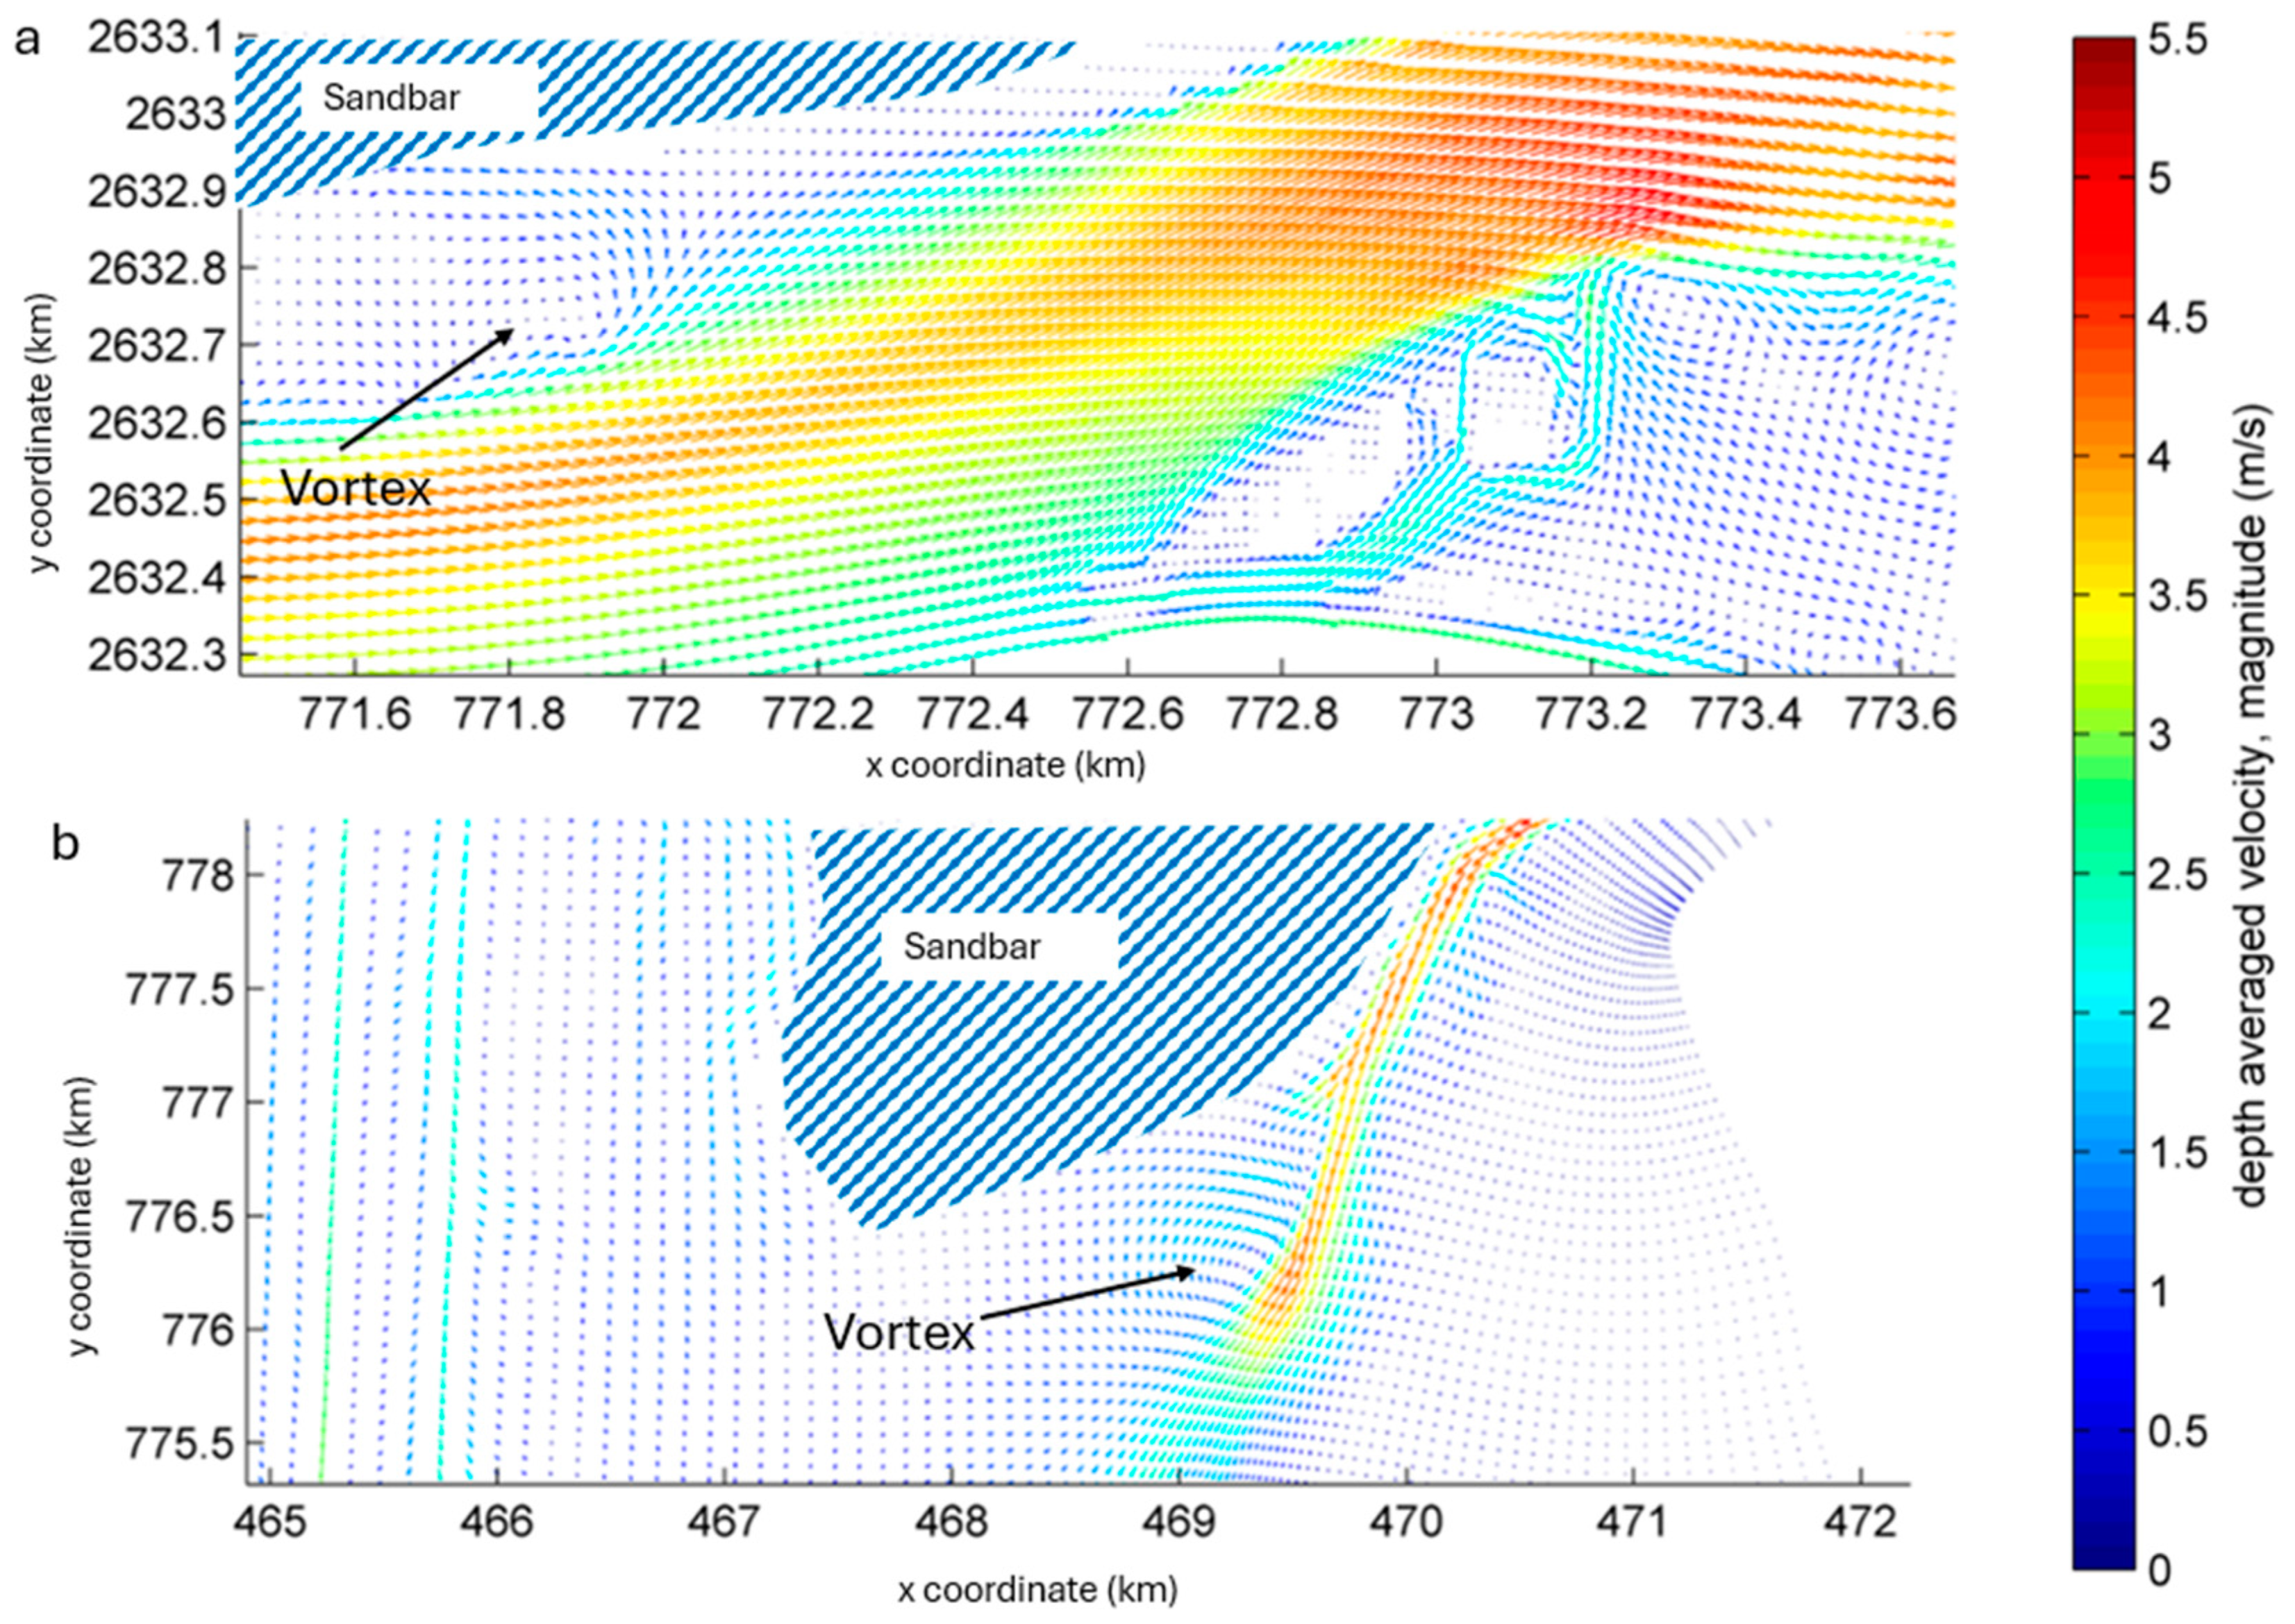
4.2. Hydraulic Impact of Sandbar
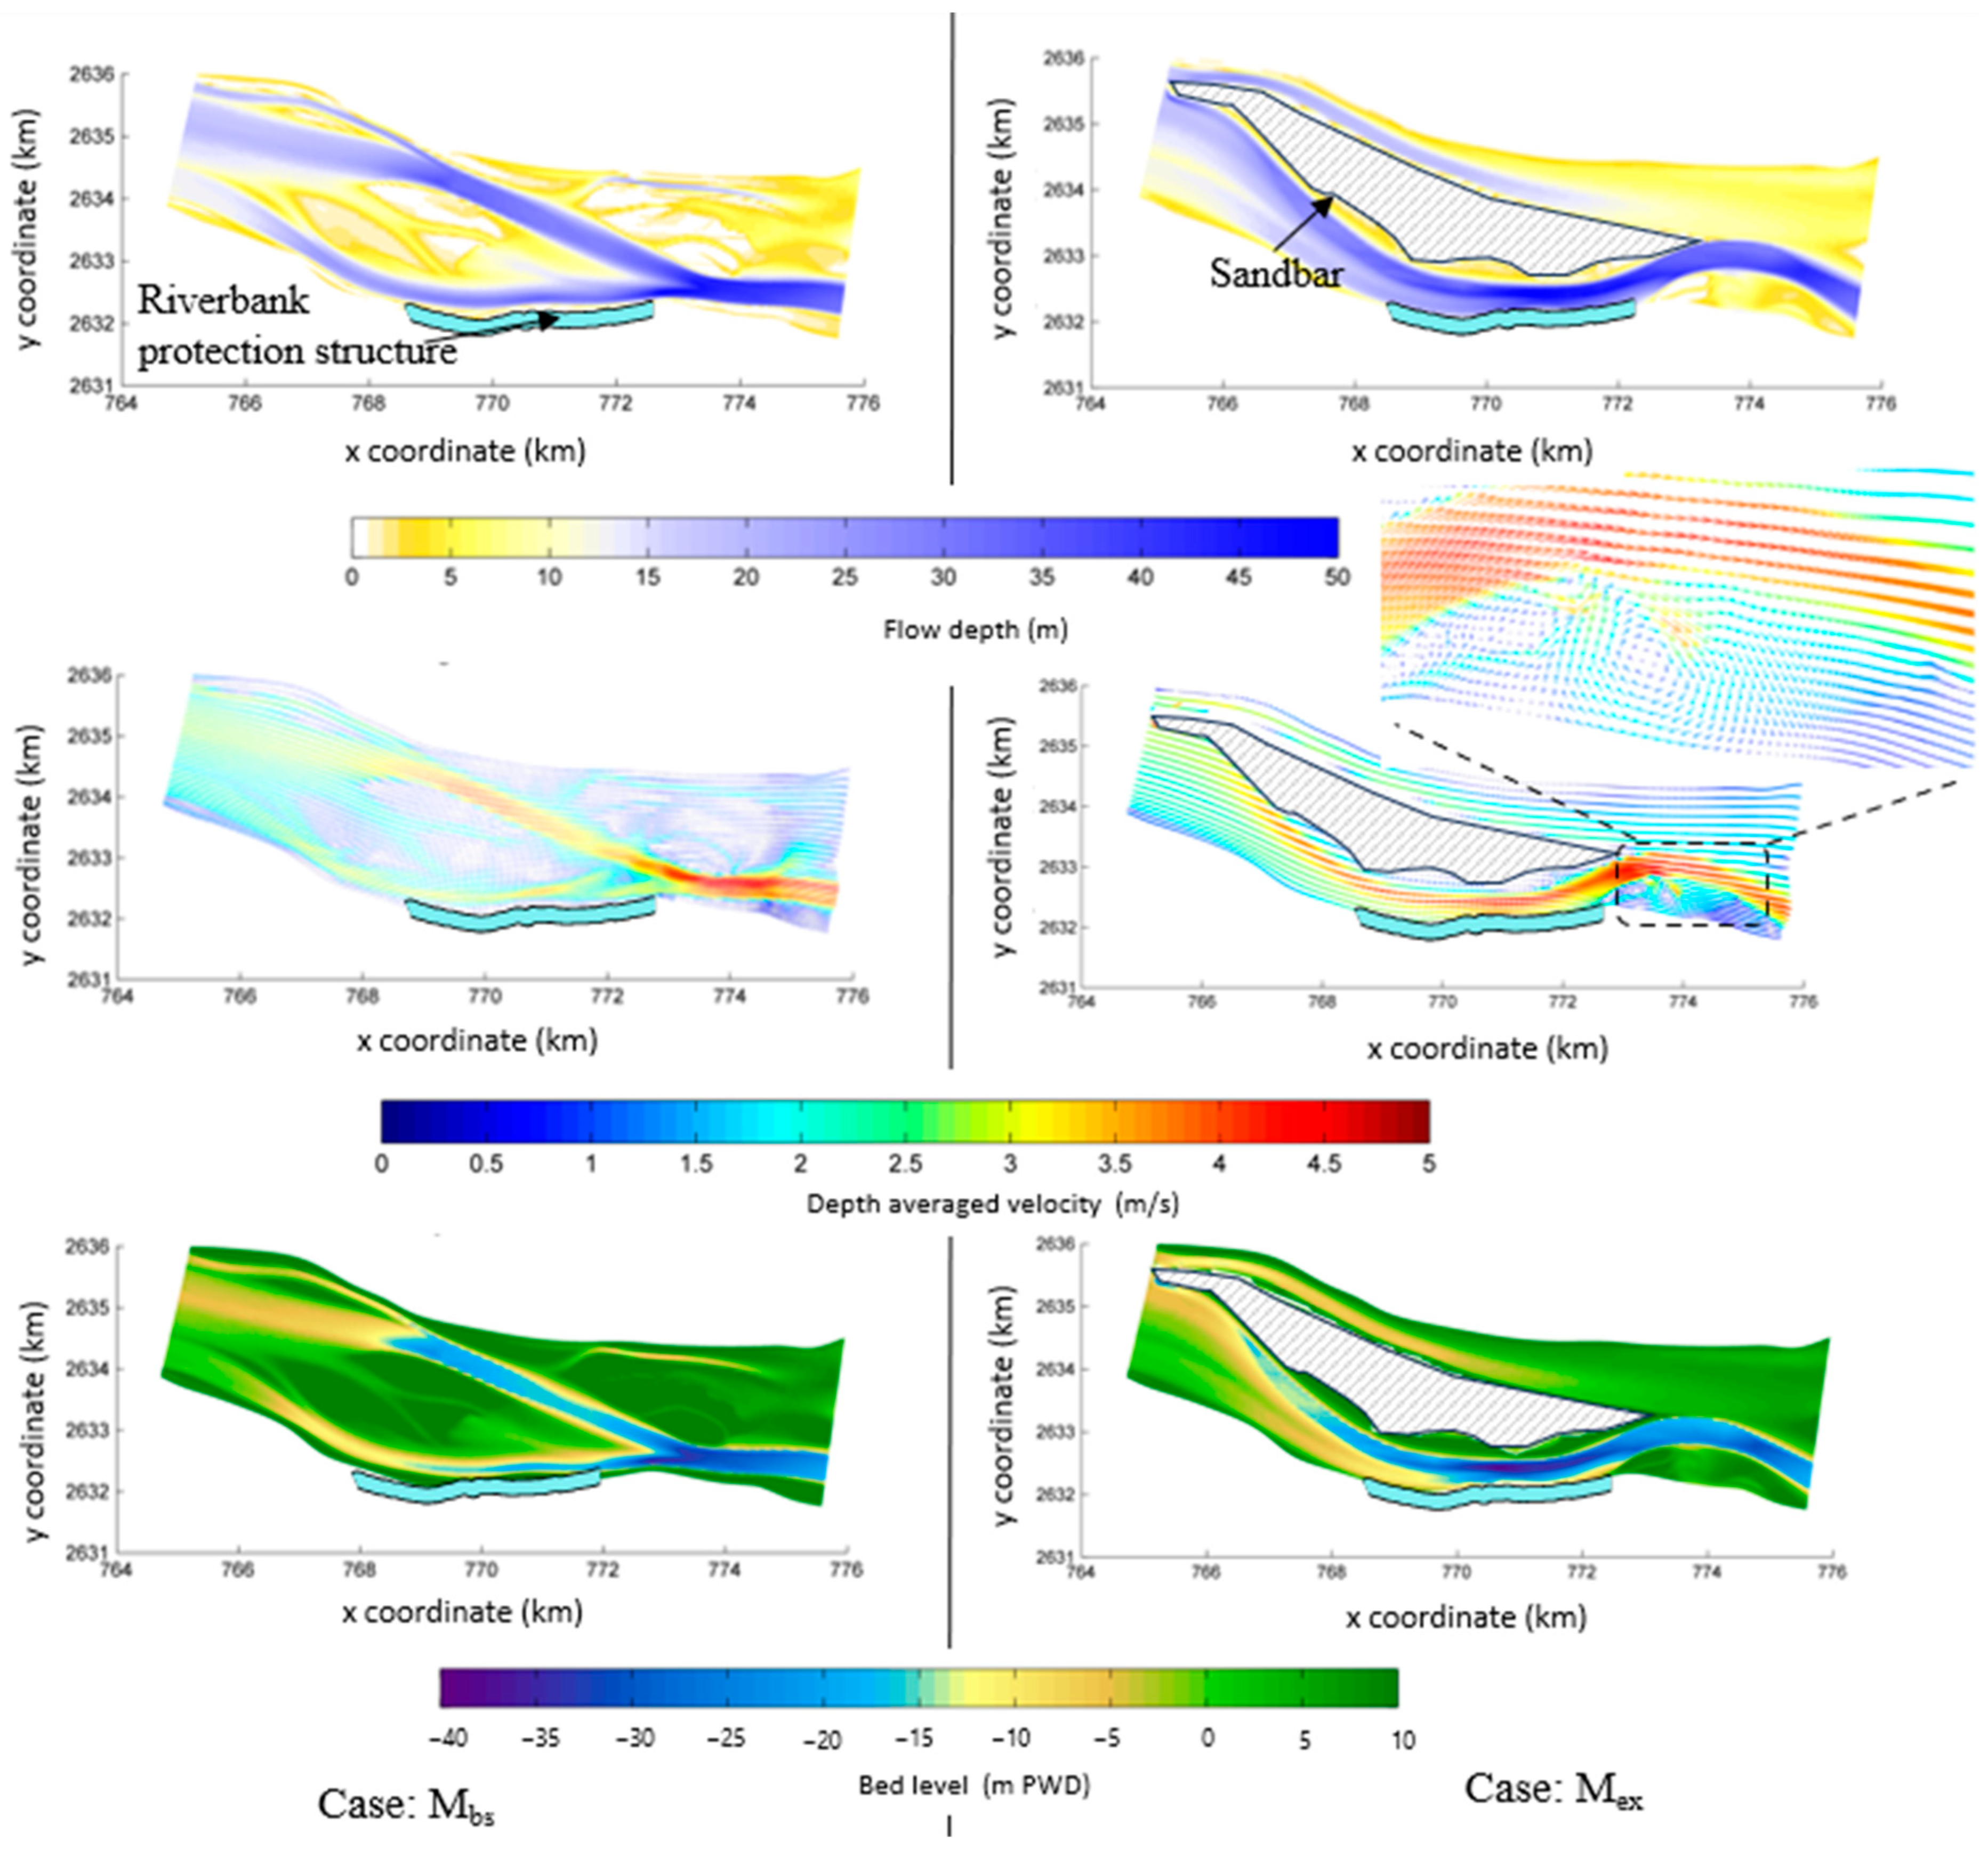
4.2.1. Hydraulic Impact of Sandbar in Ganges Reach
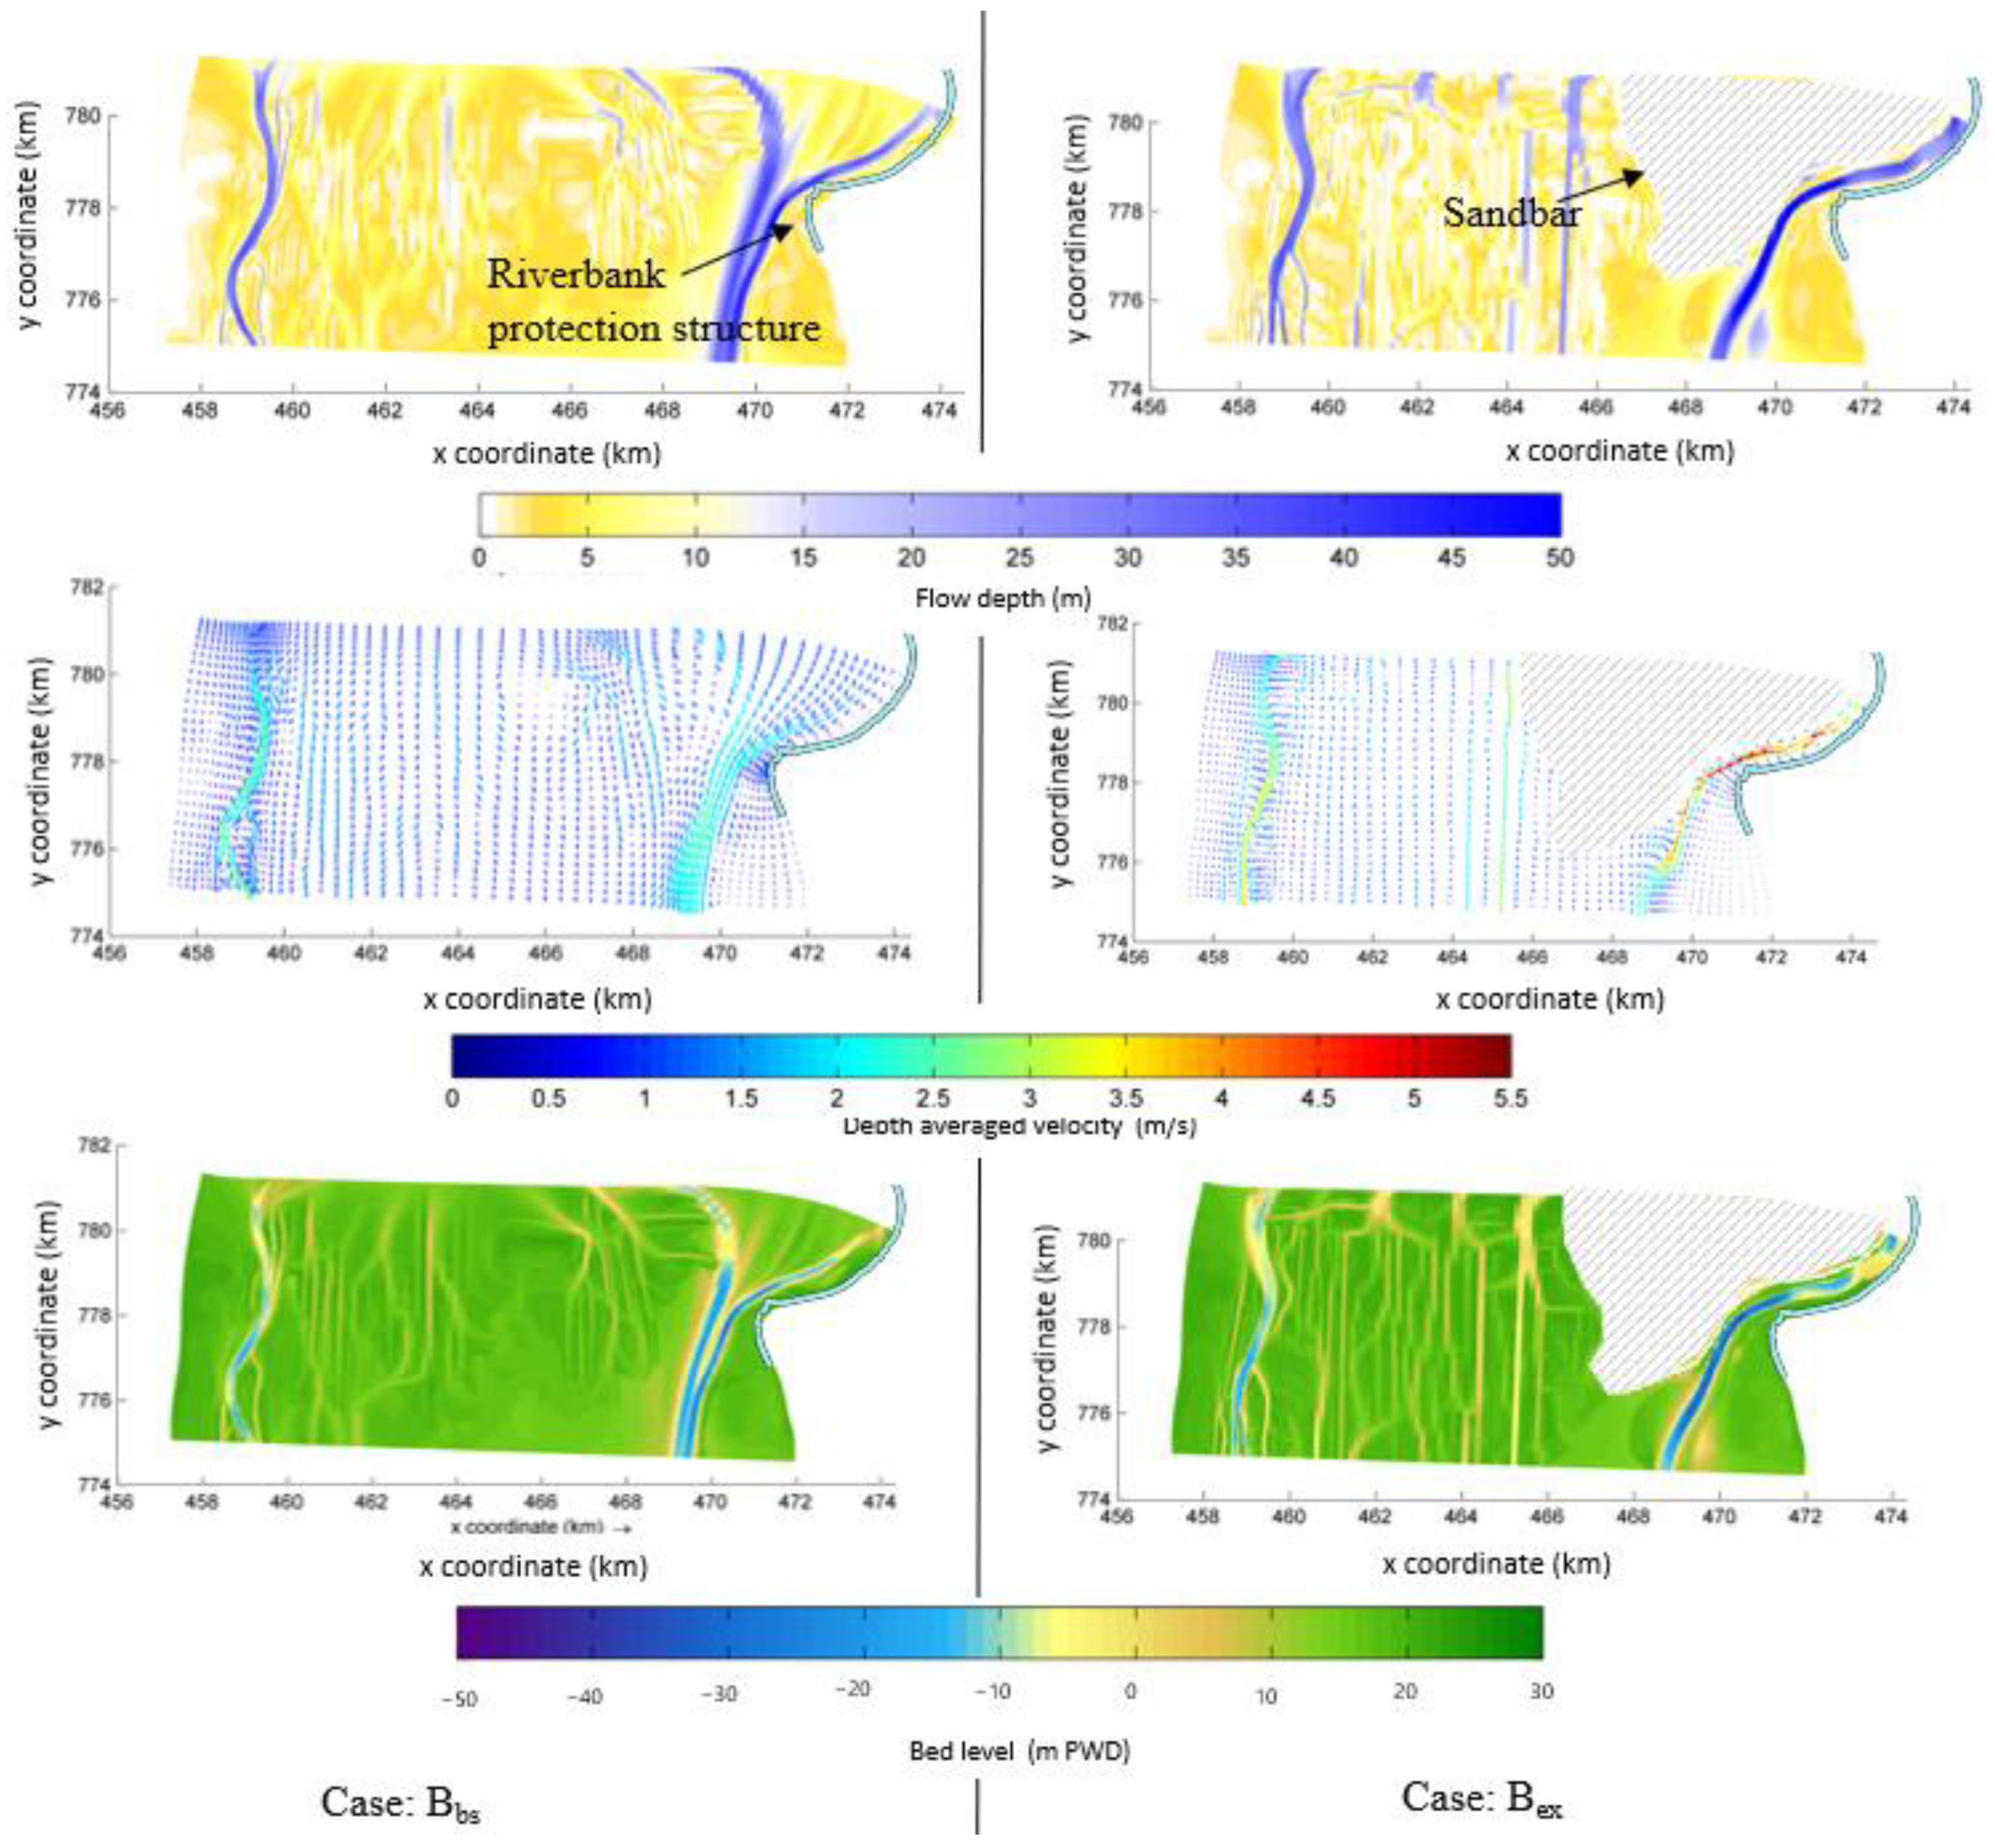
4.2.2. Hydraulic Impact of Sandbar in Brahmaputra-Jamuna Reach
5. Discussion
6. Conclusions
Supplementary Materials
Author Contributions
Funding
Data Availability Statement
Acknowledgments
Conflicts of Interest
References
- Thorne, C.R.; Tovey, N.K. Stability of composite river banks. Earth Surf. Process. Landf. 1981, 6, 469–484. [Google Scholar] [CrossRef]
- Yu, M.-H.; Wei, H.-Y.; Wu, S.-B. Experimental study on the bank erosion and interaction with near-bank bed evolution due to fluvial hydraulic force. Int. J. Sediment Res. 2015, 30, 81–89. [Google Scholar] [CrossRef]
- Redolfi, M. Free Alternate Bars in Rivers: Key Physical Mechanisms and Simple Formation Criterion. Water Resour. Res. 2021, 57, e2021WR030617. [Google Scholar] [CrossRef]
- Claude, N.; Rodrigues, S.; Bustillo, V.; Bréhéret, J.G.; Tassi, P.; Jugé, P. Interactions between flow structure and morphodynamic of bars in a channel expansion/contraction, Loire River, France. Water Resour. Res. 2014, 50, 2850–2873. [Google Scholar] [CrossRef]
- Crosato, A.; Mosselman, E. An Integrated Review of River Bars for Engineering, Management and Transdisciplinary Research. Water 2020, 12, 596. [Google Scholar] [CrossRef]
- Fredsøe, J. Meandering and braiding of rivers. J. Fluid Mech. 1978, 84, 609–624. [Google Scholar] [CrossRef]
- Tubino, M.; Seminara, G. Free–forced interactions in developing meanders and suppression of free bars. J. Fluid Mech. 1990, 214, 131–159. [Google Scholar] [CrossRef]
- Zhang, K.; Wu, S.; Feng, W.; Zhang, J.; Wen, S. Bar dynamics in a sandy braided river: Insights from sediment numerical simulations. Sediment. Geol. 2020, 396, 105557. [Google Scholar] [CrossRef]
- BWDB. An Investigation on the Causes of Embankment Failure and Recommendations for Sustainable Solutions; Final Report, Bangladesh Water Development Board (BWDB); Government of the People’s Republic of Bangladesh: Dhaka, Bangladesh, 2023.
- WBIWD. Guidelines for Riverbank Protections & Anti-Sea Erosion Work in West Bengal. lst Amendment; Government of West Bengal Irrigation & Waterways Department (WBIWD), 2019. Available online: https://wbxpress.com/files/2022/05/501-IFC.pdf (accessed on 7 June 2024).
- Parker, G. On the cause and characteristic scales of meandering and braiding in rivers. J. Fluid Mech. 1976, 76, 457–480. [Google Scholar] [CrossRef]
- Ashworth, P.J. Mid-channel bar growth and its relationship to local flow strength and direction. Earth Surf. Process. Landf. 1996, 21, 103–123. [Google Scholar] [CrossRef]
- Best, J.L.; Ashworth, P.J.; Bristow, C.S.; Roden, J. Three-Dimensional Sedimentary Architecture of a Large, Mid-Channel Sand Braid Bar, Jamuna River, Bangladesh. J. Sediment. Res. 2003, 73, 516–530. [Google Scholar] [CrossRef]
- Ashmore, P.E. How do gravel-bed rivers braid? Can. J. Earth Sci. 1991, 28, 326–341. [Google Scholar] [CrossRef]
- Egozi, R.; Ashmore, P. Experimental analysis of braided channel pattern response to increased discharge. J. Geophys. Res. Earth Surf. 2009, 114, 1–15. [Google Scholar] [CrossRef]
- Ashmore, P. Morphology and Dynamics of Braided Rivers; Elsevier Ltd.: Amsterdam, The Netherlands, 2013; Volume 9. [Google Scholar] [CrossRef]
- Fujita, Y.; Muramoto, Y. Experimental Study on Stream Channel in Alluvial Rivers. Bull. Disaster Prev. Res. Inst. 1982, 32, 49–96. [Google Scholar]
- Ikeda, S.; Parker, G.; Sawai, K. Bend theory of river meanders. Part 1. Linear development. J. Fluid Mech. 1981, 112, 363–377. [Google Scholar] [CrossRef]
- Blondeaux, P.; Seminara, G. A unified bar-bend theory of river meanders. J. Fluid Mech. 2016, 157, 44–70. [Google Scholar] [CrossRef]
- Kleinhans, M.G.; van den Berg, J.H. River channel and bar patterns explained and predicted by an empirical and a physics-based method. Earth Surf. Process. Landf. 2011, 36, 721–738. [Google Scholar] [CrossRef]
- Qian, H.; Cao, Z.; Liu, H.; Pender, G. Numerical modelling of alternate bar formation, development and sediment sorting in straight channels. Earth Surf. Process. Landf. 2017, 42, 555–574. [Google Scholar] [CrossRef]
- Duró, G.; Crosato, A.; Tassi, P. Numerical study on river bar response to spatial variations of channel width. Adv. Water Resour. 2016, 93, 21–38. [Google Scholar] [CrossRef]
- Cordier, F.; Tassi, P.; Claude, N.; Crosato, A.; Rodrigues, S.; Van Bang, D.P. Numerical Study of Alternate Bars in Alluvial Channels With Nonuniform Sediment. Water Resour. Res. 2019, 55, 2976–3003. [Google Scholar] [CrossRef]
- Schuurman, F.; Kleinhans, M.G. Bar dynamics and bifurcation evolution in a modelled braided sand-bed river. Earth Surf. Process. Landf. 2015, 40, 1318–1333. [Google Scholar] [CrossRef]
- Rice, S.P.; Church, M.; Wooldridge, C.L.; Hickin, E.J. Morphology and evolution of bars in a wandering gravel-bed river; lower Fraser river, British Columbia, Canada. Sedimentology 2009, 56, 709–736. [Google Scholar] [CrossRef]
- Hooke, J.M.; Yorke, L. Channel bar dynamics on multi-decadal timescales in an active meandering river. Earth Surf. Process. Landf. 2011, 36, 1910–1928. [Google Scholar] [CrossRef]
- Fujita, Y. Bar and channel formation. In River Meandering; Ikeda, S., Parker, G., Eds.; American Geophysical Union: Washington, DC, USA, 1989; pp. 417–462. [Google Scholar]
- Colombini, M.; Seminara, G.; Tubino, M. Finite-amplitude alternate bars. J. Fluid Mech. 1987, 181, 213. [Google Scholar] [CrossRef]
- Luchi, R.; Zolezzi, G.; Tubino, M. Modelling mid-channel bars in meandering channels. Earth Surf. Process Landf. 2010, 35, 902–917. [Google Scholar] [CrossRef]
- Ikeda, S. Prediction of Alternate Bar Wavelength and Height. J. Hydraul. Eng. 1984, 110, 371–386. [Google Scholar] [CrossRef]
- Struiksma, N.; Olesen, K.W.; Flokstra, C.; De Vriend, H.J. Bed deformation in curved alluvial channels. J. Hydraul. Res. 1985, 23, 57–79. [Google Scholar] [CrossRef]
- Gonzalo, D.; Crosato, A.; Tassi, P. Numerical experiments to explore bar management by channel width variations. In Proceedings of the 36th IAHR World Congress, The Hague, The Netherlands, 28 June–3 July 2015; pp. 28–31. [Google Scholar]
- Rohde, S.; Schütz, M.; Kienast, F.; Englmaier, P. River widening: An approach to restoring riparian habitats and plant species. River Res. Appl. 2005, 21, 1075–1094. [Google Scholar] [CrossRef]
- Inoue, T.; Ushiyama, T.; Asahi, K.; Yonemoto, M. An Experimental Study on the Bedrock Re-Exposure by Sandbar Formation and Channel Curvature. In Proceedings of the 36th IAHR World Congress, The Hague, The Netherlands, 28 June 2015; pp. 1–8. [Google Scholar]
- Yamaguchi, S.; Kyuka, T. A Hydraulic Model Experiment on the Relationship between Sediment Low-Water Revetment or Spur Dikes. In Proceedings of the 38th IAHR World Congress, Panama City, Panama, 1–6 September 2019; pp. 315–320. [Google Scholar] [CrossRef]
- Nakagawa, H.; Zhang, H.; Baba, Y.; Kawaike, K.; Teraguchi, H. Hydraulic characteristics of typical bank-protection works along the Brahmaputra/Jamuna River, Bangladesh. J. Flood Risk Manag. 2013, 6, 345–359. [Google Scholar] [CrossRef]
- Bishwakarma, K.; Wang, G.-X.; Zhang, F.; Adhikari, S.; Karki, K.; Ghimire, A. Hydrochemical characterization and irrigation suitability of the Ganges Brahmaputra River System: Review and assessment. J. Mt. Sci. 2022, 19, 388–402. [Google Scholar] [CrossRef]
- Allison, M.A. Geologic framework and environmental status of the Ganges-Brahmaputra delta. J. Coast. Res. 1998, 14, 826–836. [Google Scholar]
- Gupta, A. Large Rivers: Geomorphology and Management; John Wiley & Sons: Hoboken, NJ, USA, 2007. [Google Scholar]
- Islam, M.M. Numerical Simulation of Bed Level Changes of the Ganges. Master’s Thesis, Department of Water Resources Engineering, Bangladesh University of Engineering & Technology, Dhaka, Bangladesh, 1993. [Google Scholar]
- BWDB. Hydroinformatics & Flood Forecasting Circle Bangladesh Water Development Board. Available online: http://www.hydrology.bwdb.gov.bd/index.php?pagetitle=home&id=75 (accessed on 12 July 2024).
- BWDB. Morphological Changes of River Ganges over the Last Seven Years (2013 to 2019); River Morphology Processing Branch, Bangladesh Water Development Board (BWDB): Dhaka, Bangladesh, 2020. Available online: http://www.hydrology.bwdb.gov.bd/img_upload/ongoing_project/782.pdf (accessed on 7 June 2024).
- FAP 24. Flood Action Plan (FAP); Special Report 9, River Survey Project; Flood Plan Coordination Organization, Government of Bangladesh: Dhaka, Bangladesh, 1996.
- Shampa; Roy, B.; Hussain, M.M.; Islam, A.S.; Rahman, M.A.; Mohammed, K. Assessment of Flood Hazard in Climatic Extreme Considering Fluvio-Morphic Responses of the Contributing River: Indications from the Brahmaputra-Jamuna’ s Braided-Plain. GeoHazards 2022, 3, 465–491. [Google Scholar] [CrossRef]
- Gao, B.-C. NDWI A Normalized Difference Water Index for Remote Sensing of Vegetation Liquid Water from Space. Remote Sens. Environ. 1996, 58, 257–266. [Google Scholar] [CrossRef]
- Jana, S. An automated approach in estimation and prediction of riverbank shifting for flood-prone middle-lower course of the Subarnarekha river, India. Int. J. River Basin Manag. 2021, 19, 359–377. [Google Scholar] [CrossRef]
- Yang, C.; Cai, X.; Wang, X.; Yan, R.; Zhang, T.; Zhang, Q.; Lu, X. Remotely sensed trajectory analysis of channel migration in Lower Jingjiang Reach during the period of 1983-2013. Remote Sens. 2015, 7, 16241–16256. [Google Scholar] [CrossRef]
- Hossain, A.; Gan, T.Y.; Baki, A.B.M. Assessing morphological changes of the Ganges River using satellite images. Quat. Int. 2013, 304, 142–155. [Google Scholar] [CrossRef]
- Lesser, G.; Roelvink, J.; van Kester, J.; Stelling, G. Development and validation of a three-dimensional morphological model. Coast. Eng. 2004, 51, 883–915. [Google Scholar] [CrossRef]
- Van Rijn, L.C. Principles of Sediment Transport in Rivers, Estuaries and Coastal Seas; Aqua Publications: Amsterdam, The Netherlands, 1993. [Google Scholar]
- Exner, F.M. On the interaction between water and sediment in rivers. Akad. Wiss. Wien. Math. Naturwiss. Klasse 1925, 134, 165–204. [Google Scholar]
- Roelvink, D.; Lesser, G.; van der Wegen, M. Evaluation of the Long Term Impacts of an Infiltration BMP Drexel E-Repository and Archive (iDEA). In Proceedings of the 7th International Conference on HydroScience and Engineering College of Engineering, Philadelphia, PA, USA, 10–13 September 2006; pp. 1–6. [Google Scholar]
- Moriasi, D.N.; Arnold, J.G.; van Liew, M.W.; Bingner, R.L.; Harmel, R.D.; Veith, T.L. Model Evaluation Guidelines for Systematic Quantification of Accuracy in Watershed Simulations. Trans. ASABE 2007, 50, 885–900. [Google Scholar] [CrossRef]
- Knoben, W.J.M.; Freer, J.E.; Woods, R.A. Technical note: Inherent benchmark or not? Comparing Nash-Sutcliffe and Kling-Gupta efficiency scores. Hydrol. Earth Syst. Sci. 2019, 23, 4323–4331. [Google Scholar] [CrossRef]
- Vijai, H.; Sorooshian, S.; Yapo, P.O. Status of a Utomatic Calibration For Hydrologic Models: Comparison With Multilevel Expert Calibration. J. Hydrol. Eng. 1999, 4, 135–143. [Google Scholar]
- Oberhagemann, K.; Haque, A.M.A.; Thompson, A. A century of riverbank protection and river training in bangladesh. Water 2020, 12, 3018. [Google Scholar] [CrossRef]
- Taniguchi, J.; Watanabe, K.; Saito, N. Study on the Behavior of Sandbar in a River Channel at the Babamegawa River. Int. J. Geomate 2021, 20, 115–120. [Google Scholar] [CrossRef]
- Nagata, T.; Watanabe, Y.; Yasuda, H.; Ito, A. Development of a meandering channel caused by the planform shape of the river bank. Earth Surf. Dyn. 2014, 2, 255–270. [Google Scholar] [CrossRef]
- Almeida, R.P.; Galeazzi, C.P.; Best, J.; Ianniruberto, M.; Prado, A.H.D.; Janikian, L.; Mazoca, C.E.M.; Tamura, L.N.; Nicholas, A. Morphodynamics and depositional architecture of mid-channel bars in large Amazonian rivers. Sedimentology 2024, 71, 1591–1614. [Google Scholar] [CrossRef]
- Trigg, M.A.; Carr, A.B.; Smith, M.W.; Tshimanga, R.M. Measuring Geomorphological Change on the Congo River Using Century-Old Navigation Charts. In Congo Basin Hydrology, Climate, and Biogeochemistry: A Foundation for the Future; American Geophysical Union: Washington, DC, USA, 2022; pp. 413–426. [Google Scholar] [CrossRef]
- ASCE. River Width Adjustment I: Processes and Mechanisms. J. Hydraul. Eng. 1998, 124, 881–902. [Google Scholar] [CrossRef]
- ASCE. River Width Adjustment II: By the ASCE Task Committee on Hydraulics, Bank Mechanics. J. Hydraul. Eng. 1998, 124, 903–917. [Google Scholar]
- Li, J.; Xia, J.; Kong, L.; Ji, Q.; Li, L.; Chen, F. Geomorphic adjustments of channel bars in the braided reach of the lower Yellow river from 1986 to 2018. Catena 2024, 236, 107735. [Google Scholar] [CrossRef]
- Sarker, M.H.; Thorne, C.R.; Aktar, M.N.; Ferdous, R. Morpho-dynamics of the Brahmaputra-Jamuna River, Bangladesh. Geomorphology 2014, 215, 45–59. [Google Scholar] [CrossRef]
- Zhou, Y.; Xia, J.; Deng, S.; Han, Z. Bank erosion under the impacts of hydraulic erosion, river stage change and revetment protection in the Middle Yangtze River. Geomorphology 2024, 448, 109043. [Google Scholar] [CrossRef]
- Tockner, K.; Paetzold, A.; Karaus, U.; Claret, C.; Zettel, J. Ecology of Braided Rivers; Special Publication-International Association of Sedimentologists 36; 2006; pp. 339–359. Available online: https://onlinelibrary.wiley.com/doi/10.1002/9781444304374.ch17 (accessed on 7 June 2024). [CrossRef]
- Rahman, R.; Rahman, M.M.; Islam, T.G.M.; Sarker, M.H.; Choudhury, S.M.; Ahmed, M. Hydraulic Profiling of Important Fish. Habitats of the Jamuna River; Final Report; Bangladesh University of Engineering and Technology (BUET): Dhaka, Bangladesh, 2011. [Google Scholar]
- Ock, G.; Gaeuman, D.; McSloy, J.; Kondolf, G.M. Ecological functions of restored gravel bars, the Trinity River, California. Ecol. Eng. 2015, 83, 49–60. [Google Scholar] [CrossRef]
- BWDB. Standard Design Manual; Bangladesh Water Development Board (BWDB): Dhaka, Bangladesh, 1993; Volume 1.
- BWDB. Design Guidelines for River Bank Protection Work; Bangladesh Water Development Board (BWDB): Dhaka, Bangladesh, 2021.
- Pilarczyk, K.W. Coastal Protection: Design of Seawalls and Dikes incl. Overview of Revetments; Rijkswaterstaat, Road and Hydraulic Engineering Division Van der Burghweg 1: Delft, The Netherlands, 1991; Volume 1. [Google Scholar]


| River Type | Condition | Case | Representation of the Bathymetric Condition and Bar Alignment (of the Year) | |
|---|---|---|---|---|
| Bathymetry | Bar Alignment | |||
| Meandering River (Ganges) | Base | Mbs | 2022 | 2022 |
| Extreme bar condition | Mex | 2022 | 2020 | |
| Braided River (Brahmaputra-Jamuna) | Base | Bbs | 2022 | 2022 |
| Extreme bar condition | Bex | 2022 | 2020 | |
| Parameter(s) | Unit | Ganges | Brahmaputra-Jamuna |
|---|---|---|---|
| Mean grain size | µm | 150 | 250 |
| Density of sediment | kg/m3 | 2650 | 2650 |
| Density of water | kg/m3 | 1000 | 1000 |
| Van Rijn’s reference height factor | - | 2 | 2 |
| Horizontal eddy viscosity | MEX/s | 1 | 1 |
| Hydrodynamic time step | s | 12 | 48 |
| Roughness (Manning’s) | sm−1/3 | 0.025 | 0.027 |
| Morphological acceleration factor, m | - | 2 | 3 |
| Threshold sediment thickness | m | 0.05 | 0.005 |
| River Type | Parameter | NSE | RSR | R2 | Performance Ratings | |||
|---|---|---|---|---|---|---|---|---|
| NSE | RSR | R2 | ||||||
| Meandering River (Ganges) | Water Level | 0.774 | 0.475 | 0.853 | Very good | 0.75< NSE ≤ 1.00 | 0.00 ≤ RSR ≤ 0.50 | The value ranges from 0 to 1, where a value of 1 represents perfect predicted accuracy. |
| Good | 0.65 < NSE ≤ 0.75 | 0.50 < RSR ≤ 0.60 | ||||||
| Braided River (Brahmaputra-Jamuna) | Water Level | 0.994 | 0.073 | 0.999 | Satisfactory | 0.50 < NSE ≤ 0.65 | 0.60 < RSR ≤ 0.70 | |
| Discharge | 0.999 | 0.009 | 0.999 | Unsatisfactory | NSE ≤ 0.50 | RSR > 0.70 | ||
| River Type | Cases | Depth (m) | Velocity (m/s) | Force (N/m2) |
|---|---|---|---|---|
| Meandering River | Mbs | 29.7 | 2.8 | 5.62 |
| Mex | 35.3 | 3.6 | 8.92 |
| River Type | Cases | Depth (m) | Velocity (m/s) | Force (N/m2) |
|---|---|---|---|---|
| Braided River | Bbs | 32.2 | 1.8 | 13.1 |
| Bex | 38.2 | 2.5 | 69.0 |
Disclaimer/Publisher’s Note: The statements, opinions and data contained in all publications are solely those of the individual author(s) and contributor(s) and not of MDPI and/or the editor(s). MDPI and/or the editor(s) disclaim responsibility for any injury to people or property resulting from any ideas, methods, instructions or products referred to in the content. |
© 2024 by the authors. Licensee MDPI, Basel, Switzerland. This article is an open access article distributed under the terms and conditions of the Creative Commons Attribution (CC BY) license (https://creativecommons.org/licenses/by/4.0/).
Share and Cite
Shampa; Muktadir, H.M.; Nejhum, I.J.; Islam, A.K.M.S.; Rahman, M.M.; Islam, G.M.T. The Impact of Sandbars on Bank Protection Structures in Low-Land Reaches: Case of Ganges and Brahmaputra-Jamuna. Water 2024, 16, 2523. https://doi.org/10.3390/w16172523
Shampa, Muktadir HM, Nejhum IJ, Islam AKMS, Rahman MM, Islam GMT. The Impact of Sandbars on Bank Protection Structures in Low-Land Reaches: Case of Ganges and Brahmaputra-Jamuna. Water. 2024; 16(17):2523. https://doi.org/10.3390/w16172523
Chicago/Turabian StyleShampa, Hussain Muhammad Muktadir, Israt Jahan Nejhum, A. K. M. Saiful Islam, Md. Munsur Rahman, and G. M. Tarekul Islam. 2024. "The Impact of Sandbars on Bank Protection Structures in Low-Land Reaches: Case of Ganges and Brahmaputra-Jamuna" Water 16, no. 17: 2523. https://doi.org/10.3390/w16172523
APA StyleShampa, Muktadir, H. M., Nejhum, I. J., Islam, A. K. M. S., Rahman, M. M., & Islam, G. M. T. (2024). The Impact of Sandbars on Bank Protection Structures in Low-Land Reaches: Case of Ganges and Brahmaputra-Jamuna. Water, 16(17), 2523. https://doi.org/10.3390/w16172523