Article

Migration of Water and Sand Inrush through the Mining-Induced Caving Zone: Insights from Model Test and Numerical Analysis

1
College of Geosciences and Engineering, North China University of Water Resources and Electric Power, Zhengzhou 450046, China
2
School of Urban Geology and Engineering, Hebei GEO University, Shijiazhuang 050031, China
3
Key Laboratory of Intelligent Detection and Equipment for Underground Space of Beijing-Tianjin-Hebei Urban Agglomeration, Shijiazhuang 050031, China
4
Hebei Technology Innovation Center for Intelligent Development and Control of Underground Built Environment, Shijiazhuang 050031, China
5
North China Engineering Investigation Institute Co., Ltd., Shijiazhuang 050021, China
6
Technology Innovation Center for Groundwater Disaster Prevention and Control Engineering for Metal Mines Ministry of Natural Resources, Shijiazhuang 050021, China
7
Technological Innovation Center for Mine Groundwater Safety of Hebei Province, Shijiazhuang 050021, China
*
Author to whom correspondence should be addressed.
Water 2024, 16(17), 2527; https://doi.org/10.3390/w16172527
Submission received: 29 July 2024 / Revised: 24 August 2024 / Accepted: 4 September 2024 / Published: 6 September 2024
(This article belongs to the Section Water-Energy Nexus)

Abstract

:
Due to the thin bedrock, typical geological characteristics, and the high-intensity underground mining in western China, the water and sand inrush pour into the panels through the broken rock fragmentations in the caving zone, which could result in serious financial losses or even casualties. This paper investigated the influence of the height of the caving zone and the size of sand particles on the speed of water and sand inrush by the methods of laboratory tests and numerical simulation. The test results reveal that the speed of sand flow decreases with an increase in the height of the caving zone until the height of the caving zone approaches a certain value, and the speed of sand flow decreases with the increase in sand particles. The particle flow (PFC3D) method was used to simulate the experiment to study the dynamic changes in the force chain during the process of water and sand inrush. The simulation results show that the process of water and sand inrush is a continuous and variable process of force chain formation and break. Sand particles only flow through the gap between the caving zones, and during this process, some sand particles remain, which makes the force chain gradually become stable and the speed of water and sand inrush slow.

1. Introduction

Water and sand mixture inrush is one of the major geohazards encountered during tunneling and mining activities, which refers to water inrush accompanied by a large volume of mud, sand, or rock fragments bursting into underground workspaces [1,2,3]. Water and sand inrush pose a significant threat to coal mine safety [4,5]. Since the 1950s, more than 200 cases of water and sand inrush have been reported throughout the world, causing substantial financial losses or even casualties [6,7,8,9]. For example, the Halagou coal mine encountered an exceptionally large influx of water and sand inrush on 28 July 2009. Two years later, in 2011, the Buertai coal mine located in the Inner Mongolia Autonomous Region experienced a devastating water and sand inrush disaster. Subsequently, on 17 November 2012, during the drilling of a borehole towards the mine, the Longde coal mine encountered a calamitous event involving the sudden influx of water and sand. The Liliangdian coal mine suffered a water and sand inrush disaster during the grouting process of the back wall at a depth of 272 m in November 2013; a water and sand inrush disaster occurred during the grouting of the back wall at a depth of 272 m in the Liliangdian coal mine. On 7 April 2016, the Zhaojin coal mine was struck by a massive water and sand inrush, resulting in the loss of 11 miners’ lives and incurring significant financial damages. In August 2016, a subsidiary shaft of the Jinjitan coal mine in Shaanxi Province endured a severe water and sand inrush disaster [7,10]. On 15 July 2021, the Haojialiang coal mine reported a major water and sand inrush accident, leading to five fatalities and substantial financial losses. On 14 August 2021, the Chaidaer coal mine located in Qinghai province experienced a large water and sand inrush accident, this accident caused 20 casualties [11].
All of the above influx of water and sand inrush cases were caused by overburden rock failure due to mining directly or indirectly exposing loose aquifers, as shown in Figure 1. Figure 1b shows that the fractured zone and caving zone induced by mining activity provide channels for water and sand mixture. Dong et al. [12] pointed out that the fractured zone facilitating the flow of water and sand serves as the primary contributor to water and sand inrush hazards, particularly in thin bedrock. The study results of Xu et al. [13] revealed that the permeability changes in mining-induced fractures in weathered bedrock beneath shallow coal seams undergo alterations under the influence of high-pressure water flow, providing conditions for disaster occurrence. To further investigate the conditions and mechanisms of the influx of water and sand inrush through fracture, well-controlled laboratory testing and simulations have been employed by many researchers [14,15]. Sui et al. [16] innovatively employed concrete blocks with various crack sizes to simulate mining-induced fractured rock masses, highlighting that the degree of openness at the sand burst outlet is pivotal in regulating the volume of sand burst within the mining face. Yang et al. [17] executed large-scale model experiments to study the transport dynamics of water–sand mixed flows in various mining-induced fracture channels through pre-designed fractures. Zhang et al. [18] characterized the water and sand migration in circular pore fractures and quantitatively analyzed the correlation changes in physical parameters, such as flow rate and pore water pressure in different stages of water and sand inrush. Yuan et al. [19] investigated the dynamic response of water and sand inrush events under various combinations of factors by using a custom-designed hydraulically coupled water–sand inrush test apparatus. With the development of digital photography and image processing technologies, visual experiments are now extensively used to obtain further insights into the inrush process in fractures. Zheng et al. [20] studied the water and sand leakage through cracks with different apertures using a transparent model box and observed that an increase in crack width led to a gradual augmentation in the sand content of the water–sand mixture. Xu et al. [21] used 3D printing technology to assess the influence of fracture aperture and angle on the seepage behavior of water–sand mixtures and found that the fracture aperture and angle have a great effect on the water and sand inrush disasters. Additionally, various discrete element methods have been utilized to explore the characteristics of water and sand migration or surge in fracture channels [22,23,24,25].
Obviously, the aforementioned studies primarily reveal the mechanism of water and sand inrush through artificially induced fractures, focusing on the perspectives of inrush channels and the aquifers’ heights. However, with the frequent reports of water and sand inrush involving rock fragmentations within the caving zone, increased attention has been directed towards the mining-induced caving zone [26]. Figure 1c illustrates the schematic diagram of the engineering geological model of water and sand inrush hazards. The modified MTS816 was used by Chen et al. [27] to study the water sand seepage characteristics through broken rock, and the result shows that the outflow sand increases with an increase in the hydraulic gradient and the initial porosity. Similarly, Du et al. [28] confirmed that sand loss amount has a close relation to the porosity and particle sizes of broken rock mass. Furthermore, Zhang et al. [29] conducted experiments under a modified self-developed flow testing system to study the flow behavior of water sand mixtures in broken rock mass and also found that the discharge of Aeolian sand is influenced by the particle size distribution, void ratio, and the initial mass of Aeolian sand. Due to differences in channel and hydrodynamic conditions, after the water and sand flow into the broken rock mass in the caving zone, the flow may be blocked by the broken rock or may continue to move. Also, the blockage and movement are interchangeable under certain conditions [3,30]. Nonetheless, these previous studies conducted within the modified seepage test system have limitations in directly observing the initiation and movement patterns of water and sand mixture through the caving zone. Further research is needed to obtain further insights into the inrush process through visual, physical experiments and numerical simulations.
In this paper, the self-designed transport device was performed in laboratory-scale porous media columns packed with glass beads based on the extent of previous research. The influence of different sand particle sizes and the height of the caving zone on the sand-breaking speed is analyzed. Then, the particle flow (PFC3D) method is applied to numerically simulate and analyze the test results from a microscopic perspective. The research findings offer valuable insights into the mechanism of water and sand inrush and contribute potential design concepts for its control and mitigation strategies.

2. Materials and Methods

2.1. Experimental Setup

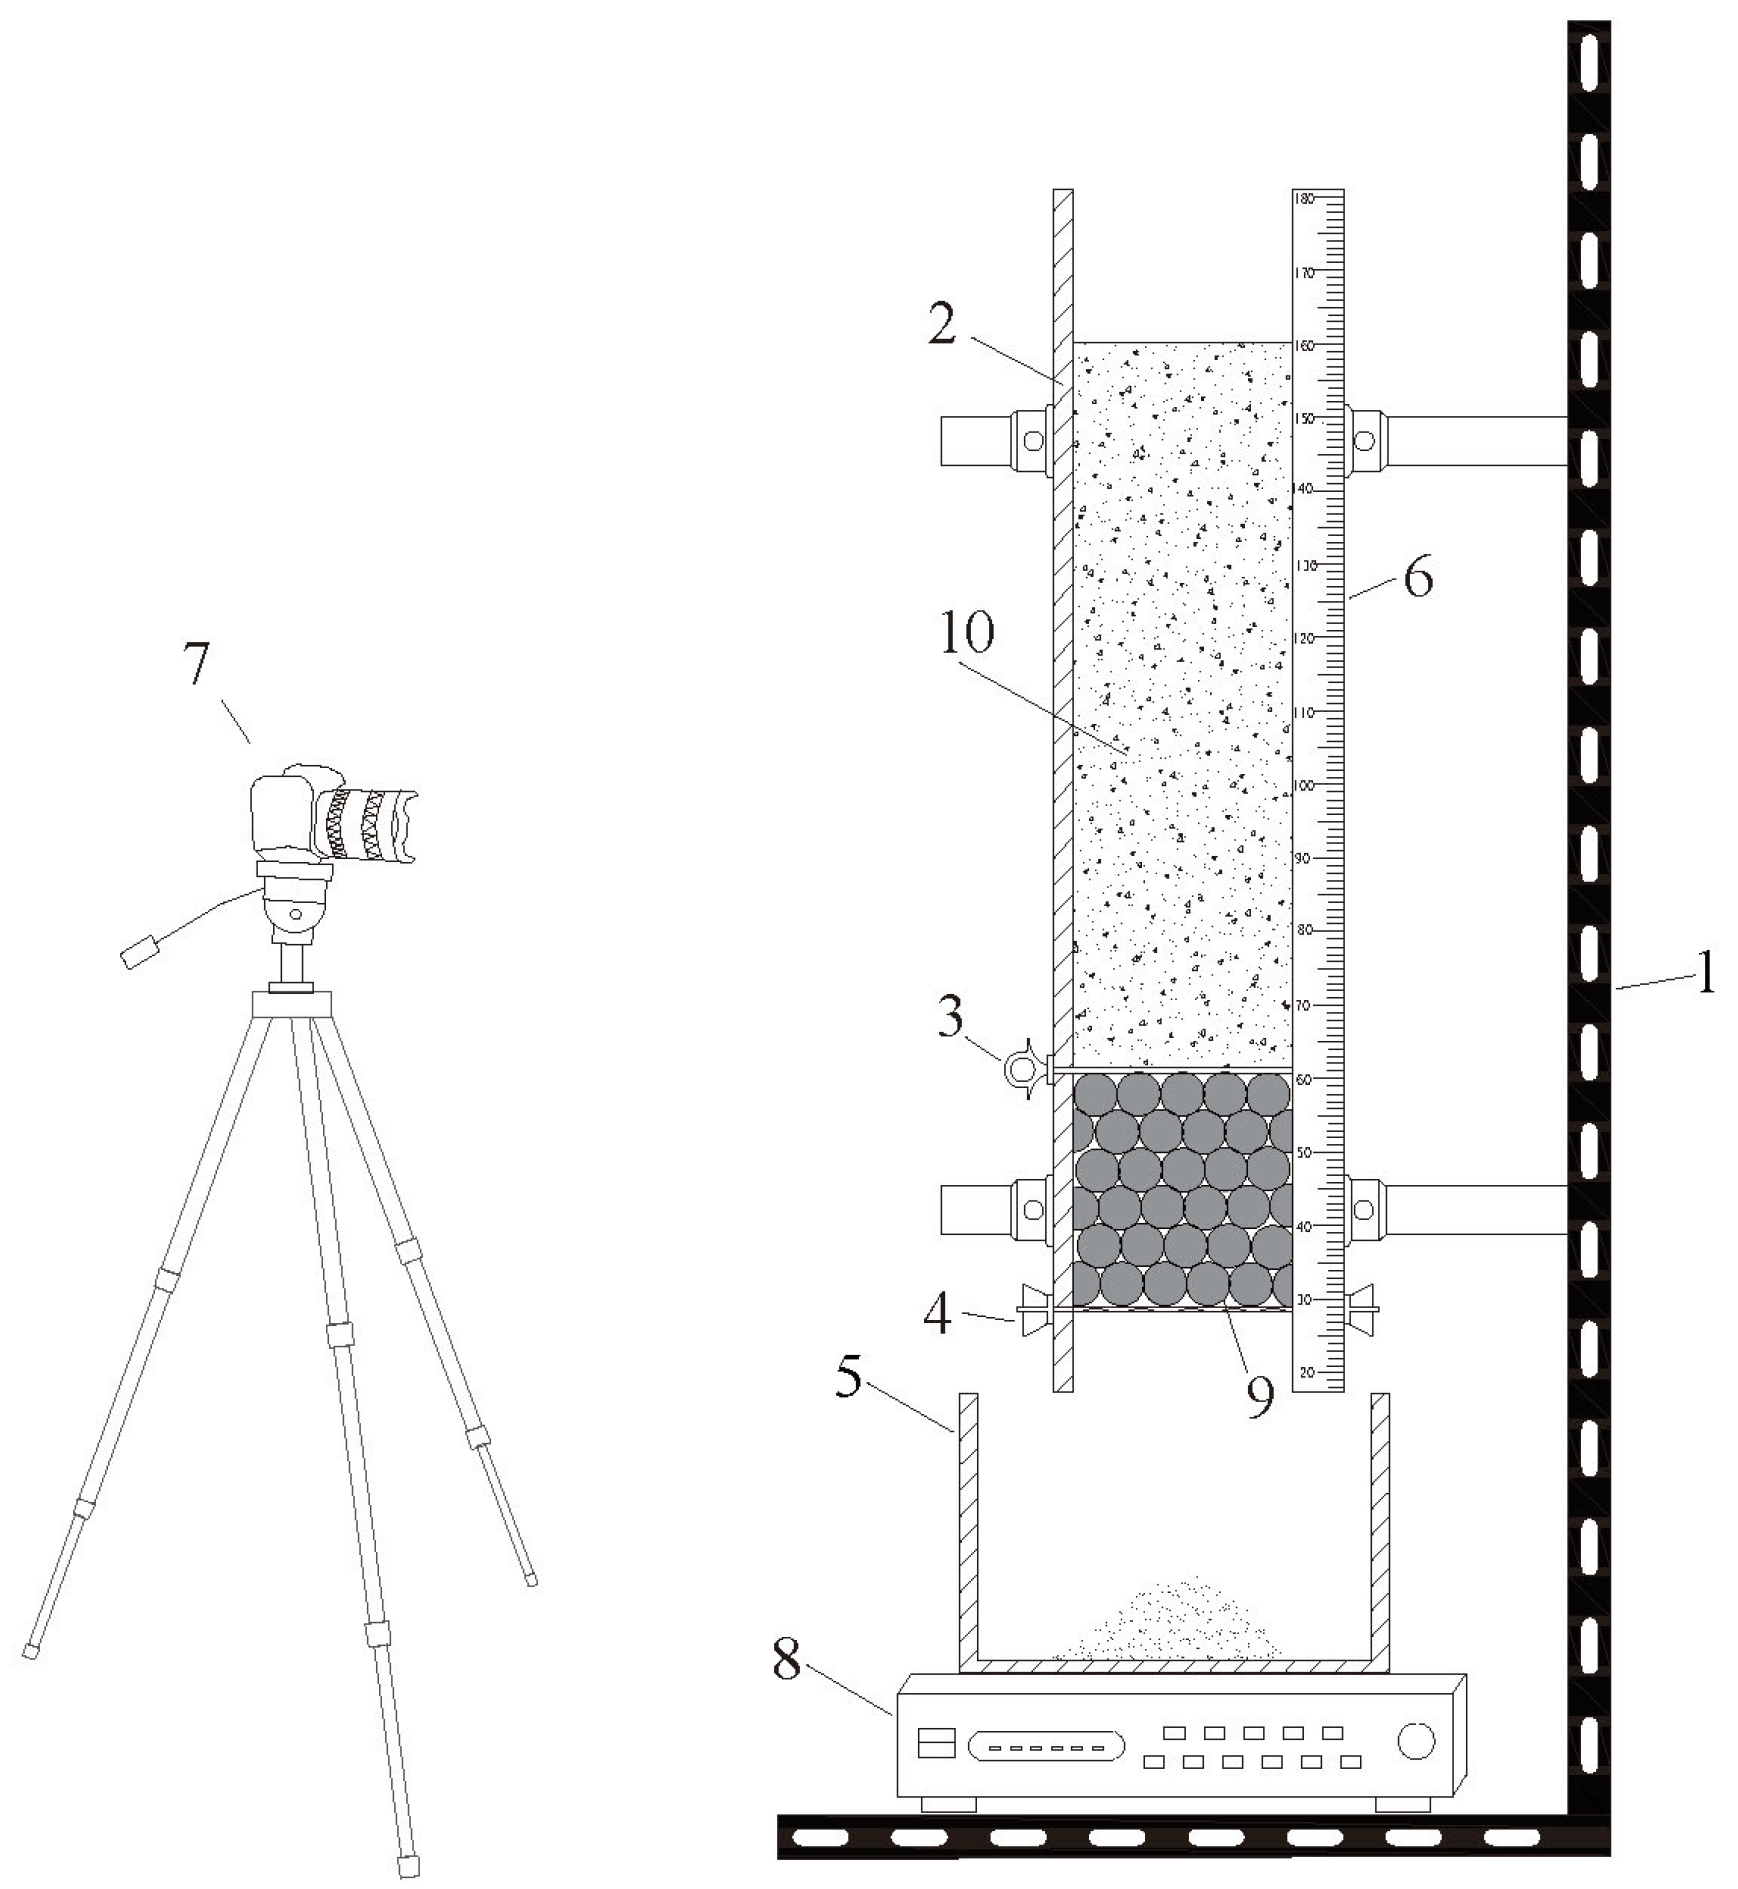
The self-designed testing device is shown in Figure 2. The device consists of four parts: the material source box, the idealized caving zone model, the outflow measurement device, and a digital camera. In order to observe the spreading of sand through the caving zone in real time, the model box adopts a transparent organic glass tube with an inner diameter of 120 mm and a thickness of 5 mm. The caving zone test chamber is mainly used for filling broken rock masses, and the test chamber uses organic glass tubes of the same size as the source box. The outflow measurement device is used for real-time monitoring and collection of the quality of the discharge, mainly including collection containers and electronic scales. Digital cameras are mainly used to observe the entire process of the water and sand flowing through the porous medium tests. This paper focuses on the development mechanism of the flow process of loose sand aquifer pour into the broken rock masses without considering the influence of similarity ratio.

2.2. Materials

Studies show that the possibility of water and sand mixture inrush weakening as the clay content in unconsolidated layers increases [31]. The particle size of aeolian sand in the western China coal mines usually ranges from 0.075 to 2 mm, which is considered fine- to medium-grained sand with minor clay content. Moreover, the clay content in the sand grains of unconsolidated layers from coal mines in eastern China, where sand and water inrush are common geohazards, does not exceed 10% by weight of the total sand grains [8]. Thus, three different ranges of sands without clay were used in this study, with particle sizes (d) of 1–2 mm, 0.5–1 mm, and 0.1–0.5 mm, respectively. In order to eliminate any potential influence from clay particles, the sand (Xuzhou, Jiangsu, China) was repeatedly washed, dried, and screened before the experiment. The specific parameters of the experimental sand are detailed in Table 1. The dry density measured in the laboratory is 1.57 g/cm3.
The actual fragmented rock mass within the caving zone comprises loose stones of various sizes and shapes. The caving zone in the coal mine is a kind of porous medium, which is often generalized as a uniform porous medium in order to mitigate potential difficulties associated with real fragmented rock mass in the caving zone. Due to the similarity in the elastic modulus and Poisson’s ratio between glass balls and loose sandstone, transparent glass beads were utilized as the packing material in the experiment, substituting for the actual fragmented, broken rock mass. This substitution effectively eliminates numerous uncertainties that could significantly complicate the analysis of experimental data. The diameter of glass beads (D) employed are 25 mm and 21 mm, respectively. Statistics show that the porosity of the caving zone induced by mining activities is generally between 0.2 and 0.45 [32]. In order to reduce the difference in porosity between the ideal fractured rock mass and the real fractured rock mass, the glass beads are closely arranged to form a porous medium with a porosity of approximately 0.4 to 0.46.

2.3. Experimental Procedure

Previous experiments have confirmed that the thickness of the loose sand layer exerts minimal influence on the speed of the sand flow (mass flow rate) [33]. Therefore, the effect of the loose sand layer’s height is not considered in this experiment, and the height of the sand layer is uniformly maintained at 800 mm. The detailed experimental procedures are outlined below.
(1)
Installation of the experimental setup. Firstly, fix the model box onto the bracket to guarantee that the device remains stable and vertically aligned. Next, sequentially fix the wire mesh according to the test requirements, adjust the switch, and place a measuring stick on the model box. Then, ensure the sealing of all parts of the experimental setup and adjust the camera to guarantee that it effectively captures the propagation of sand throughout the entire experimental process.
(2)
To ensure the stability of the test results, it is necessary to ensure that the dry density of each group of test sand is consistent, all of which are 1.57 g/cm3. Then, the sand column was constructed by manually compacting 10 layers of sand particles. After filling one layer, gently compact it with a compactor and then fill the next layer until the height reaches 800 mm. The arrangement of the glass beds is carried out in the closest possible way to ensure that the number of spheres placed in each layer is consistent, the porosity of the porous media in this study ranged approximately between 40% and 46%.
(3)
After the preparation steps, turn on the digital camera, switch, and electronic scale, following which the sand particle streams were recorded with the camera.
(4)
Once no more sand particles were flowing out from the caving zone, the experimental setup was thoroughly washed to eliminate any residual sand particles and prepare for the subsequent experiment.
It is important to maintain consistency in all test conditions and minimize the impact of human error on the test results during the experiment. Therefore, three repeated tests were conducted for each experimental trial to ensure the reliability of the experiment.

3. Experimental Results and Discussion

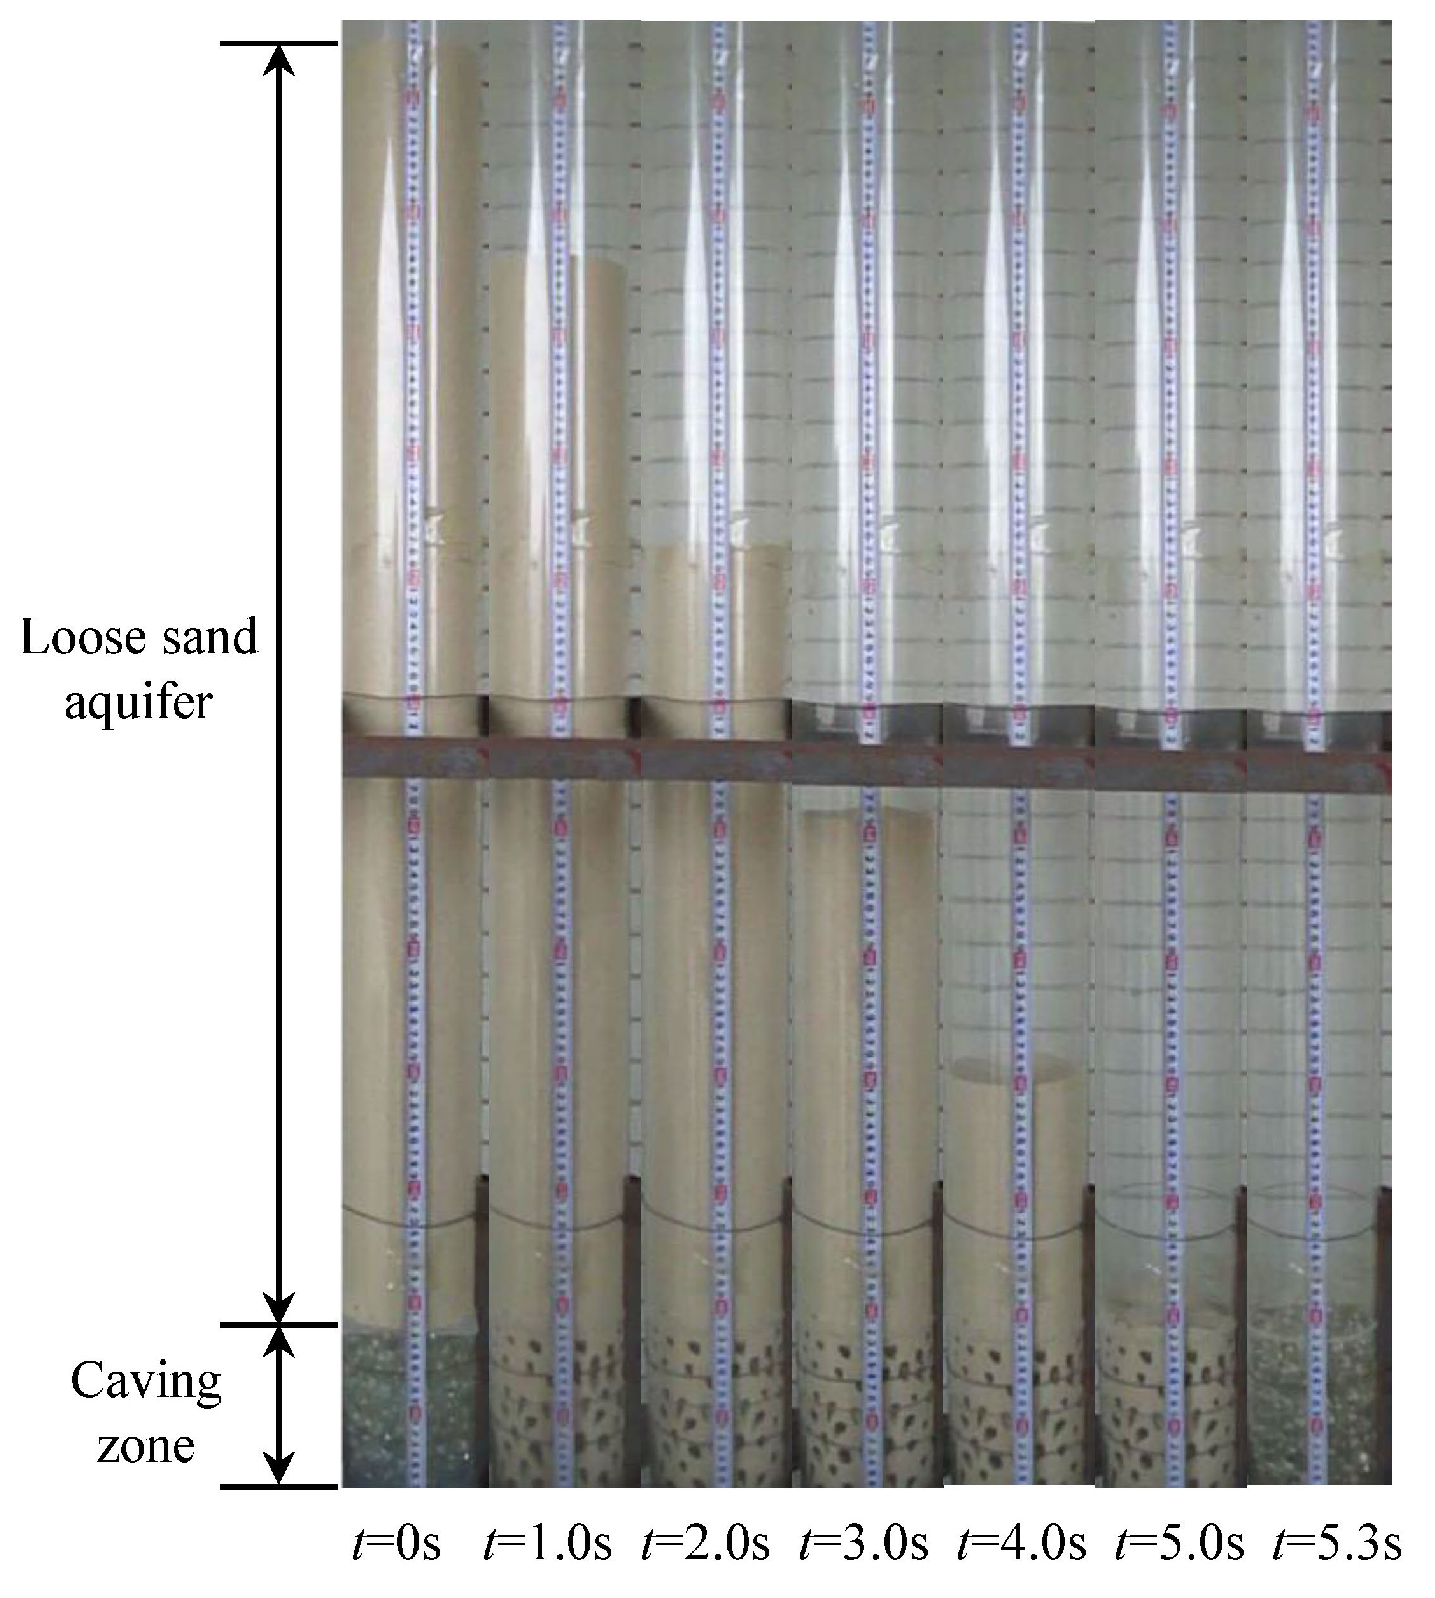
The sand particles would instantaneously flow into the porous medium comprised of glass beads when the switch was open at the start of the experiment. Since the top surface of the dropping sand column remained flat throughout the experiment, the speed of the sand flow can be characterized as the distance the sand column descends per second. The flow pattern of sand flowing through the porous medium is shown in Figure 3.

3.1. Influence of Caving Zone Height on Sand Flow Speed

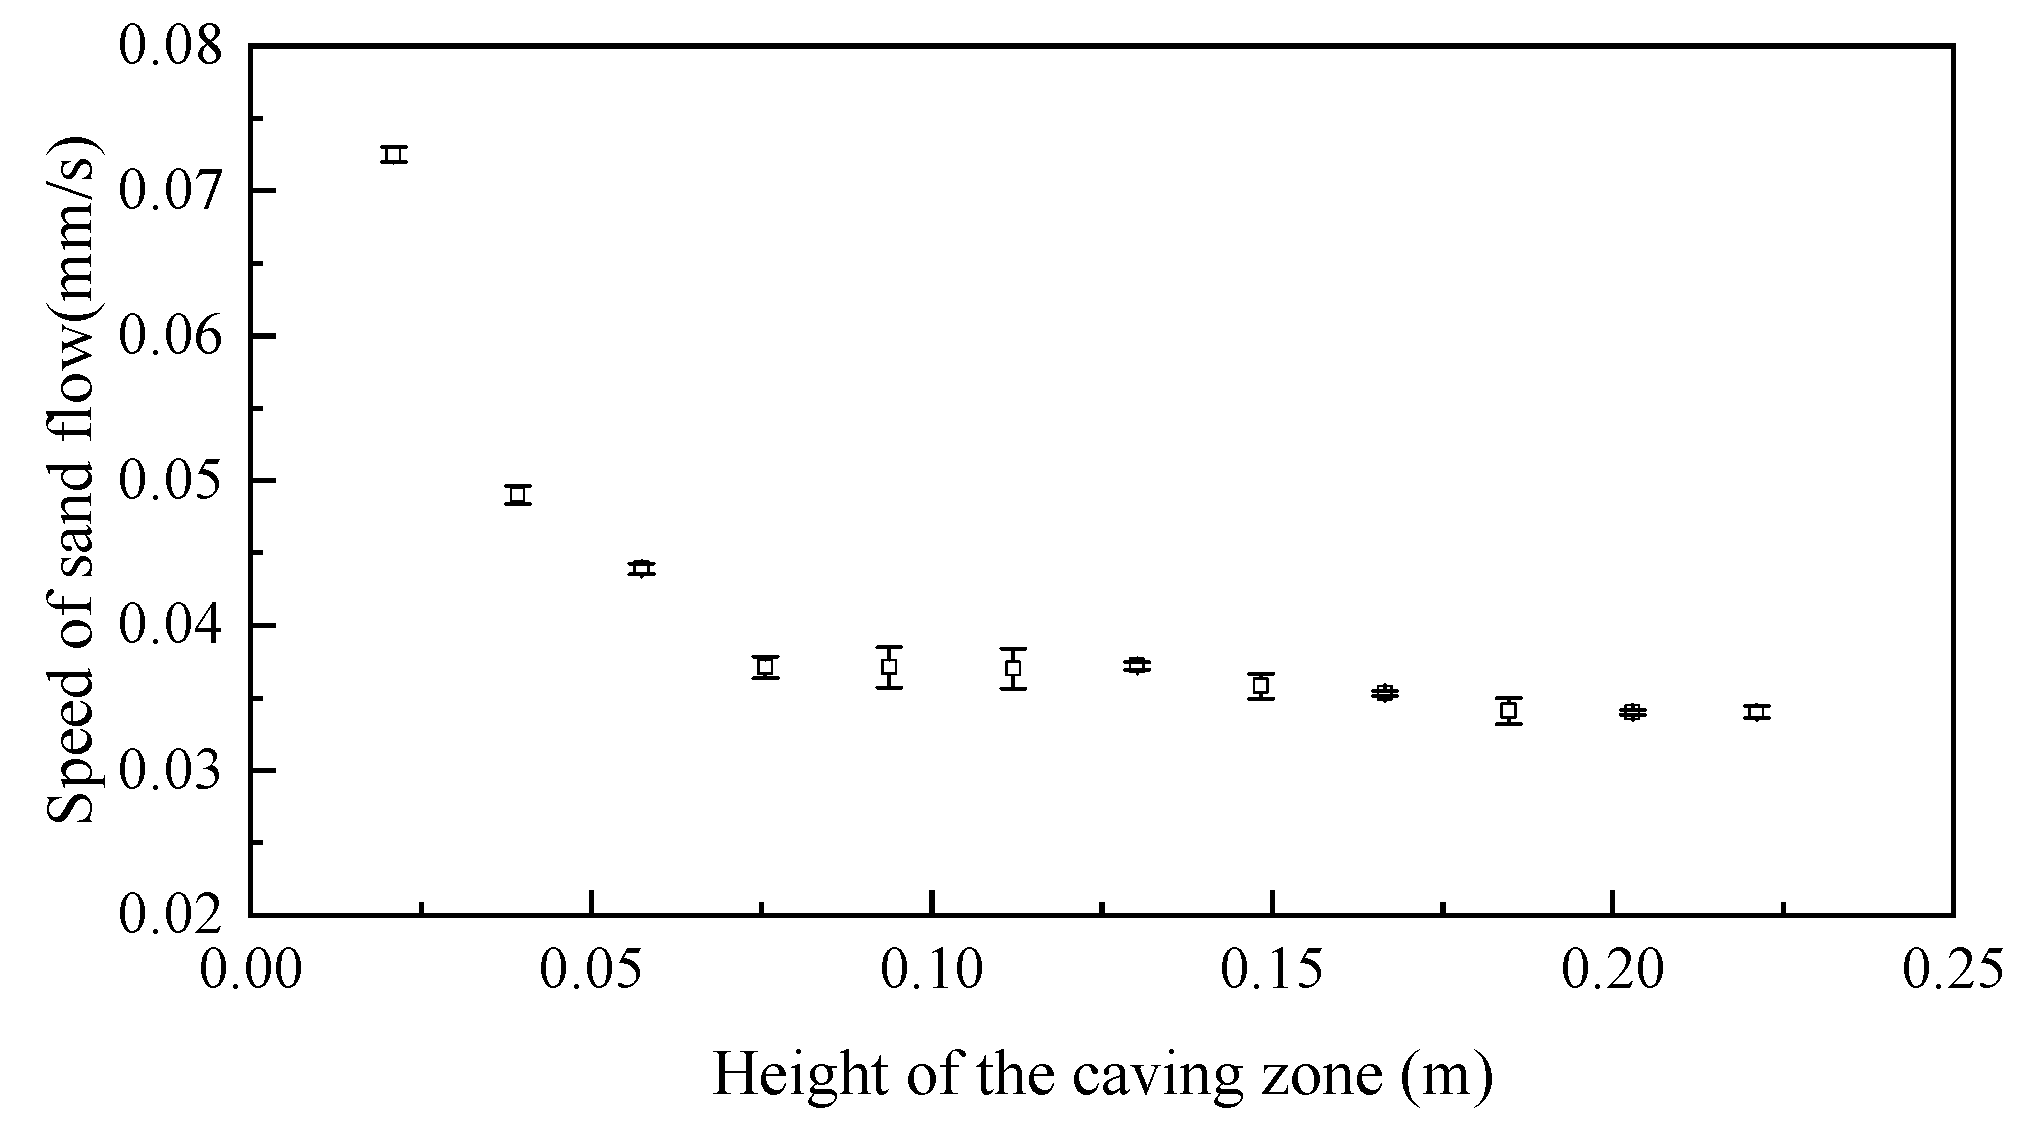
The experimental results reveal that the significant reduction in the speed of sand flow into the caving zone is attributed to the obstruction of the broken rock mass. Figure 4 is a schematic diagram of the relationship between the speed of sand flow and the height of the caving zone for (D, d) = (21 mm, 0.1–0.5 mm). Note that as the height of the caving zone increases, the speed of sand flow decreases. Moreover, when the height of the caving zone is greater than about 0.1 m, the spend of sand low basically reaches stability. For example, when the height of the caving zone is 0.1 m, the sand flow speed is 37 ± 1.4 mm/s. Whereas at a height of about 0.2 m, the sand flow speed slightly decreases to 35 ± 0.9 mm/s. Compared with the height of 0.1 m, the reduction in sand flow speed is slight, so it can be considered that the sand breaking speed has reached a stable value.

3.2. Influence of Sand Particle Size on Sand Flow Speed

When the height of the caving zone is greater than 0.1 m, there is no notable increase in the speed of sand flow with the height of the caving zone. Therefore, when studying the relationship between the sand flow speed and sand particle size, the caving zone height of 0.15 m is adopted as a fixed parameter. Figure 5 shows the relationship between the sand flow speed and sand particle size. Note that the sand flow speed decreases with the increase in the sand particle size. For a given sand particle size, an increase in the size of the fragmented rock mass (D) leads to a faster sand flow speed. This is attributed to the fact that the larger the particle size in the porous medium, the larger the voids between them, thereby facilitating a faster sand flow speed. Therefore, the speed of sand flow is related to the size of the voids formed within the porous medium.

4. Simulation Results and Discussion

Water and sand inrush hazards typically involve large volumes of sand with a high solid content, which is characterized by the rapid flow of numerous sand particles. Traditional solid mechanics or fluid mechanics theories have difficulty explaining the dynamic behavior of water and sand inrush hazards. PFC3.0 is a particle flow software to simulate the motion and interaction of circular particle media. It has significant advantages in simulating interaction problems between particles, large deformation problems, and other aspects [34,35] and is widely used in the simulation of particle flow [5,36,37].

4.1. Numerical Model Establishment

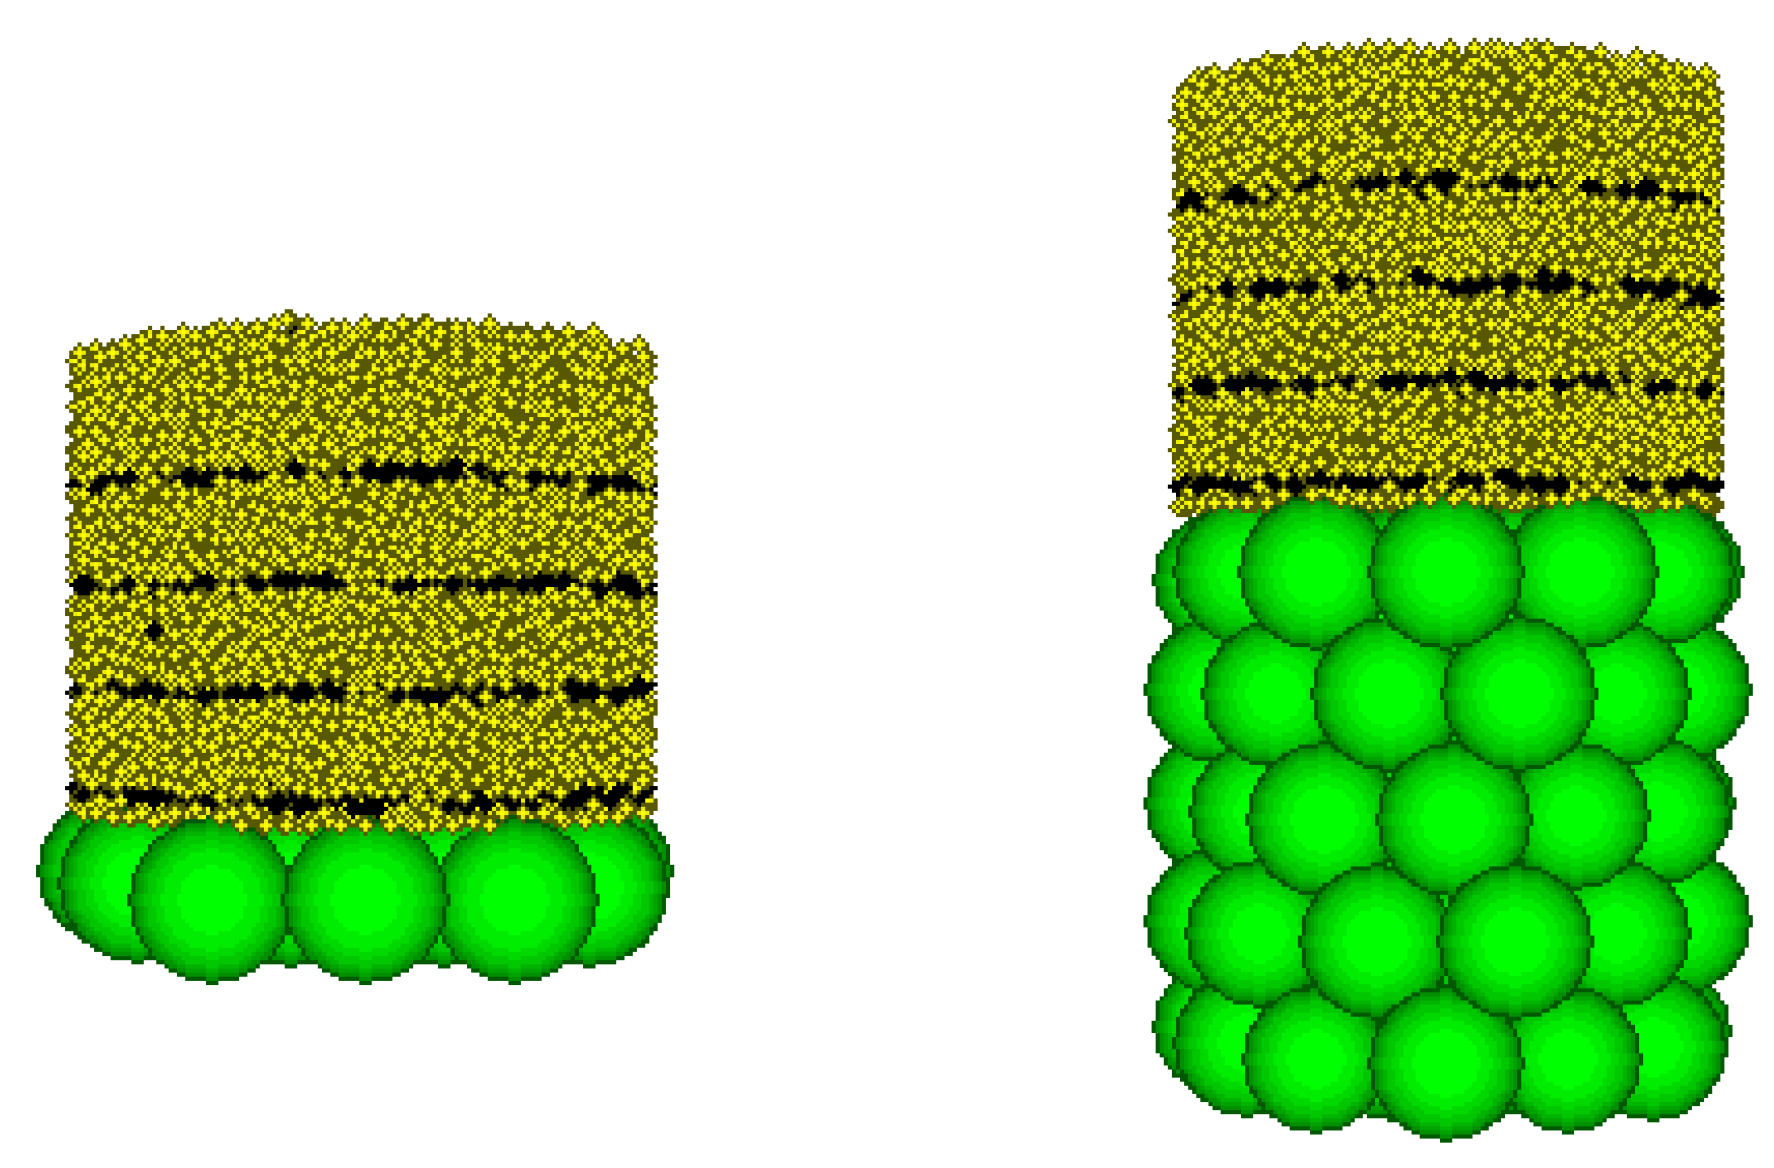
In order to conduct a better comparative analysis with model experiments, the numerical model adopts a cylindrical shape with an inner diameter of 120 mm. The generation method of equal-diameter spheres adopts a layered generation method, and the number of spheres generated is controlled by porosity. To ensure that the generated spheres do not overlap with each other, the Gen command is used to generate spheres. In addition, in order to ensure that sand particles can only flow out through the pores between the spheres, the fix command is used to fix the bottom spherical particles. Figure 6 shows the generated numerical model, in which green spheres with a diameter of 25 mm represent glass beads in the porous medium, and the heights of the caving zone are 25 mm × 1 mm and 25 mm × 5 mm, respectively. The yellow particles in Figure 6 represent sand particles. In this study, the diameters of sand particles were selected as 2 mm, 1 mm, and 0.75 mm, respectively. Considering that the calculation time of the PFC model is significantly influenced by the number of particles, and the height of the sand layer has a relatively little impact on the speed of sand flow, the height of the sand layer is set to 100 mm. In addition, for the convenience of observing the particles’ flow, a marker layer is set every 20 mm in the middle of the sand particles.

4.2. Microscopic Parameter and Model Verification

In practical engineering calculations, parameters such as modulus, strength, and internal friction angle are mainly used to describe the characteristics of rock and soil materials. However, for discrete element PFC, the microscopic parameters commonly used to describe materials include particle size (R), friction coefficient (μ) between particles, porosity (n), particle normal stiffness (kn), tangential stiffness (ks), as well as normal and tangential bonding strength (n_bond, s_bond), etc. These microscopic parameters cannot be directly obtained from experiments and must be calibrated through parameter calibration. During this process, it is necessary to continuously adjust the microscopic parameters and compare the mechanical response of the model with the macroscopic experimental results until the simulated results approximate the actual experimental results.
The sand in numerical simulation adopts a contact stiffness model, which is mainly suitable for simulating loose media, mainly in particle contact. The normal and tangential bonding strength in the sand is generally 0, and this model requires three parameters to be determined: normal stiffness (kn), tangential stiffness (ks), and friction coefficient (μ). By referring to the microscopic parameter configurations established by Li et al. [38] for standard sand, the parameters were determined by comparing the simulation results with experimental data through the trial-and-error method to ensure the reliability of the simulation results. The basic microscopic parameter values of the selected model are shown in Table 2.
To determine microscopic parameters, it is necessary to conduct model verification since they cannot be directly obtained from macro laboratory experiments. Figure 7 shows the variation pattern of the transport of sand particles with the size of 1 mm over time under different heights of the caving zone. Note that the flow of sand particles in the caving zone is affected by broken rocks. Under the influence of gravity, sand particles only continuously move along the gaps in the caving zone, and the height of the sand column continuously decreases. From the movement of the black-marked layer, it can be seen that sand particles do not flow downward as a whole but flow along the pores of the porous medium. There is a funnel-shaped fluctuation in the sand particle-marked layer near the pores. In addition, the higher the height of the caving zone, the slower the descent speed of the sand layer. When t = 0.03 s, the height of the sand column is about 80 mm. When t = 0.35 s, the height of the sand column is about 70 mm.
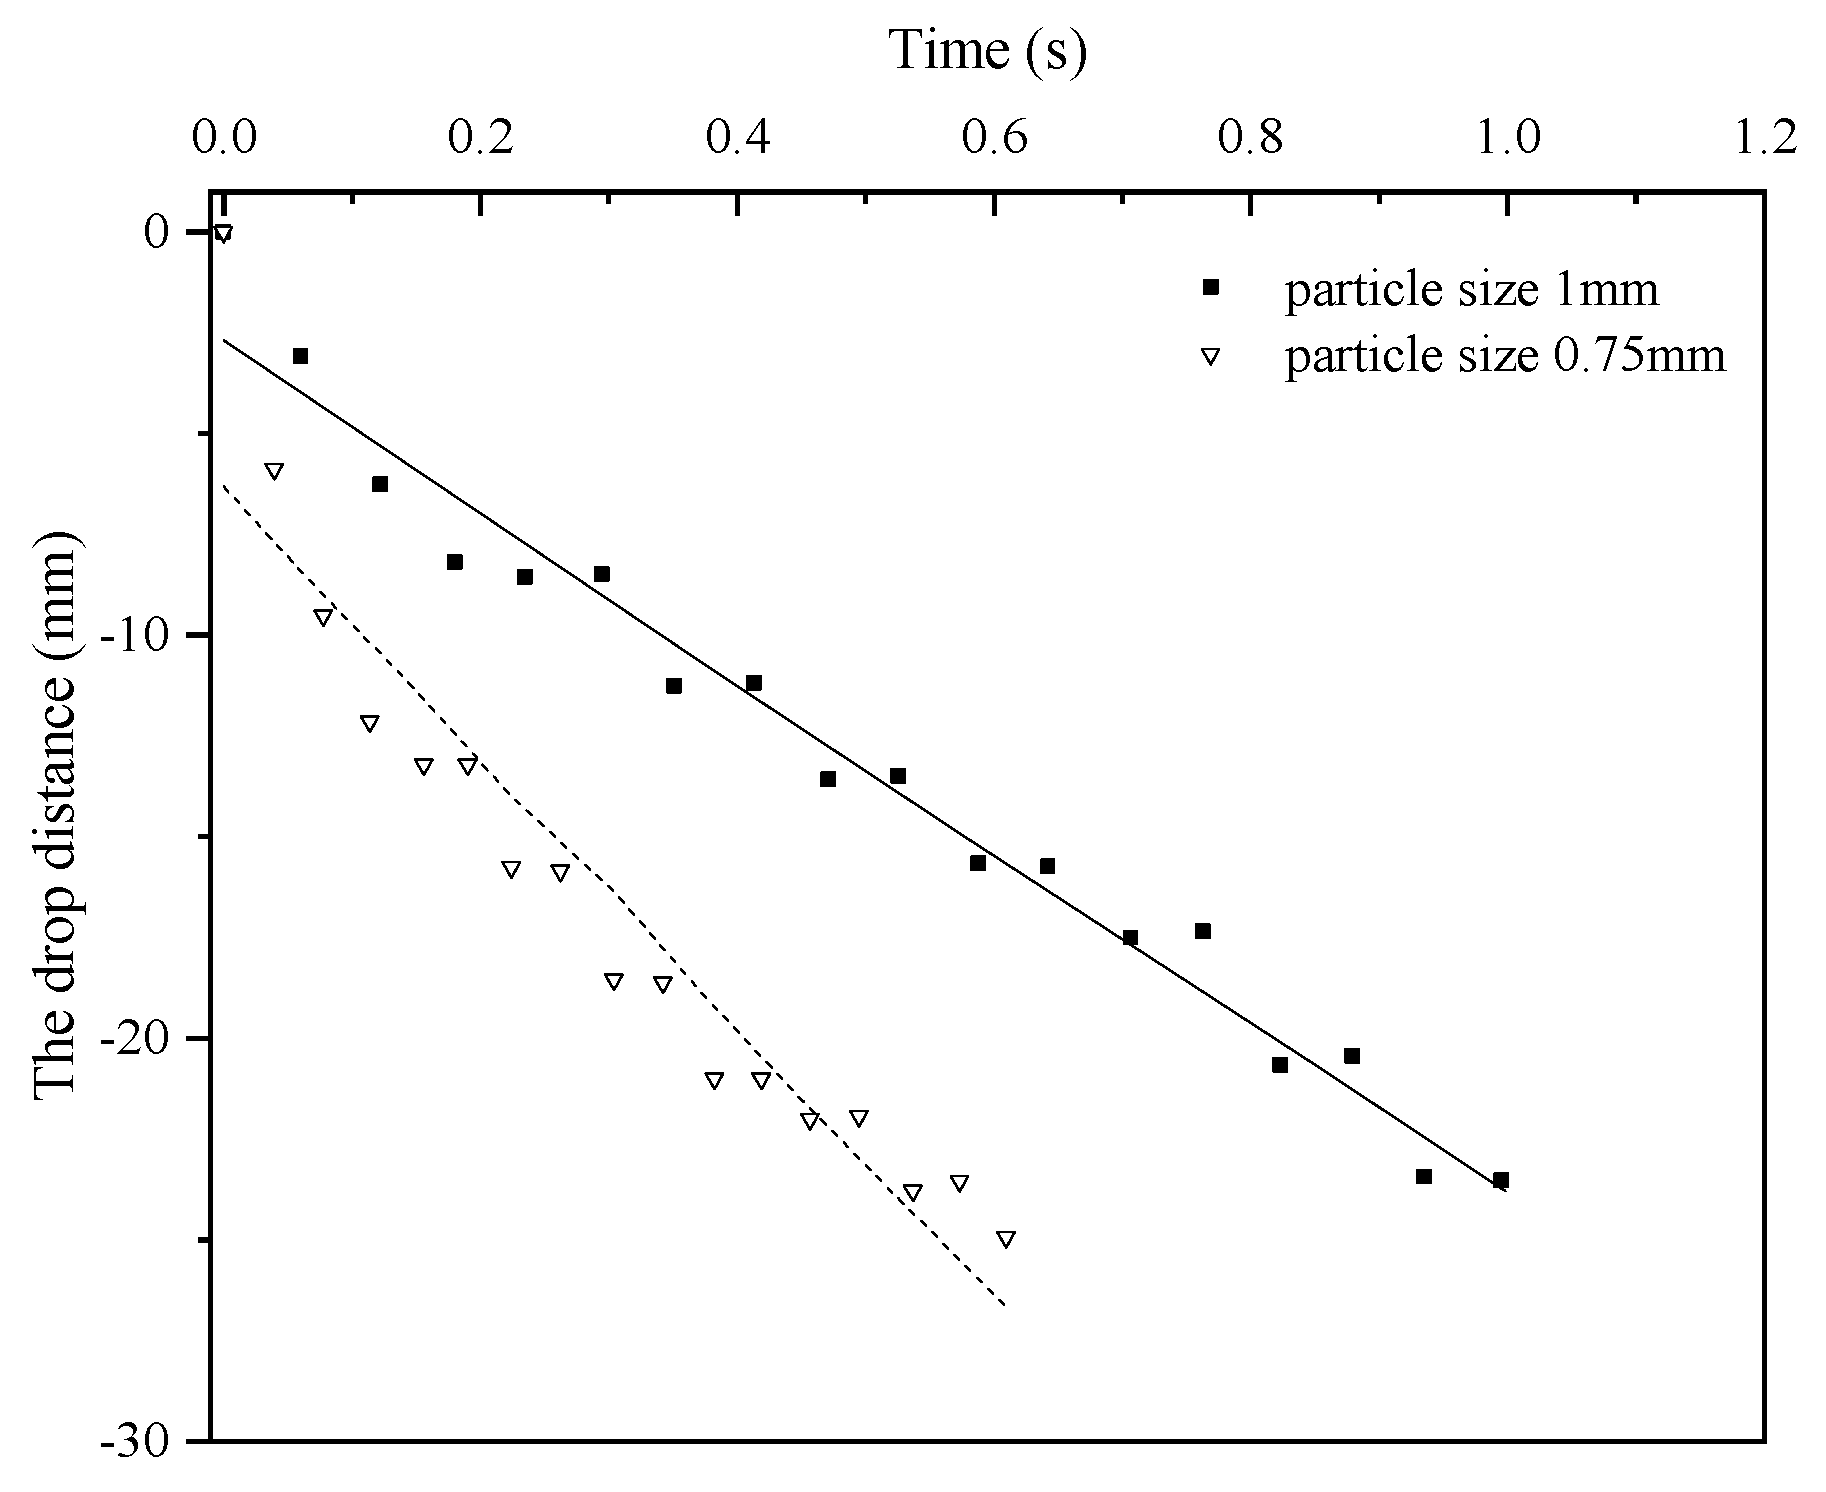
Using the FISH language in PFC to extract and calculate data, the height of the sand column at different time points is extracted, as shown in Figure 8. Note that the drop distance is decreasing linearly with time; there is good qualitative agreement with the observed testing phenomenon. However, due to the incomplete settlement of sand particles, the initial speed of sand flow is relatively high during numerical simulation. In order to ignore this influence, the height of the initial point is excluded from the data fitting process. After fitting the data, the sand flow speed under different conditions can be obtained.
Table 3 summarizes a comparison of sand flow speed between an experiment and the corresponding numerical simulation. It is noted that the simulated value of sand flow speed for particles with a diameter of 0.75 mm is about 33.7 mm/s, which is very close to the mean experimental data for particles with diameters ranging from 0.5 mm to 1 mm. In addition, the sand flow speed for d = 1–2 mm is 19.0 mm/s in the experiment, which falls between the speeds obtained from simulations for particle sizes of 2 mm and 1 mm. The calculated value of sand flow speed using PFC agrees well with the experimental value, which implies the appropriateness of microscopic parameters.

4.3. Microscopic Analysis

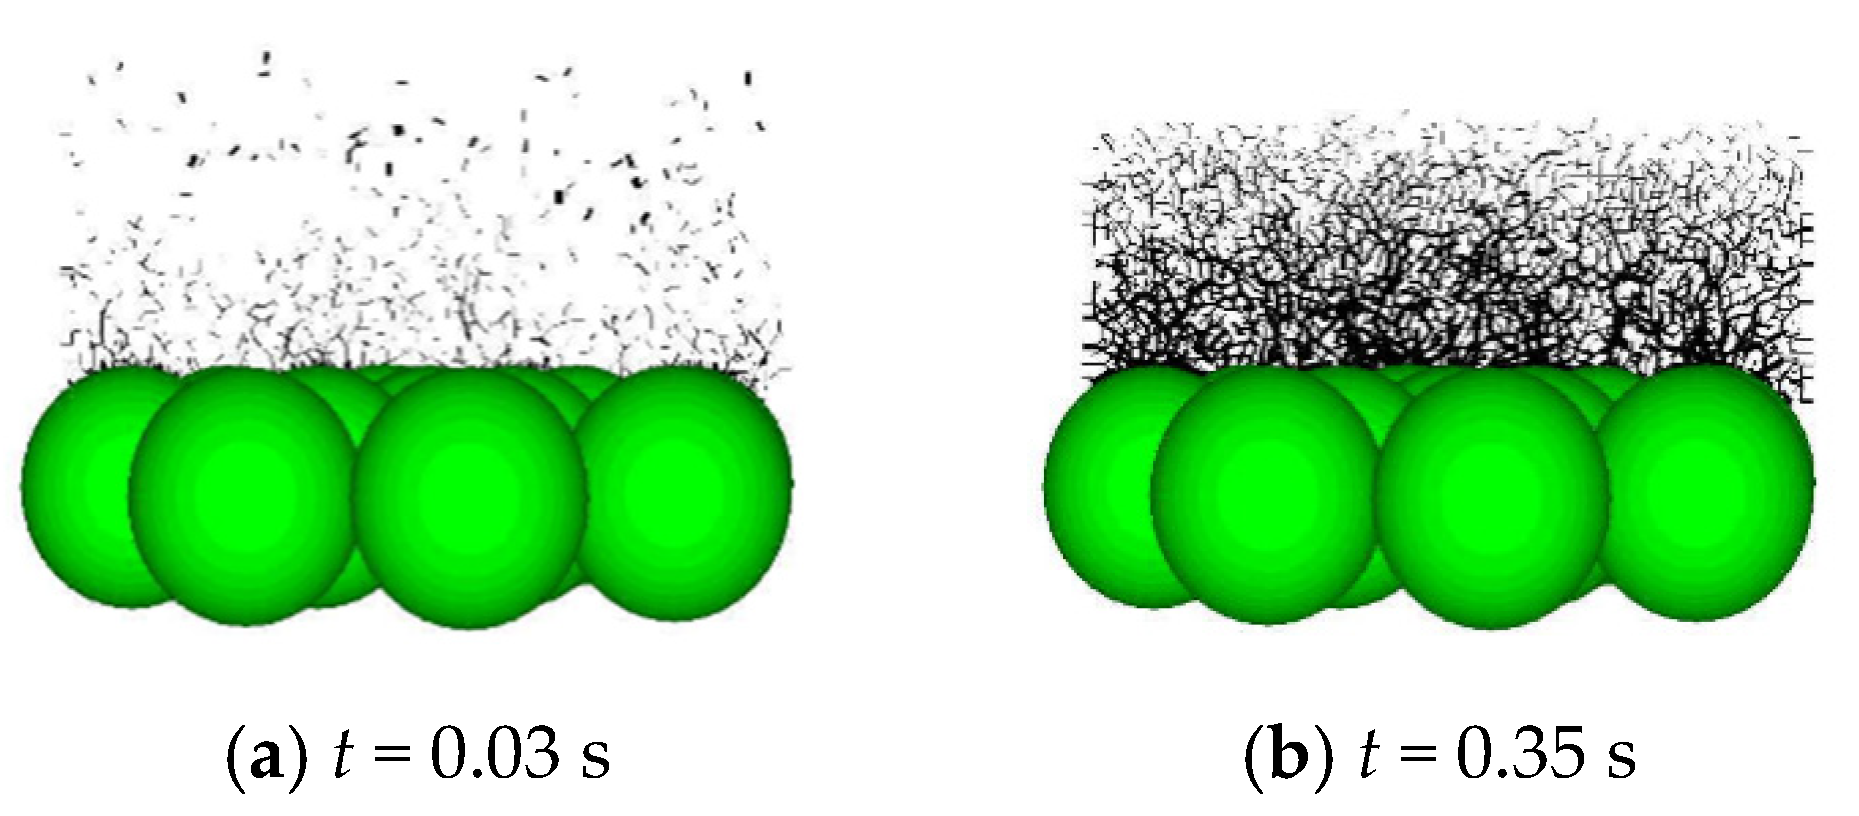
Forces in granular materials are transmitted through force chains, and PFC connects the contact forces between particles. The thickness of the force chains is directly proportional to the magnitude of the contact forces, making this algorithm convenient for visualizing contact forces. Figure 9 shows the force chain diagram formed during the movement of 1 mm sand particles.
Note that in the dense flow under the action of gravity, a linear and relatively stable force chain is formed between the contact particles, which forms a force chain network within the entire particle medium to support the gravity and external load of the entire particle medium. During the process of sand flow, the distribution of contact stress inside the particles is non-uniform. The force chains around the bottom particles are relatively thick, while the upper force chains become thin, which indicates that these lower particles are subjected to strong forces, while the force chains of the overlying particles are very weak due to continuous movement. During the process of sand flow, the force chain undergoes continuous dynamic changes, and several sand particles aggregate to form a force chain. Due to the obstruction of the lower sphere, the sand particles continue to accumulate, which would cause the force chain to gradually become stable and the speed of sand flow to slow down.
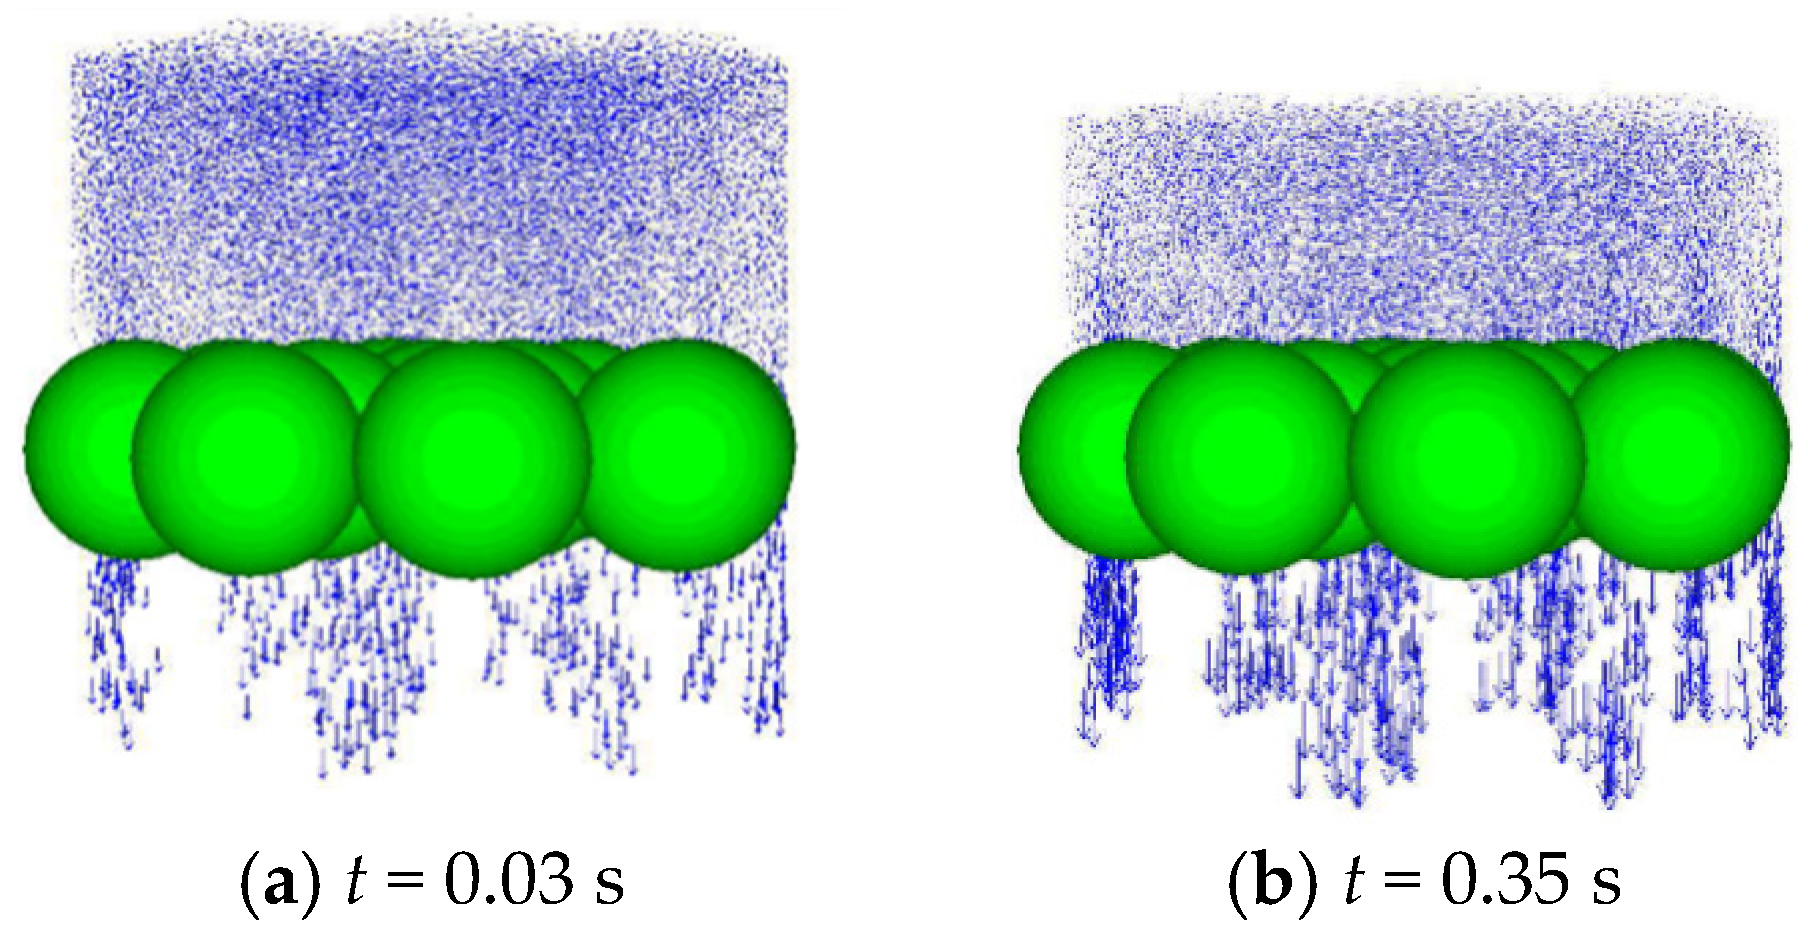
Figure 10 is the corresponding velocity distribution map. Note that during the process of sand flow, the speed and direction of the sand particle vary over time, which have the features of non-uniformity and discontinuity. From a microscopic perspective, when the sand column is located near the pores of a porous medium, the sand collapse rate is relatively fast. However, due to the continuous supply of surrounding sand particles, the sand column velocity is macroscopically uniform.

4.4. Discussion and Limitation

The transport of particles in a porous medium has significantly evolved into an area of study with implications across various disciplines, including wastewater filtration, oil recovery processes, erosion and piping in earth dams, and coal mining [39,40]. These particles can range in size from very small, such as viruses and particulates, to quite large, including sand and gravel. The majority of previous studies have revealed that fine particle size, pore size, pore size distribution in porous media, and hydrodynamic conditions are the main controlling factors that influence the transport speed of particles [41,42,43]. The results of the study reveal that the sand flow speed decreases as the height of the caving zone increases for the same particle size. That may be because of the major difference in pores geometry and distribution between the ideal and real caving zone. The pores in the idealized caving zone, regarded as a homogeneous porous medium, are generally continuous, while the actual caving zone, which is full of fragmented rock mass, contains a lot of disconnected pores and dead-end pores. The geometry of dead-end pores resembles stagnant pockets, which favors the deposition and accumulation of sand particles in these zones [44]. In addition, the disconnected pores can restrain the movement of sand particles, and consequently, sand particles only migrate through well-interconnected pores, which is likely to lead to a preferential flow pathway. However, the uniform pore distribution resulting from the single size of the glass bead prevents the formation of significantly preferential flow pathways. Furthermore, the absence of an immobile domain within the rock mass is likely to diminish the sand flow speed during water and sand inrush. The water and sand inrush usually contain large volumes of sand with a high solid content, which can be regarded as a dense, rapid flow. According to Hong et al. [45], the increase in friction and viscosity in dense flows directly leads to a decrease in mobility, causing pore blockages that further restrict the movement. Furthermore, research conducted by Fjaestad and Tomac [46] has demonstrated that the mutual interactions between particles have a substantial impact on the flow and transport of particles within dense flows. However, the mechanism of this behavior remains unidentified, which will be the focus of our future research.
The experimental results offer a deeper understanding of the water and sand flow through a caving zone, which is invaluable for preventing water and sand inrush geological hazards. For instance, reducing the broken rock mass in the caving zone can effectively prevent the influx of water and sand mixtures, thereby mitigating the risk of geohazards. Consequently, in some coal mines, aggregates or sands can be strategically poured into the caving zone as a means of controlling water and sand inrush towards the mining panel. However, there are some limitations and several issues that need to be addressed in further studies. To reduce uncertainties that would have considerably complicated the analysis of the experimental data, the influence of clay content was not taken into account in this study. In addition, the experimental work presented here was not intended to simulate any particular mine site, and the experimental design does not strictly conform to similarity laws. We will consider these issues in the future.

5. Conclusions

(1)
The sand flow speed decreases with the increase in the height of the caving zone until a certain threshold value is reached. After the height of the caving zone is higher than the threshold value, the speed of sand flow remains approximately constant. The trend in sand flow speed with respect to the height of the caving zone is fundamentally consistent with the trend of porosity with respect to the same height. In addition, the sand flow speed decreases with the increase in sand particle size, and for a given sand particle size, the speed of sand increases with the increase in the size of the broken rock mass.
(2)
The PFC3D was used to analyze the transport of sand particles during the sand flow process from a microscopic perspective. The results show that during the sand flow process, the overlying sand particles continuously move and the force chain undergoes dynamic changes. Furthermore, with the obstruction of the lower sphere, the sand particles continue to accumulate between the gaps of the porous medium, the force chain is gradually stable, and the speed of sand flow slows down.
(3)
During the process of sand flow, the speed and direction of sand particles change over time, which have certain characteristics of non-uniformity and discontinuity. However, due to the continuous supply of surrounding sand particles, the speed of the sand column is unchanged from a macro perspective.

Author Contributions

Conceptualization, performing simulations, and writing original manuscript preparation: Y.L.; methodology and conceptualization: S.Y.; performing simulations: S.M.; validation and writing—review and editing: G.H.; supervision: J.S. All authors have read and agreed to the published version of the manuscript.

Funding

This research was funded by the Natural Science Foundation of Henan Province (Grant No. 242300420225), the Key Research and Development Project of Henan Province (Grant No. 241111322900), and the National Natural Science Foundation of China (Grant No. 41902283).

Data Availability Statement

The raw data supporting the conclusions of this article will be made available by the authors on request.

Acknowledgments

The authors express their gratitude to the anonymous reviewers for their detailed comments and suggestions, which have greatly enhanced the quality of this paper.

Conflicts of Interest

Guilei Han and Jiabin Shi were employed by North China Engineering Investigation Institute Co., Ltd. The remaining authors declare that the research was conducted in the absence of any commercial or financial relationships that could be construed as a potential conflict of interest.

References

  1. Islam, M.; Hayashi, D.; Kamruzzaman, A. Finite element modeling of stress distributions and problems for multi-slice longwall mining in Bangladesh, with special reference to the Barapukuria coal mine. Int. J. Coal Geol. 2009, 78, 91–109. [Google Scholar] [CrossRef]
  2. Vallejos, J.; Basaure, K.; Palma, S.; Castro, R. Methodology for evaluation of mud rush risk in block caving mining. J. S. Afr. Inst. Min. Metall. 2017, 117, 491–497. [Google Scholar] [CrossRef]
  3. Sui, W. Catastrophic mechanism of seepage deformation and mining rock mass and its prevention & control I: Water-sand mixture inrush form seam roof. J. Earth Sci. Environ. 2022, 44, 903–921. [Google Scholar]
  4. Araffa, S.; Gobashy, M.; Khalil, M. Integration of geophysical techniques to detect geotechnical hazards: A case study in Mokattam, Cairo, Egypt. Bull. Eng. Geol. Environ. 2021, 80, 8021–8041. [Google Scholar] [CrossRef]
  5. Li, W.; Liu, Y.; Li, S.; Ma, L.; Yue, L.; Wang, J. Experimental and Numerical Studies of Water-Sand Flow in Fractured Porous Media. Rock Mech. Rock Eng. 2024. [Google Scholar] [CrossRef]
  6. Xue, Y.; Kong, F.; Qiu, D.; Su, M.; Zhao, Y.; Zhang, K. The classifications of water and mud/rock inrush hazard: A review and update. Bull. Eng. Geol. Environ. 2021, 80, 1907–1925. [Google Scholar] [CrossRef]
  7. Qian, Z.; Jiang, Z.; Guan, Y.; Yue, N. Mechanism and remediation of water and sand mixture inrush induced in an inclined shaft by large-tonnage vehicles. Mine Water Environ. 2019, 37, 849–855. [Google Scholar] [CrossRef]
  8. Liang, Y.; Sui, W.; Jiang, T.; Shen, X. Experimental investigation on the transport behavior of a sand/mud/water mixture through a mining-induced caving zone. Mine Water Environ. 2022, 77, 153–164. [Google Scholar] [CrossRef]
  9. Dong, S.; Liu, Z.; Wang, H. Research status and Prospect on the mechanism of dynamic sand inrush at weakly cemented strata in working face with thick bedrock. J. Chin. Coal Soc. 2022, 47, 274–285. [Google Scholar]
  10. Zhang, S.; Li, Y.; Li, J.; Yang, W.; Wang, G.; Wen, Z. Experimental studies on variation characteristics of physical parameters during water and sand burst through mining fractures. J. Chin. Coal Soc. 2020, 45, 182–189. [Google Scholar]
  11. China Central Television. Water and Sand Mixture Inrush Hazard. Occurred in Haojialiang Coal Mine in Yulin Shanxi. 2021. Available online: https://news.cctv.com/2021/07/16/ARTIZ3hTbE9ULARMERFHt52o210716.shtml (accessed on 16 July 2021).
  12. Dong, S.; Ji, Y.; Wang, H.; Zhao, B.; Cao, H.; Liu, Y.; Liu, Y.; Ji, Z.; Liu, B. Prevention and control technology and application of roof water disaster in Jurassic coal field of Ordos Basin. J. Chin. Coal Soc. 2020, 45, 2367–2375. [Google Scholar]
  13. Xu, Y.; Luo, Y.; Li, J.; Li, K.; Cao, X. Water and sand inrush during mining under thick unconsolidated layers and thin bedrock in the Zhaogu No. 1 coal mine, China. Mine Water Environ. 2018, 37, 336–345. [Google Scholar] [CrossRef]
  14. Wang, H.; Chen, S.; Guo, W. Development and application of test system for water-sand inrush. J. Min. Saf. Eng. 2019, 36, 72–79. [Google Scholar]
  15. Zhang, G.; Wang, R.; Ma, J.; Lyu, W.; Zhang, W.; Wang, H. Study on solid-fluid coupling similarity simulation test of water-sand inrush during mining of shallow buried thin bedrock roof. Coal Sci. Technol. 2024, 52, 165–175. [Google Scholar]
  16. Sui, W.; Cai, G.; Dong, Q. Experimental research on critical percolation gradient of quicksand across overburden fissures due to coal mining near unconsolidated soil layers. Chin. J. Rock Mech. Eng. 2007, 26, 2084–2091. [Google Scholar]
  17. Yang, W.; Jin, L.; Zhang, X. Simulation test on mixed water and sand mixture inrush disaster induced by mining under the thin bedrock. J. Loss Prev. Process Ind. 2019, 57, 1–6. [Google Scholar] [CrossRef]
  18. Zhang, G.; Zhang, K.; Wang, L. Mechanism of water inrush and quicksand movement induced by a borehole and measures for prevention and remediation. Bull. Eng. Geol. Environ. 2015, 74, 1395–1405. [Google Scholar] [CrossRef]
  19. Yuan, K.; Yu, B.; Zhang, M.; Yang, Y.; Yu, H. Investigating the dynamics of water-sand mixing inrush in viscous sand layers: Insights from laboratory experiments. Nat. Hazards 2024, 120, 9713–9734. [Google Scholar] [CrossRef]
  20. Zheng, G.; Dai, X.; Zhang, X. Experimental study and numerical simulation of leaking process of water and sand in underground engineering. Chin. J. Rock. Mech. Eng. 2014, 12, 2458–2471. [Google Scholar]
  21. Xu, J.; Pu, H.; Chen, J.R.; Sha, Z. Experimental study on sand inrush hazard of water-sand two phase flow in broken rock mass. Geofluids 2021, 2021, 5542440. [Google Scholar] [CrossRef]
  22. Zhong, J.; Zhou, H.; Zhao, Y.; Liu, Y.; Yang, H.; Xue, D. The two-phase flow of water-sand inrush under shallow coal seam mining: A coupled numerical study. Eng. Mech. 2017, 34, 229–238. [Google Scholar]
  23. Du, F.; Jiang, G.; Chen, Z. A numerical simulation study of the migration law of water-sand two-phase flow in broken rock mass Geofluids. Geofluids 2018, 2018, 6418476. [Google Scholar] [CrossRef]
  24. Pu, H.; Guo, S.; Liu, D.; Xu, J.; Wang, J. Study on laws of water inrush and sand burst migration based on LBM-DEM coupling method. Coal Sci. Technol. 2021, 49, 206–216. [Google Scholar]
  25. Ma, D.; Duan, H.; Zhang, J.; Liu, X.; Li, Z. Numerical simulation of water-silt inrush hazard of fault rock: A three-phase flow model. Rock Mech. Rock Eng. 2022, 55, 5163–5182. [Google Scholar] [CrossRef]
  26. Ma, D.; Duan, H.; Liu, X.; Ma, X.; Tao, M. Water-sediment two-phase flow inrush hazard in rock fractures of overburden strata during coal mining. Mine Water Environ. 2020, 39, 308–319. [Google Scholar] [CrossRef]
  27. Chen, J.; Pu, H.; Xiao, C.; Liu, G. Experimental study of impact of deformation history on water-sand seepage characteristics of broken rock. J. Min. Safe Eng. 2016, 33, 329–335. [Google Scholar]
  28. Du, F.; Cao, Z.; Li, Z. Research progress of two-phase water-sand flow characteristics in crushed rock mass. Coal Sci. Technol. 2018, 46, 48–53. [Google Scholar]
  29. Zhang, B.; He, Q.; Lin, Z.; Li, Z. Experimental study on the flow behaviour of water-sand mixtures in fractured rock specimens. Int. J. Min. Sci. Technol. 2021, 31, 377–385. [Google Scholar] [CrossRef]
  30. Yang, B.; Yang, T.; Xu, Z.; Liu, H.; Yang, X.; Shi, W. Impact of particle-size distribution on flow properties of a packed column. J. Hydrol. Eng. 2019, 24, 04018070. [Google Scholar] [CrossRef]
  31. Chen, B.; Zhang, S.; Li, Y.; Li, J. Experimental study on water and sand mixture inrush of mining cracks in loose layers with different clay contents. Bull. Eng. Geol. Environ. 2021, 80, 663–678. [Google Scholar] [CrossRef]
  32. Zhang, C.; Zhao, Y.; Tu, S.; Zhang, T. Numerical simulation of compaction and re-breakage characteristics of coal and rock samples in goaf. Chin. J. Geotech. Eng. 2020, 42, 696–704. [Google Scholar]
  33. Sui, W.; Liang, Y.; Zhang, X.; Ravi, J.; Zhu, T. An experimental investigation on the speed of sand flow through a fixed porous bed. Sci. Rep. 2017, 7, 41398. [Google Scholar] [CrossRef] [PubMed]
  34. Campbell, C.; Brennen, C. Computer simulation of granular shear flows. J. Fluid Mech. 1985, 151, 167–188. [Google Scholar] [CrossRef]
  35. Zhou, J.; Yao, Z.; Zhang, G. Research on piping mechanism sandy soils based on discrete element theory. Chin. J. Rock Mech. Eng. 2008, 27, 749–756. [Google Scholar]
  36. Lu, J.; Pu, H.; Chen, J. Simulation of mine water and sediment inrush based on particle flow method. Coal Technol. 2017, 36, 185–187. [Google Scholar]
  37. Liang, Y.; Sui, W.; Zhu, T.; Zhang, X. Numerical simulation of quicksand through the broken rocks in caving zone due to coal mining based on DEM. J. Chin. Coal Soc. 2017, 42, 470–476. [Google Scholar]
  38. Li, N.; Gao, Y. PFC simulation on triaxial shear test of transparent sand. J. Eng. Geol. 2011, 19, 311–317. [Google Scholar]
  39. Ahfir, N.; Wang, H.; Benamar, A.; Alem, A.; Massei, N.; Dupont, J. Transport and deposition of suspended particles in saturated porous media: Hydrodynamic effect. Hydrogeol. J. 2007, 15, 659–668. [Google Scholar] [CrossRef]
  40. Sun, D. Hydrodynamics and effect of velocity on particle filtration due to bridging in water-saturated porous media using CFD-DEM simulation. Environ. Sci. Pollut. Res. 2023, 30, 100124–100136. [Google Scholar] [CrossRef]
  41. Ahfir, N.; Hammadi, A.; Alem, A.; Wang, H.; Bras, G.; Ouahbi, T. Porous media grain size distribution and hydrodynamic forces effects on transport and deposition of suspended particles. J. Environ. Sci. 2017, 53, 161–172. [Google Scholar] [CrossRef]
  42. Feng, Q.; Cha, L.; Da, C.; Zhang, G.; Wang, S. Effect of particle size and concentration on the migration behavior in porous media by coupling computational fluid dynamics and discrete element method. Powder Technol. 2020, 360, 704–714. [Google Scholar] [CrossRef]
  43. Fo, B.; Xu, R.; Xi, J.; Yang, L.; Song, X.; Cai, J.; Gu, Z. Numerical simulation of fine particle liquid–solid flow in porous media based on LBM-IBM-DEM. Can. J. Chem. Eng. 2022, 101, 3576–3591. [Google Scholar] [CrossRef]
  44. Biswas, D.; Kartha, S. Conceptual modeling of temperature effects on capillary pressure in dead-end pores. Sādhanā 2019, 44, 117. [Google Scholar] [CrossRef]
  45. Hong, S.; Dinh, L.; Abuzar, S.; Lee, E.; Hwang, S. Synthesis of celecoxib-eutectic mixture particles via supercritical CO2 Process and celecoxib immediate release tablet formulation by quality by design approach. Pharmaceutics 2022, 14, 1549. [Google Scholar] [CrossRef]
  46. Fjaestad, D.; Tomac, I. Experimental investigation of sand proppant particles flow and transport regimes through narrow slots. Powder Technol. 2019, 343, 495–511. [Google Scholar] [CrossRef]
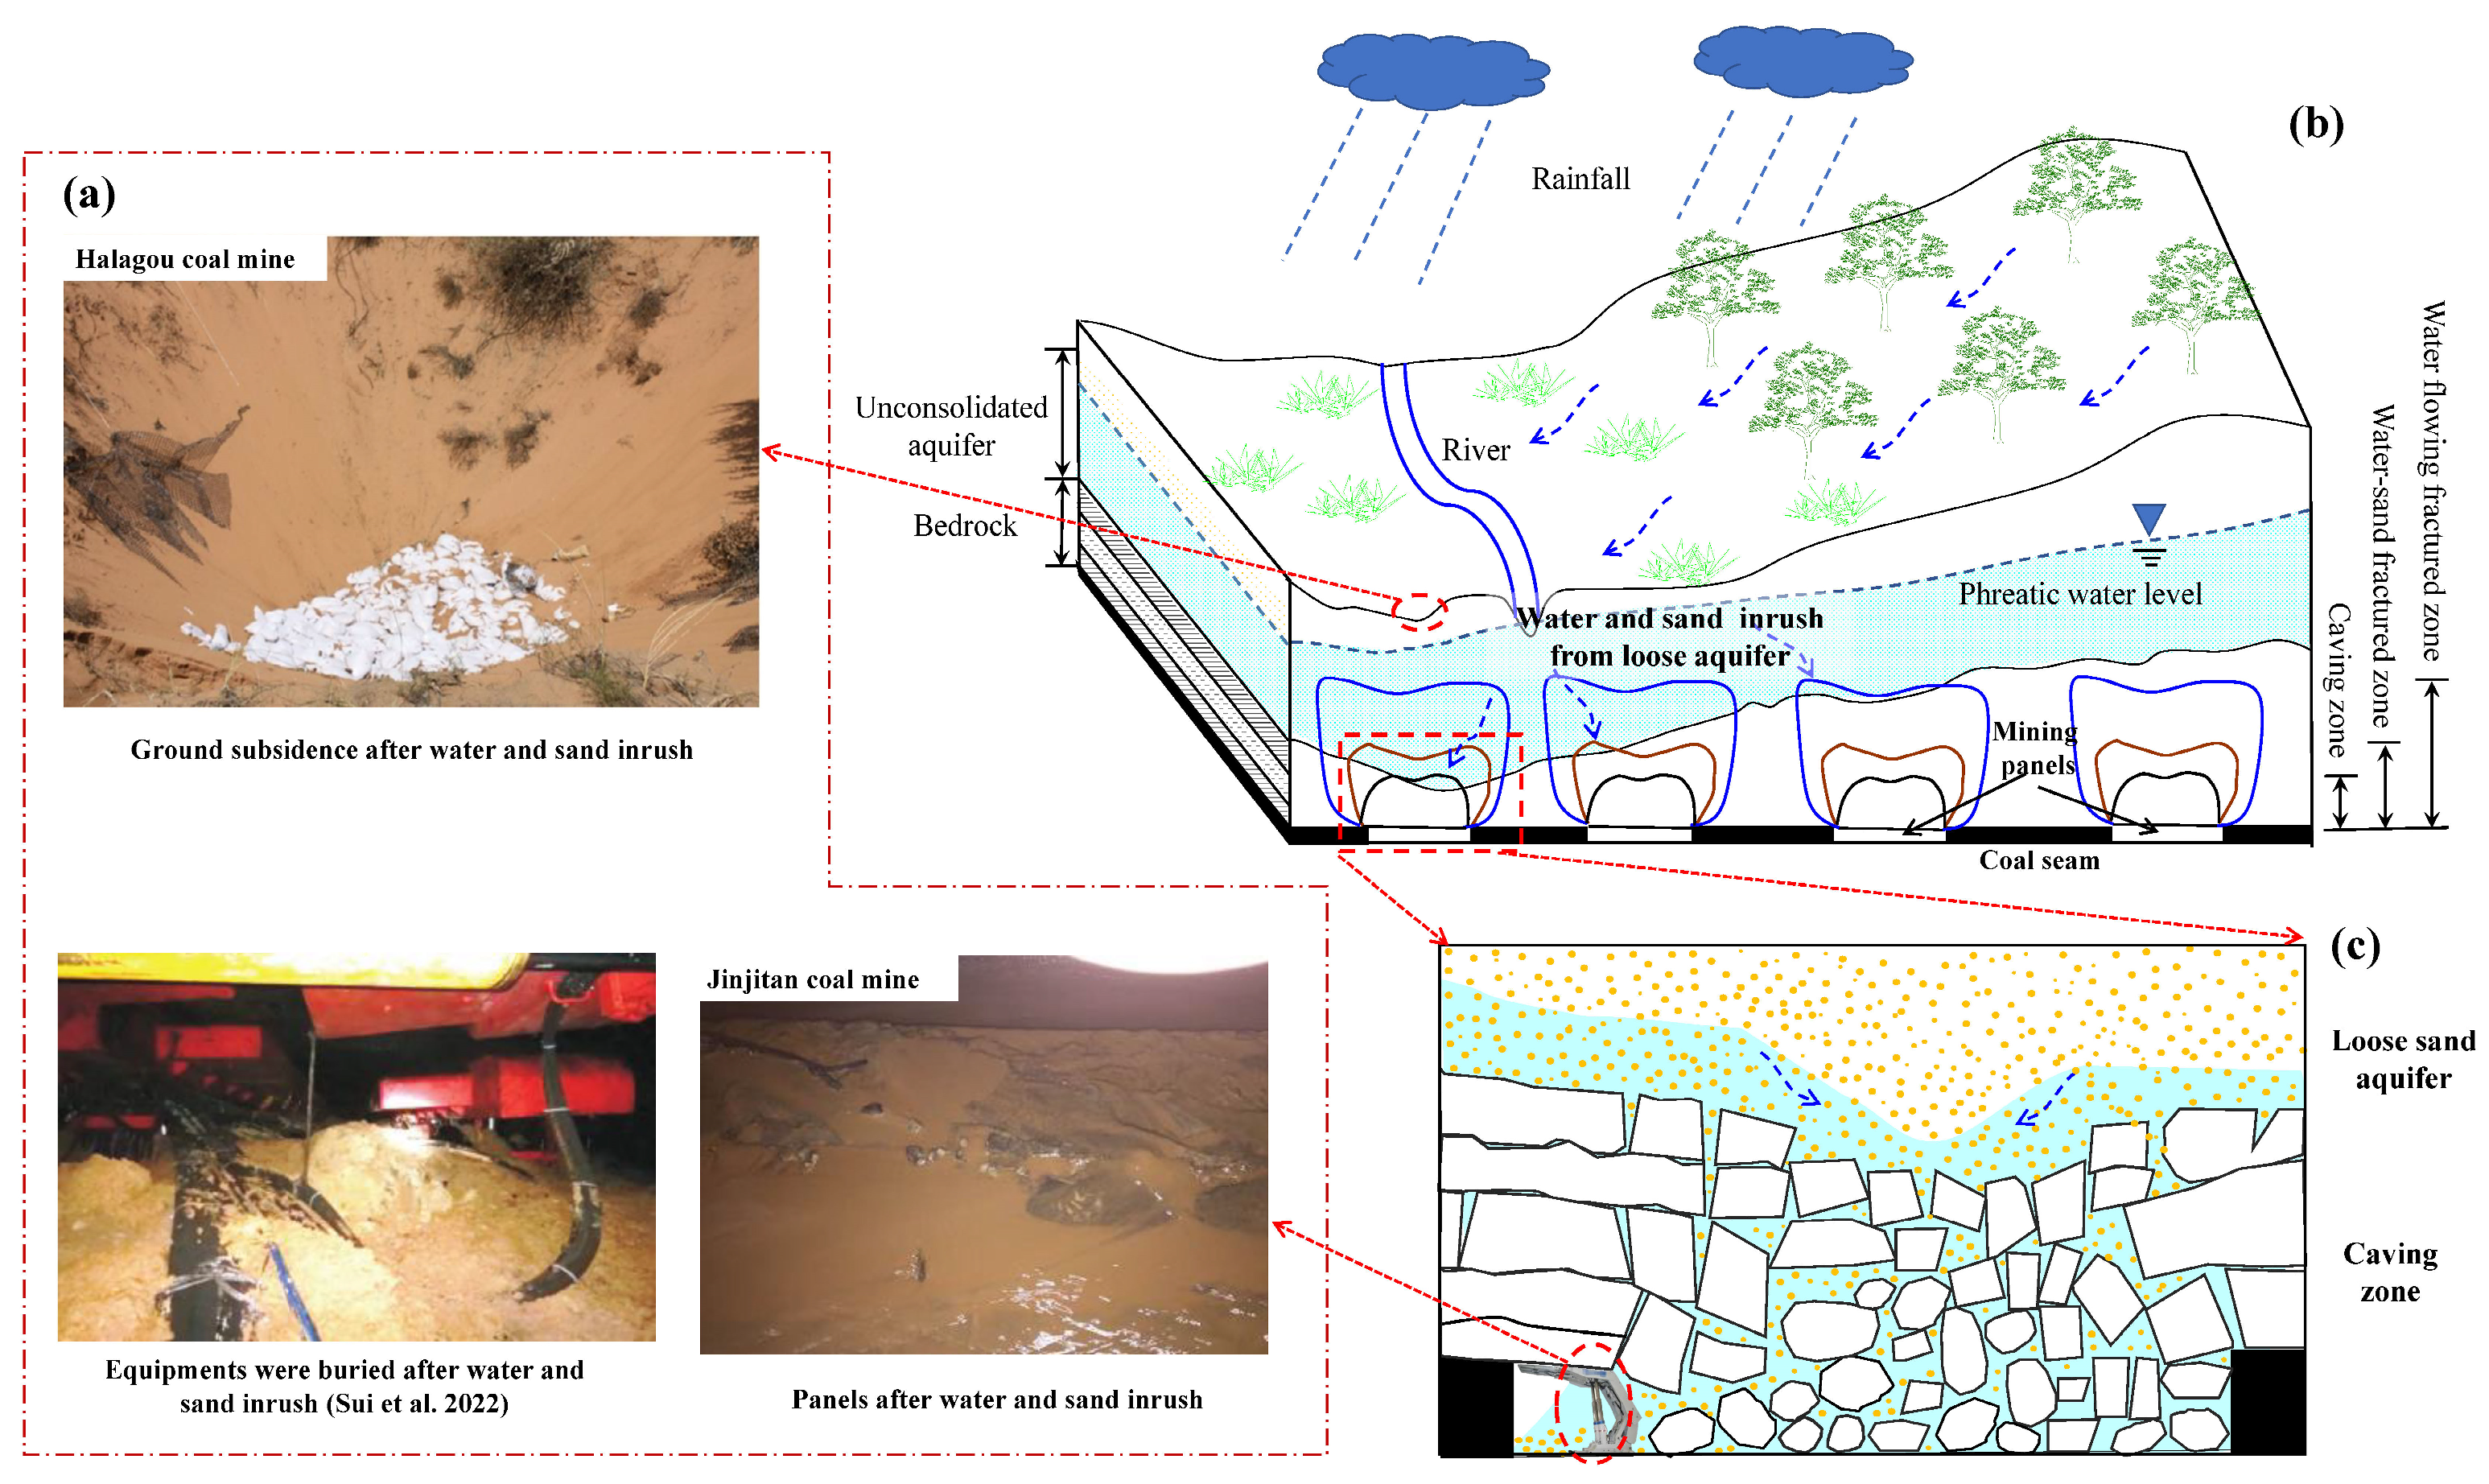
Figure 1. (a) Illustrations of water and sand inrush hazards in China’s coal mines [3]; (b) An engineering geological model depicting the mechanisms of water and sand inrush hazards; (c) A schematic representation of the process of water and sand inrush through the caving zone.
Water 16 02527 g001
Figure 2. Experimental setup. 1—Rack; 2—Material source box; 3—Switch; 4—Wire mesh; 5—Outflow collection device; 6—Measuring stick; 7—Digital camera; 8—Electronic scale; 9—Broken rock mass model; 10—Looser sand aquifer.
Water 16 02527 g002
Figure 3. Images of sand flow through the porous medium captured at various time intervals.
Water 16 02527 g003
Figure 4. The influence of height of caving zone on the speed of sand flow.
Water 16 02527 g004
Figure 5. The relationship between the speed of sand flow and the size of porous bed.
Water 16 02527 g005
Figure 6. Numerical simulation model of water and sand inrush for d = 1 mm.
Water 16 02527 g006
Figure 7. Sand flow through porous bed for d = 1 mm.
Water 16 02527 g007
Figure 8. The simulation relationship between the falling height of sand column and time.
Water 16 02527 g008
Figure 9. Force chain formed during water and sand inrush.
Water 16 02527 g009
Figure 10. The velocity distribution map during sand inrush.
Water 16 02527 g010
Table 1. Parameters of sand used in experiments.
Sand Particle Size (mm)Specific GravityInternal Friction Angle (°)Dry Density (g/cm3)
1–22.6643.31.57
0.5–12.6641.11.57
0.1–0.52.67401.57
Table 2. Main parameters of numerical model.
ParameterValue
Particle density (kg/m3)1570
Particle friction coefficient, μ0.6
Filling material porosity, n0.4
Normal contact stiffness of particles, kn (MPa)30
Tangential contact stiffness of particles, ks (MPa)1.5
Table 3. Comparison of sand flow speed between simulation results and experimental data.
MethodHeight of Caving Zone (mm) Particle Size of Sand (mm)Sand Flow Speed
(mm/s)
Simulation25 × 1275.9
1100.2
0.75104.4
25 × 526.7
121.1
0.7533.7
Experiment1501–219
0.5–130
Disclaimer/Publisher’s Note: The statements, opinions and data contained in all publications are solely those of the individual author(s) and contributor(s) and not of MDPI and/or the editor(s). MDPI and/or the editor(s) disclaim responsibility for any injury to people or property resulting from any ideas, methods, instructions or products referred to in the content.