
Migration of Water and Sand Inrush through the Mining-Induced Caving Zone: Insights from Model Test and Numerical Analysis


Abstract
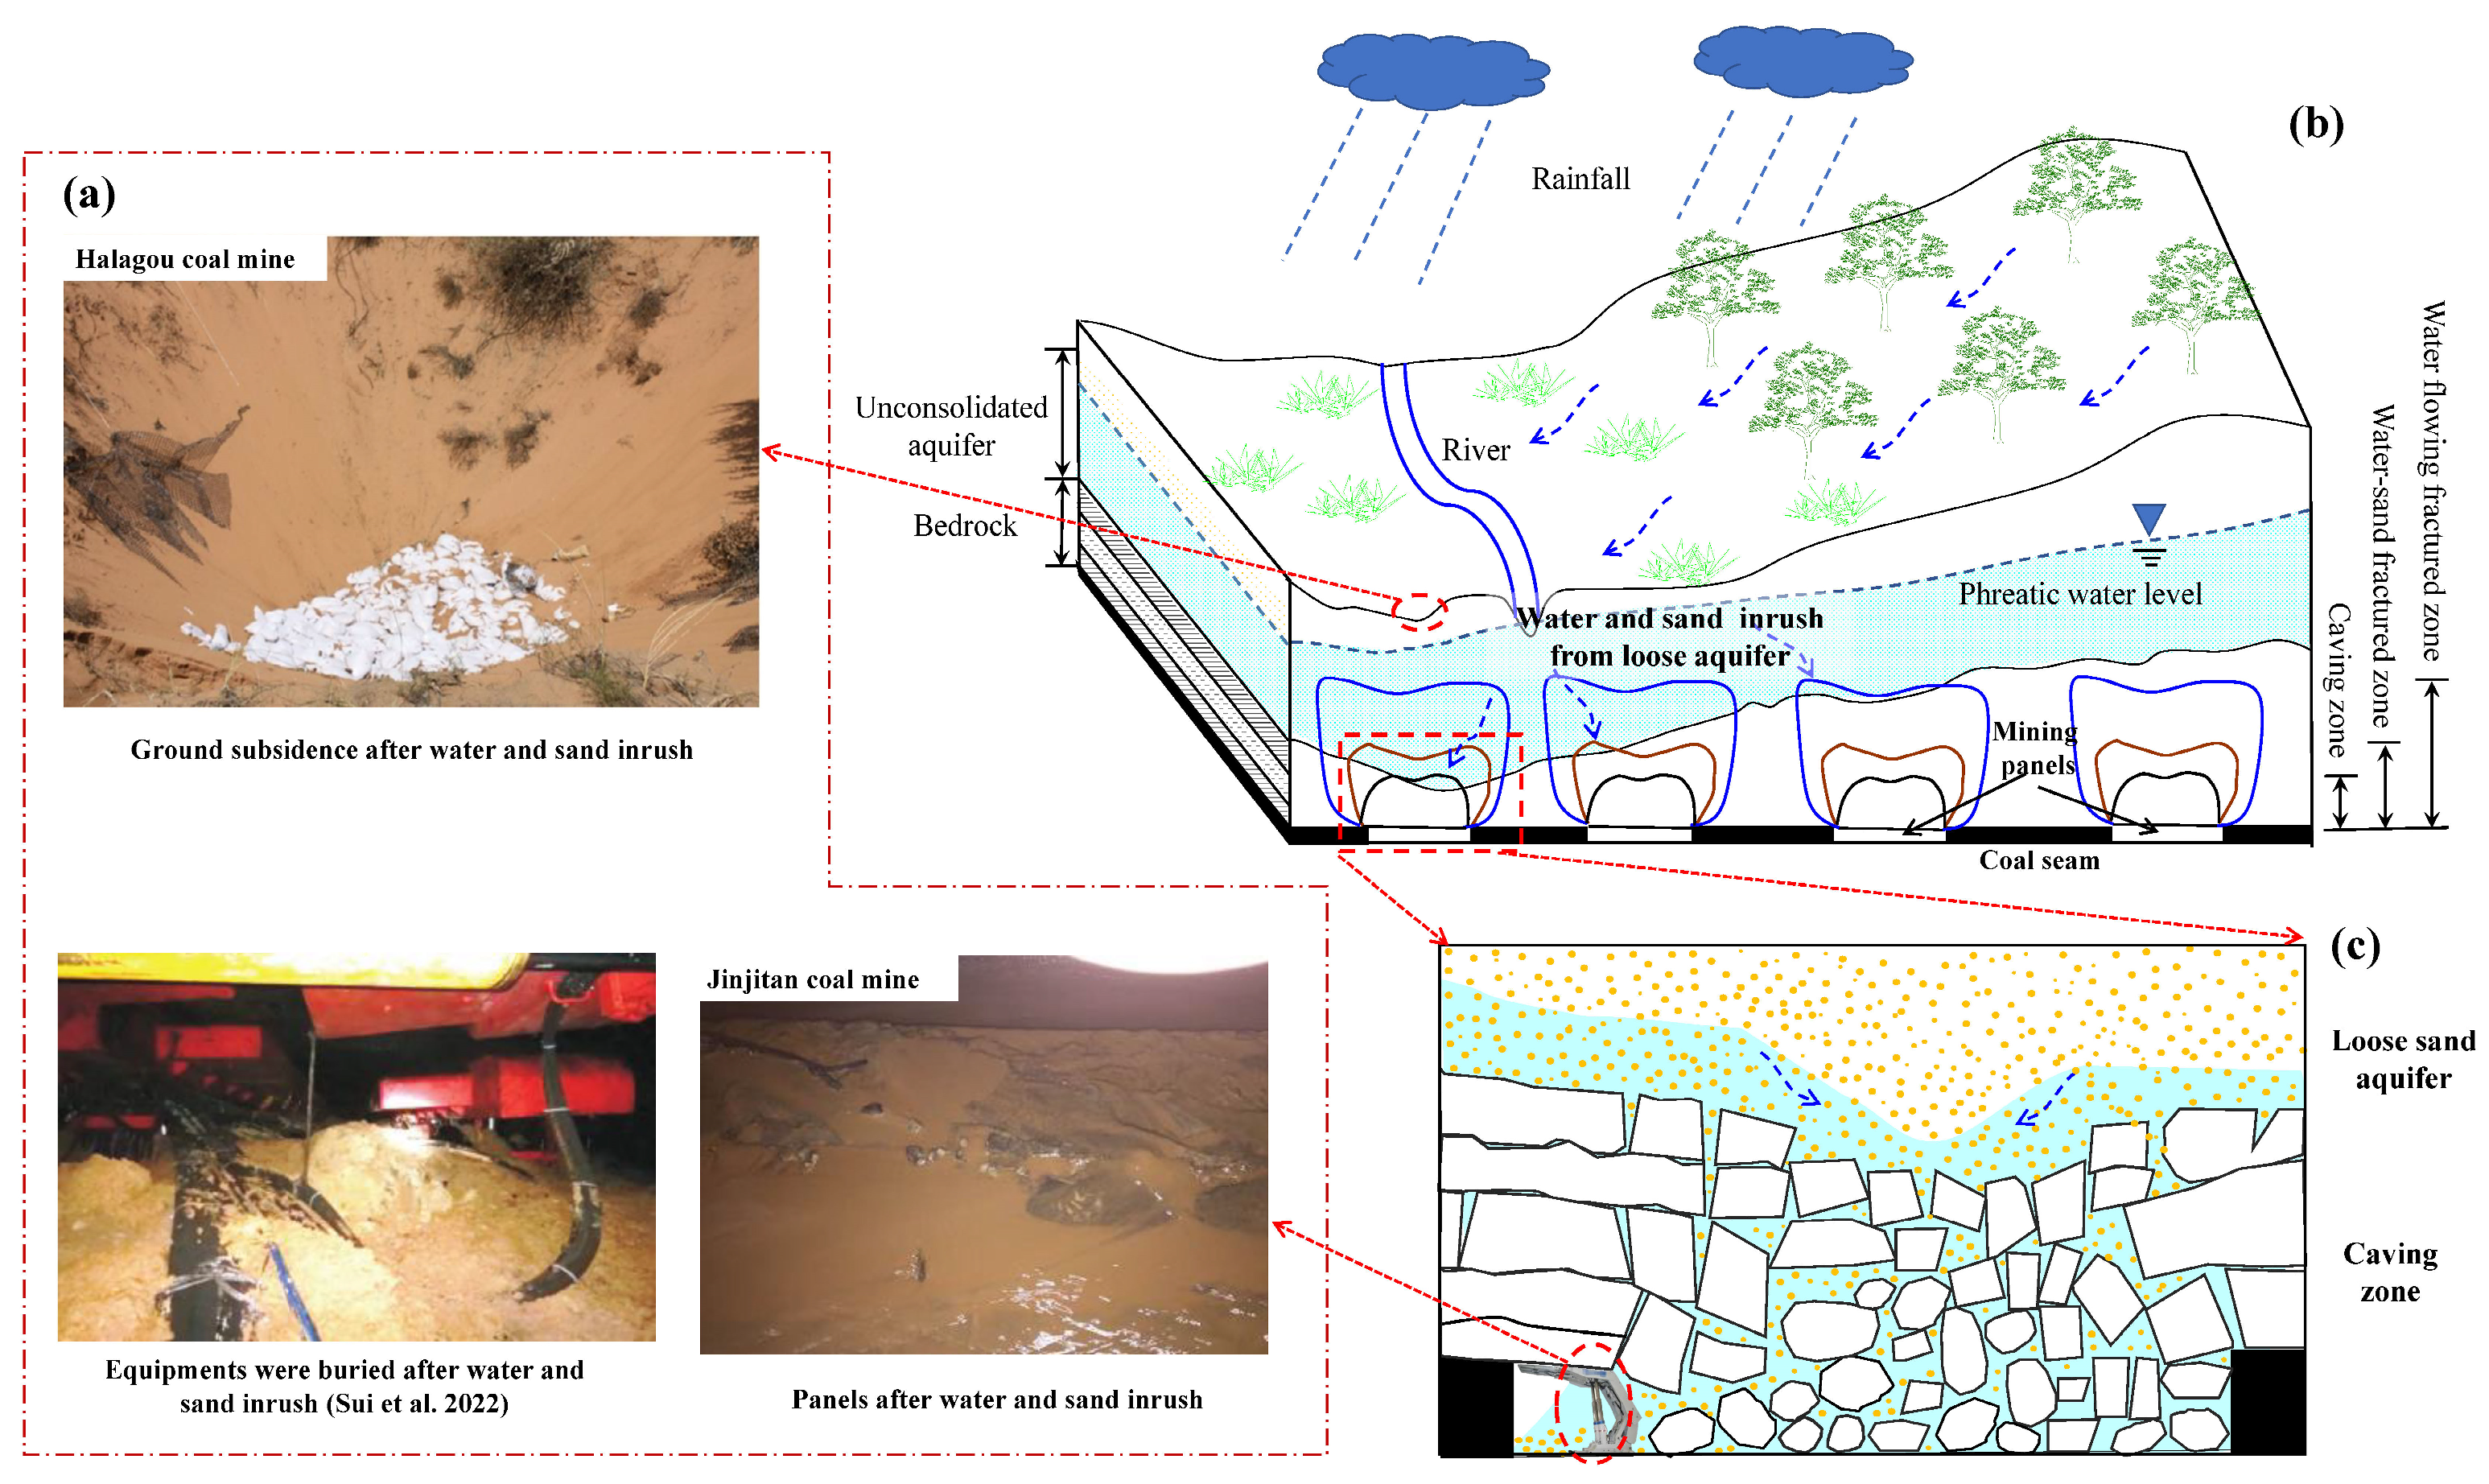
1. Introduction
2. Materials and Methods
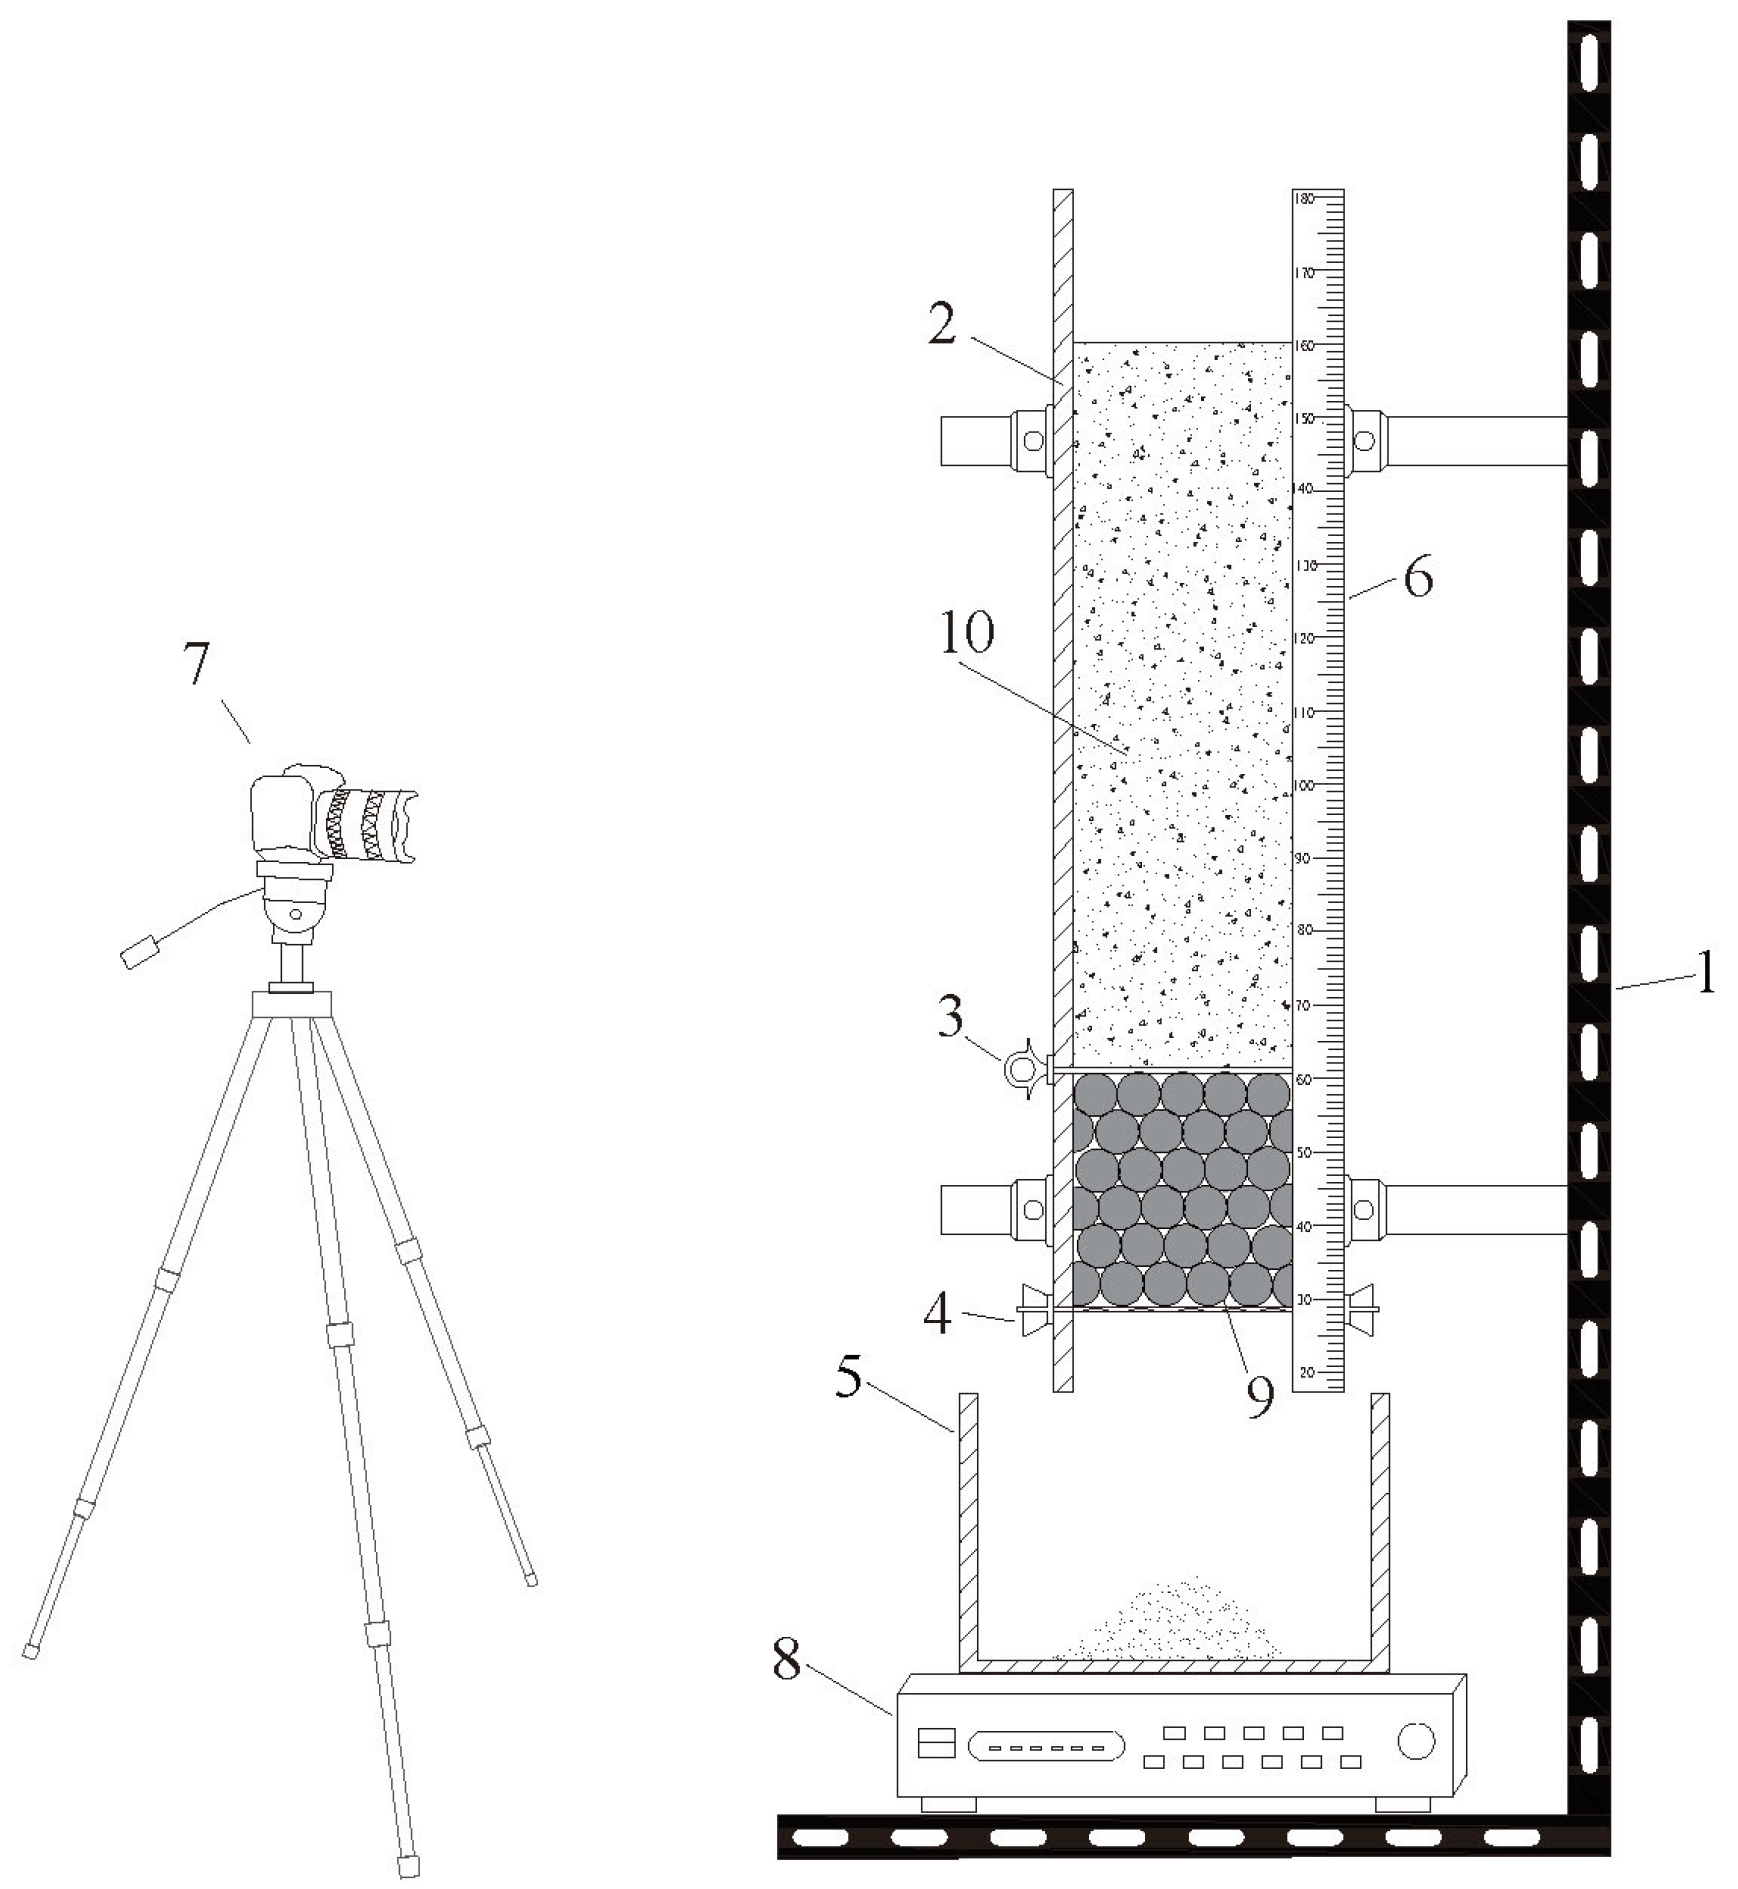
2.1. Experimental Setup
2.2. Materials
2.3. Experimental Procedure
- (1)
- Installation of the experimental setup. Firstly, fix the model box onto the bracket to guarantee that the device remains stable and vertically aligned. Next, sequentially fix the wire mesh according to the test requirements, adjust the switch, and place a measuring stick on the model box. Then, ensure the sealing of all parts of the experimental setup and adjust the camera to guarantee that it effectively captures the propagation of sand throughout the entire experimental process.
- (2)
- To ensure the stability of the test results, it is necessary to ensure that the dry density of each group of test sand is consistent, all of which are 1.57 g/cm3. Then, the sand column was constructed by manually compacting 10 layers of sand particles. After filling one layer, gently compact it with a compactor and then fill the next layer until the height reaches 800 mm. The arrangement of the glass beds is carried out in the closest possible way to ensure that the number of spheres placed in each layer is consistent, the porosity of the porous media in this study ranged approximately between 40% and 46%.
- (3)
- After the preparation steps, turn on the digital camera, switch, and electronic scale, following which the sand particle streams were recorded with the camera.
- (4)
- Once no more sand particles were flowing out from the caving zone, the experimental setup was thoroughly washed to eliminate any residual sand particles and prepare for the subsequent experiment.
3. Experimental Results and Discussion
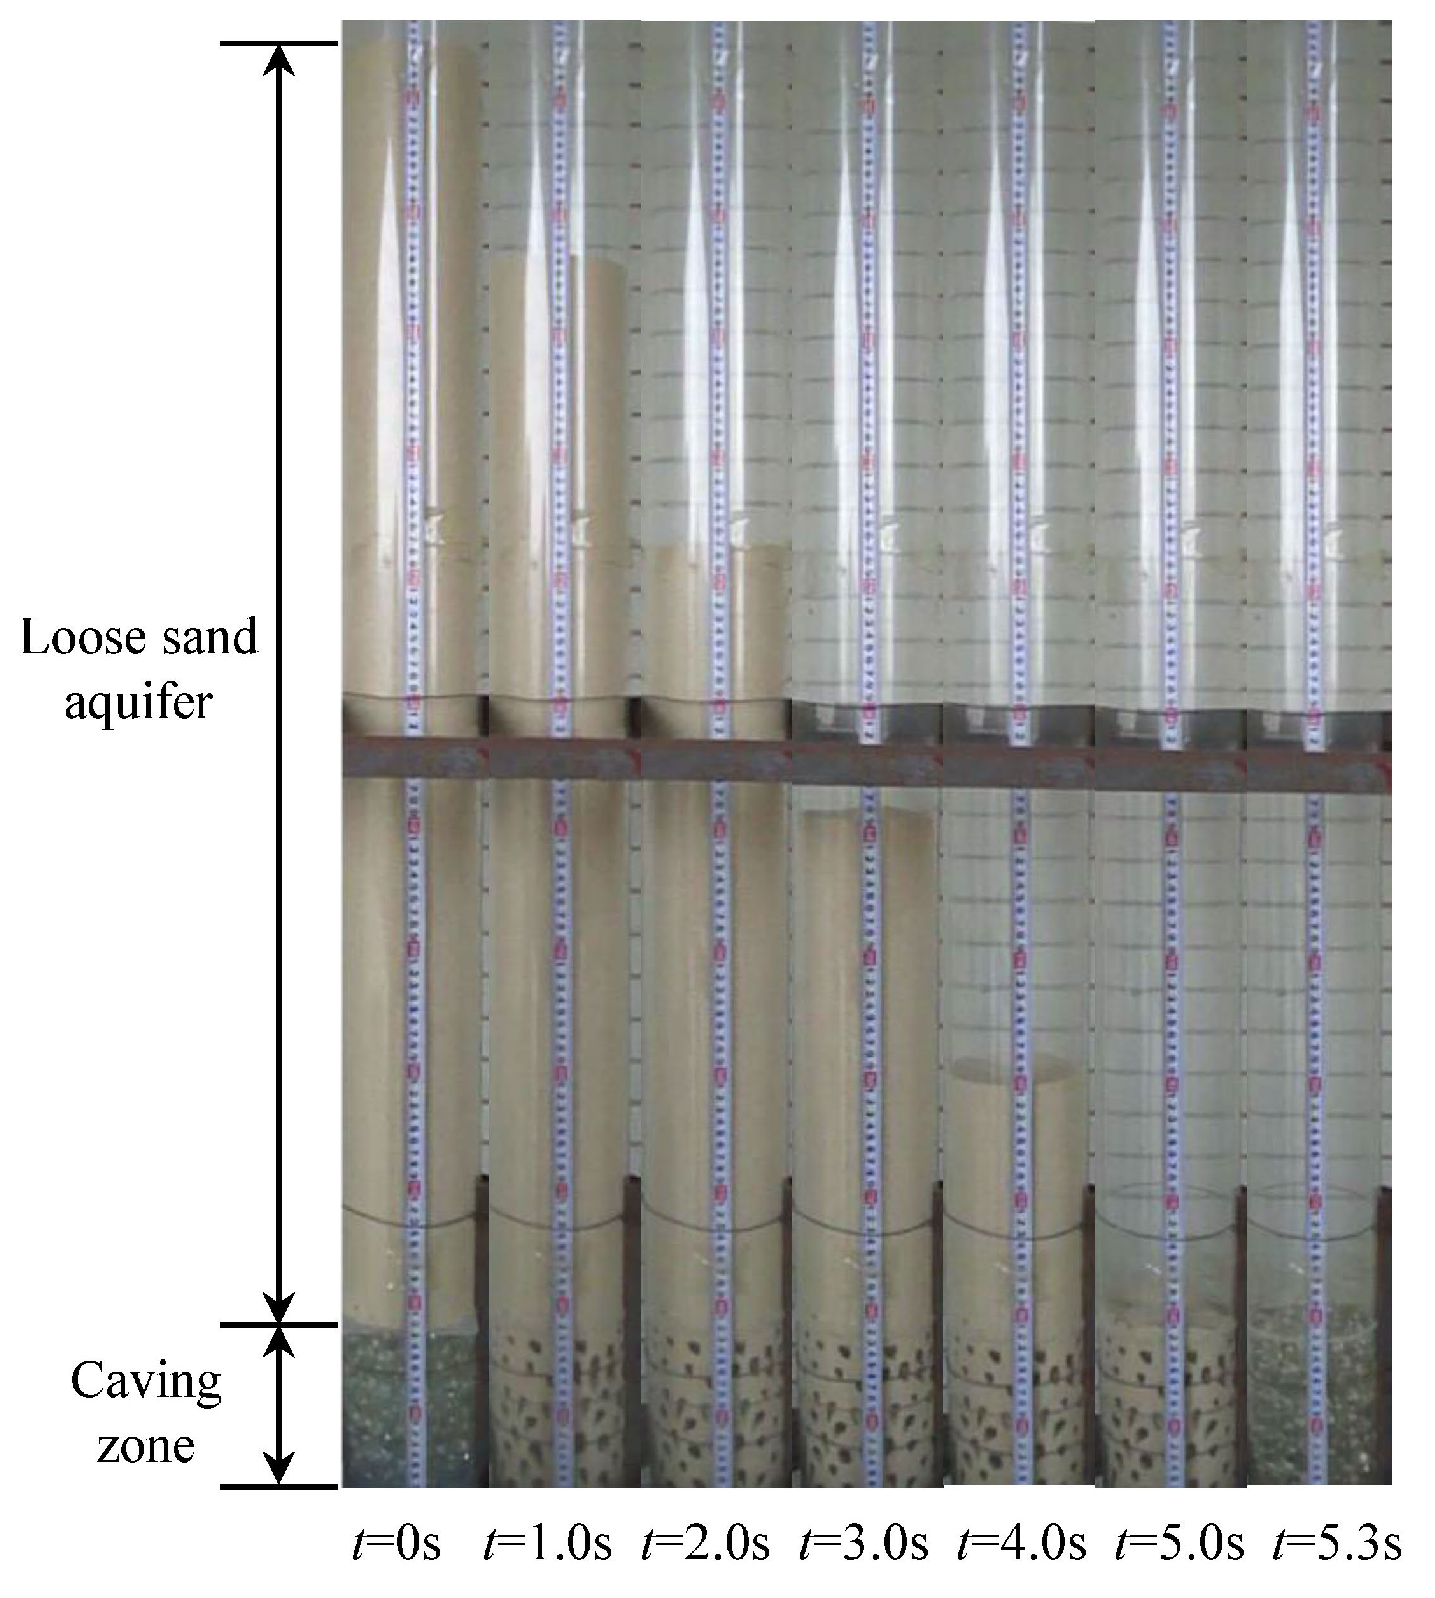
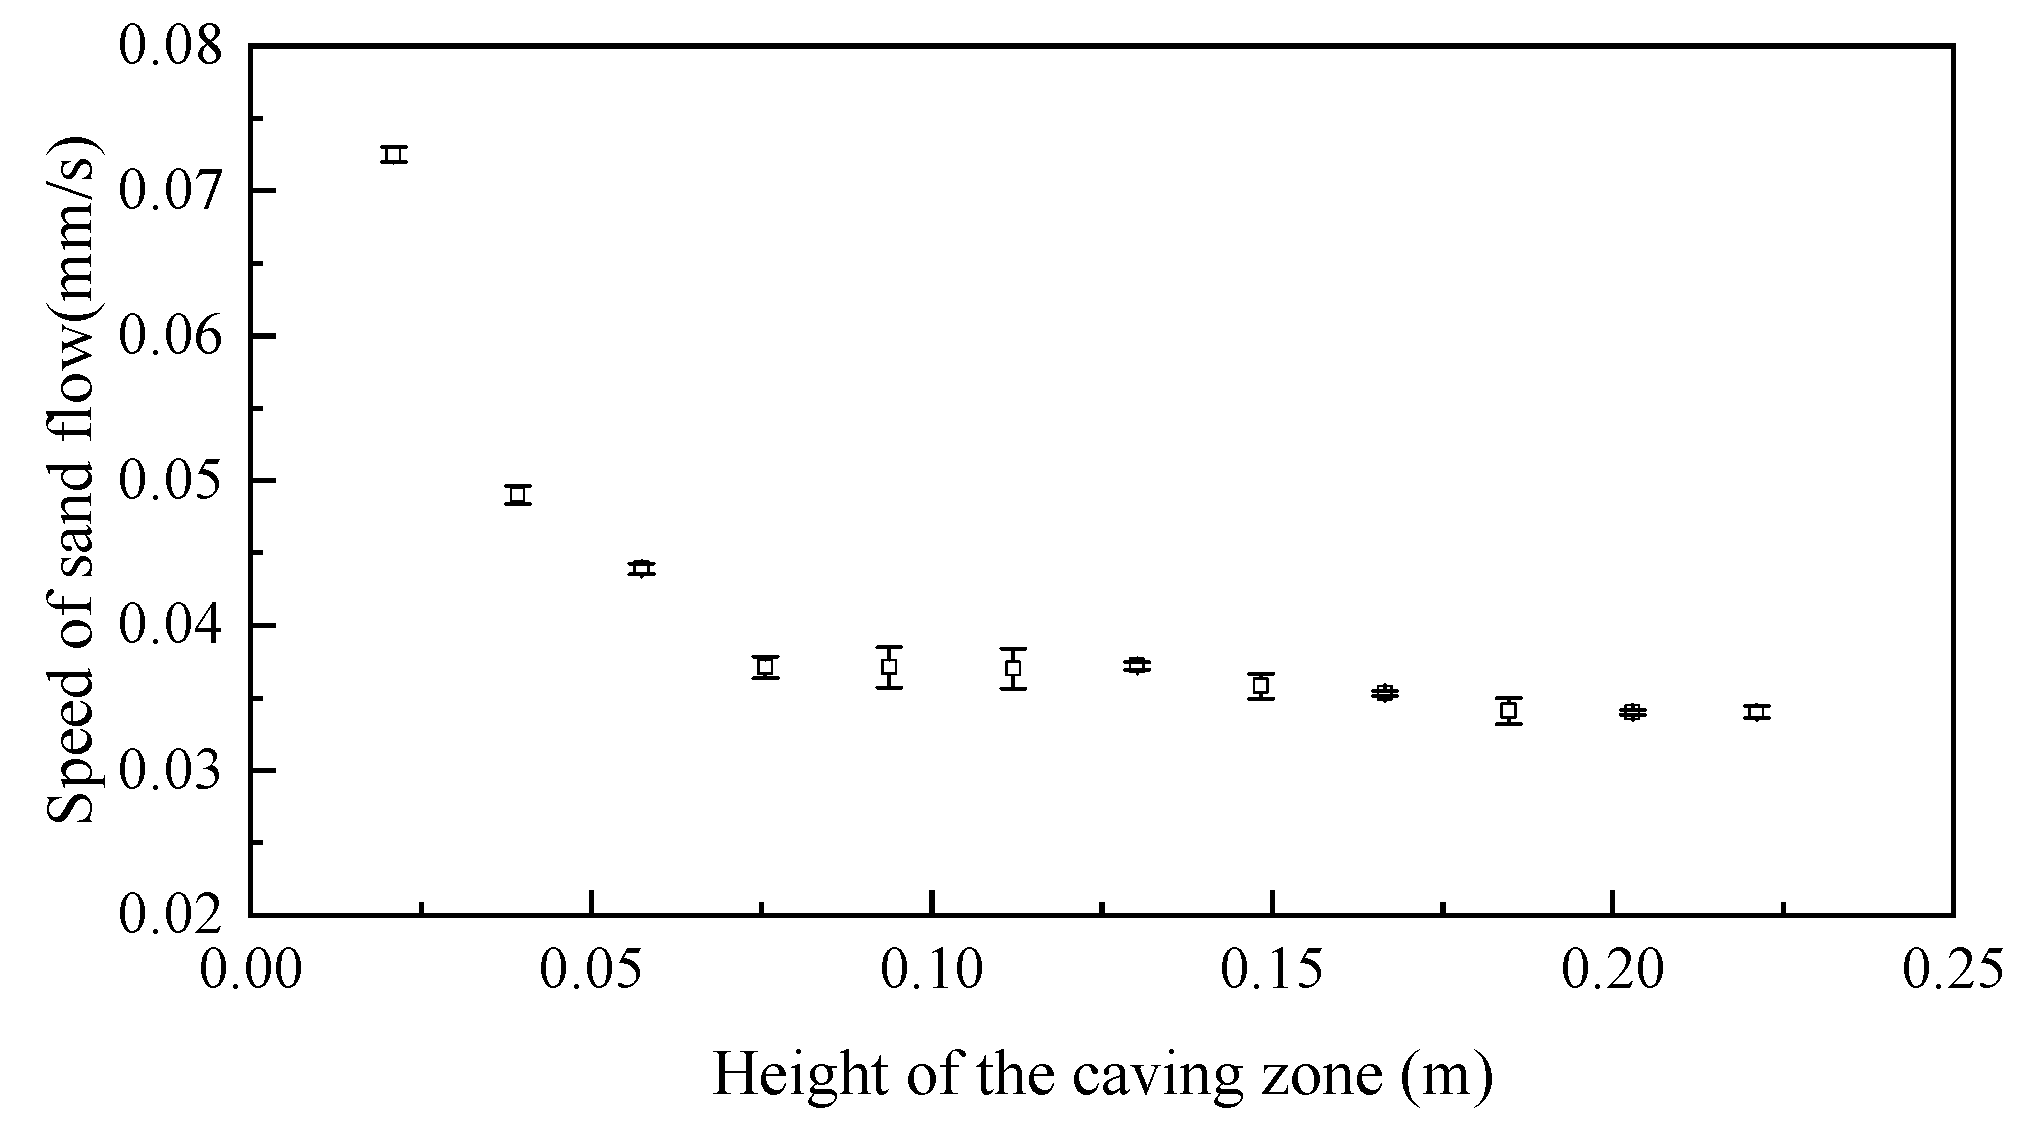
3.1. Influence of Caving Zone Height on Sand Flow Speed
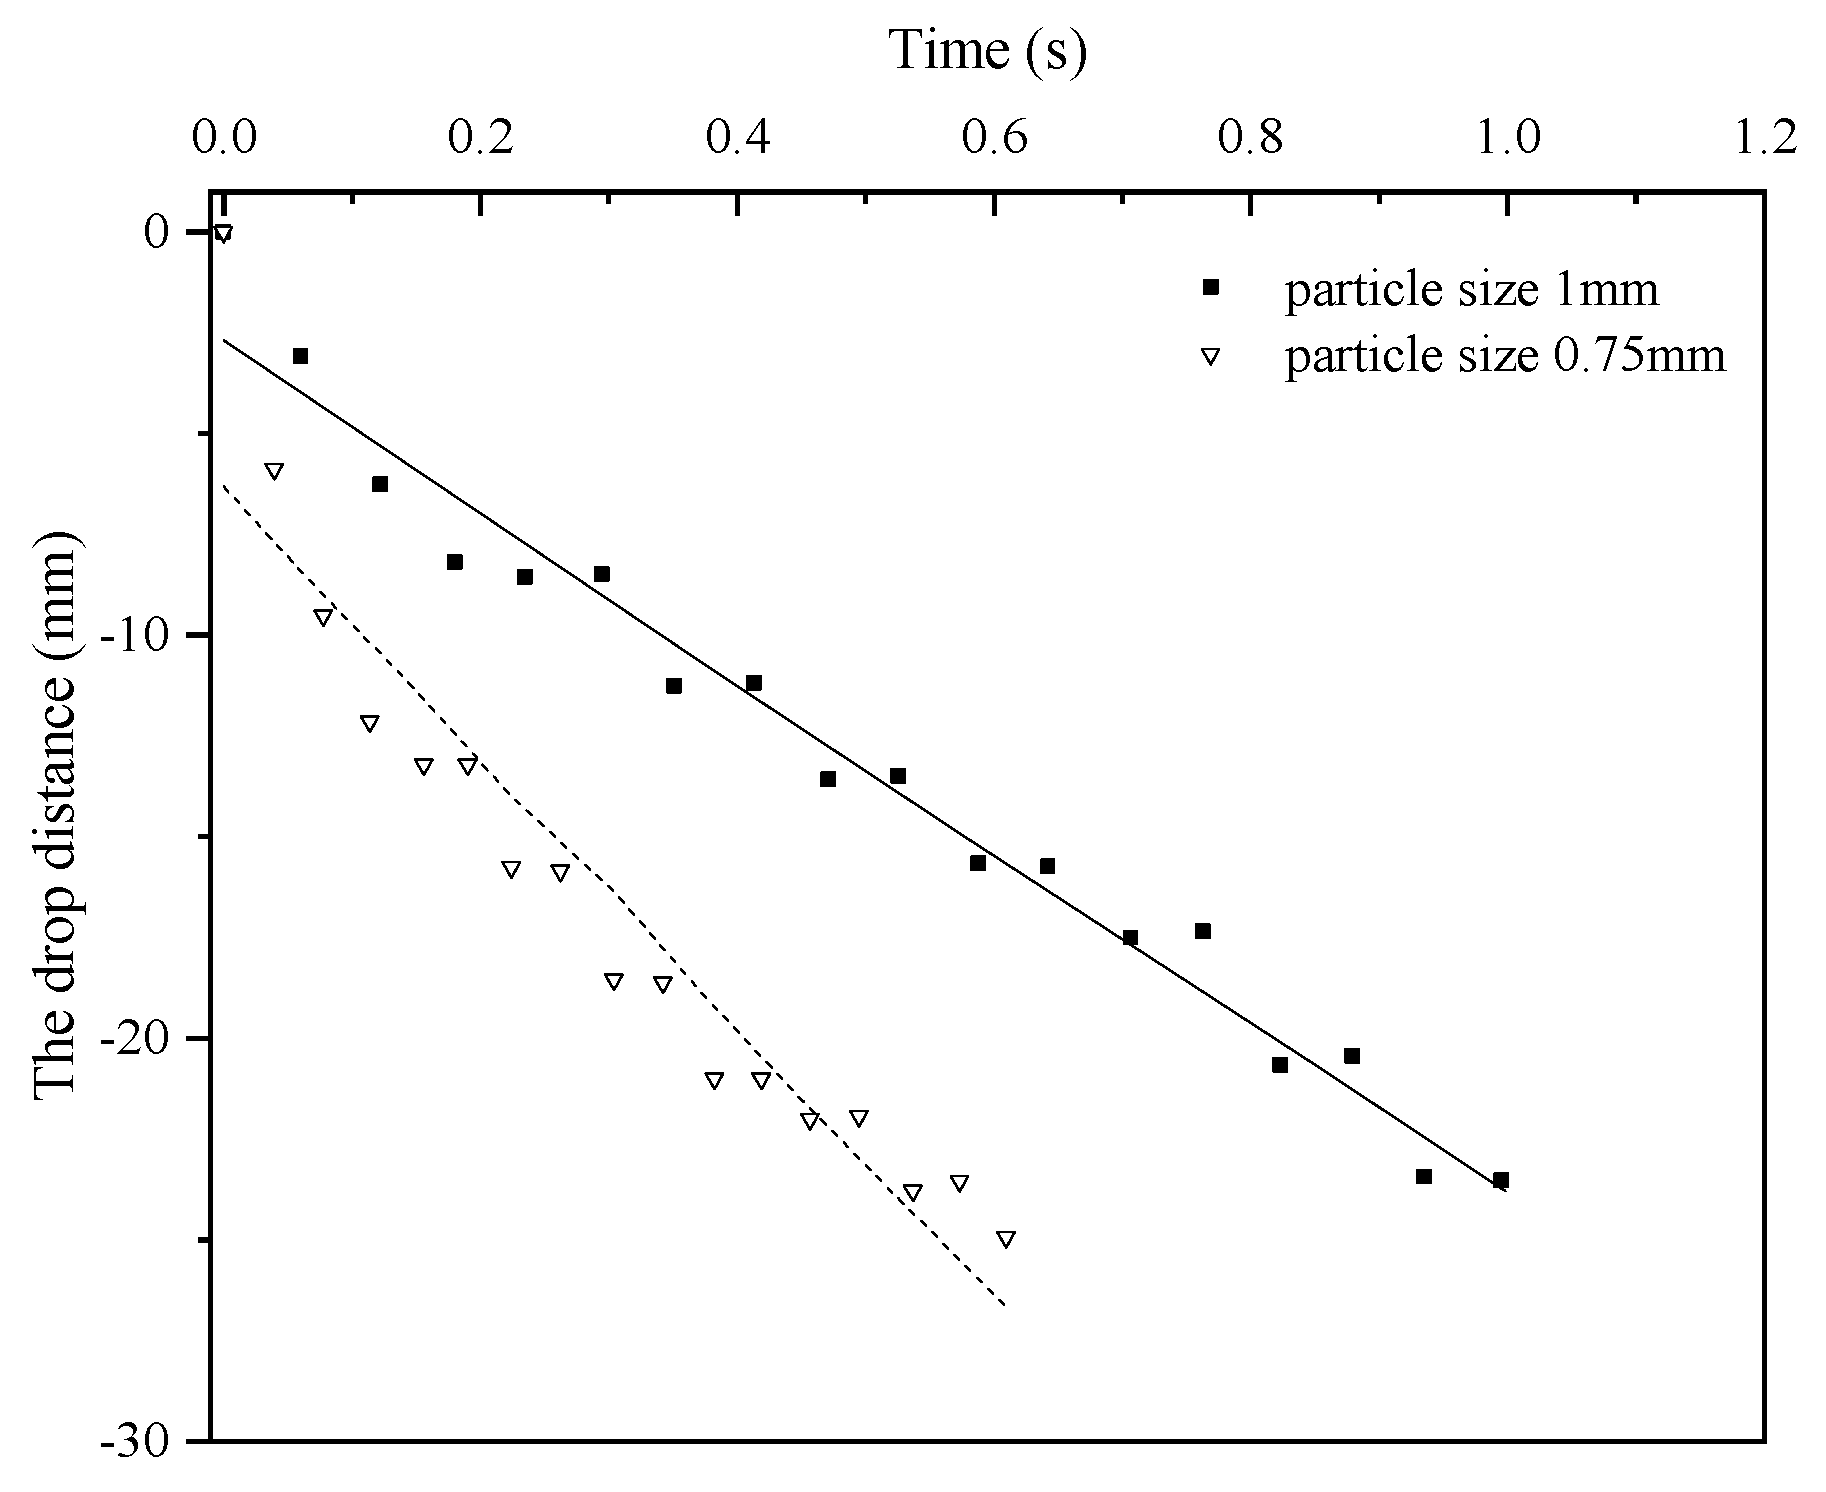
3.2. Influence of Sand Particle Size on Sand Flow Speed
4. Simulation Results and Discussion
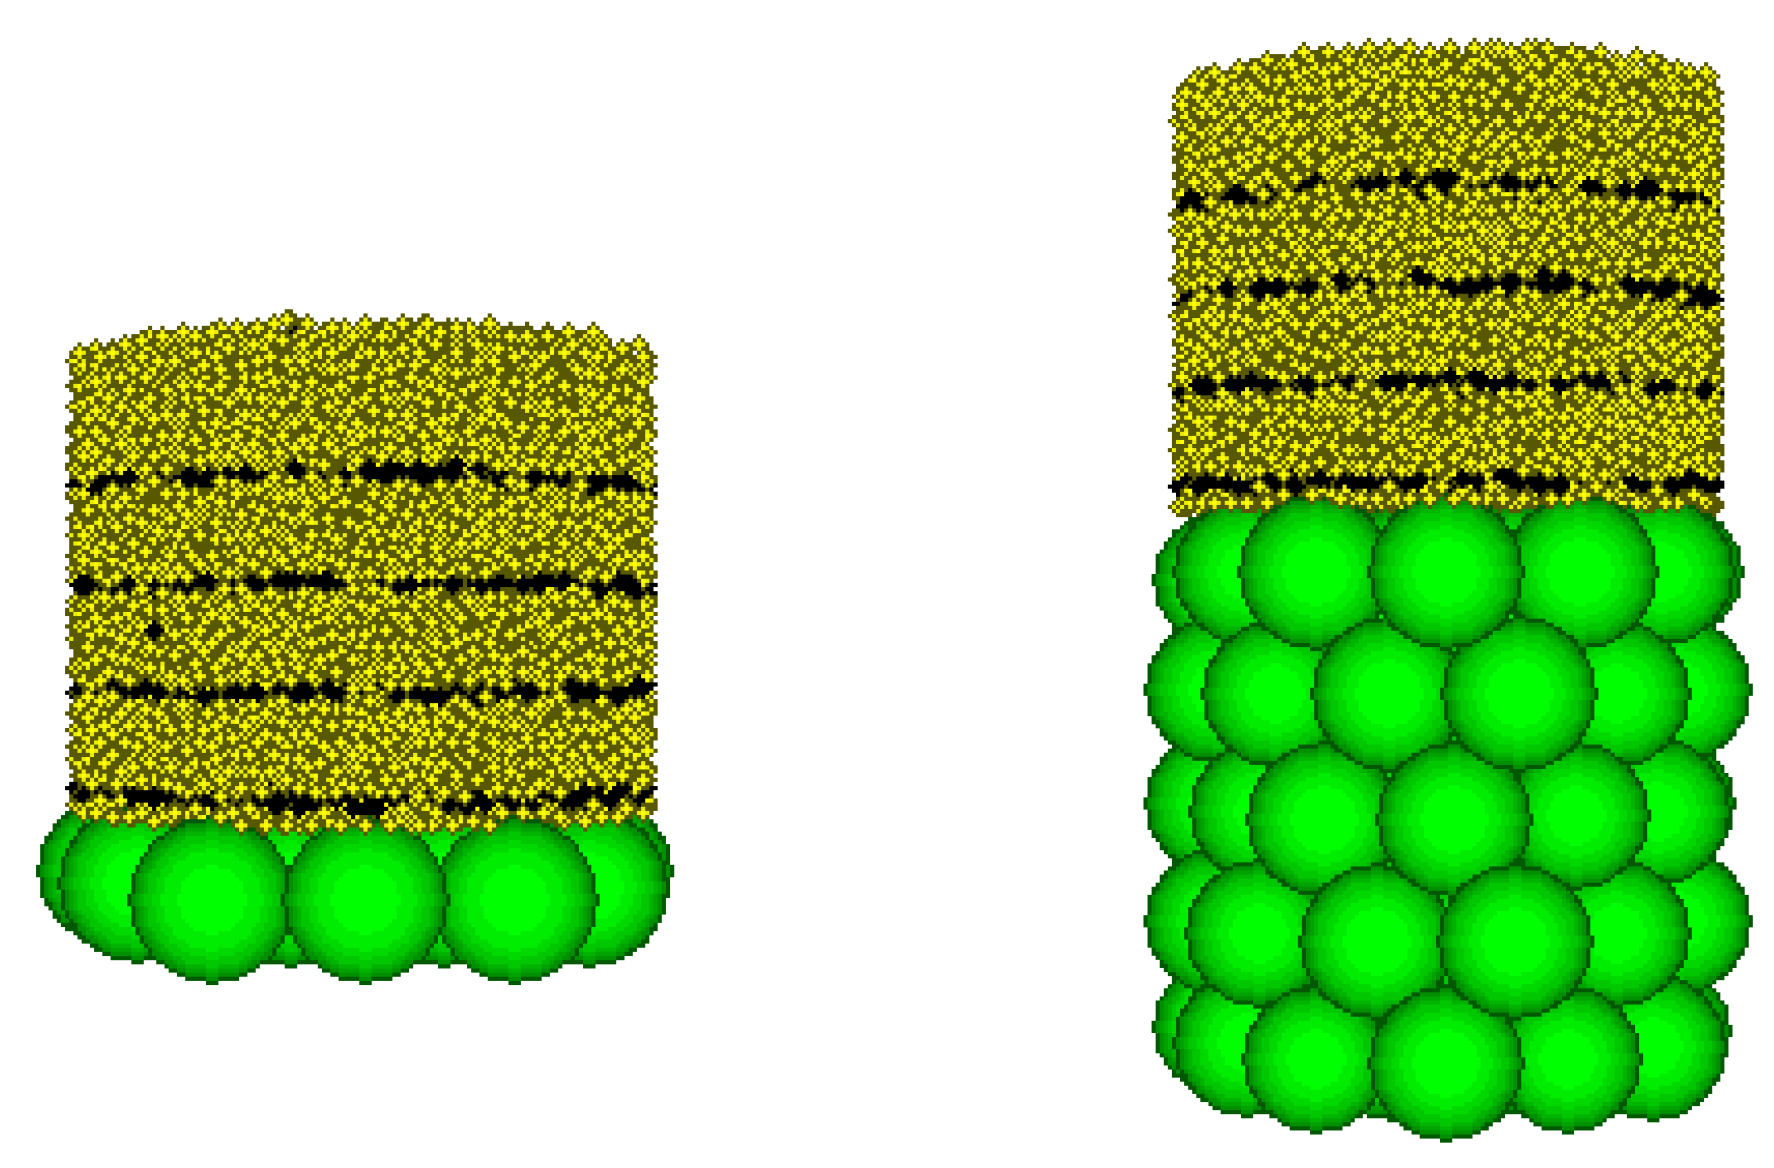
4.1. Numerical Model Establishment
4.2. Microscopic Parameter and Model Verification
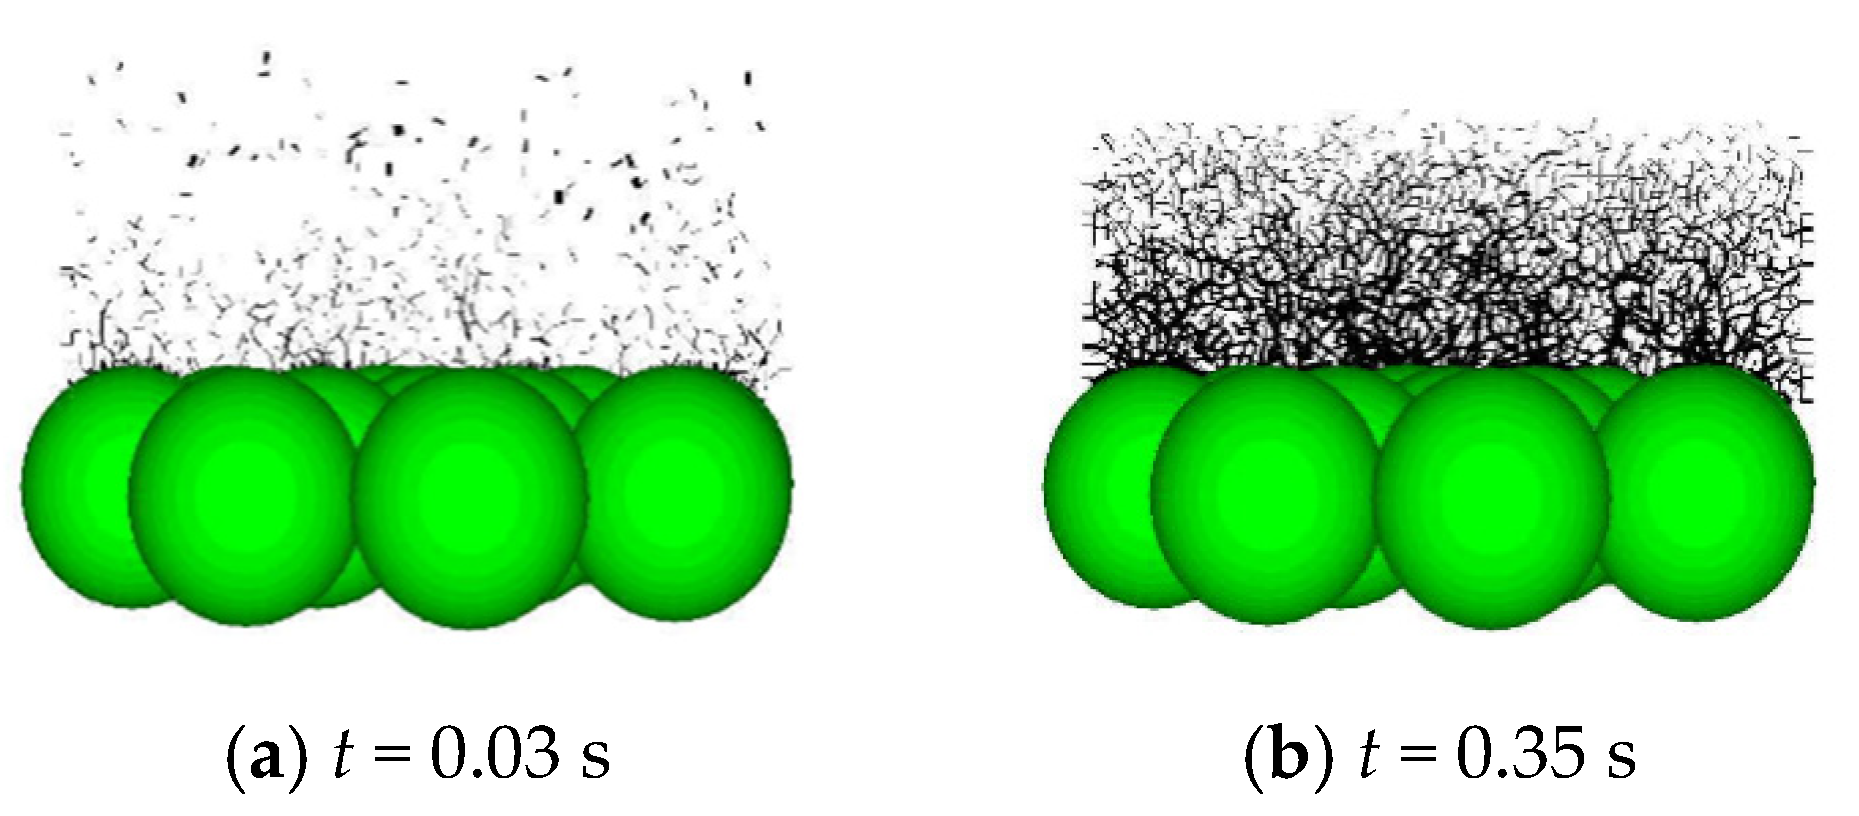
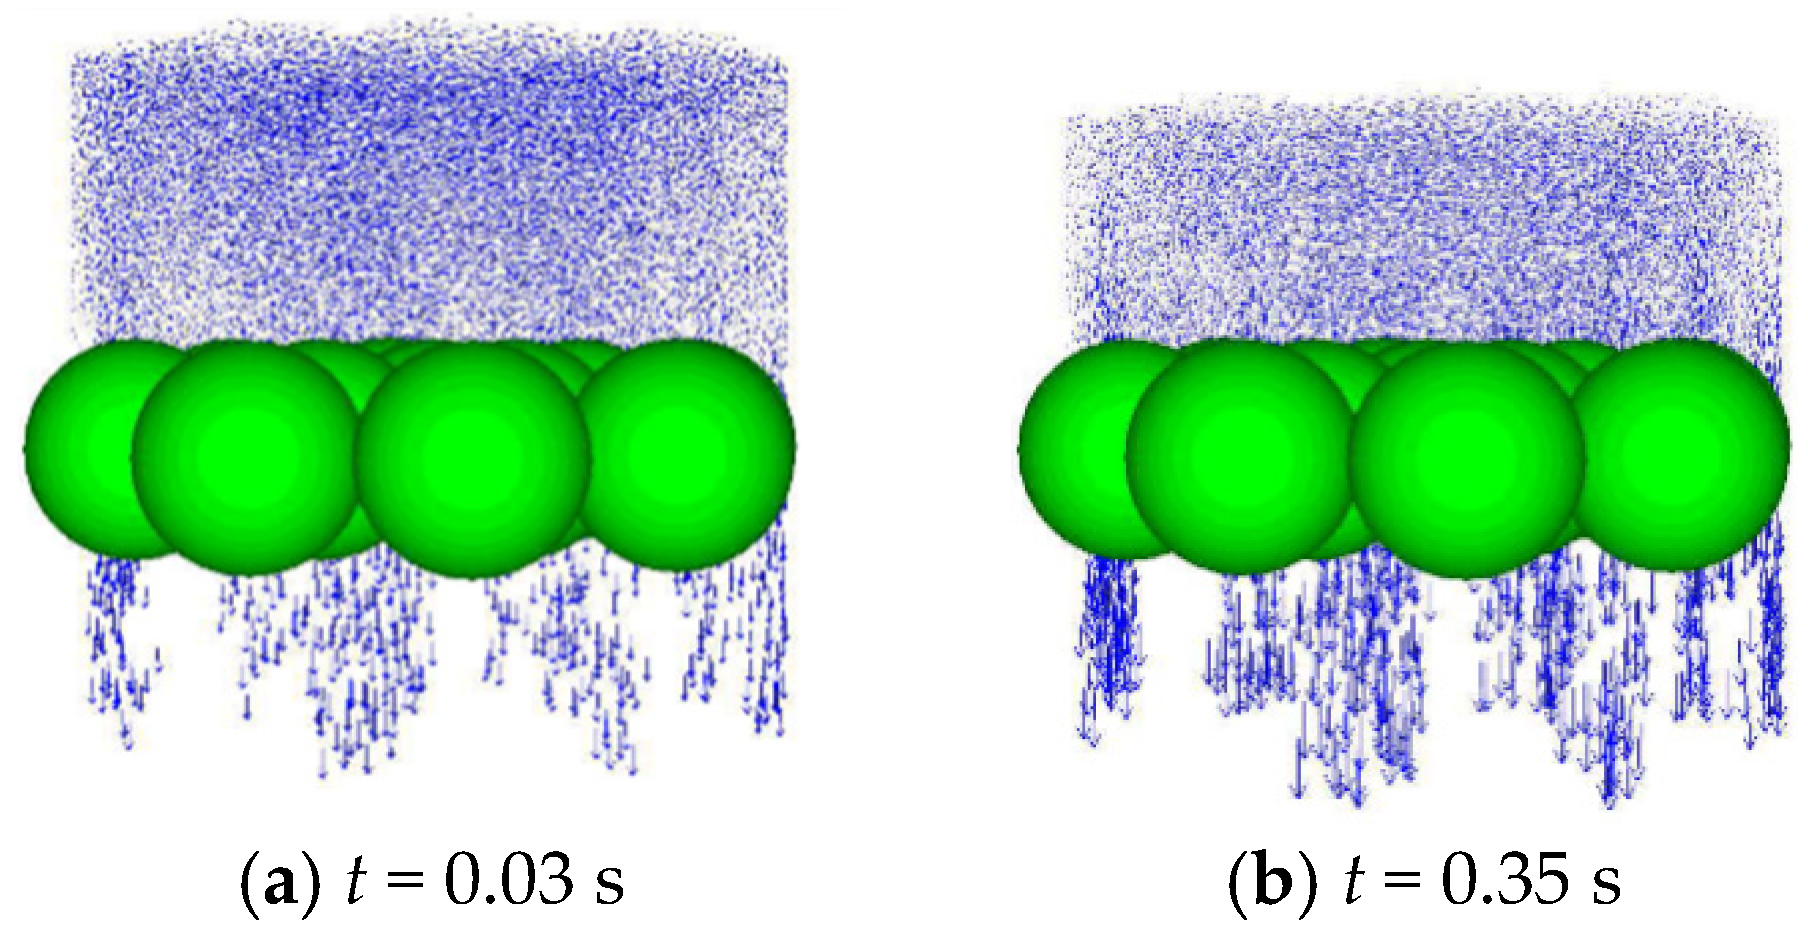
4.3. Microscopic Analysis
4.4. Discussion and Limitation
5. Conclusions
- (1)
- The sand flow speed decreases with the increase in the height of the caving zone until a certain threshold value is reached. After the height of the caving zone is higher than the threshold value, the speed of sand flow remains approximately constant. The trend in sand flow speed with respect to the height of the caving zone is fundamentally consistent with the trend of porosity with respect to the same height. In addition, the sand flow speed decreases with the increase in sand particle size, and for a given sand particle size, the speed of sand increases with the increase in the size of the broken rock mass.
- (2)
- The PFC3D was used to analyze the transport of sand particles during the sand flow process from a microscopic perspective. The results show that during the sand flow process, the overlying sand particles continuously move and the force chain undergoes dynamic changes. Furthermore, with the obstruction of the lower sphere, the sand particles continue to accumulate between the gaps of the porous medium, the force chain is gradually stable, and the speed of sand flow slows down.
- (3)
- During the process of sand flow, the speed and direction of sand particles change over time, which have certain characteristics of non-uniformity and discontinuity. However, due to the continuous supply of surrounding sand particles, the speed of the sand column is unchanged from a macro perspective.
Author Contributions
Funding
Data Availability Statement
Acknowledgments
Conflicts of Interest
References
- Islam, M.; Hayashi, D.; Kamruzzaman, A. Finite element modeling of stress distributions and problems for multi-slice longwall mining in Bangladesh, with special reference to the Barapukuria coal mine. Int. J. Coal Geol. 2009, 78, 91–109. [Google Scholar] [CrossRef]
- Vallejos, J.; Basaure, K.; Palma, S.; Castro, R. Methodology for evaluation of mud rush risk in block caving mining. J. S. Afr. Inst. Min. Metall. 2017, 117, 491–497. [Google Scholar] [CrossRef]
- Sui, W. Catastrophic mechanism of seepage deformation and mining rock mass and its prevention & control I: Water-sand mixture inrush form seam roof. J. Earth Sci. Environ. 2022, 44, 903–921. [Google Scholar]
- Araffa, S.; Gobashy, M.; Khalil, M. Integration of geophysical techniques to detect geotechnical hazards: A case study in Mokattam, Cairo, Egypt. Bull. Eng. Geol. Environ. 2021, 80, 8021–8041. [Google Scholar] [CrossRef]
- Li, W.; Liu, Y.; Li, S.; Ma, L.; Yue, L.; Wang, J. Experimental and Numerical Studies of Water-Sand Flow in Fractured Porous Media. Rock Mech. Rock Eng. 2024. [Google Scholar] [CrossRef]
- Xue, Y.; Kong, F.; Qiu, D.; Su, M.; Zhao, Y.; Zhang, K. The classifications of water and mud/rock inrush hazard: A review and update. Bull. Eng. Geol. Environ. 2021, 80, 1907–1925. [Google Scholar] [CrossRef]
- Qian, Z.; Jiang, Z.; Guan, Y.; Yue, N. Mechanism and remediation of water and sand mixture inrush induced in an inclined shaft by large-tonnage vehicles. Mine Water Environ. 2019, 37, 849–855. [Google Scholar] [CrossRef]
- Liang, Y.; Sui, W.; Jiang, T.; Shen, X. Experimental investigation on the transport behavior of a sand/mud/water mixture through a mining-induced caving zone. Mine Water Environ. 2022, 77, 153–164. [Google Scholar] [CrossRef]
- Dong, S.; Liu, Z.; Wang, H. Research status and Prospect on the mechanism of dynamic sand inrush at weakly cemented strata in working face with thick bedrock. J. Chin. Coal Soc. 2022, 47, 274–285. [Google Scholar]
- Zhang, S.; Li, Y.; Li, J.; Yang, W.; Wang, G.; Wen, Z. Experimental studies on variation characteristics of physical parameters during water and sand burst through mining fractures. J. Chin. Coal Soc. 2020, 45, 182–189. [Google Scholar]
- China Central Television. Water and Sand Mixture Inrush Hazard. Occurred in Haojialiang Coal Mine in Yulin Shanxi. 2021. Available online: https://news.cctv.com/2021/07/16/ARTIZ3hTbE9ULARMERFHt52o210716.shtml (accessed on 16 July 2021).
- Dong, S.; Ji, Y.; Wang, H.; Zhao, B.; Cao, H.; Liu, Y.; Liu, Y.; Ji, Z.; Liu, B. Prevention and control technology and application of roof water disaster in Jurassic coal field of Ordos Basin. J. Chin. Coal Soc. 2020, 45, 2367–2375. [Google Scholar]
- Xu, Y.; Luo, Y.; Li, J.; Li, K.; Cao, X. Water and sand inrush during mining under thick unconsolidated layers and thin bedrock in the Zhaogu No. 1 coal mine, China. Mine Water Environ. 2018, 37, 336–345. [Google Scholar] [CrossRef]
- Wang, H.; Chen, S.; Guo, W. Development and application of test system for water-sand inrush. J. Min. Saf. Eng. 2019, 36, 72–79. [Google Scholar]
- Zhang, G.; Wang, R.; Ma, J.; Lyu, W.; Zhang, W.; Wang, H. Study on solid-fluid coupling similarity simulation test of water-sand inrush during mining of shallow buried thin bedrock roof. Coal Sci. Technol. 2024, 52, 165–175. [Google Scholar]
- Sui, W.; Cai, G.; Dong, Q. Experimental research on critical percolation gradient of quicksand across overburden fissures due to coal mining near unconsolidated soil layers. Chin. J. Rock Mech. Eng. 2007, 26, 2084–2091. [Google Scholar]
- Yang, W.; Jin, L.; Zhang, X. Simulation test on mixed water and sand mixture inrush disaster induced by mining under the thin bedrock. J. Loss Prev. Process Ind. 2019, 57, 1–6. [Google Scholar] [CrossRef]
- Zhang, G.; Zhang, K.; Wang, L. Mechanism of water inrush and quicksand movement induced by a borehole and measures for prevention and remediation. Bull. Eng. Geol. Environ. 2015, 74, 1395–1405. [Google Scholar] [CrossRef]
- Yuan, K.; Yu, B.; Zhang, M.; Yang, Y.; Yu, H. Investigating the dynamics of water-sand mixing inrush in viscous sand layers: Insights from laboratory experiments. Nat. Hazards 2024, 120, 9713–9734. [Google Scholar] [CrossRef]
- Zheng, G.; Dai, X.; Zhang, X. Experimental study and numerical simulation of leaking process of water and sand in underground engineering. Chin. J. Rock. Mech. Eng. 2014, 12, 2458–2471. [Google Scholar]
- Xu, J.; Pu, H.; Chen, J.R.; Sha, Z. Experimental study on sand inrush hazard of water-sand two phase flow in broken rock mass. Geofluids 2021, 2021, 5542440. [Google Scholar] [CrossRef]
- Zhong, J.; Zhou, H.; Zhao, Y.; Liu, Y.; Yang, H.; Xue, D. The two-phase flow of water-sand inrush under shallow coal seam mining: A coupled numerical study. Eng. Mech. 2017, 34, 229–238. [Google Scholar]
- Du, F.; Jiang, G.; Chen, Z. A numerical simulation study of the migration law of water-sand two-phase flow in broken rock mass Geofluids. Geofluids 2018, 2018, 6418476. [Google Scholar] [CrossRef]
- Pu, H.; Guo, S.; Liu, D.; Xu, J.; Wang, J. Study on laws of water inrush and sand burst migration based on LBM-DEM coupling method. Coal Sci. Technol. 2021, 49, 206–216. [Google Scholar]
- Ma, D.; Duan, H.; Zhang, J.; Liu, X.; Li, Z. Numerical simulation of water-silt inrush hazard of fault rock: A three-phase flow model. Rock Mech. Rock Eng. 2022, 55, 5163–5182. [Google Scholar] [CrossRef]
- Ma, D.; Duan, H.; Liu, X.; Ma, X.; Tao, M. Water-sediment two-phase flow inrush hazard in rock fractures of overburden strata during coal mining. Mine Water Environ. 2020, 39, 308–319. [Google Scholar] [CrossRef]
- Chen, J.; Pu, H.; Xiao, C.; Liu, G. Experimental study of impact of deformation history on water-sand seepage characteristics of broken rock. J. Min. Safe Eng. 2016, 33, 329–335. [Google Scholar]
- Du, F.; Cao, Z.; Li, Z. Research progress of two-phase water-sand flow characteristics in crushed rock mass. Coal Sci. Technol. 2018, 46, 48–53. [Google Scholar]
- Zhang, B.; He, Q.; Lin, Z.; Li, Z. Experimental study on the flow behaviour of water-sand mixtures in fractured rock specimens. Int. J. Min. Sci. Technol. 2021, 31, 377–385. [Google Scholar] [CrossRef]
- Yang, B.; Yang, T.; Xu, Z.; Liu, H.; Yang, X.; Shi, W. Impact of particle-size distribution on flow properties of a packed column. J. Hydrol. Eng. 2019, 24, 04018070. [Google Scholar] [CrossRef]
- Chen, B.; Zhang, S.; Li, Y.; Li, J. Experimental study on water and sand mixture inrush of mining cracks in loose layers with different clay contents. Bull. Eng. Geol. Environ. 2021, 80, 663–678. [Google Scholar] [CrossRef]
- Zhang, C.; Zhao, Y.; Tu, S.; Zhang, T. Numerical simulation of compaction and re-breakage characteristics of coal and rock samples in goaf. Chin. J. Geotech. Eng. 2020, 42, 696–704. [Google Scholar]
- Sui, W.; Liang, Y.; Zhang, X.; Ravi, J.; Zhu, T. An experimental investigation on the speed of sand flow through a fixed porous bed. Sci. Rep. 2017, 7, 41398. [Google Scholar] [CrossRef] [PubMed]
- Campbell, C.; Brennen, C. Computer simulation of granular shear flows. J. Fluid Mech. 1985, 151, 167–188. [Google Scholar] [CrossRef]
- Zhou, J.; Yao, Z.; Zhang, G. Research on piping mechanism sandy soils based on discrete element theory. Chin. J. Rock Mech. Eng. 2008, 27, 749–756. [Google Scholar]
- Lu, J.; Pu, H.; Chen, J. Simulation of mine water and sediment inrush based on particle flow method. Coal Technol. 2017, 36, 185–187. [Google Scholar]
- Liang, Y.; Sui, W.; Zhu, T.; Zhang, X. Numerical simulation of quicksand through the broken rocks in caving zone due to coal mining based on DEM. J. Chin. Coal Soc. 2017, 42, 470–476. [Google Scholar]
- Li, N.; Gao, Y. PFC simulation on triaxial shear test of transparent sand. J. Eng. Geol. 2011, 19, 311–317. [Google Scholar]
- Ahfir, N.; Wang, H.; Benamar, A.; Alem, A.; Massei, N.; Dupont, J. Transport and deposition of suspended particles in saturated porous media: Hydrodynamic effect. Hydrogeol. J. 2007, 15, 659–668. [Google Scholar] [CrossRef]
- Sun, D. Hydrodynamics and effect of velocity on particle filtration due to bridging in water-saturated porous media using CFD-DEM simulation. Environ. Sci. Pollut. Res. 2023, 30, 100124–100136. [Google Scholar] [CrossRef]
- Ahfir, N.; Hammadi, A.; Alem, A.; Wang, H.; Bras, G.; Ouahbi, T. Porous media grain size distribution and hydrodynamic forces effects on transport and deposition of suspended particles. J. Environ. Sci. 2017, 53, 161–172. [Google Scholar] [CrossRef]
- Feng, Q.; Cha, L.; Da, C.; Zhang, G.; Wang, S. Effect of particle size and concentration on the migration behavior in porous media by coupling computational fluid dynamics and discrete element method. Powder Technol. 2020, 360, 704–714. [Google Scholar] [CrossRef]
- Fo, B.; Xu, R.; Xi, J.; Yang, L.; Song, X.; Cai, J.; Gu, Z. Numerical simulation of fine particle liquid–solid flow in porous media based on LBM-IBM-DEM. Can. J. Chem. Eng. 2022, 101, 3576–3591. [Google Scholar] [CrossRef]
- Biswas, D.; Kartha, S. Conceptual modeling of temperature effects on capillary pressure in dead-end pores. Sādhanā 2019, 44, 117. [Google Scholar] [CrossRef]
- Hong, S.; Dinh, L.; Abuzar, S.; Lee, E.; Hwang, S. Synthesis of celecoxib-eutectic mixture particles via supercritical CO2 Process and celecoxib immediate release tablet formulation by quality by design approach. Pharmaceutics 2022, 14, 1549. [Google Scholar] [CrossRef]
- Fjaestad, D.; Tomac, I. Experimental investigation of sand proppant particles flow and transport regimes through narrow slots. Powder Technol. 2019, 343, 495–511. [Google Scholar] [CrossRef]


| Sand Particle Size (mm) | Specific Gravity | Internal Friction Angle (°) | Dry Density (g/cm3) |
|---|---|---|---|
| 1–2 | 2.66 | 43.3 | 1.57 |
| 0.5–1 | 2.66 | 41.1 | 1.57 |
| 0.1–0.5 | 2.67 | 40 | 1.57 |
| Parameter | Value |
|---|---|
| Particle density (kg/m3) | 1570 |
| Particle friction coefficient, μ | 0.6 |
| Filling material porosity, n | 0.4 |
| Normal contact stiffness of particles, kn (MPa) | 30 |
| Tangential contact stiffness of particles, ks (MPa) | 1.5 |
| Method | Height of Caving Zone (mm) | Particle Size of Sand (mm) | Sand Flow Speed (mm/s) |
|---|---|---|---|
| Simulation | 25 × 1 | 2 | 75.9 |
| 1 | 100.2 | ||
| 0.75 | 104.4 | ||
| 25 × 5 | 2 | 6.7 | |
| 1 | 21.1 | ||
| 0.75 | 33.7 | ||
| Experiment | 150 | 1–2 | 19 |
| 0.5–1 | 30 |
Disclaimer/Publisher’s Note: The statements, opinions and data contained in all publications are solely those of the individual author(s) and contributor(s) and not of MDPI and/or the editor(s). MDPI and/or the editor(s) disclaim responsibility for any injury to people or property resulting from any ideas, methods, instructions or products referred to in the content. |
© 2024 by the authors. Licensee MDPI, Basel, Switzerland. This article is an open access article distributed under the terms and conditions of the Creative Commons Attribution (CC BY) license (https://creativecommons.org/licenses/by/4.0/).
Share and Cite
Liang, Y.; Yuan, S.; Ma, S.; Han, G.; Shi, J. Migration of Water and Sand Inrush through the Mining-Induced Caving Zone: Insights from Model Test and Numerical Analysis. Water 2024, 16, 2527. https://doi.org/10.3390/w16172527
Liang Y, Yuan S, Ma S, Han G, Shi J. Migration of Water and Sand Inrush through the Mining-Induced Caving Zone: Insights from Model Test and Numerical Analysis. Water. 2024; 16(17):2527. https://doi.org/10.3390/w16172527
Chicago/Turabian StyleLiang, Yankun, Shichong Yuan, Shuang Ma, Guilei Han, and Jiabin Shi. 2024. "Migration of Water and Sand Inrush through the Mining-Induced Caving Zone: Insights from Model Test and Numerical Analysis" Water 16, no. 17: 2527. https://doi.org/10.3390/w16172527
APA StyleLiang, Y., Yuan, S., Ma, S., Han, G., & Shi, J. (2024). Migration of Water and Sand Inrush through the Mining-Induced Caving Zone: Insights from Model Test and Numerical Analysis. Water, 16(17), 2527. https://doi.org/10.3390/w16172527