Article

Investigation of Biotoxicity and Environmental Impact of Prometryn on Fish and Algae Coexistent System

1
College of Animal Science and Technology, Henan Agricultural University, Zhengzhou 450046, China
2
Research Station for Field Scientific Observation of Aquatic Organisms in Yiluo River, Yellow River Basin, Sanmenxia 472200, China
*
Authors to whom correspondence should be addressed.
Water 2024, 16(17), 2531; https://doi.org/10.3390/w16172531
Submission received: 5 August 2024 / Revised: 4 September 2024 / Accepted: 5 September 2024 / Published: 6 September 2024
(This article belongs to the Special Issue Aquatic Environmental Pollution and Ecotoxicological Studies)

Abstract

:
To investigate the toxic and environmental effects of prometryn, a laboratory experiment was performed on coexistent fish and algae. The body weight and length of Carassius carassius, Microcystis aeruginosa (M. aeruginosa) densities and water quality were measured continuously for 92 days. It was observed that fish growth was significantly inhibited by prometryn. This can be partly attributed to the adverse effects of prometryn on the antioxidant system of fish; the activities of superoxide dismutase (SOD) and catalase (CAT) in crucian carp were significantly inhibited by prometryn. The growth of M. aeruginosa was greatly inhibited by prometryn (p < 0.05), and the adverse effects of prometryn on M. aeruginosa indirectly impacted water qualities. The body weight and length of Carassius carassius first increased and then tended to be stable with increasing electrical conductivity (EC) values; their quantified relationship was established based on the Gompertz and Logistic equations (R2 = 0.920–0.989). Based on the above results, we concluded that the toxic effects of prometryn can impact the antioxidant system of fish and algae which in turn affects their growth performance, and have an indirect impact on water quality. The application of equations made it realizable to obtain a more detailed interpretation of the processes involved in these biological–abiotic interactions.

1. Introduction

Due to the rapidly growing world population, the demand for high-quality proteins is increasing, which promotes the rapid development of the aquaculture industry [1]. Fish are a globally traded food commodity due to the valuable proteins they provide [2]. In China, the crucian carp (Carassius carassius) is one of the most commercially important freshwater omnivorous fishes [3].
Aquaculture activities have largely increased the nutrients in the aquatic environment [4]. In common carp (Cyprinus carpio) ponds, 57–71% of the nitrogen and 44–58% of the phosphorus came from aquaculture feed [5]. Nutrients coming from the fish culturing business may drive the growth of harmful algae [6], leading to eutrophication and causing a drop in fish productivity [7,8,9].
Algae in aquatic ecosystems are an important component of water quality monitoring processes [10]. Algae’s abundance and wide distribution in aquaculture systems can significantly affect the water chemistry of an aquatic ecosystem. M. aeruginosa is a common cyanobacterium in eutrophic water bodies, and it is a functional organism that is widely used in biological experiments [11]. Many types of herbicides are used in aquaculture systems to control harmful algae [12]. Herbicides exposed to aquatic environments are detrimental to the aquatic ecosystem [13], and they have hazardous effects on aquatic organisms [14]. Prometryn is a selective herbicide of the s-triazine chemical family which is widely used and detected in natural water bodies worldwide, imposing toxic effects on aquatic organisms [15].
Only a small amount of prometryn acts on target cells, and most of this prometryn can cause toxic effects on aquatic organisms. As reported by Huang et al. [16], exposure to prometryn reduced the activities of antioxidant enzymes in Eriocheir sinensis, increased the level of lipid peroxidation and caused oxidative stress. Similar results on Procambarus clarkii were observed by Stara et al. [17]. In a study by Zhao and Zhu [18], an increased bioaccumulation of prometryn led to an increased level of lipid peroxidation in zebrafish (Danio rerio). It should be pointed out that although the coexistence of fish and algae is very common in natural water bodies, only a few papers have conducted experimental research on their coexistent system. A better understanding of the biotoxic effects of prometryn forms the foundation for conducting relevant research.
A variety of mathematical models (e.g., Logistic equation, Monod equation) [19] have been employed in microalgae research to study the microalgae growth process in depth [20]. In addition, equations such as the Gompertz equation and the Logistic equation have been proposed for modeling fish growth [21,22]. The literature is sparse on studies evaluating the quantitative relationship between biological and abiotic factors in the water environment; we hypothesized that the application of equations could facilitate a more in-depth analysis of the biotoxic effects of prometryn.
In light of the above-mentioned issues, this study chose crucian carp and M. aeruginosa as target organisms to investigate the biotoxic effects of prometryn. The physiological and biochemical indexes of fish and algae as well as key water quality parameters were analyzed to reveal the environmental impacts of prometryn, clarify its underlying mechanisms ad provide a scientific basis for promoting the high-quality development of the aquaculture industry.

2. Materials and Methods

2.1. Experimental Materials

We conducted this experiment in accordance with the ARRIVE guidelines and relevant regulations.
Crucian carp were purchased from a local market near Henan Agricultural University in Henan, China. Six healthy crucian carp (6 months old) were each raised in an aquarium; their initial individual weights and lengths were 18.3 ± 0.1 g and 9.3 ± 0.2 cm, respectively. They were acclimated in aerated aquariums for 20 days before the beginning of the experiment.
M. aeruginosa was obtained from the Freshwater Algae Culture Collection of the Institution of Hydrobiology (FACHB-905) at the Chinese Academy of Sciences. Before the experiment, the M. aeruginosa was cultured in BG-II culture medium for 24 days.
The fish feed used in this experiment was manufactured by Zhongliang Company Limited (Rizhao, China) and has been widely used throughout China. The amount of phosphorus and nitrogen in the feed were 12.11 g kg−1 and 46.58 g kg−1, by analysis [23].
The prometryn (purity ≥ 99.0%) was purchased from Shanghai Aladdin Biochemical Technology Limited (Shanghai, China).
The experiment was conducted in aquariums (60.0 cm long, 40.0 cm wide and 40.0 cm high) containing 50 L of tap water with continuous aeration.

2.2. Experimental Methods

Aquariums named CK that contained only tap water were used as a blank. Aquariums with only fish were named F, aquariums with both fish and algae were named FA and aquariums with fish, algae and prometryn were named FAP. The selected exposure concentration of prometryn was 100 μg L−1 because it cannot fully inhibit the growth of fish and algae [24,25], and it is in the range of recommended concentrations of prometryn used in aquaculture [26]. All the groups were prepared in triplicates. Fish feed was added to the aquariums (except CK) by hand (09:00 a.m.) at 1.0% of the initial crucian carp body weight daily. The feed added to the aquariums with fish was completely consumed according to our observation. The initial density of M. aeruginosa was 1 × 10³ cells mL−1.
A photoperiodic cycle of 12 h of light and 12 h of darkness was used. The volume of water in the aquariums remained constant during the course of the experiment (92 d), and the water lost due to evaporation was replenished daily. The water temperature in the aquariums was not controlled in the present study and fluctuated naturally.

2.3. Measurement of Monitoring Indicators

Water samples were taken from the center of the aquariums at a depth of 6 cm from the water surface. The water samples were filtered through 0.45 μm membrane filters to determine the total dissolved phosphorus (TDP), orthophosphate (PO43−-P), total dissolved nitrogen (TDN) and ammonia nitrogen (NH4+-N). Digested water samples by autoclave were used for the determination of TDP and TDN. The concentrations of TDP, PO43−-P, TDN and NH4+-N were determined according to the literature of Yang et al. [27]. The physicochemical parameter (EC) was determined in situ with a multimeter [28].
The body length and body weight of the fish were measured every 10 days using dividing rulers and electronic scales. The density of M. aeruginosa was determined referring to the literature by Wu et al. [23], and each sample was counted 5 times. The M. aeruginosa densities and water quality parameters were determined periodically for 4 days.
At the end of the experiment, the antioxidant indexes (superoxide dismutase (SOD) activity, catalase (CAT) activity and malondialdehyde (MDA) content) of the algae and fish were measured using assay kits (purchased from Nanjing Jiancheng Biological Co., Ltd. (Nanjing, China)). Water samples were centrifuged for 10 min at 12,000 rpm with a CT14RDII High-Speed Benchtop Centrifuge (Tianmei, Shanghai, China) to obtain algae concentrate at 4 °C. After washing with normal saline twice, the algae concentrate was redissolved in normal saline and frozen and thawed three times at −80 °C. The resulting mixture was subsequently centrifuged for 15 min under the specified condition, and the supernatant was collected for measuring the indexes. In terms of fish, 100 mg of whole fish tissue was mixed with 9 times the amount of saline (0.86%) and ground using a grinder (Xinzhi, Ningbo, China) (60 Hz, 4 °C) for 60 s. The mixture was then centrifuged at 8000 rpm and 4 °C for 10 min to obtain the supernatant for the determination of the antioxidant index. All procedures were completed according to the manufacturer’s instructions.

2.4. Statistical Analysis

The concentrations of nutrients from CK were subtracted when calculating the practical concentrations of nutrients. SPSS 17.0 and Origin 9.0 were utilized to analyze the experimental data. The significance level was set at 0.05. SPSS 17.0 was used for the statistical analysis, and one-way ANOVA was applied, followed by the Duncan post hoc test [29].

2.5. Theoretical Basis

To monitor the growth performance and feed utilization efficiency of the fish, the parameters of feed conversion efficiency (FCE, %) and protein efficiency ratio (PER, %) were used, which have also been proposed as relevant indicators in published studies [30,31]. These parameters were determined by the following equations:
F C E = W T W 0 F × 100 %
P E R = W T W 0 F × C P C × 100 %
where W0 (g) represents the initial body weight of the fish; WT (g) is the body weight of the fish at the end time T (d); F (g) is the total amount of consumed feed; and CPC (%) is the crude protein content, which is analyzed as dietary nitrogen multiplied by 6.25 according to Hamre et al. [32].
The Gompertz equation was appropriate to describe the variations of body weight (W) and body length (L) of the fish with time [21] in this study. The fitting equations are as follows:
W = W m a x e e a W r W t
L = L m a x e e a L r L t
where Wmax (g) and Lmax (mm) are the maximum weight and length of the crucian carp, respectively; rW (d−1) and rL (d−1) are the variation rate constants of body weight and body length, respectively; aW (-) and aL (-) are constants; and t (d) is the time.
A lot of evidence has shown that algae growth can be fitted by the Logistic equation [33,34], as shown in Equation (4):
N = N max 1 + e a r t
where N (1 × 10³ cells mL−1) is the algae density at any time; Nmax (1 × 10³ cells mL−1) is the maximum algae density; r (d−1) is the intrinsic growth rate; t (d) is time; and a (-) is a constant. Nmax, r and a can be obtained by fitting Equation (4) against experimental data.
According to published studies [24], the inhibition rate can be determined by Equation (5):
I = [ 1 N m a x n 1 + e a 0 r 0 t N m a x 0 1 + e a n r n t ] × 100 %
where I (%) is the inhibition rate, and Nmax-n (1 × 10³ cells mL−1), an (-) and rn (d−1) represent the Nmax, a and r of the experimental groups with prometryn (FAP) in the Logistic equation. Similarly, Nmax-0 (1 × 10³ cells mL−1), a0 (-) and r0 (d−1) represent the Nmax, a and r of the experimental groups without prometryn (FA) in the corresponding Logistic equation.
The Logistic equation has been used to simulate variations of nutrient concentrations [25], and it can also be used to fit other water quality parameters over time as follows:
E = E m a x 1 + e a E r E t
where E (µS cm−1) is the concentration of the EC value at time t (d); Emax (µS cm−1) is the maximum EC; rE (d−1) is the rate constant; aE (-) is a constant; and t (d) is time.
The Logistic equation can also be used to simulate consumed nutrients versus incubation time [35], and the function can be written as follows:
Δ C = Δ C m a x 1 + e a Δ C r Δ C t
In this function, t (d) is the incubation time, ΔC (mg L−1) is the concentration of consumed nutrients at time t, ΔCmax (mg L−1) is the maximum concentration of consumed nutrients, rΔC (d−1) is the consumed rate constant and aΔC (-) is a constant.
Based on Equations (5) and (7), the equation of inhibition rates with respect to concentrations of consumed nutrients can be developed:
I = [ 1 N m a x n 1 + e a 0 r 0 ( a Δ c 0 ln Δ C m a x 0 Δ C + l n Δ C ) / r Δ c 0 N m a x 0 1 + e a n r n ( a Δ c n ln Δ C m a x n Δ C + l n Δ C ) / r Δ c n ] × 100 %
where ΔCmax-n (mg L−1), aΔC-n (-) and rΔC-n (d−1) represent the ΔCmax, aΔC and rΔC of the experimental groups with prometryn, and ΔCmax-0 (mg L−1), aΔC-0 (-) and rΔC-0 (d−1) represent the ΔCmax, aΔC and rΔC of the experimental groups without prometryn.
According to Equations (3a), (3b) and (6), the equations of body weight and body length with respect to EC can be fitted using the following equations:
W = W m a x e e a W r E a E r w r w ln C E m a x C + r w l n C ) r E
L = L m a x e e a L r E a E r L r L ln C E m a x C + r L l n C ) r E
where the parameters in Equations (9a) and (9b) are the same as those in Equations (3a), (3b) and (6).

3. Results

3.1. The Effects of Prometryn on Crucian Carp

No fish mortality occurred throughout the entire feeding period in the present experiment. It can be found from Figure 1 that the body weight and body length of the crucian carp increased with incubation time during the first 30 days, reached maximum values and then stabilized towards the end of the experiment. From Figure 1 and Table 1, Equations (3a) and (3b) well described the variations of body weight (BW) and body length (BL) of the fish over time (R2 = 0.751–0.995).
The growth of the crucian carp was significantly inhibited by prometryn. The FCE and PER in the groups with prometryn were 88.1% and 88.2% lower than those in the groups without prometryn (p < 0.05), respectively. This is comparable with the results reported by Cattaneo et al. [36]; the reason behind is that the antioxidant response [15] and tissue biochemical [36] of fish can be affected by prometryn, which can further affect their growth. It should be noted that the growth performance of the crucian carp in the groups without M. aeruginosa (F) was slightly better than those with M. aeruginosa (FA) (p > 0.05). This difference might be related to the toxicity released by M. aeruginosa, indicating an area worthy of further study.
Prometryn is known to cause oxidative free radical damage to organisms [16,17]. To reveal the toxic effects of prometryn on the test subjects, we measured the antioxidant indicators of fish. As expected (shown in Table 1), the SOD and CAT activities of the crucian carp in the groups with prometryn were significantly lower than those in the groups without prometryn (p < 0.05). Nevertheless, our results showed that prometryn had no significant effect on the MDA content of the crucian carp.

3.2. The Effects of Prometryn on M. aeruginosa

The M. aeruginosa growth variations are summarized in Figure 2a–c. The M. aeruginosa cell densities gradually increased during the lag phase. As time went on, the M. aeruginosa densities showed a rapid increase over time in the exponential phase and eventually reached a stationary phase. Equation (4) can well predict variations of M. aeruginosa growth (R2 = 0.992–0.994 shown in Table 1). According to Huang et al. [24], the growth rate (R2 = 0.505–0.994) and specific growth rate (R2 = 0.451–0.976) of M. aeruginosa can be described by equations derived from a modified Logistic equation.
In the presence of prometryn, the growth of M. aeruginosa was greatly inhibited, and the maximum and average M. aeruginosa densities in FA (without prometryn) were 26.8% and 46.7% higher than those in FAP (with prometryn) (p < 0.05), respectively. Our results agreed with previous studies [13], and the reason behind this is that prometryn can inhibit the photosynthetic process of algae. It can be seen from Figure 2d that the inhibition rates of prometryn on M. aeruginosa slightly increased during the first several days, and then decreased due to the potential adaptation of M. aeruginosa [37]. Variations in the inhibition rates over time could be reasonably fitted by Equation (5) (R2 = 0.404–0.744) as can be seen in Figure 2d [38].
The antioxidant index of M. aeruginosa was also determined in this study. From Table 1, prometryn led to an increase in the SOD and CAT activities in M. aeruginosa; especially, the CAT activity of the algae in the groups with prometryn was significantly higher than that in the groups without prometryn (p < 0.05). Our results are consistent with previous studies [39], which indicated that the activities of SOD and peroxidase (POD) all increased under low concentrations of prometryn. Furthermore, exposure to prometryn led to an increase in the MDA content within M. aeruginosa, but the effect was not significant (p > 0.05).

3.3. The Environmental Effects of Prometryn

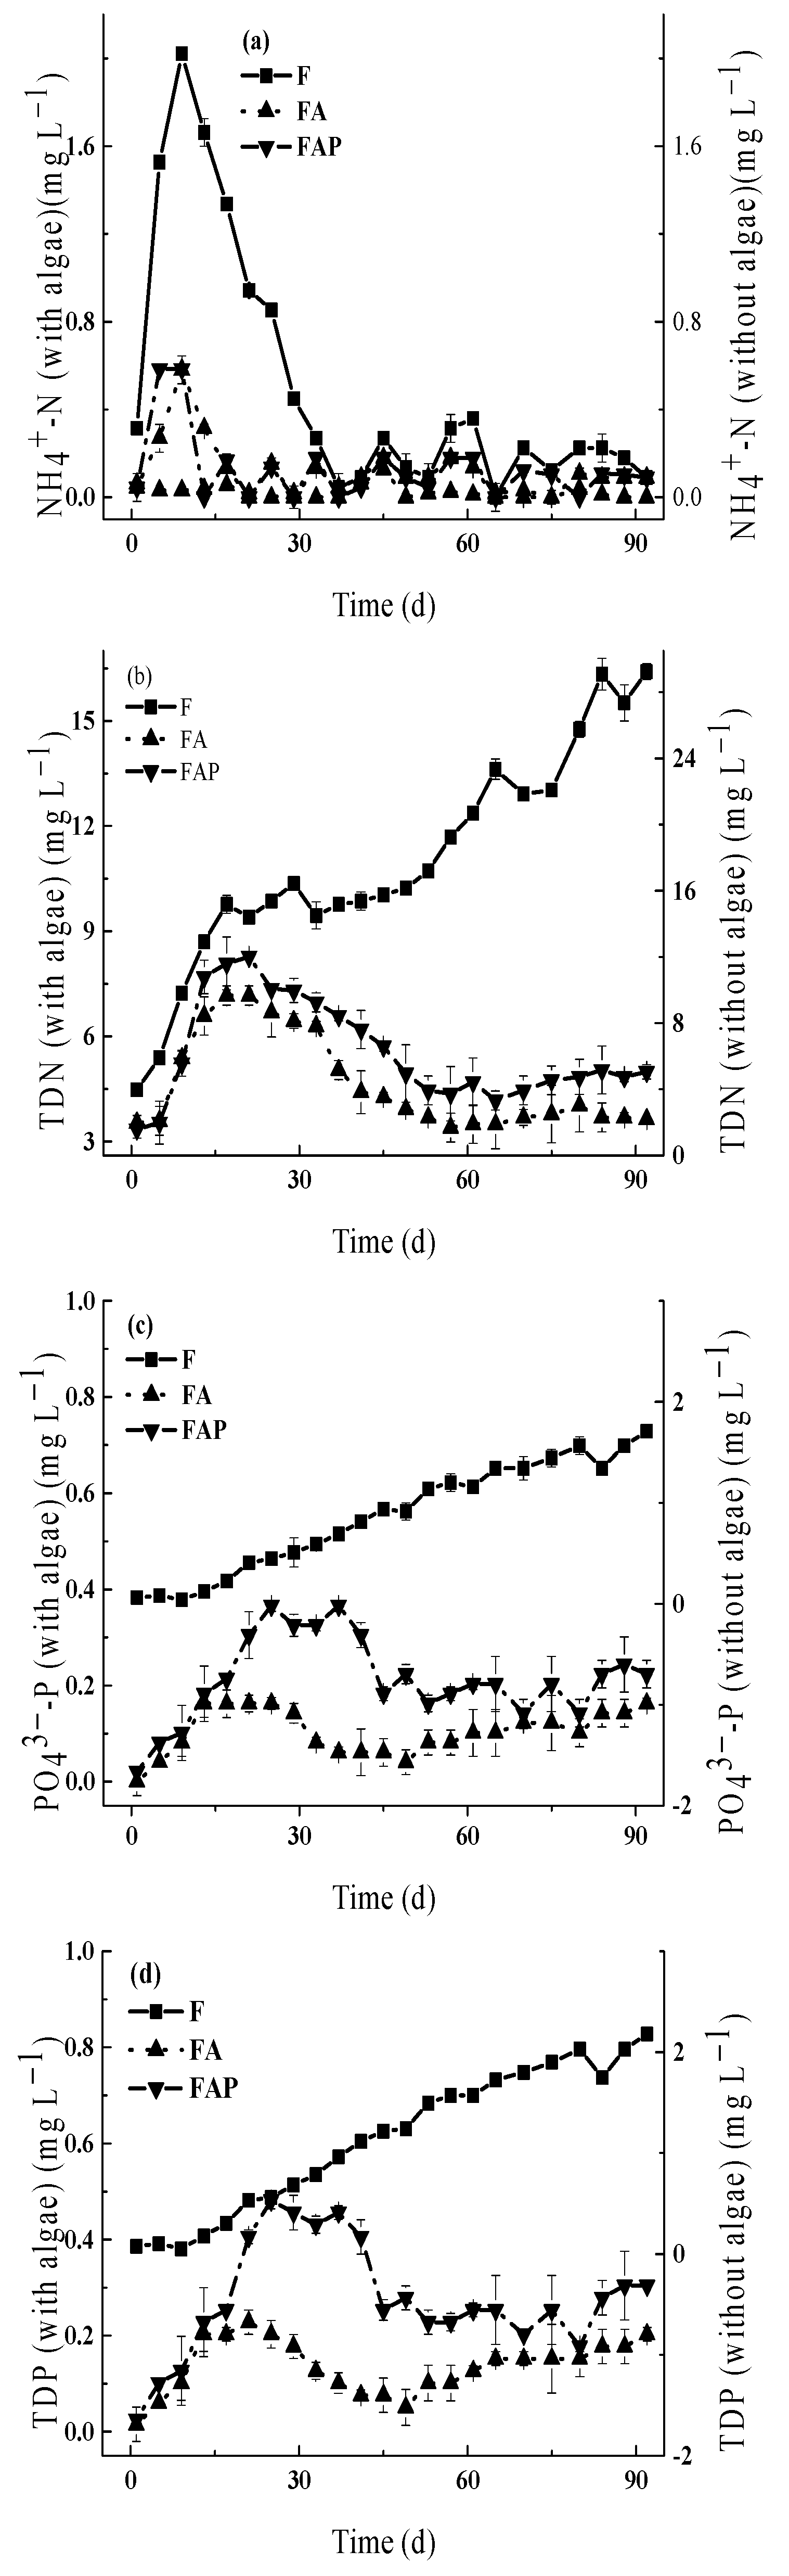
3.3.1. The Indirect Effects of Prometryn on Nutrient Concentrations

In the experimental groups, variations of nutrient concentrations over time were predominantly affected by both M. aeruginosa utilization and the metabolism of fish. As illustrated in Figure 3a–d, NH4+-N, TDN, PO43−-P and TDP concentrations climbed sharply at the start of this experiment; this stage was mainly affected by the substances released from fish metabolism. Then, concentrations of NH4+-N, TDN, PO43−-P and TDP declined; this stage was mainly influenced by the utilization of M. aeruginosa. Finally, the concentrations of nutrients reached a stationary phase with fluctuations.
It was concluded that exposure to prometryn had significant impacts on nutrient concentrations. For example, the average concentrations of TDN, NH4+-N, TDP and PO43−-P in FAP (with prometryn) were 16.7%, 23.7%, 41.2% and 39.1% higher (p < 0.05) than those in FA (without prometryn).

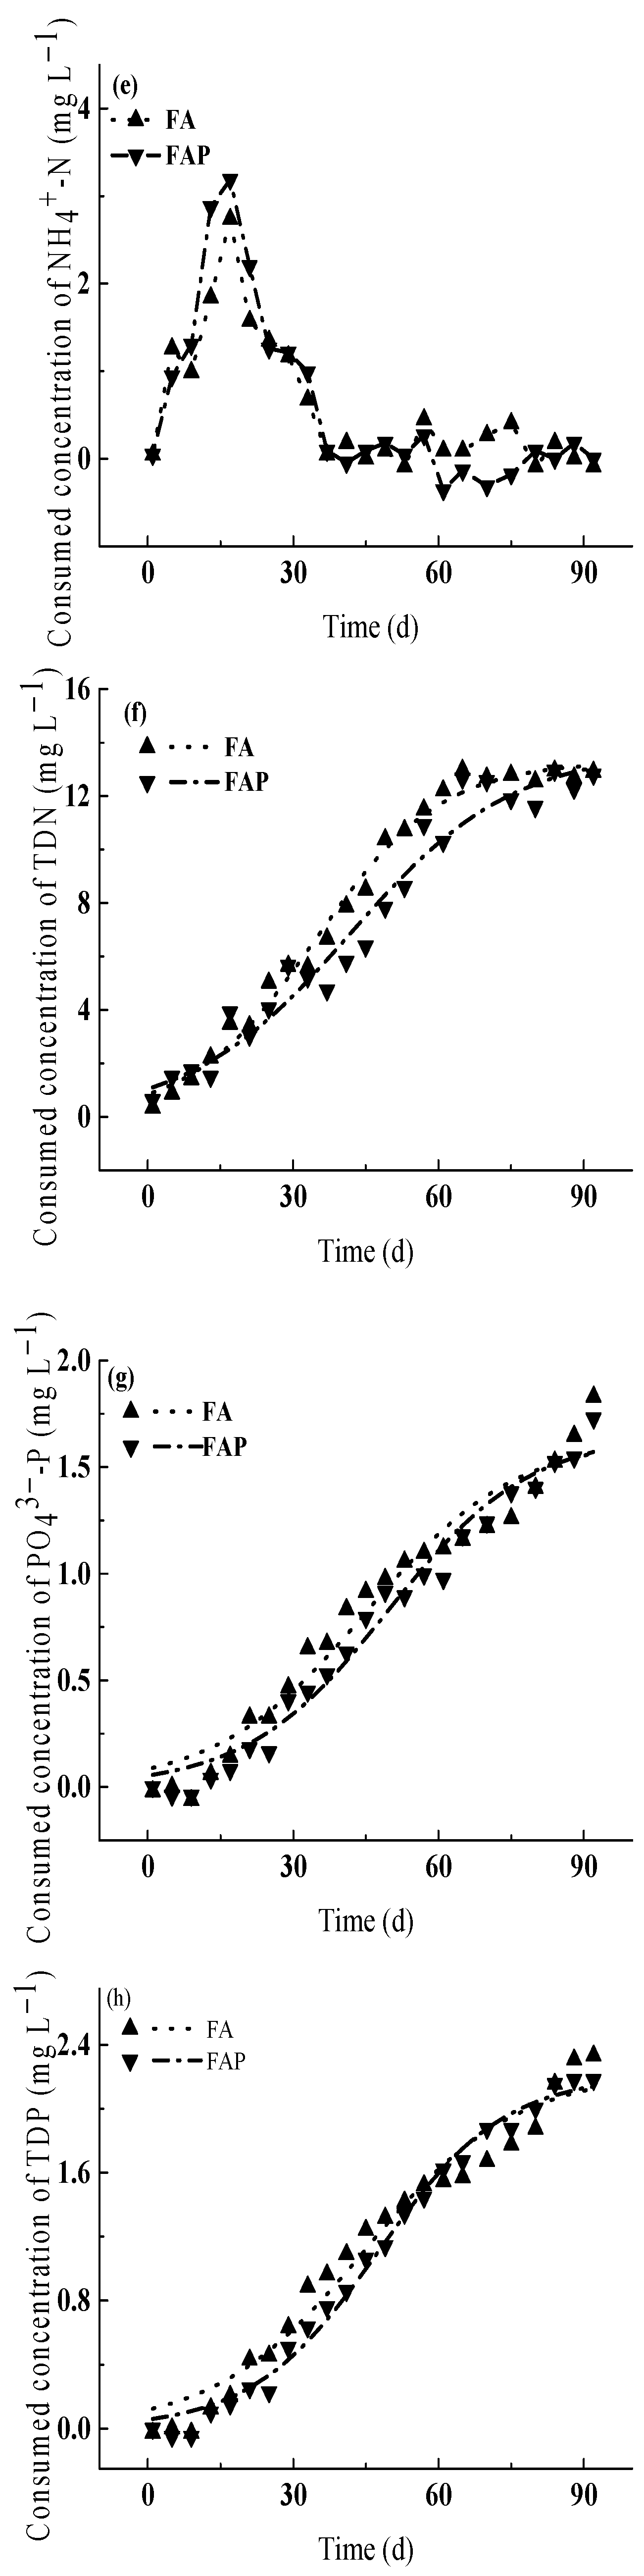
3.3.2. Indirect Effects of Prometryn on Physical Parameters of Water

EC values increased rapidly during the first 45 days, and then increased slowly and became stable afterwards. Equation (6) can well describe variations of EC with time (R2 = 0.972–0.984). As can be seen in Figure 3i, the EC values in FA were higher than those in FAP and ranged between 236 and 288 µS cm−1, while there was no distinct difference between them, indicating that prometryn had no significant effect on the EC of water.

3.3.3. Indirect Effects of Prometryn on Consumed Concentrations of Nutrients

To study the effect of prometryn on M. aeruginosa, nutrient utilization by M. aeruginosa was characterized in our experiment. The changes in the consumed concentrations of nutrients over time are shown in Figure 3e–h; the consumed TDN, PO43−-P and TDP (ΔTDN, ΔPO43−-P and ΔTDP) concentrations (consumed concentrations of nutrients were calculated by the nutrient concentration of group F minus the nutrient concentration in groups with M. aeruginosa) increased over time until they reached their respective peak values, and then remained generally stable. Equation (7) can effectively describe the variations of concentrations of consumed TDN, PO43−-P and TDP with time (R2 = 0.952–0.991), which is consistent with Huang et al.’s study [24]. However, the variations of concentrations of consumed NH4+-N (ΔNH4+-N) climbed sharply at the start of the experiment, then declined sharply and eventually reached a stationary phase, which could not be fitted by the equation.
Prometryn had great impacts on the concentrations of consumed nutrients. As can be seen in Table 2, the maximum concentrations of consumed TDN, TDP and PO43−-P in FAP (with prometryn) were 6.3%, 7.9% and 7.2% lower than those in FA (without prometryn), and the average concentrations of consumed TDN, TDP and PO43−-P in FAP were 15.5%, 14.9% and 14.9% lower (p < 0.05) than those in FA. This can be explained by the toxic effect of prometryn which strongly inhibited the growth of M. aeruginosa [40] and indirectly affected the utilization of nutrients.

4. Discussion

4.1. Discussion of the Toxic Effects of Prometryn

When an organism is subjected to external toxins or other adverse factors, the balance of redox reactions within their body is disrupted, resulting in the accumulation of a large number of free radicals, which in turn causes oxidative stress [41]. Oxygen free radicals cause cellular damage by initiating peroxidation reactions of unsaturated fatty acids in the biological membrane. SOD and CAT are crucial enzyme systems in the antioxidant system, playing significant roles in the elimination of superoxide radicals, hydrogen peroxide and peroxides, as well as in preventing or reducing the formation of hydroxyl radicals, the level of their activity represents the ability to scavenge free radicals. MDA is a product of lipid peroxidation in the cell membrane, and its content directly reflects the situation of free radical production and the degree of cellular damage [42]. Similar to Bhunia et al. [43], the results of this experiment showed that exposure to prometryn increased the activity of SOD and CAT in the cells of algae, and also led to an increase in the content of MDA; this implies that under the toxic effects of prometryn, the antioxidant system within the cells of the algae is stimulated, leading to the disruption of the redox system balance. As a result, the growth of algae was inhibited as shown in Figure 2. Furthermore, consistent with previous studies [16,17], exposure to prometryn led to a decrease in the activity of CAT and SOD in crucian carp, which may cause an increase in the content of free radicals and other harmful substances in crucian carp, thereby inhibiting their growth, as described in above (Section 3.1). Previous studies have shown that in the visceral mass of zebrafish exposed to a concentration of 53.2 μg L−1 prometryn, the activity of CAT and the content of glutathione (GSH) increased initially and then decreased over time [18]. Velisek et al.’s research [44] showed that high concentrations of prometryn (1200 and 4000 μg L−1) affected the survival, growth rate, early ontogeny and histology of common carp (Cyprinus carpio L.). These data indicate that prometryn can have a variety of adverse effects on fish.

4.2. Environmental Effects of Prometryn

Since the amount of prometryn exposed was very low, the direct change in water quality caused by its addition can be ignored. However, prometryn significantly inhibited the growth of algae and crucian carp, and indirectly affected concentrations of nutrients. This phenomenon conforms to the results documented in Yang et al. [45]. As analyzed in Section 3.3.1, concentrations of TDN, NH4+-N, TDP and PO43−-P in groups with prometryn were significantly higher than those in groups without prometryn; this can be explained by the fact that prometryn has a significant impact on cyanobacteria densities, which can have an indirect effect on concentrations of consumed nutrients (as discussed in Section 3.3.3). Additionally, results of EC values provide a useful indicator for analyzing the environmental effects of prometryn. As described in Section 3.3.2, the EC values in groups exposed to prometryn were lower than those in groups without it. This implies that prometryn can influence the physical indicators of water to a certain extent, even though the impact was not significant in this study. For future work, it is suggested to test more conditions.

4.3. Relationship between Inhibition Rates and Concentrations of Consumed Nutrients

Liu et al.’s study [46] suggests that the protective effect of nutrients on intracellular Cr toxicity could be enhanced uptake of phosphorus and an increase in C and N assimilation efficiency. In our study, the relationship between the inhibition rates caused by prometryn on M. aeruginosa and the concentrations of consumed nutrients can be well described by Equation (8) (R2 = 0.729–0.874), as shown in Figure 4. In general, the inhibition rates remained stable when the concentrations of consumed TDN were lower, which was then followed by a decrease with increasing concentrations of consumed nutrients. The observations from the above analysis demonstrate that the toxic effects of prometryn may be obscured by more consumed nutrients. There has been little research evaluating the effects of nutrient consumption on the toxicological response of algae to toxins. Wang and Dei [47] noted that phosphorus-deficient green algae responded more dramatically to increased metal concentration than phosphorus-enriched cells. Detoxification processes by polyphosphate bodies (phosphorus can be stored as polyphosphate bodies when the concentration of phosphorus in the medium is high) were considered a possible explanation for the high tolerance observed in phosphorus-enriched cultures in Serra et al.’s study [48], but this aspect was not directly addressed. In this regard, we also cannot draw a definite conclusion and this remains to be studied in future research.

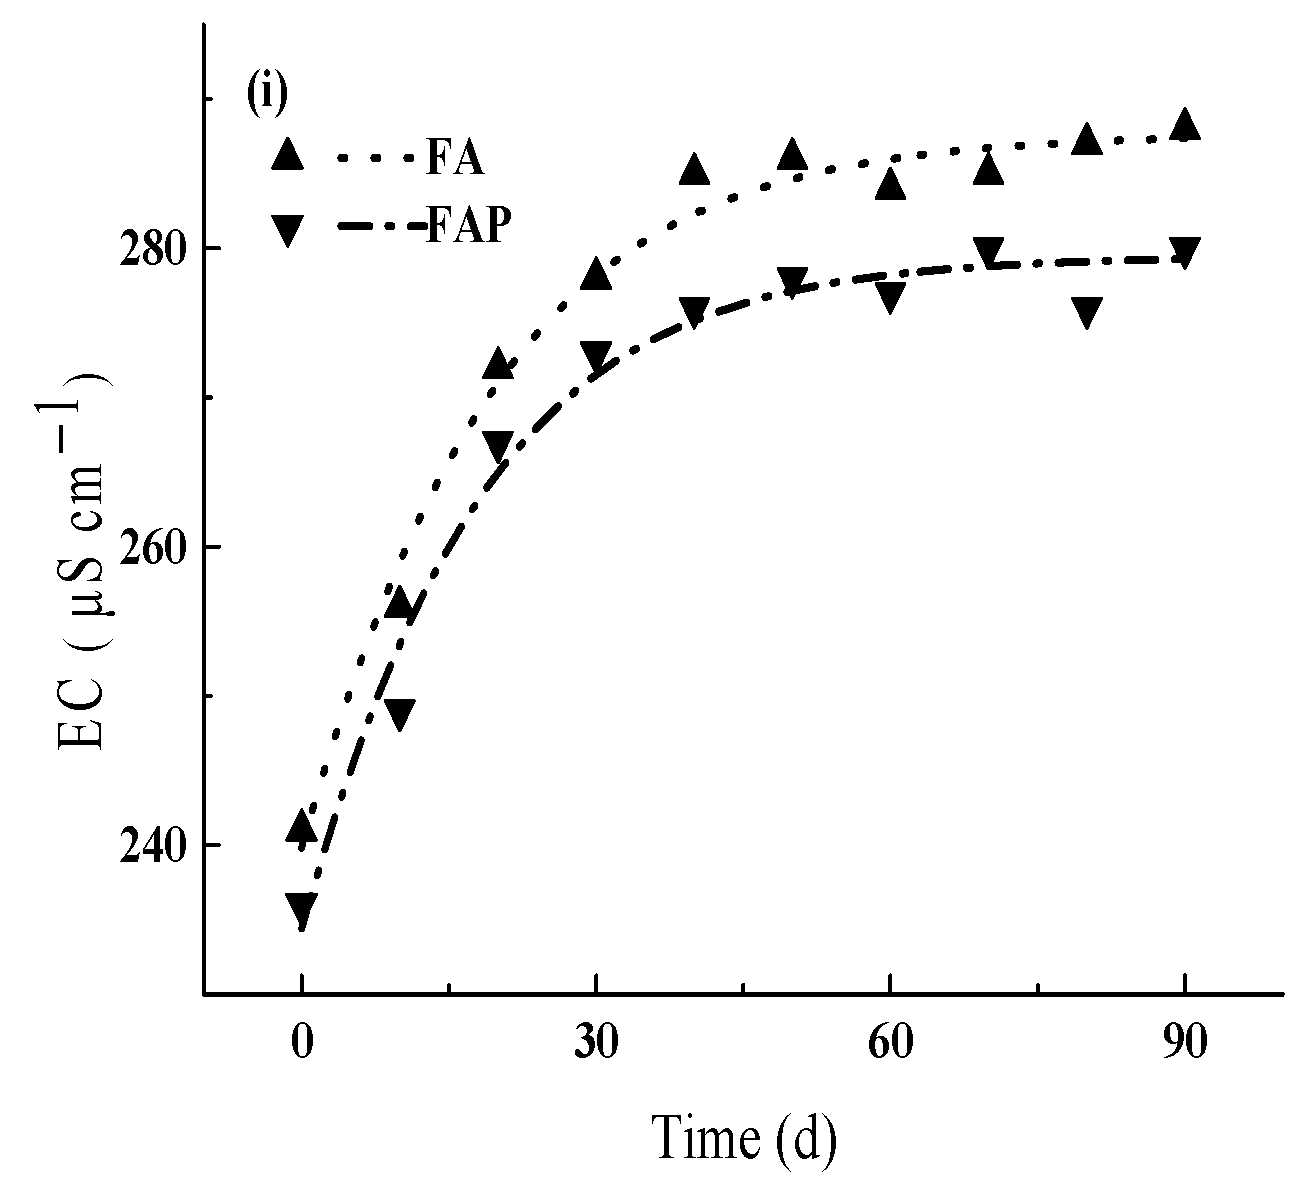
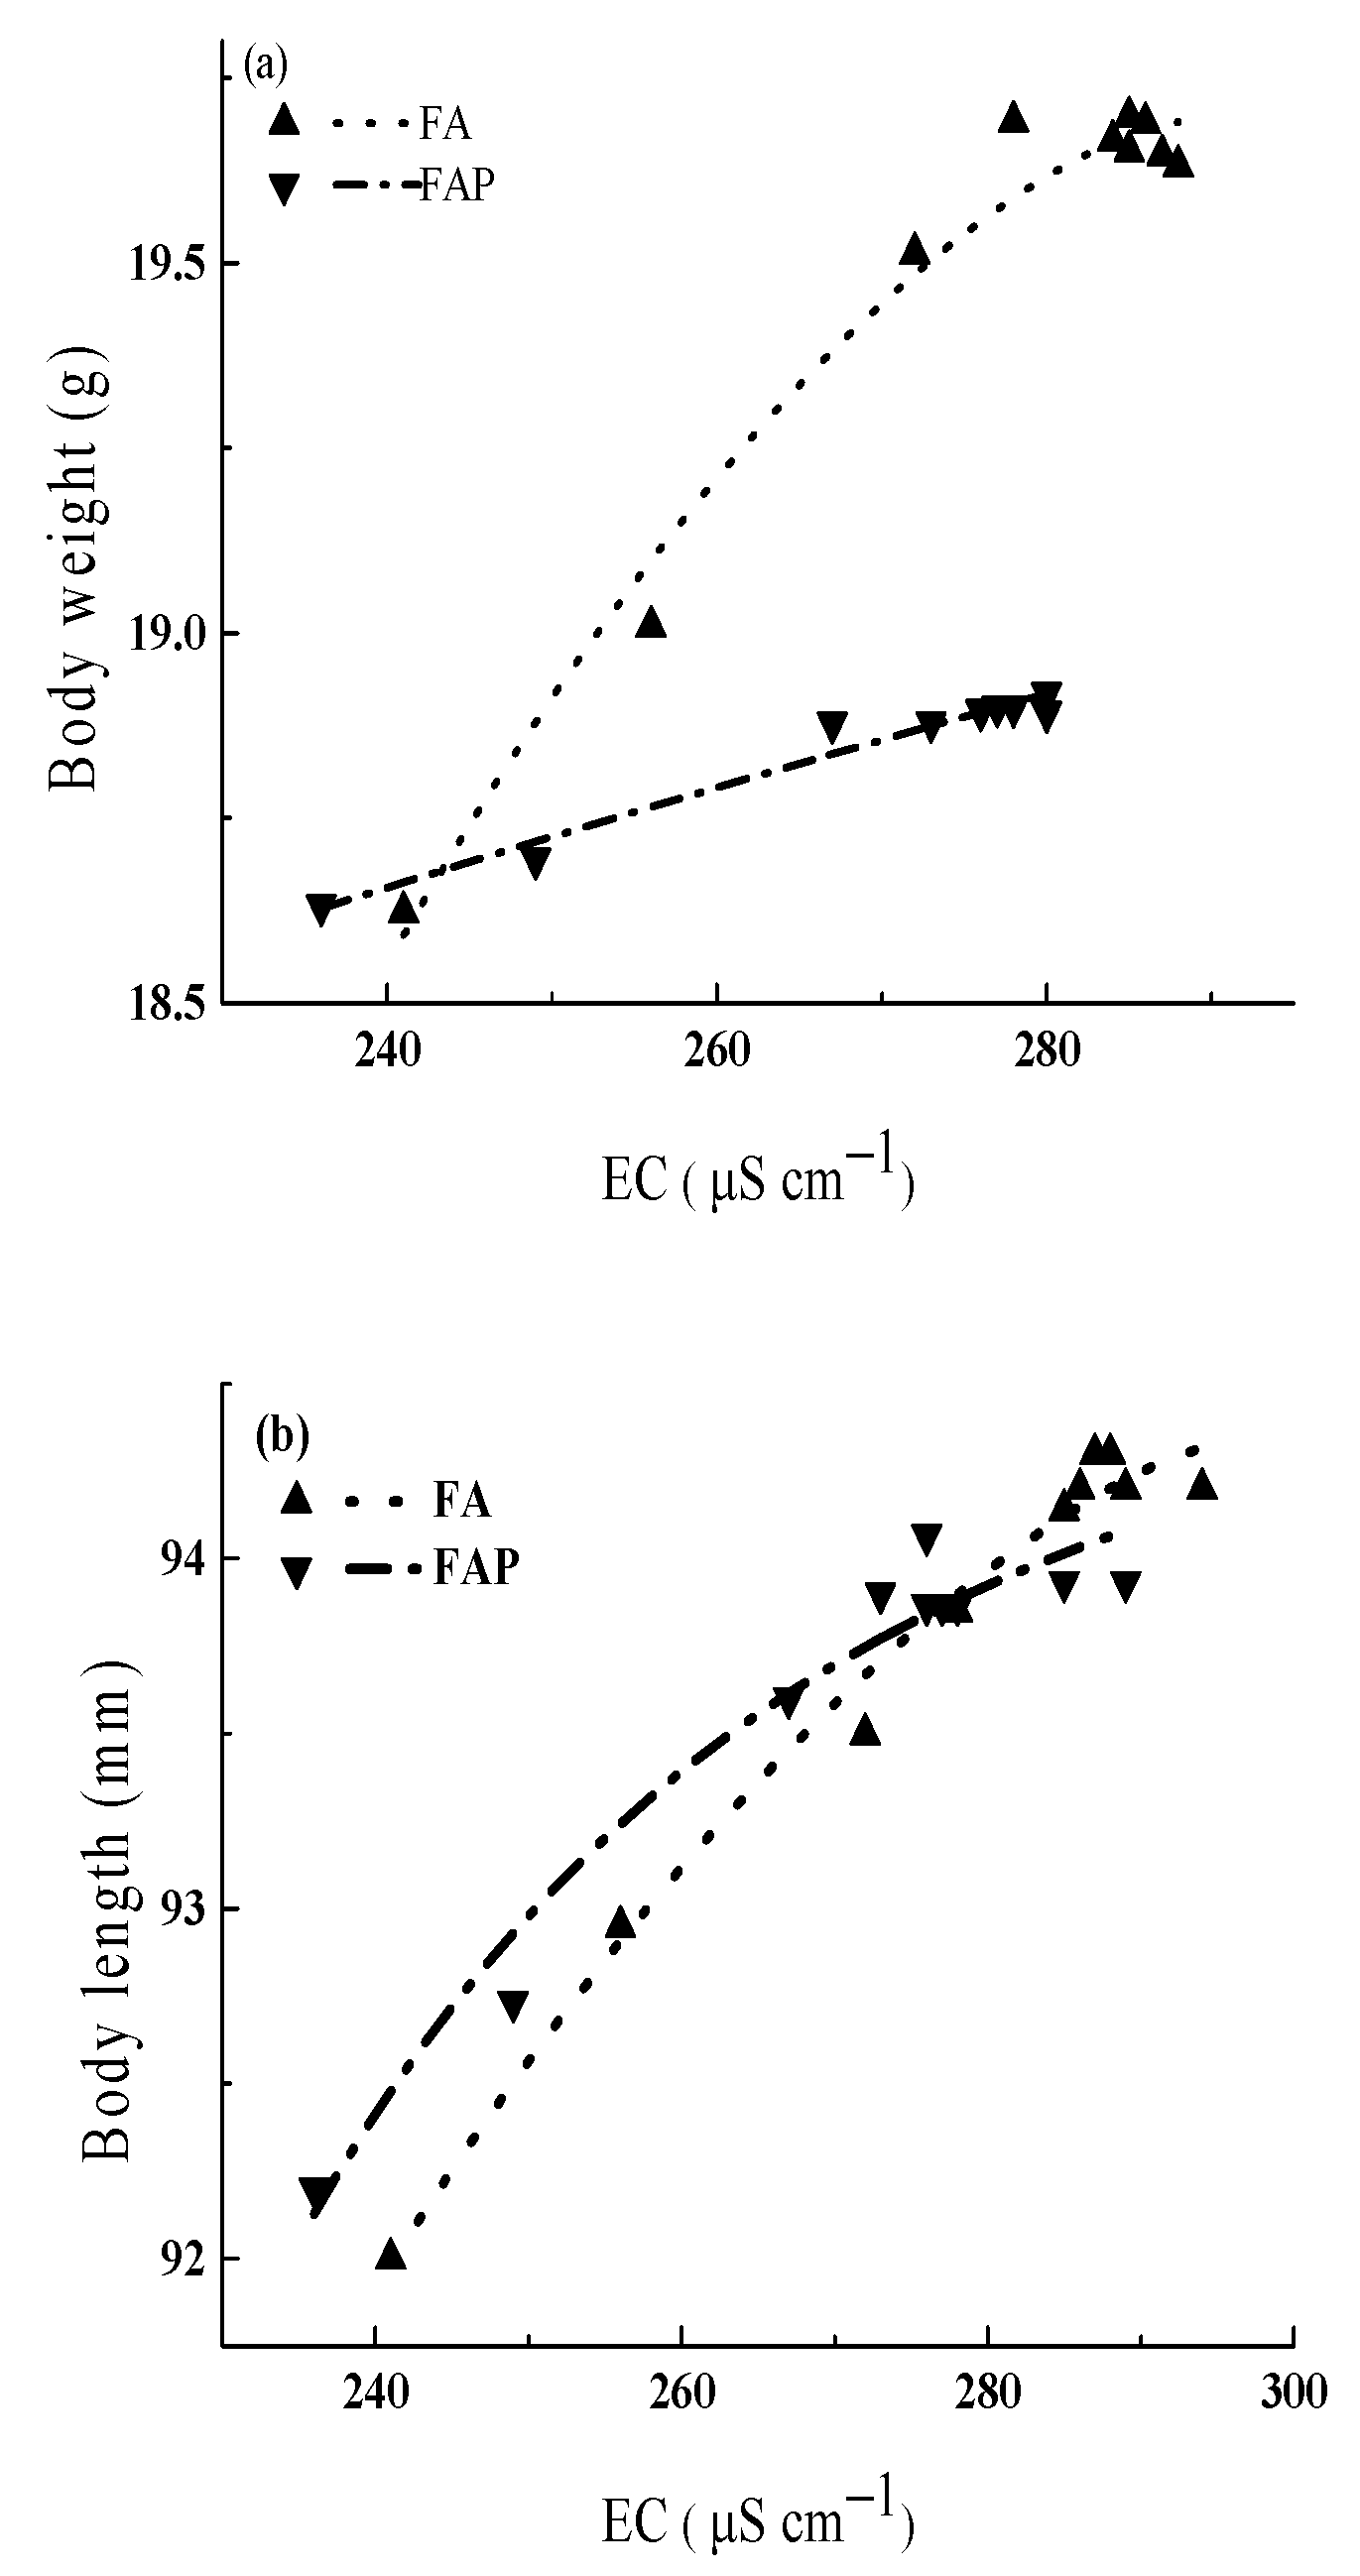
4.4. Correlations between Fish Growth and Physicochemical Parameters of Water

To explore the interaction between fish growth and physicochemical parameters of water, we proposed a novel equation (Equation (9a)) based on the Logistic equation and the Gompertz equation to describe the relationship between the weight growth of crucian carp and the EC of water. We found that when the EC values were low, the weight of the fish grew rapidly, while when the EC values were high, the growth of the crucian carp (with or without prometryn) tended to stagnate. For example, when the EC values in the water were higher than 275 µS cm−1, the weight of the crucian carp generally stopped increasing. Figure 5a shows that fitting values agree well with the measured ones (R2 = 0.920–0.989); this illustrates that Equation (9a) can be used to predict the growth of fish. The quantified relationship between the length growth of crucian carp and the EC of water was further derived, i.e., Equation (9b); Figure 5b and the computed results showed that when EC values were high, the length growth of the fish tended to stagnate.
Fish growth is affected by a variety of environmental factors [49]. According to Yang et al. [25], the concentrations of nutrients in water (e.g., TDN and TDP) have a quantified relationship with the weight gain rate of fish. Previous studies have also indicated that high concentrations of salinity and alkalinity result in the slow growth of fish [50]. As an important water quality index, EC is considered to affect the growth of aquatic organisms [51]. In this investigation, we revealed the quantified relationship between fish growth and the physicochemical parameter of water, providing a scientific basis for further studies and generating wide interest.

5. Conclusions

Our study evaluated the toxic effects of prometryn on fish and algae in a coexistent system. It was demonstrated that prometryn had a significant inhibitory effect on the growth of both crucian carp and M. aeruginosa. The adverse effects of prometryn on fish and algae can lead to an indirect impact on nutrient concentrations. The average concentrations of TDN, NH4+-N, PO43−-P and TDP in groups with prometryn were significantly higher than those in groups without prometryn; this can be mainly attributed to nutrient utilization by algae, which was inhibited by prometryn. Our study also provides experimental evidence that prometryn had a significant effect on the CAT and SOD activity of fish, as well as on the CAT activity of algae, while it had no significant effect on the MDA content of crucian carp or M. aeruginosa.
Based on the Gompertz and Logistic equations, the quantified relationships between fish growth and the EC of water were revealed (R2 = 0.920–0.989). These quantified relationships provide a solid foundation for further research. Also, our study highlights that the toxic effects of prometryn might be obscured by more consumed nutrients, and we proposed an equation to describe the relationship between inhibition rates and concentrations of consumed nutrients (R2 = 0.729–0.874).
This study was conducted in a laboratory environment, and it would be interesting to consider a more complex water environment in future research. In such an environment, we would need to consider the effects of other flora and fauna on water quality, fish and algae growth and the toxic effects of prometryn. The methodologies and results of this investigation provide a foundation for further studies. Despite this limitation, the biotoxicity and environmental effects of prometryn under the coexistence of fish and algae are still of practical application, which can provide a reference for the high-quality development of aquaculture.

Author Contributions

Conceptualization, Z.Y. and G.L.; methodology, Z.Y. and M.L.; software, Z.Y.; validation, Z.Y.; formal analysis, Z.Y., J.G. and R.W.; investigation, Z.Y., J.G. and R.W.; resources, Z.Y.; data curation, Z.Y.; writing—original draft preparation, Z.Y.; writing—review and editing, D.Z., B.L., G.Y., P.D., X.H., M.L. and G.L.; visualization, Z.Y.; supervision, Z.Y.; project administration, Z.Y.; funding acquisition, Z.Y. All authors have read and agreed to the published version of the manuscript.

Funding

This research was funded by the Henan Agricultural University High-Level Talents Special Support Fund (30501451), and the Key Science and Technology Projects in Henan Province (242102110067).

Data Availability Statement

The original contributions presented in this study are included in this article; further inquiries can be directed to the corresponding author(s).

Conflicts of Interest

The authors declare no conflicts of interest.

References

  1. Degefu, F.; Mengistu, S.; Schagerl, M. Influence of fish cage farming on water quality and plankton in fish ponds: A case study in the rift valley and north shoa reservoirs, Ethiopia. Aquaculture 2011, 316, 129–135. [Google Scholar] [CrossRef]
  2. Chen, L.; Yang, X.; Sun, C.; Wang, Y.; Xu, D.; Zhou, C. Feed intake prediction model for group fish using the MEA-BP neural network in intensive aquaculture. Inf. Process. Agric. 2020, 7, 261–271. [Google Scholar] [CrossRef]
  3. Yang, W.; Xiang, F.; Sun, H.; Chen, Y.; Minter, E.; Yang, Z. Changes in the selected hematological parameters and gill Na+/K+ ATPase activity of juvenile crucian carp Carassius auratus during elevated ammonia exposure and the post-exposure recovery. Biochem. Syst. Ecol. 2010, 38, 557–562. [Google Scholar] [CrossRef]
  4. Lopes, I.G.; Lalander, C.H.; Vidotti, R.M.; Vinners, B. Using Hermetia illucens larvae to process biowaste from aquaculture production. J. Clean. Prod. 2020, 251, 119753. [Google Scholar] [CrossRef]
  5. Rahman, M.M.; Verdegem, M.; Nagelkerke, L.; Wahab, M.D.; Milstein, A.; Verreth, J. Effects of common carp Cyprinus carpio (L.) and feed addition in rohu Labeo rohita (Hamilton) ponds on nutrient partitioning among fish, plankton and benthos. Aquacult. Res. 2008, 39, 85–95. [Google Scholar] [CrossRef]
  6. Anderson, D.M.; Glibert, P.M.; Burholder, J.M. Harmful algal blooms and eutrophication: Nutrient sources, composition, and consequences. Estuaries 2002, 25, 704–726. [Google Scholar] [CrossRef]
  7. Guo, L.; Li, Z.; Xie, P.; Ni, L. Assessment effects of cage culture on nitrogen and phosphorus dynamics in relation to fallowing in a shallow lake in China. Aquacult. Int. 2009, 17, 229–241. [Google Scholar] [CrossRef]
  8. Akhan, S.; Gedik, K. The nutrient releases from sea bass (Dicentrarchus labrax Linnaeus, 1758) faeces and feed in estuarine Black Sea condition. J. Food Agric. Environ. 2011, 9, 738–740. [Google Scholar]
  9. Huang, S.L.; Wu, M.; Zang, C.J.; Du, S.L.; Domagalski, J.; Gajewska, M.; Gao, F.; Lin, C.; Guo, Y.; Liu, B.; et al. Dynamics of algae growth and nutrients in experimental enclosures culturing bighead carp and common carp: Phosphorus dynamics. Int. J. Sediment. Res. 2016, 31, 173–180. [Google Scholar] [CrossRef]
  10. Tsai, K.P.; Uzun, H.; Chen, H.; Karanfil, T.; Chow, A.T. Control wildfire-induced Microcystis aeruginosa blooms by copper sulfate: Trade-offs between reducing algal organic matter and promoting disinfection byproduct formation. Water Res. 2019, 158, 227–236. [Google Scholar] [CrossRef]
  11. Yang, M.; Wang, X. Interactions between Microcystis aeruginosa and coexisting bisphenol A at different phosphorus levels. Sci. Total Environ. 2019, 658, 439–448. [Google Scholar] [CrossRef] [PubMed]
  12. Zhou, J.; Hu, F.; Jiao, J.; Liu, M.; Li, H. Effects of bacterial-feeding nematodes and prometryne-degrading bacteria on the dissipation of prometryne in contaminated soil. J. Soil Sediment. 2012, 12, 576–585. [Google Scholar] [CrossRef]
  13. Starr, A.V.; Bargu, S.; Maiti, K.; Ronald, D.L. The effect of atrazine on Louisiana gulf coast estuarine phytoplankton. Arch. Environ. Con. Tox. 2017, 72, 178–188. [Google Scholar] [CrossRef] [PubMed]
  14. Masia, A.; Campo, J.; Navarro-Ortega, A.; Barcelo, D.; Plco, Y. Pesticide monitoring in the basin of Llobregat River (Catalonia, Spain) and comparison with historical data. Sci. Total Environ. 2015, 503–504, 58–68. [Google Scholar] [CrossRef]
  15. Stara, A.; Machova, J.; Velisek, J. Effect of chronic exposure to simazine on oxidative stress and antioxidant response in common carp (Cyprinus carpio L.). Pestic. Biochem. Phys. 2013, 33, 18–23. [Google Scholar] [CrossRef] [PubMed]
  16. Huang, P.; Cao, L.; Du, J.; Gao, J.; Zhang, Y.; Sun, Y.; Li, Q.; Nie, Z.; Xu, G. Effects of prometryn exposure on hepatopancreas oxidative stress and intestinal flora in Eriocheir sinensis (Crustacea: Decapoda). Antioxidants 2023, 12, 1548. [Google Scholar] [CrossRef]
  17. Stara, A.; Kouba, A.; Velisek, J. Effect of chronic exposure to prometryne on oxidative stress and antioxidant response in red swamp crayfish (Procambarus clarkii). Biomed Res. Int. 2014, 2014, 680131. [Google Scholar] [CrossRef]
  18. Zhao, Q.; Zhu, L. Effect of humic acid on prometryn bioaccumulation and the induction of oxidative stress in zebrafish (Danio rerio). RSC Adv. 2016, 6, 16790–16797. [Google Scholar] [CrossRef]
  19. Zhang, H.; Huang, F.; Li, F.; Gu, Z.; Chen, R.; Zhang, Y. An improved logistic model illustrating Microcystis aeruginosa growth under different turbulent mixing conditions. Water 2019, 11, 669. [Google Scholar] [CrossRef]
  20. Aleynik, D.; Dale, A.C.; Porter, M.; Davidson, K. A high resolution hydrodynamic model system suitable for novel harmful algal bloom modelling in areas of complex coastline and topography. Harmful Algae 2016, 53, 102–117. [Google Scholar] [CrossRef]
  21. Hernandez-Llamas, A.; Ratkowsky, D.A. Growth of fishes, crustaceans and molluscs: Estimation of the von Bertalanffy, Logistic, Gompertz and Richards curves and a new growth model. Mar. Ecol. Prog. Ser. 2004, 282, 237–244. [Google Scholar] [CrossRef]
  22. Lv, Q.; Pitchford, J.W. Stochastic von Bertalanffy models, with applications to fish recruitment. J. Theor. Biol. 2007, 244, 640–655. [Google Scholar] [CrossRef] [PubMed]
  23. Wu, M.; Huang, S.L.; Zang, C.J.; Du, S.L. Release of nutrient from fish feed and effects on Microcystis aeruginosa growth. Aquacult. Res. 2012, 43, 1460–1470. [Google Scholar] [CrossRef]
  24. Huang, S.L.; Kong, W.W.; Yang, Z.J.; Yu, H.; Li, F.Y. Combination of Logistic and modified Monod functions to study Microcystis aeruginosa growth stimulated by fish feed. Ecotoxicol. Environ. Saf. 2019, 167, 146–160. [Google Scholar] [CrossRef] [PubMed]
  25. Yang, Z.J.; Huang, S.L.; Kong, W.W.; Yu, H.; Li, F.Y.; Khatoon, Z.; Ashraf, M.N.; Akram, W. Effect of different fish feeds on water quality and growth of crucian carp (Carassius carassius) in the presence and absence of prometryn. Ecotoxicol. Environ. Saf. 2021, 227, 112914. [Google Scholar] [CrossRef]
  26. Xie, J.; Dai, X.L.; Zang, W.L.; Wang, J.W.; Zhang, Z.H.; Ding, F.J. Study on the toxicity of prometryn to two kinds of shrimp and two kinds of aquatic plants. Hunan Agric. Sci. 2010, 23, 147–150. [Google Scholar]
  27. Yang, Z.J.; Huang, S.L.; Huang, X.W.; Liang, X.F.; Akram, W.; Khatoon, Z. Effects of prometryn exposure scenarios on Microcystis aeruginosa growth and water qualities in incubator experiments. Water 2021, 13, 1346. [Google Scholar] [CrossRef]
  28. Madilonga, R.T.; Edokpayi, J.N.; Volenzo, E.T.; Durowoju, O.S.; Odiyo, J.O. Water quality assessment and evaluation of human health risk in Mutangwi river, Limpopo Province, South Africa. Int. J. Environ. Res. Public Health 2021, 18, 6765. [Google Scholar] [CrossRef]
  29. Daendee, S.; Thongsong, B.; Kalandakanond-Thongsong, S. Effects of time of estrogen deprivation on anxiety-like behavior and GABAA receptor plasticity in ovariectomized rats. Behav. Brain Res. 2013, 246, 86–93. [Google Scholar] [CrossRef]
  30. Handeland, S.O.; Imsland, A.K.; Stefansson, S.O. The effect of temperature and fish size on growth, feed intake, food conversion efficiency and stomach evacuation rate of Atlantic salmon post-smolts. Aquaculture 2008, 283, 36–42. [Google Scholar] [CrossRef]
  31. Lim, S.J.; Lee, K.J. Partial replacement of fish meal by cottonseed meal and soybean meal with iron and phytase supplementation for parrot fish Oplegnathus fasciatus. Aquaculture 2009, 290, 283–289. [Google Scholar] [CrossRef]
  32. Hamre, K.; Yufera, M.; Ronnestad, I.; Boglione, C.; Conceicao, L.E.C.; Izquierdo, M. Fish larval nutrition and feed formulation: Knowledge gaps and bottlenecks for advances in larval rearing. Rev. Aquacult. 2013, 5, S26–S58. [Google Scholar] [CrossRef]
  33. Wang, C.Y.; Wang, X.L.; Su, R.G.; Liang, S.K. No detected toxic concentrations in in situ algal growth inhibition tests-A convenient approach to aquatic ecotoxicology. Ecotoxicol. Environ. Saf. 2011, 74, 225–229. [Google Scholar] [CrossRef] [PubMed]
  34. Qiao, Z.; Yu, H. Effects of stationary phase elongation and initial nitrogen and phosphorus concentrations on the growth and lipid-producing potential of Chlorella sp. HQ. J. Appl. Phycol. 2014, 26, 141–149. [Google Scholar]
  35. Goudar, C.T.; Joeris, K.; Konstantinov, K.B.; Piret, J.M. Logistic equations effectively model mammalian cell batch and fed-batch kinetics by logically constraining the fit. Biotechnol. Prog. 2005, 21, 1109–1118. [Google Scholar] [CrossRef] [PubMed]
  36. Cattaneo, R.; Moraes, B.S.; Loro, V.L.; Pretto, A. Tissue biochemical alterations of Cyprinus carpio exposed to commercial herbicide containing clomazone under rice-field conditions. Tox. Arch. Environ. Contam. Toxicol. 2012, 62, 97–106. [Google Scholar] [CrossRef] [PubMed]
  37. Liebig, M.; Schmidt, G.; Bontje, D.; Kooi, B.W.; Streck, G.; Traunspurger, W.; Knacker, T. Direct and indirect effects of pollutants on algae and algivorous ciliates in an aquatic indoor microcosm. Aquat. Toxicol. 2008, 88, 102–110. [Google Scholar] [CrossRef]
  38. Kong, W.W.; Huang, S.L.; Shi, F.F.; Zhou, J.G.; Feng, Y.B.; Xiao, Y. Study on Microcystis aeruginosa growth in incubator experiments by combination of Logistic and Monod functions. Algal Res. 2018, 35, 602–612. [Google Scholar] [CrossRef]
  39. Li, X.Q.; Xu, L.G.; Ma, J.Y. Combination toxicity of Prometryne and permeating agent on Chlorella pyrenoidosa. China Environ. Sci. 2005, 25, 432–436. [Google Scholar]
  40. Jin, Z.P.; Luo, K.; Zhang, S.; Zheng, Q.; Yang, H. Bioaccumulation and catabolism of prometryne in green algae. Chemosphere 2012, 87, 278–284. [Google Scholar] [CrossRef]
  41. Topal, A.; Atamanalp, M.; Ucar, A.; Oruc, E.; Kocaman, E.M.; Sulukan, E.; Akdemir, F.; Beydemir, S.; Kilinc, N.; Erdogan, O.; et al. Effects of glyphosate on juvenile rainbow trout (Oncorhynchus mykiss): Transcriptional and enzymatic analyses of antioxidant defence system, histopathological liver damage and swimming performance. Ecotoxicol. Environ. Saf. 2015, 111, 206–214. [Google Scholar] [CrossRef]
  42. Song, M.; Fan, S.; Pang, C.; Wei, H.; Yu, S. Genetic analysis of the antioxidant enzymes, methane dicarboxylic aldehyde (MDA) and chlorophyll content in leaves of the short season cotton (Gossypium hirsutum L.). Euphytica 2014, 198, 153–162. [Google Scholar] [CrossRef]
  43. Bhunia, A.K.; Basu, N.K.; Roy, D.; Chakrabarti, A.; Banerjee, S.K. Growth, chlorophyll a content, nitrogen-fixing ability, and certain metabolic activities of Nostoc muscorum: Effect of methylparathion and benthiocarb. B. Environ. Contam. Tox. 1991, 47, 43–50. [Google Scholar] [CrossRef]
  44. Velisek, J.; Stara, A.; Koutnik, D.; Machova, J. Effects of prometryne on early life stages of common carp (Cyprinus carpio L.). Pestic. Biochem. Phys. 2015, 118, 58–63. [Google Scholar] [CrossRef]
  45. Yang, Z.J.; Huang, S.L.; Kong, W.W.; Chen, L.; Ekaterina, P.; Khatoon, Z.; Ashraf, M.; Akram, W. Effects of fish feed addition scenarios with prometryn on Microcystis aeruginosa growth and water qualities. Ecotoxicol. Environ. Saf. 2021, 209, 111810. [Google Scholar] [CrossRef] [PubMed]
  46. Liu, J.; Sun, Z.; Lavoie, M.; Fan, X.; Bai, X.; Qian, H. Ammonium reduces chromium toxicity in the freshwater alga Chlorella vulgaris. Appl. Microbiol. Biot. 2015, 99, 3249–3258. [Google Scholar] [CrossRef]
  47. Wang, W.X.; Dei, R.C.H. Metal stoichiometry in predicting Cd and Cu toxicity to a freshwater green alga Chlamydomonas reinhardtii. Environ. Pollut. 2006, 142, 303–312. [Google Scholar] [CrossRef] [PubMed]
  48. Serra, A.; Guasch, H.; Admiraal, W.; Geest, H.G.V.D. Influence of phosphorus on copper sensitivity of fluvial periphyton: The role of chemical, physiological and community-related factors. Ecotoxicology 2010, 19, 770–780. [Google Scholar] [CrossRef] [PubMed]
  49. Bengtsson, B.E. Effect of zinc on growth of the minnow Phoxinus phoxinus. Oikos 1974, 25, 370–373. [Google Scholar] [CrossRef]
  50. Barman, U.K.; Jana, S.N.; Garg, S.K.; Bhatnagar, A.; Arasu, A.R.T. Effect of inland water salinity on growth, feed conversion efficiency and intestinal enzyme activity in growing grey mullet, Mugil cephalus (Linn.): Field and laboratory studies. Aquacult. Int. 2005, 13, 241–256. [Google Scholar] [CrossRef]
  51. Shannon, L.J.; Coll, M.; Yemane, D.; Jouffre, D.; Neira, S.; Bertrand, A.; Diaz, E.; Shin, Y.J. Comparing data-based indicators across upwelling and comparable systems for communicating ecosystem states and trends. ICES J. Mar. Sci. 2010, 67, 807–832. [Google Scholar] [CrossRef]
Figure 1. Variations in body weight (a) and body length (b) of crucian carp over time.
Water 16 02531 g001
Figure 2. Variations of: (a) M. aeruginosa densities; (b) growth rates; (c) specific growth rates; (d) inhibitions rates over time.
Water 16 02531 g002aWater 16 02531 g002b
Figure 3. Variations of nutrient concentrations (ad), consumed concentrations of nutrients (eh) and EC (i) with time. Left axis corresponds to FA and FAP groups; right axis corresponds to F group.
Water 16 02531 g003aWater 16 02531 g003bWater 16 02531 g003c
Figure 4. Relationship between inhibition rates and concentrations of consumed nutrients. (a) TDN. (b) PO43−-P. (c) TDP.
Water 16 02531 g004
Figure 5. The relationship between fish growth (a, body weight; b, body length) and the EC of water.
Water 16 02531 g005
Table 1. Physiological and biochemical indicators of fish and algae.
ParameterFFAFAP
Parameters that are related to growth of crucian carp
aW−2.79−2.97−3.06
rW0.080.080.05
BWmax19.7419.5618.92
R20.9710.7750.751
aL−3.67−3.60−3.92
rL0.050.020.02
BLmax94.3394.5995.66
R20.9950.8940.915
FCE9.01 ± 0.26 a8.50 ± 0.32 a1.01 ± 0.02 b
PER29.34 ± 0.18 a28.35 ± 0.21 a3.36 ± 0.26 b
Parameters of equations describing growth of M. aeruginosa
a-6.667.20
r/d−1-0.160.15
Nmax-165.68130.62
Nave-90.8661.94
R2-0.9920.994
μ′cmax-6.634.90
μ′cave-1.811.55
μcmax-0.160.15
μcave-0.050.05
Imax--59.48
Iave--39.25
Antioxidant indexes of fish in different groups
CAT (U/mgprot)0.74 ± 0.01 a0.73 ± 0.00 a0.67 ± 0.01 b
SOD (U/mgprot)0.67 ± 0.02 a0.65 ± 0.00 a0.55 ± 0.03 b
MDA (nmol/mgprot)0.16 ± 0.00 a0.16 ± 0.02 a0.17 ± 0.01 a
Antioxidant indexes of algae in different groups
CAT (U/mgprot)-7.91 ± 1.02 b37.75 ± 0.76 a
SOD (U/mgprot)-25.19 ± 2.42 a28.14 ± 1.36 a
MDA (nmol/mgprot)-1.36 ± 0.08 b1.93 ± 0.01 a
Notes: F, fish only; FA, fish + algae; FAP, fish + algae + prometryn. aW/aL (-), a constant; rW/rL (d−1), rate constant; BWmax (%), the maximum BW of fish; BLmax (%), the maximum BL of fish; R2, correlation coefficient; Nmax (1 × 10³ cells mL−1), the maximum algae density; a (-), a constant; r (d−1), rate constant; Nave (1 × 10³ cells mL−1), the average algae density; μ′cmax (1 × 10³ cells (mL d)−1), the maximum growth rate; μ′cave (1 × 10³ cells (mL d)−1), the average growth rate; μcmax (d−1), the maximum specific growth rate; μcave (d−1), the average specific growth rate; Imax (%), the maximum inhibition rate; Iave (%), the average inhibition rate; -, data not applicable. Some of the data (FCE, PER, CAT, SOD and MDA) shown are the mean ± SD of three independent measurements. Values in the same column with different superscript letters are significantly different (p < 0.05); values followed by the same letter are not significantly different from one another (p > 0.05).
Table 2. Parameters of Logistic equation describing concentrations of consumed nutrients.
ΔTDNΔPO43−-PΔTDP
ParametersFAFAPFAFAPFAFAP
aΔC (-)2.692.492.903.392.873.64
rΔC (d−1)0.080.060.060.070.060.08
ΔCmax (mg L−1)13.8913.021.641.512.382.21
R20.9890.9600.9520.9760.9630.991
ΔCave (mg L−1)8.667.320.870.741.211.03
aΔC, a constant; rΔC, the consumed rate constant; ΔCmax, the maximum concentrations of consumed nutrients; R2, correlation coefficient; ΔCave, the average concentrations of consumed nutrients. Data were obtained by fitting three independent measurements.
Disclaimer/Publisher’s Note: The statements, opinions and data contained in all publications are solely those of the individual author(s) and contributor(s) and not of MDPI and/or the editor(s). MDPI and/or the editor(s) disclaim responsibility for any injury to people or property resulting from any ideas, methods, instructions or products referred to in the content.

