Article

Impact of Chemical Oxygen Demand/Total Nitrogen Ratio on Shifting Autotrophic Partial Nitrification to Heterotrophic Nitrification and Aerobic Denitrification in High-Strength Ammonium Wastewater Treatment

Faculty of Environmental Science and Engineering, Kunming University of Science and Technology, Kunming 650500, China
*
Authors to whom correspondence should be addressed.
Water 2024, 16(17), 2532; https://doi.org/10.3390/w16172532
Submission received: 24 July 2024 / Revised: 27 August 2024 / Accepted: 2 September 2024 / Published: 6 September 2024
(This article belongs to the Section Wastewater Treatment and Reuse)

Abstract

:
Partial nitrification (PN) is an effective process for treating high-strength ammonium wastewater with a low COD/N (chemical oxygen demand/total nitrogen) ratio; this is because the cooperative interaction with denitrification or anammox can result in a reduction in aeration costs of approximately 25% and a reduction in the use of organic sources during biological nitrogen removal of 40%. However, the key functional microorganisms in the partial nitrification (PN) process are ammonia-oxidizing bacteria (AOB), which are autotrophic microorganisms that are influenced by carbon sources. Therefore, the COD/N ratio affects the performance of the PN process when treating high-strength ammonium wastewater. In this study, five sequence batch reactors were constructed and operated for 42 days; they were fed with synthetic high-strength ammonium wastewater (500 mg/L) with various COD/N ratios (at 0, 0.5, 1, 2, and 4). The results suggested that the PN process could be accomplished at COD/N ratios of 0 and 0.5, but its performance decreased significantly when the COD/N ratio increased to 1 due to the occurrence of simultaneous nitrification and denitrification. The AOB could not compete with the heterotrophic bacteria; as the COD/N ratios increased, the abundance of Nitrosomonas (a genus of autotrophic AOB) decreased, and it was not detected at COD/N ratios of 2 and 4. Instead, the heterotrophic nitrification and heterotrophic denitrification (HNAD) bacteria appeared, and their relative abundance increased when the COD/N ratios increased from 1 to 4.

1. Introduction

It is important to note that landfill leachate, sludge digestion effluent, and industrial wastewater (e.g., from oil refining, fertilizer production, and meat processing) contain not only a high level of organic matter but also high ammonium (500–2500 mg/L) [1]. The wastewater causes eutrophication and toxic algal blooms, threatening human health and the ecosystem [2]. The conventional biological nitrogen removal process (nitrification–denitrification) requires extensive air circulation for nitrification and a supplementary organic carbon source for denitrification; many novel nitrogen removal processes have been proposed. The majority of these processes involve partial nitrification (PN), PN–denitrification [3], PN–anammox [4], and PN–anammox–denitrification [5] due to the fact that PN reduces the aeration cost by 25% and the organic source by 40%; it also reduces surplus sludge production [1].
The PN process is generally executed by ammonia-oxidizing bacteria (AOB), which are autotrophic; the prevalent genera are Nitrosomonas, Nitrosospira, Nitrosovibrio, and Nitrosolobus [6]. The bacteria known as heterotrophic bacteria (HB) grow quickly and produce a large amount of biomass; thus, they grow better than AOB when there is a large amount of organic carbon present. Mosquera-Corral et al. observed a decline in PN performance when COD/N exceeded 0.3 due to the impact of HB [7]. However, Cao et al. found that the PN process could occur at COD/N ratios of both 0 and 0.66; the latter appeared to be more stable and was capable of nitrogen removal through the denitrification process [8]. Li et al. also revealed that controlling DO below 0.2 mg/L allowed the occurrence of PN when treating the wastewater at COD/N ratios of 0.33 and 1 [9]. An identical PN efficiency was obtained for COD/N below 1 and for COD/N between 1 and 2 [10]. Friedman et al. found that the genus Nitrospira predominated over AOB and the genus Nitrobacter in oil aquifer treatment of synthetic secondary effluent when COD/N ratios were 3 and 5, strongly indicating the activity of complete ammonia-oxidizing bacteria [11]. The aforementioned findings indicate that the COD/N ratios exert a significant impact on the stability of the PN process; to date, however, no conclusive results have been obtained. Thus, it is imperative to conduct a comprehensive investigation into the detailed impact of the COD/N ratio on the PN process and to elucidate the mechanism, the functional microorganisms, and their functions in nitrogen metabolism at various COD/N ratios.
Recently, heterotrophic nitrification has gained increasing attention [12]. In particular, heterotrophic nitrification–aerobic denitrification (HNAD) was successfully employed to treat high-strength ammonium wastewater, such as landfill leachate [13] and piggery and cow wastewater [14], as well as anaerobic digestate effluent [15]. To date, over 20 genera of functional HNAD bacteria have been identified, including Acinetobacter, Bacillus, Comamonas, Flavobacterium, Paracoccus, and Pseudomonas [12]. Although the high COD/N ratio has an adverse effect on the PN process, it has benefited the HNAD process since HNAD bacteria require organic carbon sources. Nonetheless, there was limited knowledge regarding the transformation process of PN to HNAD.
Therefore, synthetic high-strength ammonium wastewater (500 mg/L) with various COD/N ratios (at 0, 0.5, 1, 2, 4) was fed into five sequence batch reactors (SBRs). The nitrogen removal performance, the bacterial activity and community, and the functional microorganisms and genes were analyzed. An optimal COD/N ratio is required to obtain a stable PN process, and the possible transformation of PN to HNAD at a certain COD/N ratio may also be involved. The aim of this study is to offer practical insights for applying the PN process in wastewater treatment with varying COD/N ratios.

2. Materials and Methods

2.1. Experimental Set-Up and Operation Strategy

The experimental set-up and operational parameters are shown in Figure S1 and Table 1, respectively. Five SBR reactors were used in the experiment, each with a working volume of 1 L. The reactors were equipped with internal stirring, aeration, and temperature control devices, maintaining a temperature of 26 ± 1 °C. The SBR volume exchange ratio was 50%, and the hydraulic retention time was 12 h. Every single cycle of the SBRs had a total duration of 6 h, which included 0.25 h of filling, 5 h of aerobic reaction, 0.5 h of settling, and 0.25 h of decanting. To suppress the growth of nitrite-oxidizing bacteria (NOB), the sludge retention time and DO concentration were controlled at 13.5 days and 0.5–1 mg/L, respectively. Meanwhile, due to the different COD concentrations in each reactor, the aeration rates required to maintain a consistent DO concentration varied, as shown in Table 1.

2.2. Seeding Sludge and Synthetic Wastewater

The seeding sludge was acquired from a well-run PN reactor in our laboratory; in the sludge, the mixed suspended solids concentration was 6320 mg/L and the mixed volatile suspended solids concentration was 1930 mg/L. The seeding sludge was divided equally into five parts and put into the SBR reactors.
The synthetic wastewater that was pumped into the SBRs was composed of (NH4)2SO4 (NH4+-N, 500 mg/L) and sodium acetate as ammonium and organic carbon sources. The other components were MgSO4·7H2O (300 mg/L), KH2PO4 (10 mg/L), CaCl2·2H2O (56.5 mg/L), NaHCO3 (5500 mg/L), and trace solutions I (1 mL/L) and II (1.25 mL/L); the compositions of the latter two solutions were in accordance with those given in reference [16]. The pH was adjusted to 7.0–7.5 by adding 1 M of HCl or 1 M NaOH.

2.3. Analytical Methods

The samples were collected every two days and subjected to filtering with a 0.45 m syringe filter. The ammonium, nitrite, nitrate, MLSS, MLVSS, and COD were analyzed according to the standard methods [17] and the HACH chemical method. Additionally, The COD demand for removing 1 g of N=NO2 is 1.14 g COD. The pH and dissolved oxygen (DO) were measured using a pH meter (Remagnet, Shanghai, China) and a benchtop dissolved oxygen meter (MP516, San Xin, Shanghai, China), respectively. The ammonium removal rate (ARR), nitrite accumulation rate (NAR), concentration of free ammonia (FA), and free nitrous acid (FNA) in the SBRs were determined using Equations (1)–(4), respectively [8].
ARR = ( C Inf - NH 4 + C Eff - NH 4 + ) / C Inf - NH 4 +
NAR = C Eff - NO 2 / ( C Eff - NO 2 + C Eff - NO 3 )
FA = 17 / 14 × C NH 4 + × 10 pH / ( exp 6334 / ( 273 + T ) + 10 pH )
FNA = 46 / 14 × C NO 2 / 10 pH / exp 2300 / ( 273 + T )
where C Inf - NH 4 + and C Eff - NH 4 + are the ammonium concentrations in the influent and effluent, and C Eff - NO 2 and C Eff - NO 3 are the nitrite and nitrate concentrations in the effluent. C NH 4 + and C NO 2 are the ammonium and nitrite concentrations. T indicates the temperature (°C).

2.4. Extracellular Polymeric Substance Extraction and Analysis

The extracellular polymeric substance (EPS), which was divided into loosely bound EPS (LB-EPS) and tightly bound EPS (TB-EPS), was extracted using a heating method [16]. Firstly, after the sludge had been placed until it settled, the supernatant was discarded, and the sludge was resuspended with 0.01 M phosphate buffer solution (PBS) three times. The left sludge pellet was mixed with 0.01 M PBS; after centrifugation at 5000 rpm for 15 min at 4 °C, the supernatant was collected as LB-EPS. The pellet resuspended in 0.1 M of PBS was shaken at 200 prm for 30 min at 70 °C and then centrifuged at 10,000 rpm for 15 min at 4 °C. Using a 0.45 µm syringe filter, the filtered supernatant was collected as TB-EPS. The proteins and polysaccharides of the EPS were determined using a bicinchoninic acid assay and the anthrone method, respectively [16].
The excitation–emission matrix (EEM) spectra of the EPS solution were measured using a fluorescence spectrometer (F-7000, Hatchi, Janpan). The EEM spectra were analyzed by scanning the emission (Em) spectra from 200 nm to 400 nm at 5 nm intervals and the excitation wavelengths (Ex) from 290 nm to 550 nm at 1 nm increments [18]. The scanning speed was set at 2400 nm/min. Parallel factor analysis (PARAFAC), applied using MATLAB R2018a with the EFC toolkit, was used to handle the EEM data [19].

2.5. Specific Oxygen Uptake Rate

As per the findings of Surmacz-Gorska et al. [20], the specific oxygen uptake rate (SOUR) was determined. Firstly, synthetic wastewater containing ammonium, nitrite, and an organic carbon source was prepared as described in Section 2.2. Subsequently, it was fully aerated to achieve a DO concentration above 8 mg/L. The sludge sample was mixed with the synthetic wastewater; then, the mixture was sealed in a glass tube and the DO was recorded every 15 s. SOUR1, which represented the SOUR of the total bacteria, was obtained after 3 min. Then, NaClO3 (2.13 g/L) was added as an inhibitor of the NOB, and SOUR2 was obtained after the following 3 min. Finally, arylthiourea (5 mg/L) was added as an inhibitor of the AOB, and SOUR3 was obtained after another 3 min. The SOUR of the AOB, NOB, and HB could be calculated using Equations (5)–(7):
SOUR AOB = SOUR 2 SOUR 3
SOUR NOB = SOUR 1 SOUR 2
SOUR HB = SOUR 1 SOUR 2 SOUR 3

2.6. Bacterial Analysis

The SBRs were located in Kunming, Yunnan Provence, Chian at 24°50′55″ N, −24°51′45″ E. On day 42 (17 June 2021), fifty milliliters of suspended sludge samples were collected from each reactor and centrifuged at 10,000 rpm for 15 min at 4 °C. The PowerSoil DNA Isolation Kit (MoBio Laboratories, Carlsbad, CA, USA) was used to extract the genomic DNA from 0.5 g of the pellet. Polymerized chain reaction (PCR) amplifications were performed using the primer set of 338F (5′-ACTCCTACGGGAGGCAGCA-3′) and 806R (5′-GGACTACHVGGGTWTCTAAT-3′), which amplified the V3-V4 region of the 16S rRNA. The reaction mixture, which measured 20 μL, comprised 4 μL of 5 × FastPfu buffer, 2 μL of deoxynucleotide triphosphate (0.5 mM), 0.8 μL of each primer (5 μM), 0.4 μL of FastPfu polymerase, and 10 ng of template DNA. The PCR was carried out as follows: initial denaturation at 95 °C for 3 min, 27 cycles of denaturation at 95 °C for 30 s, annealing at 55 °C for 30 s, and extension at 72 °C for 30 s, as well as a final extension at 72 °C for 10 min. The PCR products were confirmed using 2% agarose gel and purified using the AxyPrep DNA Gel Extraction Kit (Axygen Biosciences, Union City, CA, USA); then, they were specified using the Quantus™ Fluorometer. The purified PCR products were sequenced and analyzed by Majorbio Bio-Pharm Technology Co., Ltd. (Shanghai, China) on the Illumina Miseq PE300 platform. The raw Illumina sequencing data were deposited in the NCBI Sequence Read Archive (BioProject accession: PRJNA860110).
To establish the functional composition of the bacterial genome, the phylogenetic investigation of communities by reconstruction of unobserved states (PICRUSt) was employed to analyze the 16S rRNA gene sequences and to deduce functions from the Kyoto Encyclopedia of Genes and Genomes. To acquire predictive information, the predicted metagenome was classified into KEGG orthologs.

2.7. Statistical Analysis

The significant differences of the samples were determined by analysis of variance (ANOVA) using SPSS Statistics software (version 20), and the correlations were confirmed using Pearson’s correlation coefficient.

3. Results

3.1. Reactor Performance

Figure 1 provides the performances of the five reactors operating for 42 days at different COD/N ratios. In all of the reactors, except Rd, the effluent nitrite concentration was higher than the influent ammonium concentration due to the autolysis of seeding sludge during the initial 5 days (adoption phase) and the conversion of organic nitrogen into ammonium and nitrite [16]. For Ra and Rb, the effluent ammonium concentrations (Figure 1A,C) were mainly below 100 mg/L during the operation periods. In particular, during the days 34–42, they reached 12.5 ± 13.6 and 32.8 ± 33.1 mg/L, respectively, with average ARRs of 97.5 ± 2.7% and 93.4 ± 6.6% (Figure 1B,D). Correspondingly, the average effluent nitrite concentrations in Ra and Rb were 404.5 ± 25.6 and 346.5 ± 6.5 mg/L, respectively, with mean NARs of 91.2 ± 3.4% and 88.4 ± 6.9%. This showed that a stable PN process was achieved in those two reactors, and the effluent ammonium, ARR, and NAR were similar between them. Moreover, the effluent nitrite of Ra was higher than that of Rb (ANOVA, p < 0.5), which means that the Ra had a higher nitrite yield than that of Rb. After day 8, a decrease in TN was intermittently observed in Ra, with TN removal from 0 to 17.3%. This indicated that denitrification occurred in Ra even though no organic carbon source was present; it is possible that the EPS secreted by the microorganisms contributed to the organic carbon source needed by the denitrification process [21]. The TN removal percentage fluctuated between 7.2% and 39.3% in Rb starting from day 4, which was higher than that of Ra and was probably caused by the presence of organic carbon sources that helped the denitrifiers to grow [22].
For Rc (Figure 1E,F), the effluent ammonium and nitrite concentrations were in the ranges of 15.0–73.9 and 236.2–529.0 mg/L, respectively, during the initial 18 days, with the ARR above 85.0%, NAR above 98%, and TN removal below 37.2%. The results showed that a well-performed PN and denitrification co-existed in this stage. As the process continued, the average effluent ammonium and nitrite concentrations reached 171.6 ± 29.6 and 59.9 ± 19.5 mg/L, respectively, with an average TN removal of 53.6 ± 4.0% after day 22, indicating that the nitrite could not accumulate further, and the PN ability of Rc was significantly decreased.
In Rd and Re (Figure 1G–J), the effluent nitrite concentrations were in the ranges of 391.8–547.0 and 191.3–449.7 mg/L, respectively, during the initial 4 days. Then, they decreased sharply to 0 from day 6 and day 8 for Rd and Re, respectively, and the NAR became 0. After that day, their average effluent ammonium concentrations were 143.7 ± 24.1 and 120.7 ± 40.4 mg/L, respectively. The TN removal averages were 69.9 ± 5.4% and 75.4 ± 8.1%. It was observed that the PN process completely disappeared when the influent COD/N ratio surpassed 1, but the enhanced denitrification could be achieved.
Overall, the PN process was stable at COD/N ratios of 0 and 0.5. If the COD/N ratio was 1, the PN efficiency declined significantly and was accompanied by the removal of TN. The PN totally disappeared at COD/N ratios of 2 and 4, and the TN removal was continuously increased.

3.2. Typical Single Cycle in Reactors

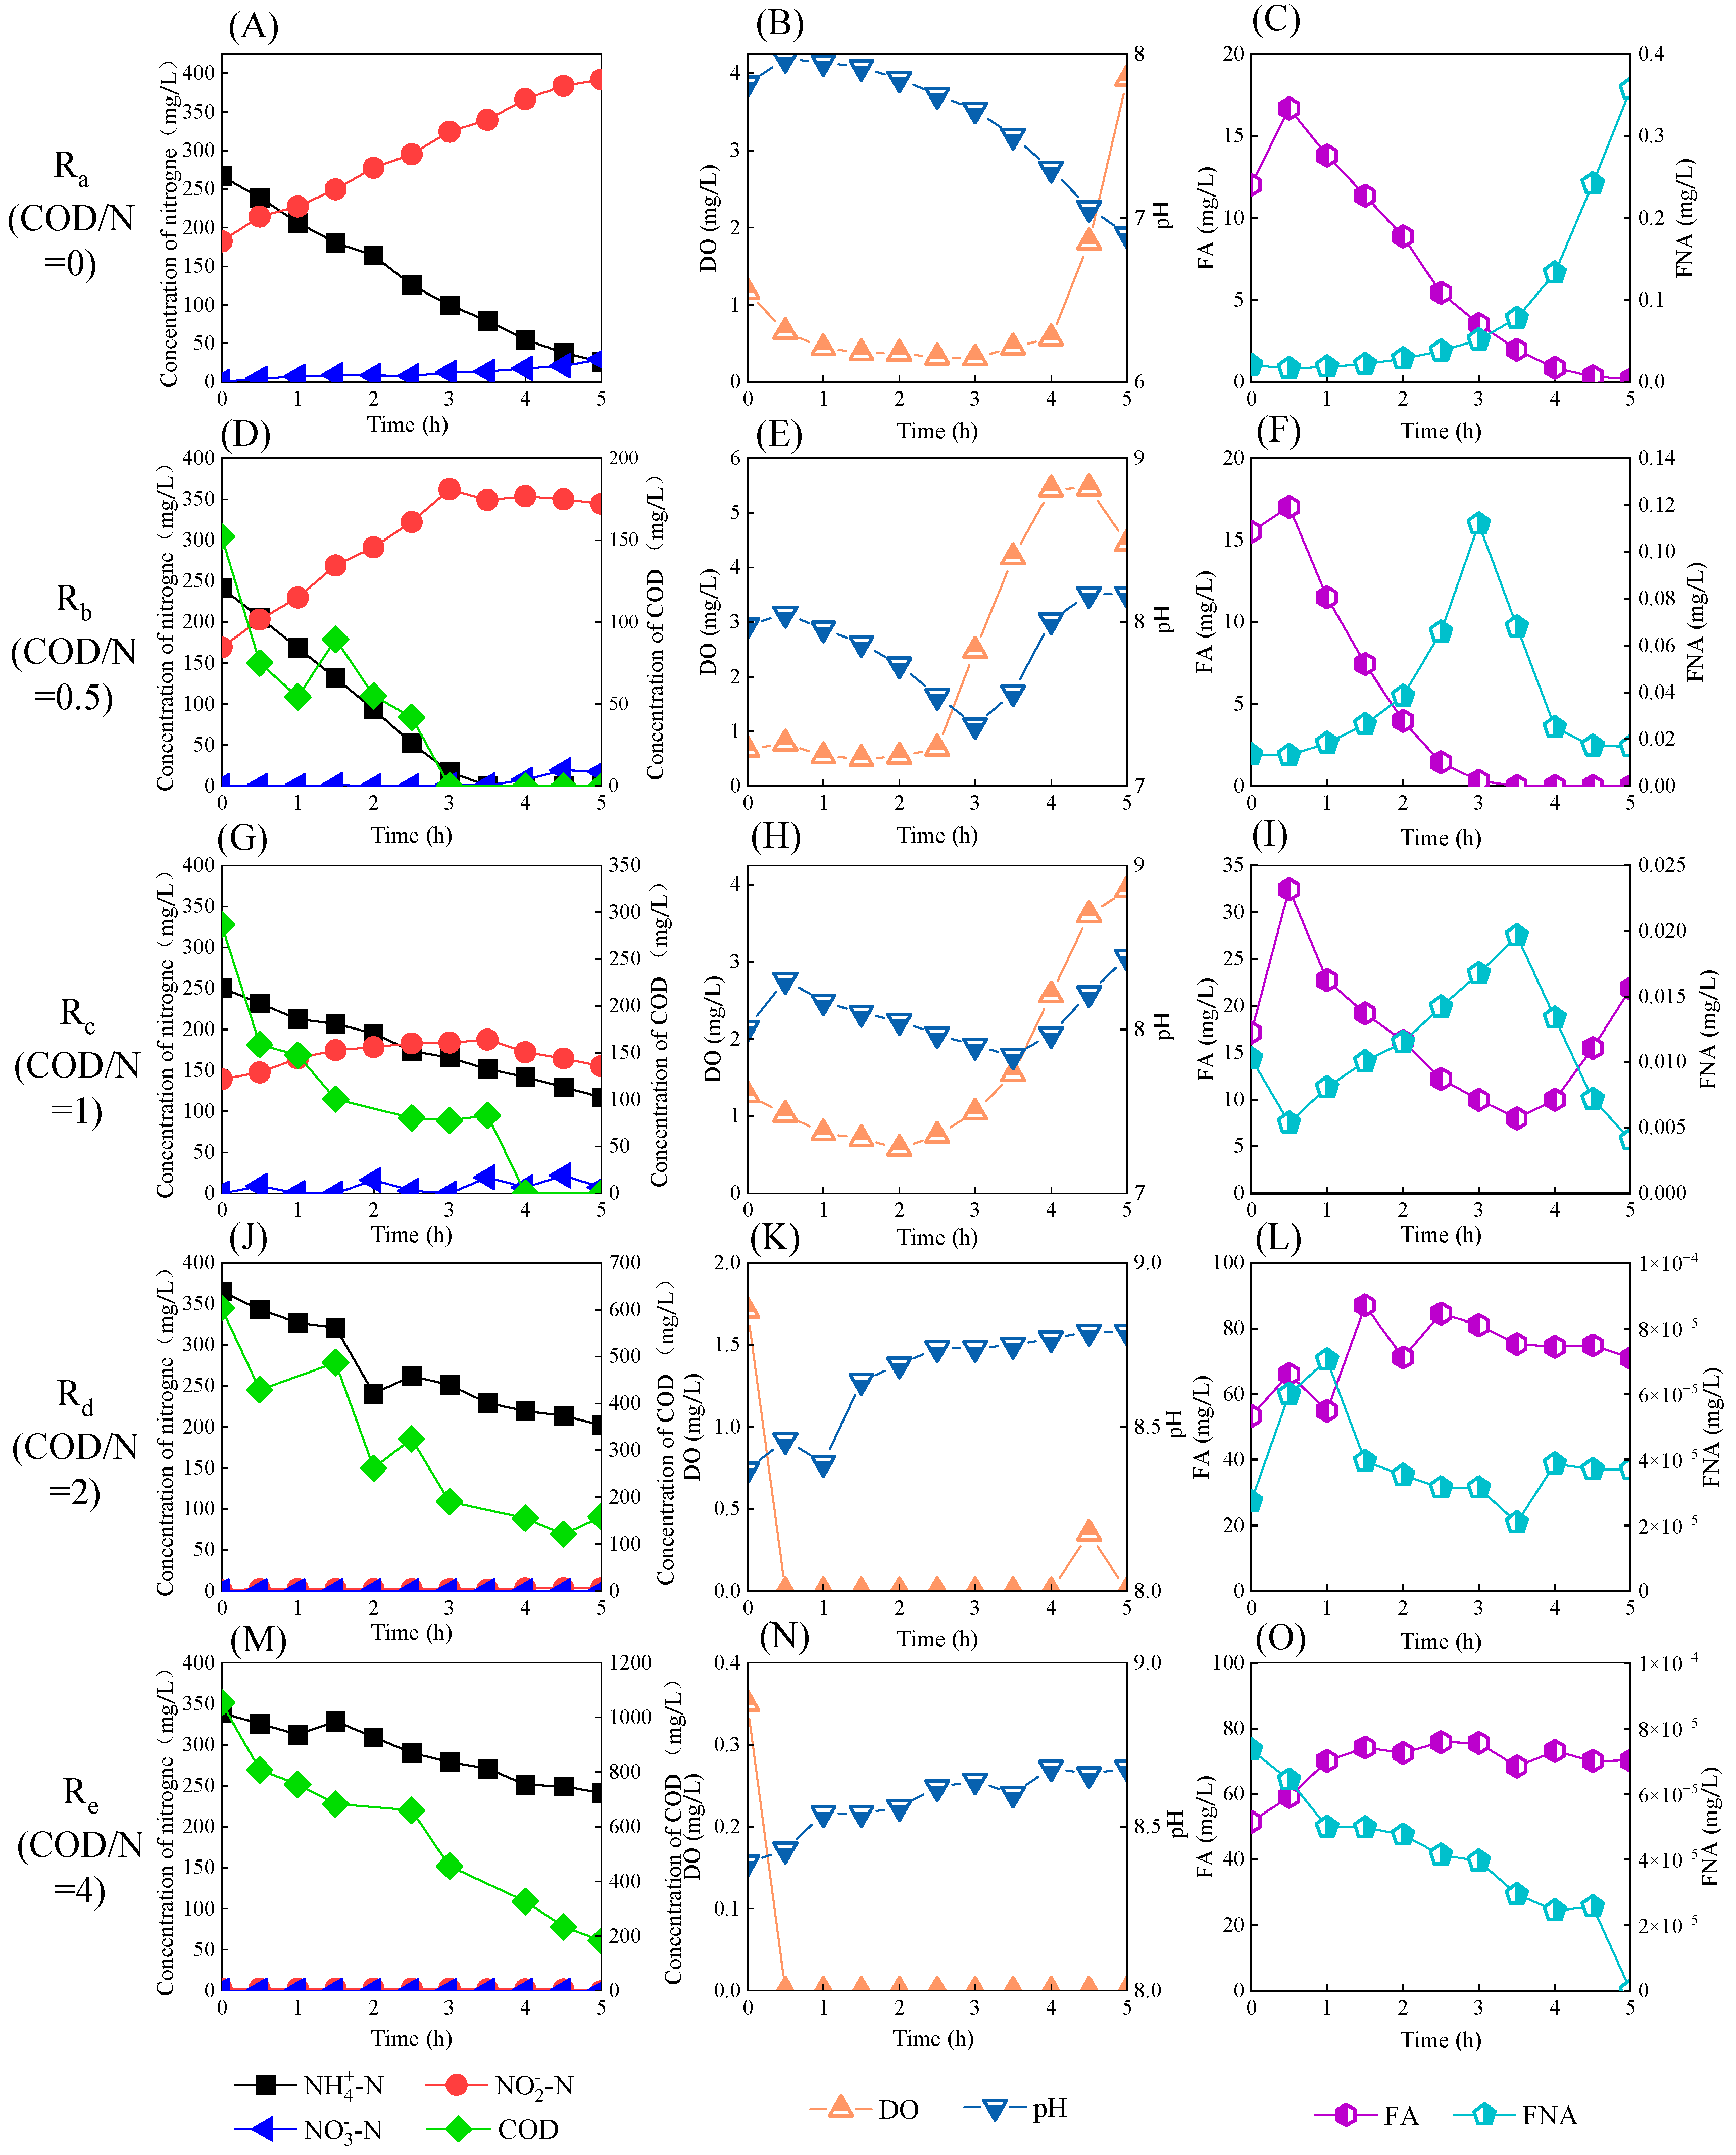
To examine the transformation of nitrogen in the different reactors, the variations in ammonium, nitrite, nitrate, COD, pH, and DO were measured in a typical single cycle on day 42 (Figure 2). In the single cycle of Ra, the ammonium concentration declined steadily from 266.9 mg/L to 26.3 mg/L, the nitrite concentration increased correspondingly from 182.2 mg/L to 392.0 mg/L, and the nitrate concentration increased from 0 to 29.5 mg/L. Similarly, in the typical single cycle of Rb, the ammonium and COD concentrations reduced from 241.9 mg/L and 152 mg/L to 17.5 mg/L and 0, respectively, and the nitrite increased from 169.1 to 362.0 mg/L within the initial three hours. From the third to the fifth hour, the nitrite concentration decreased slightly from 353.6 mg/L to 344.4 mg/L, while the nitrate concentration increased from 1.4 mg/L to 17.7 mg/L. The amount of nitrite reduction approached the amount of nitrate increase, and the DO was above 2 mg/L (Figure 2E), indicating that nitrification occurred during this time period.
During the typical single cycle of Rc, the ammonium concentration gradually decreased from 250.7 mg/L to 117.3 mg/L, while the nitrite concentration increased from 139.0 mg/L to 187.6 mg/L at the 3.5th hour, then finally fell off to 155.3 mg/L at the 5th hour, with a TN loss of 78.2 mg/L. In the typical single cycles of Rd and Re, the nitrite and nitrate concentrations maintained a level near 0, while the ammonium and COD concentrations decreased. A higher ratio of COD/N resulted in a reduction in ammonium loss, albeit with a greater reduction in TN loss.
Meanwhile, due to the alkalinity generation in the denitrification process [22], their pH values increased slightly from the initial values of 8.37 and 8.39 to 8.79 and 8.68, respectively. Figure 2 shows how FA and FNA change in a single cycle. They were reported to inhibit the AOB and NOB growth, in which the FA inhibited the AOB in the range of 10–150 mg/L and the NOB in the range of 0.1–1 mg/L, and FNA inhibited them in the range of 0.42–1.72 mg/L and 0.011–0.07 mg/L [23]. As can be seen, the FA concentrations in all the reactors exceeded 10 mg/L. In particular, in the entire single cycle of Rd and Re, it reached 87.0 and 74.1 mg/L, respectively. This implies that at COD/N ratios of 2 and 4, the AOB was inhibited by FA throughout the entire cycle, thereby explaining the failure or low efficiency of PN in these systems. Furthermore, as the concentrations of FNA in all the reactors were all below 0.4 mg/L, the growth of the AOB was not affected.

3.3. EPS Analysis

3.3.1. EPS Content

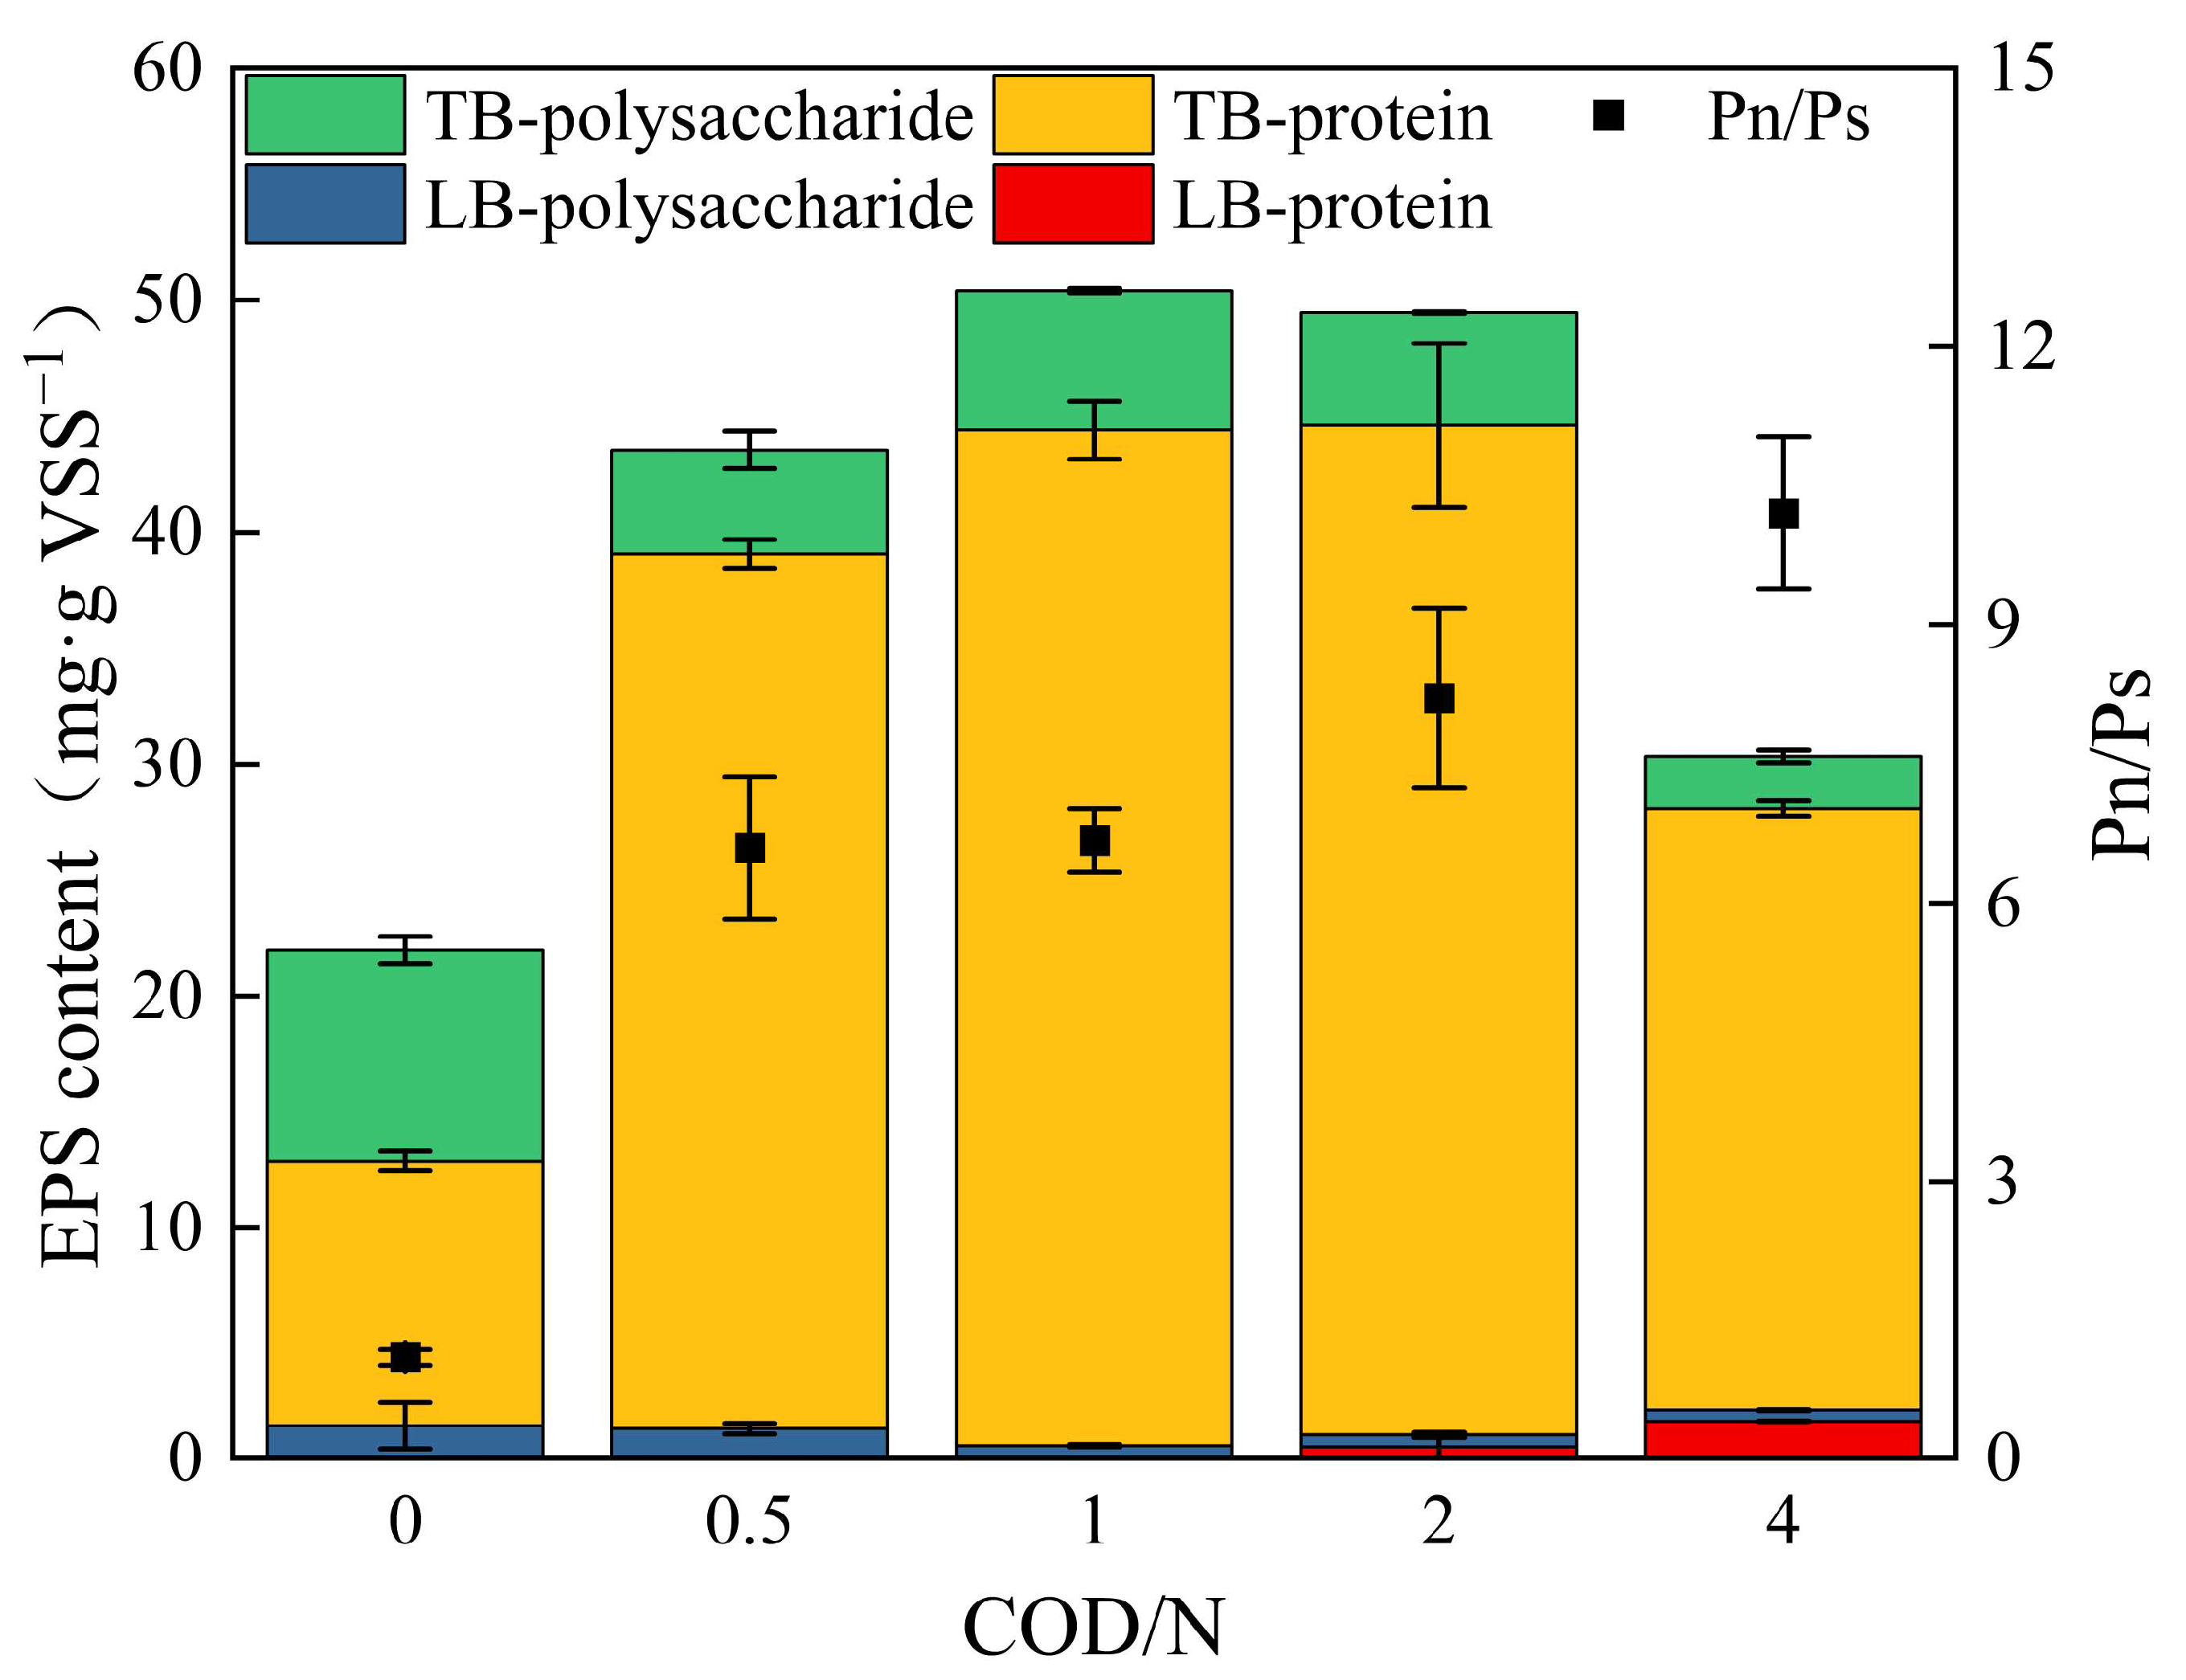
EPS is closely related to the aggregation degree, settling performance, and settleability of sludge, which are further related to the stability of the reactor operation [24]. After 42 days of operation, the EPS was extracted from the sludge of each reactor, and the protein and polysaccharide contents were determined as shown in Figure 3. The EPS contents in Ra, Rb, Rc, Rd, and Re were 21.00 ± 0.01, 43.55 ± 0.05, 50.42 ± 1.09, 49.46 ± 4.00, and 30.34 ± 0.61 mg/gVSS, respectively. The lowest EPS in Ra was due not only to the lack of organic carbon source for EPS secretion but also to the EPS consumption by HB. The TB-EPS contents accounted for 93.6%, 97.1%, 98.9%, 98.0%, and 93.1%, respectively, of the total EPS, and the LB-EPS content accounted for a relatively low value, which was similar to the others [24,25]. In addition, proteins were the main components of EPS, accounting for 52.3%, 86.8%, 87.0%, 89.1%, and 91.0%, respectively, for Ra, Rb, Rc, Rd, and Re. The polysaccharide content of Ra (10.5 ± 1.6 mg/g VSS) was significantly higher than those of Rb, Rc, Rd, and Re (5.8 ± 1.0, 6.6 ± 0.2, 5.4 ± 0.1 and 2.7 ± 0.3 mg/gVSS). Compared to the polysaccharide content in the activated sludge EPS, the polysaccharide contents in the AOB-enriched sludge were usually higher as more extracellular enzymes as proteins were present in the activated sludge [26]. The protein-to-polysaccharide ratios (Pn/Ps) in Ra, Rb, Rc, Rd, and Re were 1.1 ± 0.1, 6.6 ± 0.8, 6.7 ± 0.3, 8.2 ± 1.0 and 10.2 ± 0.8, respectively. Those ratios had an important effect on the stability and settling performance of the sludge.

3.3.2. Characterization of EPS Components Using 3D-EEM-PARAFAC

PARAFAC was used to separate the overlapping 3D-EEM spectra, and the results are shown in Figure S2. Two components (C1 and C2) were identified in LB-EPS and TB-EPS. For the LB-EPS fraction, C1 was observed at the excitation/emission (Ex/Em) of (270,360)/435 nm and was defined as a humic/fulvic acid-like substance [18,27]. C2 is identified by the characteristic peaks at Ex/Em of 220/333 nm, which represent an aromatic protein substance [18,28]. For the TB-EPS fraction, the C1 component is classified as an aromatic protein (Ex/Em = 225/347 nm) and microbial byproduct-like substance (Ex/Em = 280/347 nm) [18,27]. C2 with three peaks at Ex/Em = (220,270,370)/449 is considered a humic/fulvic acid-like substance [18,27,28]. The relative content of a component is indicated by the maximum fluorescence (Fmax); a greater Fmax value denotes a higher relative content of the component. In the TB-EPS, the Fmax values of C1 were 0.16 ± 0.04, 0.23 ± 0.03, 0.22 ± 0.01, 0.25 ± 0.02, and 0.17 ± 0.04 for Ra, Rb, Rc, Rd, and Re, respectively, which correlated positively with the protein trends (r = 0.92, p < 0.05, Pearson), verifying that the fluorescence intensity of the aromatic protein and microbial byproduct-like substances in TB-EPS could reflect the protein content.

3.4. The Influence of COD/N Ratio on Specific Oxygen Uptake Rates

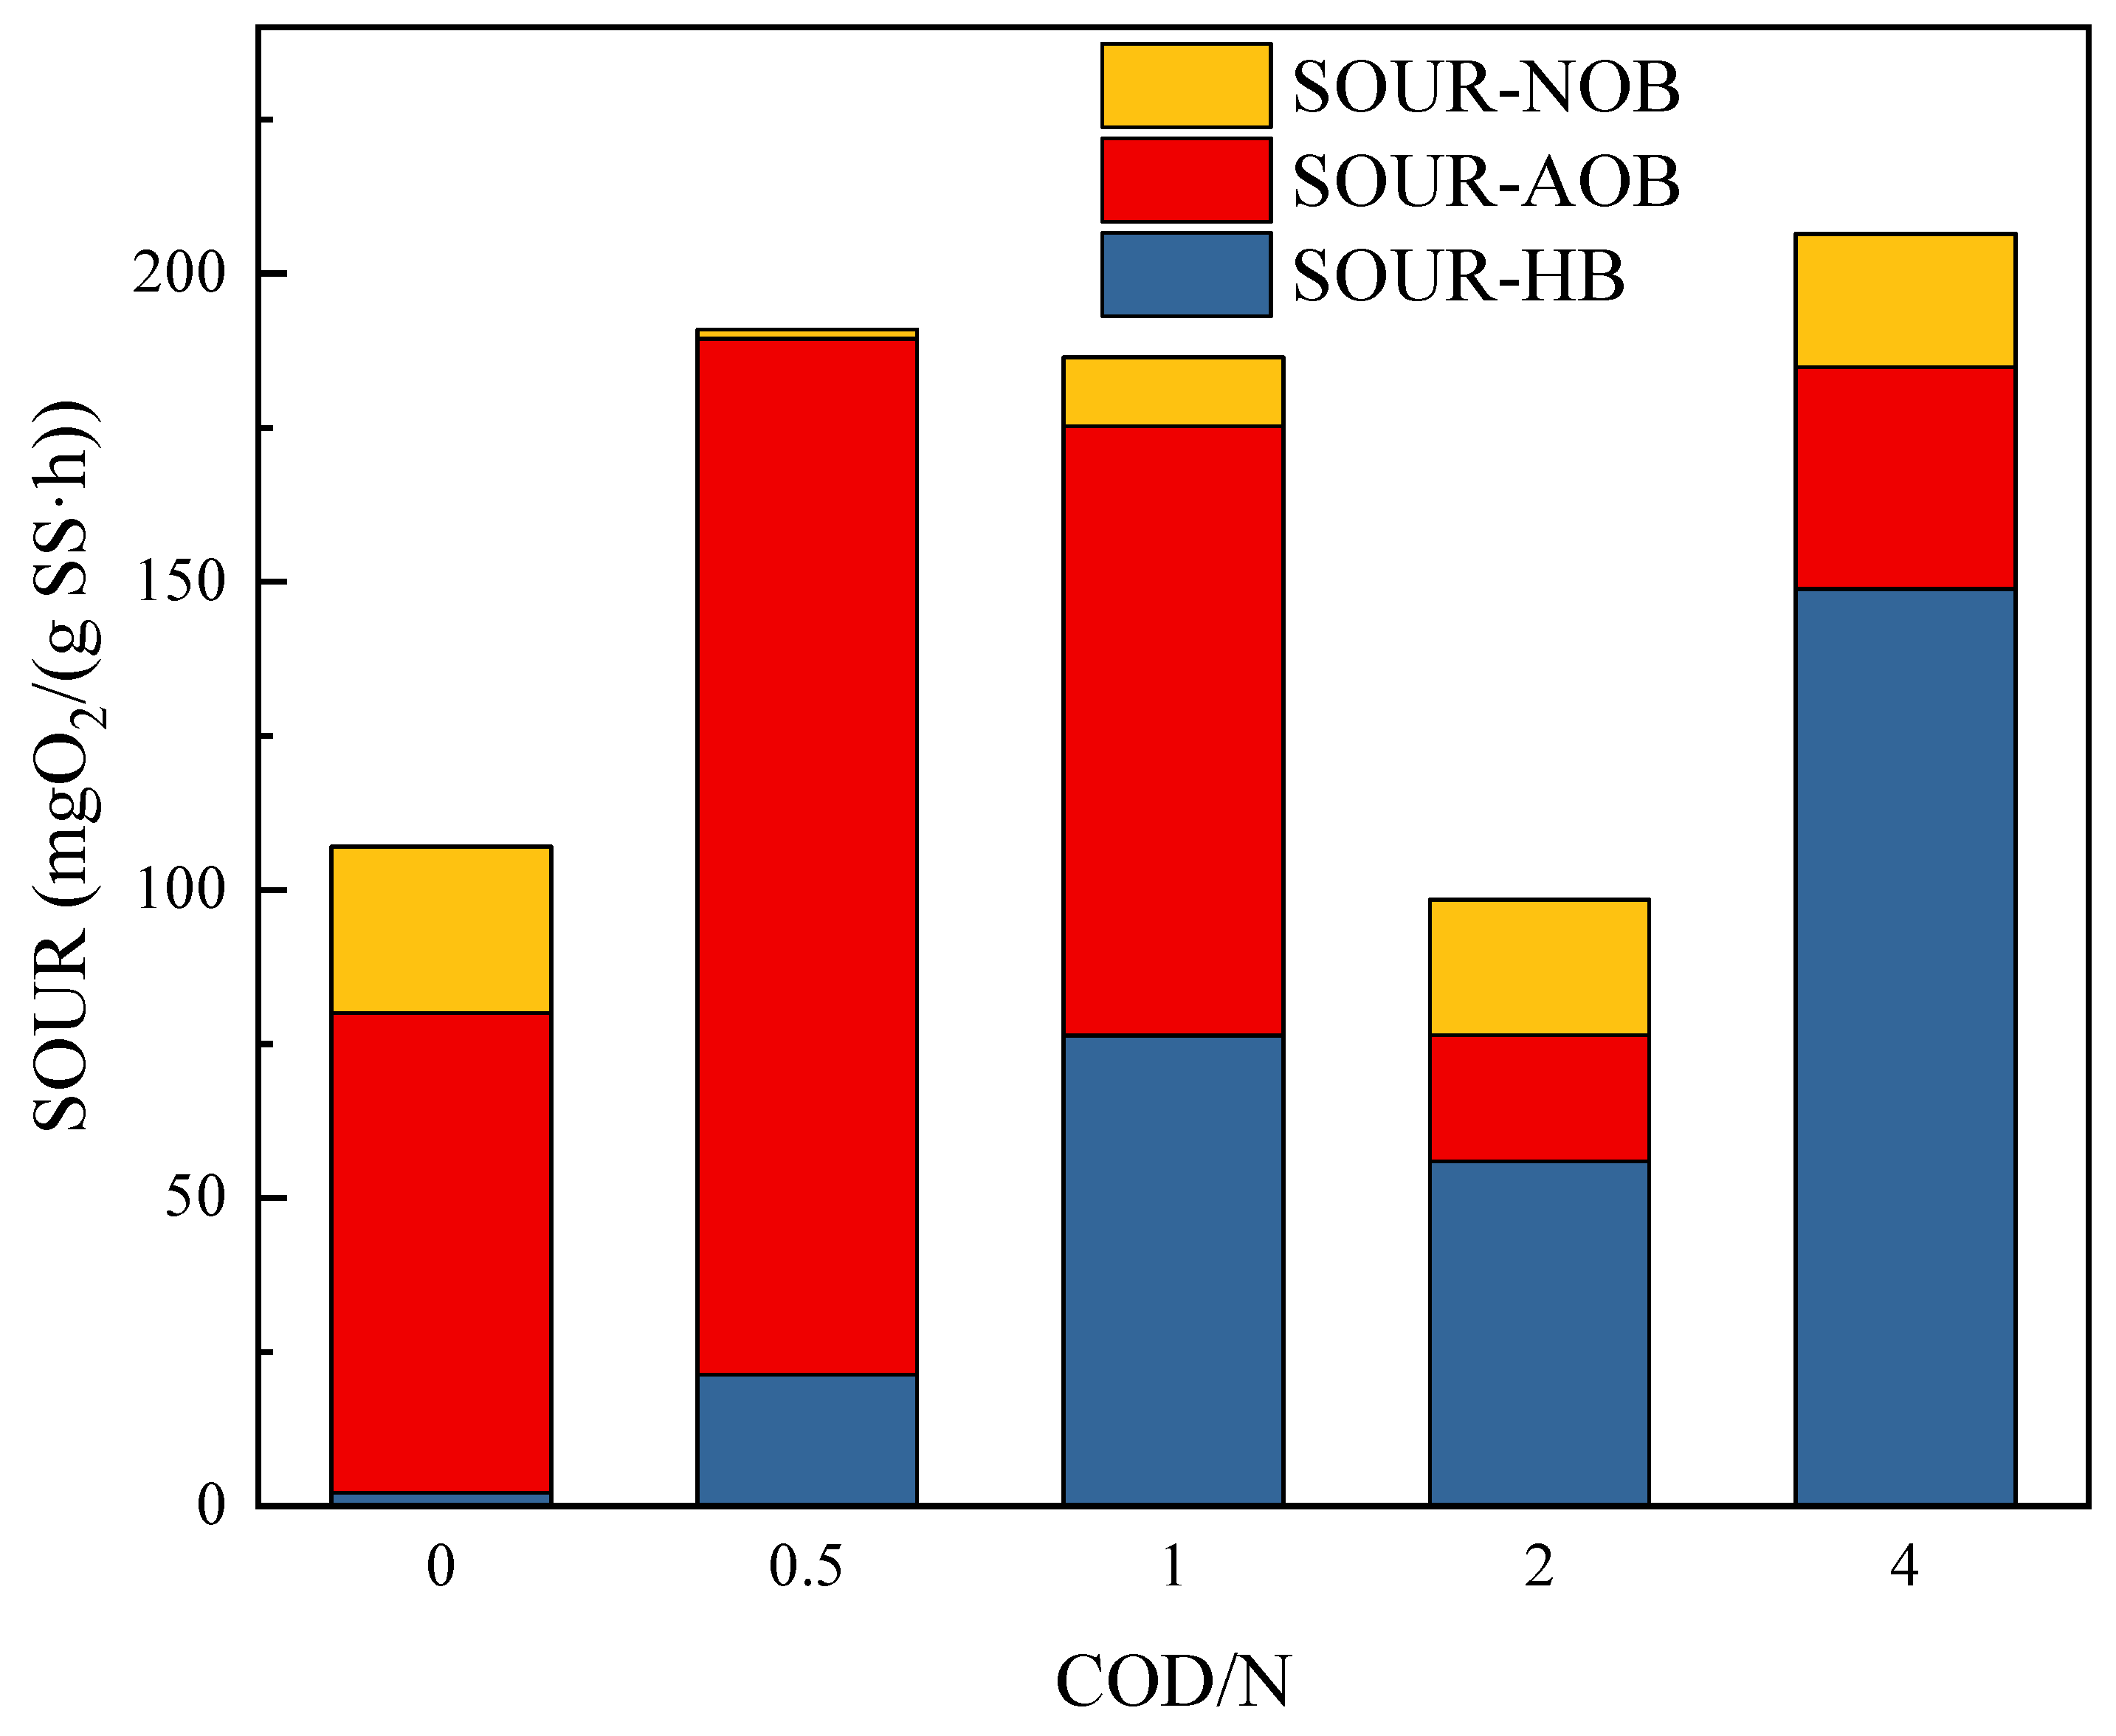
The SOUR was measured using different ratios of COD/N, and they were applied to indicate how active the different microorganisms were (Figure 4). The SOURs of the total bacteria at the COD/N ratios of 0, 0.5, 1, 2, and 4 were 107.07, 190.91, 186.41, 98.40, and 206.50 mgO2/(g SS·h), respectively. The SOURs of the AOB were 77.85, 168.09, 98.89, 20.48, and 35.97 mgO2/(g SS·h). The percentages of the SOUR of HB in the SOUR of the total bacteria were 2.0%, 11.2%, 41.0%, 56.8%, and 72.1%, respectively. The data demonstrate that the elevation in the ratio of COD/N led to an increase in the activity of the HB, whereas it inhibited the activity of the AOB. Furthermore, once the SOUR of the HB exceeded that of the AOB, the AOB could not compete for sufficient oxygen to realize a stable PN process.

3.5. Bacterial Community

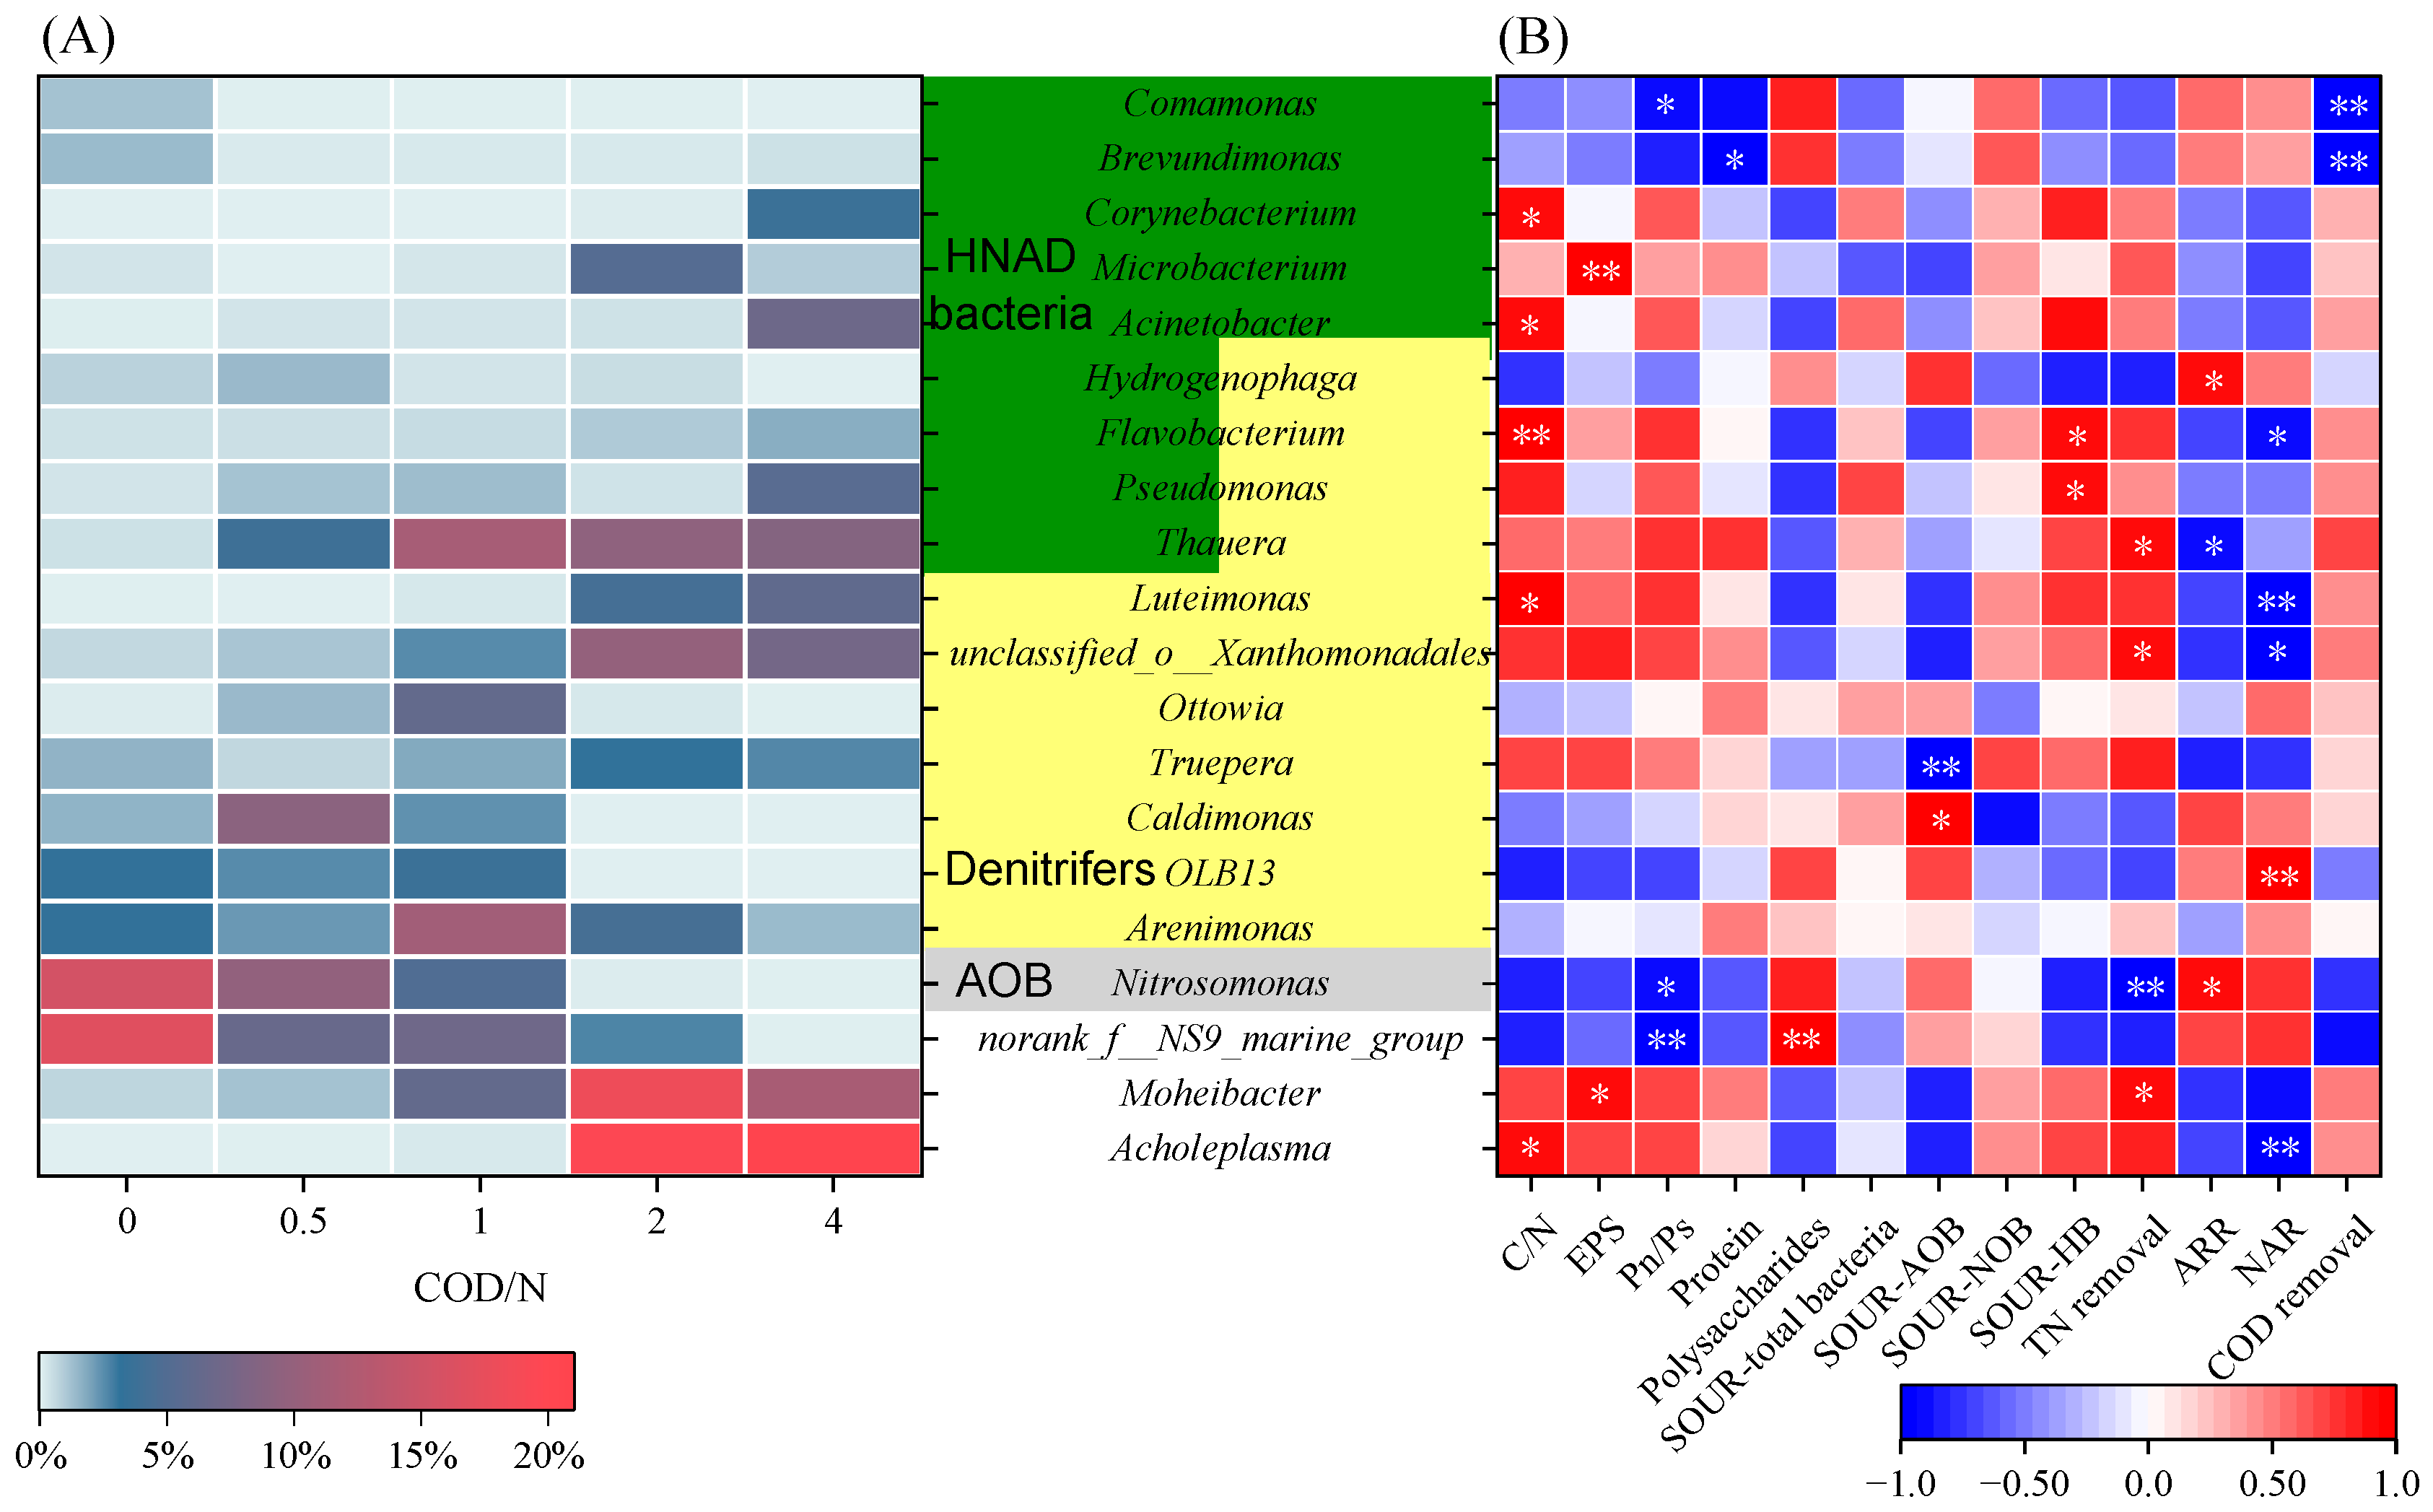
At the genus level (Figure 5A), the genera and relative abundances differed significantly among the different COD/N ratios. The most abundant genera were Acholeplasma and Moheibacter with COD/N ratios at 2 and 4. Acholeplasma has excellent acetate utilization properties [29], and Moheibacter could survive in organic-rich environments and could metabolize a varied range of organic matter [30]. Nitrosomonas was the only observed autotrophic AOB genus, at COD/N ratios of 0 (15.5%), 0.5 (9.7%), and 1 (4.9%), respectively, and it was not observed at COD/N ratios of 2 and 4. Meanwhile, a large number of denitrifiers, including Arenimonas, OLB13, Caldimonas, Truepera, Ottowia, unclassified_o__Xanthomonadales, Luteimonas, Thauera, Pseudomonas Flavobacterium, and Hydrogenophaga, were detected in all the reactors [31]. Their relative abundances were 12.2, 23.8, 41.6, 33.0, and 33.2%, respectively, at COD/N ratios of 0, 0.5, 1, 2, and 4. The relative abundances of the denitrifiers at COD/N ratios of 2 and 4 were lower than those of 1, but TN removal reached 69.9 and 75.4%, respectively, which are higher than the 53.6% observed at a COD/N of 1.
Since denitrification and anammox are the two main pathways of TN removal [32], and the genus of anammox bacteria was not detected at any of the COD/N ratios, it can be inferred that the TN removal in those five reactors was attributable to denitrification. Moreover, the autotrophic AOB and NOB genera were not detected at COD/N ratios of 2 and 4, nor were the denitrification substrates (nitrite and nitrate). Moreover, numerous reports show that the heterotrophic nitrifiers could involve organic matter in the nitrification process [12,33]. Moreover, they could complete aerobic denitrification, accompanied by heterotrophic nitrification, which is known as HNAD. In addition, Thauera, Pseudomonas, Flavobacterium, Hydrogenophaga, Acinetobacter, Microbacterium, Corynebacterium, Brevundimonas, and Comamonas are the reported HNAD bacteria [12], and their total relative abundances at COD/N ratios of 0, 0.5, 1, 2, and 4 were 4.8, 7.3, 14.5, 17.1, and 27.6%, respectively; these abundances increased with the increase in COD/N ratios.
To quantitatively assess the relationship between the bacterial communities and the performance/sludge data at different COD/N ratios, Pearson’s correlation coefficient was computed, and the degree of association was statistically evaluated, as shown in Figure 2B. COD/N was found to be significantly positively correlated with Acholeplasma (r = 0.88, p < 0.1), Luteimonas (r = 0.95, p < 0.1), Acinetobacter (r = 0.90, p < 0.1), Flavobacterium (r = 0.99), and Corynebacterium (r = 0.89), all of which are classified as heterotrophic, denitrifying, and HNAD bacteria. An increase in COD/N is beneficial for their growth. Additionally, Nitrosomonas showed a significant positive correlation with ARR, which is consistent with its role as the only detected AOB bacterial genus capable of converting ammonia nitrogen. There is no significant correlation between it and SOUR-AOB (r = 0.58). However, a significant positive correlation existed between EPS content and Moheibacter (r = 0.90, p < 0.1), as EPS contained substantial amounts of organic matter that could support Moheibacter metabolism and growth [30]. Additionally, no correlation was found between the SOUR of total bacteria and any specific bacterial genus, indicating that no single bacterial species predominantly influences the increase in COD/N. Instead, various bacterial genera are involved in oxygen consumption at different stages.

3.6. Prediction of Functional Genes

The relative abundance of functional genes related to the nitrogen cycle and carbon fixation at different COD/N ratios was analyzed based on the PICRUSt prediction in the KEGG database. The results are shown in Figure 6. Those genes are associated with nitrification, denitrification, and dissimilatory nitrate reduction to ammonium (DNRA). For the PN process, amoA, amoB, amoC, and hao are the four main genes, of which the amoA, amoB, and amoC genes encode ammonia monooxygenase. This enzyme converts ammonia to hydroxylamine. The hao gene encodes a hydroxylamine oxidase, which further transforms hydroxylamine into nitrite. The total relative abundance of those four genes decreased as the COD/N ratios increased, which was consistent with the declined PN performance with the increase in COD/N ratios. In addition, the nxrA and nxrB genes encode nitrite oxidase, which converts nitrite to nitrate. The total relative abundance of these two genes increased as the COD/N ratios increased from 0 to 1, while they decreased when the COD/N ratios were 2 and 4. A similar variation was observed in the denitrification-associated genes (narG, narH, narI, nirK, nirS, norB, norC and nosZ), except for the napA and napB genes. Furthermore, the genes involved in DNRA include nrfA, nrfH, and nirB. These genes are crucial in the conversion of nitrite to ammonium. Specifically, the nrfA and nrfH genes encode periplasmic nitrite reductase, while nirB encodes for the cytoplasmic NADH-dependent nitrite reductase [34]. There was an interesting phenomenon whereby the variation in these genes showed a similar trend to that in denitrification, which was the highest at a COD/N ratio of 1.
Acetate served as the sole external carbon source in this study, and it could be used by bacteria in two pathways [35]. First, acetate could be converted into acetyl phosphate through acetate kinase, which is encoded by the ackA gene. Second, it could be transformed into acetyl-CoA with the catalysis of AMP-dependent acetyl-CoA synthetase, which is encoded by the ACSS gene. The total relative abundances of the ackA and ACSS genes were 0.118, 0.112, 0.113, 0.127, and 0.134%, respectively, at COD/N ratios of 0, 0.5, 1, 2, and 4. They increased with the increase in the COD/N ratios (except the COD/N ratio of 0). Upon increasing the COD/N ratio, the bacteria in those SBRs performed better in acetate metabolism, suggesting an increasing abundance of heterotrophic microorganisms.

4. Discussion

This study demonstrated that COD/N played a significant role in the PN process. A stable PN process could be achieved if the COD/N ratios were 0 and 0.5. Even though the PN process could also be achieved under high DO conditions [36,37], the upholding of low DO was still an essential factor that affected the PN [6]. However, maintaining a low DO concentration did not necessarily guarantee a stable PN process. Low DO (0.1–1 mg/L) concentrations did not inhibit the activity of NOB, and the relative abundance of NOB was greater than that of AOB during the treatment of rural wastewater [38]. In a long-term activated sludge system operating under low DO conditions, Liu and Wang demonstrated that the system ultimately achieved complete nitrification rather than PN at DO levels of 0.37 mg/L and 0.16 mg/L [39]. These findings are related to the types of NOB; NOB can employ either r-strategy or k-strategy survival strategies [40]. In this study, the r-strategist bacterium Nitrobacter exhibited a higher oxygen half-saturation constant (1.98 mgO2/L) compared to Nitrosomonas (0.22–0.56 mgO2/L) [41], which was the only AOB genus detected. Consequently, Nitrobacter could be eliminated at a low DO concentration. In contrast, the k-strategist NOB Nitrospira, with a lower oxygen half-saturation constant (0.13 mgO2/L) [41], was not effectively limited by low DO concentrations. The inhibitory concentrations of FA and FNA for Nitrospira are relatively low, ranging from 0.04 to 0.08 mg/L and 0.02 mg/L, respectively [42,43]. At COD/N ratios of 0 and 1, at least one of the concentrations of FA or FNA could reach the inhibitory threshold, thereby inhibiting the growth of Nitrospira. Thus, the steady operation of the PN process at COD/N ratios of 0 and 0.5 depended to a large extent on the dynamic change in FA and FNA, as well as the low DO to suppress NOB. Mousavi et al. showed that the PN process could be completed with high ammonium (1000 mg/L) and at a low COD/N ratio (0.5) by using high FA (70 mg/L) and FNA to inhibit NOB [44]. Additionally, the addition of an organic carbon source at a COD/N ratio of 0.5 enhanced the denitrification performance by consuming nitrite, resulting in a lower effluent nitrite concentration and a significantly higher total relative abundance of denitrifiers at the COD/N ratio of 0.5 (22.1%) than that at the COD/N ratio of 0 (11.2%).
As the COD/N ratios increased to 1, the PN performance apparently reduced. In particular, when the ratios were 2 and 4, the PN process was completely destroyed, and the nitrite could not be effectively accumulated in the reactors. Therefore, in order to conclude the PN process in high-strength ammonium wastewater, it is imperative that the ratio of COD/N does not exceed 0.5. The substantial quantity of the organic carbon source was metabolized by the aerobic HB, which engaged in a competition for oxygen with the AOB. Due to the higher oxygen affinity of aerobic HB compared to that of AOB, the oxygen was primarily consumed by the aerobic HB, whereas the AOB was unable to obtain sufficient oxygen as electron acceptors for ammonium oxidation [45]. According to the different COD/N ratios, the proportion of the SOUR from the AOB relative to the SOUR from the total bacteria gradually decreased, while the proportion of the SOUR from the HB relative to the SOUR from the total bacteria gradually increased. In addition to the depletion of DO, the FA beyond the minimum inhibitory concentration for AOB was the other reason behind the failure of the PN process when treating the high-ammonium wastewater with a COD/N ratio above 1.
At COD/N ratios of 2 and 4, the TN removal reached 69.9% and 75.4%, though the PN did not exist when the COD/N ratio exceeded 1. It was the HNAD bacteria in them that facilitated the nitrogen removal. Previous studies have shown that the ratio of COD/N has a significant impact on the HNAD process [46,47,48,49], and the pure cultivation of HNAD bacteria showed that the optimal COD/N ratio was between 6 and 15 [12]. In the HNAD process, the COD/N ratio not only affected the growth of HNAD bacteria but also other symbiotic microorganisms, and a higher COD/N ratio also inspired the enrichment of HNAD microorganisms, thereby enhancing the denitrification. Chen et al. demonstrated that the TN removal significantly decreased in a HNAD reactor when the COD/N ratio was decreased from 4 to 1 [48]. In this study, because the abundant denitrifiers were at a COD/N ratio of 1, the removed TN still maintained a high level (53.6%).
However, it is necessary to clarify that the HNAD bacteria and denitrifiers might have some overlap, as, despite the fact that the HNAD bacteria exist widely, not all the bacteria of a given genus have HNAD abilities. Evaluating the abundance of HNAD bacteria solely based on the number of specific bacterial genera is not entirely accurate, and it does not elucidate the effects of HNAD bacteria on the nitrogen removal pathways. Therefore, this study employed functional genetic variations to further investigate the nitrogen removal pathways at various COD/N ratios. Nonetheless, the outcomes of the gene analysis were incongruous with the efficacy of nitrogen removal. Despite the highest relative abundance of denitrification genes at the COD/N ratio of 1, the nitrogen removal performance was significantly lower than that at the COD/N ratios of 2 and 4. There are two reasons for this phenomenon. The first is that the PICRUSt prediction technique may exhibit biases in the prediction of gene functions in instances of low gene abundances [50]. The second is the limited knowledge about HNAD functional genes and the inconsistencies that exist in the present studies [12,33]. Some studies implied that HNAD bacteria possess the capability to convert ammonia to nitrite and nitrate, subsequently leading to denitrification [51,52]. Alternatively, it has been suggested that HNAD bacteria possess the ability to produce hydroxylamine and directly convert it into nitrogen gas [53]. However, although the related proteins have been identified in various bacteria, they have not been fully identified [54]. Furthermore, a previous study reported that the amo and hao genes in HNAD bacteria might complete the oxidation of ammonia through other unknown pathways [13].
In brief, the PN process can be used to treat high-strength ammonium wastewater with COD/N ratios of 0 and 0.5. Once the COD/N ratio was equal to or greater than 1, the HNAD process occurred for direct nitrogen removal. It is noteworthy that the HNAD process was primarily derived from the analysis of the typical single cycle and bacterial community, and this study did not provide a comprehensive understanding of the specific genes and enzymes involved in the heterotrophic nitrification process within HNAD. Therefore, the elucidation of the nitrogen removal mechanism in HNAD bacteria requires the utilization of genomic and proteomic approaches.

5. Conclusions

When treating high-ammonia wastewater, an increase in the COD/N ratio could shift the process from autotrophic PN to HNAD. At COD/N ratios of 0 and 0.5, the growth of NOB was inhibited by low dissolved oxygen and high concentrations of FA and FNA, leading to a significant proliferation of AOB. Consequently, the relative abundance of Nitrosomonas was 15.5% at COD/N = 2 and 9.7% at COD/N = 4. However, the PN process was disrupted at a COD/N ratio of 1 and completely destroyed at COD/N ratios of 2 and 4, with HNAD becoming the dominant process. The proliferation of HB at C/N ≥ 1 inhibited the autotrophic AOB, allowing HNAD bacteria to become the predominant denitrifying microorganisms. Thauera, Pseudomonas, Flavobacterium, Hydrogenophaga, Acinetobacter, Microbacterium, Corynebacterium, Brevundimonas, and Comamonas—all HNAD bacteria—emerged at COD/N ratios of 2 and 4, with their relative abundance increasing as the total COD/N ratio rose, coinciding with the disappearance of Nitrosomonas. Therefore, in the treatment of high-ammonia wastewater, when COD/N ≤ 1, the PN process can be combined with other processes, such as partial denitrification and anammox, for biological denitrification. When COD/N > 1, HNAD should be used as the primary denitrification process.

Supplementary Materials

The following supporting information can be downloaded at: https://www.mdpi.com/article/10.3390/w16172532/s1, Figure S1: Schematic diagram of experimental setup; Figure S2: Variation of the fluorescence components and Fmax at different C/N identified by PARAFAC analysis; Figure S3: Bacterial composition on phylum level. Reference [55] is cited in the Supplementary Materials.

Author Contributions

Z.P.: data curation, formal analysis, investigation, methodology, writing—original draft; Y.L.: data curation, formal analysis, investigation, methodology; Y.Z.: data curation, formal analysis; B.Y.: conceptualization, funding acquisition, writing—review and editing, supervision; X.P.: resources, writing—review and editing, supervision. All authors have read and agreed to the published version of the manuscript.

Funding

This research was funded by the Research Foundation for High-Level Talents in Kunming University of Science and Technology (grant number 10978191) and Yunnan Major Scientific and Technological Projects (grant number 202202AG050019).

Data Availability Statement

The original contributions presented in the study are included in the article, further inquiries can be directed to the corresponding authors.

Conflicts of Interest

The authors declare that they have no known competing financial interests or personal relationships that could have appeared to influence the work reported in this paper.

Abbreviations

AOBAmmonia-oxidizing bacteria
ARRAmmonium removal rate
DNRADissimilatory nitrate reduction to ammonium
DODissolved oxygen
EEMExcitation–emission matrix
EPSExtracellular polymeric substance
Ex/EmExcitation/emission
FmaxMaximum fluorescence
FAFree ammonia
FNAFree nitrous acid
HBHeterotrophic bacteria
HNADHeterotrophic nitrification and heterotrophic denitrification
LB-EPSLoosely bound EPS
NRRNitrite accumulation rate
PARAFACParallel factor analysis
PBSPhosphate buffer solution
PICRUStPhylogenetic investigation of communities by reconstruction of unobserved states
Pn/PsProtein to polysaccharide ratios
PNPartial nitrification
SBRSequence batch reactor
SOURSpecific oxygen uptake rate
TB-EPSTightly bound EPS

References

  1. Ronan, E.; Aqeel, H.; Wolfaardt, G.M.; Liss, S.N. Recent advancements in the biological treatment of high strength ammonia wastewater. World J. Microbiol. Biotechnol. 2021, 37, 158. [Google Scholar] [CrossRef] [PubMed]
  2. Conley, D.J.; Paerl, H.W.; Howarth, R.W.; Boesch, D.F.; Seitzinger, S.P.; Havens, K.E.; Lancelot, C.; Likens, G.E. Controlling eutrophication: Nitrogen and phosphorus. Science 2009, 323, 1014–1015. [Google Scholar] [CrossRef] [PubMed]
  3. Li, X.; Du, R.; Peng, Y.; Zhang, Q.; Wang, J. Characteristics of sludge granulation and EPS production in development of stable partial nitrification. Bioresour. Technol. 2020, 303, 122937. [Google Scholar] [CrossRef] [PubMed]
  4. Wang, G.; Xu, X.; Zhou, L.; Wang, C.; Yang, F. A pilot-scale study on the start-up of partial nitrification-anammox process for anaerobic sludge digester liquor treatment. Bioresour. Technol. 2017, 241, 181–189. [Google Scholar] [CrossRef]
  5. Zhang, F.; Peng, Y.; Miao, L.; Wang, Z.; Wang, S.; Li, B. A novel simultaneous partial nitrification Anammox and denitrification (SNAD) with intermittent aeration for cost-effective nitrogen removal from mature landfill leachate. Chem. Eng. J. 2017, 313, 619–628. [Google Scholar] [CrossRef]
  6. Ge, S.; Wang, S.; Yang, X.; Qiu, S.; Li, B.; Peng, Y. Detection of nitrifiers and evaluation of partial nitrification for wastewater treatment: A review. Chemosphere 2015, 140, 85–98. [Google Scholar] [CrossRef]
  7. Mosquera-Corral, A.; Gonzalez, F.; Campos, J.; Méndez, R. Partial nitrification in a SHARON reactor in the presence of salts and organic carbon compounds. Process Biochem. 2005, 40, 3109–3118. [Google Scholar] [CrossRef]
  8. Cao, Q.; Chen, Y.; Li, X.; Li, C.; Li, X. Low C/N promotes stable partial nitrification by enhancing the cooperation of functional microorganisms in treating high-strength ammonium landfill leachate. J. Environ. Manag. 2023, 329, 116972. [Google Scholar] [CrossRef] [PubMed]
  9. Li, J.; Elliott, D.; Nielsen, M.; Healy, M.G.; Zhan, X. Long-term partial nitrification in an intermittently aerated sequencing batch reactor (SBR) treating ammonium-rich wastewater under controlled oxygen-limited conditions. Biochem. Eng. J. 2011, 55, 215–222. [Google Scholar] [CrossRef]
  10. Liang, Z.; Liu, J.-X. Control factors of partial nitritation for landfill leachate treatment. J. Environ. Sci. 2007, 19, 523–529. [Google Scholar] [CrossRef]
  11. Friedman, L.; Mamane, H.; Avisar, D.; Chandran, K. The role of influent organic carbon-to-nitrogen (COD/N) ratio in removal rates and shaping microbial ecology in soil aquifer treatment (SAT). Water Res. 2018, 146, 197–205. [Google Scholar] [CrossRef] [PubMed]
  12. Duan, S.; Zhang, Y.; Zheng, S. Heterotrophic nitrifying bacteria in wastewater biological nitrogen removal systems: A review. Crit. Rev. Environ. Sci. Technol. 2022, 52, 2302–2338. [Google Scholar] [CrossRef]
  13. Liu, X.; Dang, Y.; Sun, D.; Holmes, D.E. Identification of optimal parameters for treatment of high-strength ammonium leachate by mixed communities of heterotrophic nitrifying/aerobic denitrifying bacteria. Bioresour. Technol. 2021, 336, 125415. [Google Scholar] [CrossRef] [PubMed]
  14. Zhang, Q.; Chen, X.; Zhang, Z.; Luo, W.; Wu, H.; Zhang, L.; Zhang, X.; Zhao, T. Performance and microbial ecology of a novel moving bed biofilm reactor process inoculated with heterotrophic nitrification-aerobic denitrification bacteria for high ammonia nitrogen wastewater treatment. Bioresour. Technol. 2020, 315, 123813. [Google Scholar] [CrossRef] [PubMed]
  15. Lin, Z.; Zhou, J.; He, L.; He, X.; Pan, Z.; Wang, Y.; He, Q. High-temperature biofilm system based on heterotrophic nitrification and aerobic denitrification treating high-strength ammonia wastewater: Nitrogen removal performances and temperature-regulated metabolic pathways. Bioresour. Technol. 2022, 344, 126184. [Google Scholar] [CrossRef]
  16. Peng, Z.; Lei, Y.; Liu, Y.; Wan, X.; Yang, B.; Pan, X. Fast start-up and reactivation of anammox process using polyurethane sponge. Biochem. Eng. J. 2022, 177, 108249. [Google Scholar] [CrossRef]
  17. Rice, E.W.; Bridgewater, L.; Association, A.P.H. Standard Methods for the Examination of Water and Wastewater; American Public Health Association: Washington, DC, USA, 2012; Volume 10. [Google Scholar]
  18. Chen, W.; Westerhoff, P.; Leenheer, J.A.; Booksh, K. Fluorescence excitation−emission matrix regional integration to quantify spectra for dissolved organic matter. Environ. Sci. Technol. 2003, 37, 5701–5710. [Google Scholar] [CrossRef]
  19. He, W.; Hur, J. Conservative behavior of fluorescence EEM-PARAFAC components in resin fractionation processes and its applicability for characterizing dissolved organic matter. Water Res. 2015, 83, 217–226. [Google Scholar] [CrossRef]
  20. Surmacz-Gorska, J.; Gernaey, K.; Demuynck, C.; Vanrolleghem, P.; Verstraete, W. Nitrification monitoring in activated sludge by oxygen uptake rate (OUR) measurements. Water Res. 1996, 30, 1228–1236. [Google Scholar] [CrossRef]
  21. Tian, X.; Shen, Z.; Han, Z.; Zhou, Y. The effect of extracellular polymeric substances on exogenous highly toxic compounds in biological wastewater treatment: An overview. Bioresour. Technol. Rep. 2019, 5, 28–42. [Google Scholar] [CrossRef]
  22. Lu, H.; Chandran, K.; Stensel, D. Microbial ecology of denitrification in biological wastewater treatment. Water Res. 2014, 64, 237–254. [Google Scholar] [CrossRef] [PubMed]
  23. Soliman, M.; Eldyasti, A. Development of partial nitrification as a first step of nitrite shunt process in a Sequential Batch Reactor (SBR) using Ammonium Oxidizing Bacteria (AOB) controlled by mixing regime. Bioresour. Technol. 2016, 221, 85–95. [Google Scholar] [CrossRef] [PubMed]
  24. Li, J.; Li, J.; Peng, Y.; Wang, S.; Zhang, L.; Yang, S.; Li, S. Insight into the impacts of organics on anammox and their potential linking to system performance of sewage partial nitrification-anammox (PN/A): A critical review. Bioresour. Technol. 2020, 300, 122655. [Google Scholar] [CrossRef]
  25. Zhang, Z.-J.; Chen, S.-H.; Wang, S.-M.; Luo, H.-Y. Characterization of extracellular polymeric substances from biofilm in the process of starting-up a partial nitrification process under salt stress. Appl. Microbiol. Biotechnol. 2011, 89, 1563–1571. [Google Scholar] [CrossRef] [PubMed]
  26. Yin, C.; Meng, F.; Chen, G.-H. Spectroscopic characterization of extracellular polymeric substances from a mixed culture dominated by ammonia-oxidizing bacteria. Water Res. 2015, 68, 740–749. [Google Scholar] [CrossRef]
  27. Xu, J.; Li, C.; Shen, Y.; Zhu, N. Anaerobic ammonium oxidation (anammox) promoted by pyrogenic biochar: Deciphering the interaction with extracellular polymeric substances (EPS). Sci. Total Environ. 2022, 802, 149884. [Google Scholar] [CrossRef]
  28. Arshad, Z.; Maqbool, T.; Shin, K.H.; Kim, S.-H.; Hur, J. Using stable isotope probing and fluorescence spectroscopy to examine the roles of substrate and soluble microbial products in extracellular polymeric substance formation in activated sludge process. Sci. Total Environ. 2021, 788, 147875. [Google Scholar] [CrossRef]
  29. Kahane, I.; Muhlrad, A. Purification and properties of acetate kinase from Acholeplasma laidlawii. J. Bacteriol. 1979, 137, 764–772. [Google Scholar] [CrossRef]
  30. Du, B.; Xuan, H.; Geng, L.; Li, W.; Zhang, J.; Xiang, W.; Liu, R.; Shu, C. Microflora for improving the Auricularia auricula spent mushroom substrate for Protaetia brevitarsis production. Iscience 2022, 25, 105307. [Google Scholar] [CrossRef]
  31. Fu, X.; Hou, R.; Yang, P.; Qian, S.; Feng, Z.; Chen, Z.; Wang, F.; Yuan, R.; Chen, H.; Zhou, B. Application of external carbon source in heterotrophic denitrification of domestic sewage: A review. Sci. Total Environ. 2022, 817, 153061. [Google Scholar] [CrossRef]
  32. Winkler, M.K.; Straka, L. New directions in biological nitrogen removal and recovery from wastewater. Curr. Opin. Biotechnol. 2019, 57, 50–55. [Google Scholar] [CrossRef] [PubMed]
  33. Song, T.; Zhang, X.; Li, J.; Wu, X.; Feng, H.; Dong, W. A review of research progress of heterotrophic nitrification and aerobic denitrification microorganisms (HNADMs). Sci. Total Environ. 2021, 801, 149319. [Google Scholar] [CrossRef] [PubMed]
  34. Zhao, Y.; Li, Q.; Cui, Q.; Ni, S.-Q. Nitrogen recovery through fermentative dissimilatory nitrate reduction to ammonium (DNRA): Carbon source comparison and metabolic pathway. Chem. Eng. J. 2022, 441, 135938. [Google Scholar] [CrossRef]
  35. Berger, S.; Welte, C.; Deppenmeier, U. Acetate activation in Methanosaeta thermophila: Characterization of the key enzymes pyrophosphatase and acetyl-CoA synthetase. Archaea 2012, 2012, 315153. [Google Scholar] [CrossRef]
  36. Bao, P.; Wang, S.; Ma, B.; Zhang, Q.; Peng, Y. Achieving partial nitrification by inhibiting the activity of Nitrospira-like bacteria under high-DO conditions in an intermittent aeration reactor. J. Environ. Sci. 2017, 56, 71–78. [Google Scholar] [CrossRef]
  37. Cui, B.; Yang, Q.; Liu, X.; Huang, S.; Yang, Y.; Liu, Z. The effect of dissolved oxygen concentration on long-term stability of partial nitrification process. J. Environ. Sci. 2020, 90, 343–351. [Google Scholar] [CrossRef]
  38. Luan, Y.-N.; Yin, Y.; An, Y.; Zhang, F.; Wang, X.; Zhao, F.; Xiao, Y.; Liu, C. Investigation of an intermittently-aerated moving bed biofilm reactor in rural wastewater treatment under low dissolved oxygen and C/N condition. Bioresour. Technol. 2022, 358, 127405. [Google Scholar] [CrossRef]
  39. Liu, G.; Wang, J. Long-term low DO enriches and shifts nitrifier community in activated sludge. Environ. Sci. Technol. 2013, 47, 5109–5117. [Google Scholar] [CrossRef]
  40. Nogueira, R.; Melo, L.F. Competition between Nitrospira spp. and Nitrobacter spp. in nitrite-oxidizing bioreactors. Biotechnol. Bioeng. 2006, 95, 169–175. [Google Scholar] [CrossRef]
  41. Dytczak, M.A.; Londry, K.L.; Oleszkiewicz, J.A. Activated sludge operational regime has significant impact on the type of nitrifying community and its nitrification rates. Water Res. 2008, 42, 2320–2328. [Google Scholar] [CrossRef]
  42. Kim, D.-J.; Lee, D.-I.; Cha, G.-C.; Keller, J. Analysis of free ammonia inhibition of nitrite oxidizing bacteria using a dissolved oxygen respirometer. Environ. Eng. Res. 2008, 13, 125–130. [Google Scholar] [CrossRef]
  43. Vadivelu, V.; Keller, J.; Yuan, Z. Free ammonia and free nitrous acid inhibition on the anabolic and catabolic processes of Nitrosomonas and Nitrobacter. Water Sci. Technol. 2007, 56, 89–97. [Google Scholar] [CrossRef] [PubMed]
  44. Mousavi, S.A.; Ibrahim, S.; Aroua, M.K. Effect of carbon source on acclimatization of nitrifying bacteria to achieve high-rate partial nitrification of wastewater with high ammonium concentration. Appl. Water Sci. 2017, 7, 165–173. [Google Scholar] [CrossRef]
  45. Cho, K.; Bae, S.; Jung, J.; Choi, D. Effect of aerobic microbes’ competition for oxygen on nitrogen removal in mainstream nitritation-anammox systems. Chemosphere 2022, 305, 135493. [Google Scholar] [CrossRef] [PubMed]
  46. Gu, X.; Leng, J.; Zhu, J.; Zhang, K.; Zhao, J.; Wu, P.; Xing, Q.; Tang, K.; Li, X.; Hu, B. Influence mechanism of C/N ratio on heterotrophic nitrification-aerobic denitrification process. Bioresour. Technol. 2022, 343, 126116. [Google Scholar] [CrossRef] [PubMed]
  47. Chen, X.; Zhang, Q.; Zhu, Y.; Zhao, T. Response of wastewater treatment performance, microbial composition and functional genes to different C/N ratios and carrier types in MBBR inoculated with heterotrophic nitrification-aerobic denitrification bacteria. Bioresour. Technol. 2021, 336, 125339. [Google Scholar] [CrossRef]
  48. Chen, X.; Zhang, Q.; Zhu, Y.; Zhao, T. Response of rotating biological contactor started up by heterotrophic nitrification-aerobic denitrification bacteria to various C/N ratios. Chemosphere 2022, 291, 133048. [Google Scholar] [CrossRef]
  49. Chen, J.; Shen, L.; Li, Y.; Cao, H.; Chen, C.; Zhang, G.; Xu, Z.; Lu, Y. Insights into the nitrogen transformation mechanism of Pseudomonas sp. Y15 capable of heterotrophic nitrification and aerobic denitrification. Env. Res. 2024, 240, 117595. [Google Scholar] [CrossRef]
  50. Agrawal, S.; Kinh, C.T.; Schwartz, T.; Hosomi, M.; Terada, A.; Lackner, S. Determining uncertainties in PICRUSt analysis–An easy approach for autotrophic nitrogen removal. Biochem. Eng. J. 2019, 152, 107328. [Google Scholar] [CrossRef]
  51. Zhang, Q.-L.; Liu, Y.; Ai, G.-M.; Miao, L.-L.; Zheng, H.-Y.; Liu, Z.-P. The characteristics of a novel heterotrophic nitrification–aerobic denitrification bacterium, Bacillus methylotrophicus strain L7. Bioresour. Technol. 2012, 108, 35–44. [Google Scholar] [CrossRef]
  52. Zhang, M.; Li, A.; Yao, Q.; Wu, Q.; Zhu, H. Nitrogen removal characteristics of a versatile heterotrophic nitrifying-aerobic denitrifying bacterium, Pseudomonas bauzanensis DN13-1, isolated from deep-sea sediment. Bioresour. Technol. 2020, 305, 122626. [Google Scholar] [CrossRef] [PubMed]
  53. Zhao, B.; An, Q.; He, Y.L.; Guo, J.S. N2O and N2 production during heterotrophic nitrification by Alcaligenes faecalis strain NR. Bioresour. Technol. 2012, 116, 379–385. [Google Scholar] [CrossRef] [PubMed]
  54. Liu, X.; Shu, Z.; Sun, D.; Dang, Y.; Holmes, D.E. Heterotrophic nitrifiers dominate reactors treating incineration leachate with high free ammonia concentrations. ACS Sustain. Chem. Eng. 2018, 6, 15040–15049. [Google Scholar] [CrossRef]
  55. Li, J.; Du, Q.; Peng, H.; Zhang, Y.; Bi, Y.; Shi, Y.; Xu, Y.; Liu, T. Optimization of biochemical oxygen demand to total nitrogen ratio for treating landfill leachate in a single-stage partial nitrification-denitrification system. J. Clean. Prod. 2020, 266, 121809. [Google Scholar] [CrossRef]
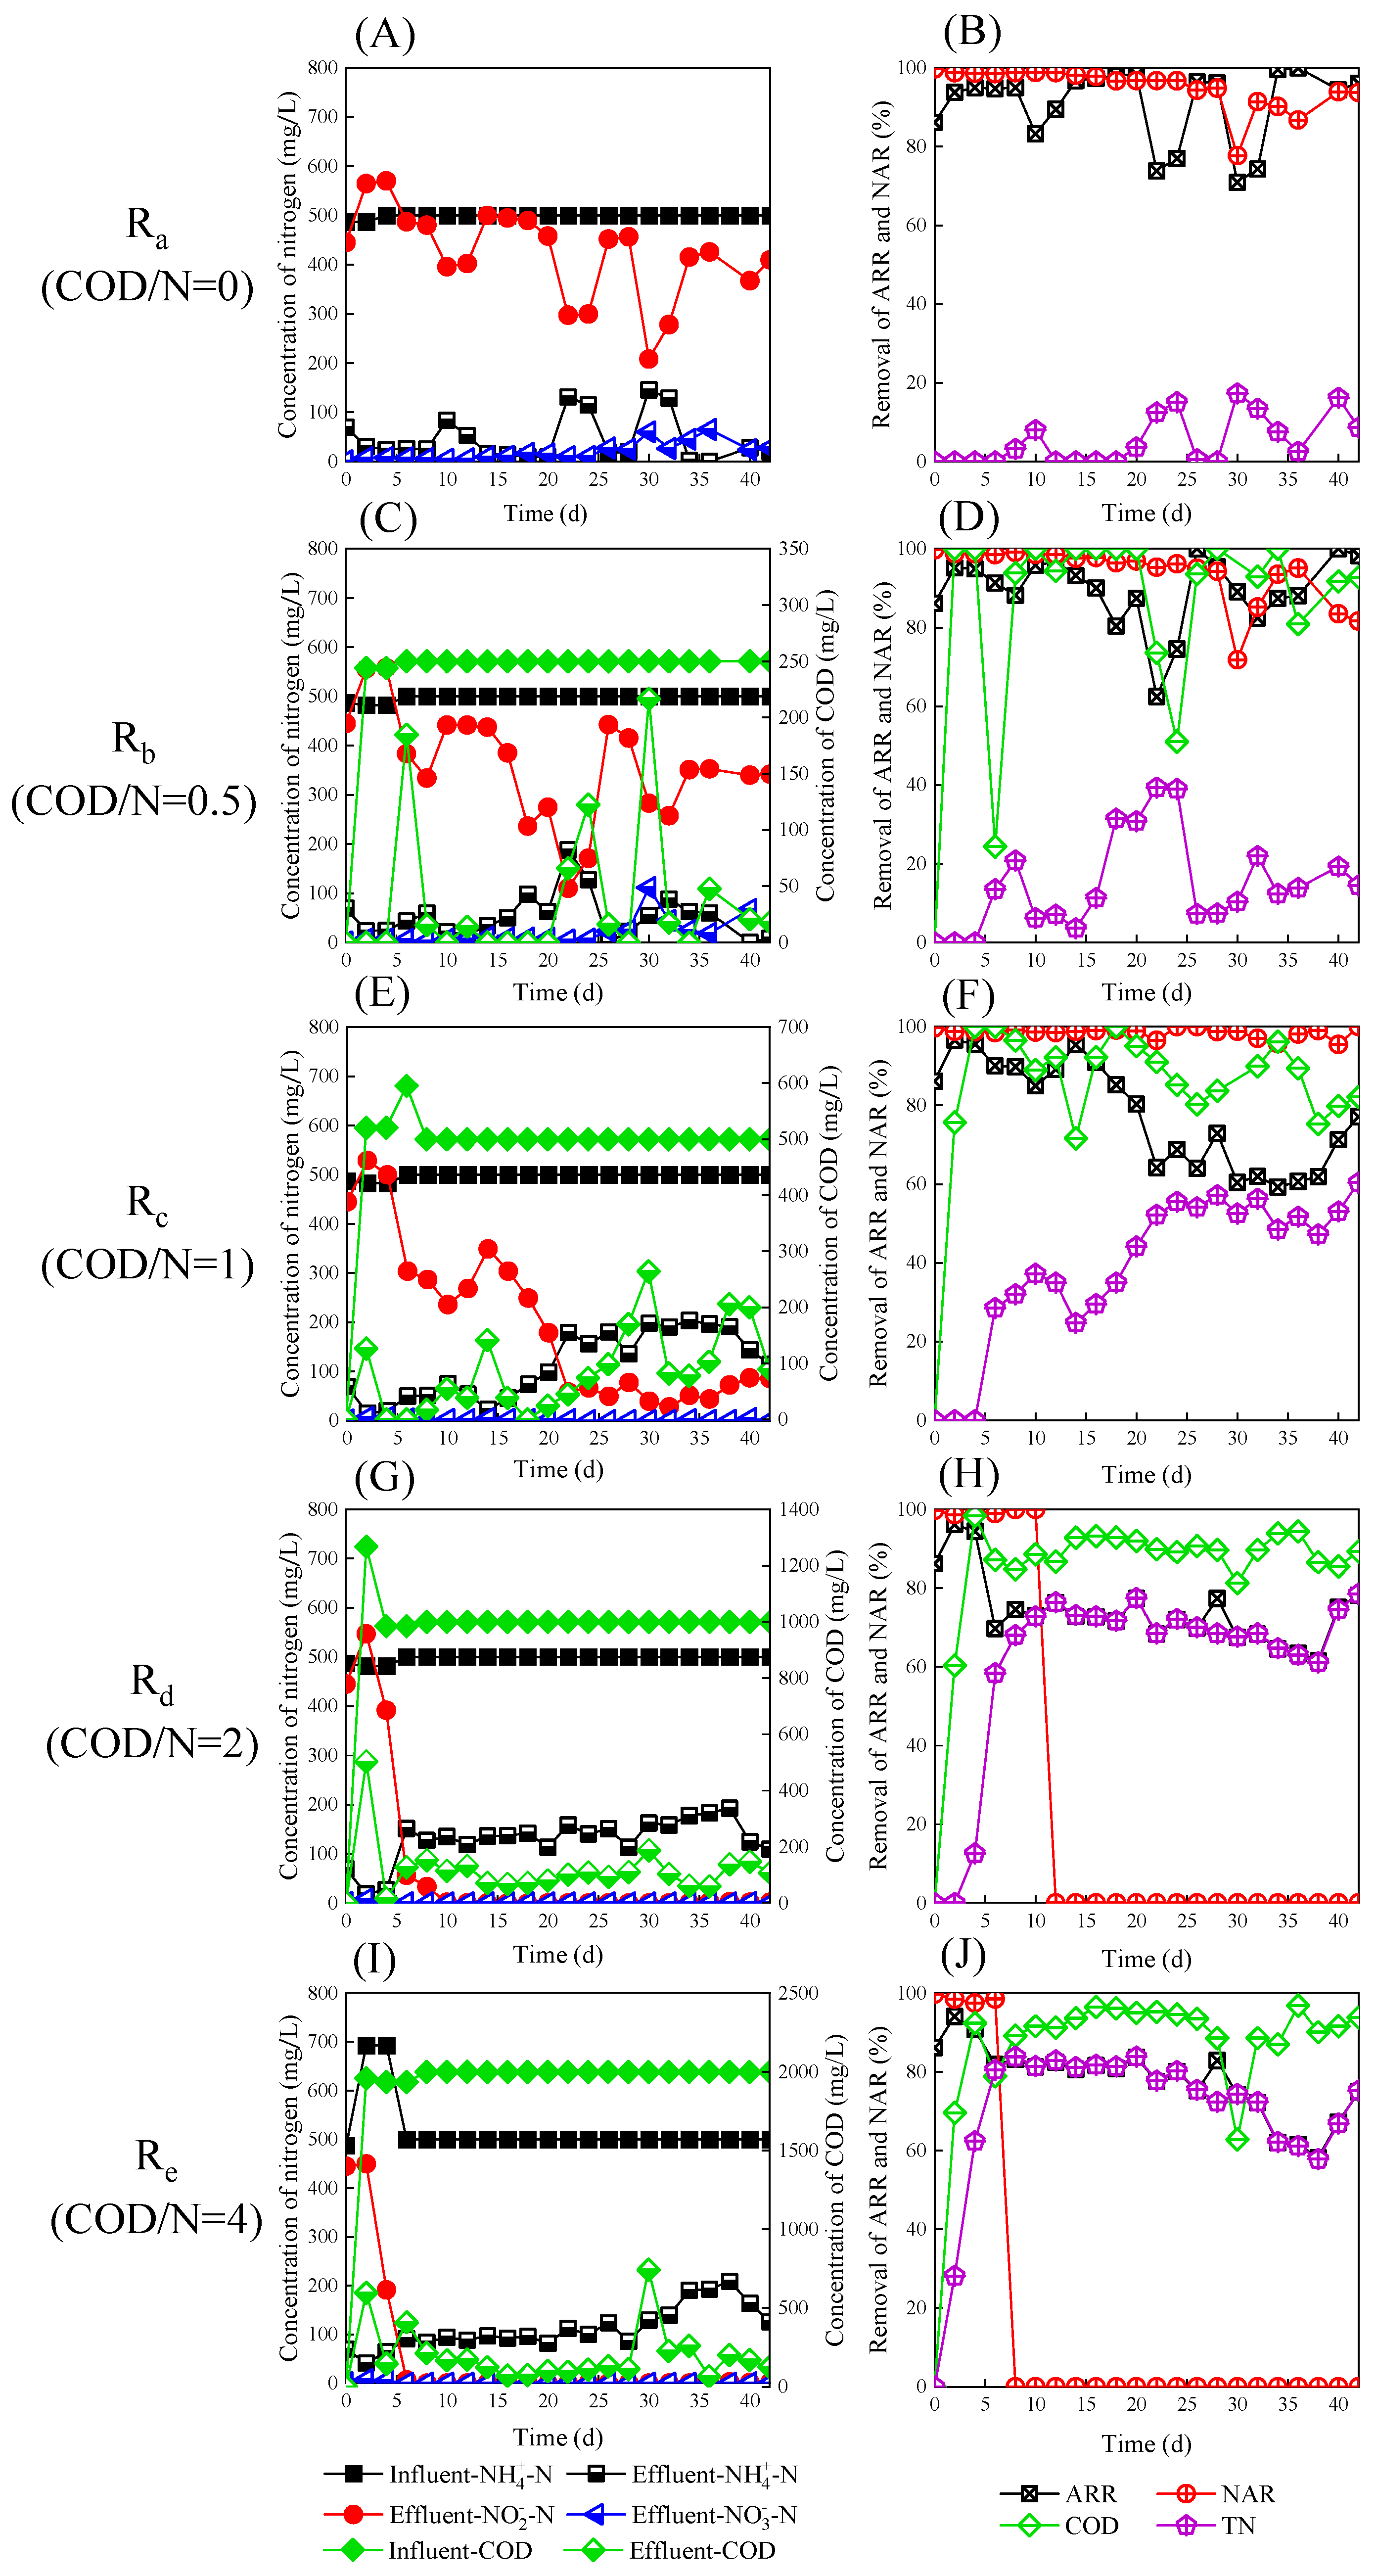
Figure 1. Variations in nitrogen and COD concentrations as well as ARR and NAR of SBRs at COD/N ratios of 0 (A,B), 0.5 (C,D), 1 (E,F), 2 (G,H), and 4 (I,J).
Water 16 02532 g001
Figure 2. Variations in nitrogen, COD, DO, pH, FA, and FNA concentrations at COD/N ratios of 0 (AC), 0.5 (DF), 1 (GI), 2 (JL), and 4 (MO) in a typical single cycle.
Water 16 02532 g002
Figure 3. Variation in EPS content after 42 days of operation of SBRs at different COD/N ratios.
Water 16 02532 g003
Figure 4. Variations in SOUR of total bacteria, AOB, NOB, and HB at different COD/N conditions.
Water 16 02532 g004
Figure 5. (A) Relative abundances of bacterial communities at the genus level across different COD/N ratios. (B) Pearson’s correlation between bacterial communities and performance/sludge properties at varying COD/N ratios. The color key represents the strength of the correlation coefficient, with significant correlations denoted by * (p < 0.05) and ** (p < 0.01).
Water 16 02532 g005
Figure 6. Relative abundance of functional genes related to nitrogen cycle and carbon fixation based on KEGG database.
Water 16 02532 g006
Table 1. Operational parameters of SBRs at different COD/N ratios.
COD/NNH4+-N (mg/L)COD (mg/L)NaHCO3 (mg/L)Aeration Rate (mL/min)pH
Ra0500055006007.3 ± 0.2
Rb0.550025055008007.3 ± 0.2
Rc1500500550012007.3 ± 0.2
Rd25001000550018007.3 ± 0.2
Re45002000550020007.3 ± 0.2
Disclaimer/Publisher’s Note: The statements, opinions and data contained in all publications are solely those of the individual author(s) and contributor(s) and not of MDPI and/or the editor(s). MDPI and/or the editor(s) disclaim responsibility for any injury to people or property resulting from any ideas, methods, instructions or products referred to in the content.