Abstract
This paper aims to establish a more standardized and regulated carbon emission accounting model for sponge cities by unifying the accounting content for carbon emissions and clarifying the relationships between carbon reduction benefits, carbon reduction effects, and carbon sequestration, in order to evaluate the carbon reduction outcomes and mechanisms of sponge city construction. Based on a Life Cycle Assessment (LCA) carbon emission accounting model using the carbon emission factor method, a newly constructed residential area in Tianshui City, Gansu Province, was selected as a case study, and the carbon emission reduction effect of sponge city construction was then investigated. Results indicated that the 30-year full life cycle carbon emissions for sponge city construction in the newly constructed residential area amounted to 828.98 tons, compared to 744.28 tons of CO2 reduction in traditional construction, representing a 47.31% reduction in carbon emissions. Over a 30-year life cycle, this equated to a total carbon emission reduction effect of 1460.31 tons. Additionally, under various rainfall scenarios in a typical year, the carbon emission reduction effect of sponge city construction exceeded the carbon emissions, achieving carbon neutrality within 22 to 30 years of operation. This demonstrates that the carbon emission reduction effect of sponge city communities is significant. The findings of this study provide data and a theoretical basis for the low-carbon construction of sponge cities in China.
1. Introduction
With the acceleration of global climate change and urbanization, the frequency and intensity of extreme rainfall events have been increasing. This has led to overburdened stormwater systems during heavy rains, resulting in severe flooding issues and even flood disasters in various regions. To effectively address this pressing challenge, many countries around the world have actively engaged in research on stormwater management and technology, achieving significant progress [1]. Developed nations initiated stormwater management studies in the 1970s, focusing on BMPs in the US [2]. These, coupled with design standards, aim to intercept and purify rainwater, restoring pre-urban hydrological cycles and fostering LID [3]. LID, stemming from BMPs, controls runoff via decentralized development. Current research underscores LID’s effectiveness in enhancing urban water cycles and flood mitigation [4]. Various countries, including Australia [5], the UK [6], Singapore, and Japan [7], have implemented innovative systems integrating rainwater management into urban planning, showcasing diverse approaches to sustainable water management [8]. China has adopted these low-impact development concepts, tailoring them to meet the specific needs of its urban construction, and actively puts forward the construction concept of “sponge city” [9]. It aims to enhance urban resilience to environmental changes and natural disasters, thereby improving the city’s ability to cope with extreme weather-related disasters and maintain urban water ecological balance.
On the other hand, since the Industrial Revolution, rapid global socio-economic development has led to substantial carbon emissions. The continuous accumulation of greenhouse gases, such as carbon dioxide, has significantly increased the concentration of greenhouse gases in the Earth’s atmosphere [10]. As a major global carbon emitter, China is facing the dual challenge of economic growth and environmental sustainability. China has committed to achieving peak carbon by 2030 and carbon neutrality by 2060. The design of sponge cities mimics natural hydrological processes, enhancing the absorption, storage, infiltration, and purification of rainwater. It reduces the energy dependence and emissions associated with urban drainage, promotes the use of low-carbon materials, and increases green spaces for carbon sequestration. These initiatives are vital for promoting urban sustainability and mitigating carbon emissions [11].
Within this framework, the greenhouse gas emissions associated with urban water systems and sponge city construction have garnered significant attention. Scholars have conducted extensive research on greenhouse gas emissions accounting for urban water systems, focusing on two main perspectives: sponge city carbon emission accounting and carbon emission reduction calculation. Numerous academic studies have conducted detailed quantitative analyses of the carbon emissions and reduction potential of sponge cities from a life cycle perspective. The use of Life Cycle Assessment (LCA) for carbon emission accounting is widely recognized and considered one of the most comprehensive and universal methodologies in the current academic field [12]. Its approach considers the entire life cycle of a sponge city, from “cradle to grave”, accounting for carbon emissions and reductions across various stages, including the production of facility materials, material transportation, construction processes, operation and maintenance, as well as dismantling and recycling [13]. Zhao [14] calculated the carbon emissions associated with each stage from a life cycle perspective and treated the carbon reductions from processes such as carbon sequestration in green spaces, rainwater utilization, runoff reduction, rainwater purification, and building energy efficiency during operation as carbon sinks. They then calculated the carbon reduction benefits. Lin [15] examined Xiamen City’s sponge city construction, assessing material production, material transport, construction energy consumption, operation energy consumption, direct carbon emissions, maintenance energy consumption, demolition energy consumption, and green space carbon sequestration, rainwater utilization, rainwater purification, building energy efficiency, and runoff reduction carbon sinks. Jiang et al. [16] calculated the carbon emissions of the entire sponge city construction process and treated the carbon sequestration by plants, as well as the reduction in carbon emissions due to runoff reduction and pollution control, as carbon sinks. Wang et al. [17] simulated and evaluated the multidimensional environmental benefits of sponge cities, calculating carbon reduction benefits only from carbon sequestration by green roofs and constructed wetlands. Kavehei et al. [18] quantified the carbon sink capacity of LID facilities, including green roofs and rain gardens, and confirmed that rain gardens have the highest carbon capacity. Zhao et al. [19] accounted for the carbon sequestration by plants as a carbon sink benefit when analyzing the carbon reduction potential of rain gardens. The above studies [14,15,16] regard carbon reductions from processes such as green space carbon sequestration, rainwater purification, rainwater utilization, building energy efficiency improvements, and runoff reduction as carbon sinks, while others [17,18,19,20] consider only plant carbon sequestration as a carbon sink. Another study [21] included the carbon reduction from plants and green spaces as part of the carbon offsetting amount when calculating regional carbon emissions. In fact, a carbon sink should be defined as activities that absorb and store greenhouse gases from the atmosphere [22]. Therefore, only green space carbon sequestration fits the definition of a carbon sink. Other activities, such as rainwater utilization and purification, should not be considered carbon sinks, as they do not directly absorb and store carbon. Additionally, there are differences in defining the carbon emission reduction effect and benefit. Su et al. [11] compared the carbon emissions during the operation phase of sponge cities with traditional drainage systems and defined the difference in carbon emissions between traditional drainage systems and sponge cities as the emission reduction effect, showing that sponge city drainage systems can reduce carbon emissions by an average of 49%. Other studies [16] calculated the carbon reduction efficiency by comparing the total carbon emissions with the carbon emission reduction. Peng et al. [23] considered the carbon sequestration by plants, along with the purification and storage benefits of rainwater, as carbon reduction benefits when calculating the life cycle carbon emissions of rain gardens. Wang et al. [13] used the ratio of carbon reduction over the life cycle of LID facilities to their cost as a measure of carbon reduction benefits.
From another perspective, some studies [24,25,26] focus primarily on the operational and construction phases of carbon emission accounting, with insufficient consideration of carbon emissions throughout the entire life cycle and potential carbon reduction pathways, which can lead to deviations in the results. Daniel Jato-Espino et al. [27] conducted a life cycle sustainability assessment of traditional and LID-based sustainable drainage systems, highlighting the carbon emission differences between the two models during the construction and operational phases. There are also some other studies with incomplete considerations regarding the carbon emissions associated with facilities, particularly in the operational phase. For example, these studies [28,29] tend to focus exclusively on the indirect carbon emissions arising from factors such as operational equipment within facilities, along with the carbon emission reductions achieved by the facilities, while neglecting the potential direct carbon emissions that may stem from the degradation and transformation of pollutants in rainwater, a process facilitated by sponge facilities.
The review of the aforementioned references reveals inconsistencies and ambiguities in the definitions of carbon sinks, carbon emission reduction effects, and carbon emission reduction benefits, as well as disparities in accounting content, leading to significant variations in accounting outcomes and conclusions. To address these discrepancies, this study primarily clarifies the often-neglected relationships among carbon sinks, carbon emission reduction effects, and carbon emission reduction benefits. Specifically, it integrates additional activities during sponge facility operation, such as rainwater utilization and purification, into the carbon emission reduction effects alongside carbon sinks. Furthermore, the difference between traditional and sponge facilities is defined as the carbon emission reduction benefit. Through a comparative reference analysis, this study discusses the delineation of stages and boundaries for carbon emission accounting in sponge cities, thereby refining the accounting methods and enhancing the calculation of carbon emission reduction effects. This study can provide theoretical support for the standardization and scientific development of the carbon emission accounting system for sponge cities, as well as offer a reference for guiding urban water management towards a greener and more low-carbon direction.
2. Research Methodology
2.1. Carbon Emission Accounting Modelling
2.1.1. Model and Boundary Conditions
Determining the boundaries of carbon emission accounting and identifying carbon sources and carbon reductions are crucial in constructing a comprehensive carbon emission accounting model [14]. In terms of time scale, the boundaries for carbon emission accounting should encompass the entire “cradle-to-grave” life cycle of the system, spanning from the initial phases of construction, through operation and maintenance, to eventual demolition and recovery [30], specifically:
- (1)
- Construction Phase: All processes before the facility’s official operation and commissioning, including material production, material transportation, and construction stages.
- (2)
- Operation and Maintenance Phase: All processes from the facility’s commissioning to the end of its operation.
- (3)
- Dismantling and Recycling Phase: All processes in which the facility is used for other purposes or completely removed after the end of operation.
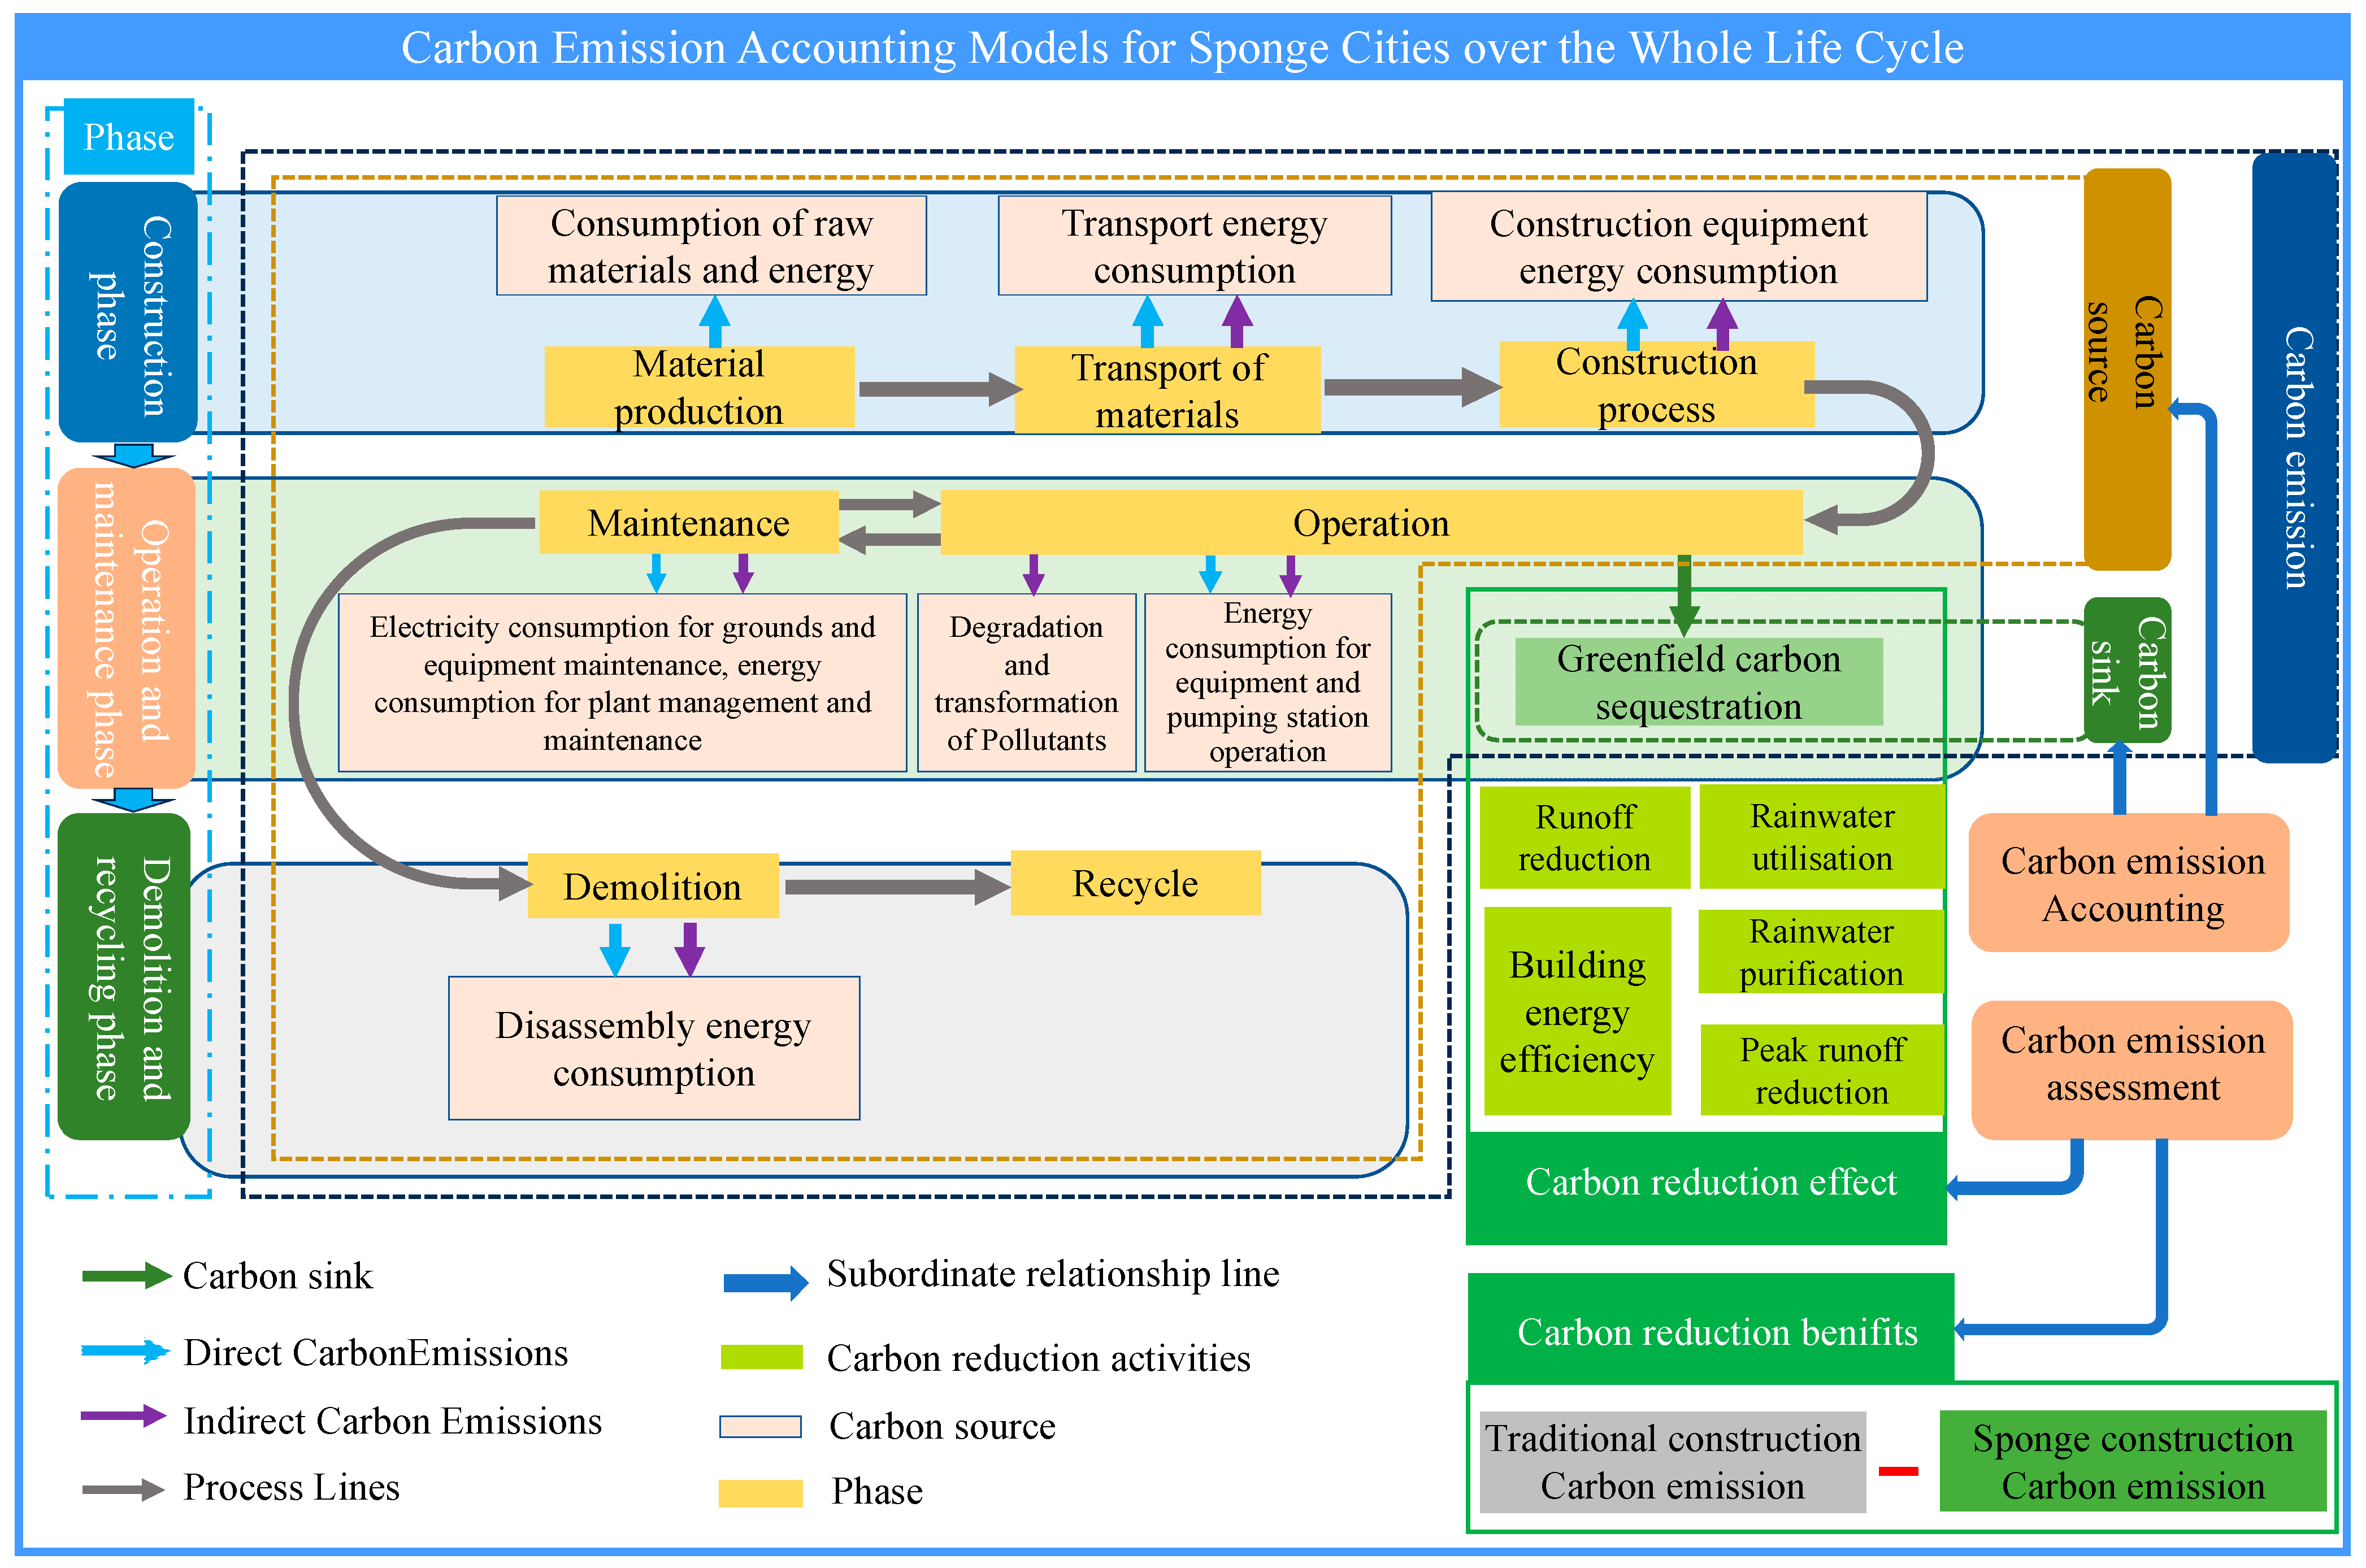
Physically, the boundaries should encompass the entire process, starting from the source reduction facilities for rainwater, through its conveyance within the stormwater pipe network system, and ultimately to its discharge. This includes the carbon emissions attributed to the stormwater pipe network system itself [11]. Additionally, a thorough accounting must consider both direct and indirect carbon emissions, as well as carbon emission reductions associated with sponge city facilities. Direct carbon emissions refer to those generated by the degradation of pollutants within the sponge facilities. Indirect carbon emissions encompass emissions stemming from the production and transportation of materials used in the facilities, as well as energy consumption by equipment utilized at various stages. Carbon emission reduction is achieved through mechanisms such as plant carbon sequestration, rainwater utilization, runoff reduction, rainwater purification, and building energy efficiency during the operation of sponge city facilities [14].
In summary, the carbon emission accounting model for sponge cities is constructed as shown in Figure 1.
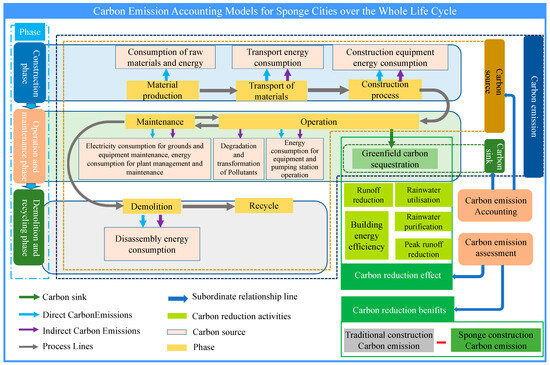
Figure 1.
Carbon emission accounting model for the whole life cycle of sponge cities.
2.1.2. Methods of Accounting
According to existing references [14], sponge city carbon emission accounting methods are divided into two categories: the emission factor method and the actual measurement method. The carbon emission factor method involves constructing a carbon emission inventory, estimating activity data for each carbon emission locus, finding appropriate emission factors, and estimating carbon emissions based on activity level and emission factors. Since a carbon emission factor database for sponge city carbon emission accounting has not yet been formed, current carbon emission factors are primarily derived from other industries’ carbon accounting standards, life cycle assessment software databases, and related references [31]. The actual measurement method involves sampling and instrumental measurement to determine greenhouse gas emissions at each carbon emission site. Measurement results can be converted into carbon emission factors to enrich the emission factor database. Most existing references adopt the carbon emission factor method for sponge city carbon emission accounting, with a few studies using the measurement method. For example, Bledsoe et al. [32] measured GHG fluxes from an artificial wetland in Greenville, and Fan et al. [33] measured carbon sequestration from green roofs over five years.
The carbon emission factor method is suitable for carbon emission accounting in sponge cities at various scales and stages. This method offers simplicity, clarity, and methodological consistency. The accuracy of accounting results relies on high-quality carbon emission factors and activity data. Carbon emission factors are mainly obtained through long-term monitoring and research, as well as data accumulation, and the method is also an empirical method [30]. Unlike the carbon emission factor method, the actual measurement method is more suitable for carbon accounting at a single site during the operation and maintenance phase at the facility scale. Therefore, this study uses the emission factor method for sponge city carbon emission accounting, as detailed in Equation (1):
where is the carbon emissions, kgCO2; is the activity data; is the emission factor, which represents the carbon emissions generated per unit of activity data.
The carbon emission accounting method and formula refer to the “IPCC Guidelines for National Greenhouse Gas Inventories (2019 Revision).”
2.2. Definition and Accounting Methods for Carbon Reduction Benefits
Carbon reduction benefit evaluates the reduction in carbon emissions when using sponge construction compared to traditional construction. The calculation formula is shown in Equation (2).
where is the carbon reduction benefit, kgCO2; is the traditional construction carbon emission; is the sponge construction carbon emission.
2.3. Definition and Accounting Methods for Carbon Emission Reduction Effect
We define the carbon emission reduction effect of a sponge city as the carbon emission reduction generated by sponge construction due to activities such as carbon sequestration in green space, energy saving in buildings, rainwater purification, peak runoff reduction, rainwater utilization, and runoff reduction. The calculation formula is shown in Equation (3).
where is the carbon emission reduction of the operation process, kgCO2; is the carbon sink of carbon sequestration in green space, kgCO2, which is calculated by using Equation (4) and is the carbon emission reduction of building energy saving, kgCO2, which is calculated by using Equation (5); is the carbon emission reduction from rainwater purification, kgCO2, calculated by using Equation (6); is the carbon emission reduction from the decrease in rain pipes (sponge cities can cut down the peak runoff and thus reduce the diameter of constructed stormwater pipes), kgCO2, calculated by using Equation (7); is the carbon emission reduction from rainwater utilization, kgCO2, calculated by using Equation (8); is the carbon emission reduction from runoff reduction, kgCO2, calculated by using Equation (9).
Greenfield sequestration carbon sinks are calculated in Equation (4).
where is the area of green space of category , m2; is the carbon sink factor of green space of category , kgCO2/(m2·year); is the time of the life cycle, in years, set to 30 years, and the same applies below.
The calculation of carbon emission reduction from building energy efficiency due to sponge city construction is shown in Equation (5).
where is the amount of air-conditioning electricity saved in the building by the sponge facility due to thermal insulation, kW·h/a. is the carbon emission factor of electricity production, kgCO2/(kW·h).
The calculation method for rainwater purification is shown in Equation (6).
where is the reduction in pollutants, kgCOD/year; is the carbon emission factor corresponding to the purification of an equal amount of wastewater in a sewage treatment plant, kgCO2/kg COD, set to 3.1 kgCO2/kg COD.
Sponge cities can cut down the peak runoff and thus reduce the diameter of constructed stormwater pipes. Its carbon emission reduction can be calculated according to Equation (7).
where is the carbon emission from the construction of rainwater pipes without sponge facilities, kgCOD; is the carbon emission from the construction of rainwater pipes after the installation of sponge facilities to reduce the peak of runoff, kgCO2.
The calculation of carbon emission reductions from rainwater use is shown in Equation (8).
where is the amount of rainwater collected by the sponge facility, m3/year; is the amount of electricity consumed per cubic meter of tap water, kW·h/m3; and is the carbon emission factor of electricity production, kgCO2/(kW·h).
The calculation of carbon emission reduction from runoff reduction is shown in Equation (9).
where is the acceleration of gravity, m/s2; is the average head of the pumping station, m; is the runoff volume cut by the sponge facility, including rainwater utilization, m3/year; is the efficiency of the pump work; is the transmission efficiency between the motor and the pump; is the efficiency of the motor. is the carbon emission factor of electricity production, kgCO2/(kW·h).
2.4. Case Overview
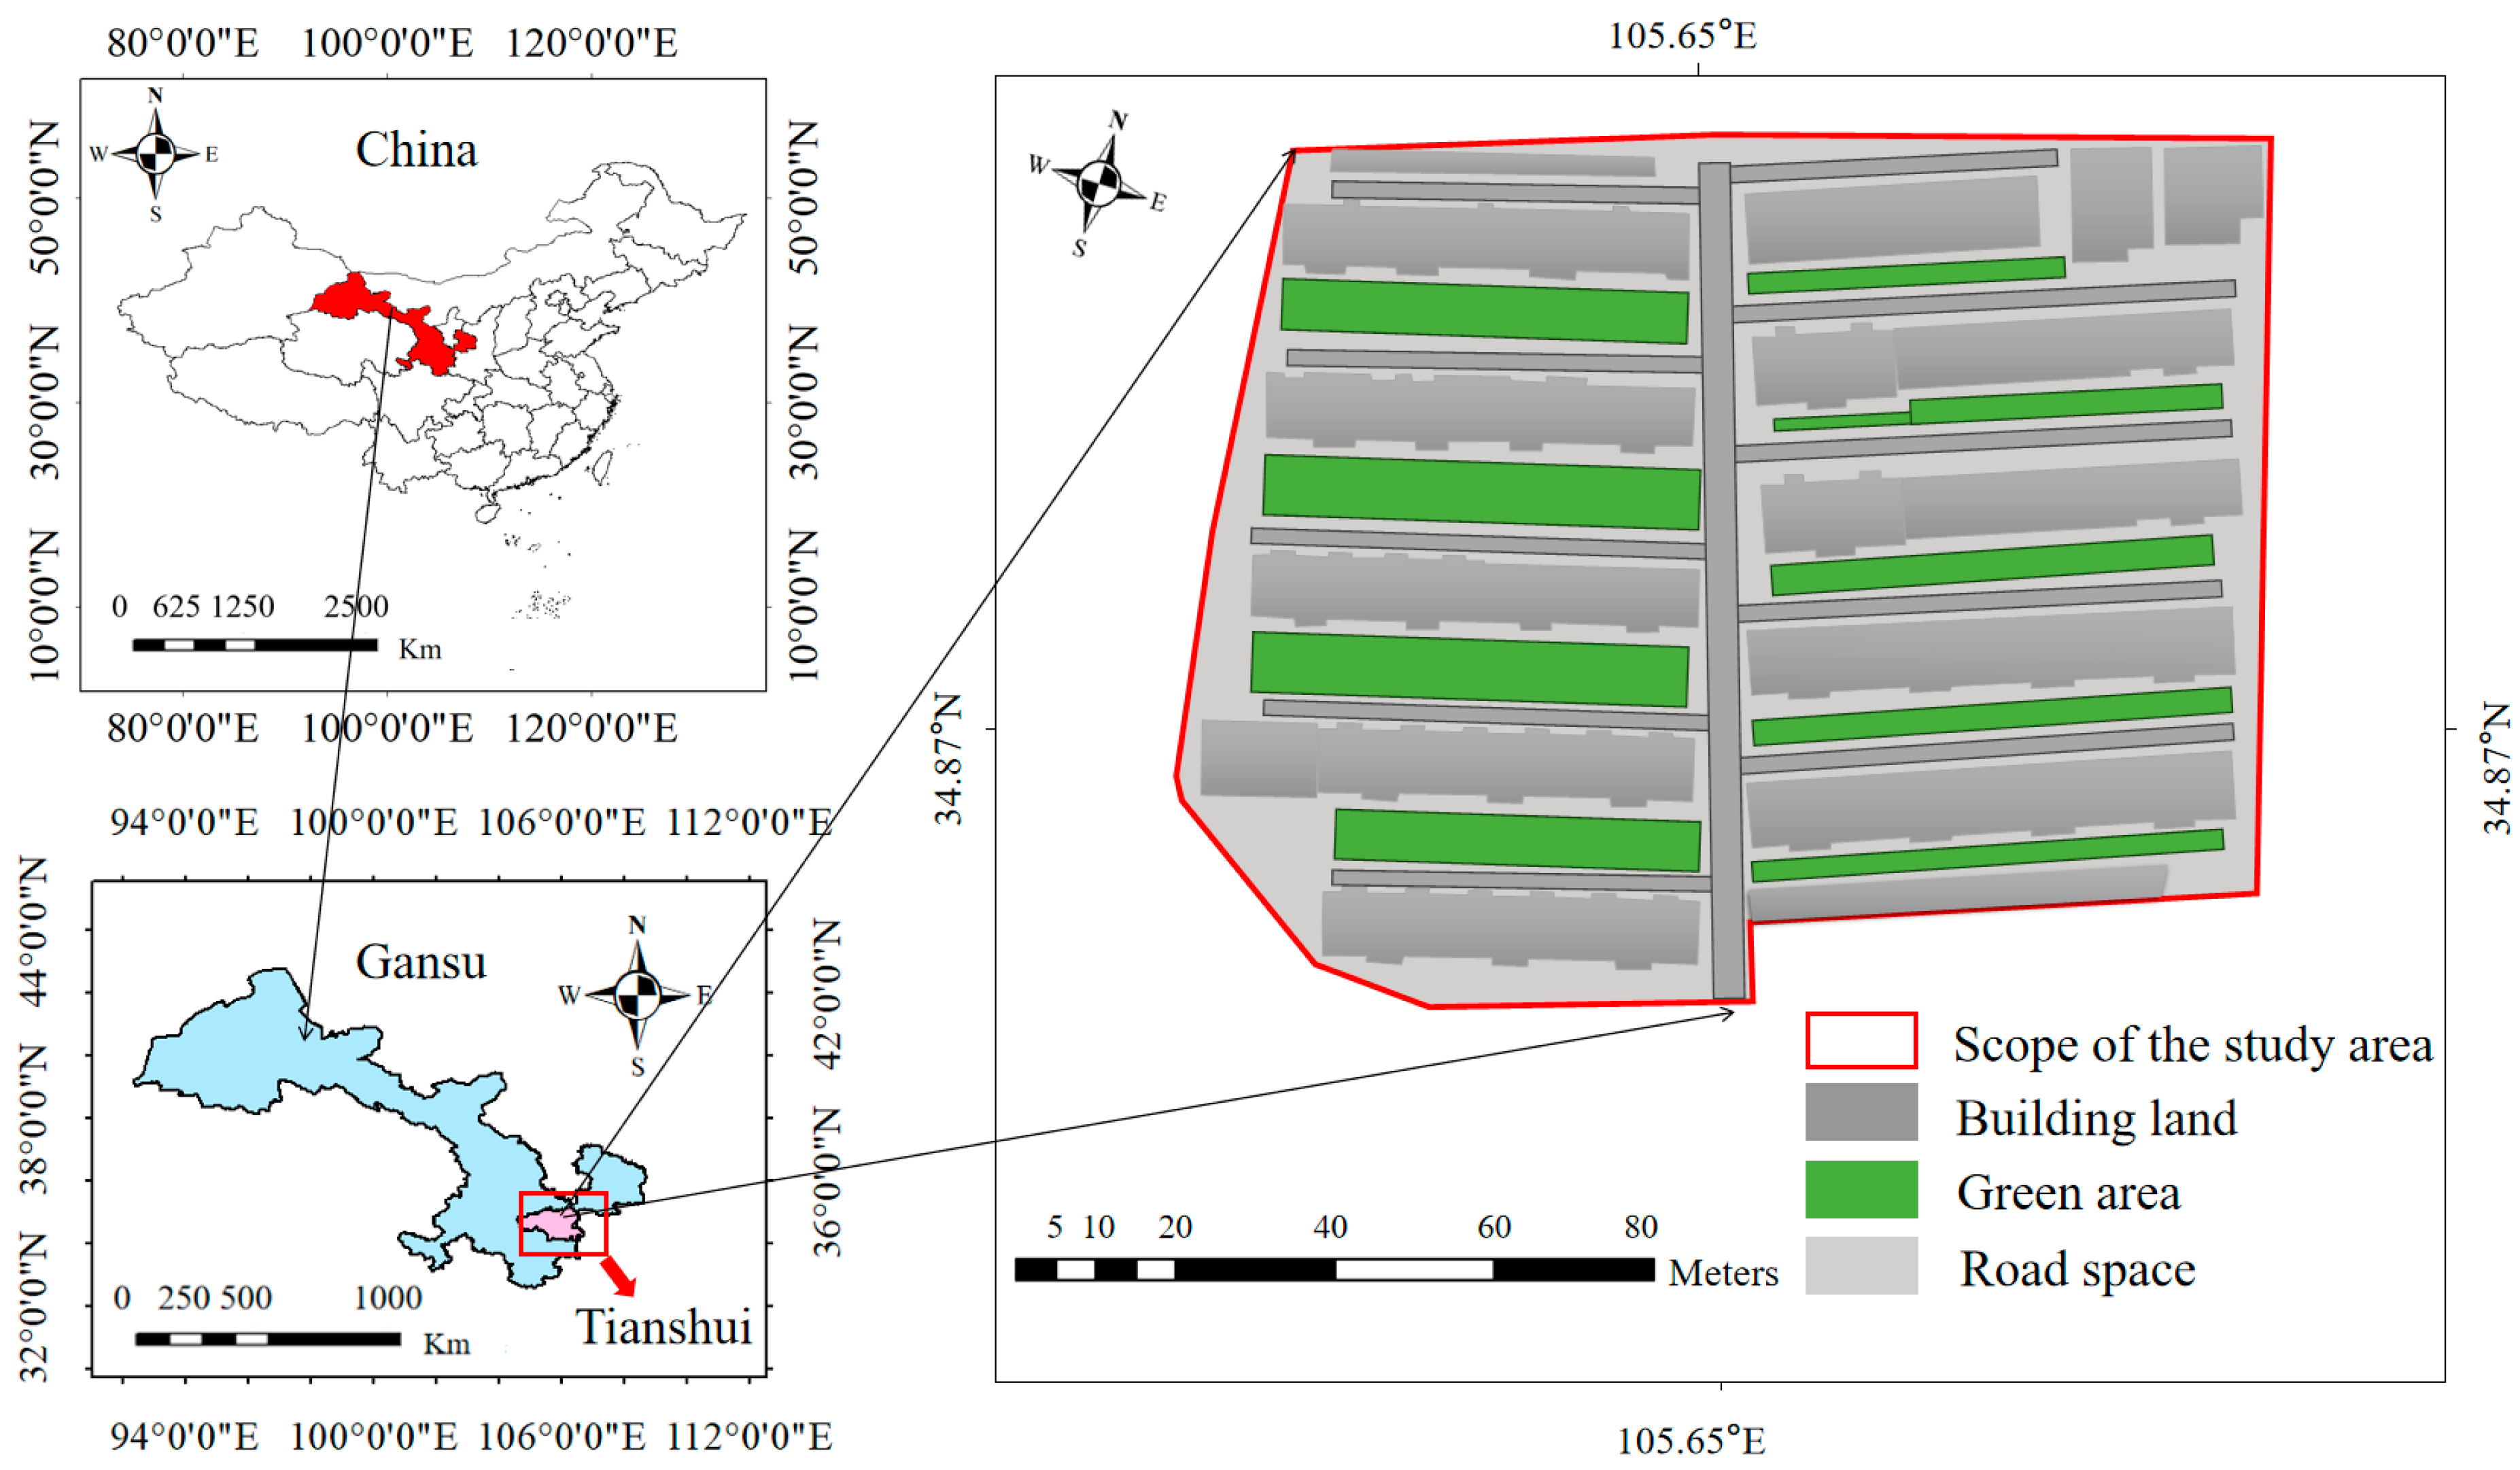
The study area is a new residential district in Maiji, Tianshui City, covering 26,600 m2. The terrain of the surrounding area is characterized by higher elevations in the west and south, and lower elevations in the east and north. The land use distribution within the study area consists of building land (42.11%), road land (42.48%), and green land (15.41%). A schematic diagram of the study area is presented in Figure 2.
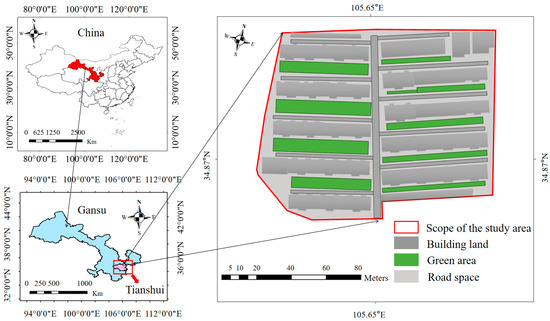
Figure 2.
Schematic of the study area.
The region, situated within a pilot city for sponge city development in China, serves as a vital subject for intensive research. This endeavor facilitates a profound understanding of carbon emission characteristics and provides a reference framework for subsequent sponge city constructions, thereby fostering their environmentally sustainable and low-carbon development nationwide.
Under the traditional construction model, 4100 m2 of ordinary green space and 6883.28 m2 of conventional impermeable pavement were constructed. The comprehensive runoff coefficient, calculated as the area-weighted average of the three surface types, is 0.78. The total annual runoff control rate is 39.57%.
In contrast, the sponge construction model incorporates 2046.65 m2 of bioretention facilities, 6883.28 m2 of permeable pavement, and 3612.84 m2 of green roofs. Additionally, 2053.35 m2 of common green space is included. This configuration results in a comprehensive runoff coefficient of 0.53, achieving a total annual runoff control rate of 91.71%, thereby surpassing the required control rate of 85%.
Carbon emission accounting under the sponge construction model primarily focuses on the whole life cycle carbon emissions of permeable pavement, green roofs, bioretention facilities, and other sponge infrastructure. Conversely, the traditional construction model emphasizes the whole life cycle carbon emissions of conventional impervious pavement, ordinary green space, and rainwater pipe networks. The area structure of ordinary green space and ordinary impervious pavement corresponds to the pervious pavement and bioretention facilities of the sponge construction model.
Rainfall in Tianshui City exhibits significant annual variability. According to data from the Tianshui meteorological station (1956–2022), the long-term average annual precipitation is 501.9 mm. Notable inter-annual variations include a peak precipitation of 818.6 mm in a wet year (2013) and a low of 242.7 mm in a dry year (1996). Figure 3 illustrates the precipitation changes at the Tianshui station from 1956 to 2022.
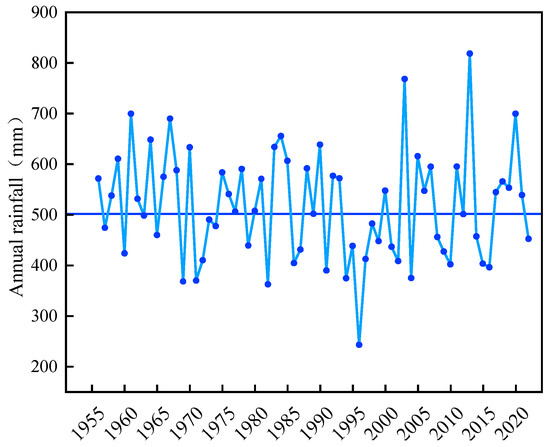
Figure 3.
Multi-year rainfall variation at Tianshui station.
2.5. Data Collection and Model Applicability
This study endeavors to establish a comprehensive and standardized theoretical framework for a life cycle carbon emission accounting model for sponge cities, with the aim of fostering its widespread adoption and deepened application in practical settings. Given the current absence of a dedicated carbon emission factor database specific to sponge cities, this research selected carbon emission factors by drawing upon established carbon accounting standards from other industries, leveraging authoritative life cycle assessment software databases, and integrating rigorous references with standards comparison processes. Throughout this process, environmental similarity was taken into account to ensure that the selected factors accurately reflect actual emission scenarios, thereby enhancing the relevance and scientific rigor of the accounting results [31], aligning with common strategies employed in relevant references within the field [14,15,34]. While the currently employed carbon emission factors preliminarily meet the requirements of this study, their precision and universal applicability necessitate further rigorous validation and continuous optimization. Consequently, this paper proposes that in subsequent specialized research, a more detailed and precise argumentation and empirical measurement of carbon emission factors should be conducted, taking into account the varying developmental stages and unique operational conditions of various sponge city facilities. This endeavor will notably enhance the accuracy of carbon emission calculations, providing a solid data foundation for further model optimization and propelling the development of the sponge city carbon emission accounting system towards greater sophistication and advancement.
Moreover, when extending the application of this accounting model to different cities or regions, it is imperative to fully consider the specific conditions and characteristics of each location, adjusting or updating the key carbon emission factors accordingly. This measure not only exemplifies the rigor of scientific research but also ensures the accuracy, relevance, and applicability of the accounting results.
3. Result
Using the above-established life cycle carbon emission accounting model and methodology, this study conducted an accounting and analysis of carbon emissions and carbon emission reductions at various stages of sponge city construction versus traditional construction, taking a newly built residential area as an example. The results indicate that sponge city construction significantly reduces carbon emissions over a 30-year life cycle, achieving a carbon emission reduction benefit of 744.28 tCO2, with a reduction rate as high as 47.31%. Additionally, sponge city construction generates a carbon emission reduction effect of 1460.31 t, with building energy efficiency contributing the largest proportion. This approach enables the achievement of carbon neutrality within 22 to 39 years. These findings demonstrate that sponge city construction holds significant advantages in promoting low-carbon urban development.
3.1. Carbon Emission Accounting
3.1.1. Carbon Emissions during the Construction Phase
- (1)
- Carbon emissions from material production
The traditional construction model involves the use of pipes, ordinary concrete paving, and conventional green spaces. In contrast, the sponge construction model incorporates bioretention facilities, permeable paving, green roofs, rain barrels, and storm drains. Specific details are provided in Table 1.

Table 1.
Carbon emissions from material production.
- (2)
- Carbon emissions from transport of materials
Diesel trucks are utilized for material transportation. To simplify calculations and account for the uncertainty of material manufacturer locations, the national average freight distance in 2020 (176 km) is used [14]. Carbon emissions from the transport of individual materials are detailed in Table 2.
Table 2.
Carbon emissions from material transport.
- (3)
- Carbon emissions from construction
Referencing studies by Zhao [14] and Ma Jie [36], the energy consumption associated with mechanical equipment, power supply, excavation, and backfilling during the construction process is considered. Standard coal, identified as the primary energy source, is used to meet various energy requirements. According to Lu Lin [37], the carbon emission conversion factor for standard coal is 29.30 kgCO2/GJ. Utilizing this factor, the carbon emissions for traditional and sponge construction were calculated, resulting in 110,338.00 kgCO2 and 57,667.20 kgCO2, respectively.
3.1.2. Carbon Emissions during the Operation and Maintenance Phase
The average annual precipitation in Tianshui City is 501.9 mm, with average mass concentrations of chemical oxygen demand (COD) and total nitrogen (TN) in rainwater at 150 mg/L and 14 mg/L, respectively. In sponge construction plots, the annual runoff COD removal rate is 44.63%, and the TN removal rate is 41.73%, whereas traditional construction achieves COD and TN removal rates of 23.74% and 19.79%, respectively.
The direct carbon emission in the operation phase comes from the degradation and transformation of pollutants in rainwater in the community. Indirect carbon emissions, such as those from the energy consumption of stormwater pumping stations, are not considered in this study due to the absence of such stations in the case area.
Carbon sinks during the operation phase primarily arise from the carbon sequestration by green facilities.
Maintenance phase carbon emissions in the new community include those from the upkeep of site facilities and plant management. Traditional construction maintenance involves projects like pipe unblocking, facility repairs, and centralized stormwater drainage. Sponge construction maintenance requires pressure washing and vacuuming of permeable pavements. Both traditional and sponge constructions must account for carbon emissions from repairing damaged facilities, estimated at 1% of construction phase emissions [14]. Plants in traditionally constructed plots are typically hardy, low-maintenance species that grow mainly from natural rainfall, resulting in relatively low carbon emissions from maintenance. In contrast, sponge construction involves bioretention facilities, green roofs, and larger plants and shrubs, necessitating maintenance equipment and irrigation, thereby consuming electricity and diesel and generating carbon emissions. Since specific maintenance work has not yet been conducted in this study, carbon emissions from the maintenance of bioretention facilities, planting trenches, and green roof plants are calculated using the unit area carbon emission factors from Ma Jie [36] and Zhu Yu [38].
Calculations indicate that direct carbon emissions in the operation phase under traditional construction are 39,163.10 kgCO2, with a carbon sink of −197,021.40 kgCO2. Maintenance phase carbon emissions are 635,608.54 kgCO2 for traditional construction, with site facility maintenance contributing 1476.00 kgCO2. For sponge construction, direct carbon emissions are 28,438.62 kgCO2, with a carbon sink of −274,877.00 kgCO2. Maintenance phase carbon emissions for site facilities in sponge construction are 13,406.46 kgCO2, and plant management and conservation contribute 20,512.66 kgCO2.
3.1.3. Carbon Emissions from Demolition and Recycling
Carbon emissions from dismantling and recycling are estimated to be 90% of the construction phase carbon emissions. This estimation method is commonly used in the construction sector [39]. For traditional construction of new neighborhoods, carbon emissions from this phase are calculated to be 99,304.20 kgCO2, and for sponge construction, they are 51,900.50 kgCO2.
3.2. Carbon Reduction Benefits
Based on the carbon emission calculations for each stage of traditional and sponge construction, combined with Equation (2), the carbon emission reduction benefit of the 30-year life cycle for the sponge construction plot is determined to be 744.28 tCO2.
3.3. Carbon Emission Reduction Effect
The carbon emission reduction in sponge construction primarily arises from “carbon offsets” generated through green field carbon sequestration, building energy efficiency rainwater purification, peak runoff reduction, and rainwater utilization during the operational period. As there is no rainwater pumping station in the study area, carbon emission reductions from runoff reduction are not included. Based on the content and formulas from Section 2.3, the carbon reduction amounts for each activity are calculated as follows.
- (1)
- Green field Carbon Sequestration
Results refer to the carbon sink amount during the operational phase, as detailed in Section 3.1.2.
- (2)
- Rainwater Utilization
Rainwater collection and utilization facilities reduce carbon emissions from the treatment and delivery of tap water by the urban water supply system. According to the “Tianshui Sponge City Construction Project Sponge Control Indicator Table”, the case study area’s rainwater resource utilization rate is 25%, with a rainwater utilization amount of 3337.64 m3/a, and the carbon emission factor for tap water supply and treatment is 1.07 kg CO2/m3. The calculated carbon reduction over a 30-year lifecycle is 107,138.07 kg CO2.
- (3)
- Peak Runoff Reduction
Sponge cities can reduce runoff peaks, thereby decreasing the diameter of stormwater pipes and lowering the carbon emissions from the production and transportation of these pipes. In traditional construction scenarios for newly built residential areas, sponge facilities are not implemented, and a stormwater drainage system is installed. In sponge construction scenarios, carbon emissions from the drainage system are not considered, with rainwater flowing from bioretention facilities and vegetated swales to the municipal network. Therefore, the carbon reduction in sponge construction compared to traditional construction comes from the material production, transportation, and installation of stormwater pipes. The carbon reduction for this activity over a 30-year lifecycle is 205,783.30 kg CO2.
- (4)
- Rainwater Purification
Green roofs, permeable pavements, and bioretention facilities in the residential area can remove some pollutants from rainwater runoff, effectively regulate rainwater, and improve the quality of rainwater runoff, thereby reducing carbon emissions from pollutant treatment in sewage treatment plants. The pollutants reduced are mainly chemical oxygen demand (COD), with a surface pollutant concentration of 775 mg/L and a carbon emission factor of 3.1 kg/kg, based on the pollutant removal calculation method from Zhao [14]. The carbon reduction over a 30-year lifecycle is 70,511.74 kg CO2 for traditional construction and 209,408.13 kg CO2 for sponge construction.
- (5)
- Building Energy Efficiency
Carbon reductions from building energy efficiency mainly come from green roofs, which significantly improve the building environment. The carbon reduction factor for building energy efficiency is 6.118 kg CO2/(m2·year) according to reference [40]. The calculated carbon reduction over a 30-year lifecycle is 663,100.65 kg CO2.
In summary, the case study area can achieve a carbon reduction of 1460.31 tons over a 30-year lifecycle, with contributions of 18.82% from green space carbon sequestration, 7.34% from rainwater utilization, 14.09% from runoff peak reduction, 14.34% from rainwater purification, and 45.41% from building energy efficiency. The carbon emission reductions from each activity are detailed in Table 3.
Table 3.
Carbon emission reductions by carbon emission reduction activity.
4. Discussion
4.1. Carbon Emission Analysis
4.1.1. Carbon Source Analysis for Sponging Communities
The carbon emission analysis of sponge construction reveals that the net carbon emission over a 30-year life cycle is 828.98 tCO2. This total includes a carbon emission reduction of 274.88 tCO2 and a carbon emission of 1103.86 tCO2, resulting in a carbon emission per square meter of 31.16 kg/m2. The carbon emissions for each phase are illustrated in Figure 4. Material production contributes the most to carbon emissions, amounting to 768.21 tCO2, which constitutes 92.67% of the total emissions. This finding aligns with the conclusion of Li Junqi [41] indicating that carbon emissions from sponge city construction are predominantly concentrated in the material production phase, with material production accounting for over 80% of total emissions.
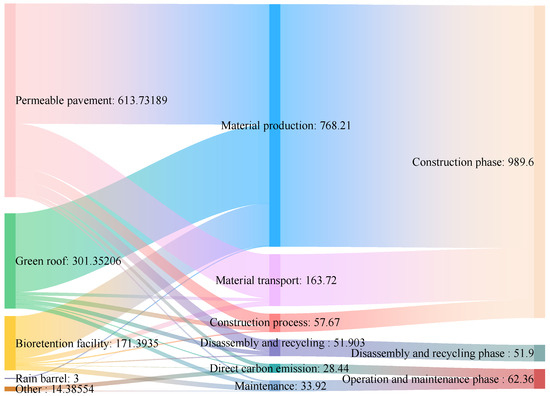
Figure 4.
Carbon emissions at various stages of sponging in new subdivisions.
Permeable paving has the largest share of carbon emissions during material production, transport, and construction, followed by green roofs. The proportion of carbon emissions from the production of permeable paving materials is 49.65%, the proportion of carbon emissions from the transport of materials is 84.78%, and the proportion of carbon emissions from the construction process is 69.83%. The proportion of carbon emissions from the production of materials for bioretention facilities is 17.44%, the proportion of carbon emissions from the transport of materials is 9.27%, and the proportion of carbon emissions from the construction process is 5.95%. Green roofs account for 32.52% of carbon emissions from material production, 5.93% of carbon emissions from material transport, and 24.22% of carbon emissions from the construction process. Rain barrels are almost negligible except for the material production stage, which accounts for 0.39%.
In the material production process, permeable concrete, the material used for permeable paving, has the highest carbon emissions, accounting for 32.26% of material production. PVC drainage boards, the material used for green roofs, account for 30.08% of carbon emissions from material production, and high-density polyethylene (HDPE), the material used for bioretention facilities and green roofs, accounts for 16.35% of carbon emissions from material production. This finding is inconsistent with the results of Lin’s study [15], where the HDPE seepage control membrane had the highest carbon emissions. This discrepancy is due to the significantly larger areas of permeable paving and green roofs constructed in the case study area compared to bioretention facilities, resulting in higher usage of permeable concrete and PVC drainage boards, while the use of HDPE membranes is relatively minimal. The remaining materials are largely green and non-polluting, contributing to a reduced overall environmental impact.
Pervious concrete and graded gravel have higher percentages of carbon emissions during transport, at 34.44% and 30.79%, respectively, which is consistent with the findings of Ma Jie [36]. In this study, the planting soil and amended soil of the bioretention facility are locally transplanted and sourced nearby, so the carbon emissions from the transport of the bioretention facility are negligible. Therefore, when purchasing materials, local manufacturers close to the construction site should be chosen, or materials should be sourced as close as possible. During the construction process, the carbon emissions of permeable paving are greater than those of bioretention facilities and green roofs, which aligns with Wang’s [42] conclusion that permeable paving generates more carbon emissions during construction.
During the operation and maintenance phase, the carbon emission reduction is only sequestered in the green space, with a carbon sink of 5585.00 kgCO2/year. Carbon emissions from fertilizer and pesticides account for 79.81% of sponge plant maintenance. This high percentage is due to the increased use of insecticides and the number of sterilizations required for the diverse plant species. To reduce carbon emissions, lower-maintenance, drought-tolerant, and insect-resistant shrubs or biological control measures can be used. The dismantling and recycling processes were not analyzed further due to their low percentage of carbon emissions. The results showed that the carbon emissions of the four facilities in descending order are permeable paving, green roofs, bioretention facilities, and rain barrels.
4.1.2. Analysis of Carbon Emissions from LID Facilities
Due to the different construction scales of various types of low-impact development (LID) facilities, the comparison of total carbon emissions cannot reflect the differences in the whole life cycle carbon emissions of different LID facilities. Therefore, the carbon emissions per unit area for the whole life cycle of each sponge facility are calculated, as shown in Table 4.
Table 4.
Carbon emissions per unit area of each LID facility over a 30-year life cycle (unit: kgCO2/m2).
Carbon emission accounting results are uncertain, and the carbon emissions per unit area of various LID facilities are different in different studies due to the differences in accounting facility types, facility structures, facility materials, facility lifetimes (ranging from 15 to 75 years, with most assuming a facility lifetime of 30 years), and accounting phases in different studies.
Junqi Li [30] reviewed the relevant research references and converted the results into units, and the results are shown in Table 5.
Table 5.
Carbon emissions per unit area of LID facilities.
The whole life cycle carbon emissions in the table do not include carbon sinks and direct carbon emissions. Comparing the accounting results of each sponge facility per unit area in this study, it can be seen that the accounting results of each sponge facility in each stage and the whole life cycle are within a reasonable range, even close to the average value, so the accounting results are correct and reliable.
4.2. Carbon Reduction Benefit Analysis
4.2.1. The Whole Life Cycle Carbon Emissions Analysis
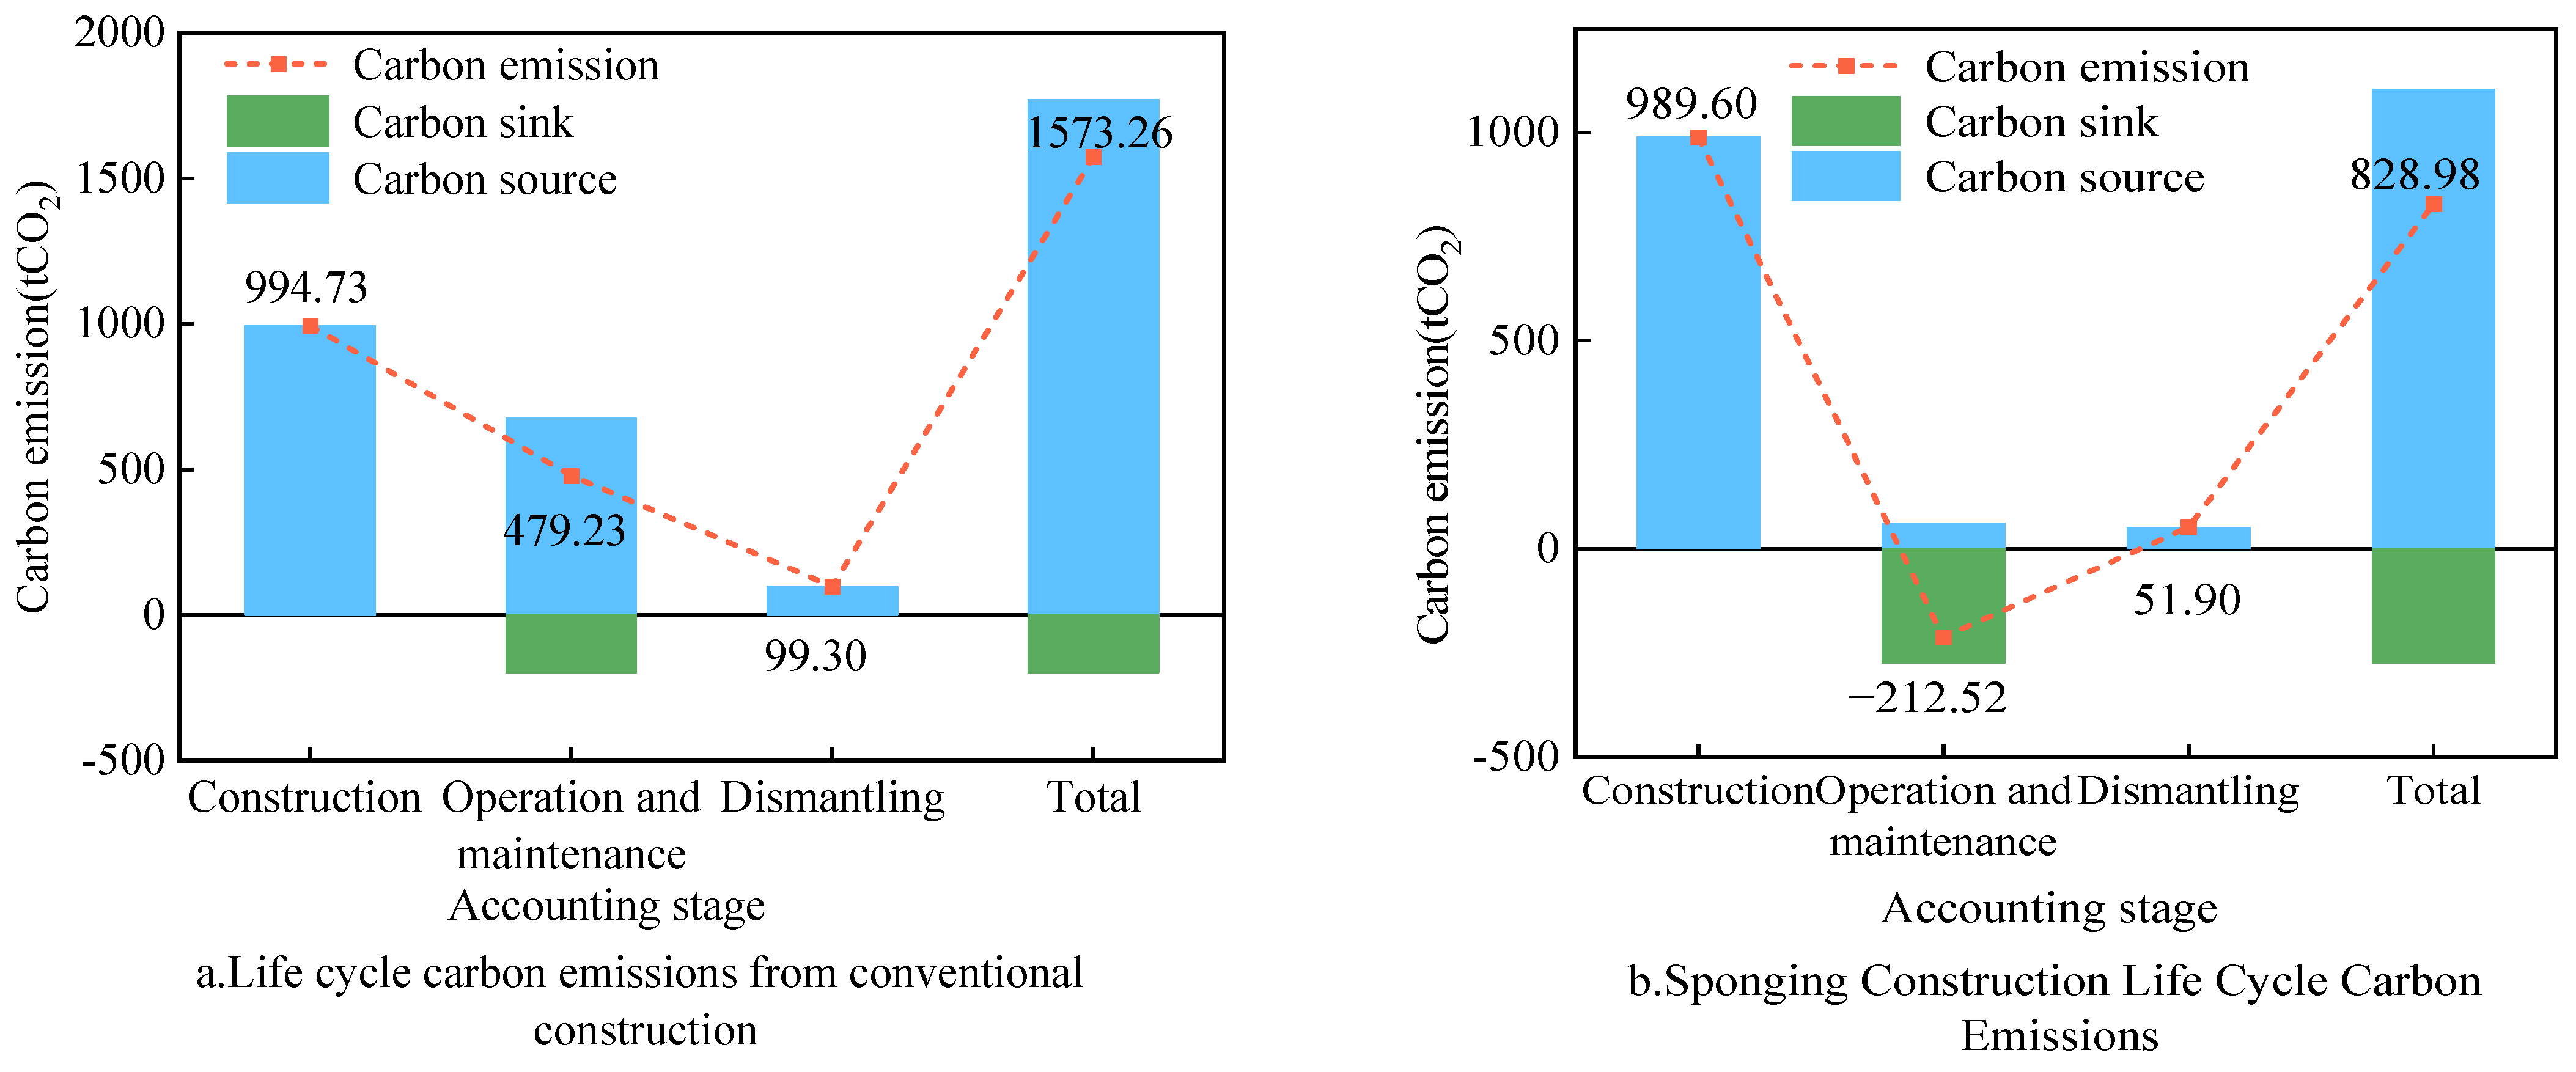
Figure 5 depicts the whole life cycle carbon emissions of traditional and sponge construction.

Figure 5.
Life cycle carbon emissions from traditional and sponge construction.
From the figure, it is evident that the carbon sink generated during the operation of traditional construction does not compensate for the carbon emissions, whereas the carbon sink generated during the operation of sponge construction exceeds the carbon emissions. This indicates that sponge construction has a superior carbon emission reduction effect compared to traditional construction.
The carbon sinks generated throughout the whole life cycle of both traditional and sponge construction do not entirely offset the carbon emissions. This is because the accounting limits the defined carbon sinks to the reductions in carbon dioxide generated through the LID facilities themselves. Other factors, such as building energy efficiency and pollutant reductions, are excluded from the accounting boundaries. Consequently, the net carbon emissions over the whole life cycle remain positive.
4.2.2. Study on the Benefits of Carbon Emission Reduction
Compared to traditional construction with ordinary impermeable paving, permeable pavements exhibit certain permeability, reduce surface runoff, and have a pollutant purification effect. The permeable bricks used in permeable pavements produce more carbon emissions than concrete bricks, and permeable concrete emits more carbon than C15 concrete. However, the sand used in permeable paving generates less carbon emissions than M10 cement mortar during material production. As a result, the carbon emissions from permeable paving are lower than those from ordinary impermeable paving during material production. Despite this, the weight of materials used in permeable paving is greater than that of ordinary paving, leading to higher carbon emissions during transport.
Bioretention facilities require more complex materials than conventional green spaces. These materials include planting soil, geotextiles, HDPE impermeable composite membranes, gravel, and PE pipes, all of which contribute to carbon emissions during production and transport. Consequently, bioretention facilities generate more carbon emissions in both the material production and transport stages compared to ordinary green spaces. Similarly, green roofs have more layers, including planting, filtration, and drainage layers, compared to ordinary roofs. This complexity results in higher carbon emissions during the material production and transport stages for green roofs, consistent with Liu’s findings.
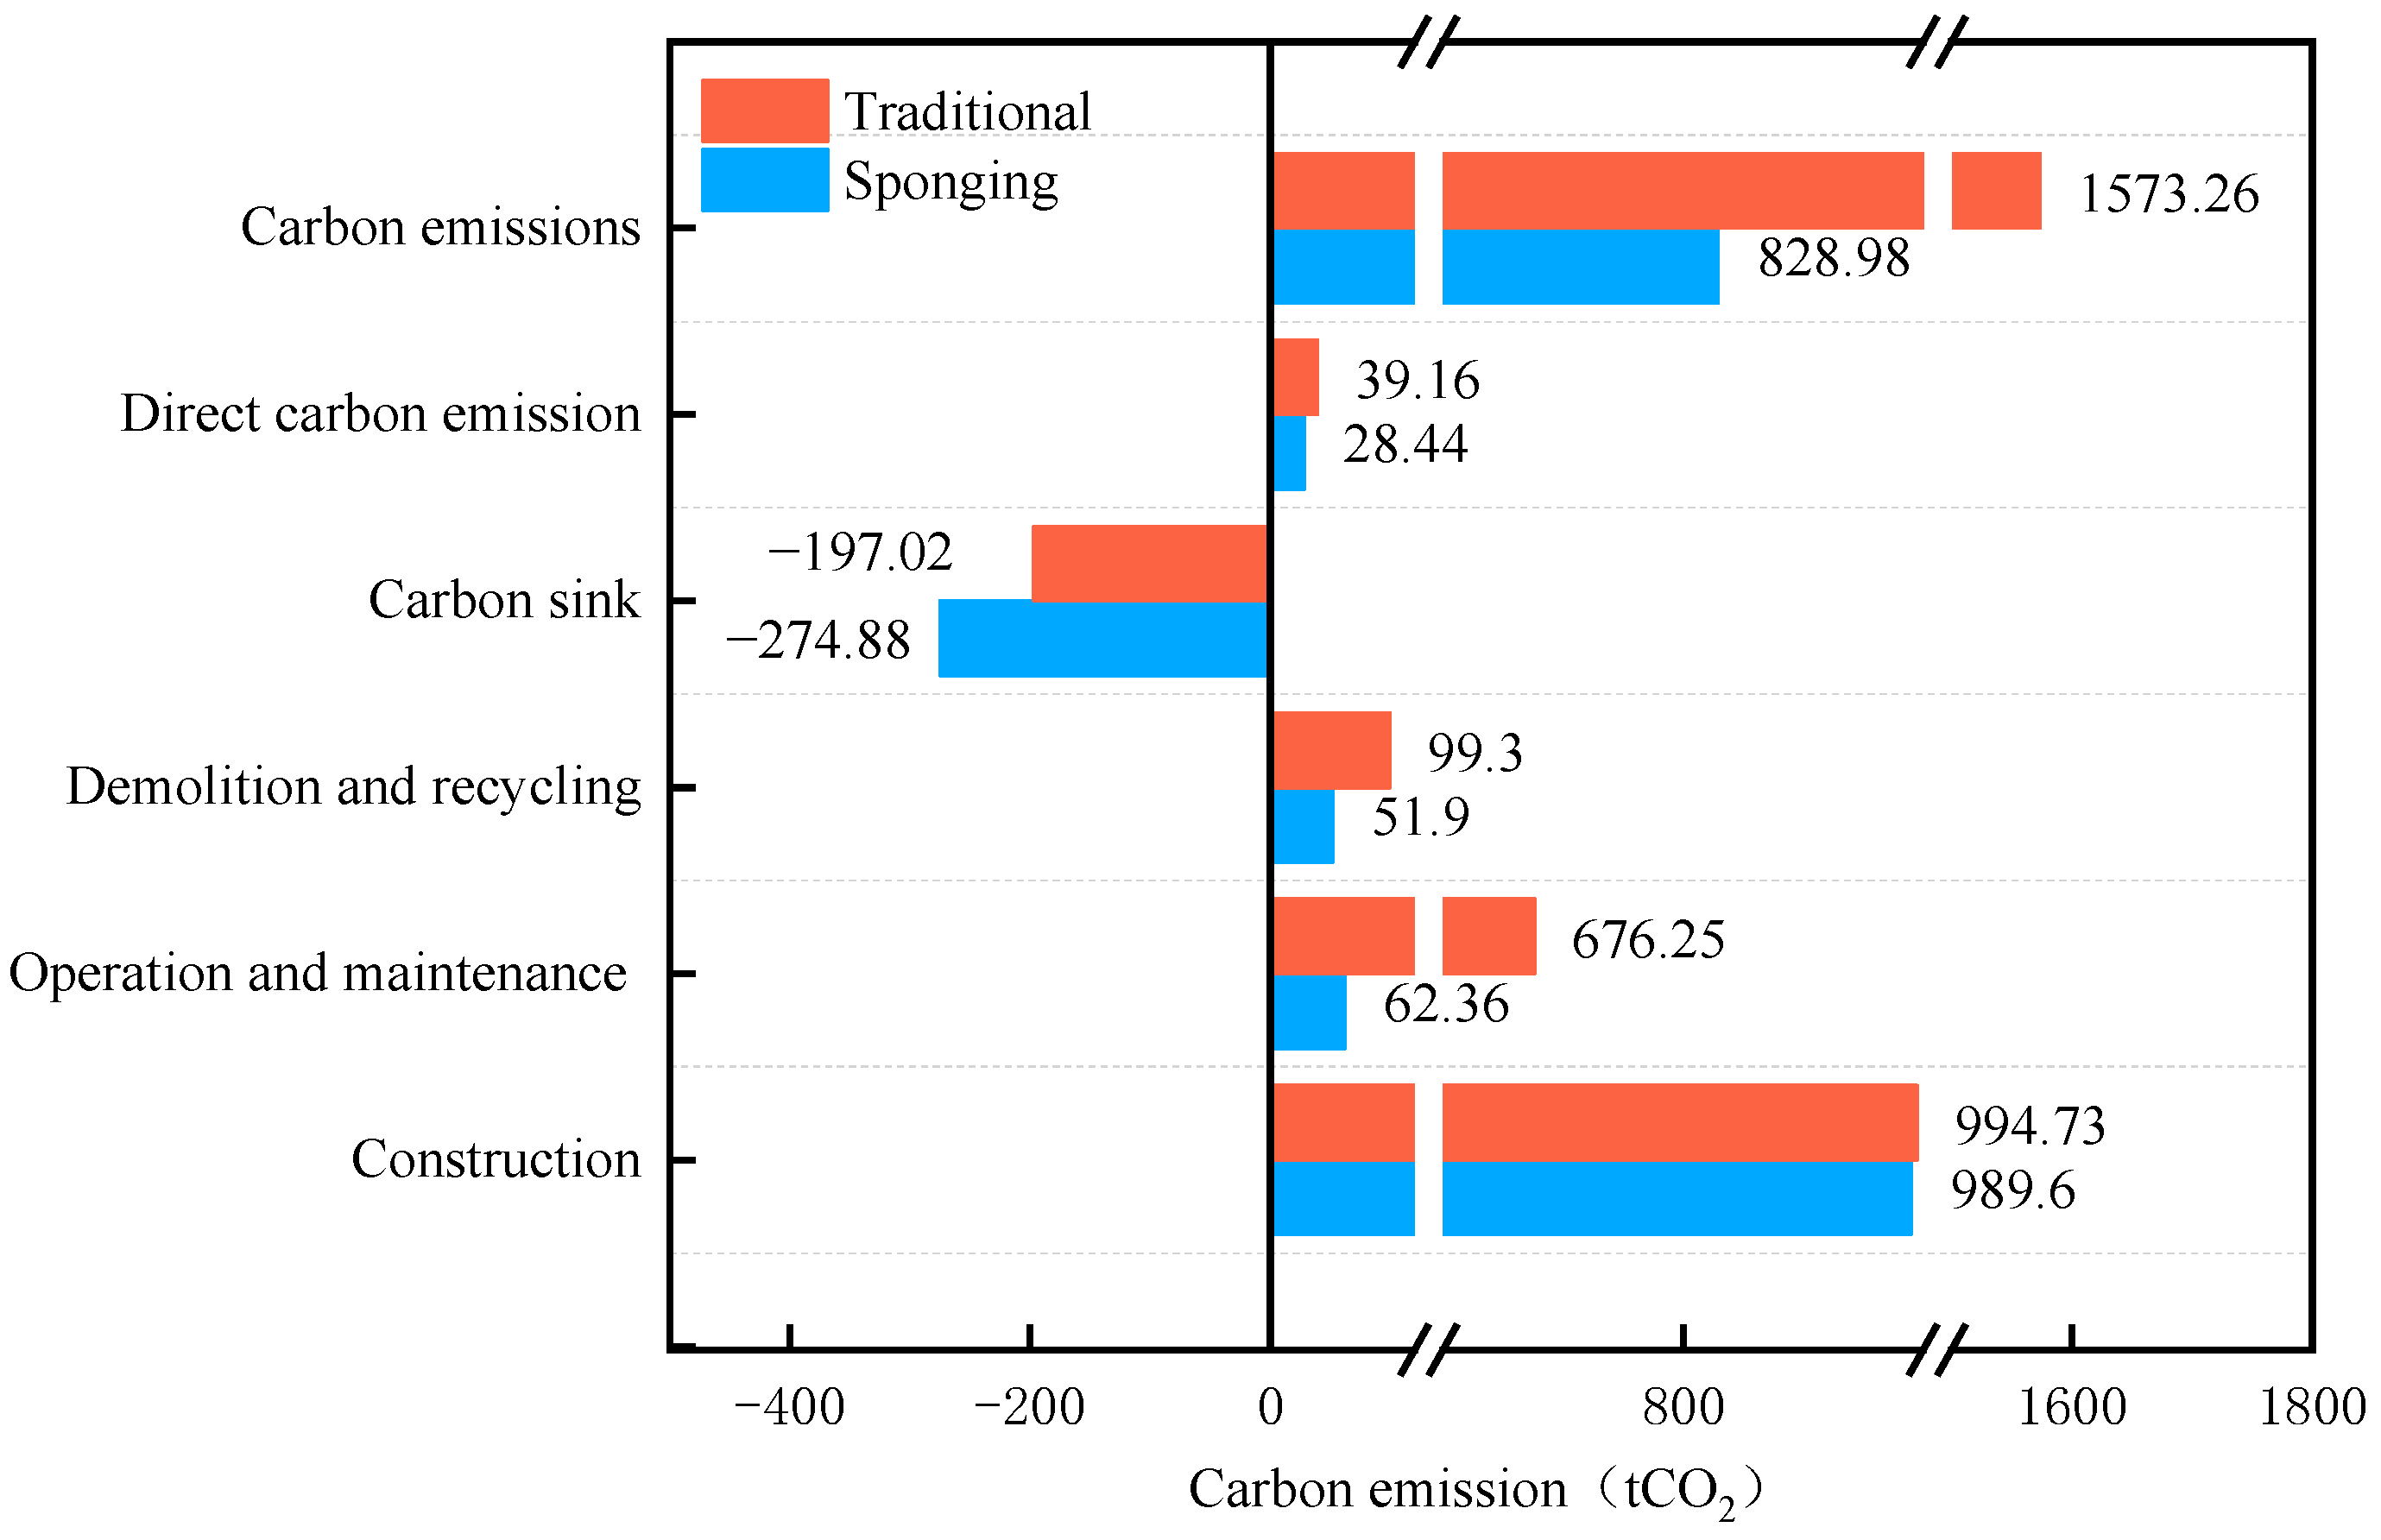
Figure 6 illustrates a comparison of carbon emissions at each stage of the whole life cycle between conventional and sponge construction.
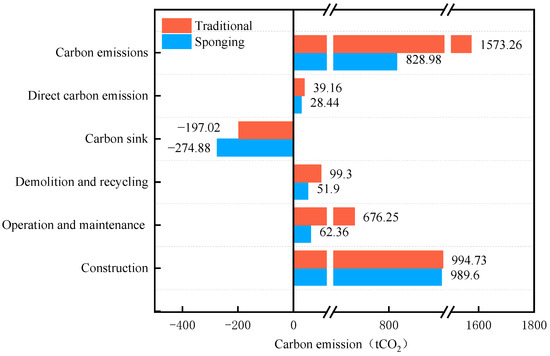
Figure 6.
A Comparison of whole life cycle carbon emissions between traditional and sponge city construction of new residential areas.
The carbon emission ranking for traditional construction, from highest to lowest, is as follows: material production > site maintenance > material transport > construction process > dismantling and recycling. For sponge construction, the ranking is as follows: material production > material transport > construction process > dismantling and recycling > operation and maintenance. This ranking for traditional construction contrasts with Zhao’s [14] conclusion that operation and maintenance generate more carbon emissions than material production. This discrepancy arises because the permeable pavement area in sponge construction is larger, leading to a corresponding larger area of ordinary impermeable pavement in traditional construction. The carbon emission factor for materials used in impermeable pavement is higher, resulting in greater emissions compared to maintenance activities.
In both sponge and traditional construction, material production during the construction phase contributes the most to carbon emissions, at 69.59% and 43.20%, respectively. When comparing the two construction modes, sponge construction plots show an average reduction of 47.31% in carbon emissions over the whole life cycle. This indicates that sponge construction positively impacts carbon emission reduction in plot construction.
4.3. Analysis of Carbon Reduction Effects
4.3.1. Calculation of Carbon Emission Reduction for Different Typical Years of Sponging Construction
Referring to Hu Fangxu’s [43] research method, the carbon reduction effect under different typical years was analyzed. Based on the typical annual rainfall data of abundant, flat, and dry water years, data on runoff reduction, rainwater recycling, and pollutant reduction of sponge facilities were obtained.
The annual carbon emission reduction of sponge facilities in the year of abundant water is 48.48 t (the carbon emission reduction of peak runoff reduction has been calculated in carbon emission accounting, so the annual carbon emission reduction is not included, and the same applies below). The carbon emission reduction from building energy savings is the largest, accounting for 45.60%, followed by rainwater purification, which accounts for 23.49%.
In a dry water year, the annual carbon emission reduction of sponge facilities is 36.37 t, mainly composed of building energy savings and green space carbon sequestration, accounting for 25.19% and 60.78%, respectively.
Comparing the typical annual carbon emission reductions in abundant, flat, and dry water years, there is a correlation between annual precipitation and carbon emission reduction in sponge cities. As annual precipitation increases, carbon emission reduction also increases. From the dry water year to the abundant water year, the annual precipitation increased by 575.9 mm, and the annual carbon emission reduction of the sponge city increased by 12.11 t.
4.3.2. Analysis of Carbon Emission Reduction Effect of Sponging
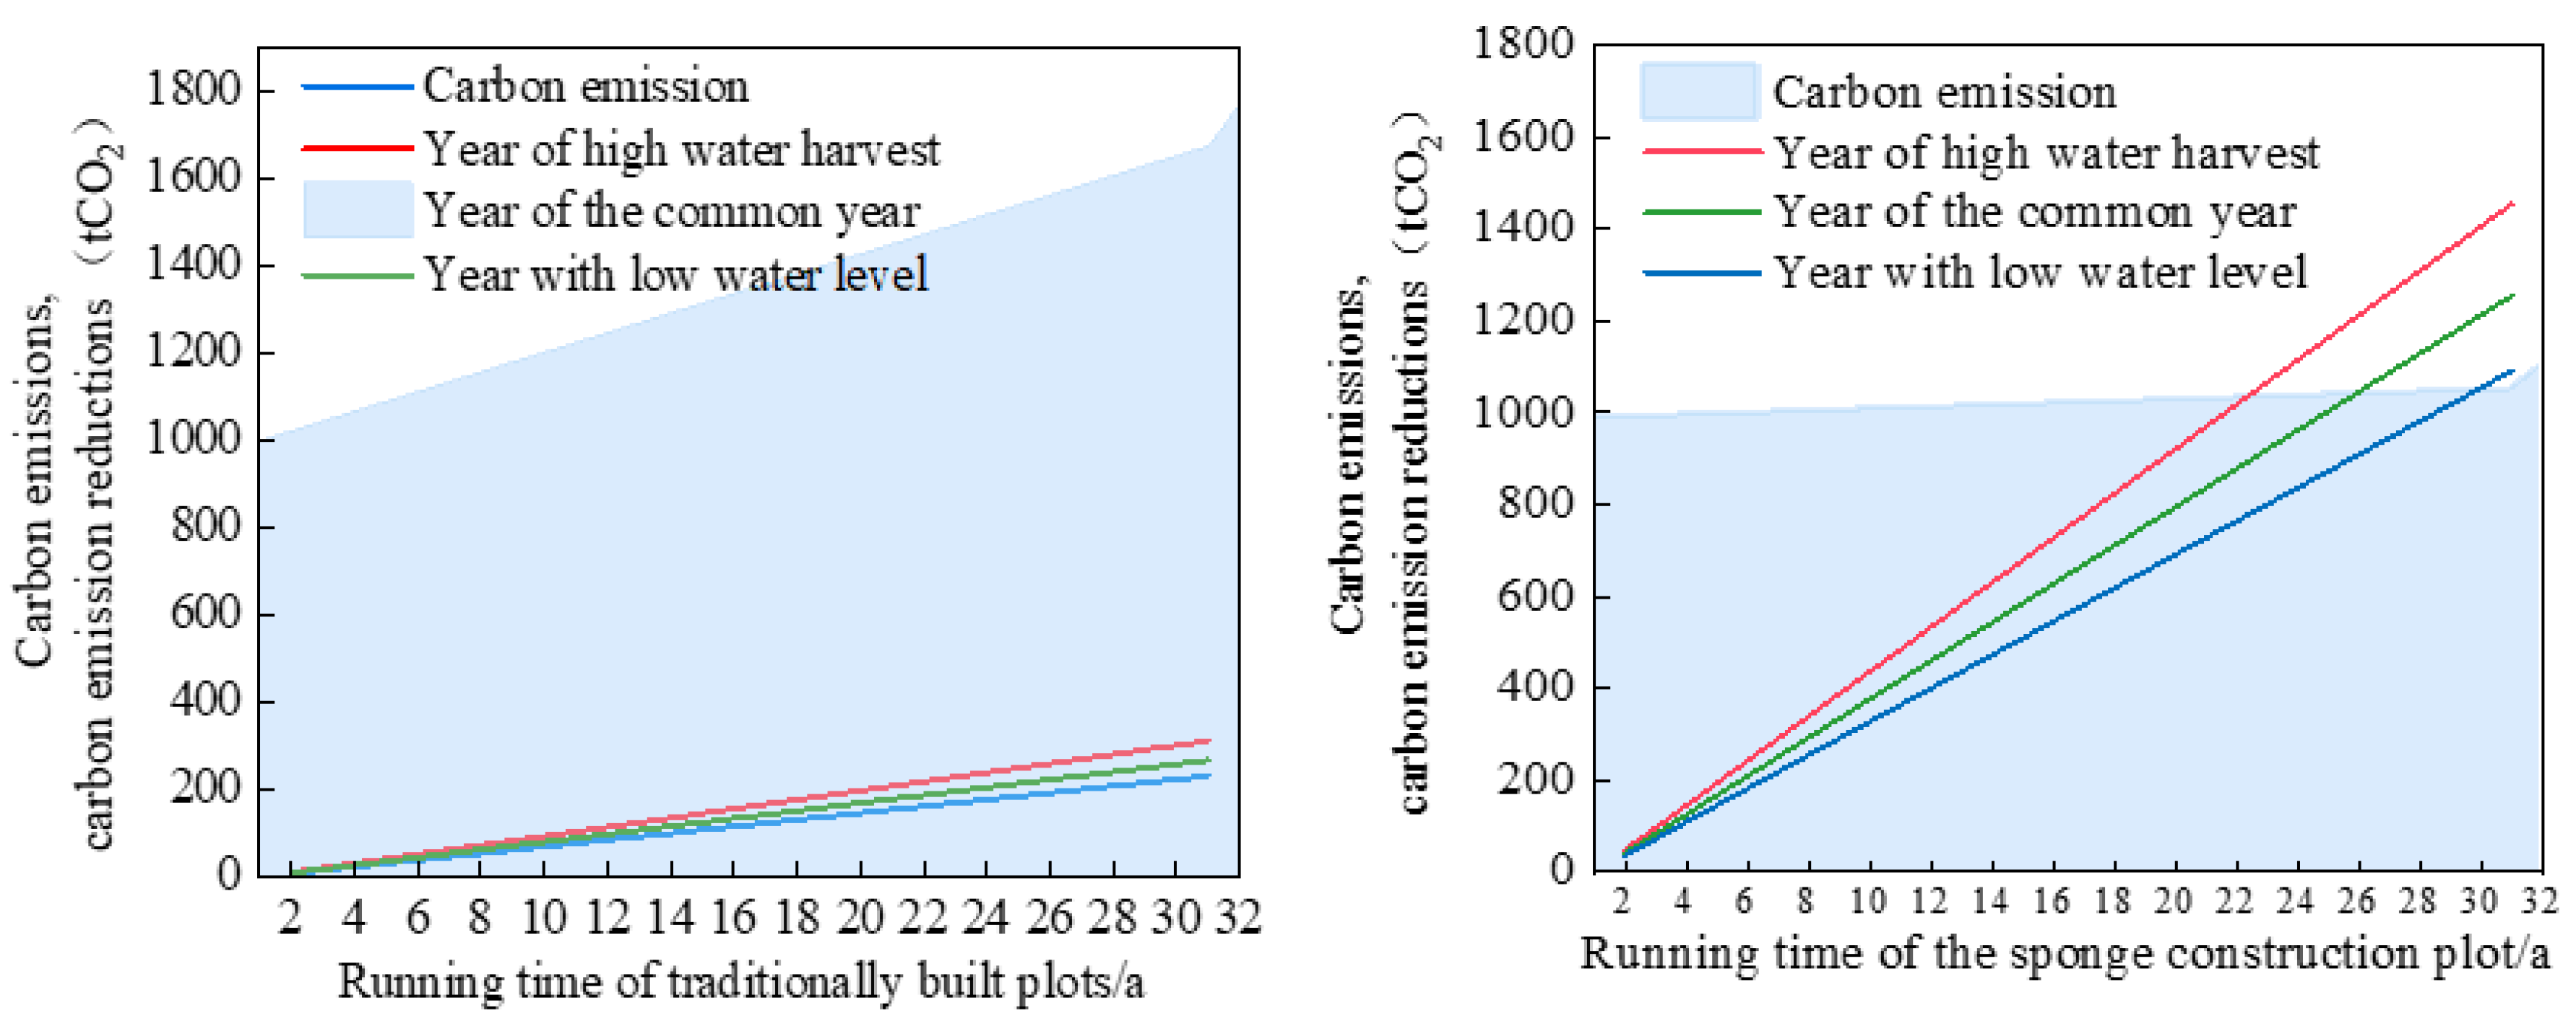
To reflect the impact of sponge facilities on district carbon emissions, a comparison of carbon emissions and the carbon emission reduction effect of sponge facilities over a 30-year life cycle is provided. The calculations are based on carbon emission reductions in the years of abundant, flat, and dry water, respectively, as shown in Figure 7.
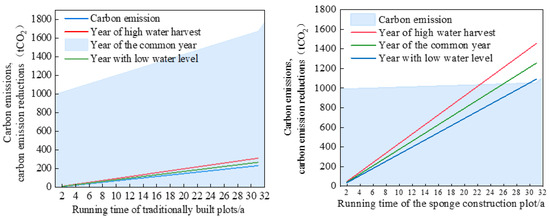
Figure 7.
Comparison of whole life cycle carbon emissions and carbon emission reductions between traditional and spongy construction of new subdivisions.
As seen in Figure 7, the carbon emission reduction over the whole life cycle of the sponge construction community in the typical years of abundant, flat, and dry water is greater than the carbon emission, indicating that carbon neutrality has been achieved, producing a positive carbon emission reduction effect. The carbon emission reduction effect of sponge construction plots in the typical year of abundant water, flat water, and dry water over the 30-year life cycle is 1454.27 t, 1254.52 t, and 1091.05 t, respectively. Sponge construction plots achieve carbon neutrality in 22 to 30 years. In contrast, the carbon emission reduction of traditionally constructed districts is much smaller than their carbon emissions, with the whole life cycle carbon emissions being significantly higher than those of sponge construction districts. Therefore, the sponge construction of the new district has a significant positive effect on building low-carbon cities.
4.3.3. Correlation Analysis between Carbon Reduction Effect and Annual Rainfall
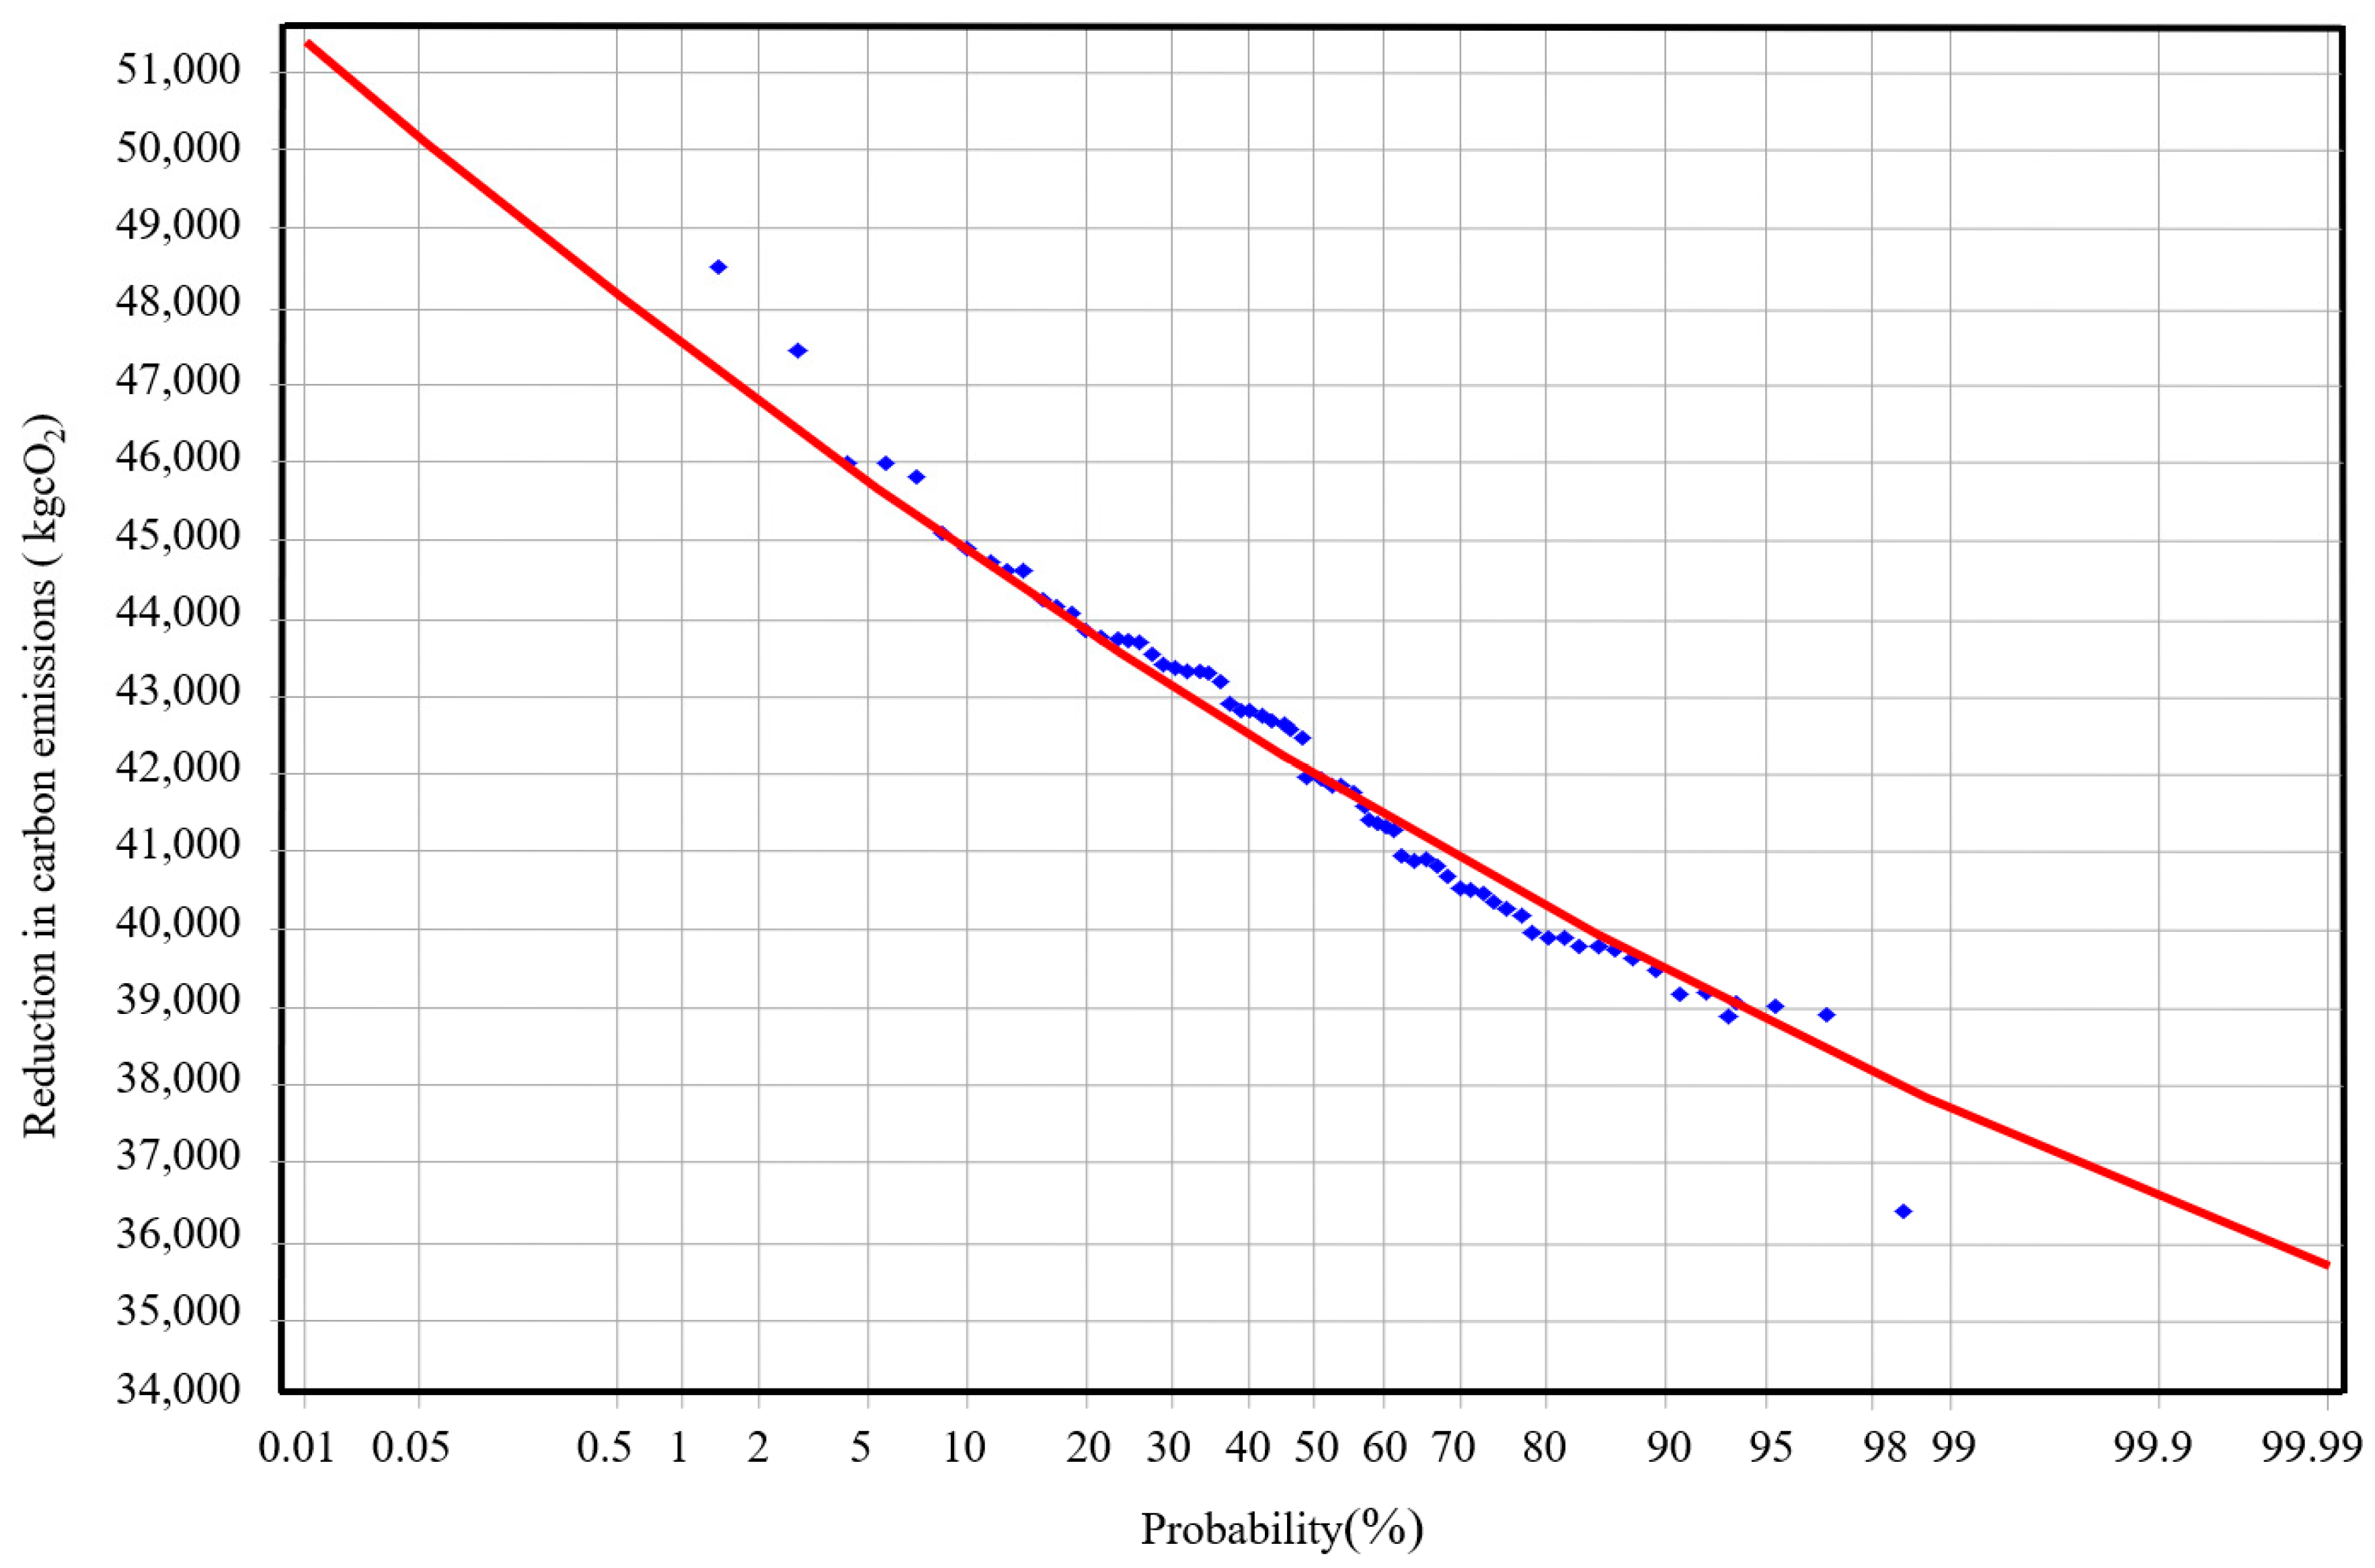
The annual rainfall data of Tianshui city from 1956 to 2022 were used as rainfall events and were substituted into the models for both sponge construction and traditional construction to obtain the carbon emission reduction of the sponge city under different annual precipitation conditions. A correlation analysis between the two was conducted. The results show a linear correlation between the carbon emission reduction of sponge construction in the district and the annual precipitation. The carbon emission reduction of the sponge city increases with the increase in annual precipitation. To explore the characteristics of carbon emission reduction distribution, the reductions in different years were sorted and fitted with a Pearson-III curve, as shown in Figure 8.
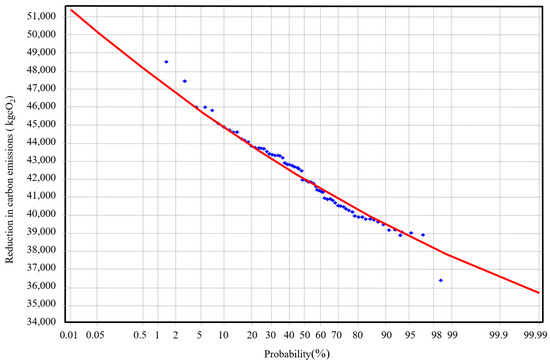
Figure 8.
Pearson type III distribution curve of carbon emission reduction from sponge construction.
The results of carbon emission reductions for the selected parameters and corresponding typical occurrence frequencies are shown in Table 6.
Table 6.
Selected parameters and corresponding CO2 emission reductions for typical occurrence frequencies.
The distribution of carbon emission reductions in sponge communities conforms to the Pearson-III distribution law, with a goodness of fit of 0.971. The mean value of carbon emission reductions in sponge communities is 42,140.90 kg, with a coefficient of variation (CV) of 0.05 and a coefficient of skewness (CS) of 0.32. The small coefficient of variation indicates that the density dispersion is small and the frequency distribution is more concentrated. The skewness coefficient, being greater than CS/CV of 6.40 and greater than 0, indicates a positively skewed distribution. Additionally, the mean value corresponds to a frequency of occurrence of 48.10%, which is consistent with the rainfall pattern in the study area. According to the inverse check of the curve, the carbon emission reduction corresponding to P = 50% is 42,028.70 kg, which is close to the carbon emission reduction of 41,817.46 kg in a flat water year.
4.3.4. Study on Carbon Emission Reduction Effect
The carbon emission reduction benefit of sponge construction compared to traditional construction is 744.28 tCO2. The annual carbon emission reduction effect of sponge construction is 32.90 tCO2 more than that of traditional construction. Over a 30-year life cycle, the total carbon emission reduction of sponge construction compared to traditional construction is 1731.28 tCO2. This reduction can offset the carbon emissions generated by other carbon-emitting activities, or its equivalent carbon sink.
After conversion, this amount of activity is equivalent to the amount of carbon dioxide released by burning 695 tons of standard coal, which is also comparable to consuming 1.74 million kWh of electricity, a car driving 9.61 million kilometers, the daily normal life of 229 people, the amount of carbon dioxide absorbed by 7905.4 square meters of green vegetation through photosynthesis daily, or the total amount of carbon dioxide absorbed by 33 trees in the same period of time. Among them, burning 1 kg of standard coal emits about 2.49 kgCO2, using 1 kWh of electricity emits about 0.99 kgCO2 [44], an ordinary car travelling 1 km emits about 0.18 kgCO2 [45], each person’s metabolism produces about 0.69 kgCO2 per day [46], the carbon sink of 1 m2 of green space is 0.02 kgCO2 per day, and a tree absorbs about 4.8 kgCO2 per day [47].
In conclusion, in countries like China that face challenges in urban water management and urgently need transformation to address water scarcity and environmental pollution, sponge cities demonstrate their unique dual advantages. On the one hand, as an innovative urban water management concept, sponge cities not only open new paths for sustainable water resource management, but they also exhibit significant advantages in urban carbon emission reduction. This paper focuses on the construction of a standardized model for carbon emission accounting in sponge cities. Through a scientific methodology, it meticulously differentiates and clearly explains previously ambiguous concepts, deeply revealing the specific processes and sources of carbon emissions associated with various sponge city facilities. This research provides scientific evidence for optimizing the design of sponge facilities and offers references for improving relevant management guidelines and standards, enabling urban water management to move towards a greener, low-carbon future.
5. Conclusions
Given the inconsistencies in the definitions of carbon sink, carbon reduction effects, and carbon reduction benefits in existing research on sponge city accounting systems, as well as differences in accounting content leading to significant variations in results and conclusions, this study constructs a life cycle carbon emission accounting model for sponge cities using a newly constructed residential area as a case study. It standardizes the accounting content for sponge cities, defines the concepts of carbon reduction benefits and carbon reduction effects, clarifies the relationship between carbon sequestration and carbon reduction effects, and uses the carbon emission factor method to detail the carbon emissions and reductions at each stage of sponge facilities. This model can be more scientifically used for the accounting and analysis of sponge city carbon emissions. The analysis shows that sponge construction provides a carbon reduction benefit of 744.28 tons CO2 over a 30-year life cycle compared to traditional construction, resulting in a 47.31% reduction in carbon emissions. Under traditional construction, M10 cement mortar has the highest carbon emissions, significantly impacting material production, transportation, and construction processes. In sponge construction, the LID facility with the greatest impact on carbon emissions is permeable pavement. Sponge construction can achieve a carbon reduction effect of 1460.31 tons CO2 over a 30-year life cycle, with building energy efficiency having the largest proportion of carbon reduction effects. In different typical annual rainfall scenarios, the carbon reduction amount from sponge construction exceeds the carbon emissions, achieving carbon neutrality between 22 and 30 years. Over a 30-year life cycle, sponge construction reduces carbon emissions by a total of 1731.28 tons of CO2 compared to traditional construction. The reduced carbon emissions can offset carbon emissions from other activities or correspond to an equivalent amount of carbon sequestration. Therefore, sponge construction in newly built residential areas demonstrates a strong carbon reduction effect. The analysis of carbon reduction effects in sponge areas shows a positive correlation with annual rainfall and follows the Pearson Type III distribution pattern, exploring the potential impact of climate change on the carbon reduction benefits of sponge cities.
Finally, the results of this study provide theoretical support for advancing the standardization and scientific development of sponge city carbon emission accounting systems, offering guidance and providing a reference for guiding urban water management towards a greener and more low-carbon direction.
The selection of carbon emission factors in this study was based on references from other industries and references. Future research can improve the accuracy of carbon accounting for sponge city projects by conducting specialized studies on carbon emission factors, developing comprehensive carbon emission databases, and establishing monitoring and intelligent control systems. Additionally, policies such as carbon trading systems and carbon taxes could be integrated into future carbon accounting frameworks to help achieve emission reduction goals and facilitate industrial restructuring.
Author Contributions
Y.M.: methodology, investigation. X.L.: conceptualization. J.L.: validation. M.L. and C.D.: format analysis. W.L.: date curation. L.C.: resources. D.W.: conceptualization. H.W.: visualization. T.Z.: writing—review and editing. B.W.: supervision. All authors have read and agreed to the published version of the manuscript.
Funding
This research was funded by the National Natural Science Foundations of China (52060014), Gansu Province Construction Science and Technology Project (JK2023-18, JK2024-21), and Guangdong Shouhui Lantian Engineering Technology Co., Ltd. Science and Technology Project (KY-2022-04).
Data Availability Statement
The raw data supporting the conclusions of this article will be made available by the authors on request.
Acknowledgments
The authors are grateful to the anonymous reviewers for their comments and suggestions which contributed to the further improvement of this paper.
Conflicts of Interest
Author Chengyin Du was employed by the company Guangdong Shouhui Lantian Engineering Technology Co., Ltd. The remaining authors declare that the research was conducted in the absence of any commercial or financial relationships that could be construed as a potential conflict of interest. The authors declare that they have no known competing financial interests or personal relationships that could have appeared to influence the work reported in this paper.
References
- Xu, C.; Lin, W.; Zhu, Y.; Zhang, B.; Wang, Z.; Jia, H. A macro-level life cycle environmental-economic impact and benefit assessment of sponge cities in China. Resour. Conserv. Recycl. 2024, 211, 107859. [Google Scholar] [CrossRef]
- Lawrence, A.; Marsalek, J.; Ellis, J.; Urbonas, B. Stormwater detention & BMPs. J. Hydraul. Res. 1996, 34, 799–813. [Google Scholar]
- Pugliese, F.; Gerundo, C.; De Paola, F.; Caroppi, G.; Giugni, M. Enhancing the urban resilience to flood risk through a decision support tool for the LID-BMPs optimal design. Water Resour. Manag. 2022, 36, 5633–5654. [Google Scholar] [CrossRef]
- Zhao, L.; Li, J.; Zhang, T.; Feng, P.; Wang, X.; Shen, J. Multi-method combined analysis of urban flood risks and its influencing factors under low impact development. J. Hydrol. 2024, 632, 130927. [Google Scholar] [CrossRef]
- Schulze, J.; Gehrmann, S.; Somvanshi, A.; Rudolph-Cleff, A. From District to City Scale: The Potential of Water-Sensitive Urban Design (WSUD). Water 2024, 16, 582. [Google Scholar] [CrossRef]
- Gimenez-Maranges, M.; Breuste, J.; Hof, A. Sustainable Drainage Systems for transitioning to sustainable urban flood management in the European Union: A review. J. Clean. Prod. 2020, 255, 120191. [Google Scholar] [CrossRef]
- Lim, H.S.; Lu, X.X. Sustainable urban stormwater management in the tropics: An evaluation of Singapore’s ABC Waters Program. J. Hydrol. 2016, 538, 842–862. [Google Scholar] [CrossRef]
- Xu, H.; Randall, M.; Fryd, O. Urban stormwater management at the meso-level: A review of trends, challenges and approaches. J. Environ. Manag. 2023, 331, 117255. [Google Scholar] [CrossRef]
- Griffiths, J.; Chan, F.K.S.; Shao, M.; Zhu, F.; Higgitt, D.L. Interpretation and application of Sponge City guidelines in China. Philos. Trans. R. Soc. A 2020, 378, 20190222. [Google Scholar] [CrossRef]
- Li, J.; Huang, X.; Chuai, X.; Yang, H. The impact of land urbanization on carbon dioxide emissions in the Yangtze River Delta, China: A multiscale perspective. Cities 2021, 116, 103275. [Google Scholar] [CrossRef]
- Su, X.; Shao, W.; Liu, J.; Jiang, Y.; Wang, J.; Yang, Z.; Wang, N. How does sponge city construction affect carbon emission from integrated urban drainage system? J. Clean. Prod. 2022, 363, 132595. [Google Scholar] [CrossRef]
- Pohl, J.; Hilty, L.M.; Finkbeiner, M. How LCA contributes to the environmental assessment of higher order effects of ICT application: A review of different approaches. J. Clean. Prod. 2019, 219, 698–712. [Google Scholar] [CrossRef]
- Wang, D.; Liu, X.; Li, H.; Chen, H.; Wang, X.; Li, W.; Cao, L.; Liu, J.; Zhang, T.; Wei, B. The Carbon Emission Intensity of Rainwater Bioretention Facilities. Water 2024, 16, 183. [Google Scholar] [CrossRef]
- Zhao, Z.; Liu, C.; Xie, H.; Li, Y.; Zhu, C.; Liu, M. Carbon Accounting and Carbon Emission Reduction Potential Analysis of Sponge Cities Based on Life Cycle Assessment. Water 2023, 15, 3565. [Google Scholar] [CrossRef]
- Lin, X.; Ren, J.; Xu, J.; Zheng, T.; Cheng, W.; Qiao, J.; Huang, J.; Li, G. Prediction of life cycle carbon emissions of sponge city projects: A case study in Shanghai, China. Sustainability 2018, 10, 3978. [Google Scholar] [CrossRef]
- Jiang, C.; Zhang, Y.; Zhang, X.; Han, Q.; Xiao, Y. Research on the carbon profit and loss correlation mechanism of sponge city construction life cycle in urban built up areas. Ecohydrol. Hydrobiol. 2024. [Google Scholar] [CrossRef]
- Wang, J.; Zhou, X.; Wang, S.; Chen, L.; Shen, Z. Simulation and comprehensive evaluation of the multidimensional environmental benefits of sponge cities. Water 2023, 15, 2590. [Google Scholar] [CrossRef]
- Kavehei, E.; Jenkins, G.; Adame, M.; Lemckert, C. Carbon sequestration potential for mitigating the carbon footprint of green stormwater infrastructure. Renew. Sustain. Energy Rev. 2018, 94, 1179–1191. [Google Scholar] [CrossRef]
- Zhao, Z.; Chen, J.; Han, S.; Ding, L.; Zhao, X.; Liu, X.; Deng, H. A Study on Plant Selection for Low-Carbon Rain Gardens Based on an AHP-TOPSIS Model. Sustainability 2024, 16, 2097. [Google Scholar] [CrossRef]
- Li, Q.; Zhu, Y.; Zhu, Z. Calculation and optimization of the carbon sink benefits of green space plants in residential areas: A case study of Suojin Village in Nanjing. Sustainability 2022, 15, 607. [Google Scholar] [CrossRef]
- Wang, Y.; Yang, Y.; Zhang, L.; Li, Q.; Chen, J. Annual carbon emission calculation and green technology exploration of the green campus based on comprehensive energy. J. Phys. Conf. Ser. 2024, 2826, 012006. [Google Scholar] [CrossRef]
- Association, C.U.W. Guidelines for Carbon Accounting and EmissionReduction in the Urban Water Sector; China Architecture & Building Press: Beijing, China, 2022; Volume 202. [Google Scholar]
- Peng, Y.; Wang, Y.; Chen, H.; Wang, L.; Luo, B.; Tong, H.; Zou, Y.; Lei, Z.; Chen, S. Carbon reduction potential of a rain garden: A cradle-to-grave life cycle carbon footprint assessment. J. Clean. Prod. 2024, 434, 139806. [Google Scholar] [CrossRef]
- Wei, Y.; Cao, X.; Li, J.; Chang, Y. Greenhouse gas, water, and economic implications of permeable pavements: Quantification for pilot sponge cities in China. J. Clean. Prod. 2024, 471, 143424. [Google Scholar] [CrossRef]
- Cai, Y.; Zhao, Y.; Wei, T.; Fu, W.; Tang, C.; Yuan, Y.; Yin, Q.; Wang, C. Utilization of constructed wetland technology in China’s sponge city scheme under carbon neutral vision. J. Water Process Eng. 2023, 53, 103828. [Google Scholar] [CrossRef]
- Lu, Y.; Zhou, Y.; Zeng, S. Understanding the link between industrial stimulation effect and environmental impact of sponge city: With a focus on the construction phase. J. Clean. Prod. 2023, 389, 136113. [Google Scholar] [CrossRef]
- Jato-Espino, D.; Toro-Huertas, E.I.; Güereca, L.P. Lifecycle sustainability assessment for the comparison of traditional and sustainable drainage systems. Sci. Total Environ. 2022, 817, 152959. [Google Scholar] [CrossRef]
- Dong, X.; Yi, W.; Yuan, P.; Song, Y. Optimization and trade-off framework for coupled green-grey infrastructure considering environmental performance. J. Environ. Manag. 2023, 329, 117041. [Google Scholar] [CrossRef]
- She, L.; Wei, M.; You, X.-y. Multi-objective layout optimization for sponge city by annealing algorithm and its environmental benefits analysis. Sustain. Cities Soc. 2021, 66, 102706. [Google Scholar] [CrossRef]
- Li, J.; Wang, H.; Li, H. Research progress of carbon emission accounting for urban stormwater systems based on content analysis method. Water Conserv. 2024, 40, 33–43. (In Chinese) [Google Scholar]
- Dos Santos, M.F.N.; Barbassa, A.P.; Vasconcelos, A.F.; Ometto, A.R. Stormwater management for highly urbanized areas in the tropics: Life cycle assessment of low impact development practices. J. Hydrol. 2021, 598, 126409. [Google Scholar] [CrossRef]
- Bledsoe, R.B.; Bean, E.Z.; Austin, S.S.; Peralta, A.L. A microbial perspective on balancing trade-offs in ecosystem functions in a constructed stormwater wetland. Ecol. Eng. 2020, 158, 106000. [Google Scholar] [CrossRef]
- Fan, L.; Wang, J.; Liu, X.; Luo, H.; Zhang, K.; Fu, X.; Li, M.; Li, X.; Jiang, B.; Chen, J. Whether the carbon emission from green roofs can be effectively mitigated by recycling waste building material as green roof substrate during five-year operation? Environ. Sci. Pollut. Res. 2020, 27, 40893–40906. [Google Scholar] [CrossRef]
- Teng, Y.; Li, C.Z.; Shen, G.Q.; Yang, Q.; Peng, Z. The impact of life cycle assessment database selection on embodied carbon estimation of buildings. Build. Environ. 2023, 243, 110648. [Google Scholar] [CrossRef]
- Liu, J.; Chen, Z.; Wu, L.; She, N. Study on Carbon Reduction Capacity of Sponge City Facilities. In ICCREM 2022; ASCE: Preston, VA, USA, 2022; pp. 37–46. [Google Scholar]
- Ma, J. Carbon Source Analysis and Carbon Emission Study of Typical Measures for Sponge City Construction. Master’s Thesis, Shanxi Agricultural University, Jinzhong, China, 2018. (In Chinese). [Google Scholar]
- Lu, L. Life Cycle Assessment of Two Typical Low Impact Development Technology. Master’s Thesis, Beijing University of Civil Engineering and Architecture, Beijing, China, 2013. (In Chinese). [Google Scholar]
- Zhu, Y.; Shao, W.; Yang, Z. Carbon emission accounting for whole life cycle of sponge facilities. Water Conserv. 2023, 39, 32–38. (In Chinese) [Google Scholar]
- Zheng, T. Estimation of carbon emission during sponge city recoSnstruction of residential community. China Water Wastewater 2021, 37, 112–119. (In Chinese) [Google Scholar]
- Jia, Y. Study on Low Impact Development Technology Allocation Optimization and Carbon Emission Reduction in Sponge City Construction. Master’s Thesis, Tianjin University, Tianjin, China, 2017. (In Chinese). [Google Scholar]
- Li, J.; Zhang, X.; Li, H. Study on carbon emission accounting in construction and operation of a sponge city in Beijing. Water Resour. Prot. 2023, 39, 86–93. (In Chinese) [Google Scholar]
- Wang, Y.; Li, H.; Abdelhady, A.; Harvey, J. Initial evaluation methodology and case studies for life cycle impact of permeability of permeable pavements. Int. J. Transp. Sci. Technol. 2018, 7, 169–178. [Google Scholar] [CrossRef]
- Hu, F.L.Y.; Zhou, X.; Li, Y.; Yu, L.; Zhang, S. Assessment of Carbon Emission Reduction Benefits of Sponge City Construction in Typical Old District. China Water Supply Drain. 2024, 40, 130–136. (In Chinese) [Google Scholar]
- Zhai, M.; Huang, D.; She, X. China’s Energy Development from the BP Statistical Yearbook of World Energy. Energy Environ. 2014, 6, 16–17. (In Chinese) [Google Scholar]
- Tian, P.C.S.; Mao, B.; Zhou, Q.; Huang, J.; Tong, R. Impact of new energy vehicles on carbon emissions of private cars in China. J. Chang. Univ. (Nat. Sci. Ed.) 2023, 43, 88–98. (In Chinese) [Google Scholar]
- Li, M.; Bekö, G.; Zannoni, N.; Pugliese, G.; Carrito, M.; Cera, N.; Moura, C.; Wargocki, P.; Vasconcelos, P.; Nobre, P. Human metabolic emissions of carbon dioxide and methane and their implications for carbon emissions. Sci. Total Environ. 2022, 833, 155241. [Google Scholar] [CrossRef] [PubMed]
- Guo, Y.; Ren, Z.; Wang, C.; Zhang, P.; Ma, Z.; Hong, S.; Hong, W.; He, X. Spatiotemporal patterns of urban forest carbon sequestration capacity: Implications for urban CO2 emission mitigation during China’s rapid urbanization. Sci. Total Environ. 2024, 912, 168781. [Google Scholar] [CrossRef] [PubMed]


Disclaimer/Publisher’s Note: The statements, opinions and data contained in all publications are solely those of the individual author(s) and contributor(s) and not of MDPI and/or the editor(s). MDPI and/or the editor(s) disclaim responsibility for any injury to people or property resulting from any ideas, methods, instructions or products referred to in the content. |
© 2024 by the authors. Licensee MDPI, Basel, Switzerland. This article is an open access article distributed under the terms and conditions of the Creative Commons Attribution (CC BY) license (https://creativecommons.org/licenses/by/4.0/).