Article

Green Analytical Method for Perfluorocarboxylic Acids (PFCAs) in Water of Stir Bar Sorptive Extraction Coupled with Thermal Desorption–Gas Chromatography—Mass Spectroscopy

by
Ahsan Habib
,
Elizabeth Noriega Landa
,
Kiana L. Holbrook
,
Angelica A. Chacon
and
Wen-Yee Lee
*
Department of Chemistry and Biochemistry, The University of Texas at El Paso, 500 W. University Ave., El Paso, TX 79968, USA
*
Author to whom correspondence should be addressed.
Water 2024, 16(17), 2543; https://doi.org/10.3390/w16172543 (registering DOI)
Submission received: 16 August 2024 / Revised: 29 August 2024 / Accepted: 5 September 2024 / Published: 8 September 2024

Abstract

:
Perfluoroalkyl carboxylic acids (PFCAs) are a significant group of per- and polyfluoroalkyl substances (PFASs). They are persistent organic chemicals manufactured for their resistance to heat, water, and stains. PFCAs are ubiquitous in the environment, particularly in surface water and wastewater, because they are widely used in everyday consumer products. This contamination poses a risk to drinking water supplies and human health, necessitating sensitive and effective analytical methods. Traditional liquid chromatography–tandem mass spectrometry (LC-MS/MS) is commonly used but involves complex sample handling and high costs. In this study, we developed an enhanced stir bar sorptive extraction (SBSE) method coupled with thermal desorption–gas chromatography–mass spectrometry (TD-GC-MS) for the analysis of PFCAs in water. This method demonstrates linearity, with R2 values from 0.9892 to 0.9988, and low limits of detection (LOD) between 21.17 ng/L and 73.96 ng/L. Recovery rates varied from 47 to 97%, suggesting efficient extraction. Compared to traditional methods, the developed SBSE technique requires only a 1 mL sample volume and minimal amounts of solvents, enhancing eco-friendliness and reducing potential contamination and handling errors. This method also demonstrated good precision and robustness across various water matrices. Overall, the developed method offers a precise, eco-friendly, and reliable approach for analyzing PFCAs in diverse water samples.

1. Introduction

Per- and polyfluoroalkyl substances, commonly known as PFASs, encompass a vast group of over 4700 synthetic compounds characterized by their multiple fluorine atoms [1]. They are well known for their water- and oil-repellant properties and their thermal stability; however, their environmental mobility, resistance to biochemical degradation, bioaccumulative effects, and toxicity are causing increasing concerns [2]. PFASs can be found in common consumer products like non-stick cookware, clothing, leather, upholstery, carpets, etc. [3,4,5]. They can also be used in fire-fighting foams and in industrial applications such as wetting agents, additives, coatings, emulsifiers, paints, waxes, and polishes [4,6,7,8]. Their useful properties are a result of their structure, which includes a fluorinated carbon chain that is both hydrophobic and oleophobic, and hydrophilic charged functional groups (such as carboxylic or sulfonic acid) attached to the structure [4,9]. Among the PFAS compounds, perfluorocarboxylic acids (PFCAs) have garnered attention due to their ubiquitous presence and persistence in the environment, especially in water matrices [10,11]. A PFCA compound is expressed as CnF(2n+1)-COOH, where CnF(2n+1) represents the per-fluoroalkyl portion of the molecular structure [4,12]. PFCAs predominantly exist in water environments owing to their low pKa values, making them more soluble [13]. Human exposure to PFCAs primarily occurs through consumption, including food and water intake, particularly near heavily contaminated locations [14,15]. Recent studies suggest that exposure to elevated levels of PFCAs is associated with a range of adverse health outcomes, including reproductive and developmental problems, liver and kidney damage, immunological effects, and disturbances in thyroid function and overall immune system health [2,12,16,17,18]. In the past few years, research has increasingly revealed that PFASs are found in a wide range of aquatic environments worldwide. Specifically, the presence of PFCAs has been confirmed in a variety of sources. These substances have been detected in surface waters [19,20,21], underground aquifers [22,23], oceans [24,25], precipitation [26], and even in the water we consume from faucets [27,28,29] and in bottled form [30]. Furthermore, they have been identified in water entering and exiting wastewater treatment plants, showcasing their widespread distribution in both natural and treated water systems. Wastewater treatment plants (WWTPs) are known to accept industrial, household, and commercial waste streams. Due to their common uses in regular consumer products, PFCAs are being found in most wastewater systems globally [31,32]. The concentrations of PFCAs in wastewater have been reported to range from a not-detected level to 143 µg/L (ppb) [33]. As wastewater treatment processes are not designed to remove PFCAs, these compounds were found in wastewater effluents in amounts ranging from <0.13 to 6.67 ng/L. The US Environmental Protection Agency (EPA) has recognized the severity of this issue and has established interim updated minimum reporting levels as low as 4 parts per trillion (ppt) for PFOA [34]. Thus, sensitive and effective analytical methods are needed for monitoring water quality.
Numerous methods for analyzing PFCAs in aqueous environments have been established [35,36]. A variety of chromatographic techniques such as liquid chromatography (LC), gas chromatography (GC), high-performance liquid chromatography (HPLC), and ultra-high-performance liquid chromatography (UHPLC) are frequently used for the determination of PFCAs in water matrices [37,38,39,40,41]. Less commonly used methods include nuclear magnetic resonance, Fourier transform infrared spectroscopy, ion chromatography, and several sensor-based methods [42,43,44,45]. Moreover, methods such as the total oxidizable precursor assay have determined that a significant fraction of the total PFCAs present in environmental samples consists of unidentified compounds [46,47]. The gold standard for PFCA analysis has been liquid chromatography coupled with tandem mass spectrometry (LC-MS/MS) [43]. US EPA has developed and validated a series of methods (EPA Method 533, 537.1, 8327) for PFAS using LC-MS/MS with sample preparation using solid-phase extraction [44,48]. Despite these advancements, the most common methods, centered around LC, are not without their challenges. Yamashita et al. [49] reported background contamination issues in PFAS monitoring. Specific attention should be paid to auto-sampler vial caps made of Teflon or fluoropolymers, fluoropolymer tubing, solvent inlet filters, and a variety of other laboratory products containing teflon and perfluoroalkoxy compounds, as they are sources of background PFASs. A well-known problem in electrospray ionization (ESI), which is commonly used in LC-MS, is ion suppression [50]. Moreover, while LC methods are invaluable for PFCA detection, they require sophisticated and costly instrumentation, and the analytical process can be time-consuming and labor-intensive. This underscores the need for alternative analytical techniques to enhance our ability to monitor PFCAs efficiently and effectively. As an alternative, gas chromatography (GC) is a convenient instrument for volatile and semi-volatile PFAS analysis (i.e., fluorotelomer alcohols, FTOH; perfluorinated sulfonamido ethanols, FASE) [37,50,51]. Thermal desorption (TD) is often paired with gas chromatography–mass spectrometry (GC-MS). The TD-GC-MS method reduces sample handling, which lowers the risk of contamination and analyte loss, making the analysis more sensitive [14,52]. In order to decrease the polarity and increase the volatility of PFCAs, a derivatization process is often performed. There are several studies that have been conducted on PFCA derivatization prior to GC-MS analysis [13,37,50,53,54,55]. Gołebiowski et al. applied 2,4 difluoroaniline for derivatization in the presence of N, N′-dicyclohexylcarbodiimide (DCC) [56]. However, this method consists of several sample preparation steps: pH adjustment, phase separation, and washing the organic phase with HCl, NaHCO3, and NaCl solution. Dufkova et al. developed a fast derivatization procedure for PFCAs by using isobutyl chloroformate to quantify PFASs in water [53]. Strozynska et al. developed two derivatization processes using triethylsilanol and N,N-Dimethylformamide dimethylacetal for the separation of PFCAs through GC-MS [57]. Overall, due to rapid and simple derivatization steps, isobutyl chloroformate-based derivatization appeared to be commonly used for the determination of PFAS in water by GC-MS.
In the analysis of PFCAs in water, solid-phase extraction (SPE) is the conventional choice for concentrating and purifying samples before LC-MS/MS analysis, owing to its widespread application [50,58]. However, liquid–liquid extraction (LLE), despite its potential, is less favored due to its limited potential for automation. As the scientific community shifts towards sustainable practices, traditional sample preparation techniques, which rely heavily on harmful solvents, are becoming less attractive, especially for analyzing multiple residues of PFCAs in aqueous samples [59]. The application of SPE in PFCA analysis, while established, can sometimes be labor-intensive and less effective, with potential pitfalls such as incomplete removal of matrix components, inconsistent recovery rates, and issues with processing large volumes of water samples when targeting ultra-trace level contaminants [60]. In recent years, microextraction techniques have emerged as a modern alternative to traditional extraction methods such as liquid–liquid extraction (LLE) and solid-phase extraction (SPE). Alzaga et al. [61] and Monteleone at. el. [62] successfully applied solid-phase microextraction (SPME) to determine multiple PFCAs in water matrices. Typically, SPME requires less solvent and is designed to be more sensitive, more selective, and are generally easier and safer to operate. Dispersive liquid–liquid microextraction (DLLME) has been employed by researchers such as Liu et al. [3] and Hu et al. [54] as an extraction technique specifically for extracting PFCAs from aqueous environments. Similar to SPME, Baltussen et al. (1999) first introduced stir bar sorptive extraction (SBSE) as an effective technique for screening organic micro-pollutants in water samples [63]. SBSE is well known for its environmentally friendly approach and low operational costs, excels in handling large volumes of samples with minimal labor, and seamlessly fits into the standard of green chemistry [51,64,65]. It stands out for its ability to take a higher absorbent volume compared to SPME, amplifying sensitivity by an order of magnitude and facilitating the detection of compounds at sub-ng/L concentrations [51,63,66]. SBSE has robust adsorption capacity and high extraction efficiency, but there are limited explorations of its applications in extracting PFCAs for subsequent thermal desorption–gas chromatography–mass spectrometry (TD-GC-MS) analysis. Previous studies have utilized SBSE for perfluoroalkyl acid extraction, coupled with liquid chromatography–tandem mass spectrometry (LC-MS/MS) for analysis [67,68,69,70]. However, SBSE coupled with GC-MS is yet to be developed.
This study aimed to develop and validate a simple, sensitive, and efficient method by integrating green chemistry-based stir bar sorptive extraction (SBSE) with thermal desorption–gas chromatography–mass spectrometry (TD-GC-MS) specifically for the analysis of perfluorocarboxylic acids (PFCAs), a significant subgroup of PFAS. The novelty of this research lies in its solvent-free approach, which reduces environmental impact and costs while enhancing the sensitivity and accuracy of PFCA detection by minimizing potential contamination and analyte loss. Unlike traditional methods such as LC-MS/MS, which often require complex, labor-intensive, and costly procedures, our SBSE-TD-GC-MS method offers a more efficient, cost-effective, and environmentally friendly alternative. This method was applied to analyze water samples from various sources, including tap water and influents and effluents from local municipal wastewater treatment facilities. To the best of our knowledge, this is the first study to combine SBSE with TD-GC-M for PFCA extraction followed by solvent-free desorption using a thermal desorption unit prior to GC-MS analysis. These aspects not only fill a significant gap in the existing literature but also present a valuable alternative method for PFAS analysis in water matrices.

2. Materials and Methods

2.1. Standards and Reagents

The analytical standard of PFCAs, listed in Table 1, was purchased from Fisher Scientific (Fair Lawn, NJ, USA), and standard stock solutions of 1000 µg/mL of PFCA were prepared in acetonitrile. Isobutyl chloroformate (98%), pyridine (99%), and isobutyl alcohol were supplied by Fisher Scientific, USA. HPLC-grade methanol, hexane, and acetonitrile were purchased from J.T.Baker® (Radnor, PA, USA). Mirex (99.0%, Dr. Ehrenstorfer GmbH, Augsburg, Germany) was used as the internal standard and 1000 µg/mL and 10 µg/mL Mirex stock solutions were prepared in acetonitrile. Deionized (DI) water, purchased from J.T.Baker®, USA, was used in the dilutions and sample preparations.

2.2. Sample Collection

In this study, wastewater samples were obtained from El Paso Water in El Paso, Texas, USA in September 2023. Both wastewater influent and effluent samples were taken from four municipal wastewater treatment plants, denoted as WWTP-1, WWTP-2, WWTP-3, and WWTP-4. The samples were collected in 500 mL polypropylene bottles, ensuring no headspace remained, and were then promptly stored at 4 °C. Upon their arrival at the analytical laboratory, wastewater samples were centrifuged using Sorvall Legend X1R (Thermo Scientific, Waltham, MA, USA) at 4000 rpm and 4 °C. The resulting supernatant was separated and stored at the same temperature. All samples were analyzed for PFCAs within 7 days from their collection. Additionally, tap water samples were procured directly from our laboratory for comparative analysis.

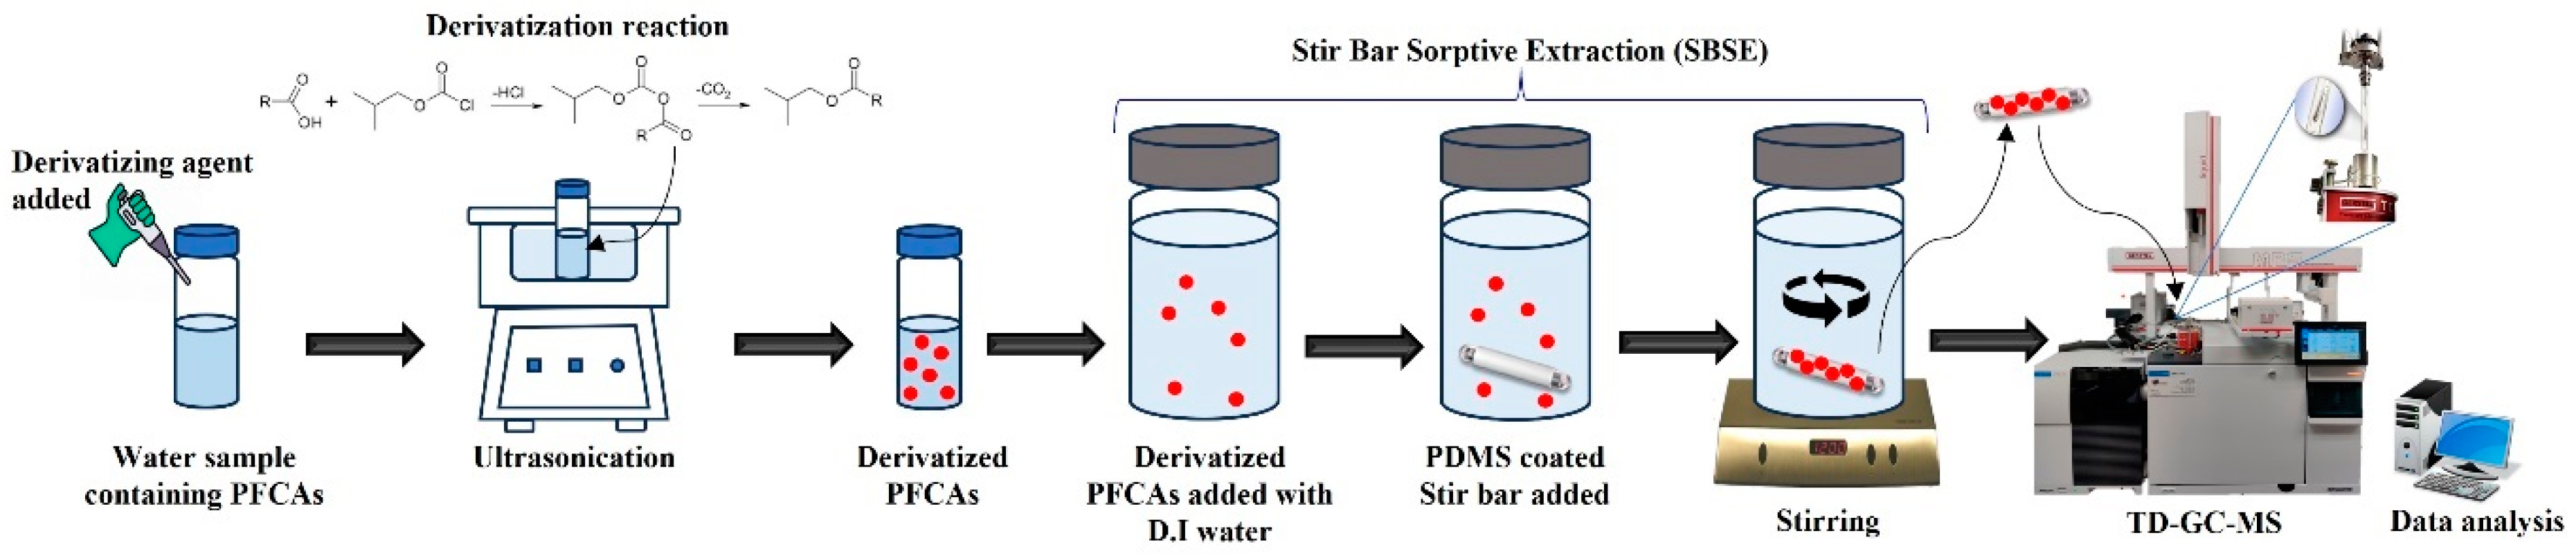
2.3. Sample Preparation, Derivatization, and Stir Bar Sorptive Extraction (SBSE)

For the determination of PFCAs, a derivatization process was employed in accordance with a methodology developed by Dufková et al. [53] with modifications. To elaborate, a 2.0 mL polypropylene (PP) vial was used for the derivatization reaction. The vial was filled with a mixture comprising 1000 µL of 1 µg/mL of nine targeted PFCAs, 50 µL of isobutyl alcohol, 20 µL of pyridine, and 50 µL of isobutyl chloroformate (IBCF). The vial was placed in an ultrasonic bath and sonicated for 30 s at room temperature. After sonication, the vial was set aside for 5 min to allow the formation of the isobutyl ester derivatives of each PFCA. The PFCAs derivatives were then subject to SBSE extraction.
For the SBSE step, a 20 mL amber vial was prepared with a mixture of 20 µL of the derivatized PFCA solution (with a concentration of 1 µg/mL), 19.96 mL of deionized (D.I.) water, and an addition of 20 µL of Mirex at a concentration of 10 µg/mL, which served as the internal standard. The ultimate concentration of the PFCAs in the vial was 1 ng/mL in a total volume of 20 mL. A commercially available stir bar (Twister™, 10 mm × 1 mm, Gerstel, Mülheim an der Ruhr, Germany) coated with polydimethylsiloxane was then introduced into the vial. The solution was subsequently stirred at a speed of 1000 rpm for 120 min. Post-stirring, the stir bar was carefully retrieved, washed with D.I. water to remove any residual sample, and then dried using lint-free tissue. The stir bar was then placed in a thermal desorption tube (TDT), and then it was ready for the final TD-GC-MS analysis. Figure 1 illustrates the entire SBSE-TD-GC-MS procedure.

2.4. Analysis Using Thermal Desorption–Gas Chromatography–Mass Spectrometry (TD-GC-MS)

PFCAs analysis was conducted using a thermal desorption unit (TDU, Gerstel, MD, USA), integrated with an 8890-Gas Chromatograph system and a 5977B Mass Selective Detector (Agilent Technologies, Wilmington, Delaware, USA). The thermal desorption program was set up as follows. The starting temperature was set at 40 °C and maintained for 0.5 min; thereafter the temperature was ramped at 60 °C/minute to 280 °C and held for 5.0 min. Ultra-high pure helium served as the carrier gas, flowing steadily at 1.2 mL/minute. The temperature of the transfer line was kept steady at 290 °C. As desorption occurred, the compounds were concentrated in a cold injection setup, CIS4/TDU, with a baffle liner (from Gerstel, USA), at −40 °C before the GC step. After completing the desorption process, CIS4 was heated at 12 °C/s to 300 °C and held for 5 min in splitless mode. PFCAs were then separated and assessed via GC-MS. They were analyzed in solvent vent mode. The analysis was conducted through an HP-5MS Ultra Inert capillary column (30 m × 0.25 mm i.d., 0.25 um film thickness, Agilent, Wilmington, Delaware , USA).
The temperature for the GC oven was configured as follows: the initial temperature was set to 40 °C and held for 2 min. Then, it was increased from 10 °C/min to 200 °C, where it was held for another 2 min. Lastly, it was increased to 300 °C at 25 °C/min and held for 3 min (total run time, 27 min). The temperature for the transfer line was set at 280 °C. The electron ionization (EI) source had ionization energy set at 70 eV. The solvent delay time was set to 1 min. The mass selective detector (MSD) was set in scan mode (40–980 m/z) for PFCA identification. For qualitative and quantitative analysis, the mass spectrometer was operated in the selected ion monitoring (SIM) mode at m/z values of 69, 131, 169, 181, and 272. Compounds were identified using ChemStation Mass Spectral Search Program. The National Institute of Standards and Technology Library (NIST17) was used for the identification of PFCA profiles.

2.5. Optimization of Stir Bar Sorptive Extraction Parameters

In this study, various operational parameters that could have influenced the extraction process were evaluated. Factors such as the duration of extraction, the speed of stirring, the composition of the solvent, the addition of salt, and the pH value of the water were meticulously assessed. These parameters were then optimized to ensure the most efficient extraction possible using SBSE. Following this optimization, the samples underwent TD-GC-MS analysis for further evaluation.

2.6. Quality Control and Quality Assurance

For quality assurance, a D.I. water blank was processed with each batch of samples to serve as a procedural blank. Each sample underwent duplicate measurements, and a third analysis was conducted if the relative standard deviation (RSD) exceeded 25%.
A nine-point calibration curve was constructed using calibration standards (0, 25 ng/L, 50 ng/L, 100 ng/L, 200 ng/L, 400 ng/L, 800 ng/L, 1000 ng/L, and 2000 ng/L). The detection limit (LOD) was determined using the standard deviation (Sy) of the lowest measurable response and the calibration curve’s slope (S), applying the equation LOD = (3Sy)/S. Similarly, the quantification limit (LOQ) was derived using LOQ = (10Sy)/S. We assessed the method’s repeatability by analyzing seven replicate samples at concentrations of 100 ng/L and 1000 ng/L. The extraction efficiency of the SBSE-TD-GC-MS method was tested by adding known amounts (10 ng and 20 ng) of PFCA standards to various water samples (tap water, wastewater influent, and wastewater effluent), and these spiking experiments were conducted in triplicates. We also quantified the matrix effects by comparing the signal intensities in the sample matrix to those in deionized water. Finally, our method was tested by calculating the recoveries of PFCAs in wastewater, and precision was determined through the relative standard deviation of the recovery data.

2.7. Statistical Analysis

In the process of optimizing SBSE parameters, we documented the responses of PFCA extraction recovery and represented them as mean values. These means were calculated from duplicate measurements. We applied the Tukey honest significance difference test (Tukey HSD) to compare the averages of the conditions we used for PFCAs analysis. In order to determine statistical significance, we used a significance threshold of p < 0.05. This criterion ensured that we considered the influence of each tested parameter on the recovery of PFCAs significant if the probability fell below this threshold. All of this statistical work was performed using RStudio, version 1.4.1564. Complete analysis results are included in the Supplementary Materials.

2.8. Method Detection Limit (MDL)

We determined the method detection limit (MDL) by assessing the variability among seven replicates. The MDL was calculated based on the spiked sample. Briefly, seven replicates of the PFCAs were prepared by spiking 5 ng of each PFCA in 1 mL of D.I. water. The resulting concentration was 5 ng/mL (5 ppb). We followed the same sample preparation method described earlier in Section 2.3 to prepare these seven replicate samples prior to GC-MS analysis for MDL determination. The MDL was calculated based on Formula (1) using the U.S. EPA method [71]:
MDL = t (n−1, 1−α = 0.99) × S
where n = number of replicates.
t (n−1, 1−α = 0.99) = the appropriate Student t-value for a single-tailed 99th percentile t statistic and a standard deviation estimate with n-1 degrees of freedom.
S = sample standard deviation of the replicate spiked sample analyses.

2.9. Analysis of PFCAs in Real Water Samples

In our research, we analyzed real-world water samples for PFCAs using a developed and optimized SBSE-TD-GC-MS method. The process commenced with the derivatization of the water samples, following the SBSE procedure. In a 2.0 mL polypropylene vial, 1 mL of the water sample, 50 µL of isobutyl alcohol, 20 µL of pyridine, and 50 µL of isobutyl chloroformate (IBCF) were added. The mixture underwent ultrasonic agitation for 30 s and was subsequently left to stand for 5 min. The mixture was then transferred to a 20 mL amber vial, mixed with 17.98 mL of D.I. water, 1 mL of methanol, 200 mg of NaCl, and 20 µL of a 10 µg/mL Mirex solution as an internal standard for SBSE. A stir bar was placed into the vial. The sample was stirred for 120 min at 1250 rpm. After extraction, the stir bar was cleaned with D.I. water, dried with lint-free tissue, and placed in a thermal desorption tube, making it ready for the final TD-GC-MS analysis.

3. Results and Discussion

3.1. Optimization of Stir Bar Sorptive Extraction

To optimize SBSE for the extraction of PFCA derivatives in water, various parameters were tested:
(1)
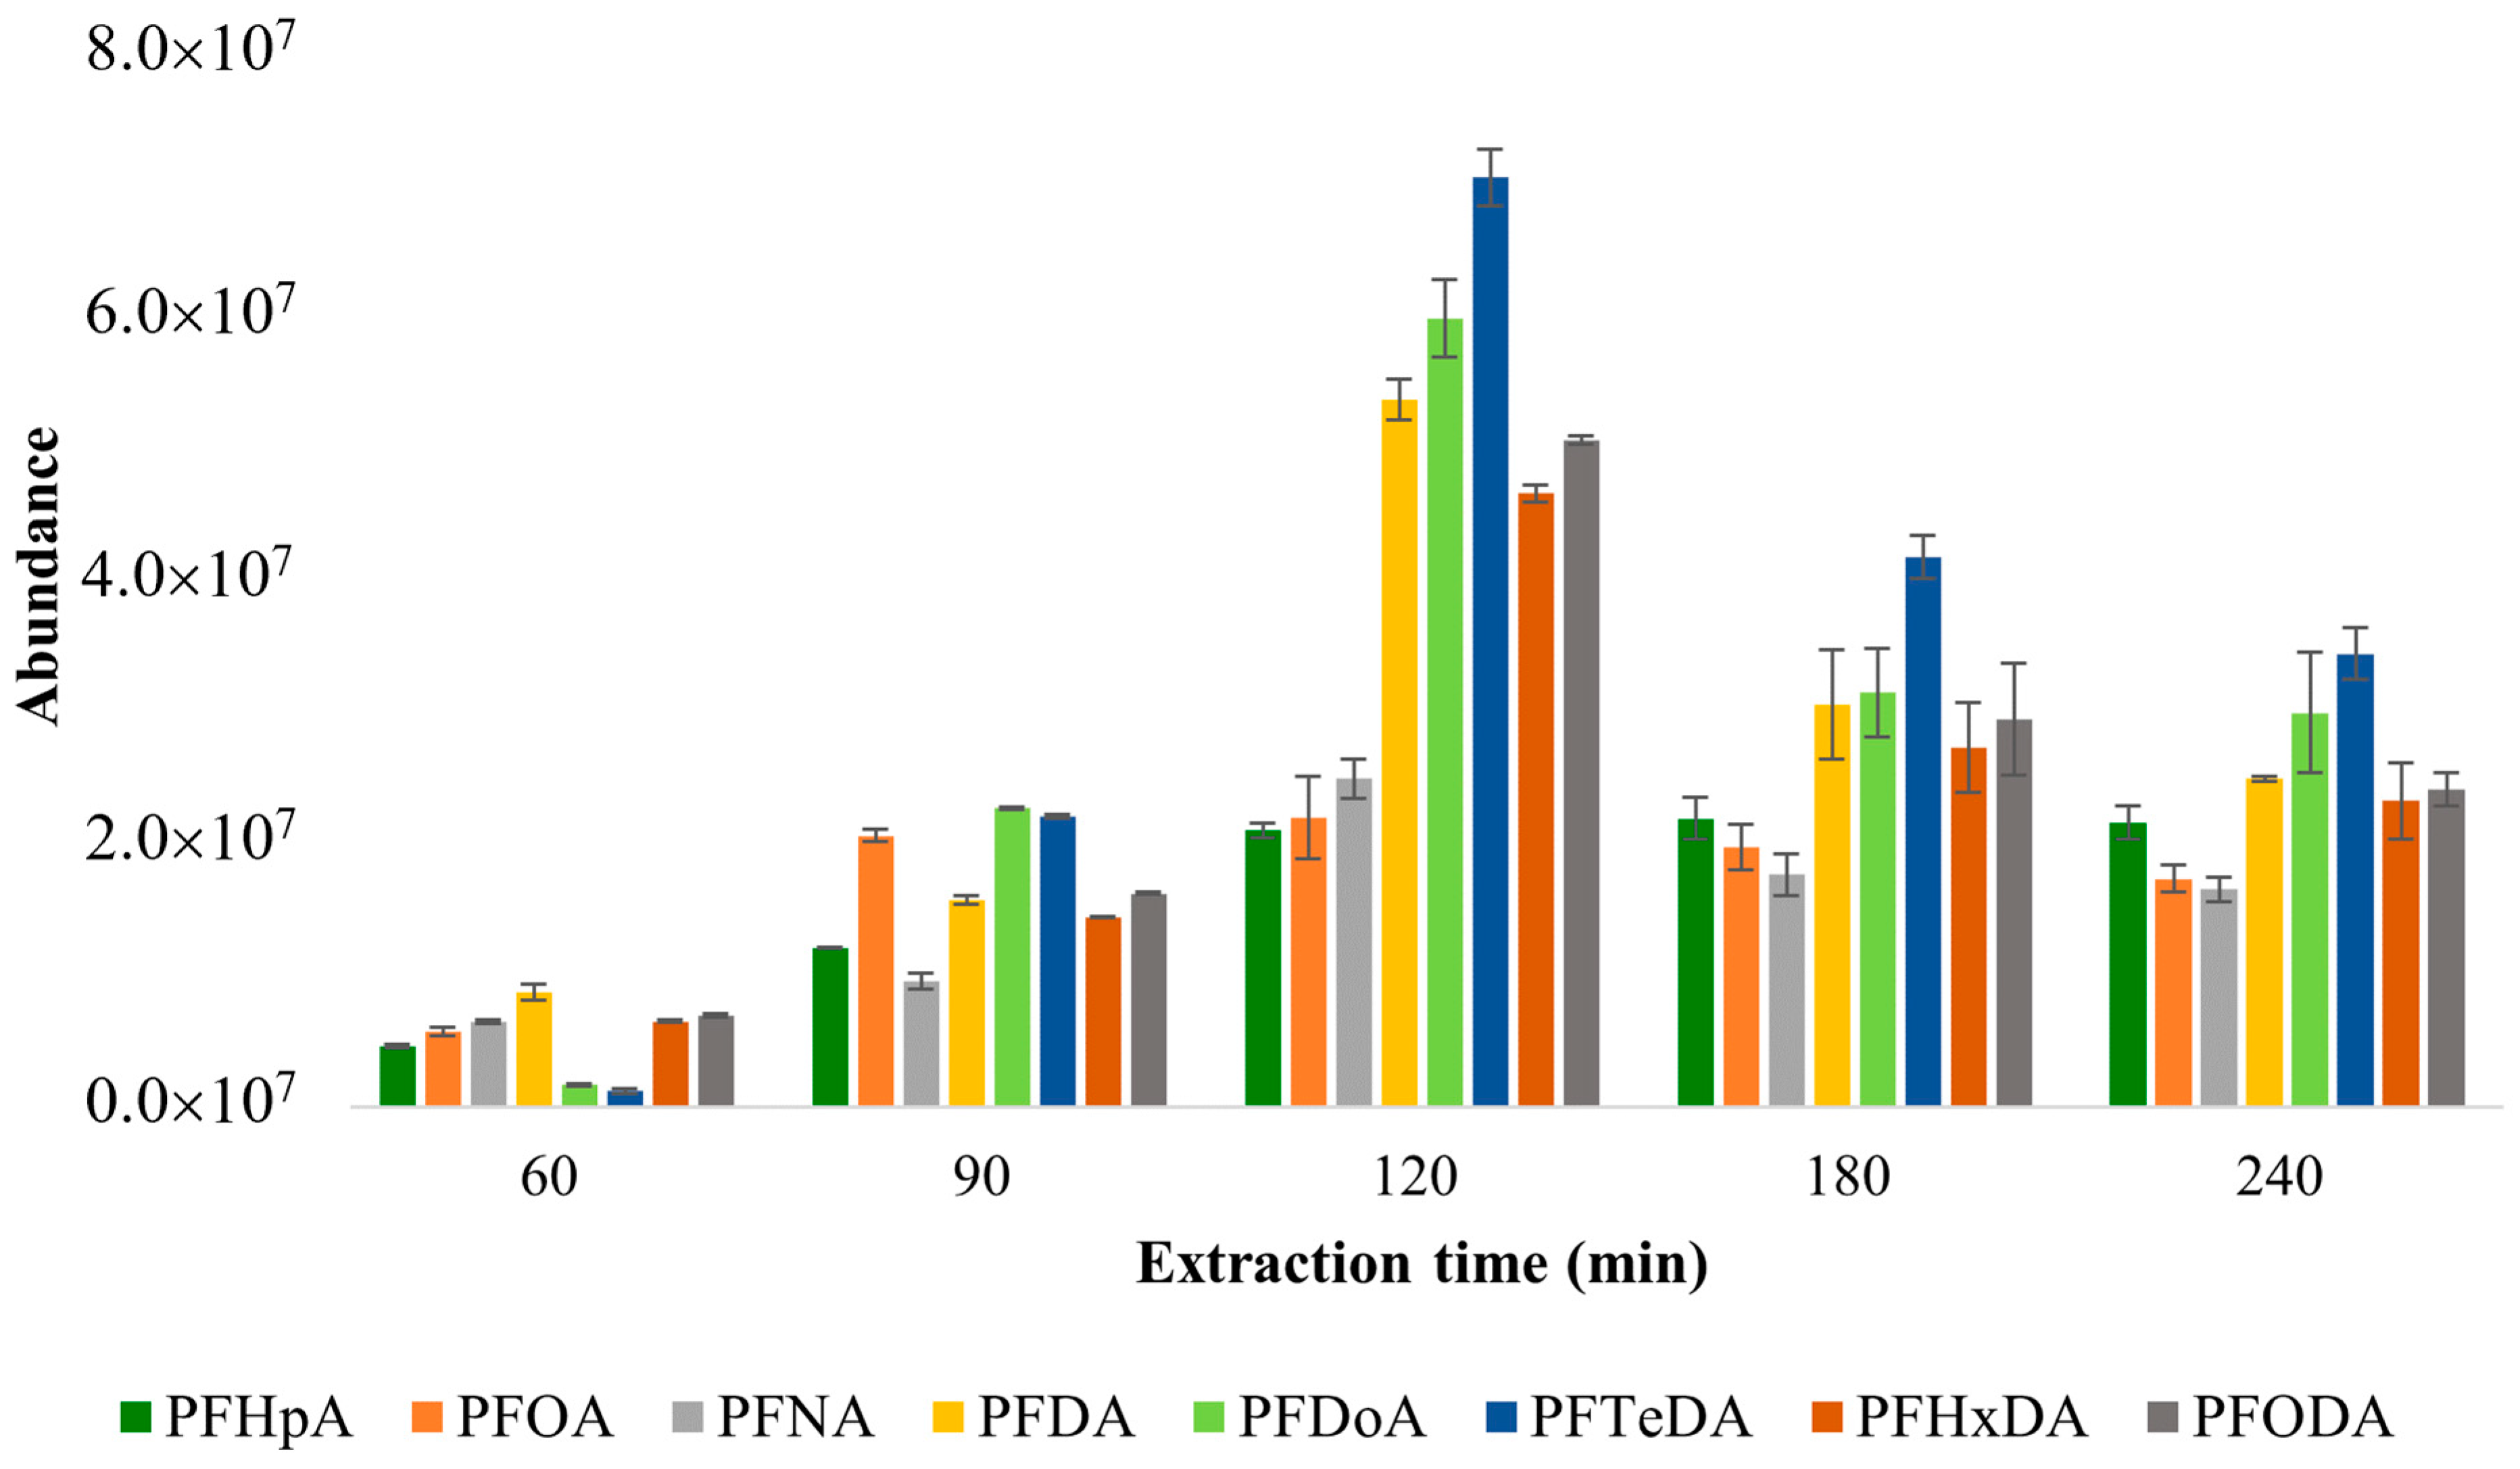
Five different extraction times (60 min, 90 min, 120 min, 180 min, and 240 min) were tested for the extraction time optimization;
(2)
Four stir bar stirring speeds were investigated (750 rpm, 1000 rpm, 1250 rpm, and 1500 rpm);
(3)
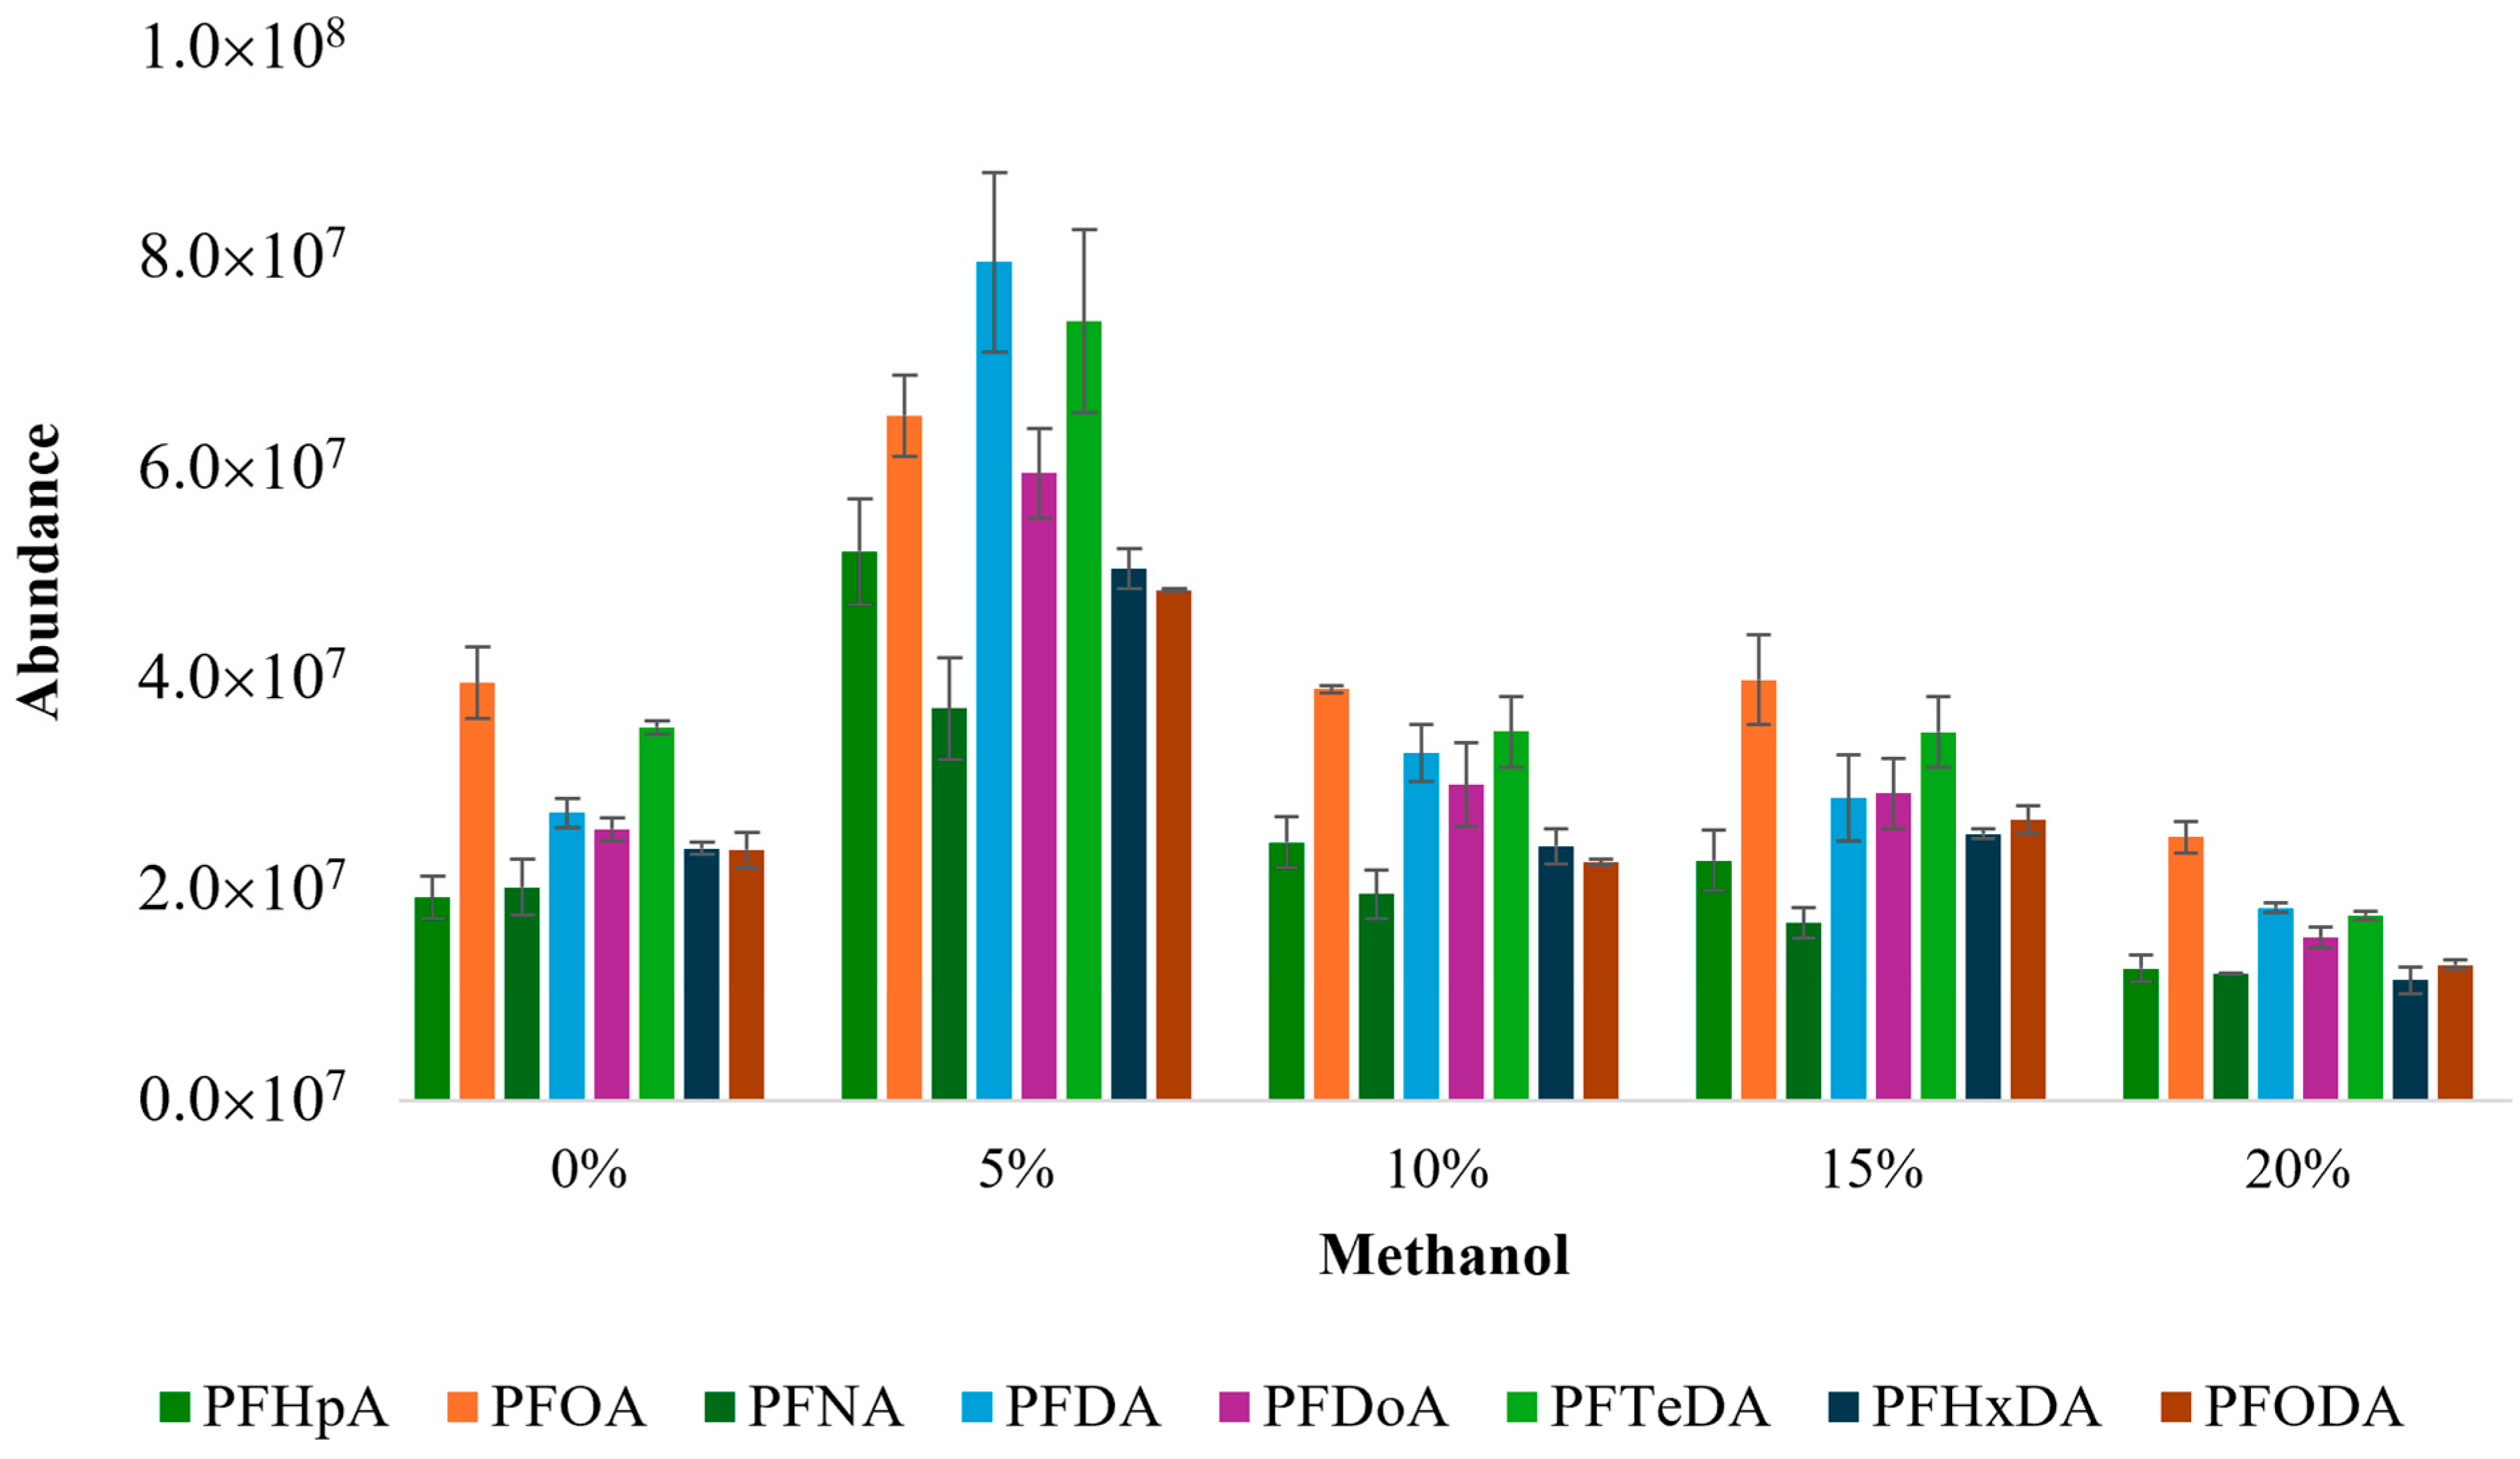
Five methanol concentrations (0%, 5%, 10%, 15%, and 20%) were tested for the solvent composition optimization during SBSE;
(4)
Five salt (NaCl) weight (w/v) percentages (0%, 1%, 2%, 3%, and 4%) were tested upon obtaining the optimized conditions in (1) to (3);
(5)
Three different pH conditions (pH 4, no pH adjustment, and pH 10) were tested.

3.1.1. Optimization of Extraction Time

The efficiency of SBSE depends largely on the duration of extraction. To determine the ideal time frame for effectively extracting PFCAs, the process was evaluated over periods ranging from 60 to 240 min. Extractions were performed in duplicate, under a constant stirring speed of 1000 rpm at room temperature. As illustrated in Figure 2, there was significantly higher recovery (p < 0.05) in the extraction of all targeted PFCAs as the extraction time expanded from 60 to 120 min. Specifically, for PFHpA, the extraction equilibrium was reached in 120 min and this equilibrium persisted up to 240 min without notable increases in recovery rates from 90 to 240 min. Interestingly, for the remaining PFCAs, their response began to decrease beyond 120 min as the duration of extraction increased. This decline post-equilibrium was likely a result of the analytes entering back into the sample matrix as stirring was prolonged beyond the equilibrium point [51]. Consequently, 120 min was determined to be the most effective extraction period and was therefore employed in all further experiments.

3.1.2. Optimization of Stirring Speed

The efficacy of SBSE is closely linked to the stirring speed, which is a critical factor in managing the transfer of analytes from the water to the polymer coating on the stir bar [51]. This transfer is essentially a diffusion process, influenced by the agitation of the medium: too little agitation leads to slow mass transfer due to a limited diffusion gradient, while too much agitation can create turbulence that disrupts the delicate equilibrium [59]. A higher stirring speed could damage the polymeric coating of the stir bar or create air bubbles, both of which can result in less efficient extraction. To obtain the optimal balance, stirring speeds were evaluated at 750, 1000, 1250, and 1500 revolutions per minute (rpm) over a 120 min extraction period. As shown in Figure 3, all of the studied PFCAs were extracted in significantly higher amounts (p < 0.05) at 1250 rpm. This specific speed presumably offers the best balance between ensuring rapid mass transfer and maintaining the integrity of the stir bar’s coating. Subsequently, the speed of 1250 rpm was selected as the most effective for the extraction process and was consistently applied in further experiments to ensure reproducibility and accuracy.

3.1.3. Optimization of Solvent Composition

The “wall effect” in the SBSE procedure refers to the tendency of analytes to adhere to the glass surfaces of the extraction vial, which can lead to a significant reduction in their recovery [72]. This adhesion is particularly problematic for hydrophobic compounds, which have a strong affinity for surfaces like glass compared to the aqueous phase. To mitigate this issue, methanol can be added to the aqueous solution as a modifier; it increases the solubility of non-polar compounds, especially those with a log octanol–water partition coefficient (log Kow) greater than 3, reducing their propensity to stick to the glass walls and enhancing their availability in the solution for extraction [51]. The use of methanol offers a two-fold benefit: it acts as a solubilizing agent for the analytes and as a competing solvent against adsorption to the glass vial. By increasing the water solubility of the non-polar analytes, methanol decreases their interaction with the glass, allowing for a greater proportion of the analytes to remain in the liquid phase where they can be extracted by the polymeric phase on the stir bar. The optimization of methanol concentration is crucial, as too much methanol could lead to a decrease in extraction efficiency due to changes in the solvent properties of the matrix. The addition of methanol to the sample matrix was evaluated at various percentages of the total solvent composition (0%, 5%, 10%, 15%, and 20%). The experimental data, presented in Figure 4, indicate that a methanol composition of 5% yielded significantly higher (p < 0.05) recovery rates for all the analytes. Thus, 5% was determined to be the optimal methanol concentration for enhancing the extraction efficiency in subsequent SBSE procedures.

3.1.4. Optimization of Ionic Strength

In aqueous solutions, the ionic strength, adjusted by adding varying amounts of salt, has a significant impact on the extraction efficiency. The addition of salt, such as sodium chloride (NaCl), to the aqueous matrix is a critical step in enhancing the SBSE process, as it regulates the ionic strength of the sample matrix [68]. The presence of salt induces a ‘salting-out’ effect, which promotes the transfer of analytes from the aqueous phase to the sorbent by reducing the solubility of hydrophobic compounds in water. Conversely, too much salt can also lead to a ‘salting-in’ effect, where the increased ionic strength of the solution can hinder the extraction process, possibly by altering the physical properties of the aqueous matrix and the sorbent [51]. In optimizing SBSE for PFCAs, NaCl was added in incremental concentrations, ranging from 0% to 4% (w/v). It was observed that the extraction efficiency significantly improved (p < 0.05) when the NaCl concentration was at 1% (w/v), suggesting an optimal salting-out condition (Figure 5). However, further increasing the concentration of NaCl to 4% (w/v) led to a reduction in efficiency, likely due to the over-enhanced ionic strength, which could have negatively influenced the extraction dynamics. Hence, after evaluating the effects at various levels, a 1% (w/v) NaCl addition was determined to provide the most favorable conditions for the SBSE of PFCAs. This optimized concentration was thus established as a standard parameter for subsequent extractions to ensure efficient and consistent recovery of the targeted analytes.

3.1.5. Optimization of pH

The pH of the sample is a critical factor in the SBSE method, as it affects the existing forms of the analytes and consequently their interaction with the sorbent. Considering that the typical pH range for actual water samples is between 6.5 and 7.5, the influence of sample pH on extraction efficiency was evaluated at three pH levels (pH 4, no pH adjustment and pH 10). Figure 6 demonstrates that significantly higher (p < 0.05) recovery rates for extractions were achieved when the pH was not adjusted. At a neutral pH, typically around pH 7, PFCA esters are more likely to be in their neutral, non-ionic form, which make them have a higher affinity for the PDMS coating on the stir bar due to its hydrophobic nature. This neutral form is less soluble in water and more inclined to be sorbed onto the PDMS surface, resulting in enhanced extraction efficiencies. When the sample pH is either acidic (pH 4) or basic (pH 10), the PFCA esters can become ionized. Acidic conditions can lead to additional protonation, while basic conditions can result in deprotonation, yielding charged forms of the PFCA-esters. These charged species are more soluble in water and less likely to adhere to the hydrophobic PDMS coating, which significantly decreases the efficiency of the SBSE process (Figure 6). Therefore, for subsequent extractions, no pH modification was carried out. This approach simplifies the sample preparation process and avoids potential complications associated with pH modification.

3.2. Evaluating SBSE-TD-GC-MS Performance: Linearity, Recovery, and Sensitivity Metrics

In the development of a robust SBSE method followed by TD-GC-MS analysis for PFCAs, we established a comprehensive set of analytical parameters that underscore the efficacy and reliability of this approach. As shown in Table 2, the retention times for the PFCAs ranged from 5.884 min for PFHpA to 13.943 min for PFODA, showcasing the method’s ability to efficiently chromatographic separation and analyze these compounds in a timely manner. The linearity of the method was investigated through the extraction of PFCAs that were spiked into samples at concentrations varying from 0 to 2000 ng/L indicating a good linearity range. The coefficients of determination (R2) ranged from 0.9892 to 0.9988, representing a high level of precision in the quantitative analysis. The method’s sensitivity, as demonstrated by the limits of detection (LODs) and limits of quantification (LOQs), were notably in the lower ppt range across all analytes. LODs ranged from 21.17 ng/L to 73.96 ng/L. Furthermore, the LOQs remained well under 200 ng/L, with PFODA demonstrating the lowest LOQ of 87.74 ng/L. As documented in the study by Bansal et al. [33], the concentrations of PFCAs in wastewater span a range from below detectable levels up to 143 µg/L (ppb). The LOQs established via our developed method enabled the reliable detection and precise quantification of PFCAs, even with the latter being present at very low levels. Collectively, these analytical merits not only validate the effectiveness of the SBSE-TD-GC-MS method but also emphasize its potential as a reliable tool for monitoring PFCAs in water matrices.
In comparison with established analytical methods for PFCA analysis, as detailed in Table 3, the newly developed SBSE-TD-GC-MS technique showcases a significant advancement in the field. This method distinguishes itself by requiring only a 1 mL sample volume, which is markedly less than the 200–500 mL typically needed for other techniques. This reduced sample volume is not only a logistical advantage but also represents a methodological improvement, potentially leading to less sample handling efforts. Furthermore, the SBSE method uses just 1 mL of methanol to enhance the extraction process, thereby supporting the method’s eco-friendliness. This reduced solvent use is aligned with the principles of green chemistry and makes our approach not only more sustainable but also less hazardous compared to traditional methods that utilize larger volumes of organic solvents. Table 3 summarizes methods such as SPE and LLE, with recovery rates from 25% to 137%, and limits of detection (LODs) ranging widely from ng/L to µg/L. Our SBSE method achieves a consistent recovery rate of 47–97% with LODs from 21.17 to 73.96 ng/L. This demonstrates competitive sensitivity and efficiency in detecting trace levels of PFCAs. Overall, our developed method maintains a balance between methodological simplicity and analytical performance, avoiding the need for more complex and costly MS/MS systems.

3.3. Method Repeatability

The method’s repeatability was evaluated through a series of tests at two spiked concentration levels, 100 ng/L and 1000 ng/L, with seven replicates for each level. The resultant data (Table 4) demonstrate the method’s robust precision, with the percentage relative standard deviation (%RSD) below 14% for all target compounds, regardless of the concentration level. These results are consistently replicated in tap water analyses, with PFNA displaying a notably low %RSD of 7.2% at a concentration of 1000 ng/L. These data emphasize the method’s reliable performance and its high repeatability, which highlights its suitability for the accurate and consistent monitoring of PFCAs.

3.4. Spiked Recovery Experiment

In our study, we thoroughly assessed the recovery efficiency of our newly developed SBSE-TD-GC-MS method for PFCA analysis across various water matrices. This was accomplished by spiking two levels (10 ng and 20 ng) of the PFCAs into 20 mL of tap water, wastewater influent, and wastewater effluent samples. The recovery percentages, along with their respective standard deviations, were calculated based on duplicate measurements (n = 2) for each condition. In tap water, recovery rates were fairly high, ranging from 68% (±8) to 90% (±10) at the 10 ng level, and improved at the 20 ng level with rates from 61% (±1) to 96% (±6) (Table 5). This indicates a degree of matrix-related enhancement in recovery at the higher spiking level. On the other hand, the recovery rates in wastewater influent were significantly lower, with values from 29% (±12) to 44% (±11) at the 10 ng level, and only a slight increase at the 20 ng level, achieving values between 21% (±7) and 31% (±10). This indicates a substantial matrix effect likely due to the presence of interfering substances. Wastewater effluent displayed intermediate recovery rates. The 10 ng spikes yielded 43% (±6) to 65% (±14) recoveries and the 20 ng spikes led to 44% (±11) to 74% (±8) recoveries. These findings further confirm the impact of matrix complexity on the extraction efficiency of PFCAs. The effluent samples showed a lower degree of interference compared to influent samples, likely due to the partial removal of contaminants during the wastewater treatment process. To address the matrix effect encountered, particularly in the more complex wastewater samples, the standard addition method could be considered a viable solution. By adding known quantities of PFCAs directly to the samples, this method compensates for matrix-induced deviations. This allows for a more accurate quantification of analytes.

3.5. Determination of PFCAs in Real Water Samples

In our deployment of the novel SBSE-TD-GC-MS methodology, comprehensive testing was conducted on various water matrices, including tap water and both wastewater influent and effluent samples from four distinct wastewater treatment facilities. Despite the method’s enhanced sensitivity and specificity for PFCA detection, none of the analytes were identified above the method’s quantification limit in the real wastewater samples examined. This absence of detectable PFCAs may reflect the efficiency of the wastewater treatment processes, which seem to be effective in removing these compounds or reducing their concentrations to sub-threshold levels. It is also important to consider the potential influence of matrix effects in the influent water, which could lead to signal suppression or enhancement, affecting the detection of PFCAs in complex matrices like wastewater. It should be noted that we used only 1 mL of water for the analysis. As shown in Table 2, the concentrations of the PFCAs in water would have to be in high ppt or low ppb ranges to be detected directly without any sample pre-concentration. Thus, the absence of detectable PFCAs in the tested samples likely reflects their true scarcity or low concentration in the sampled environments.

3.6. Method Strengths and Limitations

The SBSE-TD-GC-MS method for PFCAs analysis presents a novel approach that integrates the principles of green chemistry and marks a significant advancement in environmental analytical methodologies. Its strength lies in minimizing environmental impacts by drastically reducing the reliance on organic solvents traditionally required for extraction processes. This not only aligns with green chemistry goals but also decreases the potential for introducing solvent-related contamination. Another considerable strength of the method is its ability to effectively analyze PFCAs without the need for a clean-up and pre-concentration step. This method requires only 1 mL of a water sample. This feature is particularly advantageous for field studies where the sample volume is often limited or in situations where the transportation of large volumes of samples is impractical. This aspect of the method greatly enhances its application in remote or logistically challenging environments, where carrying out extensive sampling may not be feasible. Furthermore, this method is the first to use the SBSE technique to extract PFCAs from water without using solvents for desorption prior to GC-MS analysis as the thermal desorption unit is coupled with GC-MS. Solventless desorption simplifies the process, cuts down the steps, and lowers the chance of errors or contamination.
However, despite these strengths, this method does have its limitations. The matrix effects observed in wastewater samples indicate that complex sample matrices can influence the recovery and detection of PFCAs. Although the standard addition method and matrix-matched calibrations can be employed to counter these effects, they do add complexity and may increase the time required for sample preparation and analysis. Overall, the SBSE-TD-GC-MS method represents a significant step forward for the efficient analysis of PFCAs in water samples when high concentrations (high ppt to low ppb ranges) of PFCAs are expected.

4. Conclusions

This research fills a gap in the existing literature by employing SBSE with TD-GC-MS, a novelty in the field. Additionally, employing a thermal desorption unit coupled with GC-MS can eliminate the need for organic solvent usage for desorption in LC-MS/MS methods, as reported in the previous studies. By optimizing the SBSE conditions, we demonstrated extraction effectiveness, decreased the time required for extraction, and addressed the issue of low recovery reported in earlier research. This sophisticated SBSE-TD-GC-MS method is optimized and validated analytical method, characterized by its simplicity, sensitivity, and robustness for the extraction and quantification of PFCAs in aquatic environments. Through rigorous testing, the method demonstrated exemplary linearity across a concentration range of 0–2000 ng/L, repeatability with a %RSD within 14%, and a consistent recovery rate of 47–97%. The LODs ranged from 21.17 to 73.96 ng/L. These attributes emphasize the method’s reliability as an alternative to the conventional methods for PFCA analysis. Despite the method’s heightened sensitivity and specificity, it is notable that none of the targeted PFCAs were identified in the real water samples analyzed. The environmental sustainability of this method is evident in its minimal requirements in terms of sample volume (20 mL) and organic solvent (1 mL of methanol), marking it as a green analytical technique. This study also sets a precedent by being the first to report on the use of SBSE without necessitating an organic solvent for desorption. Although the MDLs were found to be in a high ppt or low ppb range, this method could be an ideal alternative with which to study water in highly contaminated regions or could incorporate a pre-concentration step to reach desirable detection levels. Nonetheless, its performance surpasses that of traditional methods such as SPE, LLE, and SPME in terms of efficiency and cost-effectiveness, and its compatibility with commercially available stir bars makes it more user-friendly than previous SBSE methods associated with LC-MS/MS.

Supplementary Materials

The following supporting information can be downloaded at https://www.mdpi.com/article/10.3390/w16172543/s1, Statistical Analysis Supporting Information: Comparison within each optimization parameter, containing the p-values obtained from the Tukey HSD test.

Author Contributions

Conceptualization, A.H. and W.-Y.L.; methodology, A.H. and W.-Y.L.; formal analysis, A.H.; investigation, W.-Y.L., A.H. and E.N.L.; data curation, A.H. and E.N.L.; writing—original draft, A.H.; validation, K.L.H., A.A.C. and W.-Y.L.; writing—review and editing, A.H., E.N.L., K.L.H., A.A.C. and W.-Y.L.; supervision, W.-Y.L.; funding acquisition, W.-Y.L. All authors have read and agreed to the published version of the manuscript.

Funding

The study in this publication was partially funded by the National Cancer Institute of the National Institutes of Health (grant number SC1CA245675). The contents expressed in this publication are the responsibility of the authors and do not necessarily reflect the official position of the National Institutes of Health.

Data Availability Statement

The data that support the findings of this study are available on request from the corresponding author [W.-Y.L.].

Acknowledgments

The authors extend their gratitude to Teresa T. Alcala and the staff at El Paso Water Laboratory for their support with the collection of wastewater samples.

Conflicts of Interest

The authors declare no conflicts of interest.

References

  1. OECD. Toward a New Comprehensive Global Database of Per-and Polyfluoroalkyl Substances (PFASs): Summary Report on Updating the OECD 2007 List of per-and Polyfluoroalkyl Substances (PFASs); Series on Risk Management, No. 39; OECD: Paris, France, 2018; pp. 1–24. [Google Scholar]
  2. Habib, Z.; Song, M.; Ikram, S.; Zahra, Z. Overview of Per-and Polyfluoroalkyl Substances (PFAS), Their Applications, Sources, and Potential Impacts on Human Health. Pollutants 2024, 4, 136–152. [Google Scholar] [CrossRef]
  3. Liu, W.L.; Ko, Y.C.; Hwang, B.H.; Li, Z.G.; Yang, T.C.C.; Lee, M.R. Determination of Perfluorocarboxylic Acids in Water by Ion-Pair Dispersive Liquid-Liquid Microextraction and Gas Chromatography-Tandem Mass Spectrometry with Injection Port Derivatization. Anal. Chim. Acta 2012, 726, 28–34. [Google Scholar] [CrossRef]
  4. Buck, R.C.; Franklin, J.; Berger, U.; Conder, J.M.; Cousins, I.T.; De Voogt, P.; Jensen, A.A.; Kannan, K.; Mabury, S.A.; van Leeuwen, S.P.J. Perfluoroalkyl and Polyfluoroalkyl Substances in the Environment: Terminology, Classification, and Origins. Integr. Environ. Assess. Manag. 2011, 7, 513–541. [Google Scholar] [CrossRef] [PubMed]
  5. Schwartz-Narbonne, H.; Xia, C.; Shalin, A.; Whitehead, H.D.; Yang, D.; Peaslee, G.F.; Wang, Z.; Wu, Y.; Peng, H.; Blum, A.; et al. Per-and Polyfluoroalkyl Substances in Canadian Fast Food Packaging. Environ. Sci. Technol. Lett. 2023, 10, 343–349. [Google Scholar] [CrossRef]
  6. Wang, Z.; Dewitt, J.C.; Higgins, C.P.; Cousins, I.T. A Never-Ending Story of Per-and Polyfluoroalkyl Substances (PFASs)? Environ. Sci. Technol. 2017, 51, 2508–2518. [Google Scholar] [CrossRef]
  7. Kotthoff, M.; Müller, J.; Jürling, H.; Schlummer, M.; Fiedler, D. Perfluoroalkyl and Polyfluoroalkyl Substances in Consumer Products. Environ. Sci. Pollut. Res. 2015, 22, 14546–14559. [Google Scholar] [CrossRef] [PubMed]
  8. Abunada, Z.; Alazaiza, M.Y.D.; Bashir, M.J.K. An Overview of Per-and Polyfluoroalkyl Substances (PFAS) in the Environment: Source, Fate, Risk and Regulations. Water 2020, 12, 3590. [Google Scholar] [CrossRef]
  9. Knutsen, H.; Mæhlum, T.; Haarstad, K.; Slinde, G.A.; Arp, H.P.H. Leachate Emissions of Short-And Long-Chain per-And Polyfluoralkyl Substances (PFASs) from Various Norwegian Landfills. Environ. Sci. Process. Impacts 2019, 21, 1970–1979. [Google Scholar] [CrossRef]
  10. Amin, A.; Sobhani, Z.; Liu, Y.; Dharmaraja, R. Environmental Technology & Innovation Recent Advances in the Analysis of Per-and Polyfluoroalkyl Substances (PFAS)—A Review. Environ. Technol. Innov. 2020, 19, 100879. [Google Scholar] [CrossRef]
  11. Lu, G.H.; Gai, N.; Zhang, P.; Piao, H.T.; Chen, S.; Wang, X.C.; Jiao, X.C.; Yin, X.C.; Tan, K.Y.; Yang, Y.L. Perfluoroalkyl Acids in Surface Waters and Tapwater in the Qiantang River Watershed—Influences from Paper, Textile, and Leather Industries. Chemosphere 2017, 185, 610–617. [Google Scholar] [CrossRef] [PubMed]
  12. Zango, Z.U.; Ethiraj, B.; Al-Mubaddel, F.S.; Alam, M.M.; Lawal, M.A.; Kadir, H.A.; Khoo, K.S.; Garba, Z.N.; Usman, F.; Zango, M.U.; et al. An Overview on Human Exposure, Toxicity, Solid-Phase Microextraction and Adsorptive Removal of Perfluoroalkyl Carboxylic Acids (PFCAs) from Water Matrices. Environ. Res. 2023, 231, 116102. [Google Scholar] [CrossRef]
  13. Ye, R.X.; Di Lorenzo, R.A.; Clouthier, J.T.; Young, C.J.; VandenBoer, T.C. A Rapid Derivatization for Quantitation of Perfluorinated Carboxylic Acids from Aqueous Matrices by Gas Chromatography-Mass Spectrometry. Anal. Chem. 2023, 95, 7648–7655. [Google Scholar] [CrossRef] [PubMed]
  14. Wolf, N.; Müller, L.; Enge, S.; Ungethüm, T.; Simat, T.J. Thermal Desorption—Gas Chromatography—Mass Spectrometry (TD-GC-MS) Analysis of PFAS Used in Food Contact Materials. Food Addit. Contam. Part A 2024, 41, 1099–1117. [Google Scholar] [CrossRef] [PubMed]
  15. Di Giorgi, A.; Basile, G.; Bertola, F.; Tavoletta, F.; Busardò, F.P.; Tini, A. A Green Analytical Method for the Simultaneous Determination of 17 Perfluoroalkyl Substances (PFAS) in Human Serum and Semen by Ultra-Performance Liquid Chromatography-Tandem Mass Spectrometry (UPLC-MS/MS). J. Pharm. Biomed. Anal. 2024, 246, 116203. [Google Scholar] [CrossRef] [PubMed]
  16. Bassler, J.; Ducatman, A.; Elliott, M.; Wen, S.; Wahlang, B.; Barnett, J.; Cave, M.C. Environmental Perfluoroalkyl Acid Exposures Are Associated with Liver Disease Characterized by Apoptosis and Altered Serum Adipocytokines. Environ. Pollut. 2019, 247, 1055–1063. [Google Scholar] [CrossRef]
  17. Wen, X.; Xu, X. Exposure to Per-and Polyfluoroalkyl Substances and Mortality in US Adults: A population-based cohort study. Environ. Health Perspect. 2022, 130, 067007. [Google Scholar] [CrossRef]
  18. Steenland, K.; Winquist, A. PFAS and Cancer, a Scoping Review of the Epidemiologic Evidence. Environ. Res. 2021, 194, 110690. [Google Scholar] [CrossRef]
  19. Song, D.; Qiao, B.; Yao, Y.; Zhao, L.; Wang, X.; Chen, H.; Zhu, L.; Sun, H. Target and Nontarget Analysis of Per-and Polyfluoroalkyl Substances in Surface Water, Groundwater and Sediments of Three Typical Fluorochemical Industrial Parks in China. J. Hazard. Mater. 2023, 460, 132411. [Google Scholar] [CrossRef]
  20. Kaltenberg, E.M.; Dasu, K.; Lefkovitz, L.F.; Thorn, J.; Schumitz, D. Sampling of Freely Dissolved Per-and Polyfluoroalkyl Substances (PFAS) in Surface Water and Groundwater Using a Newly Developed Passive Sampler. Environ. Pollut. 2023, 318, 120940. [Google Scholar] [CrossRef]
  21. Forster, A.L.B.; Zhang, Y.; Westerman, D.C.; Richardson, S.D. Improved Total Organic Fluorine Methods for More Comprehensive Measurement of PFAS in Industrial Wastewater, River Water, and Air. Water Res. 2023, 235, 119859. [Google Scholar] [CrossRef]
  22. McMahon, P.B.; Tokranov, A.K.; Bexfield, L.M.; Lindsey, B.D.; Johnson, T.D.; Lombard, M.A.; Watson, E. Perfluoroalkyl and Polyfluoroalkyl Substances in Groundwater Used as a Source of Drinking Water in the Eastern United States. Environ. Sci. Technol. 2022, 56, 2279–2288. [Google Scholar] [CrossRef]
  23. Park, S.; Kim, D.H.; Yoon, J.H.; Kwon, J.B.; Choi, H.; Shin, S.K.; Kim, M.; Kim, H.K. Study on Pollution Characteristics of Perfluoroalkyl Substances (PFASs) in Shallow Groundwater. Water 2023, 15, 1480. [Google Scholar] [CrossRef]
  24. Yamazaki, E.; Taniyasu, S.; Wang, X.; Yamashita, N. Per-and Polyfluoroalkyl Substances in Surface Water, Gas and Particle in Open Ocean and Coastal Environment. Chemosphere 2021, 272, 129869. [Google Scholar] [CrossRef] [PubMed]
  25. Junttila, V.; Vähä, E.; Perkola, N.; Räike, A.; Siimes, K.; Mehtonen, J.; Kankaanpää, H.; Mannio, J. PFASs in Finnish Rivers and Fish and the Loading of PFASs to the Baltic Sea. Water 2019, 11, 870. [Google Scholar] [CrossRef]
  26. Wang, F.; Zhuang, Y.; Dong, B.; Wu, J. Review on Per-and Poly-Fluoroalkyl Substances’ (PFASs’) Pollution Characteristics and Possible Sources in Surface Water and Precipitation of China. Water 2022, 14, 812. [Google Scholar] [CrossRef]
  27. Wang, Y.Q.; Hu, L.X.; Liu, T.; Zhao, J.H.; Yang, Y.Y.; Liu, Y.S.; Ying, G.G. Per-and Polyfluoralkyl Substances (PFAS) in Drinking Water System: Target and Non-Target Screening and Removal Assessment. Environ. Int. 2022, 163, 107219. [Google Scholar] [CrossRef] [PubMed]
  28. Jiang, J.J.; Okvitasari, A.R.; Huang, F.Y.; Tsai, C.S. Characteristics, Pollution Patterns and Risks of Perfluoroalkyl Substances in Drinking Water Sources of Taiwan. Chemosphere 2021, 264, 128579. [Google Scholar] [CrossRef]
  29. Mussabek, D.; Söderman, A.; Imura, T.; Persson, K.M.; Nakagawa, K.; Ahrens, L.; Berndtsson, R. PFAS in the Drinking Water Source: Analysis of the Contamination Levels, Origin and Emission Rates. Water 2023, 15, 137. [Google Scholar] [CrossRef]
  30. Guardian, M.G.E.; Boongaling, E.G.; Bernardo-Boongaling, V.R.R.; Gamonchuang, J.; Boontongto, T.; Burakham, R.; Arnnok, P.; Aga, D.S. Prevalence of Per-and Polyfluoroalkyl Substances (PFASs) in Drinking and Source Water from Two Asian Countries. Chemosphere 2020, 256, 127115. [Google Scholar] [CrossRef]
  31. Gallen, C.; Eaglesham, G.; Drage, D.; Nguyen, T.H.; Mueller, J.F. A Mass Estimate of Perfluoroalkyl Substance (PFAS) Release from Australian Wastewater Treatment Plants. Chemosphere 2018, 208, 975–983. [Google Scholar] [CrossRef]
  32. Gonzalez, D.; Thompson, K.; Quiñones, O.; Dickenson, E.; Bott, C. Assessment of PFAS Fate, Transport, and Treatment Inhibition Associated with a Simulated AFFF Release within a WASTEWATER Treatment Plant. Chemosphere 2021, 262, 127900. [Google Scholar] [CrossRef] [PubMed]
  33. Bansal, O.P.; Bhardwaj, M.K.; Gupta, V. Per- and Polyfluoroalkyl Substances in the Environment: A Review. J. Adv. Sci. Res. 2022, 375, 1–25. [Google Scholar]
  34. US EPA. Drinking Water Health Advisories for PFAS Fact Sheet for Public Water Systems (PFOA, PFOS, GenX Chemicals and PFBS); US EPA: Washington, DC, USA, 2022. [Google Scholar]
  35. Nahar, K.; Zulkarnain, N.A.; Niven, R.K. A Review of Analytical Methods and Technologies for Monitoring Per-and Polyfluoroalkyl Substances (PFAS) in Water. Water 2023, 15, 3577. [Google Scholar] [CrossRef]
  36. Cui, Y.; Wang, S.; Han, D.; Yan, H. Advancements in Detection Techniques for Per-and Polyfluoroalkyl Substances: A Comprehensive Review. TrAC-Trends Anal. Chem. 2024, 176, 117754. [Google Scholar] [CrossRef]
  37. Shafique, U.; Schulze, S.; Slawik, C.; Kunz, S.; Paschke, A.; Schüürmann, G. Gas Chromatographic Determination of Perfluorocarboxylic Acids in Aqueous Samples—A Tutorial Review. Anal. Chim. Acta. 2017, 949, 8–22. [Google Scholar] [CrossRef] [PubMed]
  38. Dong, B.; Wu, J.; Zhuang, Y.; Wang, F.; Zhang, Y.; Zhang, X.; Zheng, H.; Yang, L.; Peng, L. Trace Analysis Method Based on UPLC-MS/MS for the Determination of (C2-C18) Per-and Polyfluoroalkyl Substances and Its Application to Tap Water and Bottled Water. Anal. Chem. 2023, 95, 695–702. [Google Scholar] [CrossRef]
  39. Zarębska, M.; Bajkacz, S. Poly-and Perfluoroalkyl Substances (PFAS)—Recent Advances in the Aquatic Environment Analysis. TrAC-Trends Anal. Chem. 2023, 163, 117062. [Google Scholar] [CrossRef]
  40. Ogunbiyi, O.D.; Ajiboye, T.O.; Omotola, E.O.; Oladoye, P.O.; Olanrewaju, C.A.; Quinete, N. Analytical Approaches for Screening of Per-and Poly Fluoroalkyl Substances in Food Items: A Review of Recent Advances and Improvements. Environ. Pollut. 2023, 329, 121705. [Google Scholar] [CrossRef]
  41. Aßhoff, N.; Bernsmann, T.; Esselen, M.; Stahl, T. A Sensitive Method for the Determination of Per-and Polyfluoroalkyl Substances in Food and Food Contact Material Using High-Performance Liquid Chromatography Coupled with Tandem Mass Spectrometry. J. Chromatogr. A 2024, 1730, 465041. [Google Scholar] [CrossRef]
  42. Ganesan, S.; Chawengkijwanich, C.; Gopalakrishnan, M. Detection Methods for Sub-Nanogram Level of Emerging Pollutants—Per and Polyfluoroalkyl Substances. Food Chem. Toxicol. 2022, 168, 113377. [Google Scholar] [CrossRef]
  43. Rodriguez, K.L.; Hwang, J.H.; Esfahani, A.R.; Sadmani, A.H.M.A.; Lee, W.H. Recent Developments of PFAS-Detecting Sensors and Future Direction: A Review. Micromachines 2020, 11, 667. [Google Scholar] [CrossRef] [PubMed]
  44. Rehman, A.U.; Crimi, M.; Andreescu, S. Current and Emerging Analytical Techniques for the Determination of PFAS in Environmental Samples. Trends Environ. Anal. Chem. 2023, 37, e00198. [Google Scholar] [CrossRef]
  45. Tanim-Al Hassan, M.; Chen, X.; Fnu, P.I.J.; Osonga, F.J.; Sadik, O.A.; Li, M.; Chen, H. Rapid Detection of Per-and Polyfluoroalkyl Substances (PFAS) Using Paper Spray-Based Mass Spectrometry. J. Hazard. Mater. 2024, 465, 133366. [Google Scholar] [CrossRef]
  46. Mok, S.; Lee, S.; Choi, Y.; Jeon, J.; Kim, Y.H.; Moon, H. Target and Non-Target Analyses of Neutral per-and Polyfluoroalkyl Substances from Fluorochemical Industries Using GC-MS/MS and GC-TOF: Insights on Their Environmental Fate. Environ. Int. 2023, 182, 108311. [Google Scholar] [CrossRef]
  47. Jovanović, M.; Müller, V.; Feldmann, J.; Leitner, E. Analysis of Per-and Polyfluoroalkyl Substances (PFAS) in Raw Materials Intended for the Production of Paper-Based Food Contact Materials–Evaluating LC-MS/MS versus Total Fluorine and Extractable Organic Fluorine. Food Addit. Contam.-Part A 2024, 41, 525–536. [Google Scholar] [CrossRef]
  48. Brase, R.A.; Mullin, E.J.; Spink, D.C. Legacy and Emerging Per-and Polyfluoroalkyl Substances: Analytical Techniques, Environmental Fate, and Health Effects. Int. J. Mol. Sci. 2021, 22, 995. [Google Scholar] [CrossRef]
  49. Yamashita, N.; Kannan, K.; Taniyasu, S.; Horii, Y.; Okazawa, T.; Petrick, G.; Gamo, T. Analysis of Perfluorinated Acids at Parts-per-Quadrillion Levels in Seawater Using Liquid Chromatography-Tandem Mass Spectrometry. Environ. Sci. Technol. 2004, 38, 5522–5528. [Google Scholar] [CrossRef] [PubMed]
  50. Stróżyńska, M.; Schuhen, K. Extraction and Derivatization for Perfluorocarboxylic Acids in Liquid and Solid Matrices: A Review. Anal. Sci. Adv. 2020, 2, 343–353. [Google Scholar] [CrossRef]
  51. Habib, A.; Landa, E.N.; Holbrook, K.L.; Walker, W.S.; Lee, W.-Y. Rapid, Efficient, and Green Analytical Technique for Determination of Fluorotelomer Alcohol in Water by Stir Bar Sorptive Extraction. Chemosphere 2023, 338, 139439. [Google Scholar] [CrossRef]
  52. Robbins, Z.G.; Liu, X.; Schumacher, B.A.; Smeltz, M.G.; Liberatore, H.K. Method Development for Thermal Desorption-Gas Chromatography-Tandem Mass Spectrometry (TD-GC–MS/MS) Analysis of Trace Level Fluorotelomer Alcohols Emitted from Consumer Products. J. Chromatogr. A 2023, 1705, 464204. [Google Scholar] [CrossRef]
  53. Dufková, V.; Čabala, R.; Maradová, D.; Štícha, M. A Fast Derivatization Procedure for Gas Chromatographic Analysis of Perfluorinated Organic Acids. J. Chromatogr. A 2009, 1216, 8659–8664. [Google Scholar] [CrossRef] [PubMed]
  54. Hu, Z.; Li, Q.; Xu, L.; Zhang, W.; Zhang, Y. Determination of Perfluoroalkyl Carboxylic Acids in Environmental Water Samples by Dispersive Liquid–Liquid Microextraction with GC-MS Analysis. J. Liq. Chromatogr. Relat. Technol. 2020, 43, 282–290. [Google Scholar] [CrossRef]
  55. Yin, S.; López, J.F.; Sandoval-Pauker, C.; Calvillo Solís, J.J.; Glass, S.; Habib, A.; Lee, W.Y.; Wong, M.S.; Alvarez, P.J.J.; Villagrán, D. Trap-n-Zap: Electrocatalytic Degradation of Perfluorooctanoic Acid (PFOA) with UiO-66 Modified Boron Nitride Electrodes at Environmentally Relevant Concentrations. Appl. Catal. B 2024, 355, 124136. [Google Scholar] [CrossRef]
  56. Gołebiowski, M.; Siedlecka, E.; Paszkiewicz, M.; Brzozowski, K.; Stepnowski, P. Perfluorocarboxylic Acids in Cell Growth Media and Technologically Treated Waters: Determination with GC and GC-MS. J. Pharm. Biomed. Anal. 2011, 54, 577–581. [Google Scholar] [CrossRef] [PubMed]
  57. Stróżyńska, M.; Schuhen, K. Dispersive Solid-Phase Extraction Followed by Triethylsilyl Derivatization and Gas Chromatography Mass Spectrometry for Perfluorocarboxylic Acids Determination in Water Samples. J. Chromatogr. A 2019, 1597, 1–8. [Google Scholar] [CrossRef]
  58. Taniyasu, S.; Yeung, L.W.Y.; Lin, H.; Yamazaki, E.; Eun, H.; Lam, P.K.S.; Yamashita, N. Quality Assurance and Quality Control of Solid Phase Extraction for PFAS in Water and Novel Analytical Techniques for PFAS Analysis. Chemosphere 2022, 288, 132440. [Google Scholar] [CrossRef]
  59. Prieto, A.; Basauri, O.; Rodil, R.; Usobiaga, A.; Fernández, L.A.; Etxebarria, N.; Zuloaga, O. Stir-Bar Sorptive Extraction: A View on Method Optimisation, Novel Applications, Limitations and Potential Solutions. J. Chromatogr. A 2010, 1217, 2642–2666. [Google Scholar] [CrossRef]
  60. Iannone, A.; Carriera, F.; Di Fiore, C.; Avino, P. Poly-and Perfluoroalkyl Substance (PFAS) Analysis in Environmental Matrices: An Overview of the Extraction and Chromatographic Detection Methods. Analytica 2024, 5, 187–202. [Google Scholar] [CrossRef]
  61. Alzaga, R.; Bayona, J.M. Determination of Perfluorocarboxylic Acids in Aqueous Matrices by Ion-Pair Solid-Phase Microextraction-in-Port Derivatization-Gas Chromatography-Negative Ion Chemical Ionization Mass Spectrometry. J. Chromatogr. A 2004, 1042, 155–162. [Google Scholar] [CrossRef]
  62. Monteleone, M.; Naccarato, A.; Sindona, G.; Tagarelli, A. A Rapid and Sensitive Assay of Perfluorocarboxylic Acids in Aqueous Matrices by Headspace Solid Phase Microextraction-Gas Chromatography-Triple Quadrupole Mass Spectrometry. J. Chromatogr. A 2012, 1251, 160–168. [Google Scholar] [CrossRef]
  63. Baltussen, E.; Sandra, P.; David, F.; Cramers, C. Stir Bar Sorptive Extraction (SBSE), a Novel Extraction Technique for Aqueous Samples: Theory and Principles. J. Microcolumn Sep. 1999, 11, 737–747. [Google Scholar] [CrossRef]
  64. Holbrook, K.L.; Badmos, S.; Habib, A.; Landa, E.N.; Quaye, G.E.; Su, X.; Lee, W. Investigating the Effects of Storage Conditions on Urinary Volatilomes for Their Reliability in Disease Diagnosis. Am. J. Clin. Exp. Urol. 2023, 11, 481–499. [Google Scholar] [PubMed]
  65. Noriega Landa, E.; Quaye, G.E.; Su, X.; Badmos, S.; Holbrook, K.L.; Polascik, T.J.; Adams, E.S.; Deivasigamani, S.; Gao, Q.; Annabi, M.H.; et al. Urinary Fatty Acid Biomarkers for Prostate Cancer Detection. PLoS ONE 2024, 19, e0297615. [Google Scholar] [CrossRef]
  66. David, F.; Ochiai, N.; Sandra, P. Two Decades of Stir Bar Sorptive Extraction: A Retrospective and Future Outlook. TrAC-Trends Anal. Chem. 2019, 112, 102–111. [Google Scholar] [CrossRef]
  67. Skaggs, C.S.; Logue, B.A. Ultratrace Analysis of Per-and Polyfluoroalkyl Substances in Drinking Water Using Ice Concentration Linked with Extractive Stirrer and High Performance Liquid Chromatography—Tandem Mass Spectrometry. J. Chromatogr. A 2021, 1659, 462493. [Google Scholar] [CrossRef]
  68. Aparicio, I.; Martín, J.; Santos, J.L.; Malvar, J.L.; Alonso, E. Stir Bar Sorptive Extraction and Liquid Chromatography–Tandem Mass Spectrometry Determination of Polar and Non-Polar Emerging and Priority Pollutants in Environmental Waters. J. Chromatogr. A 2017, 1500, 43–52. [Google Scholar] [CrossRef]
  69. Villaverde-de-Sáa, E.; Racamonde, I.; Quintana, J.B.; Rodil, R.; Cela, R. Ion-Pair Sorptive Extraction of Perfluorinated Compounds from Water with Low-Cost Polymeric Materials: Polyethersulfone vs Polydimethylsiloxane. Anal. Chim. Acta 2012, 740, 50–57. [Google Scholar] [CrossRef]
  70. Yao, X.; Zhou, Z.; He, M.; Chen, B.; Liang, Y.; Hu, B. One-Pot Polymerization of Monolith Coated Stir Bar for High Efficient Sorptive Extraction of Perfluoroalkyl Acids from Environmental Water Samples Followed by High Performance Liquid Chromatography-Electrospray Tandem Mass Spectrometry Detection. J. Chromatogr. A 2018, 1553, 7–15. [Google Scholar] [CrossRef]
  71. US EPA. Definition and Procedure for the Determination of the Method Detection Limit—Revision 1.11; EPA 821-R-16-006; US EPA: Washington, DC, USA, 2016; pp. 1–8. [Google Scholar]
  72. Nogueira, J.M.F. Stir-Bar Sorptive Extraction: 15 Years Making Sample Preparation More Environment-Friendly. TrAC-Trends Anal. Chem. 2015, 71, 214–223. [Google Scholar] [CrossRef]
  73. Moody, C.A.; Field, J.A. Determination of Perfluorocarboxylates in Groundwater Impacted by Fire-Fighting Activity. Environ. Sci. Technol. 1999, 33, 2800–2806. [Google Scholar] [CrossRef]
  74. Scott, B.F.; Moody, C.A.; Spencer, C.; Small, J.M.; Muir, D.C.G.; Mabury, S.A. Analysis for Perfluorocarboxylic Acids/Anions in Surface Waters and Precipitation Using GC-MS and Analysis of PFOA from Large-Volume Samples. Environ. Sci. Technol. 2006, 40, 6405–6410. [Google Scholar] [CrossRef] [PubMed]
  75. De Silva, A.O.; Muir, D.C.G.; Mabury, S.A. Distribution of Perfluorocarboxylate Isomers in Select Samples from the North American Environment. Environ. Toxicol. Chem. 2009, 28, 1801–1814. [Google Scholar] [CrossRef] [PubMed]
  76. Dufková, V.; Čabala, R.; Ševčík, V. Determination of C 5-C 12 Perfluoroalkyl Carboxylic Acids in River Water Samples in the Czech Republic by GC-MS after SPE Preconcentration. Chemosphere 2012, 87, 463–469. [Google Scholar] [CrossRef]
  77. Jurado-Sánchez, B.; Ballesteros, E.; Gallego, M. Semiautomated Solid-Phase Extraction Followed by Derivatisation and Gas Chromatography-Mass Spectrometry for Determination of Perfluoroalkyl Acids in Water. J. Chromatogr. A 2013, 1318, 65–71. [Google Scholar] [CrossRef] [PubMed]
  78. Li, Z.; Sun, H. Cost-Effective Detection of Perfluoroalkyl Carboxylic Acids with Gas Chromatography: Optimization of Derivatization Approaches and Method Validation. Int. J. Environ. Res. Public Health 2020, 17, 100. [Google Scholar] [CrossRef]
  79. Ji, Y.; Cui, Z.; Li, X.; Wang, Z.; Zhang, J.; Li, A. Simultaneous Determination of Nine Perfluoroalkyl Carboxylic Acids by a Series of Amide Acetals Derivatization and Gas Chromatography Tandem Mass Spectrometry. J. Chromatogr. A 2020, 1622, 461132. [Google Scholar] [CrossRef]
Figure 1. Schematic representation of experimental approach with SBSE coupled to TD-GC-MS.
Water 16 02543 g001
Figure 2. Optimization of extraction time: instrument response (i.e., extraction recovery) of PFCAs with various extraction times. Error bars represent standard deviations of duplicate measurements.
Water 16 02543 g002
Figure 3. Optimization of stirring speed: the effect of stirring speed on PFCA extraction recovery. Error bars represent standard deviations of duplicate measurements.
Water 16 02543 g003
Figure 4. Optimization of solvent composition: the responses of PFCAs under various methanol compositions. Error bars represent standard deviations of duplicate measurements.
Water 16 02543 g004
Figure 5. Optimization of ionic strength: the effect of salt (NaCl) addition on PFCA extraction. Error bars represent standard deviations of duplicate measurements.
Water 16 02543 g005
Figure 6. Optimization of pH: the influence of pH on PFCA extraction. Error bars represent standard deviations of duplicate measurements.
Water 16 02543 g006
Table 1. List of the studied PFCAs.
Compound NameAcronymMolecular FormulaMolecular WeightCAS No.
1Perfluoroheptanoic acidPFHpAC7HF13O2364.06375-85-9
2Perfluorooctanoic acidPFOAC8HF15O2414.07335-67-1
3Perfluorononanoic acidPFNAC9HF17O2464.08375-95-1
4Perfluorodecanoic acidPFDAC10HF19O2514.08335-76-2
5Perfluoroundecanoic acidPFUnAC11HF21O2564.092058-94-8
6Perfluorododecanoic acidPFDoAC12HF23O2614.1307-55-1
7Perfluorotetradecanoic acidPFTeDAC14HF27O2714.11376-06-7
8Perfluorohexadecanoic acidPFHxDAC16HF31O2814.1367905-19-5
9Perfluorooctadecanoic acidPFODAC18HF35O2914.116517-11-6
Table 2. Performance parameters of SBSE-TD-GC-MS for PFCA analysis: linearity, recovery, and sensitivity data.
AnalyteRetention Time (min)Parent
Ion (m/z)
Coefficient of Determination
(R2)
% Recovery
(±SD)
LOD (ng/L)LOQ (ng/L)MDL (ng/L)
PFHpA5.8844050.998497 (±11)21.17138.27293.96
PFOA6.6404550.994894 (±11)21.20103.13495.37
PFNA7.6145050.995686 (±5)30.1290.80980.37
PFDA8.4485550.989391 (±10)54.29169.85888.30
PFUnA9.4166050.989288 (±10)34.39132.901227.97
PFDoA10.0026550.992585 (±8)73.96192.011458.84
PFTeDA11.4227550.990685 (±3)35.02107.10925.13
PFHxDA12.7288550.998879 (±7)51.75128.33955.47
PFODA13.9439550.992977 (±6)42.0587.741148.09
Table 3. Analytical performance of SBSE-TD-GC-MS for PFCA detection compared with that of existing water analysis methods.
Sl No.Target PFCAsMatrix/SourcesDerivatizing AgentExtraction MethodSample VolumeInstrumentationRecovery %LOD (ng/L)Reference
1PFHxA, PFHpA, PFOA, PFDoAGroundwaterMethyl iodide, DiazomethaneSPE200 mLGC-ECNI-MS35–9018–36 µg/L[73]
2PFBA, PFPeA, PFHxA, PFHpA, PFOA, PFNA, PFDA, PFUnA, PFDoAWastewater, SeawaterTetrabutylammonium, Butanol, Thionyl chlorideIP-SPME5 mLGC–NCI-MS35–9020–750[61]
3TFA, PFPrA, PFBA, PFPeA, PFHxA, PFHpA, PFOA, PFNA, PFDA, PFUnA, PFDoASurface water, Lake water, Sewage WTP, Precipitation2,4-difluoroaniline and N, N-dicyclohexylcarbodiimideSPE300 mLGC-EI-MS25–1370.01–0.5[74]
4PFHxA, PFHpA, PFOA, PFNA, PFDA, PFUnA, PFDoARiver waterIsobutyl chloroformate, Pyridine, IsobutanolLLE500 mLGC-EI-MSN/A200–2200 µg/L[53]
5PFOA, PFNA, PFDA, PFUnA, PFDoASurface water, Precipitation2,4-difluoroaniline and DCCIP-LLE500 mLGC-NCI-MS91–980.3–5.9[75]
6PFHxA, PFHpA, PFOA, PFNA, PFDA, PFUnA, PFDoARiver waterPropyl chloroformate, PropanolHS-SPME10 mLGC–QqQ–MS/MS84.4–116.80.08–6.6[62]
7PFPeA, PFHxA, PFHpA, PFOA, PFNA, PFDA, PFUnA, PFDoARiver WaterIsobutyl chloroformate, Pyridine, IsobutanolSPE250 mLGC-NCI-MS53–1110.1–24[76]
8PFHpA, PFOA, PFNA, PFDASurface waterTetrabutylammonium hydrogen sulfateIP-DLLME10 mLGC-NCI-MS/MS95–9837–51[3]
9PFHxA, PFHpA, PFOA, PFNA, PFDA, PFUnADrinking water/wastewaterIsobutyl chloroformate, DCC in Pyridine, IsobutanolSPE250 mLGC-DSQ II-MS94–980.1–0.5[77]
10PFPrA, PFBA, PFPeA, PFHxA, PFHpA, PFOA, PFNA, PFDA, PFUnA, PFDoAWastewaterTriethylsilanol, H2SO4SPE250 mLGC-EI-MS93–1084–48[57]
11PFHpA, PFOA, PFNA, PFDA, PFUnA, PFDoA, PFTeARiver water, Lake waterIsobutyl chloroformate, Pyridine, IsobutanolDLLME1 mLGC-EI-MS83.7–1170.9–3[54]
12PFBA, PFPeA, PFHxA, PFHpA, PFOA, PFNA, PFDA, PFUnA, PFDoASurface water2,4-difluoroaniline and DCCSPE500 mLGC-µECD62–1181140–6320[78]
13PFHxA, PFHpA, PFOA, PFNA, PFDA, PFUnA, PFDoATap water2,3,4,5,6- pentafluorobenzyl bromideSPE500 mLGC-EI-MS40.1–101.80.1–0.28[79]
14TFA, PFPrA, PFBA, PFPeA, PFHxA, PFHpA, PFOA, PFNA, PFDA, PFUnA, PFDoA, PFTrDA, PFTeDATap water, Precipitation, Ocean waterDiphenyl diazomethaneSPE250 mLGC-ECNI-MS83–1300.06–14.6[13]
15PFHpA, PFOA, PFNA, PFDA, PFUnA, PFDoA, PFTeDA, PFHxDA, PFODAWastewater, Tap waterIsobutyl chloroformate, Isobutanol, PyridineSBSE1 mLGC-EI-MS47–9721.17–73.96This work
Table 4. Method repeatability test in D.I. water and tap water at two spiking levels, 100 ng/L and 1000 ng/L, (n = 7).
Repeatability (RSD %; n = 7)
AnalyteD.I. WaterTap Water
100 ng/L1000 ng/L100 ng/L1000 ng/L
PFHpA8.6%6.5%13.1%9.7%
PFOA13.3%10.3%9.4%8.6%
PFNA10.0%9.5%11.4%7.2%
PFDA6.2%8.2%12.3%6.2%
PFUnA12.5%10.2%9.6%12.5%
PFDoA13.4%12.1%7.8%12.0%
PFTeDA12.9%8.3%8.9%10.2%
PFHxDA11.6%12.7%12.0%9.0%
PFODA6.7%9.6%12.8%9.4%
Table 5. Results of spiked recoveries of target PFCAs in tap water, wastewater influent, and wastewater effluent samples at two spiking levels (10 ng and 20 ng). Results are shown as % recovery (±SD); (n = 2).
Tap WaterWastewater InfluentWastewater Effluent
Analyte10 ng20 ng10 ng20 ng10 ng20 ng
PFHpA68 (±8)81 (±7)29 (±12)27 (±9)45 (±8)64 (±11)
PFOA74 (±5)77 (±13)31 (±7)26 (±8)46 (±7)53 (±3)
PFNA75 (±6)73 (±10)35 (±4)21 (±7)59 (±12)44 (±11)
PFDA90 (±10)87 (±12)31 (±9)23 (±6)56 (±6)49 (±10)
PFUnA69 (±3)61 (±1)29 (±9)29 (±10)43 (±6)45 (±11)
PFDoA82 (±13)93 (±7)32 (±6)27 (±9)56 (±11)65 (±10)
PFTeDA85 (±15)96 (±6)41 (±10)30 (±6)53 (±4)74 (±8)
PFHxDA84 (±8)93 (±1)44 (±11)31 (±10)57 (±11)62 (±6)
PFODA82 (±8)92 (±6)42(±2)24 (±10)65 (±14)61 (±10)
Disclaimer/Publisher’s Note: The statements, opinions and data contained in all publications are solely those of the individual author(s) and contributor(s) and not of MDPI and/or the editor(s). MDPI and/or the editor(s) disclaim responsibility for any injury to people or property resulting from any ideas, methods, instructions or products referred to in the content.

