Article

Spatiotemporal Dynamics of Ecosystem Water Yield Services and Responses to Future Land Use Scenarios in Henan Province, China

1
College of Resources and Environmental Sciences, Henan Agricultural University, Zhengzhou 450002, China
2
Center for Land and Rural Sustainable Development Research, Henan Agricultural University, Zhengzhou 450002, China
3
College of Landscape Architecture and Art, Henan Agricultural University, Zhengzhou 450002, China
*
Author to whom correspondence should be addressed.
Water 2024, 16(17), 2544; https://doi.org/10.3390/w16172544
Submission received: 16 July 2024 / Revised: 27 August 2024 / Accepted: 6 September 2024 / Published: 9 September 2024
(This article belongs to the Special Issue Prediction and Assessment of Hydrological Processes)

Abstract

:
Water yield (WY) service is the cornerstone of ecosystem functionality. Predicting and assessing the impact of land use/land cover (LULC) changes on WY is imperative for a nation’s food security, regional economic development, and ecological environmental protection. This study aimed to evaluate the water yield (WY) service in Henan Province, China, using high-resolution (30 m) remote sensing land use monitoring data from four study years: 1990, 2000, 2010, and 2020. It also utilized the PLUS model to predict the characteristics of LULC evolution and the future trends of WY service under four different development scenarios (for 2030 and 2050). The study’s results indicated the following: (1) From 1990 to 2020, the Henan Province’s WY first increased and then decreased, ranging from 398.56 × 10⁸ m3 to 482.95 × 10⁸ m3. The southern and southeastern parts of Henan Province were high-value WY areas, while most of its other regions were deemed low-value WY areas. (2) The different land use types were ranked in terms of their WY capacity, from strongest to weakest, as follows: unused land, cultivated land, grassland, construction land, woodland, and water. (3) The four abovementioned scenarios were ranked, from highest to lowest, based on the Henan’s total WY (in 2050) in each of them: high-quality development scenario (HDS), business-as-usual scenario (BAU), cultivated land protection scenario (CPS), and ecological protection scenario (ES). This study contributes to the advancement of ecosystem services research. Its results can provide scientific support for water resource management, sustainable regional development, and comprehensive land-use planning in Henan Province.

1. Introduction

Water resources are crucial for human survival and socioeconomic development. Over the past decades, the rapid development of human society and the expansion of the global economy have led to the deterioration of water environments. The resultant and increasingly prominent conflicts between water supply and demand have, in turn, hindered food production and energy development across the world [1]. Nowadays, many nations are grappling with severe (and worsening) water scarcity challenges [2,3]. In ecological studies, regarding numerous ecological service functions, water yield (WY) holds considerable value. WY influences various ecological functions such as biomass, carbon cycling, and sediment output; it [4] is instrumental in maintaining human production and livelihoods while simultaneously promoting regional sustainability [5,6]. WY is influenced by various factors, including land use/land cover (LULC) change, climate [7], hydrological processes [8], human activities [9], and ecosystem degradation [10].
Among these, LULC change is a key factor that impacts an ecosystem’s WY service. Generally, the LULC changes caused by human activities affect (directly as well as indirectly) a region’s natural environment, ecological processes, water resource utilization, sustainability of water production, and soil and water conservation. These changes also affect the availability of food and water with respect to socioeconomic growth. The question of how a region’s WY may respond to future changes in its LULC is an extensively debated topic in contemporary research in the fields of geography and ecology [11]. Thus, one must study the changes in the spatial and temporal patterns of WY in various regions of the world under different scenarios; such studies will help predict the future output of various water resources, formulate corresponding coping strategies for their utilization and protection, and promote their sustainable utilization and management.
Currently, research on WY primarily employs evaluation methods based on value or physical quantities [12]. Value-based evaluation methods are subjective when one considers the role of ecosystem services in the environment. Thus, they are unsuitable for a comprehensive assessment of WY. On the other hand, physical quantity assessment objectively evaluates ecosystems by considering their structure, functions, and ecological processes [13]. Moreover, with the rapid advancement of hydrological models, recent studies have started utilizing modeling and simulation methods to analyze and evaluate regional WY capabilities quantitatively as well as visually. Such hydrological models include the InVEST model [14], the SWAT model [15,16], and the ARIES model [17]. Among them, the InVEST model is used to quantify ecosystem services and simulate the hydrological cycle in various ecosystems. It assesses the production and distribution of water resources and is characterized by the simplicity of its model parameters as well as the relatively small amount of requisite data. Hence, lots of studies have used the InVEST model to conduct quantitative assessments of water production in regional ecosystems. These assessments include studies on the spatiotemporal distribution changes of WY [18], the impact of LULC on WY services [19], analyses of the effects of urbanization on WY under economic development [20], and evaluations of the driving factors of WY [21,22,23]. Such studies have validated the applicability of the InVEST model in different geographical contexts, thus providing strong support for water resource management in the global ecosystem.
Changes in LULC affect the watershed’s hydrological cycles, evaporation, infiltration processes, and water retention patterns, thereby profoundly impacting its WY [22,24]. Therefore, the accurate prediction of a region’s future LULC changes and the modeling of its WY response are integral to the rational use and conservation of water resources and the promotion of its ecosystem’s sustainable development. In this respect, the commonly used LULC prediction models include the cellular automaton (CA)–Markov [25,26], the CLUE-S model [27,28], and the FLUS model [29]. However, these models are limited in their simulation of the spatiotemporal evolution of different LULC types, especially at the patch scale; they make it difficult to effectively simulate changes at the patch level [30]. The PLUS model, on the other hand, possesses the advantages of high simulation accuracy and rapid data processing, enabling the effective simulation of complex evolution processes of multiple land cover types [31]. Scholars have begun to combine the InVEST model with the PLUS model to conduct quantitative research on regional WY across different historical and future periods [32,33,34], thus understanding and accurately assessing the potential impacts of socio-economic development, climate change, and LULC change on ecosystem WY services. This approach addresses the limitations of the single InVEST model, which cannot effectively simulate and predict WY across different future periods, thereby providing a basis for land-use planning and future water resource management. However, long-term, large-scale studies are still relatively scarce.
To elaborate on the study area, Henan Province is situated in the central-eastern part of China and in the southern region of the North China Plain. It is located in the middle and lower reaches of the Yellow River and is a crucial component of China’s national strategy for ecological protection and high-quality development in the Yellow River Basin [35]. As the main grain-producing area in China, Henan grapples with acute human-land conflicts. It faces severe water shortages, with only 381 m³ of water per capita in this province [36]. Here, the rising demand for water in agriculture, industry, and daily life has made the disparity between water supply and demand more pronounced. In addition, the province frequently faces threats from natural disasters such as floods and droughts. In this context, the 2021–2035 land space plan of Henan Province highlights the need to improve water conservation functions, enhance biodiversity protection measures, and preserve the province’s diverse ecological spaces for the benefit of future generations. Thus, a study of Henan’s WY is integral to the sustainable development, ecological protection, and disaster risk management in this province. In the future, with the implementation of “comprehensive land consolidation” and the “high-quality development” strategy, land use in Henan Province is bound to undergo significant changes. These changes will impact the hydrological cycle, thereby affecting WY and increasing the uncertainty and complexity of future hydrological cycles and WY responses. Therefore, there is an urgent need to study the spatial and temporal differentiation of WY in Henan Province and the response of WY to different future development scenarios. At present, current relevant studies are limited to specific areas regarding spatial characteristics of water conservation at the provincial, county, and watershed levels for specific years. There is still a lack of dynamic, long-term, and quantitative research considering future economic and social changes.
This study, focusing on Henan Province, utilizes the China annual land cover dataset in conjunction with the InVEST and PLUS models to simulate and analyze the province’s LULC changes and the corresponding WY responses over the 1990–2050 period. It elucidates the spatiotemporal evolution characteristics of WY in Henan, further providing scientific insights that can enhance its ecosystem WY services and promote the utilization and conservation of water resources in this province. The main objectives of this study include the following: (1) revealing the spatiotemporal evolution characteristics of WY service in Henan Province over the 1990–2020 period; (2) setting different development scenarios to predict the LULC in Henan in 2030 and 2050; (3) conducting simulated assessments of WY service levels in Henan in 2030 and 2050 under various development scenarios.

2. Materials and Methods
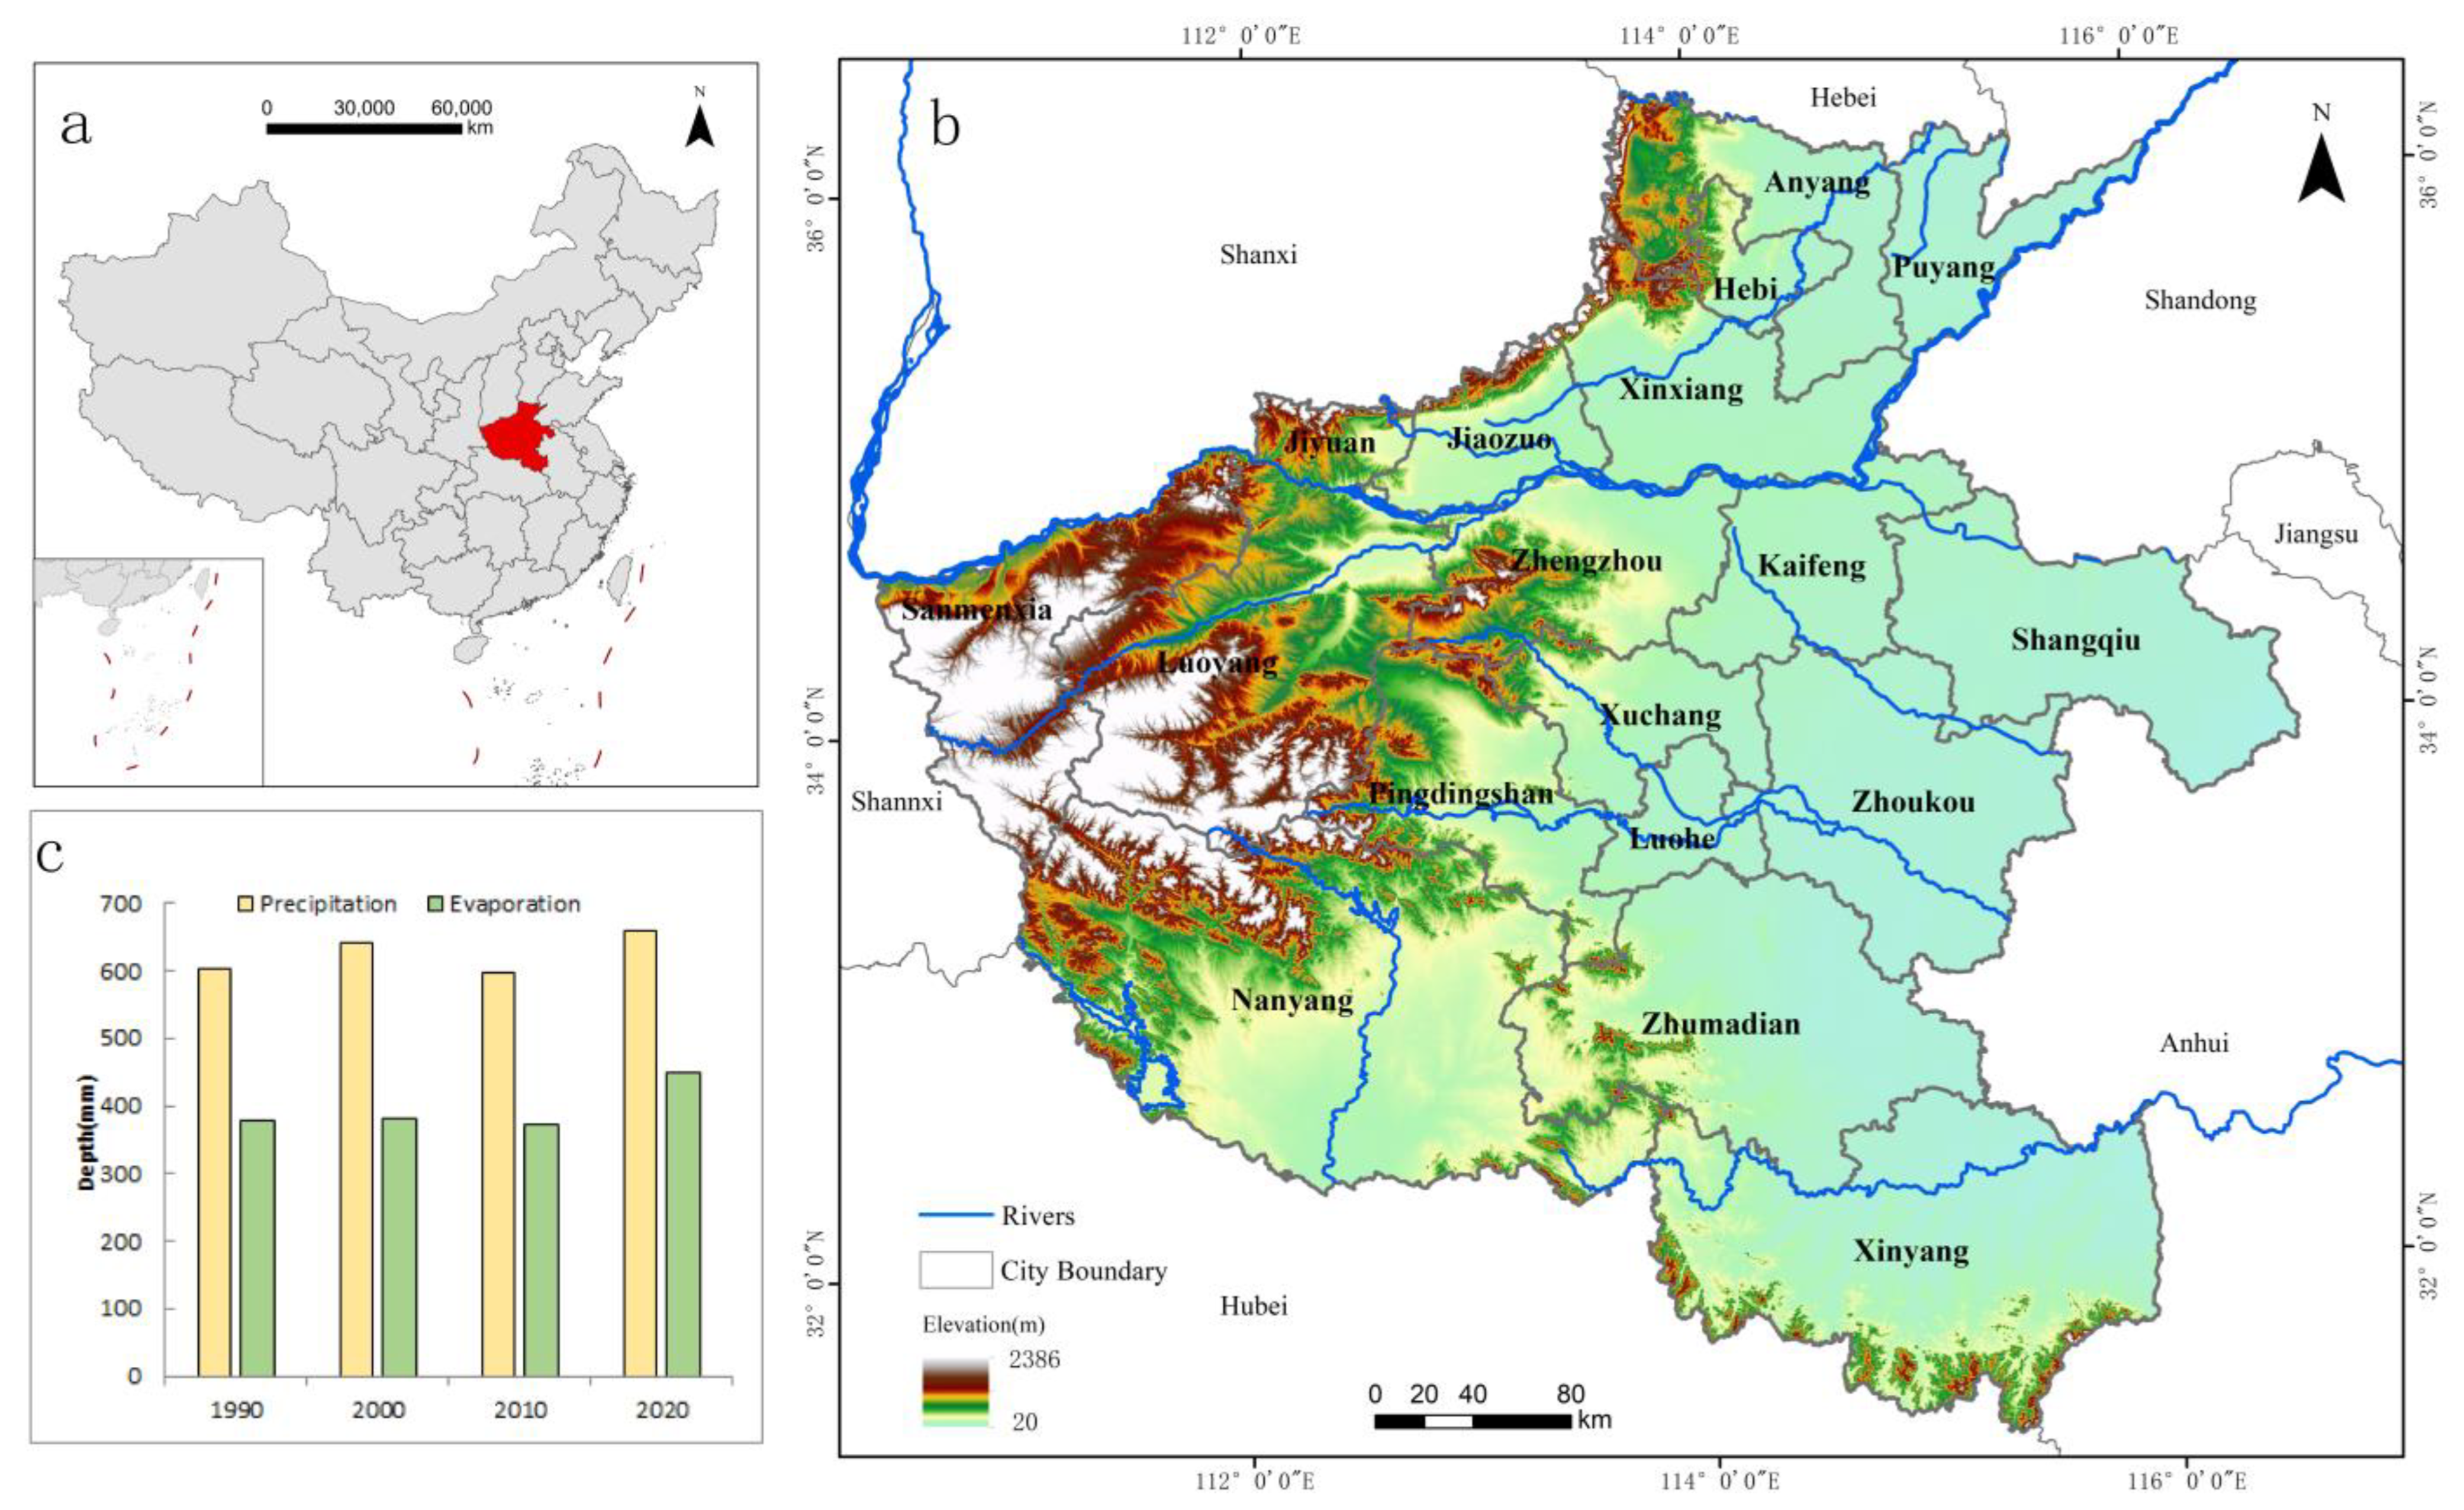
2.1. Study Area

The geographical location of Henan Province lies between latitudes 31°23′–36°22′ N and longitudes 110°21′–116°39′ E, covering a total land area of 167,000 km2 (Figure 1). The terrain is surrounded by mountains on three sides, with higher elevations in the west and south, and lower elevations in the east and north. The Funiu, Tongbai, and Dabie Mountains form a semicircular distribution along the provincial border. The elevation ranges from 20 to 2386 m, with an average elevation of 283 m [37]. Most of the province is in the warm temperate zone, whereas its southern part has a continental monsoon climate, transitioning from a subtropical to a warm temperate zone. Precipitation is unevenly distributed in the province throughout the year; the precipitation it receives in summer is relatively more than its winter precipitation [38]. During the period from 1990 to 2020, the province’s average annual precipitation is 625 mm, its average annual evapotranspiration is 395 mm, and its average multi-year water resources add up to 403.5 × 10⁸ m3. The soil types found in Henan mainly include luvisols, cambisols, and primosols; broad-leaved forests are deemed the dominant vegetation type throughout the province. Henan’s primary land use type is cultivated land, which accounts for 65.69% of the province’s total land area. Thus, Henan is an important grain-producing region in China that contributes 10% of its national grain output. Forest land and construction land follow, accounting for 17.87% and 14.17% of the total land area, respectively. By the end of 2023, the total population of Henan Province was 98.72 million (ranked third nationwide), and the GDP was 6.134505 trillion yuan (ranked fifth nationwide). As an important province in central China and the lower reaches of the Yellow River and upper reaches of the Huai River, Henan plays a crucial role in national environmental protection and sustainable economic development. Therefore, conducting studies on WY services and responses to future land use change scenarios in Henan Province is both typical and necessary.

2.2. Data Sources

Table 1 presents the LULC data relevant to this study, obtained from the China Annual Land Cover Dataset provided by Wuhan University. In this study, Henan Province’s LULC types were classified into six groups: cultivated land, woodland, grassland, water, construction land, and unused land. The biophysical parameters reflecting LULC and vegetation cover characteristics in the study area—LULC code, crop root depth, and crop evapotranspiration coefficient—were obtained from various sources, including existing research findings [39], crop reference values from the Food and Agriculture Organization of the United Nations (FAO), and parameters recommended by the InVEST model. These data were preprocessed using ArcGIS 10.2; the preprocessing phase involved cropping (based on the study area extent) and defining projections to generate datasets for four distinct study years: 1990, 2000, 2010, and 2020.

2.3. Methods

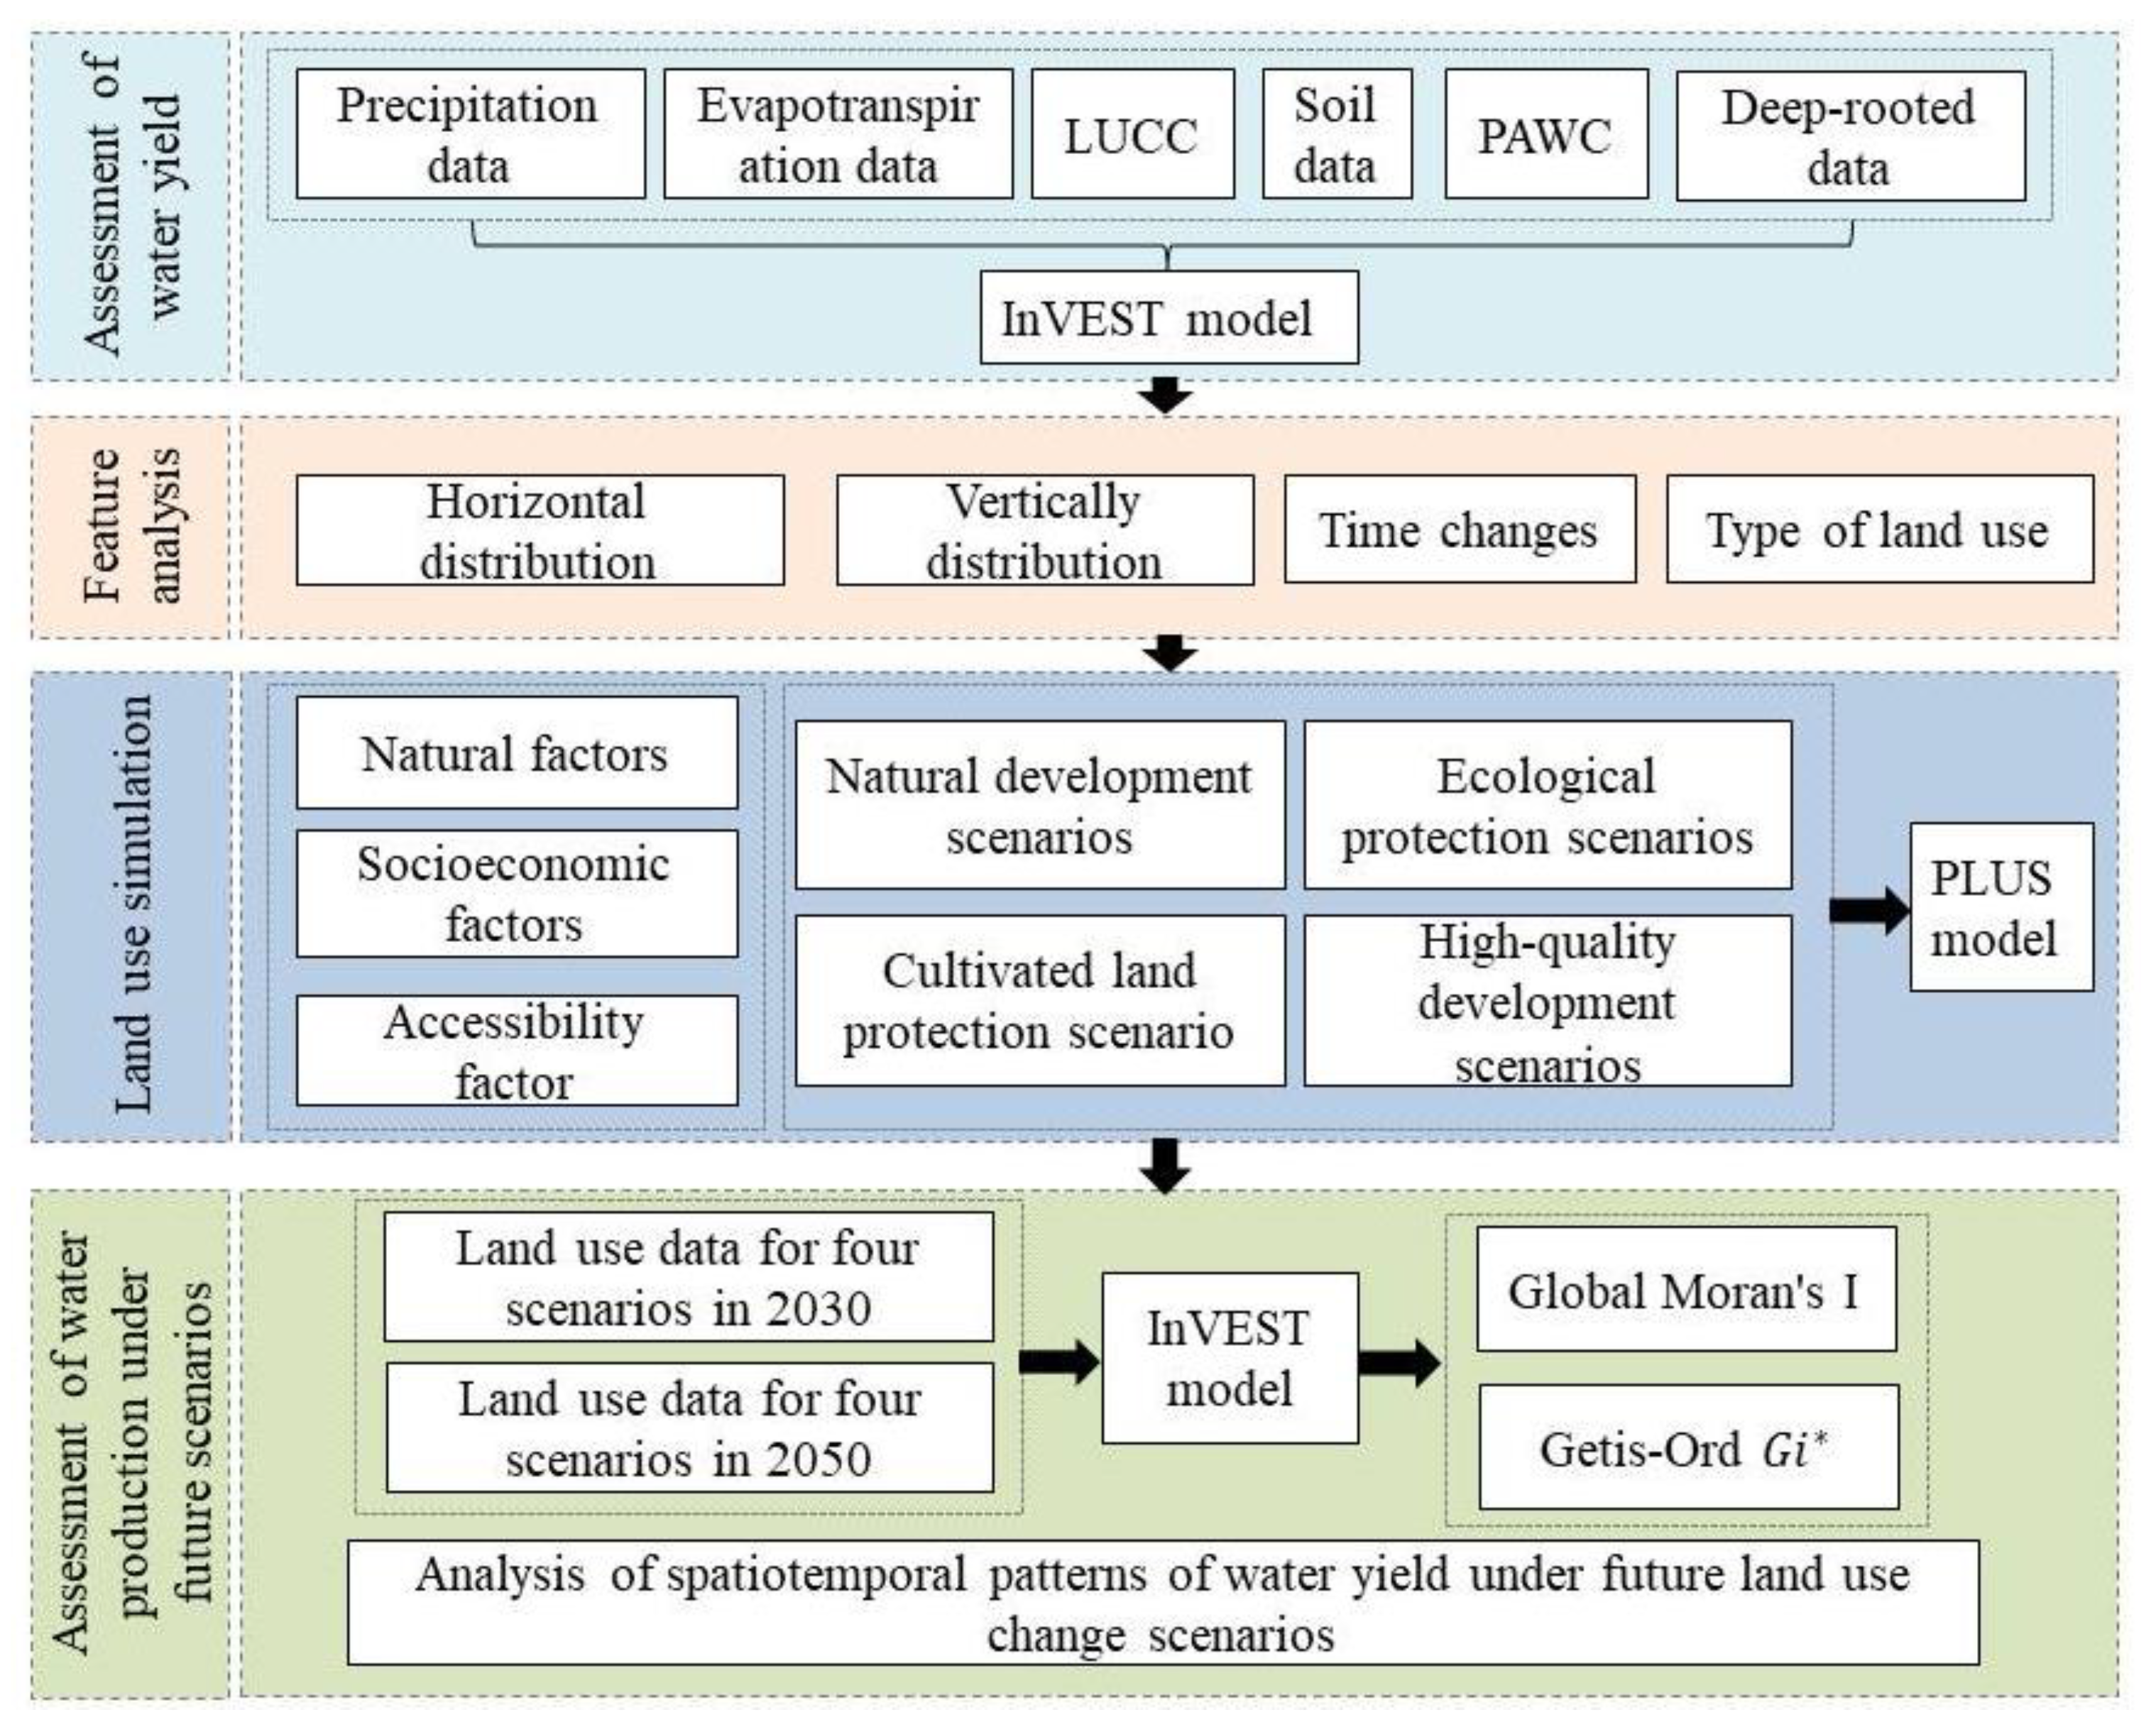
2.3.1. Technical Roadmap

The technical roadmap of this study is depicted in Figure 2. Considering the cumulative effects of LULC changes over time, this research uses a 10-year interval, selecting 1990, 2000, 2010, and 2020 as the specific study years to reveal the spatiotemporal distribution patterns of WY in Henan Province. First, the WY in Henan Province in 1990, 2000, 2010, and 2020 were evaluated by combining the study area’s meteorological, LULC, and soil data with the WY module of the InVEST model. The study’s subsequent analysis aimed to delineate the spatiotemporal variations in WY across Henan, encompassing the horizontal and vertical distribution, temporal dynamics, and comparative assessment of the province’s WY across different LULC types. Following this assessment, the PLUS model was employed to simulate the province’s LULC patterns in 2030 and 2050. Regarding the simulation, this study set up four different development scenarios: business-as-usual (BAU) scenario, cultivated land protection scenario (CPS), ecological scenario (ES), and high-quality development scenario (HDS). The temporal and spatial changes in WY under these future LULC change scenarios were analyzed using the LULC data derived from the respective simulations for 2030 and 2050. Finally, this study revealed the degree of autocorrelation in the province’s WY using the global Moran’s I index and a local hotspot analysis (Getis-Ord Gi* method).

2.3.2. InVEST Model WY Module

The InVEST model is used to quantify ecosystem services, simulate hydrological cycle processes within ecosystems, and evaluate a region’s WY and its allocation. Its WY module simulates WY according to the Budyko hydrothermal coupling formula and the water balance principle. Subtracting the actual evapotranspiration from the precipitation in each grid within a region, it obtains the corresponding WY of each grid. The formula for WY calculation is outlined as follows [40]:
Y x j = 1 A E T x j P x P x
where Y x j represents the annual WY of grid cell x in LULC type   j ,   P x is the annual precipitation of grid cell x , and A E T x j is the actual annual evapotranspiration of LULC type j on grid x , calculated as follows:
A E T x j P x = 1 + W x R x j 1 + W x R x j + 1 R x j
W x = Z A W C x P x
R x j = k x j E T 0 x P x
A W C x = M i n D s , D r × P A W C x
where R x j is the Budyko drying index (defined as the ratio of potential evapotranspiration to precipitation) of grid cell x in LULC type j , w x is a dimensionless non-physical parameter representing the soil properties under natural climatic conditions, and A W C x is the vegetative effective water content of grid x . Moreover, Z is the Zhang coefficient used to characterize seasonal precipitation. In Equation (4), k x j is the vegetation evapotranspiration coefficient of grid x in LULC type j , and E T 0 x denotes the reference evapotranspiration of grid x . Further, D s is the soil depth, D r is the rooting depth, and P A W C x is the vegetation available water of grid cell x .
To elaborate, the Zhang coefficient is a climatic seasonal factor that reflects the precipitation and hydrological characteristics of an area [41]. Its value can range from 1 to 30. By adjusting the Z value (Zhang coefficient), the InVEST model parameters can be fine-tuned to take the simulated values closer to the measured values. In this light, after repeatedly debugging the model parameters, this study found that when the Z factor was 16.5, the average runoff depth in Henan Province was 232.49 mm over many years (as simulated by the InVEST model for the 1990–2020 period). Importantly, the relative error with the average runoff depth of 239.07 mm, measured over many years, was found to be only 2.7%. This finding emphasized the reliability of the results that were obtained using the InVEST model.

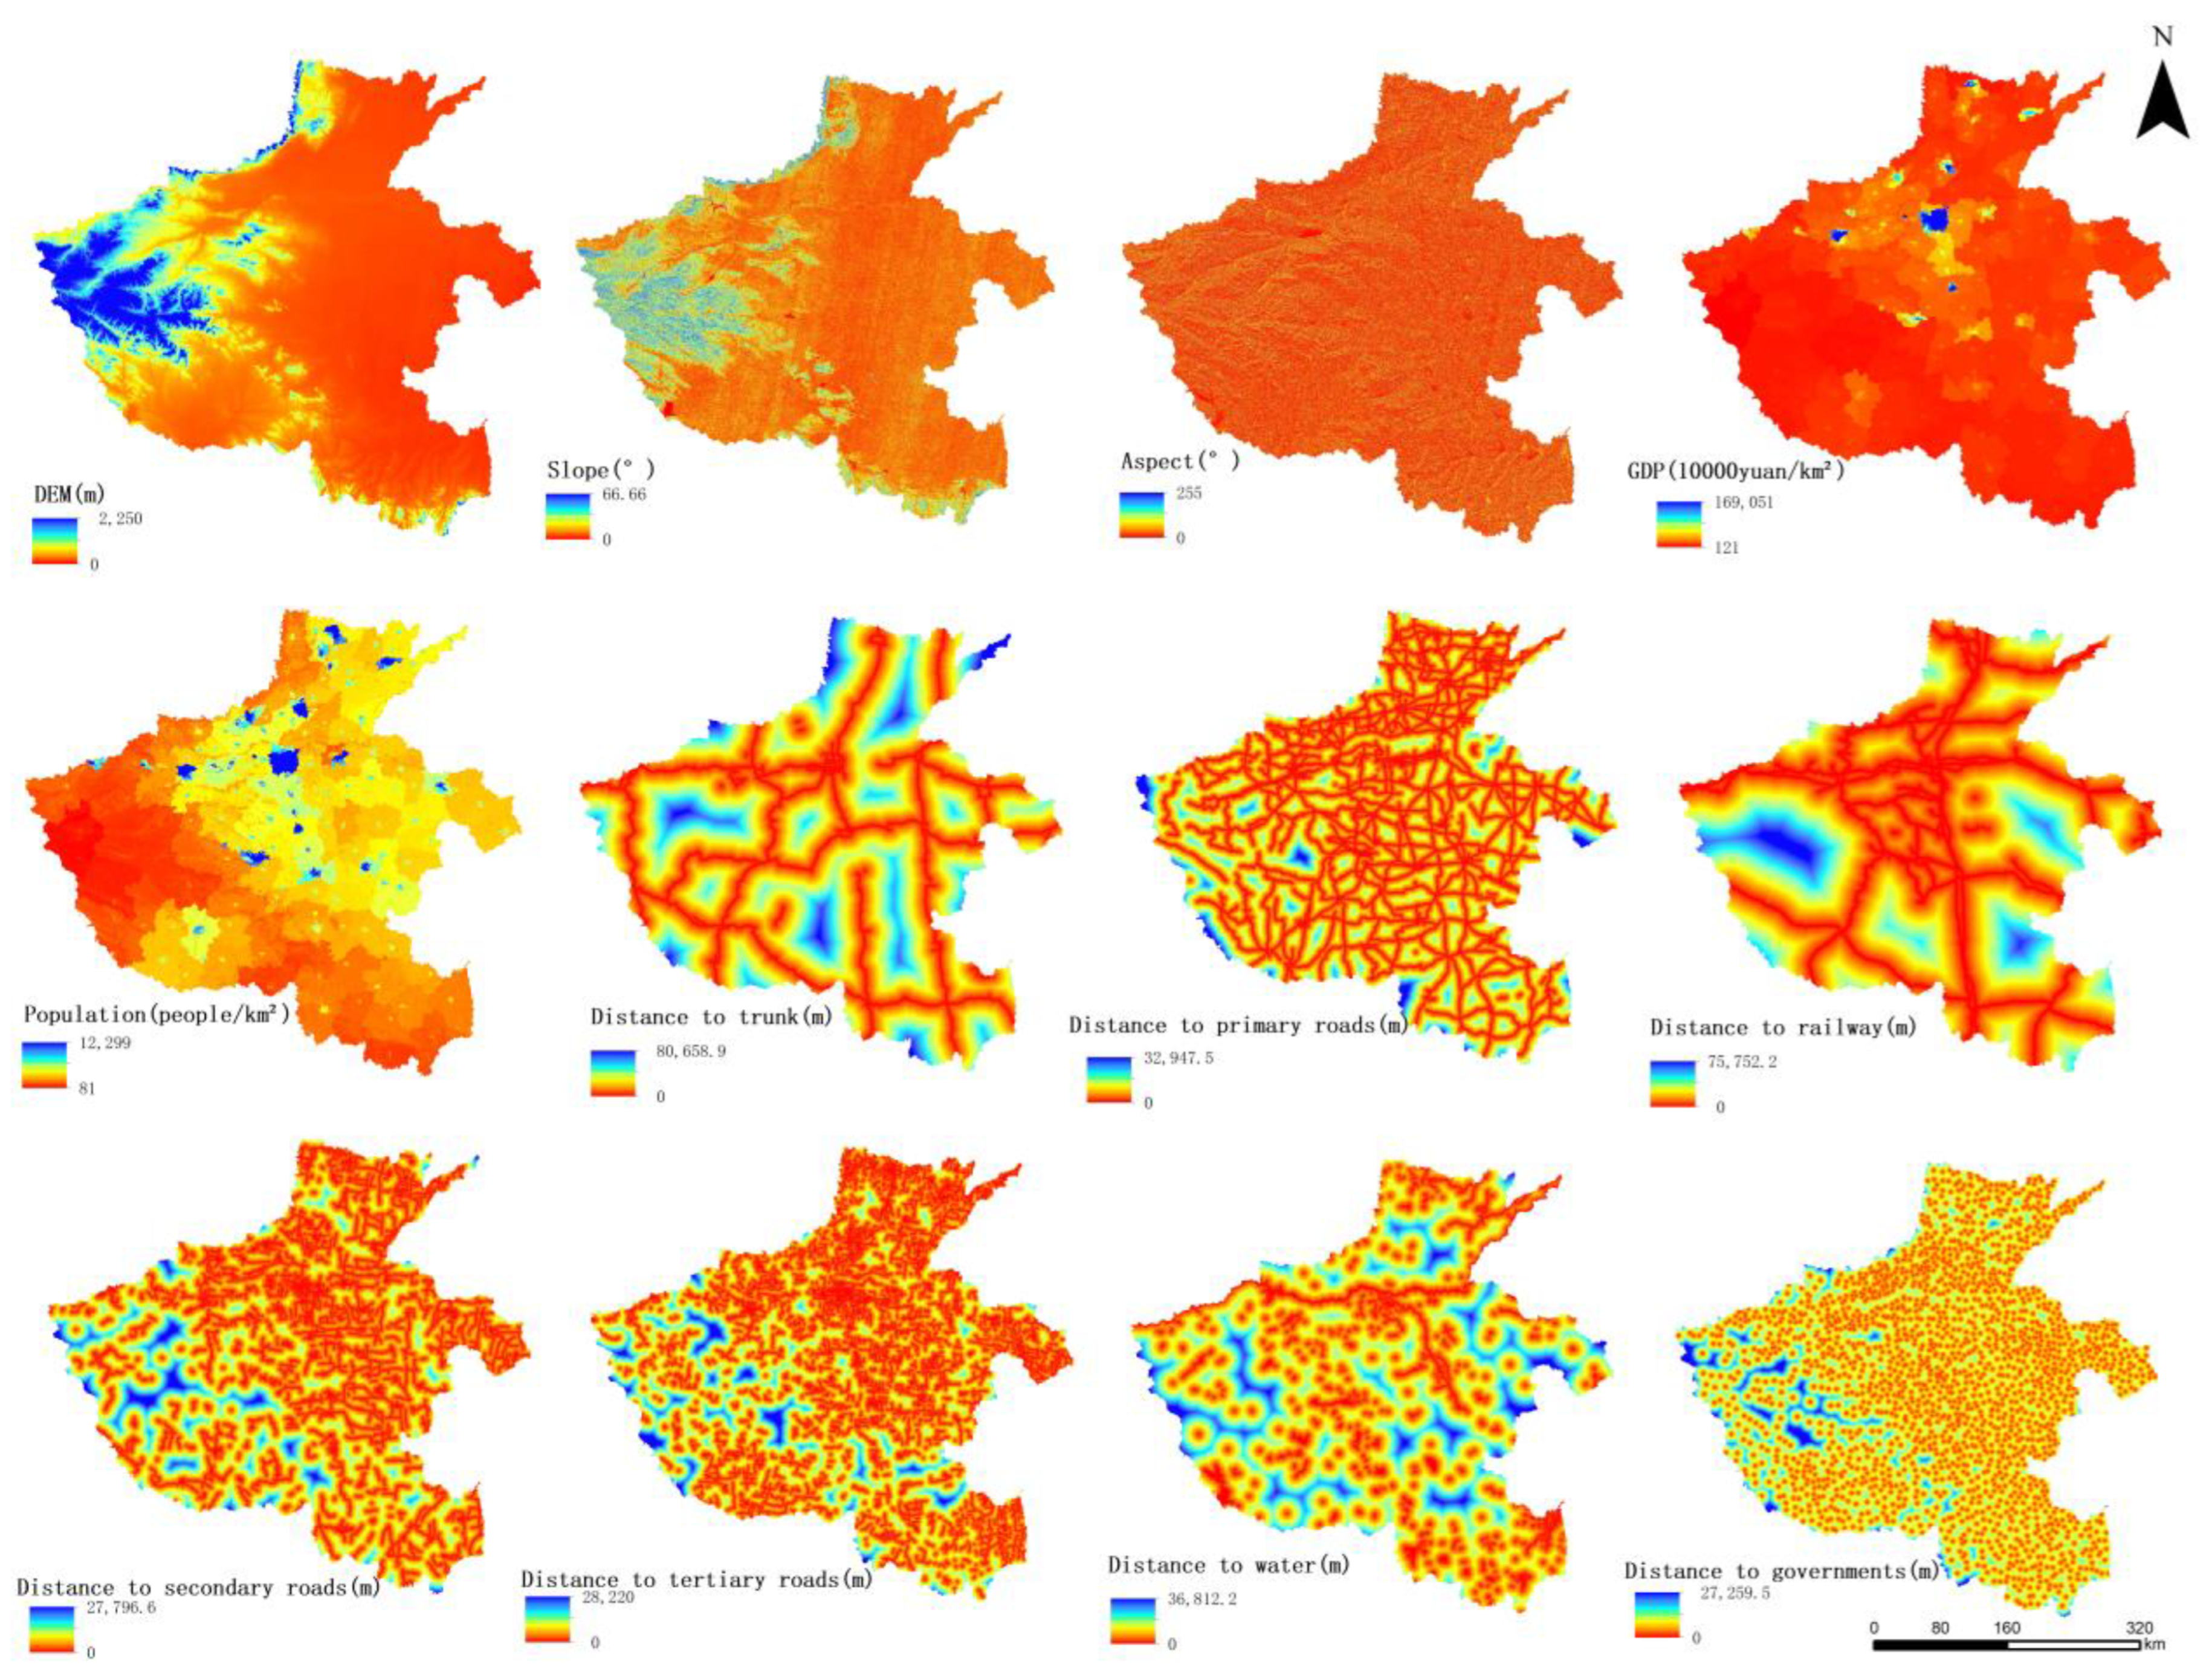
2.3.3. The PLUS Model

The PLUS model is an enhanced version of the CA model that builds on the FLUS model framework. Operating at the patch level, the PLUS model integrates policy-driven and guidance roles to achieve precise predictions of LULC types [30]. In this model, the initial LULC data from two distinct periods undergo formatting adjustments, which is followed by the extraction of initial LULC expansions toward the final cover within the land expansion analysis strategy (LEAS) module. To that end, this study meticulously selected 12 spatial driving factors in the Henan Province—including DEM, slope, aspect, gross domestic product (GDP), and population (POP), among others—considering the various factors encompassing natural landscapes, socioeconomic dimensions, and accessibility metrics (Figure 3). After each driving factor was input into the system, the random forest algorithm computed and output their development probabilities and contribution levels across diverse LULC categories. Concurrently, the CA random seeding (CARS) module was leveraged to simulate forthcoming land patterns by recognizing water bodies as constraining factors.
In the abovementioned context, the following four development scenarios were set [35]:
(1)
BAU: Under this scenario, this study observed that the development and change pattern observed in the 2010–2020 period would be maintained in the future; the changes in various LULC in Henan would be affected by natural conditions and economic factors, rather than by policies or other external factors.
(2)
CPS: Under this scenario, strict measures would be implemented to protect cultivated land. The probability matrix of land transfer would be revised based on the BAU scenario, revealing a 60% reduction in the probability of cultivated land being converted to construction land.
(3)
ES: Under this scenario, measures would be taken to reduce the probability (by 50%) of woodland areas, grassland areas, and water being converted to construction land. Additionally, the probability of cultivated land being converted to construction land would decrease by 30%. The saved area would be allocated for the conversion of cultivated land to woodland, promoting ecological conservation.
(4)
HDS: Under this scenario, the probability of woodland, grassland, and cultivated land areas being converted to construction land area would increase by 20%. Conversely, the probability of construction land area being converted to woodland, grassland, and unused land areas would reduce by 30%. Moreover, the conversion to cultivated land would decrease by 10%, aimed at high-quality and sustainable development outcomes.
Different land use types have different conversion rules under various scenarios, as shown in Table 2. Among them, 1 indicates that the land use type is allowed to be converted to other categories; 0 indicates that the land use type is not allowed to be converted to other categories.

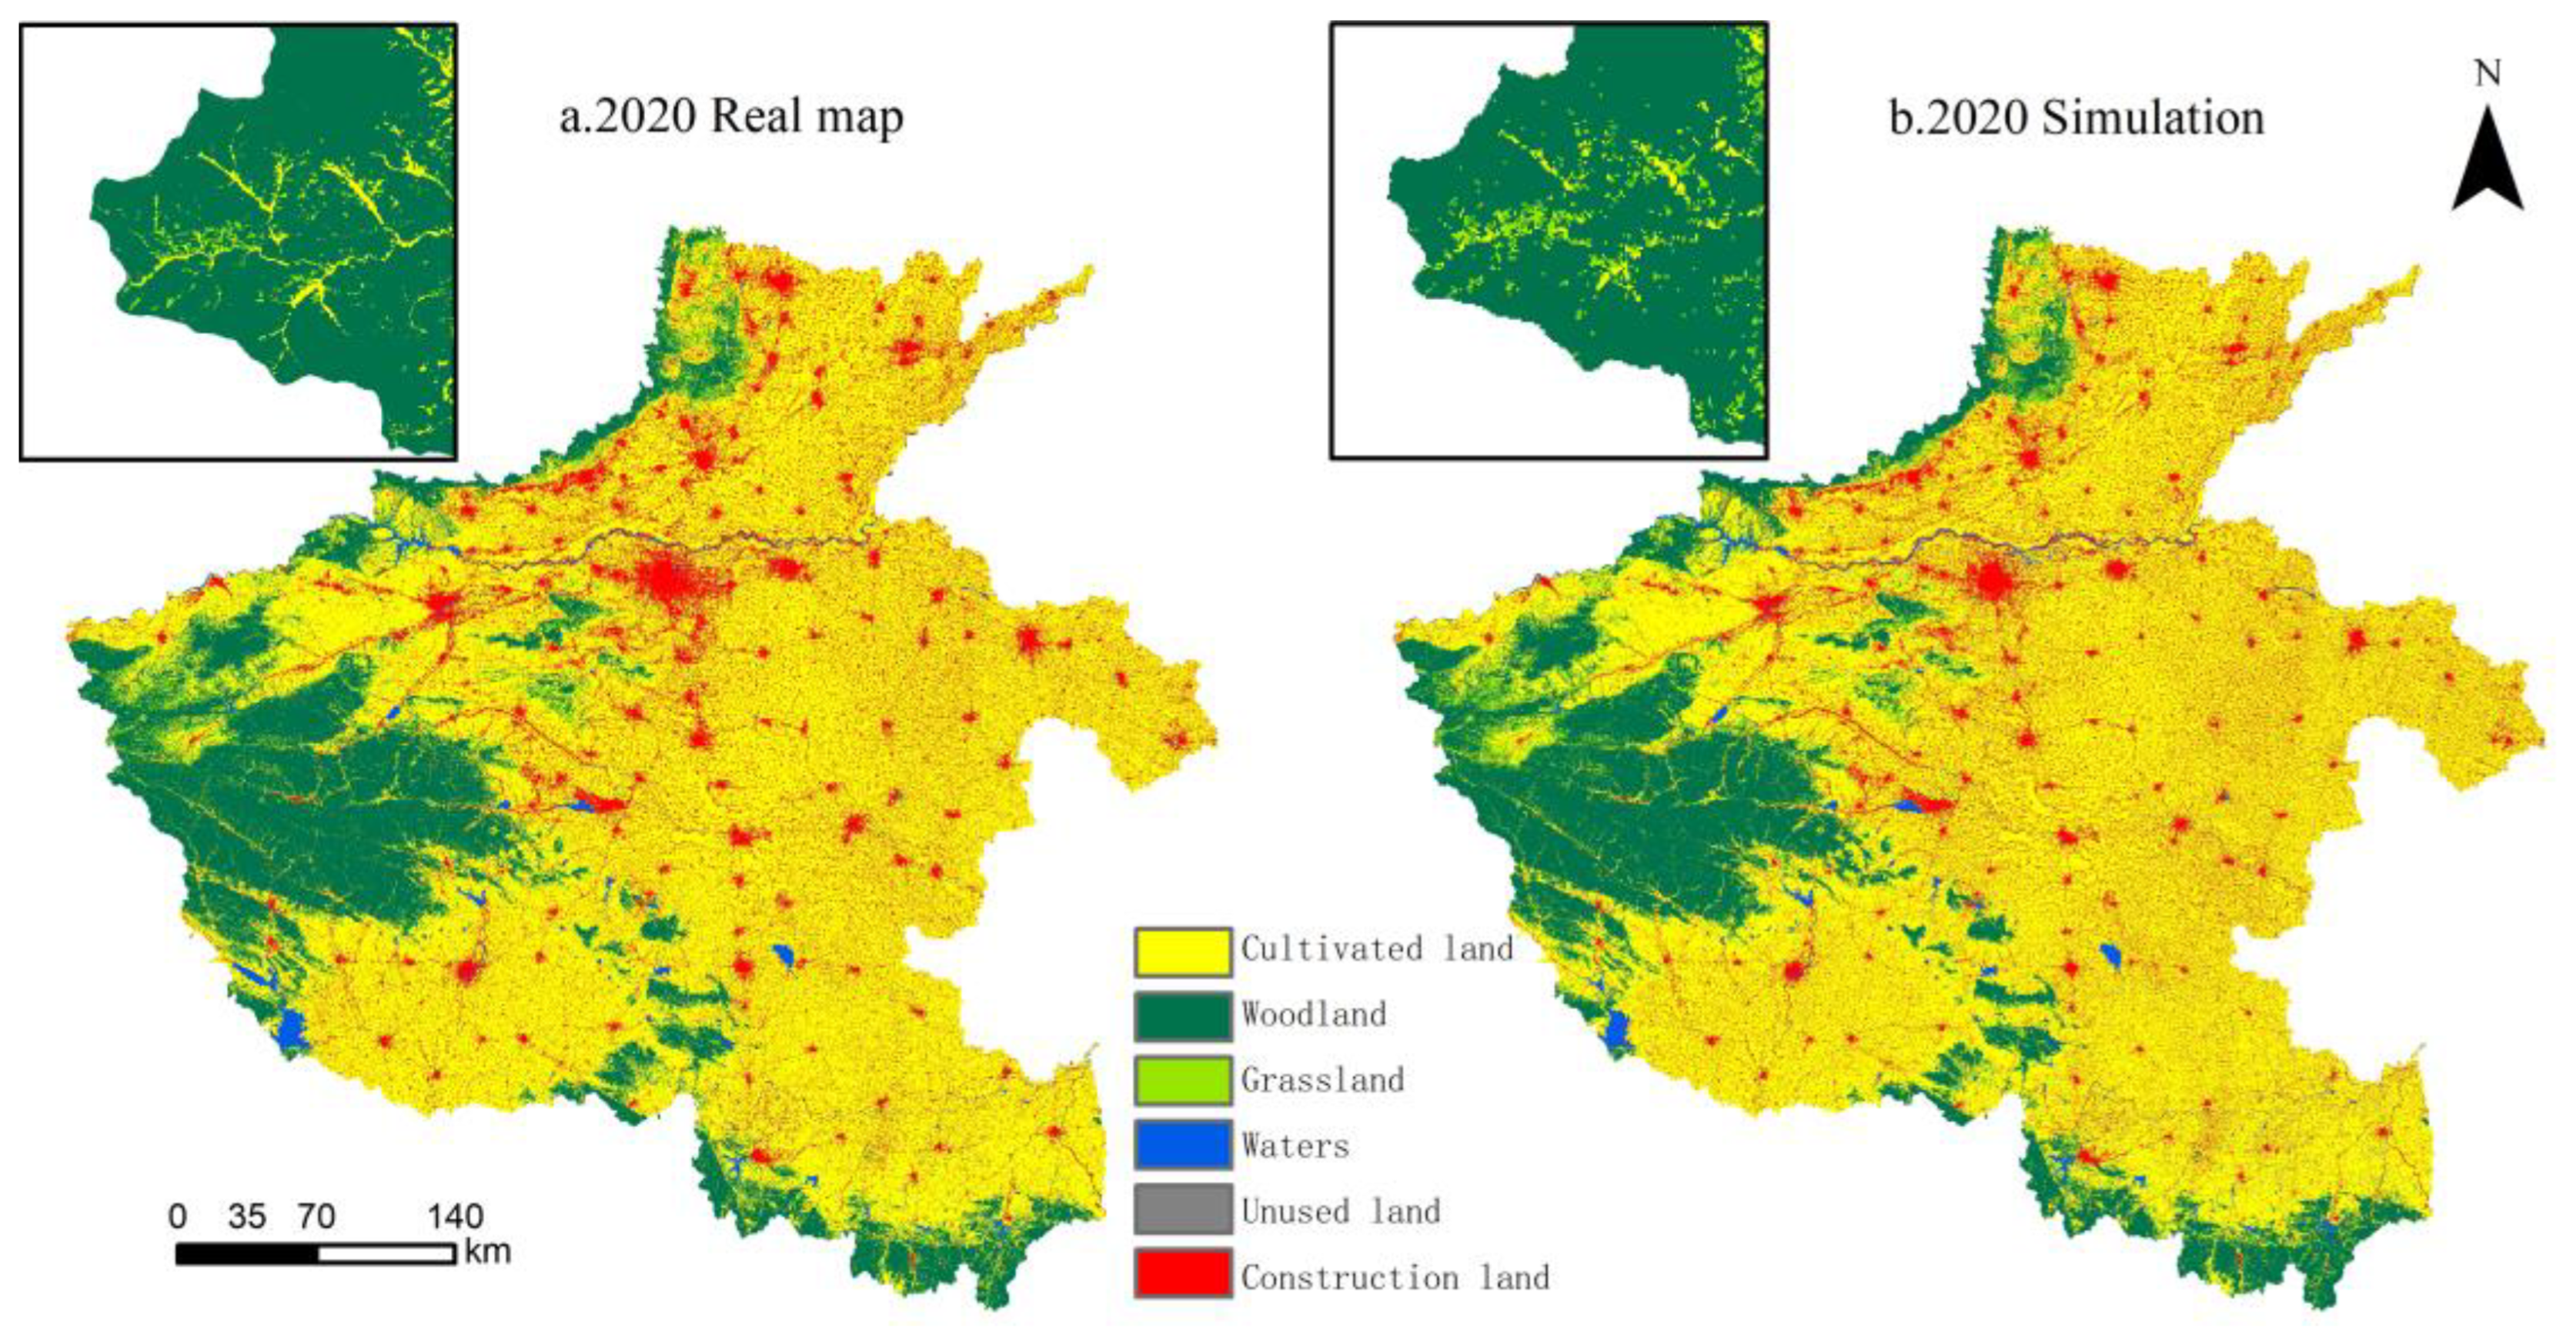
2.3.4. Model Validation

Taking 2000 as the initial year and 2010 as the final year, based on the study area’s LULC data in these two years, this study simulated and predicted its LULC changes in 2020. Subsequently, it verified the accuracy of the simulation results with regard to the province’s actual LULC situation in 2020 (Figure 4). The Kappa coefficient of the PLUS model’s calculated output was found to be 0.838, with an overall accuracy of 0.916. This finding indicated that the model’s simulation accuracy was high and its results were credible. Thereafter, considering 2020 as the initial year and based on the LULC data in this year, simulated and predicted Henan’s LULC situation in 2030 and 2050.

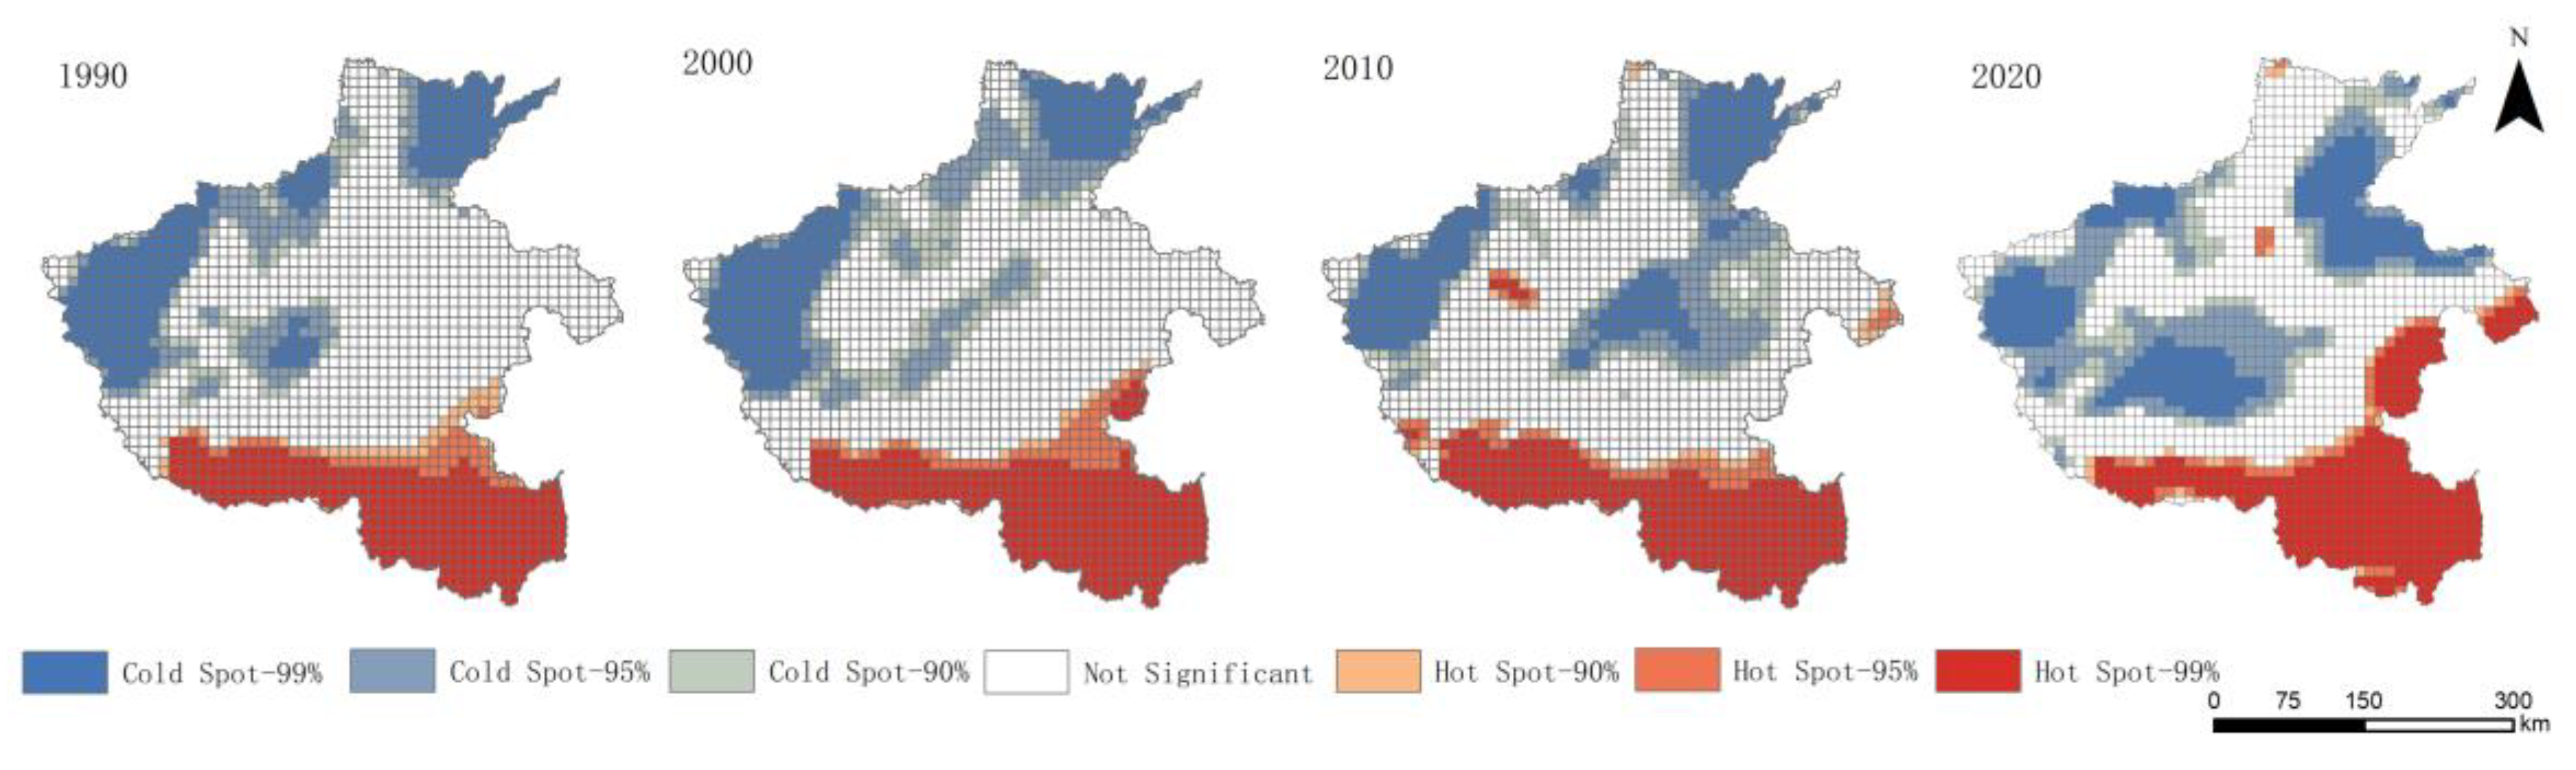
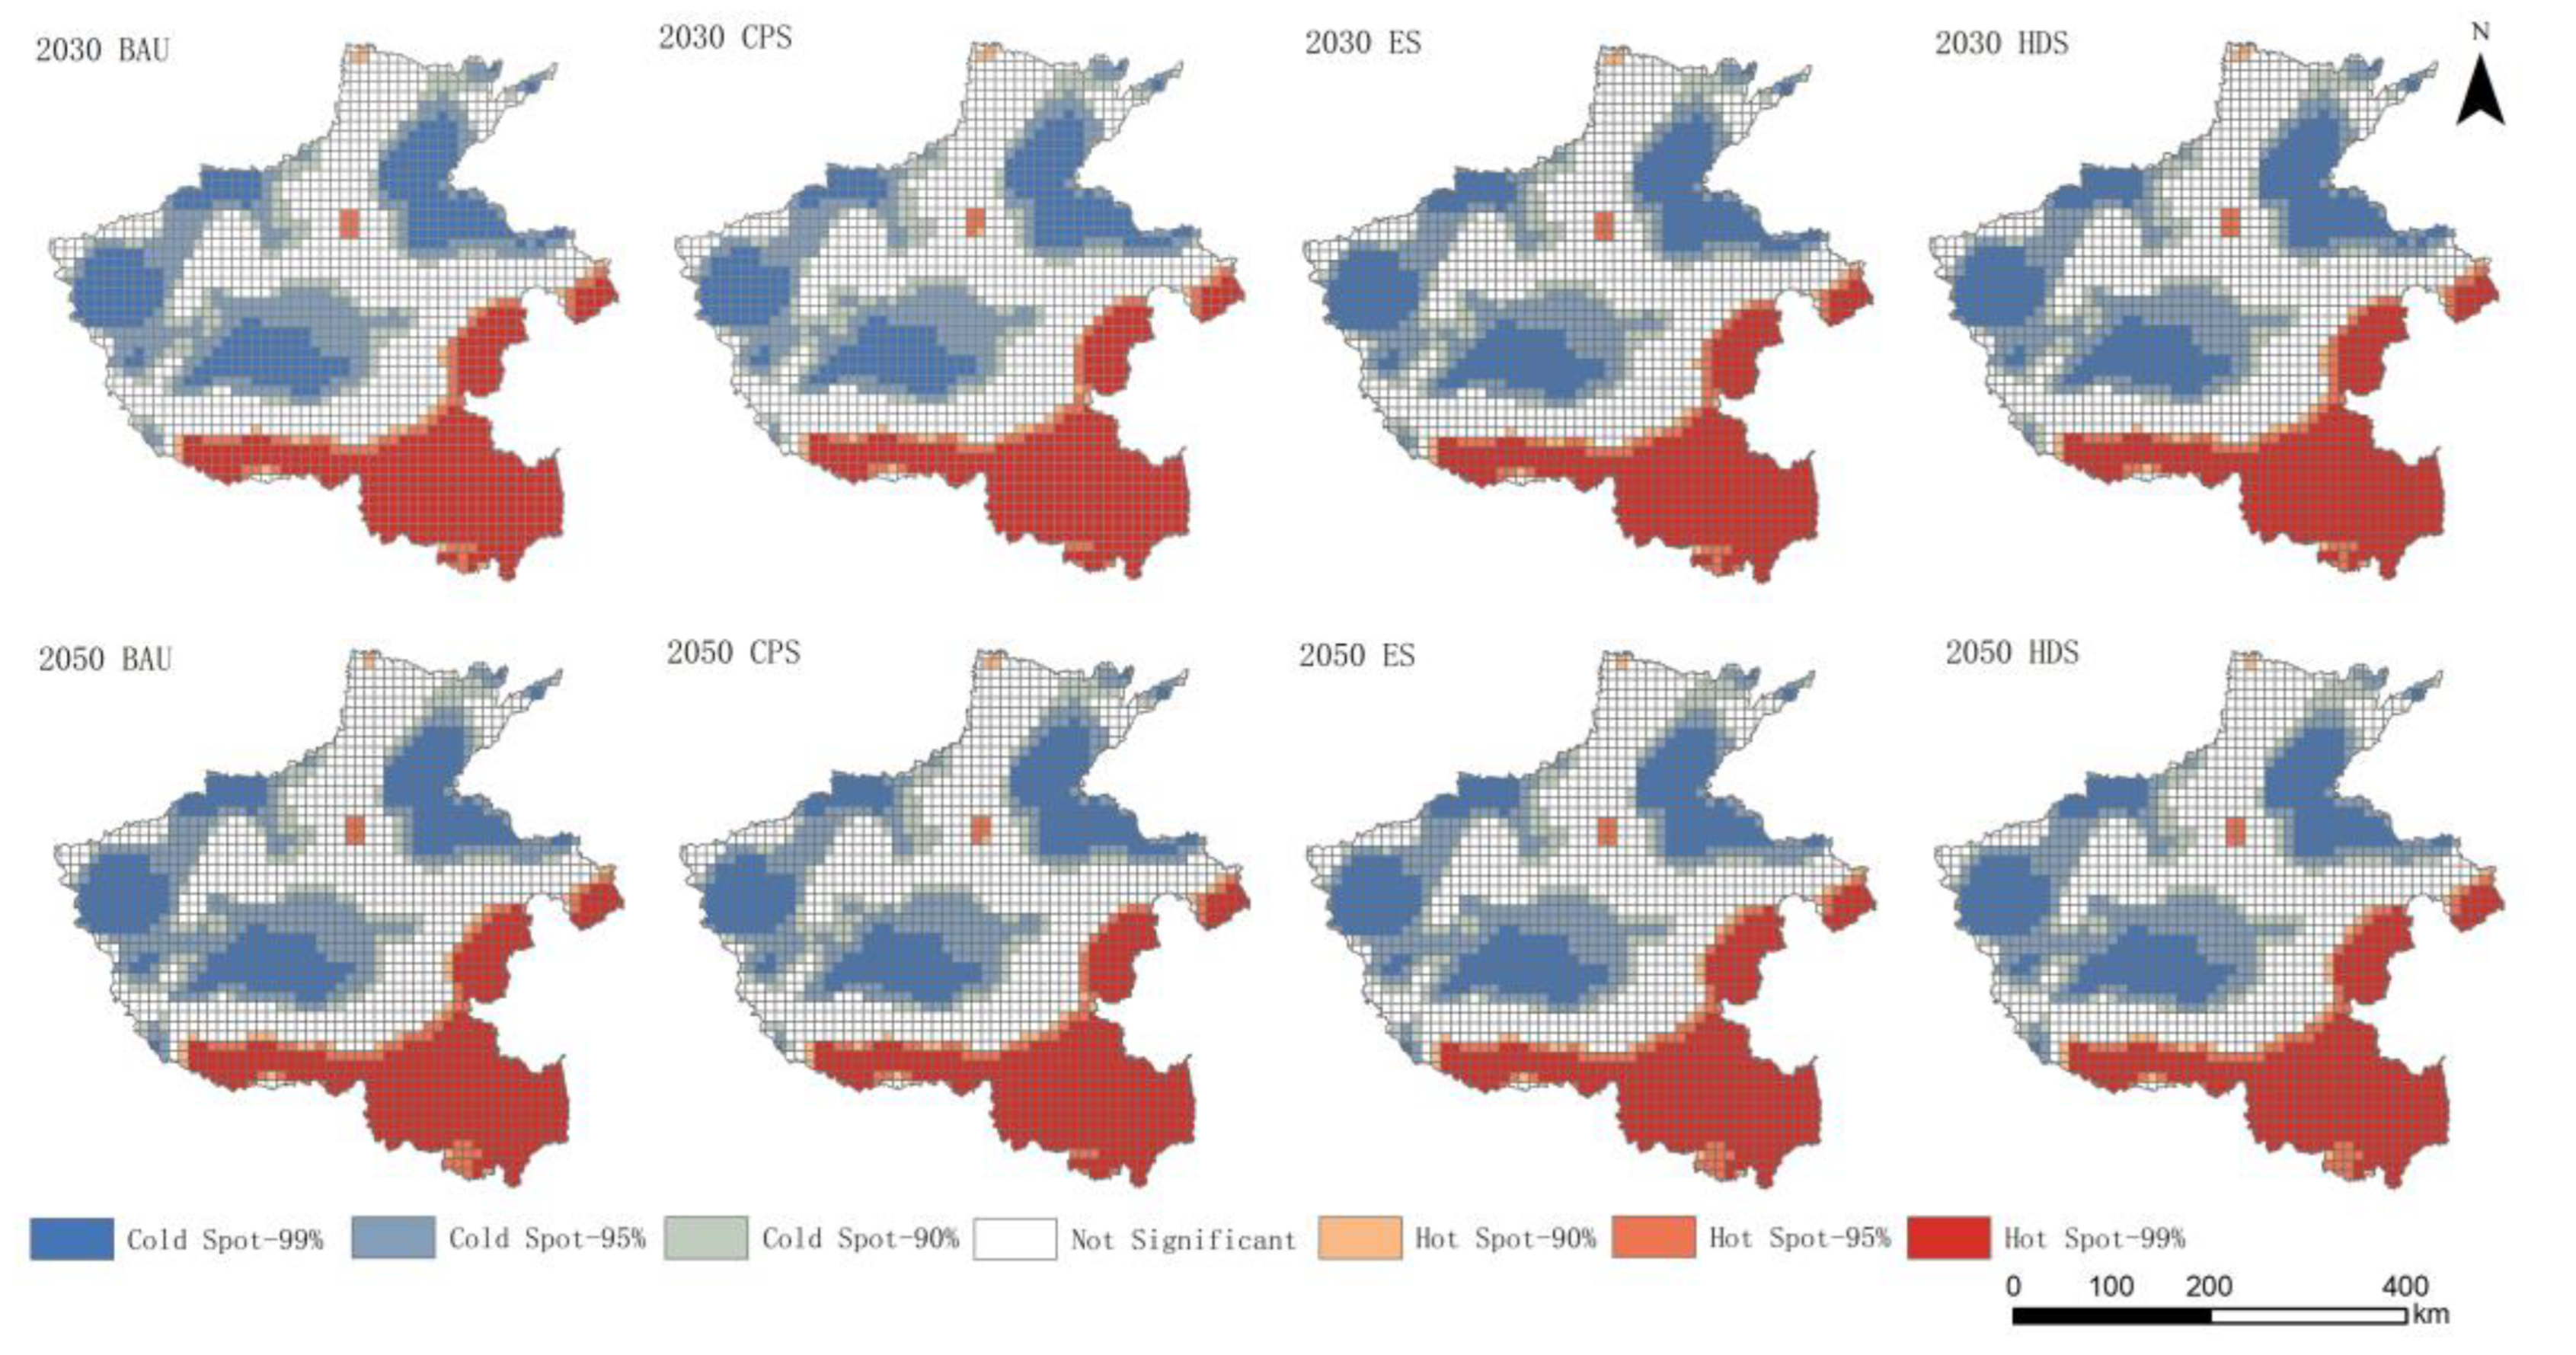
2.3.5. Spatial Autocorrelation

Global spatial autocorrelation allows an analysis of the correlation between different spatial locations within a study area [42]. Hence, this study used global Moran’s I to analyze the overall spatial correlation of WY in its study area; standardized Z-values were used to test the significance of this correlation. Thus, a | Z | s c o r e > 1.96 indicated significant spatial autocorrelation among spatial units. Moreover, a value of Moran’s I > 0 indicated a positive spatial autocorrelation, revealing significant aggregation. The following formulae were used to calculate spatial autocorrelation [43]:
I = n i = 1 n j = 1 m w i j x i x ¯ x j x ¯ i = 1 n j = 1 m w i j x i j x ¯ 2
Z s c o r e = 1 E ( I ) V A R ( I )
where I is the global Moran’s I; n is the number of grid cells in the study area; x i and x j are the WYs of the i th and j th study areas, respectively; E I and V A R ( I ) refer to the expected value and variance of Moran’s I, respectively; w i j is the spatial weight matrix; and x ¯ is the mean value of the study area.
Local spatial autocorrelation, on the other hand, is the correlation between each spatial unit in a study area in terms of its location and its neighboring spatial units [42]. It reflects the agglomeration and difference between local spatial units. In this study, a local hotspot analysis (Getis-Ord G i * method) was conducted to outline the spatial aggregation characteristics of WY in the study area at the local level; the spatial aggregation locations of high and low values of WY were identified in terms of cold and hot spots. To this end, the following formulae were used [44]:
G i * = j = 1 n w i j x j x ¯ i = 1 n w i j s n j = 1 n w i j 2 i = 1 n w i j 2 n 1
x ¯ = 1 n j = 1 n x j
s = 1 n j = 1 n x j 2 ( x ¯ ) 2
where n denotes the number of grid cells in the study space, x i and x j are the WYs of the i th and j th study areas, respectively, and w i j is the spatial weighting matrix; x ¯ and s are the average and standard deviations of the study area, respectively; higher G i * index values indicate a closer aggregation of high values, while lower G i * index values indicate the clustering of low values.

3. Results

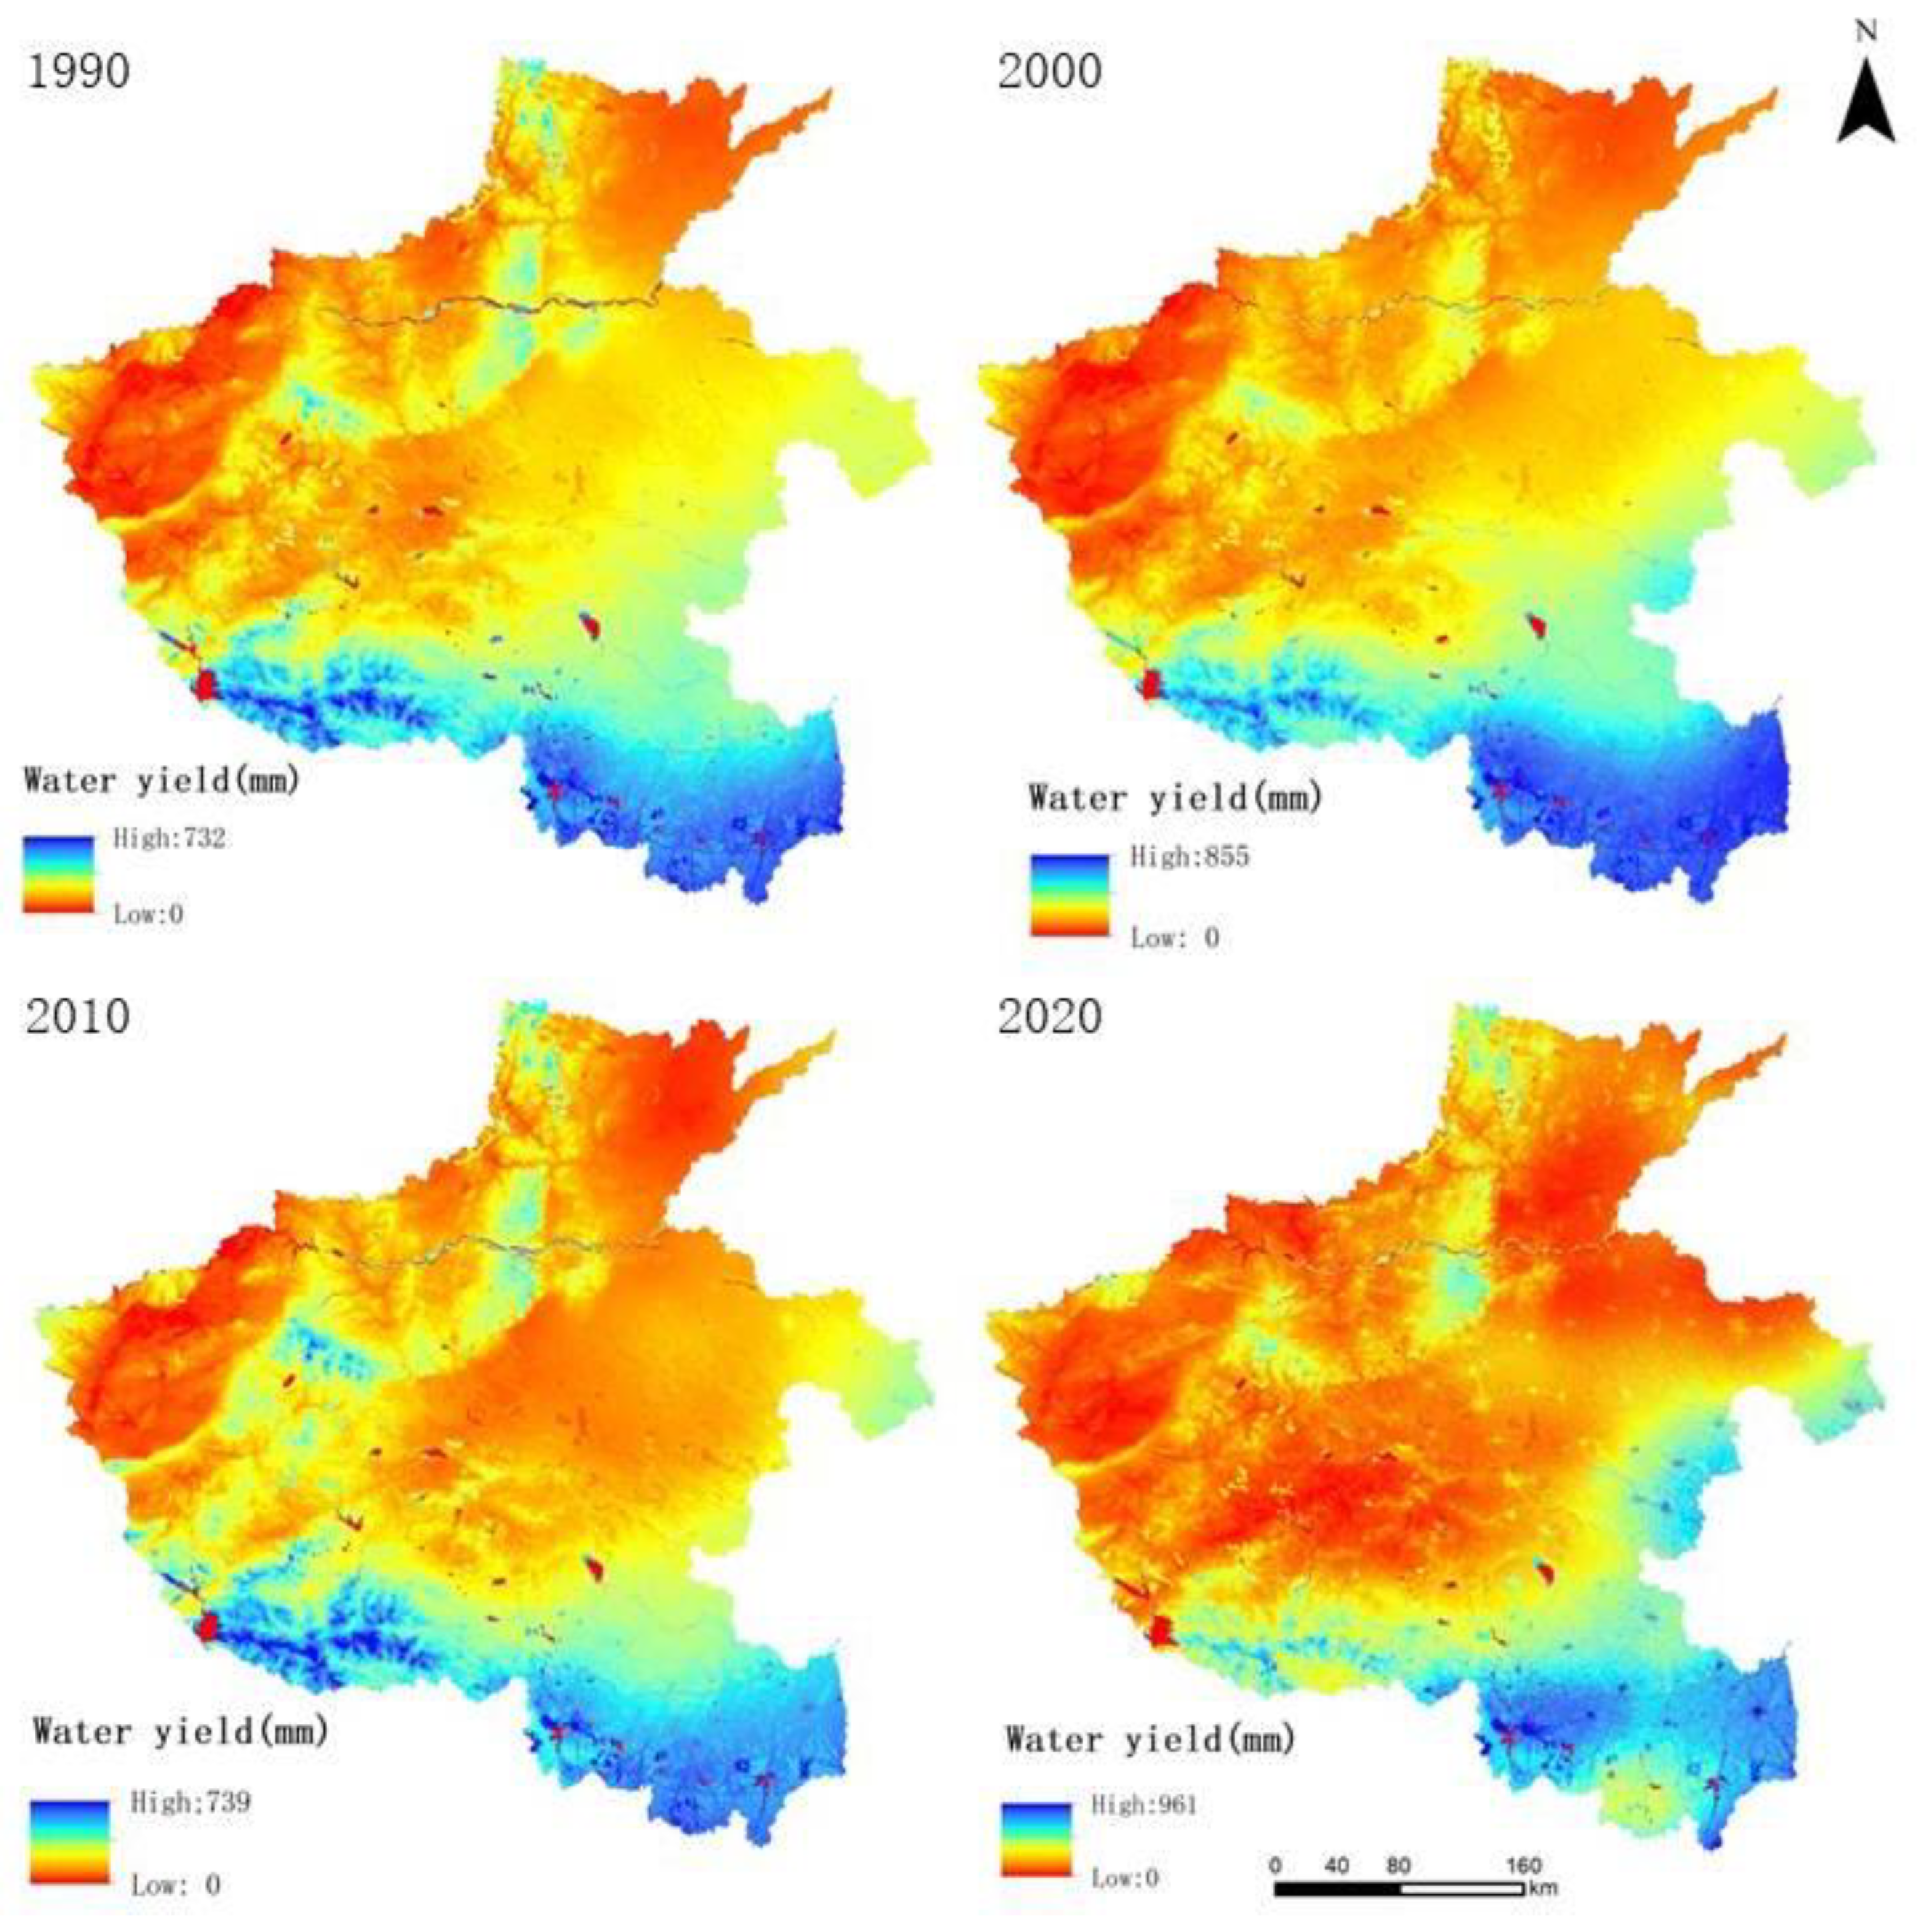
3.1. Characteristics of Spatial and Temporal Changes in WY in Henan Province

The simulation results of WY in Henan Province from 1990 to 2020 are shown in Table 3. The average WY depth ranged from 210.65 mm to 260.09 mm, with the total WY ranging from 398.56 × 10⁸ m3 to 482.95 × 10⁸ m3, showing an initial increase followed by a decrease. Among the four study years of 1990, 2000, 2010, and 2020, the highest WY was in the year 2000, at 48.295 × 10⁸ m3, while the lowest was in 2020, at 39.856 × 10⁸ m3, a difference of 17.47%. From 1990 to 2020, the WY depth first increased and then decreased, with the highest depth recorded in 2000 at 260.09 mm, an increase of 75.91 mm from 1990. The lowest depth was recorded in 2020 at 210.65 mm, a decrease of 49.44 mm from 2000, which represents a reduction of 19.01%.
From the analysis of the inter-annual changes in spatial patterns (Figure 5), it can be seen that from 1990 to 2000, the average WY depth in Henan Province mainly increased, with the increased area accounting for 82.62% of the total study area. In 47.76% of the region, the WY depth growth rate was less than 10% (Figure 5a). The increase in WY was higher in the southeast and lower in the northwest of the study area, showing a strip-like pattern increasing from north to south. In the southeastern part, the increase exceeded 100 mm, making it the area with the highest WY increase. Areas with a decrease in WY depth were mainly located in the western and northern parts of the study area, with a decrease of less than 50 mm.
From 2000 to 2010, the WY depth significantly decreased, and the WY reduced. The area with reduced WY depth covered about 66.88% of the total study area, with 21.14% of the region experiencing a reduction in depth greater than 100 mm (Figure 5b). The areas with reduced WY were mainly distributed in Xinyang City Prefecture and Zhumadian City Prefecture in southern Henan, as well as Zhoukou City Prefecture, Kaifeng City Prefecture, and Shangqiu City Prefecture in eastern Henan. The reduction magnitude increased from southeast to northwest, with the southeastern region experiencing a reduction in depth greater than 100 mm. The areas with increased WY depth were located in the western part of the study area, with an increase mostly less than 50 mm. From 2010 to 2020, the overall trend in water production depth continued to decrease (Figure 5c). Areas with decreased WY depth accounted for 63.06% of the total area, with 14.03% of the areas experiencing a reduction rate higher than 15%. These reduction areas were mainly located in the central, northern, and western parts of Henan Province within the study area, with the reduction rate increasing from east to west. Areas with increased WY depth were primarily distributed in the southeastern part of Henan Province within the study area, accounting for about 36.94% of the total area, with increases ranging from 0 to 300 mm. Overall, from 1990 to 2020, 63.39% of the study area experienced a decrease in WY depth, while 36.61% saw an increase, with WY depth generally decreasing from the southeast to the northwest (Figure 5d).
The WY depth in Henan Province from 1990 to 2020 shows a similar spatial distribution pattern, generally characterized by higher values in the south and east and lower values in the north and west (Figure 6). In 2020, the high-value areas of WY were mainly located in the southern part of Henan, particularly in Xinyang City Prefecture. Secondary high-value areas were mostly distributed on the north and south sides of the high-value areas, including the southern part of Nanyang City Prefecture, and the eastern parts of Zhoukou City Prefecture and Shangqiu City Prefecture. Medium-value areas were often band-shaped and found in the central part of Xinyang City Prefecture, the southeastern part of Zhumadian City Prefecture, and from the northeast to the northwest of Zhoukou City Prefecture. Additionally, there were patchy distributions in the northern parts of Anyang, Xinxiang, and Sanmenxia cities, as well as the western part of Zhengzhou City Prefecture. Secondary low-value areas were mainly located on the periphery of the medium-value areas, with spatial positions similar to those of the medium-value areas. Low-value areas had the largest distribution, primarily concentrated in the western, mid-western, and northeastern parts of Henan Province, including Sanmenxia City Prefecture, the southeastern part of Luoyang City Prefecture, the northwestern part of Jiyuan City Prefecture, the northwestern part of Pingdingshan City Prefecture, the southern part of Anyang City Prefecture, the eastern part of Xinxiang City Prefecture, the southern part of Puyang City Prefecture, the northwestern part of Shangqiu City Prefecture, and the northeastern part of Kaifeng City Prefecture. The degree of aggregation in these areas increased significantly compared to 1990.
In the vertical direction, the average WY depth was statistically analyzed at 100 m intervals to represent the changes in water production capacity of Henan Province along the vertical gradient. The results showed that with the increase in altitude, the overall water production capacity exhibits a decreasing trend (Figure 7). Below an altitude of 400 m, the WY depth remains at a high level, with land use in this region mainly comprising cultivated land and construction land. Above an altitude of 400 m, as the altitude increases, the proportion of forest and grassland areas gradually expands, while the proportion of cultivated land decreases. The average evapotranspiration significantly increases, leading to a reduction in WY depth. At an altitude of 1300–1400 m, the WY depth reaches its lowest value, within this range, cultivated land and construction land virtually disappear, and both factors jointly control the changes in WY at different altitudes. Beyond this altitude, as the altitude increases, the WY depth increases, with woodland accounting for more than 98%.
From the perspective of spatial correlation, the WY in Henan Province demonstrated robust positive spatial autocorrelation from 1990 to 2020. In the province, the global Moran’s I indices were 0.916, 0.950, 0.902, and 0.940 for the four specific years under study, with the Z-scores for all the years exceeding 1.96 and p-values being less than 0.001 (indicating that the test had been passed at a 95% confidence level). This finding suggested that WY services in Henan Province exhibited spatial dependency and strong positive spatial autocorrelation in their distribution over the examined period. Moreover, the hot spot analysis results (Figure 8) unveiled notable shifts in the distribution of hot and cold spots across Henan Province over the past three decades. Specifically, hot spots were predominantly clustered in the province’s southern regions, encompassing cities such as Xinyang, Zhumadian, and Nanyang, while cold spots primarily emerged in its western and northern regions. By 2010, the number of cold spots in the province increased notably, concentrated in the western, northern, and central regions, while sporadic hot spots emerged in its central and eastern zones. By 2020, the southern and eastern regions of Henan Province became hot spot areas, and the distribution of cold spots in the province displayed a distinct spatial pattern as compared with those in the two preceding decades.

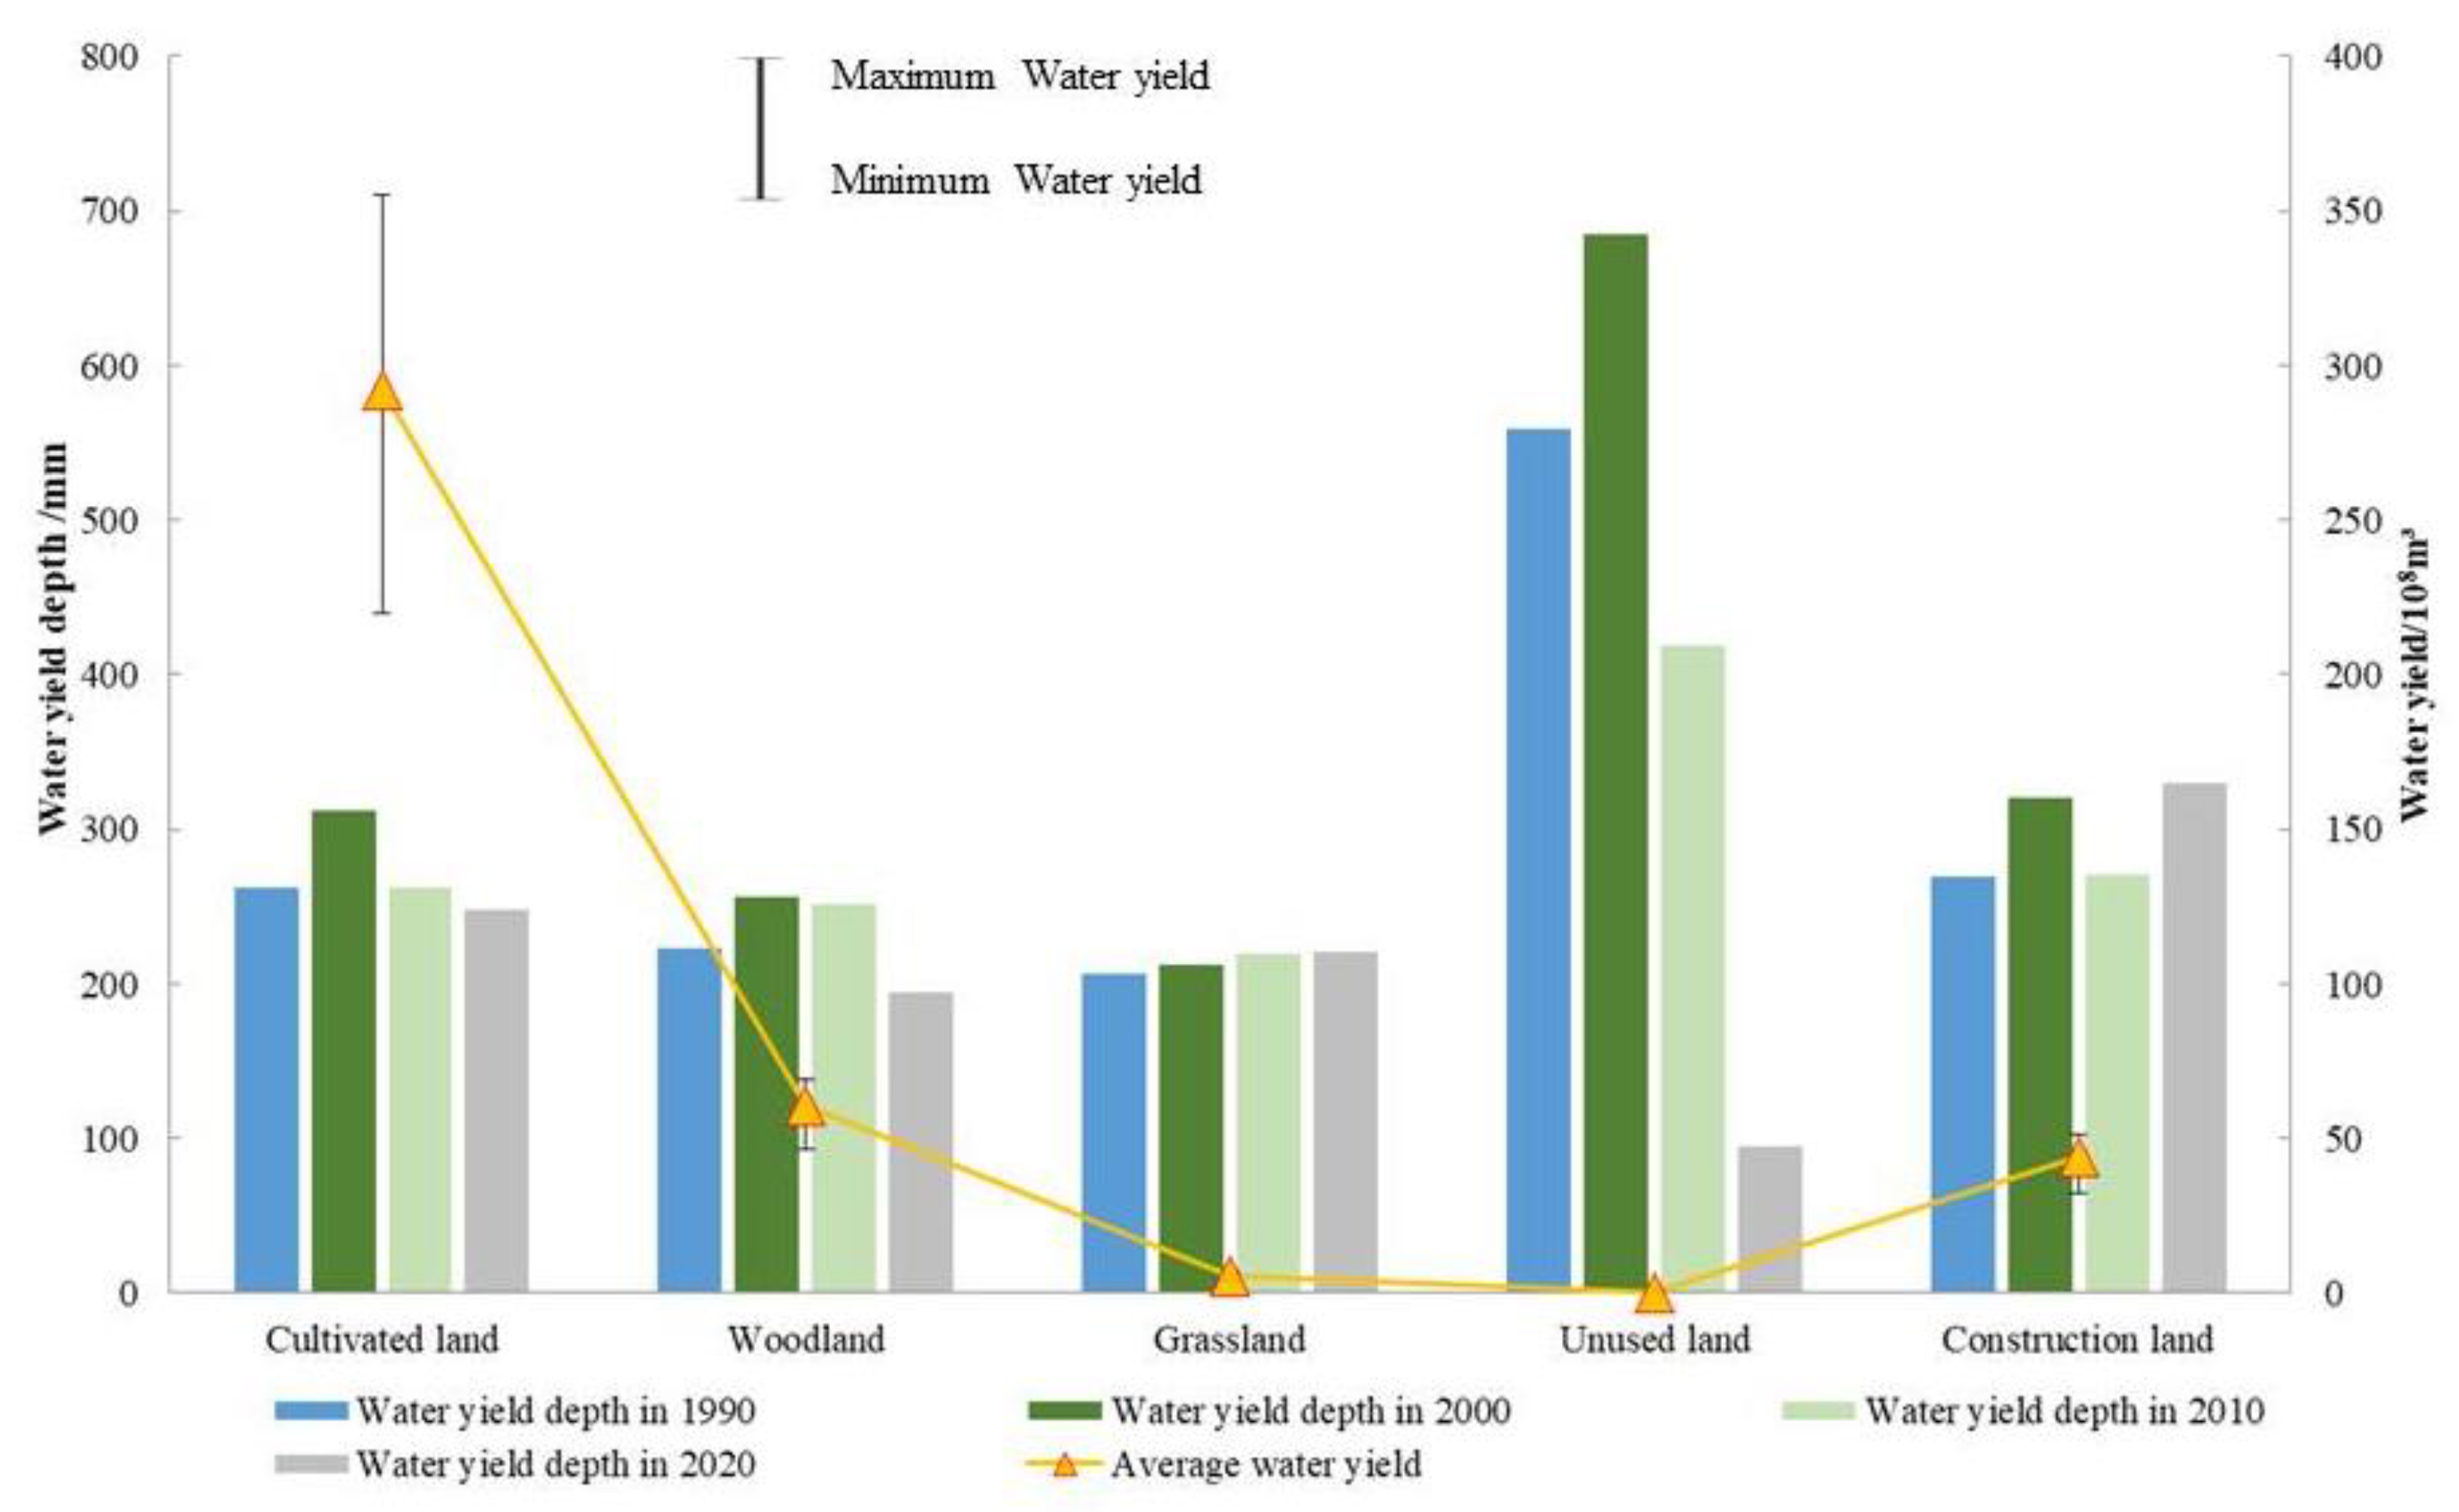
3.2. WY of Different Land Use Types

Utilizing ArcGIS to statistically analyze the water-producing capacity of various land use types (Figure 9). The total WY varies greatly among different land use types, related to the average water-producing capacity per unit area and the distribution area. The water-producing capacity of land use types from strongest to weakest is unused land, cultivated land, grassland, construction land, woodland, and water. Cultivated land, woodland, and construction land are the main land use types in Henan Province, accounting for 65.69%, 17.87%, and 14.17% of the total area, respectively, and have relatively high WY per unit area. Therefore, cultivated land, woodland, and construction land are the main contributors to WY in Henan Province, accounting for 72.54%, 15.09%, and 10.93% of the total WY in the study area, respectively. Due to their small areas, unused land and grassland contribute only 1.44% of the total WY.
The changes in WY depth and total WY across different land use types in the study area from 1990 to 2020 generally followed a similar pattern. Except for woodland and grassland, most areas showed a significant increase from 1990 to 2000, a decrease from 2000 to 2010, and a slight increase from 2010 to 2020 (Figure 9). The WY of various land use types was generally higher in 2000 and 1990, and relatively lower in 2010 and 2020.

3.3. Future LULC Projections

Utilizing the PLUS model, the spatial distribution of land use in Henan Province for the years 2030 and 2050 was obtained under four scenarios: BAU, CPS, ES, and HDS (Figure 10). Compared with 2020, the land use structure in Henan Province under the four scenarios shows varying degrees of change (Table 4 and Table 5).
In 2030, under the BAU, the areas of cultivated land, grassland, and unused land decreased by 4200.74 km2, 495.76 km2, and 0.28 km2, respectively, with reduction rates of 3.86%, 26.13%, and 10.49%, respectively. The areas of construction land, woodland, and water increased by 3799.82 km2, 801.4 km2, and 95.57 km2, respectively, with growth rates of 16.19%, 2.71%, and 4.77%, respectively. Under the CPS, the areas of cultivated land, grassland, and unused land decreased by 1921.64 km2, 487.65 km2, and 0.26 km2, respectively, with reduction rates of 1.77%, 25.71%, and 9.74%, respectively. Compared with the BAU, the CPS showed an increase of 2279.1 km2 in cultivated land area, effectively protecting cultivated land, while the increase rate of construction land significantly slowed, increasing by only 6.24 km2. The changes in water bodies were similar to those under the BAU. Under the ES, woodland area increased significantly by 1411.84 km2, the highest increase among the four scenarios, while the increase rate of construction land slowed considerably, increasing by 949.39 km2, the smallest increase among the four scenarios. Under the HDS, the areas of cultivated land and grassland decreased by 3572.43 km2 and 486.46 km2, respectively, with reduction rates of 3.29% and 25.65%, respectively. The areas of construction land, woodland, and water increased by 2583.82 km2, 1359.35 km2, and 115.98 km2, respectively, with growth rates of 11.01%, 4.59%, and 5.79%, respectively.
In 2050, under the BAU, the areas of cultivated land, grassland, and unused land decreased by 12,071.17 km2, 923.91 km2, and 0.38 km2, respectively, with reduction rates of 11.11%, 48.71%, and 14.32%, respectively. The areas of construction land, woodland, and water increased by 10,843.21 km2, 1874.14 km2, and 278.1 km2, respectively, with growth rates of 46.21%, 6.34%, and 13.88%, respectively. Under the CPS, the areas of cultivated land, grassland, and unused land decreased by 9964.92 km2, 916.41 km2, and 0.36 km2, respectively, with reduction rates of 9.17%, 48.31%, and 13.48%, respectively. The areas of construction land, woodland, and water increased by 8685.43 km2, 1911.5 km2, and 284.76 km2, respectively, with growth rates of 37.01%, 6.46%, and 14.21%, respectively. Although the cultivated land area showed a decreasing trend, it slowed compared to the BAU, and the expansion of construction land was significantly restricted. Under the ES, the areas of woodland and water increased by 2390.5 km2 and 300.08 km2, respectively, with growth rates of 8.08% and 14.98%, respectively, the highest increases among the four scenarios. Under the HDS, the areas of cultivated land, grassland, and unused land decreased by 12,774.44 km2, 928.28 km2, and 0.57 km2, respectively, with reduction rates of 11.76%, 48.94%, and 21.35%, respectively. The areas of construction land, woodland, and water increased by 11,648.52 km2, 1856.12 km2, and 198.54 km2, respectively, with growth rates of 49.64%, 6.27%, and 9.91%, respectively.

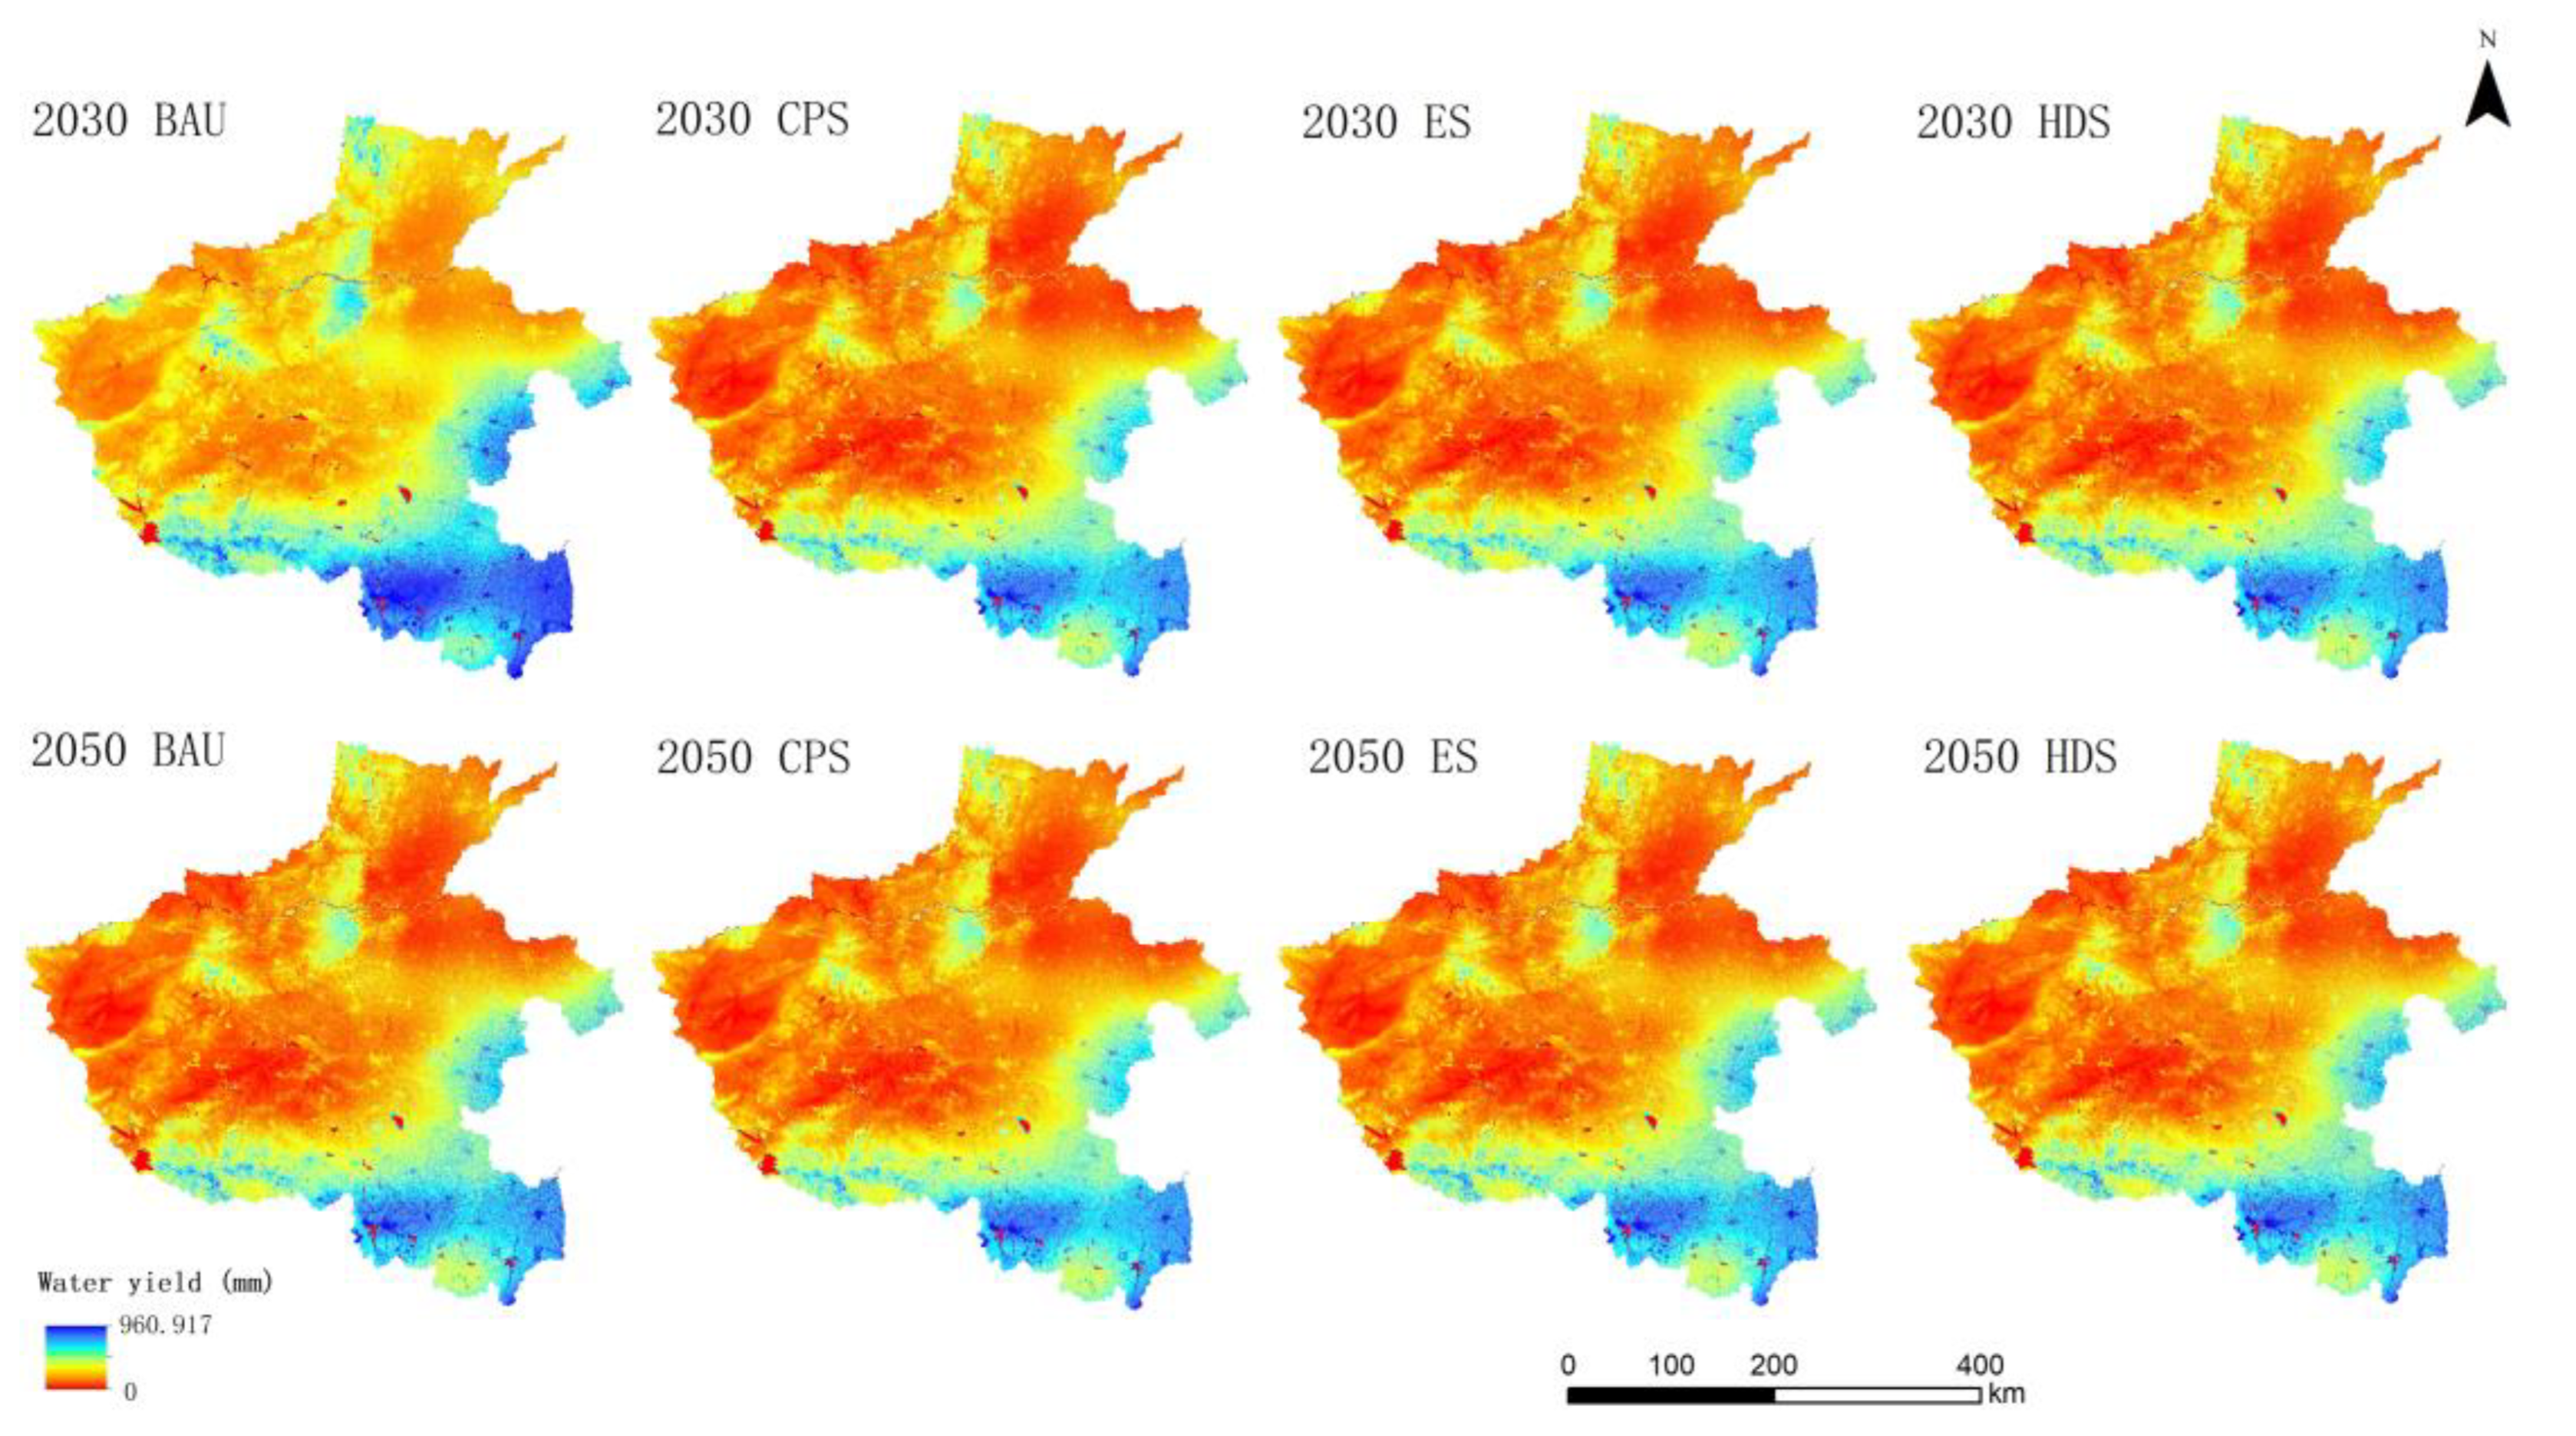
3.4. WY Response Simulation

To predict changes in the ecosystem WY services in Henan Province under different future scenarios, this study input LULC data for 2030 and 2050 (simulated using the PLUS model) along with 2020 precipitation and evapotranspiration data into the InVEST model to obtain the WY for the study area in 2030 and 2050. The spatial distribution of WY depth in the province under these four scenarios is illustrated in Figure 11. The spatial pattern continues the characteristic distribution from 1990 to 2020; the high-value WY zone will remain in the province’s southern and southeastern boundaries, while the low-value WY zone will be concentrated in its western and northern parts.
As shown in Table 6 and Table 7, under the BAU scenario, the predicted WY in Henan Province for 2030 is 401.42 × 10⁸ m3, and the predicted WY depth is 212.54 mm, which are 2.85 × 10⁸ m3 and 1.89 mm higher than those in 2020, respectively. The WY from cultivated land decreases by 23.02 × 10⁸ m3, while the WY from construction land increases by 27.49 × 10⁸ m3. For 2050, the predicted WY in Henan Province is 407.78 × 10⁸ m3 and the predicted WY depth is 216.88 mm, which are 9.21 × 10⁸ m3 and 6.23 mm higher than those in 2020, respectively. The WY from cultivated land decreases by 39.62 × 10⁸ m3, while the WY from construction land increases by 49.32 × 10⁸ m3.
Under the CPS scenario, the predicted WY volume in Henan Province for 2030 is 399.85 × 10⁸ m3, and the predicted water production depth is 211.23 mm, which are 1.28 × 10⁸ m3 and 0.58 mm higher than those in 2020, respectively. The WY from cultivated land decreases by 8.46 × 10⁸ m3, while the WY from construction land increases by 18.63 × 10⁸ m3. For 2050, the predicted water production volume in Henan Province is 399.98 × 10⁸ m3, and the predicted WY depth is 211.31 mm, which are 1.41 × 10⁸ m3 and 0.66 mm higher than those in 2020, respectively. The water production volume from cultivated land decreases by 6.78 × 10⁸ m3, while the water production volume from construction land increases by 17.82 × 10⁸ m3.
Under the ES scenario, the predicted WY in Henan Province for 2030 is 398.1 × 10⁸ m3, and the predicted WY depth is 210.5 mm, which are 0.47 × 10⁸ m3 and 0.15 mm lower than those in 2020, respectively. The WY from cultivated land decreases by 19.74 × 10⁸ m3, while the WY from construction land increases by 19.95 × 10⁸ m3. For 2050, the predicted WY in Henan Province is 406.65 × 10⁸ m3, and the predicted water production depth is 216.11 mm, which are 8.08 × 10⁸ m3 and 5.46 mm higher than those in 2020, respectively. The WY from cultivated land decreases by 38.51 × 10⁸ m3, while the WY from construction land increases by 45.75 × 10⁸ m3.
Under the HDS scenario, the predicted WY in Henan Province for 2030 is 402.52 × 10⁸ m3, and the predicted water production depth is 213.19 mm, which are 3.95 × 10⁸ m3 and 2.54 mm higher than those in 2020, respectively. The WY from cultivated land decreases by 25.32 × 10⁸ m3, while the WY from construction land increases by 31.18 × 10⁸ m3. For 2050, the predicted WY in Henan Province is 408.89 × 10⁸ m3, and the predicted WY depth is 217.51 mm, which are 10.32 × 10⁸ m3 and 6.86 mm higher than those in 2020, respectively. The WY from cultivated land decreases by 41.09 × 10⁸ m3, while the WY from construction land increases by 51.88 × 10⁸ m3.
For 2030, the global Moran’s I indices for WY in Henan Province under the BAU, CPS, ES, and HDS are 0.933, 0.932, 0.934, and 0.934, respectively. Similarly, for 2050, these indices under the same scenarios are 0.933, 0.932, 0.934, and 0.932, respectively. For both 2030 and 2050, these results indicate a certain level of spatial autocorrelation in the distribution of WY across different scenarios in Henan Province. Moreover, the results of the hotspot analyses (Figure 12) show that the distribution characteristics of cold/hot spots regarding WY in Henan Province will have similar distribution characteristics in 2030 and 2050; hot spot areas will be mainly located in the southern and southeastern parts of the province, whereas cold spot areas will be distributed in its central, western, and northeastern regions (with a more sporadic distribution).

4. Discussion

4.1. Analysis of Spatial and Temporal Trends of WY

The annual average WY and annual average WY depth in Henan Province exhibited a pattern of initially increasing and then decreasing between 1990 and 2020. The WY depth in 2020 decreased by nearly 19% compared to 2000, which is related to the hot climate and strong evapotranspiration intensity in 2020. Spatially, the high WY areas in Henan Province were mainly distributed in the southern regions, as these areas have a subtropical climate with precipitation often exceeding 800 mm, while evapotranspiration is relatively low. In contrast, the western and northern parts of Henan, due to their relatively higher elevation and warm temperate continental climate, with most rainfall between 560–600 mm and vigorous evapotranspiration, had lower water yield than the southern areas. This finding is consistent with the conclusions from the study on the spatial distribution of water conservation in Henan Province by Xiao Juncang and others [45]. Vertically, the WY depth in the study area generally decreased with increasing elevation, primarily influenced by land use types, vegetation characteristics, and evapotranspiration intensity. This finding is consistent with the conclusions of Lu et al. [46].
In fact, Henan Province is the only province in China that spans four major river basins (Figure 13); hence, changes in its WY service will directly affect the water resources in the respective river basins. Over the past 30 years, the WY depth in the southern part of the Henan section of the Haihe River Basin has decreased, while it has increased in the northern part, with an overall increase in total WY. This is related to the reduction in precipitation and increase in evapotranspiration intensity in the southern part of the basin, as well as ecological protection and vegetation restoration measures in the northern mountainous areas [47]. In the northwest and central parts of the Henan section of the Yellow River Basin, the WY depth has slightly increased, but the overall WY has decreased. This is due to the implementation of ecological restoration projects such as returning farmland to forests and afforestation, which have increased vegetation cover and enhanced water conservation capacity. However, due to the overall reduction in precipitation across the basin, the WY still shows a declining trend [48]. In the Henan section of the Yangtze River Basin, the WY depth has generally decreased, mainly influenced by factors such as rising temperatures in the basin and the increase in agricultural land area, leading to greater evapotranspiration intensity [49]. In the southern and southeastern regions of the Henan section of the Huaihe River Basin, the WY depth has increased, benefiting from the humid subtropical climate, well-protected vegetation, and increased government investment in soil and water conservation. However, the WY depth has decreased in the northeastern and northwestern parts of the basin, possibly due to climate change and suboptimal land use and management practices [50].

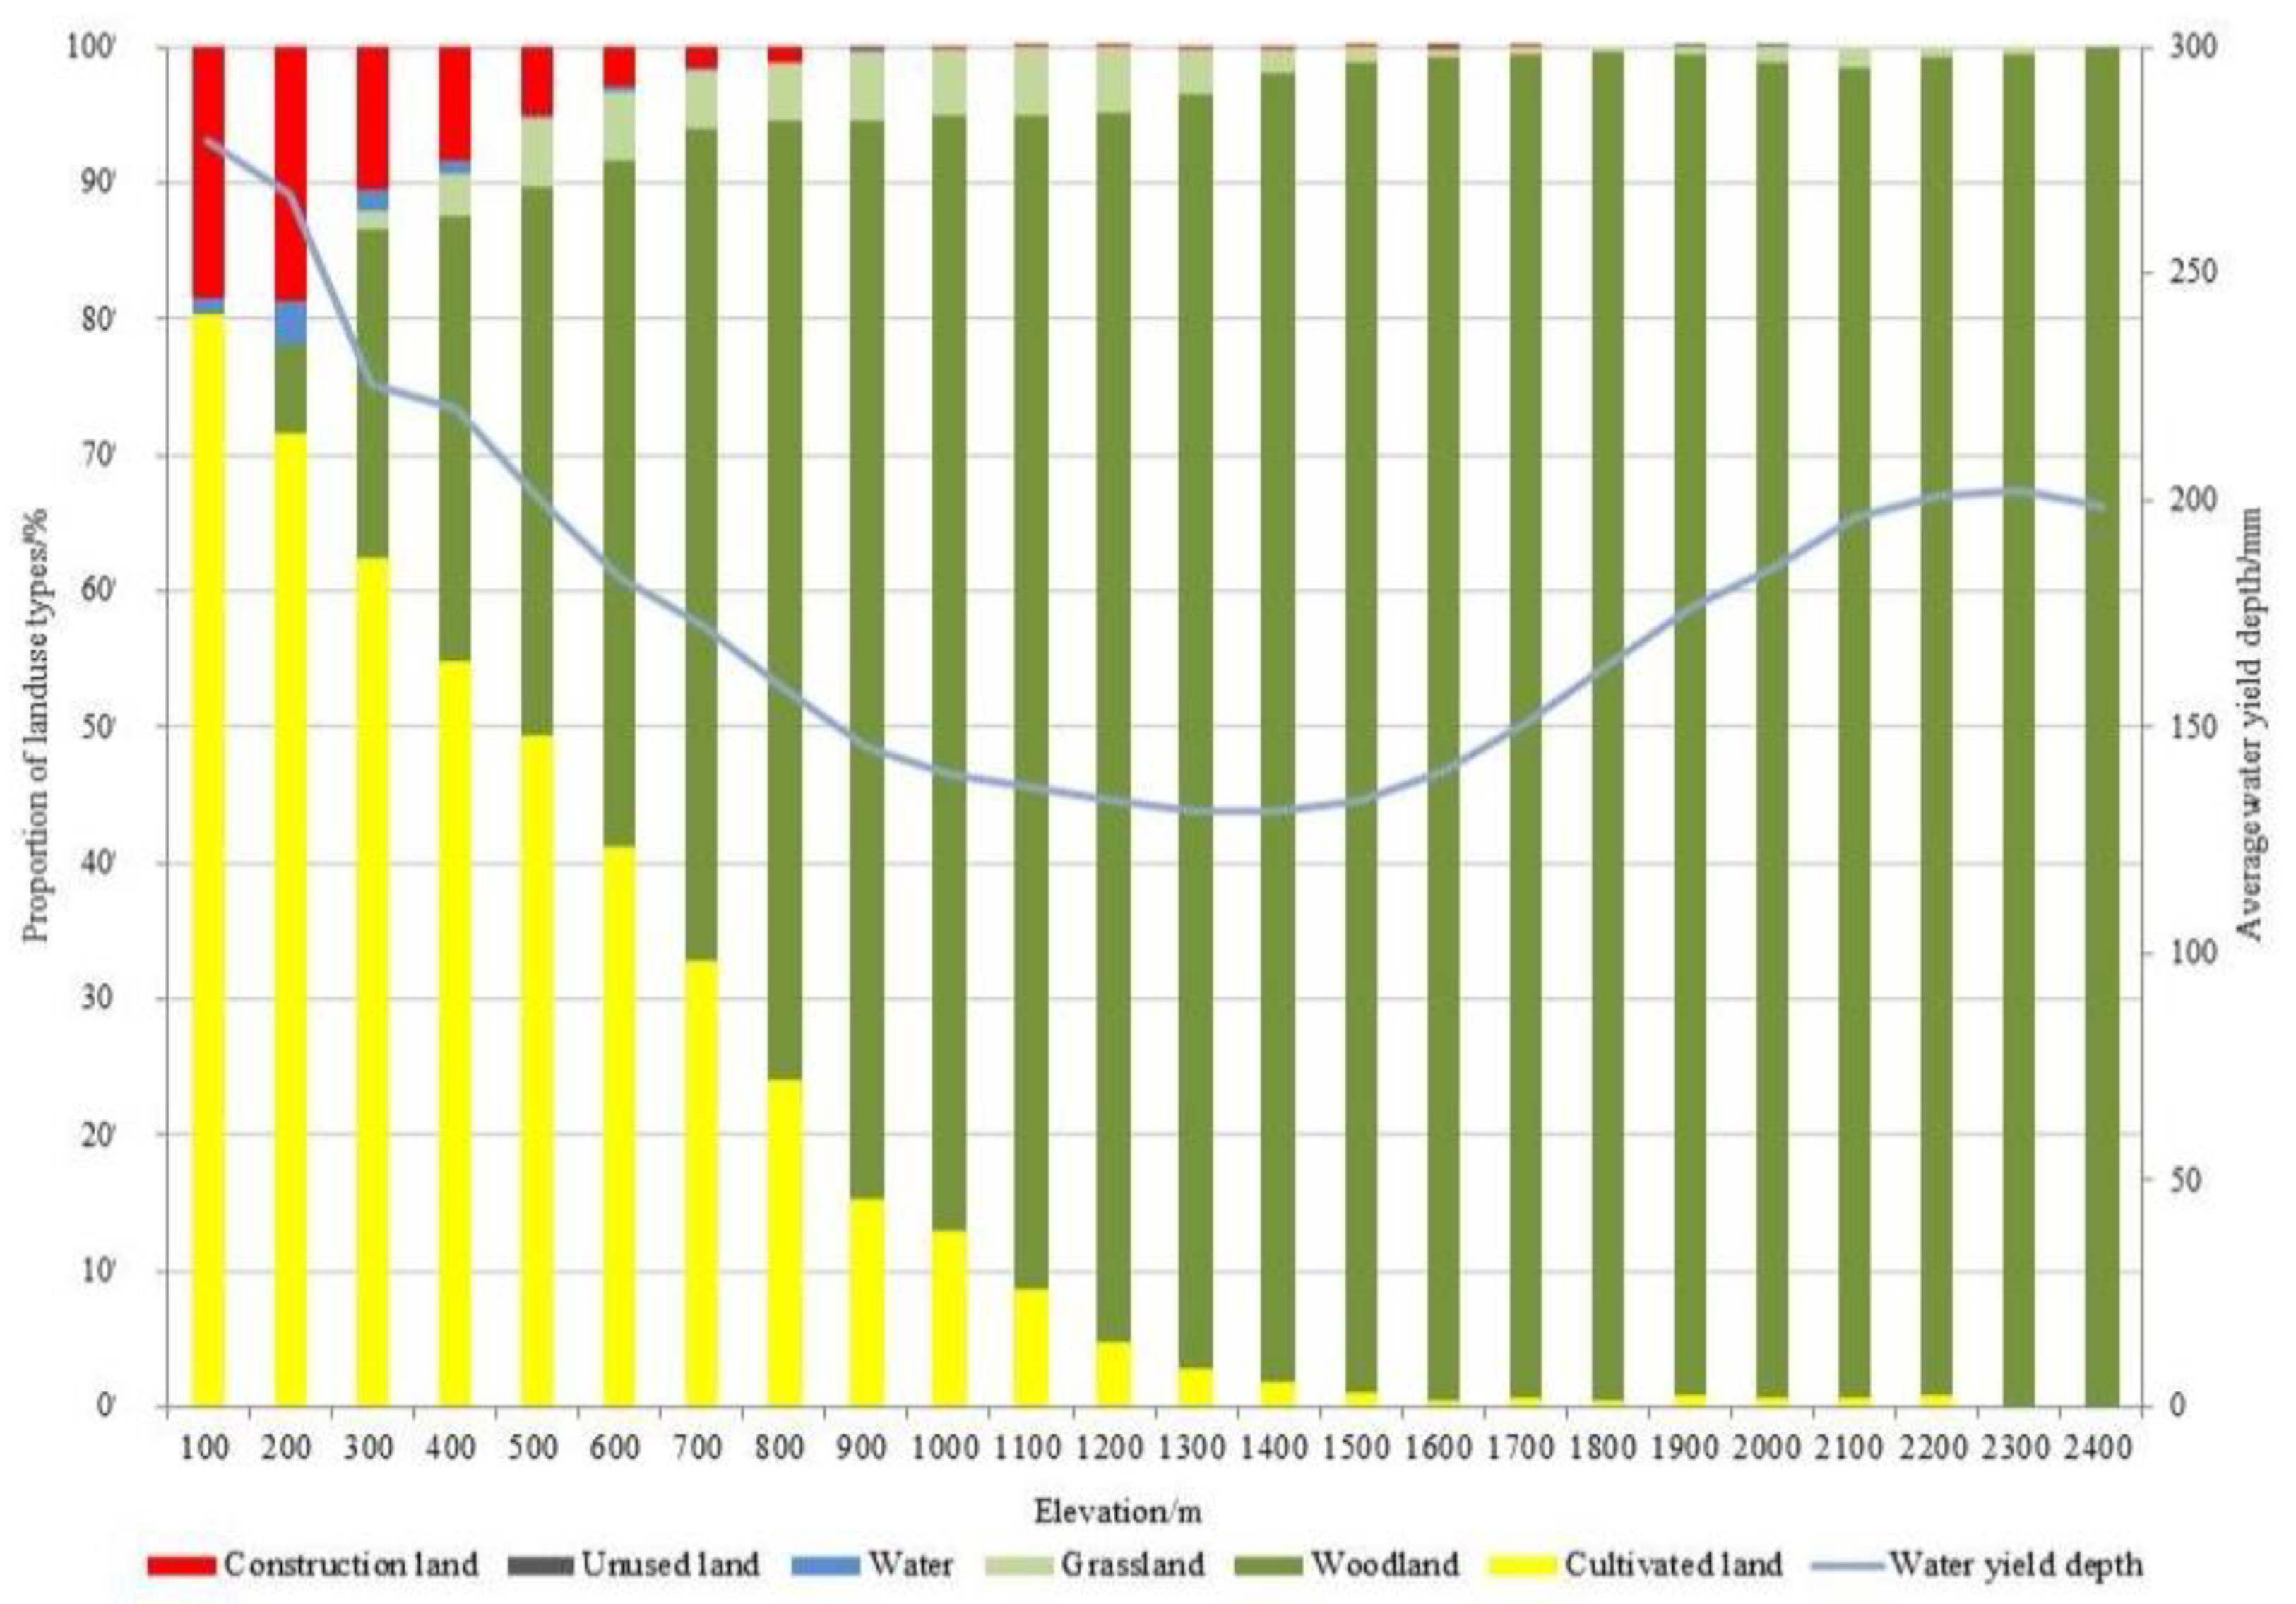
4.2. Impact of LULC Change on WY

Different land-use types exhibit significant differences in evapotranspiration capacity, soil moisture content, water-holding capacity, and canopy interception, which in turn result in notable variations in their WY capacity [51]. In this study, the WY capacity was ranked from highest to lowest as follows: unused land, cultivated land, grassland, construction land, woodland, and water bodies. The WY capacity of land-use types is inversely proportional to the evapotranspiration capacity of their vegetation; the higher the evapotranspiration, the lower the WY value [52]. Unused land, with its poor precipitation interception ability, filters only a small portion of water, allowing precipitation to directly infiltrate the ground or form runoff [5], which makes it the most effective in terms of WY capacity. Cultivated land and grassland, despite having shallow root systems and relatively weak interception effects, exhibit lower evapotranspiration, resulting in relatively better WY performance. Most construction land comprises impermeable surfaces that lack vegetation for precipitation interception, and its relatively low evapotranspiration has a positive effect on WY, which is consistent with existing studies [53]. Woodland, on the other hand, has strong evapotranspiration due to its canopy cover and robust interception by the litter layer, which may lead to a comparatively lower WY [54]. Water bodies, with their strong evapotranspiration capacity, have the lowest WY compared to other land types [31]. Furthermore, differences in the area occupied by each land type also influence their total WY. Cultivated land, with its high WY capacity and extensive area, contributes the most to the total WY in Henan Province, while grassland, despite its good WY performance, contributes less due to its limited distribution.
Furthermore, changes in land use types not only affect water yield capacity but may also lead to significant changes in other ecosystem services, such as soil erosion and carbon storage [35,55]. Unused land and cultivated land, due to their low vegetation cover and loose soil structure, are more prone to soil erosion, especially in areas with high-intensity rainfall [56]. This not only reduces soil fertility but may also lead to water eutrophication, thereby affecting regional water quality [57]. In contrast, woodland and grassland can effectively reduce soil erosion and maintain soil structure stability through their root systems and surface vegetation [55]. Additionally, woodland can sequester atmospheric carbon dioxide through photosynthesis, storing it in biomass and soil [58], while the root systems of grasslands can sequester carbon deep in the soil. Changes in land use, particularly the conversion of woodland and grassland into cultivated land or construction land, may result in the release of large amounts of carbon, thereby exacerbating climate change [59]. Changes in land use types are not simply about area and type conversion; their impacts on ecosystem services are complex and multidimensional. Future research can further explore the complex interactions between land use type changes and ecosystem services under different scenarios.

4.3. Recommendations for Future Water Resources Management

Considering that it is China’s main grain-producing region, food security in Henan Province is a necessary foundation on which China can achieve stable development. In this regard, adequate water resources are the cornerstone of food security. However, Henan Province currently faces enormous water-related challenges. First, it faces an increasing demand for water resources in agriculture, industry, and urban life. The disparity between water supply and demand and ecological environment protection is one of the most prominent problems encountered by Henan. Such an issue has intensified the competition for water resources, which may consequently lead to the uneven distribution of resources and even water supply tension in the province. Second, the geographical location and climatic conditions of Henan Province impact the distribution and utilization of its water resources. Its “high in the west and low in the east” terrain conditions result in some areas being more arid and others being prone to flooding. Such conditions frequently render Henan Province vulnerable to the threat of natural disasters such as floods and droughts. Natural disasters also result in the loss of the water resources, in addition to seriously impacting the agricultural production, urban life, and socioeconomic progress of the province. In particular, they pose a substantial threat to China’s food security. These factors have pointed to the urgency and importance of water resources management in Henan Province in light of the following issues: increased competition for resources, complexity and difficulty of holistic water resources management, and water supply constraints. In this context, based on this study’s investigation of the characteristics of water resource distribution and the future changes in Henan Province’s WY, the following three strategies are proposed:
First, effective water resources control and distribution mechanisms must be implemented to ensure the rational use of water resources in Henan Province. Stakeholders in its southern part, which receives abundant precipitation and has a high water production capacity, should focus on protecting its water resources, strengthening the protection of water source culverts, and ensuring the fulfillment of their role as important water resource production areas. In fact, Henan Province should establish a quantitative water resources management system so that it can reasonably allocate water resource quotas according to the demand and actual situation of each region, in addition to strengthening the supervision and punishment of illegal water withdrawal. It should also strengthen water resources management cooperation with neighboring provinces, especially communication and coordination with the upstream provinces, such that stakeholders can jointly protect cross-regional water resources.
Second, the Henan administration should guide high-quality development, promote a water-saving society, and enhance ecological protection and restoration. Among different scenarios, high-quality development can increase the province’s WY to the greatest extent. In addition, Henan must adopt a sustainable development model focusing on the development of frugal and environmentally friendly industries. Only then will it be able to reduce the unchecked consumption and pollution of its water resources as well as encourage water-saving measures in all fields—including agricultural, industrial, and urban areas—to improve the overall efficiency of water resource utilization, e.g., promoting water-saving irrigation technology and strengthening water recycling and reuse [60]. The administration must also try to control the scale of construction land expansion to avoid the loss of water resources and the ecological damage caused by excessive development [61]. The natural protection capacity of Henan’s water resources can also be improved to reduce soil erosion and enhance water quality through ecological restoration, vegetation protection, and other relevant measures.
Third, Henan should strengthen related scientific and technological support, develop a sound water resources monitoring and early warning system, and seek to reduce the losses caused by natural disasters. To this end, it must achieve an in-depth understanding of the distribution, changing patterns, and sustainable use potential of its water resources [62]. The administration in Henan must consolidate scientific and technological support for water resources management and promote the application of both water-saving irrigation technology and comprehensive water resources utilization technology. Fortunately, Henan has already established a robust water resource monitoring and early warning system to ensure timely warning of natural disasters (such as droughts and floods) and create a scientific basis and support for concomitant disaster response.

4.4. Research Limitations and Prospects

This study evaluated the WY changes in Henan Province using the InVEST model and the PLUS model, providing a valuable case study that could aid future water resource protection and management in the province. However, this study had some limitations. First, although the InVEST model widely used in ecosystem valuation [63] can fail to incorporate the complexity of terrain and is susceptible to the influence of model parameters and input data, leading to a certain degree of uncertainty [64]. Second, while this study considered four different development scenarios regarding the simulation of future LULC changes, its results might not have fully represented all actual change situations. To establish more comprehensive development scenarios, various development plans and related policies should be considered by future studies. Further, although this paper selected 12 driving factors to evaluate future LULC changes, the actual impacts of LULC changes would be presumably more complex. To enhance the accuracy of their LULC change predictions, future studies should thoroughly consider the many potential factors influencing LULC change in conjunction with Henan’s local government’s development plans and policy orientations.

5. Conclusions

This study employed the InVEST and PLUS models to simulate and analyze land-use changes and water yield (WY) service functions in Henan Province from 1990 to 2050, leading to the following key conclusions: The ecosystem WY in Henan Province first increased and then decreased from 1990 to 2020. The average WY depth ranged from 210.65 to 260.09 mm, and the average total WY ranged from 398.56 × 10⁸ m³ to 482.95 × 10⁸ m³. Among the four selected study years, the highest WY service level was in 2000, with an average WY depth of 260.09 mm, and the lowest WY capacity was in 2020, with an average water yield depth of 210.65 mm. Significant spatial disparities in WY were observed across Henan Province, with higher values in the southern and southeastern regions and lower values in the western and northeastern regions. The high-value area was located in the southern part of the province, particularly in Xinyang City Prefecture, while the low-value areas were mainly concentrated in the western, central, and northeastern regions. There was a strong positive spatial correlation in WY across the years, with hot spots primarily located in southern Henan and cold spots concentrated in the western and northern regions. The WY capacity of land-use types was ranked from strongest to weakest as follows: unused land, cultivated land, grassland, construction land, woodland, and water bodies, with cultivated land being the primary source of WY services in Henan Province, accounting for 75% of the total WY. Under the four scenarios, the total WY in Henan Province in 2030 ranked from highest to lowest as follows: HDS, BAU, CPS, and ES. By 2050, the ranking was HDS, BAU, ES, and CPS. Compared to the WY in 2020, the average WY depth in 2030 is projected to increase by 3.95 mm, 2.85 mm, and 1.28 mm and decrease by 0.47 mm under the HDS, BAU, CPS, and ES scenarios, respectively. In 2050, these values are expected to increase by 10.32 mm, 9.21 mm, 1.41 mm, and 8.08 mm, respectively. Henan Province should prioritize the protection of areas with the strongest WY functions, particularly in the southern regions and the topographically complex northwestern areas. A quantitative, cross-regional water resource allocation and management system should be established. Measures such as implementing high-quality development, promoting water-saving irrigation technologies, building a water-saving society, protecting cultivated land, restoring ecosystems, and establishing robust water resource monitoring and early warning systems should be undertaken to improve water resource utilization efficiency and achieve regional sustainable development.
This study’s findings hold practical and policy implications, emphasizing the importance of further investigating ecosystem WY services in Henan Province. It offers significant policy recommendations and encourages future studies to make further advances by addressing model simplification and undertaking a more comprehensive consideration of LULC changes in the province. Moreover, it provides insights into planning for LULC changes and ecosystem service functions in similar regions across the world. Further, it offers substantial support toward the achievement of concomitant scientific decision-making and sustainable development goals.

Author Contributions

Conceptualization, S.W. and Q.W.; data curation, S.W. and C.Y.; formal analysis, S.W.; funding acquisition, Q.W.; investigation, S.W.; methodology, S.W.; project administration, Q.W.; resources, S.W. and T.C.; software, S.W.; supervision, J.H. and Z.Z.; validation, Q.W.; visualization, S.W.; writing—original draft, S.W.; writing—review and editing, S.W. All authors have read and agreed to the published version of the manuscript.

Funding

This research was funded by the Henan Province Philosophy and Social Science Planning Project (grant number 2023BZH002).

Data Availability Statement

The original contributions presented in the study are included in the article; further inquiries can be directed to the corresponding authors.

Acknowledgments

The original contributions presented in the study are included in the article, further inquiries can be directed to the corresponding authors.

Conflicts of Interest

The authors declare no conflicts of interest.

References

  1. Filho, W.L.; Totin, E.; Franke, J.A.; Andrew, S.M.; Abubakar, I.R.; Azadi, H.; Nunn, P.D.; Ouweneel, B.; Williams, P.A.; Simpson, N.P. Understanding responses to climate-related water scarcity in Africa. Sci. Total. Environ. 2022, 806, 150420. [Google Scholar] [CrossRef] [PubMed]
  2. Shen, Y.; Chen, Y. Global perspective on hydrology, water balance, and water resources management in arid basins. Hydrol. Process. 2010, 24, 129–135. [Google Scholar] [CrossRef]
  3. Mekonnen, M.M.; Hoekstra, A.Y. Four billion people facing severe water scarcity. Sci. Adv. 2016, 2, e1500323. [Google Scholar] [CrossRef]
  4. Sánchez-Canales, M.; Benito, A.L.; Passuello, A.; Terrado, M.; Ziv, G.; Acuña, V.; Schuhmacher, M.; Elorza, F.J. Sensitivity analysis of ecosystem service valuation in a Mediterranean watershed. Sci. Total. Environ. 2012, 440, 140–153. [Google Scholar] [CrossRef] [PubMed]
  5. Lang, Y.; Song, W.; Zhang, Y. Responses of the water-yield ecosystem service to climate and land use change in Sancha River Basin, China. Phys. Chem. Earth Parts A/B/C 2017, 101, 102–111. [Google Scholar] [CrossRef]
  6. Zheng, H.; Li, Y.; Robinson, B.E.; Liu, G.; Ma, D.; Wang, F.; Lu, F.; Ouyang, Z.; Daily, G.C. Using ecosystem service trade-offs to inform water conservation policies and management practices. Front. Ecol. Environ. 2016, 14, 527–532. [Google Scholar] [CrossRef]
  7. Wu, L.; Liu, X.; Yang, Z.; Yu, Y.; Ma, X. Is Climate Dominating the Spatiotemporal Patterns of Water Yield? Water Resour. Manag. 2023, 37, 321–339. [Google Scholar] [CrossRef]
  8. Watson, F.G.; Vertessy, R.A.; Grayson, R.B. Large-scale modelling of forest hydrological processes and their long-term effect on water yield. Hydrol. Process. 1999, 13, 689–700. [Google Scholar] [CrossRef]
  9. Su, C.; Liu, H.; Wang, S. A process-based framework for soil ecosystem services study and management. Sci. Total. Environ. 2018, 627, 282–289. [Google Scholar] [CrossRef]
  10. Li, Y.; Chen, P.; Niu, Y.; Liang, Y.; Wei, T. Dynamics and attributions of ecosystem water yields in China from 2001 to 2020. Ecol. Indic. 2022, 143. [Google Scholar] [CrossRef]
  11. Liyun, W.; Weibin, Y.; Zhirong, J.; Shihong, X.; Dongjin, H. Ecosystem health assessment of Dongshan Island based on its ability to provide ecological services that regulate heavy rainfall. Ecol. Indic. 2018, 84, 393–403. [Google Scholar] [CrossRef]
  12. Ellison, D.; Futter, M.N.; Bishop, K. On the forest cover–water yield debate: From demand- to supply-side thinking. Glob. Chang. Biol. 2012, 18, 806–820. [Google Scholar] [CrossRef]
  13. Zhang, L.; Cheng, L.; Chiew, F.; Fu, B. Understanding the impacts of climate and landuse change on water yield. Curr. Opin. Environ. Sustain. 2018, 33, 167–174. [Google Scholar] [CrossRef]
  14. Scordo, F.; Lavender, T.M.; Seitz, C.; Perillo, V.L.; Rusak, J.A.; Piccolo, M.C.; Perillo, G.M.E. Modeling Water Yield: Assessing the Role of Site and Region-Specific Attributes in Determining Model Performance of the InVEST Seasonal Water Yield Model. Water 2018, 10, 1496. [Google Scholar] [CrossRef]
  15. Luo, Y.; Arnold, J.; Allen, P.; Chen, X. Baseflow simulation using SWAT model in an inland river basin in Tianshan Mountains, Northwest China. Hydrol. Earth Syst. Sci. 2012, 16, 1259–1267. [Google Scholar] [CrossRef]
  16. Zhang, X.; Srinivasan, R.; Bosch, D. Calibration and uncertainty analysis of the SWAT model using Genetic Algorithms and Bayesian Model Averaging. J. Hydrol. 2009, 374, 307–317. [Google Scholar] [CrossRef]
  17. Capriolo, A.; Boschetto, R.; Mascolo, R.; Balbi, S.; Villa, F. Biophysical and economic assessment of four ecosystem services for natural capital accounting in Italy. Ecosyst. Serv. 2020, 46, 101207. [Google Scholar] [CrossRef]
  18. Redhead, J.; Stratford, C.; Sharps, K.; Jones, L.; Ziv, G.; Clarke, D.; Oliver, T.; Bullock, J. Empirical validation of the InVEST water yield ecosystem service model at a national scale. Sci. Total. Environ. 2016, 569-570, 1418–1426. [Google Scholar] [CrossRef]
  19. Niu, P.; Zhang, E.; Feng, Y.; Peng, P. Spatial-Temporal Pattern Analysis of Land Use and Water Yield in Water Source Region of Middle Route of South-to-North Water Transfer Project Based on Google Earth Engine. Water 2022, 14, 2535. [Google Scholar] [CrossRef]
  20. Xu, J.; Liu, S.; Zhao, S.; Wu, X.; Hou, X.; An, Y.; Shen, Z. Spatiotemporal Dynamics of Water Yield Service and Its Response to Urbanisation in the Beiyun River Basin, Beijing. Sustainability 2019, 11, 4361. [Google Scholar] [CrossRef]
  21. Dai, E.; Wang, Y. Attribution analysis for water yield service based on the geographical detector method: A case study of the Hengduan Mountain region. J. Geogr. Sci. 2020, 30, 1005–1020. [Google Scholar] [CrossRef]
  22. Gu, K.; Ma, L.; Xu, J.; Yu, H.; Zhang, X. Spatiotemporal Evolution Characteristics and Driving Factors of Water Conservation Service in Jiangxi Province from 2001 to 2020. Sustainability 2023, 15, 11941. [Google Scholar] [CrossRef]
  23. Lei, J.; Zhang, L.; Wu, T.; Chen, X.; Li, Y.; Chen, Z. Spatial-temporal evolution and driving factors of water yield in three major drainage basins of Hainan Island based on land use change. Front. For. Glob. Chang. 2023, 6. [Google Scholar] [CrossRef]
  24. Kim, S.-W.; Jung, Y.-Y. Application of the InVEST Model to Quantify the Water Yield of North Korean Forests. Forests 2020, 11, 804. [Google Scholar] [CrossRef]
  25. Fu, F.; Deng, S.; Wu, D.; Liu, W.; Bai, Z. Research on the spatiotemporal evolution of land use landscape pattern in a county area based on CA-Markov model. Sustain. Cities Soc. 2022, 80, 103760. [Google Scholar] [CrossRef]
  26. Li, X.; Wang, M.; Liu, X.; Chen, Z.; Wei, X.; Che, W. MCR-Modified CA–Markov Model for the Simulation of Urban Expansion. Sustainability 2018, 10, 3116. [Google Scholar] [CrossRef]
  27. Zheng, F.; Hu, Y. Assessing temporal-spatial land use simulation effects with CLUE-S and Markov-CA models in Beijing. Environ. Sci. Pollut. Res. 2018, 25, 32231–32245. [Google Scholar] [CrossRef]
  28. Huang, D.; Huang, J.; Liu, T. Delimiting urban growth boundaries using the CLUE-S model with village administrative boundaries. Land Use Policy 2019, 82, 422–435. [Google Scholar] [CrossRef]
  29. Zhang, D.; Wang, X.; Qu, L.; Li, S.; Lin, Y.; Yao, R.; Zhou, X.; Li, J. Land use/cover predictions incorporating ecological security for the Yangtze River Delta region, China. Ecol. Indic. 2020, 119, 106841. [Google Scholar] [CrossRef]
  30. Liang, X.; Guan, Q.; Clarke, K.C.; Liu, S.; Wang, B.; Yao, Y. Understanding the drivers of sustainable land expansion using a patch-generating land use simulation (PLUS) model: A case study in Wuhan, China. Comput. Environ. Urban Syst. 2021, 85, 101569. [Google Scholar] [CrossRef]
  31. Liu, Y.; Jing, Y.; Han, S. Multi-scenario simulation of land use/land cover change and water yield evaluation coupled with the GMOP-PLUS-InVEST model: A case study of the Nansi Lake Basin in China. Ecol. Indic. 2023, 155, 110926. [Google Scholar] [CrossRef]
  32. Chen, J.; Kasimu, A.; Reheman, R.; Wei, B.; Han, F.; Zhang, Y. Temporal and spatial variation and prediction of water yield and water conservation in the Bosten Lake Basin based on the PLUS-InVEST model. J. Arid. Land 2024, 16, 852–874. [Google Scholar] [CrossRef]
  33. Reheman, R.; Kasimu, A.; Duolaiti, X.; Wei, B.; Zhao, Y. Research on the Change in Prediction of Water Production in Urban Agglomerations on the Northern Slopes of the Tianshan Mountains Based on the InVEST–PLUS Model. Water 2023, 15, 776. [Google Scholar] [CrossRef]
  34. Zhou, P.; Luo, Y.; Song, X.; Wu, H.; Zhang, S.; Li, W.; Li, S.; Song, S. Estimation and prediction of water conservation in Shaanxi Province based on InVEST-PLUS model. J. Soil Water Conserv. 2024, 38, 187–194. [Google Scholar] [CrossRef]
  35. Fan, L.; Cai, T.; Wen, Q.; Han, J.; Wang, S.; Wang, J.; Yin, C. Scenario simulation of land use change and carbon storage response in Henan Province, China: 1990–2050. Ecol. Indic. 2023, 154, 110660. [Google Scholar] [CrossRef]
  36. Zhang, Y.; Gao, Y.; Zhang, Y.; Liang, Z.; Zhang, Z.; Zhao, Y.; Li, P. Assessment of agricultural water resources carrying capacity and analysis of its spatio-temporal variation in Henan Province, China. J. Clean. Prod. 2023, 403, 136869. [Google Scholar] [CrossRef]
  37. Wei, Z.; Ji, D.; Yang, L. Comprehensive evaluation of water resources carrying capacity in Henan Province based on entropy weight TOPSIS—Coupling coordination—Obstacle model. Environ. Sci. Pollut. Res. 2023, 30, 115820–115838. [Google Scholar] [CrossRef]
  38. Jia, Y.; Shen, J.; Wang, H.; Dong, G.; Sun, F. Evaluation of the Spatiotemporal Variation of Sustainable Utilization of Water Resources: Case Study from Henan Province (China). Water 2018, 10, 554. [Google Scholar] [CrossRef]
  39. Wang, C.; Li, K.; Yuan, C. Study of the effects of land use change on water yield in the Qilian Mountains in western China. Ecol. Indic. 2023, 158, 111464. [Google Scholar] [CrossRef]
  40. Wang, R.; Zhao, J.; Chen, G.; Lin, Y.; Yang, A.; Cheng, J. Coupling PLUS–InVEST Model for Ecosystem Service Research in Yunnan Province, China. Sustainability 2023, 15, 271. [Google Scholar] [CrossRef]
  41. Zhang, L.; Dawes, W.R.; Walker, G.R. Response of mean annual evapotranspiration to vegetation changes at catchment scale. Water Resour. Res. 2001, 37, 701–708. [Google Scholar] [CrossRef]
  42. Ren, P.; Wu, T.; Zhou, J. Analysis of spatial distribution pattern and evolutionary characteristics of cultivated lands based on spatial autocorrelation model and GIS platform—A case study of Longquanyi District, Chengdu, China. Chin. J. Eco-Agri Cult. 2016, 325–334. [Google Scholar] [CrossRef]
  43. Ping, J.; Green, C.; Zartman, R.; Bronson, K. Exploring spatial dependence of cotton yield using global and local autocorrelation statistics. Field Crop. Res. 2004, 89, 219–236. [Google Scholar] [CrossRef]
  44. Getis, A.; Ord, J.K. The Analysis of Spatial Association by Use of Distance Statistics. Geogr. Anal. 1992, 24, 189–206. [Google Scholar] [CrossRef]
  45. Xiao, J.; Yuan, C.; Zhang, X. Water conservation function and spatial distribution pattern of ecosystem in Henan Province. Environ. Sustain. Dev. 2017, 42. [Google Scholar] [CrossRef]
  46. Lu, H.; Yan, Y.; Zhu, J.; Jin, T.; Liu, G.; Wu, G.; Stringer, L.C.; Dallimer, M. Spatiotemporal Water Yield Variations and Influencing Factors in the Lhasa River Basin, Tibetan Plateau. Water 2020, 12, 1498. [Google Scholar] [CrossRef]
  47. Han, Y.; Zhang, S.J. Characteristics of runoff variations and their influencing factor in Haihe River Basin. Water Resour and Water Eng. 2021, 32, 7–13. [Google Scholar]
  48. Jiao, S.; Yue, X.; Wang, A.; Zhang, J.; Liu, Q.; Yin, Y.; Ding, H. Study on Spatial Equilibrium of Water Resources in Henan Section of the Yellow River Basin. J. Hebei Norm. Univ. (Nat. Sci. Ed.) 2024, 48, 217–224. [Google Scholar] [CrossRef]
  49. Xue, C.; Zhang, Q.J. Rainfall, runoff evolution and flood and drought disasters in the middle reaches of the Yangtze River. Nat. Disasters 2023, 32, 169–179. [Google Scholar] [CrossRef]
  50. Zhang, Y.; Khan, S.U.; Swallow, B.; Liu, W.; Zhao, M. Coupling coordination analysis of China’s water resources utilization efficiency and economic development level. J. Clean. Prod. 2022, 373, 133874. [Google Scholar] [CrossRef]
  51. Mo, W.; Zhao, Y.; Yang, N.; Xu, Z.; Zhao, W.; Li, F. Effects of Climate and Land Use/Land Cover Changes on Water Yield Services in the Dongjiang Lake Basin. ISPRS Int. J. Geo-Inf. 2021, 10, 466. [Google Scholar] [CrossRef]
  52. Che, X.; Jiao, L.; Qin, H.; Wu, J. Impacts of Climate and Land Use/Cover Change on Water Yield Services in the Upper Yellow River Basin in Maqu County. Sustainability 2022, 14, 10363. [Google Scholar] [CrossRef]
  53. Guo, H.W.; Sun, X.Y.; Lian, L.S.; Zhang, D.Z.; Xu, Y. Response of water yield function of ecosystem to land use change in Nansi Lake Basin based on CLUE-S model and InVEST model. Ying Yong Sheng Tai Xue Bao = J. Appl. Ecol. 2016, 27, 2899–2906. [Google Scholar]
  54. Yang, J.; Xie, B.-P.; Zhang, D.-G. Spatio-temporal variation of water yield and its response to precipitation and land use change in the Yellow River Basin based on InVEST model. Ying Yong Sheng Tai Xue Bao = J. Appl. Ecol. 2020, 31, 2731–2739. [Google Scholar] [CrossRef]
  55. Schiettecatte, W.; D´hondt, L.; Cornelis, W.; Acosta, M.; Leal, Z.; Lauwers, N.; Almoza, Y.; Alonso, G.; Díaz, J.; Ruíz, M.; et al. Influence of landuse on soil erosion risk in the Cuyaguateje watershed (Cuba). CATENA 2008, 74, 1–12. [Google Scholar] [CrossRef]
  56. Pimentel, D.; Harvey, C.; Resosudarmo, P.; Sinclair, K.; Kurz, D.; McNair, M.; Crist, S.; Shpritz, L.; Fitton, L.; Saffouri, R.; et al. Environmental and Economic Costs of Soil Erosion and Conservation Benefits. Science 1995, 267, 1117–1123. [Google Scholar] [CrossRef] [PubMed]
  57. Montgomery, D.R. Soil erosion and agricultural sustainability. Proc. Natl. Acad. Sci. USA 2007, 104, 13268–13272. [Google Scholar] [CrossRef]
  58. Bonan, G.B. Forests and climate change: Forcings, feedbacks, and the climate benefits of forests. Science 2008, 320, 1444–1449. [Google Scholar] [CrossRef]
  59. Houghton, R.A. Revised estimates of the annual net flux of carbon to the atmosphere from changes in land use and land management 1850–2000. Tellus B Chem. Phys. Meteorol. 2003, 55, 378–390. [Google Scholar] [CrossRef]
  60. Zhu, J.; Wang, J.; Fang, W.; Yu, S. Schemes for Allocation of Benefits from Contracted Water-Saving: The Case of Irrigated Field Projects in China. Water Econ. Policy 2023, 9. [Google Scholar] [CrossRef]
  61. Zhao, B.; Li, S.; Liu, Z. Multi-Scenario Simulation and Prediction of Regional Habitat Quality Based on a System Dynamic and Patch-Generating Land-Use Simulation Coupling Model—A Case Study of Jilin Province. Sustainability 2022, 14, 5303. [Google Scholar] [CrossRef]
  62. Zhu, K.; Cheng, Y.; Zhou, Q.; Kápolnai, Z.; Dávid, L.D. The contributions of climate and land use/cover changes to water yield services considering geographic scale. Heliyon 2023, 9, e20115. [Google Scholar] [CrossRef]
  63. Lian, X.-H.; Qi, Y.; Wang, H.-W.; Zhang, J.-L.; Yang, R. Assessing Changes of Water Yield in Qinghai Lake Watershed of China. Water 2019, 12, 11. [Google Scholar] [CrossRef]
  64. Wei, P.; Chen, S.; Wu, M.; Deng, Y.; Xu, H.; Jia, Y.; Liu, F. Using the InVEST Model to Assess the Impacts of Climate and Land Use Changes on Water Yield in the Upstream Regions of the Shule River Basin. Water 2021, 13, 1250. [Google Scholar] [CrossRef]
Figure 1. (a) Location of the study area; (b) study area elevation map; (c) climatic conditions in the study area.
Water 16 02544 g001
Figure 2. Technical roadmap of the study.
Water 16 02544 g002
Figure 3. Drivers of LULC change simulation in Henan Province.
Water 16 02544 g003
Figure 4. (a) The 2020 real map of LULC in Henan Province; (b) 2020 simulation of LULC in Henan Province.
Water 16 02544 g004
Figure 5. Spatial pattern of inter-annual difference in WY in Henan Province from 1990 to 2020. (a) 1990–2000, (b) 2000–2010, (c) 2010–2020, (d) 1990–2020. (Note: The data in the figures represent the water yield of the ending year minus the starting year; for example, 1990–2000 is WY2000–WY1990).
Water 16 02544 g005
Figure 6. Spatial distribution pattern of WY in Henan Province from 1990 to 2020.
Water 16 02544 g006
Figure 7. Vertical gradient changes in LULC and WY depth in Henan Province in 2020.
Water 16 02544 g007
Figure 8. Spatial distribution pattern of hotspots of WY in Henan Province from 1990 to 2020.
Water 16 02544 g008
Figure 9. Changes in WY depth and total WY of different land use types from 1990 to 2020 in Henan Province.
Water 16 02544 g009
Figure 10. Spatial distribution of LULC for 2030 and 2050 under different scenarios: BAU, CPS, ES, and HDS in Henan Province.
Water 16 02544 g010
Figure 11. Spatial distribution pattern of WY depth in Henan Province in 2030 and 2050.
Water 16 02544 g011
Figure 12. Spatial distribution of WY hotspots in Henan Province for 2030 and 2050.
Water 16 02544 g012
Figure 13. Changes in WY depth in the four major watersheds in Henan Province (1990–2020).
Water 16 02544 g013
Table 1. Study data sources.
DataOriginal Resolution (m)Data Resources
LULC30https://doi.org/10.5281/zenodo.5210928
Soil1000http://www.ncdc.ac.cn/
(accessed on 2 November 2023)
Root restricting layer depth1000http://www.ncdc.ac.cn/
PAWC (Plant Available Water Capacity)1000http://www.ncdc.ac.cn/
Precipitation1000https://www.resdc.cn/
(accessed on 16 October 2023)
Evapotranspiration1000https://www.geodata.cn/
(accessed on 9 November 2023)
Watersheds and sub-watersheds30https://www.resdc.cn/
DEM (Digital Elevation Model)30https://www.gscloud.cn/
(accessed on 18 November 2023)
Slope30https://www.gscloud.cn/
Aspect30https://www.gscloud.cn/
Population30https://www.resdc.cn/
GDP30https://www.resdc.cn/
Road network data30https://www.openstreetmap.org/
(accessed on 18 November 2023)
Table 2. Land use type conversion rules in Henan Province under different development scenarios.
BAUCPSESHDS
abcdefabcdefabcdefabcdef
a111011100000111111111111
b111011111011010000111111
c111111111111011100111111
d111111101111000100111111
e111011111111111111111111
f111011000001000001000001
Note: a, b, c, d, e, and f represent cultivated land, woodland, grassland, water bodies, unused land, and construction land, respectively; rows in the matrix represent conversion out, and columns represent conversion in.
Table 3. Average WY depth and total WY in Henan Province from 1990 to 2020.
YearWY Depth (mm)WY (108 m³)
1990224.98407.04
2000260.09482.95
2010226.71415.81
2020210.65398.56
Table 4. Land use area in Henan Province under four scenarios for 2030 and 2050 (km2).
Cultivated LandWoodlandGrasslandWatersUnused LandConstruction Land
2030BAU104,433.4130,382.161401.112099.132.3927,264.98
CPS106,712.5130,422.581409.222106.332.4124,930.12
ES106,633.0530,992.61416.022124.532.4224,414.55
HDS105,061.7230,940.111410.412119.542.4126,048.98
2050BAU96,562.98314,54.9972.962281.662.2934,308.37
CPS98,669.2331,492.26980.462288.322.3132,150.59
ES97,143.1631,971.26979.232303.642.333,183.58
HDS95,859.8231,436.88968.592202.12.135,113.68
Table 5. Changes in the area covered by each land type in Henan Province from 2020 to 2030 and 2050 under four scenarios (km2).
Cultivated LandWoodlandGrasslandWatersUnused LandConstruction Land
2020 108,634.1529,580.761896.872003.52.6723,465.16
2030BAU–4200.74801.4–495.7695.57–0.283799.82
CPS–1921.64841.82–487.65102.77–0.261464.95
ES–2001.11411.84–480.85120.97–0.25949.39
HDS–3572.431359.35–486.46115.98–0.262583.82
2050BAU–12071.171874.14–923.91278.1–0.3810,843.21
CPS–9964.921911.5–916.41284.76–0.368685.43
ES–11,490.992390.5–917.64300.08–0.379718.42
HDS–12,774.331856.12–928.28198.54–0.5711,648.52
Table 6. Predicted WY in Henan Province for 2030 and 2050 and changes of WY between prediction for 2030 (2050) and 2020 under different scenarios.
WY (108 m3)Amount of
Change (108 m3)
WY Depth (mm)Amount of
Change (mm)
2030BAU401.422.85212.541.89
CPS399.851.28211.230.58
ES398.1–0.47210.5–0.15
HDS402.523.95213.192.54
2050BAU407.789.21216.886.23
CPS399.981.41211.310.66
ES406.658.08216.115.46
HDS408.8910.32217.516.86
Table 7. Mean WY of different LULC types in Henan Province for 2030 and 2050 under different scenarios (108 m3).
Cultivated LandWoodlandGrasslandUnused LandConstruction Land
2030BAU259.0457.852.850.01 80.42
CPS273.6051.012.740.071.56
ES262.3158.992.770.0172.88
HDS256.7457.722.850.0184.11
2050BAU242.43 59.59 2.09 0.01 102.25
CPS275.27 50.88 2.00 0.01 70.75
ES243.55 60.83 2.21 0.01 98.68
HDS240.97 59.66 2.08 0.01 104.81
Disclaimer/Publisher’s Note: The statements, opinions and data contained in all publications are solely those of the individual author(s) and contributor(s) and not of MDPI and/or the editor(s). MDPI and/or the editor(s) disclaim responsibility for any injury to people or property resulting from any ideas, methods, instructions or products referred to in the content.

