Article

Evolution and Analysis of Water Yield under the Change of Land Use and Climate Change Based on the PLUS-InVEST Model: A Case Study of the Yellow River Basin in Henan Province

1
Institute of Ecological Environmental Geological Survey, Henan Academy of Geology, Zhengzhou 450001, China
2
Henan Key Library of Groundwater Pollution Control and Rehabilitation, Zhengzhou 450001, China
*
Author to whom correspondence should be addressed.
Water 2024, 16(17), 2551; https://doi.org/10.3390/w16172551
Submission received: 17 July 2024 / Revised: 25 August 2024 / Accepted: 6 September 2024 / Published: 9 September 2024
(This article belongs to the Section Soil and Water)

Abstract

:
Understanding the interrelationships between land use, climate change, and regional water yield is critical for effective water resource management and ecosystem protection. However, comprehensive insights into how water yield evolves under different land use scenarios and climate change remain elusive. This study employs the Integrated Valuation of Ecosystem Services and Trade-offs (InVEST) models, Patch-generating Land Use Simulation (PLUS) model, and Geodetector within a unified framework to evaluate the dynamics of land use, water yield, and their relationships with various factors (meteorological, social, economic, etc.). To forecast the land use/cover change (LUCC) pattern of the Yellow River Basin by 2030, three scenarios were considered: economic development priority (Scenario 1), ecological development priority (Scenario 2), and cropland development priority (Scenario 3). Climate change scenarios were constructed using CMIP6 data, representing low-stress (SSP119), medium-stress (SSP245), and high-stress (SSP585) conditions. The results show the following: (1) from 2000 to 2020, cropland was predominant in the Yellow River Basin, Henan Province, with significant land conversion to impervious land (construction land) and forest land; (2) water yield changes during this period were primarily influenced by meteorological factors, with land use changes having negligible impact; (3) by 2030, the water yield of Scenario 1 is highest among different land use scenarios, marginally surpassing Scenario 2 by 1.60 × 108 m3; (4) climate scenarios reveal significant disparities, with SSP126 yielding 54.95 × 10⁸ m3 higher water yield than SSP245, driven predominantly by precipitation; (5) Geodetector analysis identifies precipitation as the most influential single factor, with significant interactions among meteorological and socio-economic factors. These findings offer valuable insights for policymakers and researchers in formulating land use and water resource management strategies.

1. Introduction

Ecosystem services refer to the benefits that humans derive from ecosystems [1,2]. Rapid economic and social development has led to increased human intervention and encroachment on ecosystems, putting immense pressure on the natural environment. This is evidenced by the sharp decrease in crop areas, water shortages, land desertification, grassland degradation, mining activities, and threats to biodiversity. Currently, about 60% of the ecosystem services provided by natural ecosystems—such as wetlands, forests, grasslands, rivers, and coasts—are degraded or used unsustainably [3].
Water is a key component of ecosystems, providing habitat and material circulation for plants and animals [4,5]. It also produces water-related ecosystem services [6,7,8], which are crucial for maintaining ecosystem functions, ensuring water supply, promoting agricultural production, and regulating arid climates [9,10,11]. Water yield, an important aspect of ecosystem services, estimates freshwater inputs, such as rain, snow, and snowmelt, flowing into streams and rivers. Factors affecting water yield include precipitation, evapotranspiration, basin size and location, and the primary source of water (rainfall or snowmelt). Consequently, water yield is essential for the healthy development of society and ecosystems.
The evolution of human societies has influenced water volume dynamics in numerous ways. As society transitioned from hunter-gatherer communities to industrial societies, water demand increased exponentially, resulting in extensive irrigation practices and engineered waterways [12]. This shift altered natural water yield patterns. Water yield services describe water availability in a basin [13,14]. Evapotranspiration and precipitation primarily affect a basin’s water yield service, which is essentially the difference between precipitation and evapotranspiration [15,16]. Climate and land use significantly impact water yield. At present, global climate change and rapid urban expansion are profoundly affecting regional water resources and potentially affecting water cycle processes [17,18,19,20]. Quantifying and distinguishing the effects of climate and land use changes on water yield is crucial for protecting and allocating water resources within and between regions [21,22,23,24,25]. Yin et al. [26] found that water consumption variability was strongly related to irrigation expansion and ecological restoration, which dominated high water yield variability in the midstream Yellow River Basin (95.73% ± 0.5%). Intensive land use changes, such as deforestation, agricultural expansion, and urban sprawl, have drastically altered the natural landscape, directly affecting local and regional water cycles and water yield [27,28]. Human activities mainly affect water yield by altering land use, which in turn influences local infiltration and evapotranspiration capacity. This effect is based on the different water yield capacities of various land use types, so when human activities alter land use, water yield also changes accordingly [29]. Additionally, climate change, a consequence of social progress, complicates the issue further. Rising temperatures and altered precipitation patterns dramatically change the timing and magnitude of water yield, exacerbating water shortages during dry periods and increasing flood risks during wet periods [30]. Therefore, evaluating the impact of land use and climate change on water yield and analyzing its core driving forces are crucial for understanding the changes and mechanisms in ecosystem water yield under human development.
Ecological protection and high-quality development of the Yellow River Basin are major strategies in China [31]. The water resources system is a composite system composed of ecological environment, living species, and human production activities. where the development and utilization of water resources are based on ecological and economic principles [32,33]. Rapid socioeconomic development in Henan Province has led to increasingly prominent problems of unbalanced and inadequate development, particularly conflicts among water resources, economic development, and the ecological environment [34,35]. The Yellow River Basin in Henan Province includes both mountainous and plain areas, with abundant forests and farmlands. It is one of China’s most important grain-producing and mineral resource areas. In recent years, rapid economic development and continuous urban expansion have led to frequent land use changes [36,37]. Meanwhile, influenced by global climate change, extreme weather events, such as the exceptionally heavy rainstorm on 20 July 2021, occur from time to time. Under the dual impacts of economic development and climate change, studying the spatiotemporal evolution patterns of water yield in the Yellow River Basin of Henan Province and analyzing the main driving factors are crucial. This research is essential for strengthening water resource management, implementing new development concepts, and achieving unity between ecological and economic benefits.
Many scholars have studied the evolution patterns and driving factors of water yield [38,39,40]. Some focus on land use types or meteorological conditions [28,41,42], which have certain limitations in analysis. Therefore, this paper focuses on the Yellow River Basin in Henan Province. It couples the PLUS model and InVEST model using CMIP6 data to analyze different land use development scenarios and meteorological forecast data. By using the Geodetector method to identify the driving forces, this study analyzes and clarifies the main driving mechanisms of land use changes and water yield changes. This research provides a theoretical basis for the intensive use of resources, water resource management, and high-quality, green, and coordinated development in the Yellow River Basin of Henan Province.

2. Study Area and Data Source

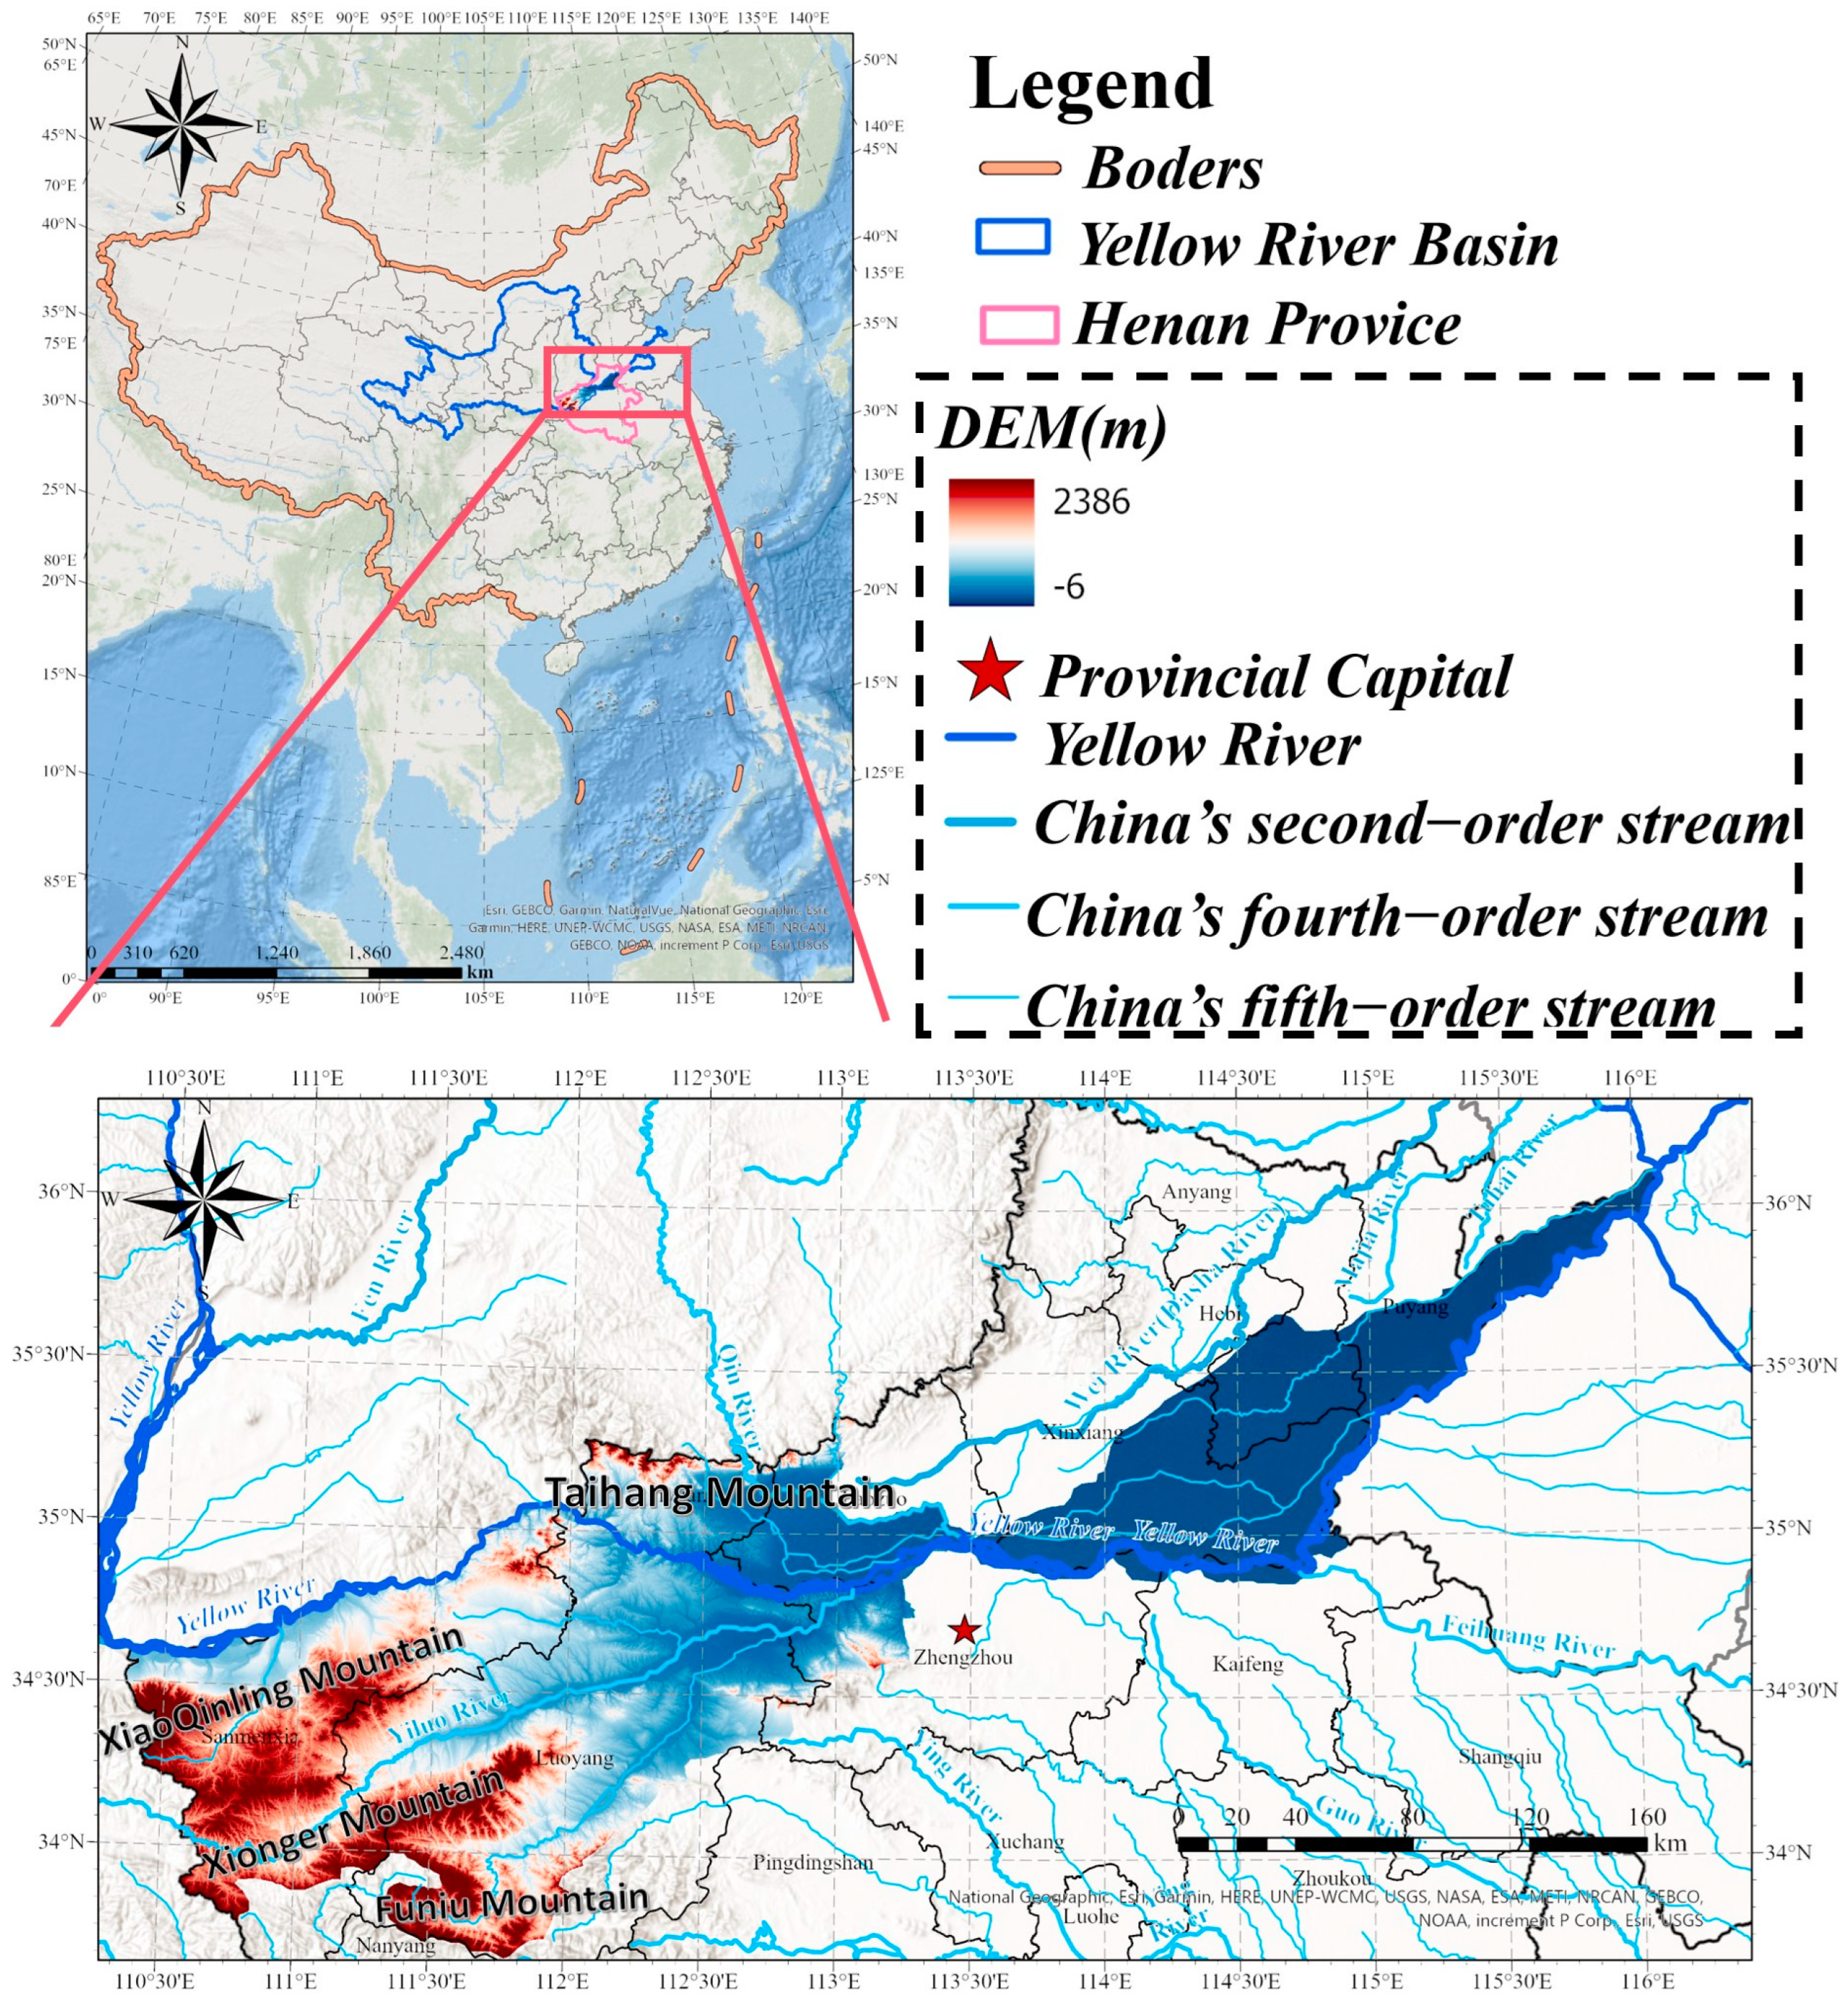
2.1. Study Area Overview

The Yellow River Basin in Henan Province is situated between 33°40′ and 36°07′ N latitude and 36°07′ and 116°07′ E longitude. The study area extends approximately 540 km in length and 167 km in width, covering a total area of 36,574 km2 (Figure 1). It is primarily located in the north-western and north-central regions of Henan Province. The westernmost part marks the junction of the middle and lower reaches of the Yellow River, predominantly in the lower reaches. The study area includes nine prefecture-level cities and one provincial county: Zhengzhou, Kaifeng, Luoyang, Xinxiang, Sanmenxia, Hebi, Anyang, Puyang, and Jiyuan. By the end of 2021, the resident population of these areas was 47,790,700, with an urbanization rate of 57.07%, making it one of the most densely populated regions in the Yellow River Basin.
The terrain is higher in the west and lower in the east. The Taihang and Funiu Mountains in the west delineate the boundary between the second and third echelons of China, while the cities in the middle and east lie within the Huang-Huai-Hai Plain. Henan Province, China’s largest province in terms of agriculture and resources, holds particular significance in the Yellow River Basin. The western region is rich in mineral resources, including the Luanchuan Lengshui–Chitudian Molybdenum Mine, the world’s largest molybdenum mine, located in Luoyang. The eastern plain area boasts extensive farmland and irrigation systems, crucial for ensuring China’s food security.

2.2. River Basin and River Systems
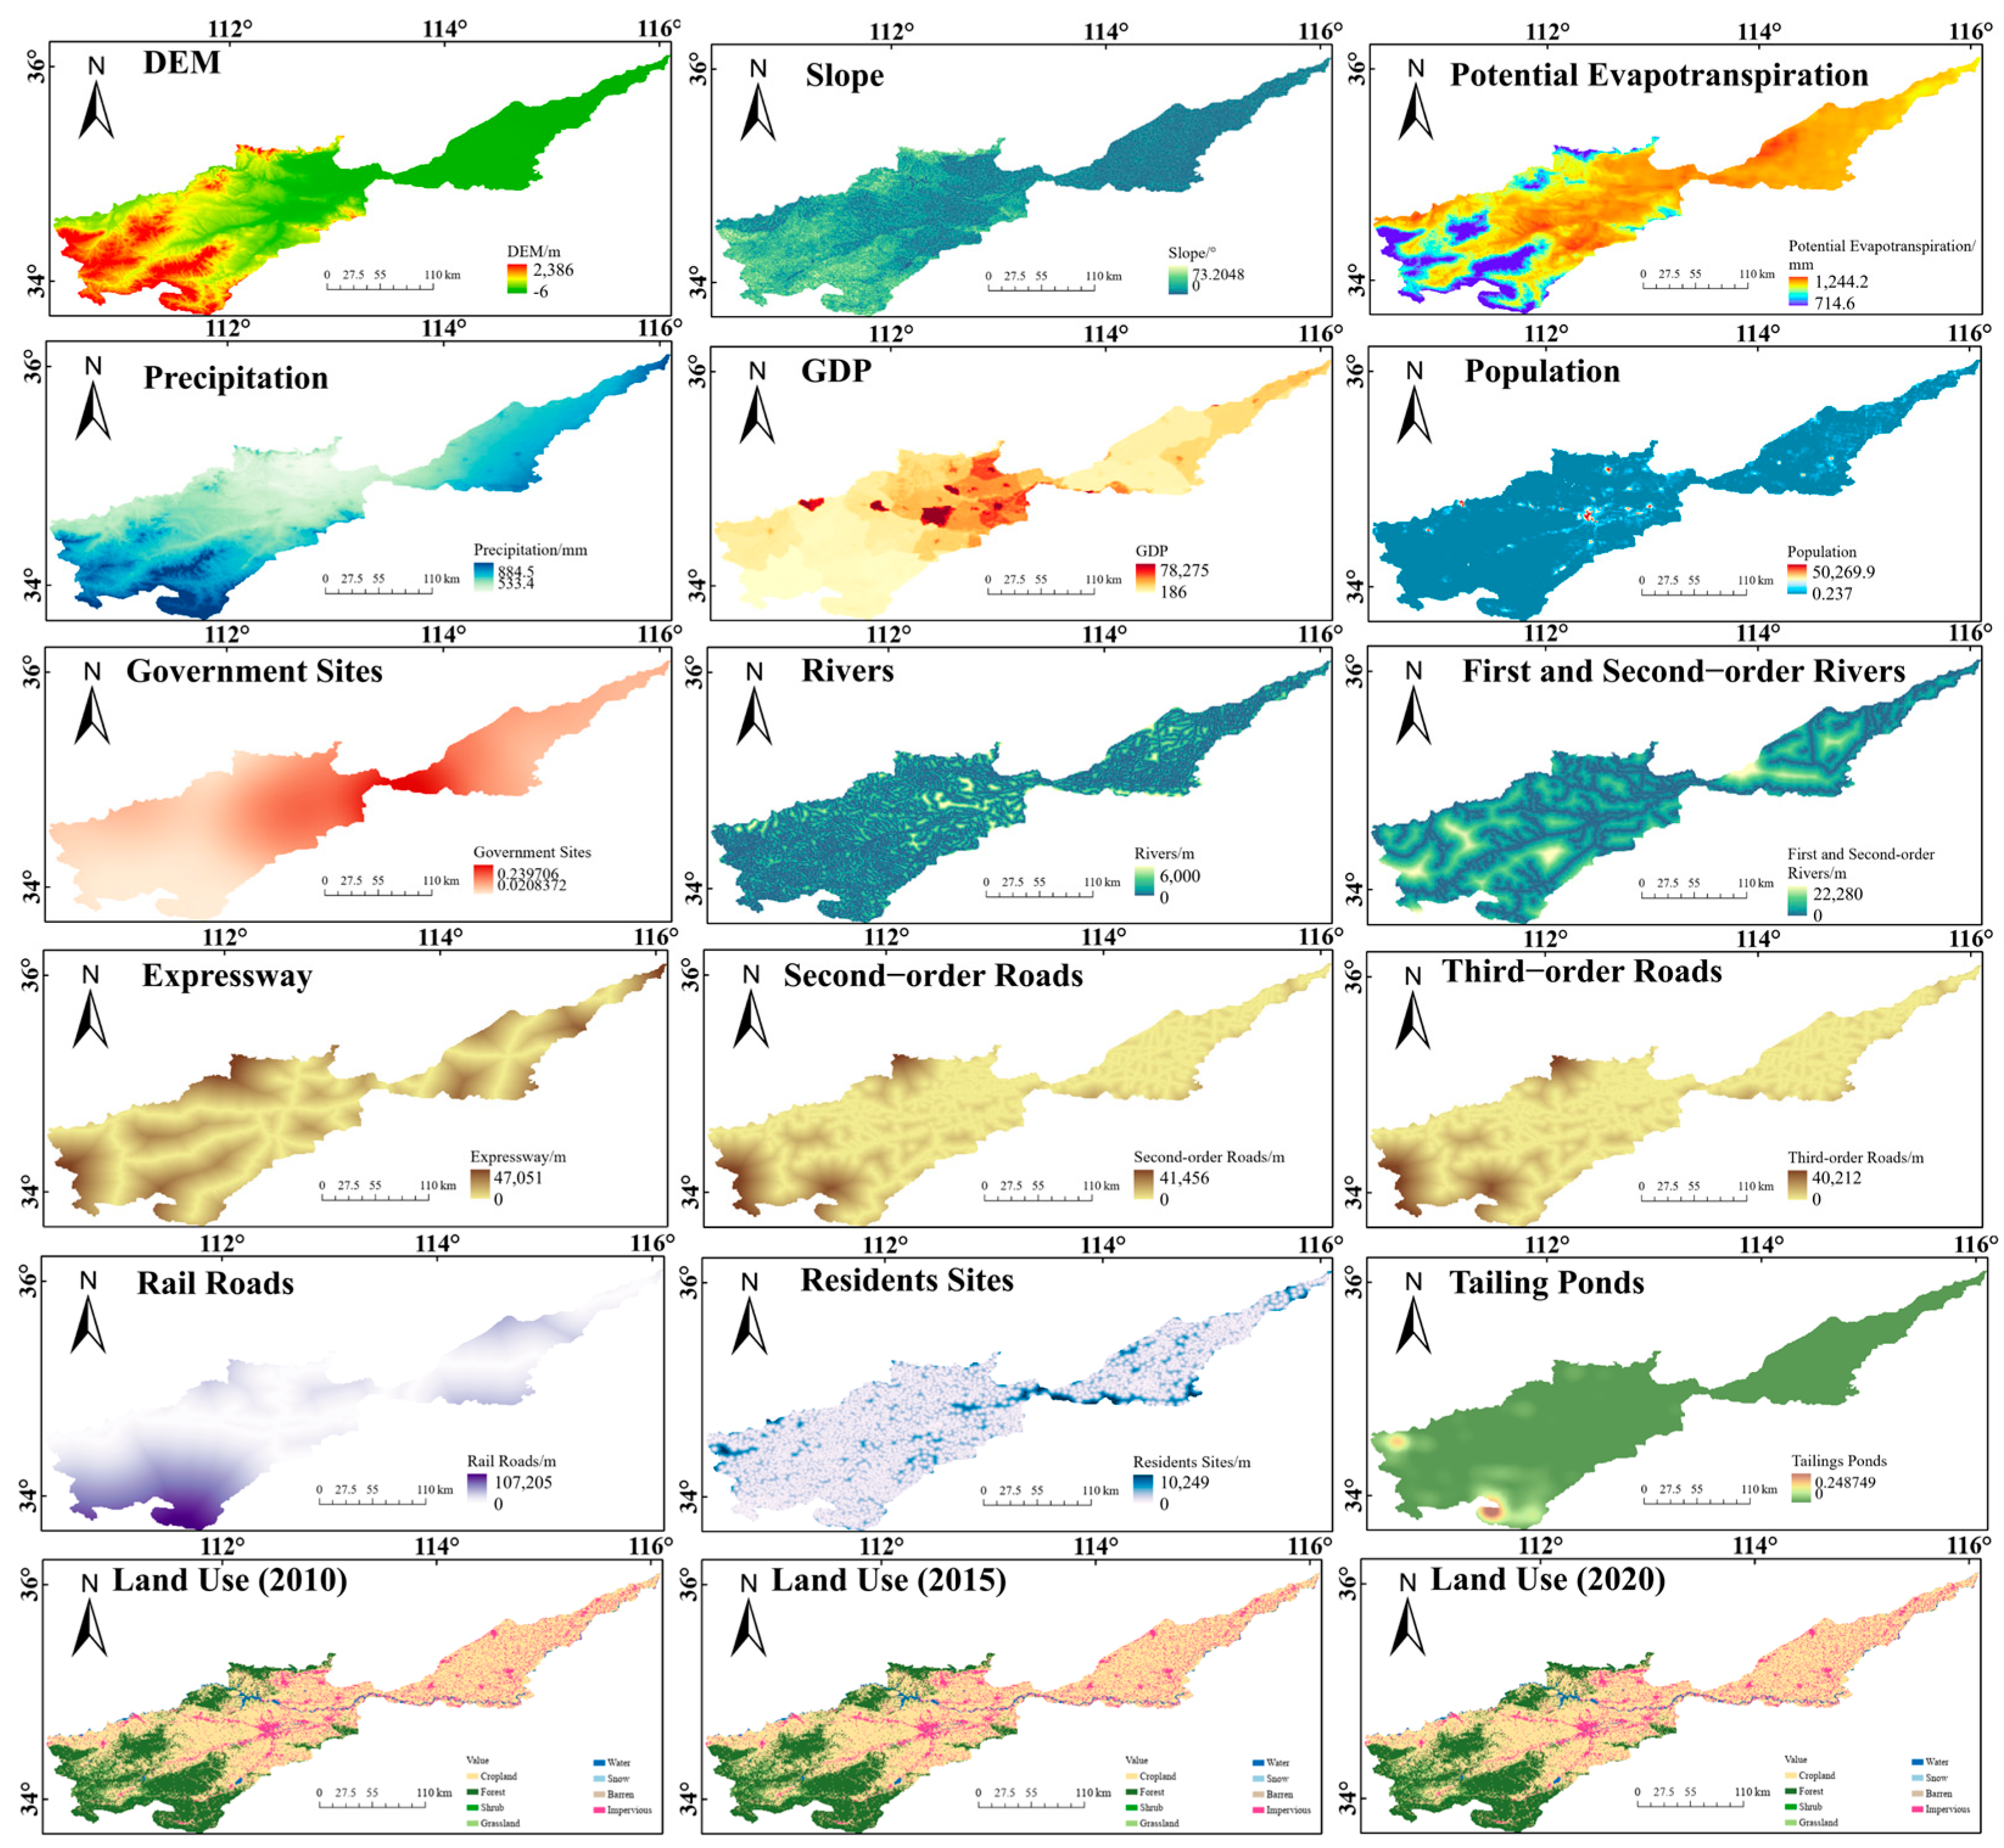
The main stream of the Yellow River enters Henan Province at Lingbao City, flowing through the cities of Sanmenxia, Luoyang, Zhengzhou, Jiaozuo, Xinxiang, Kaifeng, and Puyang. West of Mengjin, the river traverses a narrow valley with rapid currents; east of Mengjin, it enters a plain where the flow slows significantly, leading to substantial sediment deposition and annual riverbed elevation, characterizing it as a wandering river. Below Huayuankou, the riverbed rises 4–8 m above the surrounding terrain, forming a suspended river that poses significant flood risks to downstream regions, making flood control a critical concern. The main stream runs northeast after passing Sanyizhai in Lankao County, forming the border between Henan and Shandong provinces, and exits the province near Zhangzhuang in Taikang County, spanning a total length of 711 km within the province. Major tributaries within the province include the Yi River, Luo River, Qin River, Hongnongjian River, Mang River, Jindi River, and Tianranwenyan Canal. The Yi, Luo, and Qin Rivers are primary sources of floodwaters below Sanmenxia.
Luo River System: The Luo River originates in Lantian County, Shaanxi Province, and flows through Lushi, Luoning, Yiyang, Luoyang, and Yanshi in Henan Province, joining the Yellow River at Shenbei Village in Gongyi City. It has a total basin area of 19,056 square kilometers and a length of 366 km within the province. Its main tributary, the Yi River, originates in Xiongershan, Luanchuan County, and flows through Song County, Yichuan, and Luoyang, joining the Luo River at Yang Village in Yanshi County. The Yi River is 268 km long with a basin area of 6120 square kilometers.
Qin River System: The Qin River originates in Heicheng Village, Pingyao County, Shanxi Province, and enters Henan Province at Huotan Village, Xinzhuang Township, Jiyuan City, flowing through Qinyang, Boai, and Wen County, joining the Yellow River at Fangling, Wuzhi County. Its main tributary, the Dan River, originates in Danzhuling, Gaoping County, Shanxi Province, and flows through Boai and Qinyang, joining the Qin River. The Dan River has a total basin area of 3152 square kilometers and a length of 169 km, with 46.4 km within Henan Province.
Hongnongjian and Mang Rivers: These are hilly rivers that directly flow into the Yellow River. The Hongnongjian River (also known as Xijian River) originates west of Yuyuan, Lingbao County, with a length of 88 km and a basin area of 2068 square kilometers. The Mang River originates in Huayeling, Yangcheng County, Shanxi Province, and enters Henan Province at Kulongshan, northwest of Jiyuan City.
Jindi River and Tianranwenyan Canal: Both are plain slope watercourses. The Jindi River originates in Jingzhang Village, Xinxiang County, with its upper reaches known as the Dasha River, Xiliuqing River, and Hongqi Main Canal. It becomes the main stream of the Jindi River starting at Gengzhuang, Huaxian County, flowing through Puyang, Fan County, and Shandong’s Shen County and Yanggu, joining the Yellow River at Dongzhangzhuang, Taikang County. The main stream is 159 km long with a basin area of 5047 square kilometers. The Tianranwenyan Canal has two sources: the southern branch, Tianran Canal, and the northern branch, Wenyan Canal, both originating in Wanglu South and Wanglu North, Yuanyang County. They converge at Dacheji, Changyuan County, forming the Tianranwenyan Canal, which flows into the Yellow River at Qu Village, Puyang County, with a basin area of 2514 square kilometers. Sediment deposition in the Yellow River raises the riverbed annually, complicating flood discharge during high water periods.

2.3. Data

The data used in this study are categorized into three main types: land use/land cover (LULC) data, meteorological data, and socio-economic data. The meteorological data include historical records and datasets derived from Coupled Model Intercomparison Project Phase 6 (CMIP6) inversion. These data primarily drive the PLUS model and the InVEST model, serving as critical factors for subsequent subsurface probe analysis. The datasets are predominantly sourced from established databases, with some data collected independently. Figure 2 illustrates the data, and Table 1 details the data sources.

2.3.1. Land Use Data

Land use data forms the foundation of this study and is essential for the PLUS model. Land use data from the years 2000, 2010, and 2020 were utilized in this research. The data are sourced from the annual China Land Cover Dataset (CLCD), which is derived from 300,000 Landsat images, incorporating both automatic stabilization samples and visual interpretation samples of existing products [43]. The dataset has a resolution of 30 m. It is based on 5463 independent reference samples, with an overall accuracy of 79.31%. The dataset reflects China’s rapid urbanization and various ecological projects, illustrating the impact of human activities on regional surface coverage amid climate change. The land use data in this study area are divided into seven categories, including cropland, forest land, grassland, impervious land, water, shrubland, and barren land. And impervious land belongs to construction land. This paper follows the naming method in CLCD data.

2.3.2. Meteorological Data

Meteorological data primarily include potential evapotranspiration (PET) and precipitation (PRE). Potential evapotranspiration (PET) constitutes a critical component of both the hydrological cycle and the energy balance, representing the maximum evapotranspiration achievable by a given surface under conditions of unlimited water supply and specific meteorological parameters [44]. PET is frequently correlated with precipitation; higher precipitation typically leads to increased evapotranspiration. However, PET is also influenced by the characteristics of the underlying surface and vegetation [45]. Thus, while PET and precipitation are interrelated, they are governed by distinct factors. In this study, we utilized datasets of precipitation and potential evapotranspiration from the same research team and study to ensure data correlation and consistency.
With both datasets sourced from the National Tibetan Plateau/Third Pole Environment Data Center (https://data.tpdc.ac.cn/ accessed on 5 September 2024), the PET dataset, developed by Prof. Peng Shouzhang’s team, was derived using the Hargreaves model, incorporating monthly mean, maximum, and minimum temperatures. This dataset, featuring a spatial resolution of 1 km, was produced through the Delta downscaling method and a General Circulation Model (GCM) under four representative concentration pathway (RCP) scenarios [46,47,48]. The PRE dataset, published by Prof. Miao Chiyuan’s team, is based on daily precipitation observations from 2839 stations in and around China since 1961. This study applies a monthly precipitation constraint and topographic correction to the traditional dataset construction of the “precipitation background field precipitation ratio field”. The accuracy was evaluated using daily precipitation interpolation data from about 40,000 high-density stations in China from 2015 to 2019 [49]. Both datasets are in NetCDF format with a resolution of 1 km. PET and PRE at a resolution of 30 m were obtained through addition and resampling in ArcGIS v10.8.
At the same time, this study also collected PRE and PET datasets for different future climate change scenarios, sourced from the National Tibetan Plateau/Third Pole Environment Data Center and provided by Professor Peng Shouzhang’s team [48]. The dataset includes future projections of precipitation and potential evapotranspiration for low-stress scenarios (SSP119), medium-stress scenarios (SSP245), and high-stress scenarios (SSP585). The rainfall data are derived from the global climate model dataset with a resolution greater than 100 km, released by the Coupled Model Intercomparison Project Phase 6 (CMIP6), and the global high-resolution climate dataset provided by WorldClim v2.1. These data were generated in China using the Delta spatial downscaling scheme. Potential evapotranspiration data were calculated using the Hargreaves formula. In this study, the GCM model used for potential evapotranspiration is MRI-ESM2, and the GCM model used for precipitation is EC-EARTH. The accuracy of the MRI-ESM2 model has not been disclosed, while mean absolute error (MAE) was 1.85 and the Nash–Sutcliffe efficiency coefficient was 0.92 for EC-EARTH [50].

2.3.3. Topographic Data

The topographic data are based on Aster GDEM v3, released by NASA (Washington, DC, USA), with a resolution of 30 m (https://asterweb.jpl.nasa.gov/gdem.asp accessed on 5 September 2024). By obtaining DEM data, slope data can be calculated in ArcGIS v10.8.

2.3.4. Socio-Economic Data

The socio-economic data encompass multiple facets of socio-economic development, such as population size and density, economic development levels, the extent of urbanization, and infrastructure development. By comprehensively analyzing the relationship between these factors and land use change, we can better understand the driving mechanisms and trends of land use change. Apart from GDP and population, the remaining data are point or line data, with Euclidean distance used to calculate the distance from the object.
Figure 2. Presentation of the different data.
Water 16 02551 g002
Table 1. Dataset of key drivers of land use change in the Yellow River Basin, Henan Province.
Data TypeNameData Resolution/mSource of Data
Land Use DataLand Use30Pixel Information Expert Engine [43]
Meteorological dataPotential evapotranspiration (PET)1000 (resampling to 30 m)National Tibetan Plateau Data Center/Third Pole Environment Data Center [46]
Precipitation (PRE)1000National Tibetan Plateau Data Center/Third Pole Environment Data Center [51]
Topographic dataDEM elevation (DEM)30Aster GDEM v3 [52]
Slope (SLP)30Calculated by DEM using ArcGIS v10.8 to obtain
Socio-economic dataGDP1000 (resampling to 30 m)Pixel Information Expert Engine [53]
Population (POP)1000 (resampling to 30 m)WorldPop [54]
Distance to government (DG)30 (Euclidean distance)National Catalogue Service For Geographic Information [55]
Distance to rivers (DRI)30 (Euclidean distance)
Distance to first and second-order streams (DFSS)30 (Euclidean distance)
Distance to residents (DRE)30 (Euclidean distance)
Distance to expressway (DH)30 (Euclidean distance)
Distance to first-order roads (DFR)30 (Euclidean distance)
Distance to second-order roads (DSR)30 (Euclidean distance)
Distance to third-order roads (DTR)30 (Euclidean distance)
Distance to rial roads (DRR)30 (Euclidean distance)
Distance to tailings pond (DTP)30 (Euclidean distance)Local environmental protection department

3. Research Methodology
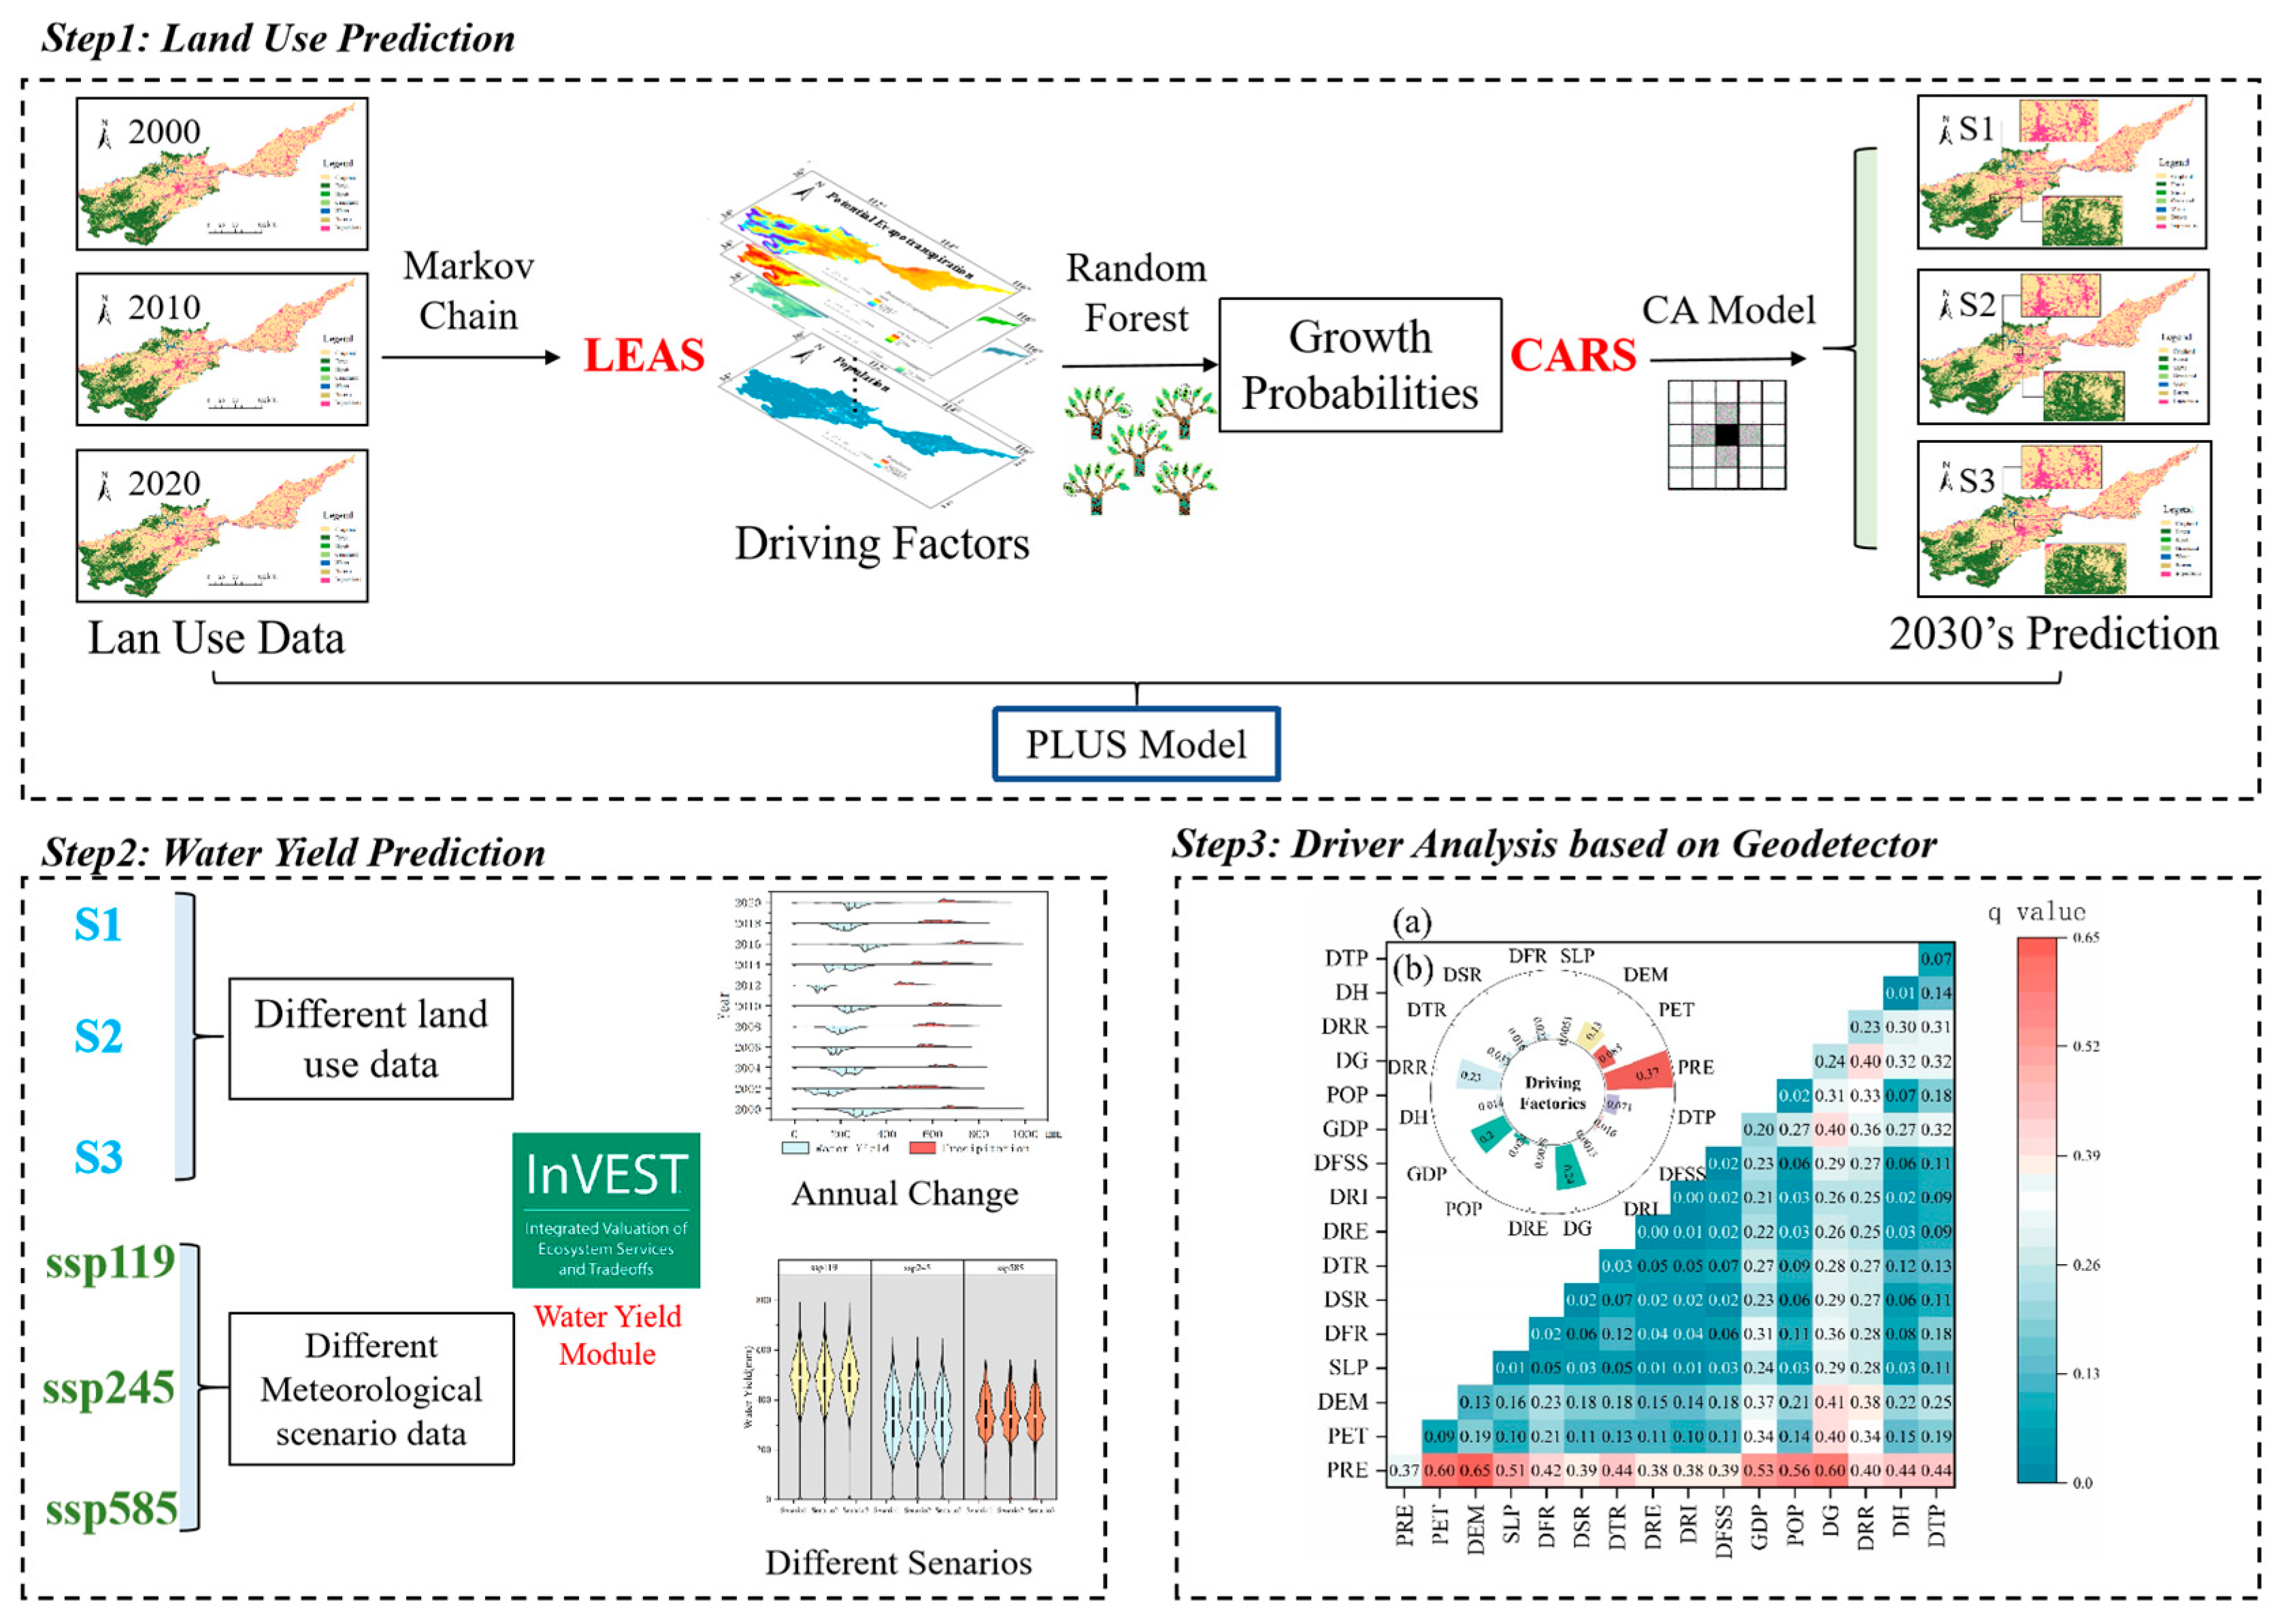
3.1. Methodology

This study adopted a research framework consisting of three main components, as shown in Figure 3. Firstly, the LEAS and CARS modules in the Markov chain and PLUS model were used to quantitatively simulate land use/land cover change demand under two different scenarios. Secondly, the water yield module of the InVEST model was employed to forecast various land use scenarios and different meteorological scenario. Finally, Geodetector v1.0-5 was utilized to analyze the influence of each driving factor on water yield and the interaction between these factors.

3.2. Simulation and Calibration of Water Yield Based on InVEST Model

3.2.1. Water Yield Simulation Based on InVEST Model

In this study, the Water Yield module of the InVEST model was utilized to evaluate the water yield of the Yellow River Basin in Henan Province. Numerous prior studies have employed this model to assess water yield. The InVEST model, being free, open-source, and widely used, is capable of evaluating a variety of ecosystem services, including water yield, water purification, and sediment production services [56,57].
The Water Yield module of the InVEST model determines water yield using a water balance approach. Specifically, it computes the total water output per pixel by deducting the evapotranspiration losses from the precipitation received [58]. The model does not distinguish between surface water and groundwater; instead, it considers the basin as a catchment area, assuming that all pixels within the basin contribute to the water flow at the basin’s outlet. The model’s algorithm operates as follows:
Y x = 1 A E T x P x × P x
where Y x is the water yield of the first year of the image; A E T x is the actual evapotranspiration in the first year of the image; P x is the precipitation in the first year of the image.
The Water Yield module of the InVEST model connects the actual evapotranspiration of a pixel A E T x to the potential evapotranspiration ( P E T ), which is an inherently simpler method. This method employs the Budyko curve [44] to calculate actual evapotranspiration ( A E T ), a method later adopted by Fu (1981) and Zhang et al. (2004) [59,60], as shown in Equation (2):
A E T x P x = 1 + P E T x P x 1 + P E T x P x ω 1 ω
where ω is a non-physical parameter that characterizes the natural climate–soil properties, defined by the following expression [61]:
ω x = Z A W C x P x + 1.25
where A W C x represents the effective water content of plants (mm), and ( Z ) is an empirical constant that reflects local precipitation and hydrogeochemical characteristics, with values ranging from 1 to 30. This is based on studies by Donohue et al. (2012) and Redhead et al. (2016) [61,62]. The value of Z can be approximated as 0.2 × N, where N denotes the annual number of rainfall events.
The potential evapotranspiration P E T x can be determined by multiplying the estimated evapotranspiration E T 0 by the crop coefficient K c , as follows:
PET x = K c x E T 0 x
Here, E T 0 x represents the reference evapotranspiration for pixel ( x ), calculated using the modified Hargreaves equation [49]. The coefficient K c x corresponds to the plant evapotranspiration coefficient associated with the land use type of x pixel. This coefficient adjusts the E T 0 x value based on the specific crop or vegetation type present in each pixel of the land use map. For a comprehensive explanation of the model, please refer to the InVEST User Guide.

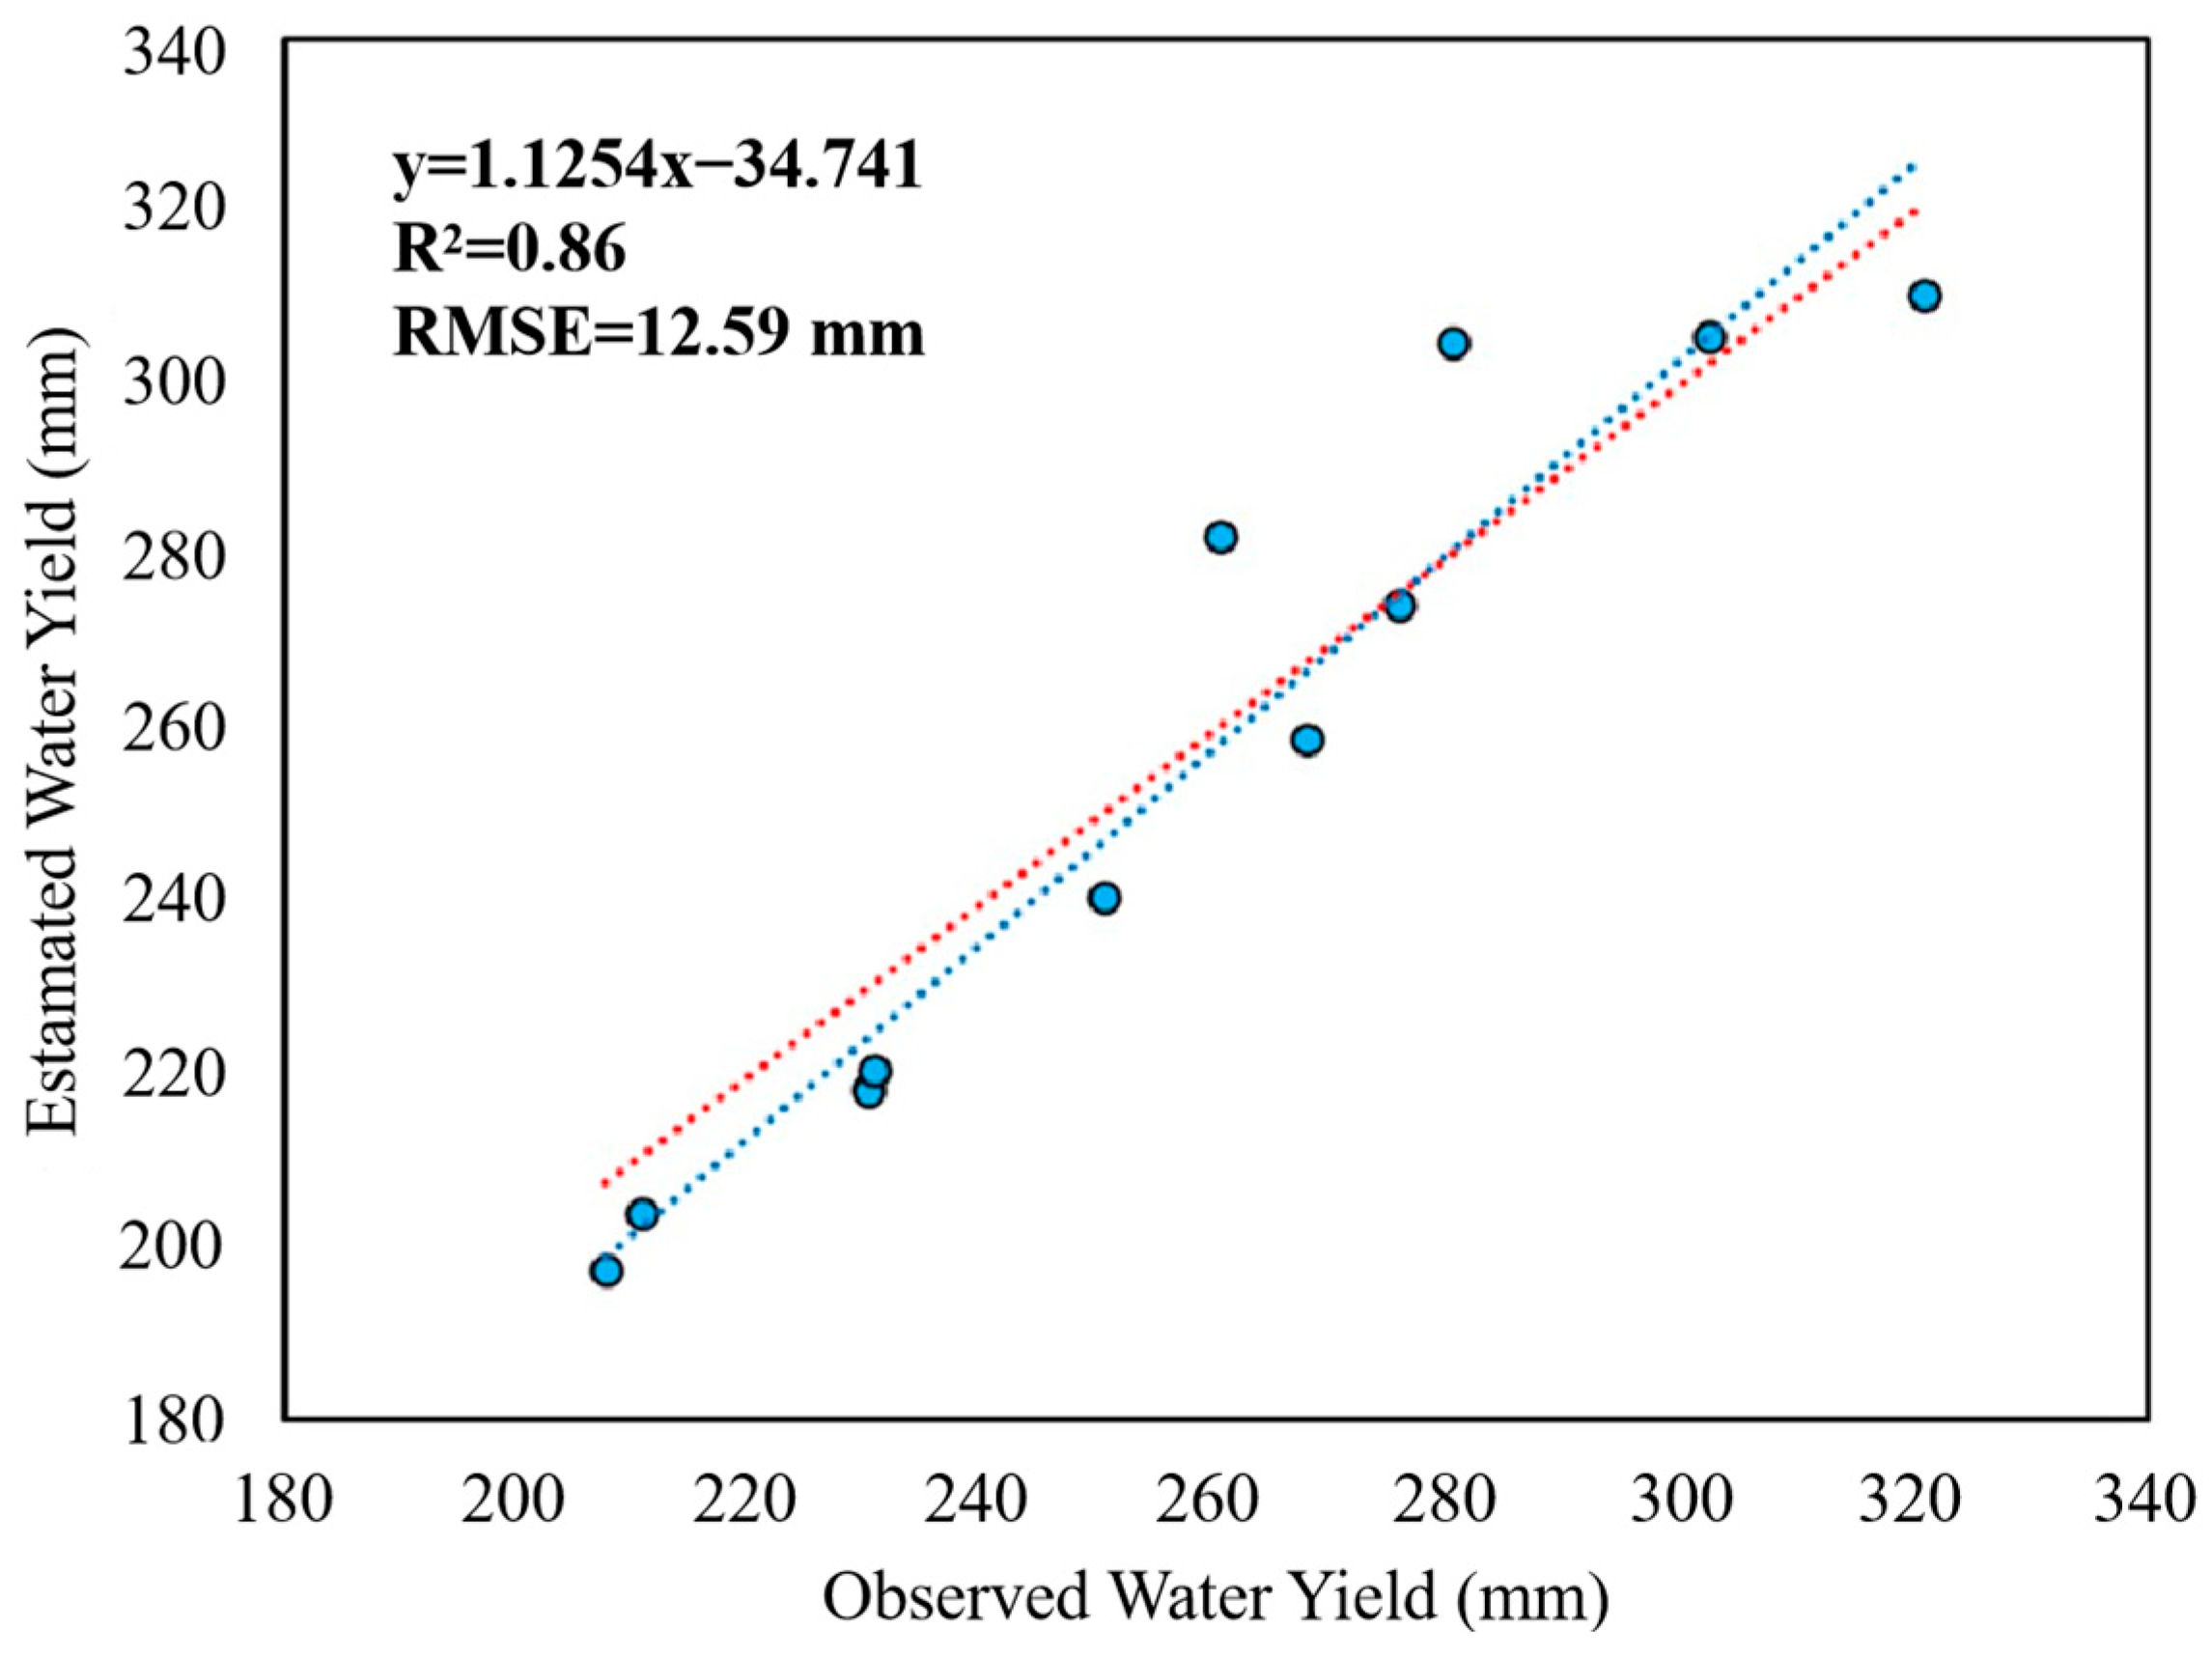
3.2.2. Model Calibration

In order to evaluate the performance of the InVEST model, we collected water production data for three large cities, Sanmenxia City, Luoyang City and Puyang City, within the Yellow River basin in Henan Province. According to this, the parameter “ Z ” of the water production module of InVEST model was adjusted and the model was calibrated. In 2000, 2005, 2010, and 2015, annual water resources data were collected from local water resources statistics (https://slt.henan.gov.cn/ accessed on 5 September 2024). According to the scale of the research region, the data are converted into water production in mm/year.
As shown in Figure 4, the results showed a strong linear relationship between the predicted water yield and the observed water yield (R2 = 0.86, p < 0.01, RMSE = 12.59). The results show that the InVEST model can be used to estimate the average annual water production on a regional scale.

3.3. PLUS Model

The PLUS model is a new patch-level refined land use prediction model developed on the basis of the FLUS model that can consider the role of spatial policy driving [63]. This model has significant advantages in mining the drivers of land use change and simulating the evolution of land use in different scenarios, which makes up for the current land use prediction model. There is a lack of simulation problem on different patch scales. The model integrates two modules: LEAS (Land Expansion Analysis Strategy) and CARS (CA based on Multiple Random Seeds). Existing land use prediction models, such as Cellular Automata (CA), can simulate complex land use and land cover (LULC) changes but fail to enhance understanding of the mechanisms driving these changes. They also lack the capability to simulate landscape evolution at the patch scale, limiting their policy-making utility. Our study introduces the Patch-level Land Use Simulation Model (PLUS), integrating the Land Expansion Analysis Strategy (LEAS) and CA with Multiple Random Seeds (CARS). This model identifies drivers of land expansion and predicts landscape evolution with higher precision and similarity. Additionally, a Markov chain is used to predict future land use demand, enhancing long-term prediction reliability.

3.3.1. LEAS (Land Expansion Analysis Strategy)

The LEAS module can randomly extract transformation samples of land use expansion areas for training, mine land transformation rules based on random forest algorithms, and obtain the development probability and contribution of driving factors of various types of land use. The calculation formula is shown in Equation (5):
P i , k d x = n = 1 M   I h n x = d M
where x represents the vector composed of multiple driving factors; d is a binary variable with the value of 1 or 0. If the value is 1, it means that other land use types are converted to land use type k. If the value is 0, it means that other conversion methods exist. h n x represents the prediction type of the x-vector decision tree; I h n x = d is an indicator function representing the set of decision numbers; M is the total number of decision trees.

3.3.2. CARS (CA Based on Multiple Random Seeds)

The CARS module combined with random seed generation and a threshold decline mechanism simulate the automatic evolution of various land use patches under the constraint of development probability. The calculation formula is as follows:
O P i , k d = 1 , t = P i , k d = 1 × Ω i , k t × D k t
where P i , k d = 1 , t represents the growth probability of land class k at unit i ; D k t is the future impact on class k , which depends on the gap between the number of units in iteration t and the target demand of class k in the region. And Ω i , k t represents the neighborhood effect of pixel i , that is, the proportion of class k in the neighborhood.

3.3.3. PLUS Simulation Strategy and Scenarios Setting

In this study, based on the PLUS model, the LEAS module was used to calculate the development probability of various land types in the Yellow River Basin of Henan Province from 2000 to 2010 and the contribution rate of driving factors to the conversion of each land type during this period. The land demand for 2020 was then obtained through the Markov chain calculation. Subsequently, the transfer cost matrix and neighborhood weights were adjusted according to the land use changes in the research area from 2000 to 2020 and relevant policies and regulations. The CARS module was then used to simulate and predict the land use changes in the Yellow River Basin of Henan Province in 2020. By comparing and validating the 2020 predictions, the Figure of Merit (Fom) was determined to assess the model’s rationality. If the model validation proved reasonable, the same parameters were used to estimate land use in 2030.
To explore the land use changes in the Yellow River Basin under different development goals, this paper set up scenarios based on previous studies [64]: economic development priority (Scenario 1), ecological protection priority (Scenario 2), and farmland protection priority (Scenario 3) to predict the land use spatial pattern in the Yellow River Basin of Henan Province in 2030. Under the cropland protection scenario, the conversion of farmland to other land types was restricted. Under the ecological priority scenario, the conversion of forest land and water areas to other land types was restricted. The cost settings for each scenario are shown in Table 2. In fact, the policy towards China is more inclined towards cropland protection, so Scenario 3 may be more appropriate to the actual scenario. In Scenario 2 and Scenario 3, only forest land and impervious land are allowed to be converted into cropland land.

3.4. Geodetector

The simulation results of the InVEST model can only visually display water yield and its spatiotemporal changes, but cannot explain the attribution of significant spatial heterogeneity in the simulation results. Therefore, to further analyze the influencing factors of water yield, it is necessary to use the mature Geodetector v1.0-5 model to explore the causes of spatial heterogeneity. Geodetector v1.0-5 is a statistical method for detecting spatial differentiation and revealing the spatial differentiation of various elements. It was proposed by Wang Jingfeng and others, and consists of modules such as differentiation and factor detection, interaction detection, ecological detection, and risk detection, which study the spatial differentiation of elements from different perspectives for different detection contents [65].
This paper takes the water yield in the Qinghai Lake Basin as the dependent variable and uses Geodetector v1.0-5 to determine its influencing factors in different regions. The influencing factors include topography, climate, and land use (Table 1). In the water yield factors, meteorological factors include potential evapotranspiration (PET) and precipitation (PRE); topographic factors include DEM and slope (SLP); socio-economic factors include distance to rivers (DRI), and distance to first and second-order streams (DFSS). Refer to Table 1 for specific factors. For the construction of the mesh linking factors, this paper generated a total of 396,163 points at 300 m × 300 m intervals to conduct multi-factor spatial correlation analysis.

4. Results

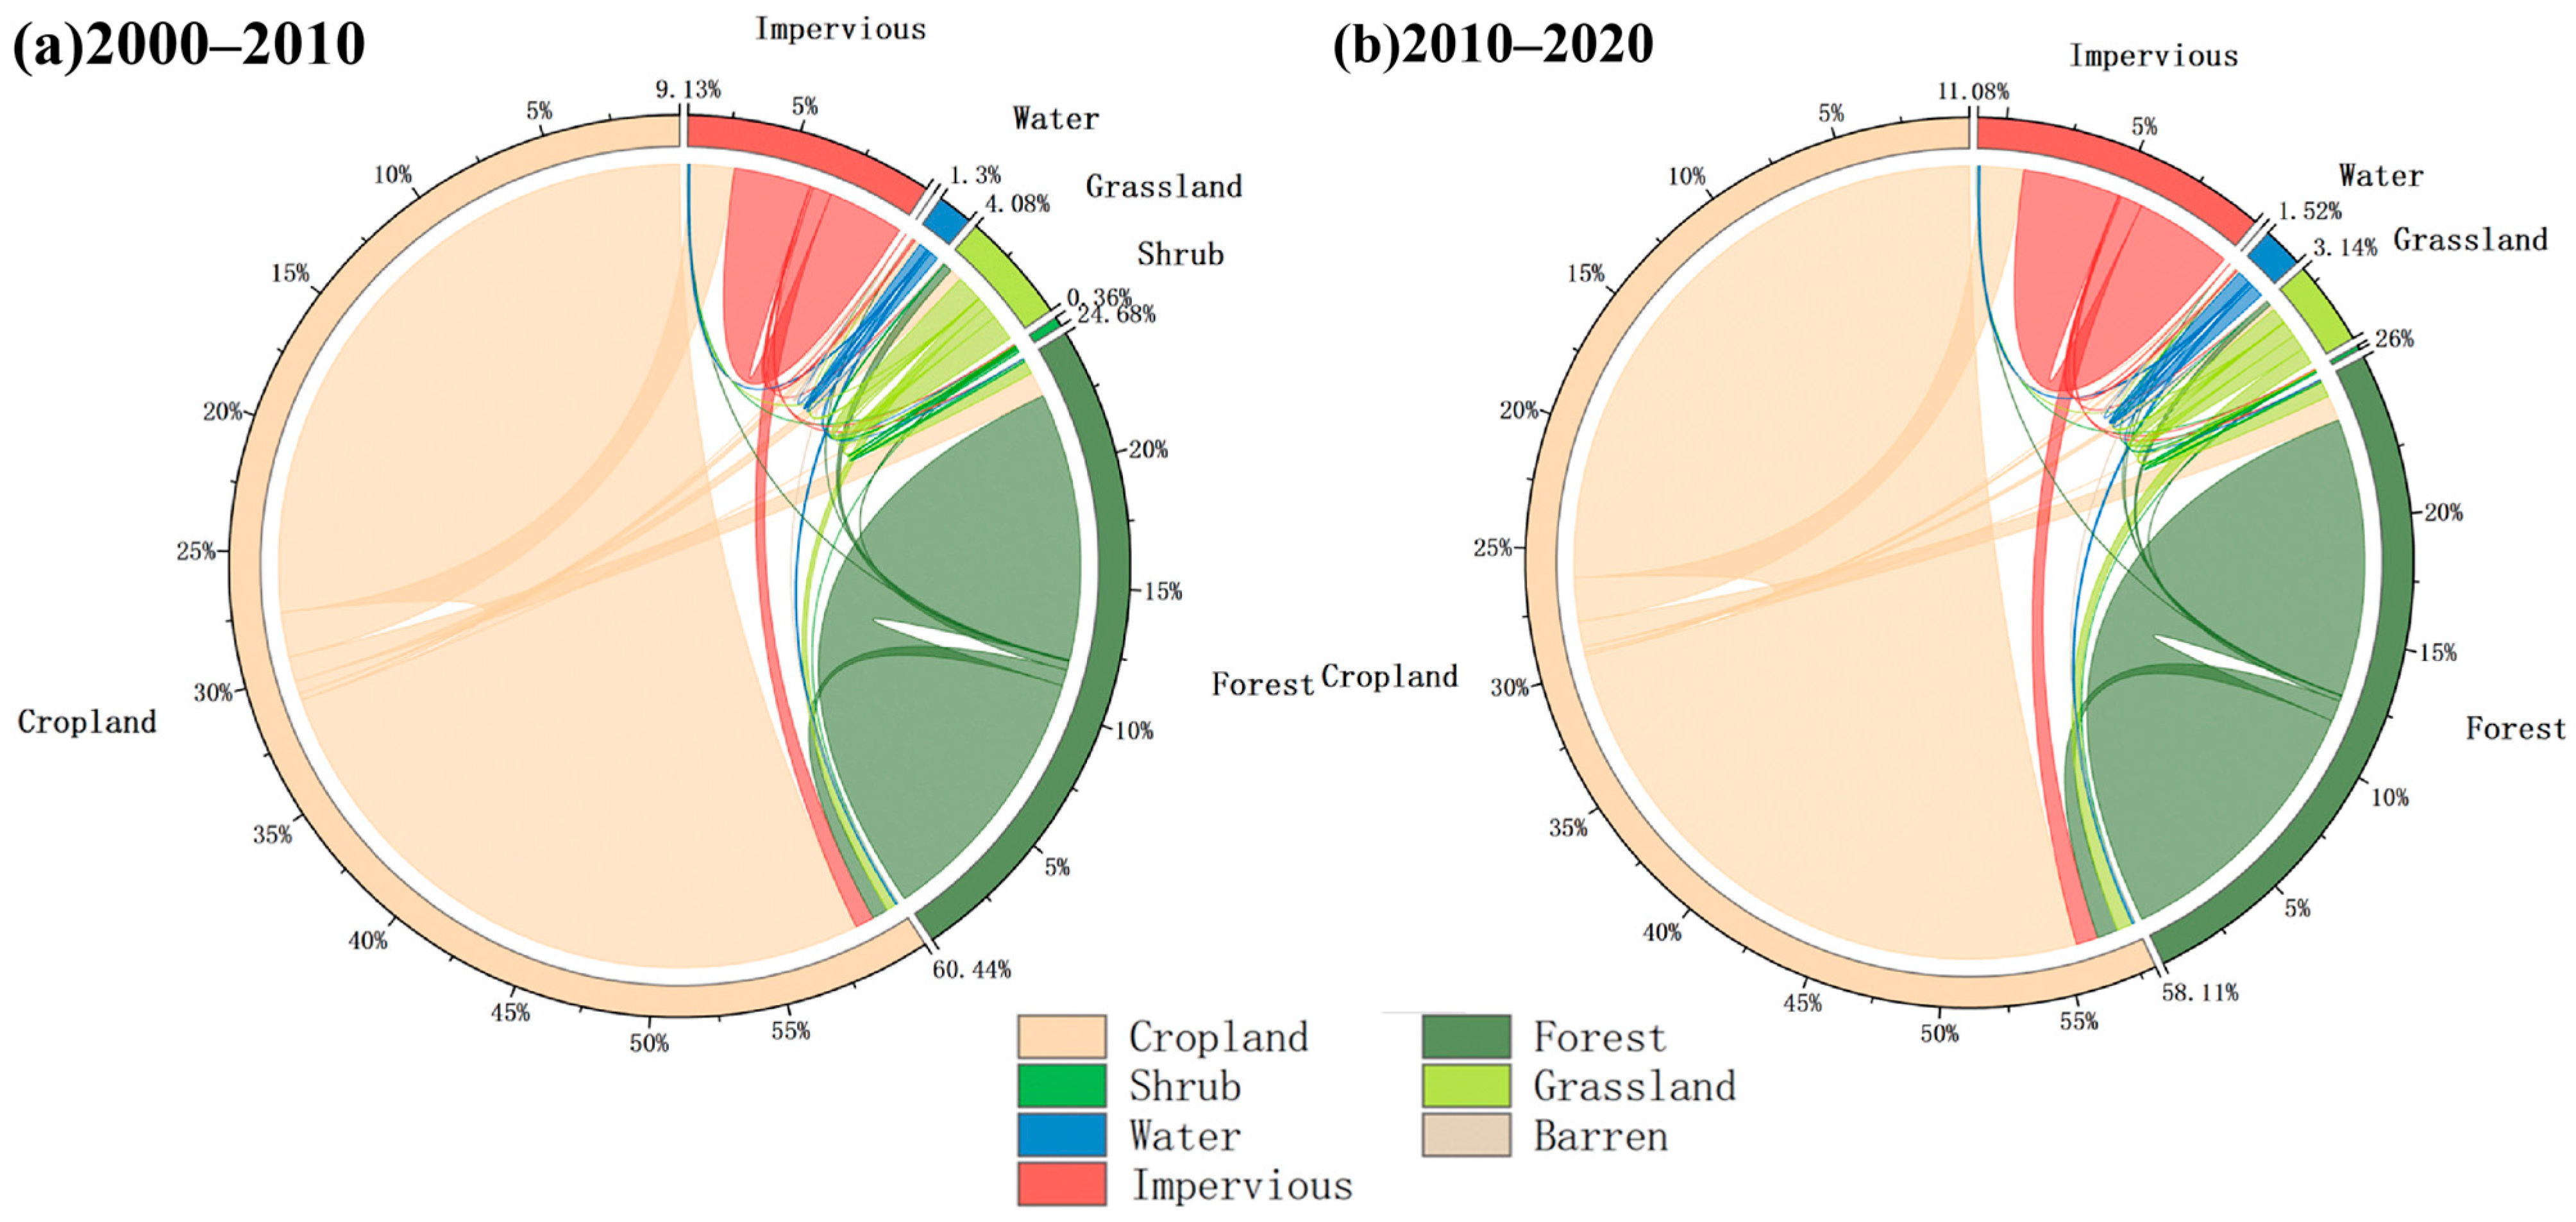
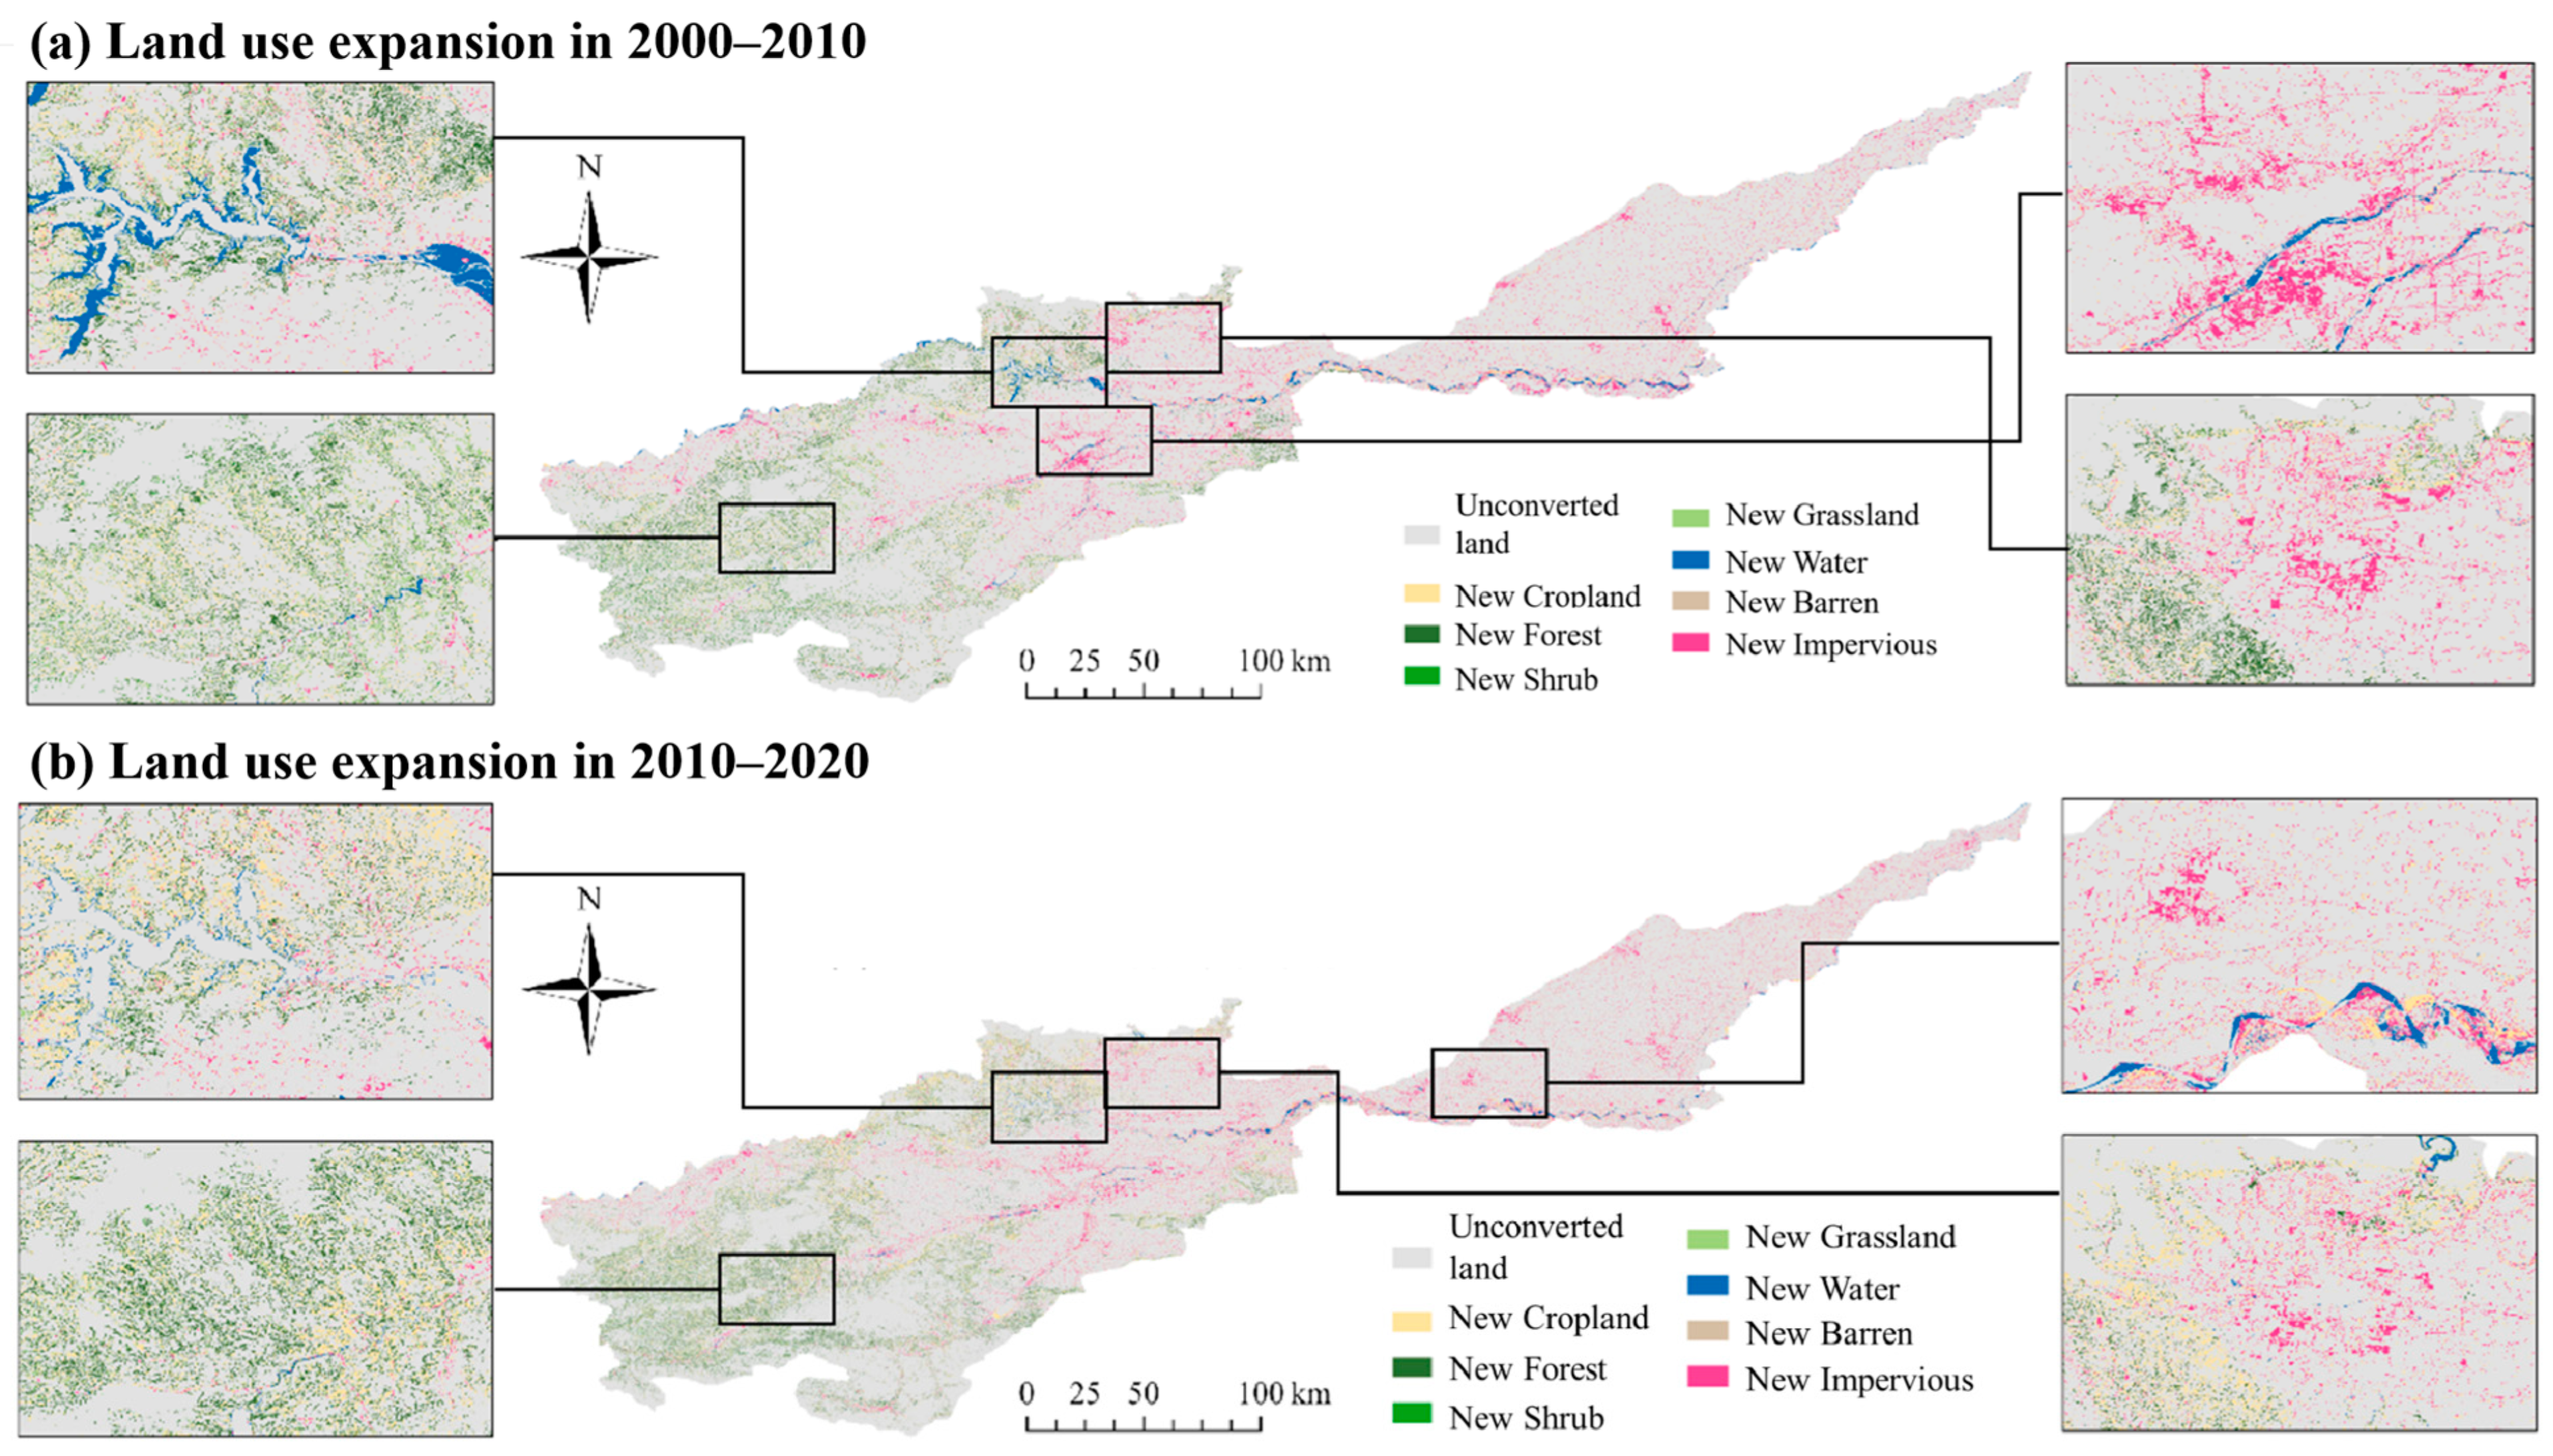
4.1. The Change of Land Use

4.1.1. Interannual Variation of Land Use

Land use changes during each period were analyzed and are presented in Figure 4. The distribution of land use in the Yellow River Basin of Henan Province was described for the periods 2000–2010 and 2010–2020. Land use types included cropland, impervious land (construction land), forest land, grassland, water, shrubland, and barren land. From 2000 to 2010, significant changes in land use occurred, particularly in the conversion of cropland, which amounted to 2592.73 km2. Approximately 50.01% of this transferred cropland was converted to impervious land, 28.29% to forest land, and only 0.34 km2 to barren land (Figure 5a). During the period 2010–2020, the conversion of cropland remained significant, totaling 2293.34 km2. During this period, impervious land had the highest conversion rate, accounting for approximately 56.30% of the total conversion (Figure 5b).
To further understand the directional and structural characteristics of land use change in the Yellow River Basin of Henan Province, this study constructed a land use transfer matrix (Table 3) and a new land use distribution map (Figure 6). The data indicate that cropland and forest land are the primary land use types, comprising approximately 84% of the total land area. From 2000 to 2020, the area of construction land increased by 1381.0 km2, raising its proportion of the total land area from 8.1% to 12.0%. This increase is mainly due to rapid urbanization and economic growth, which significantly expanded the construction land area, leading to the conversion of considerable amounts of arable land into construction land. The new construction land primarily originates from cultivated land, with changes occurring mainly in marginal areas as existing construction land expands outward. Consequently, the area of cultivated land decreased by 1662.1 km2, reducing its proportion from 62.1% to 57.5%. The primary conversions of cultivated land were to construction land, forest land, and grassland, accounting for 56.30%, 32.96%, and 7.00% of the total reduction, respectively. The conversion of cultivated land to forest and grassland is mainly concentrated in areas targeted by farmland-to-forest and wetland restoration projects. In contrast, the conversion to construction land is more prominent in economically developed areas of the Yellow River Basin, such as Luoyang and Xinxiang.

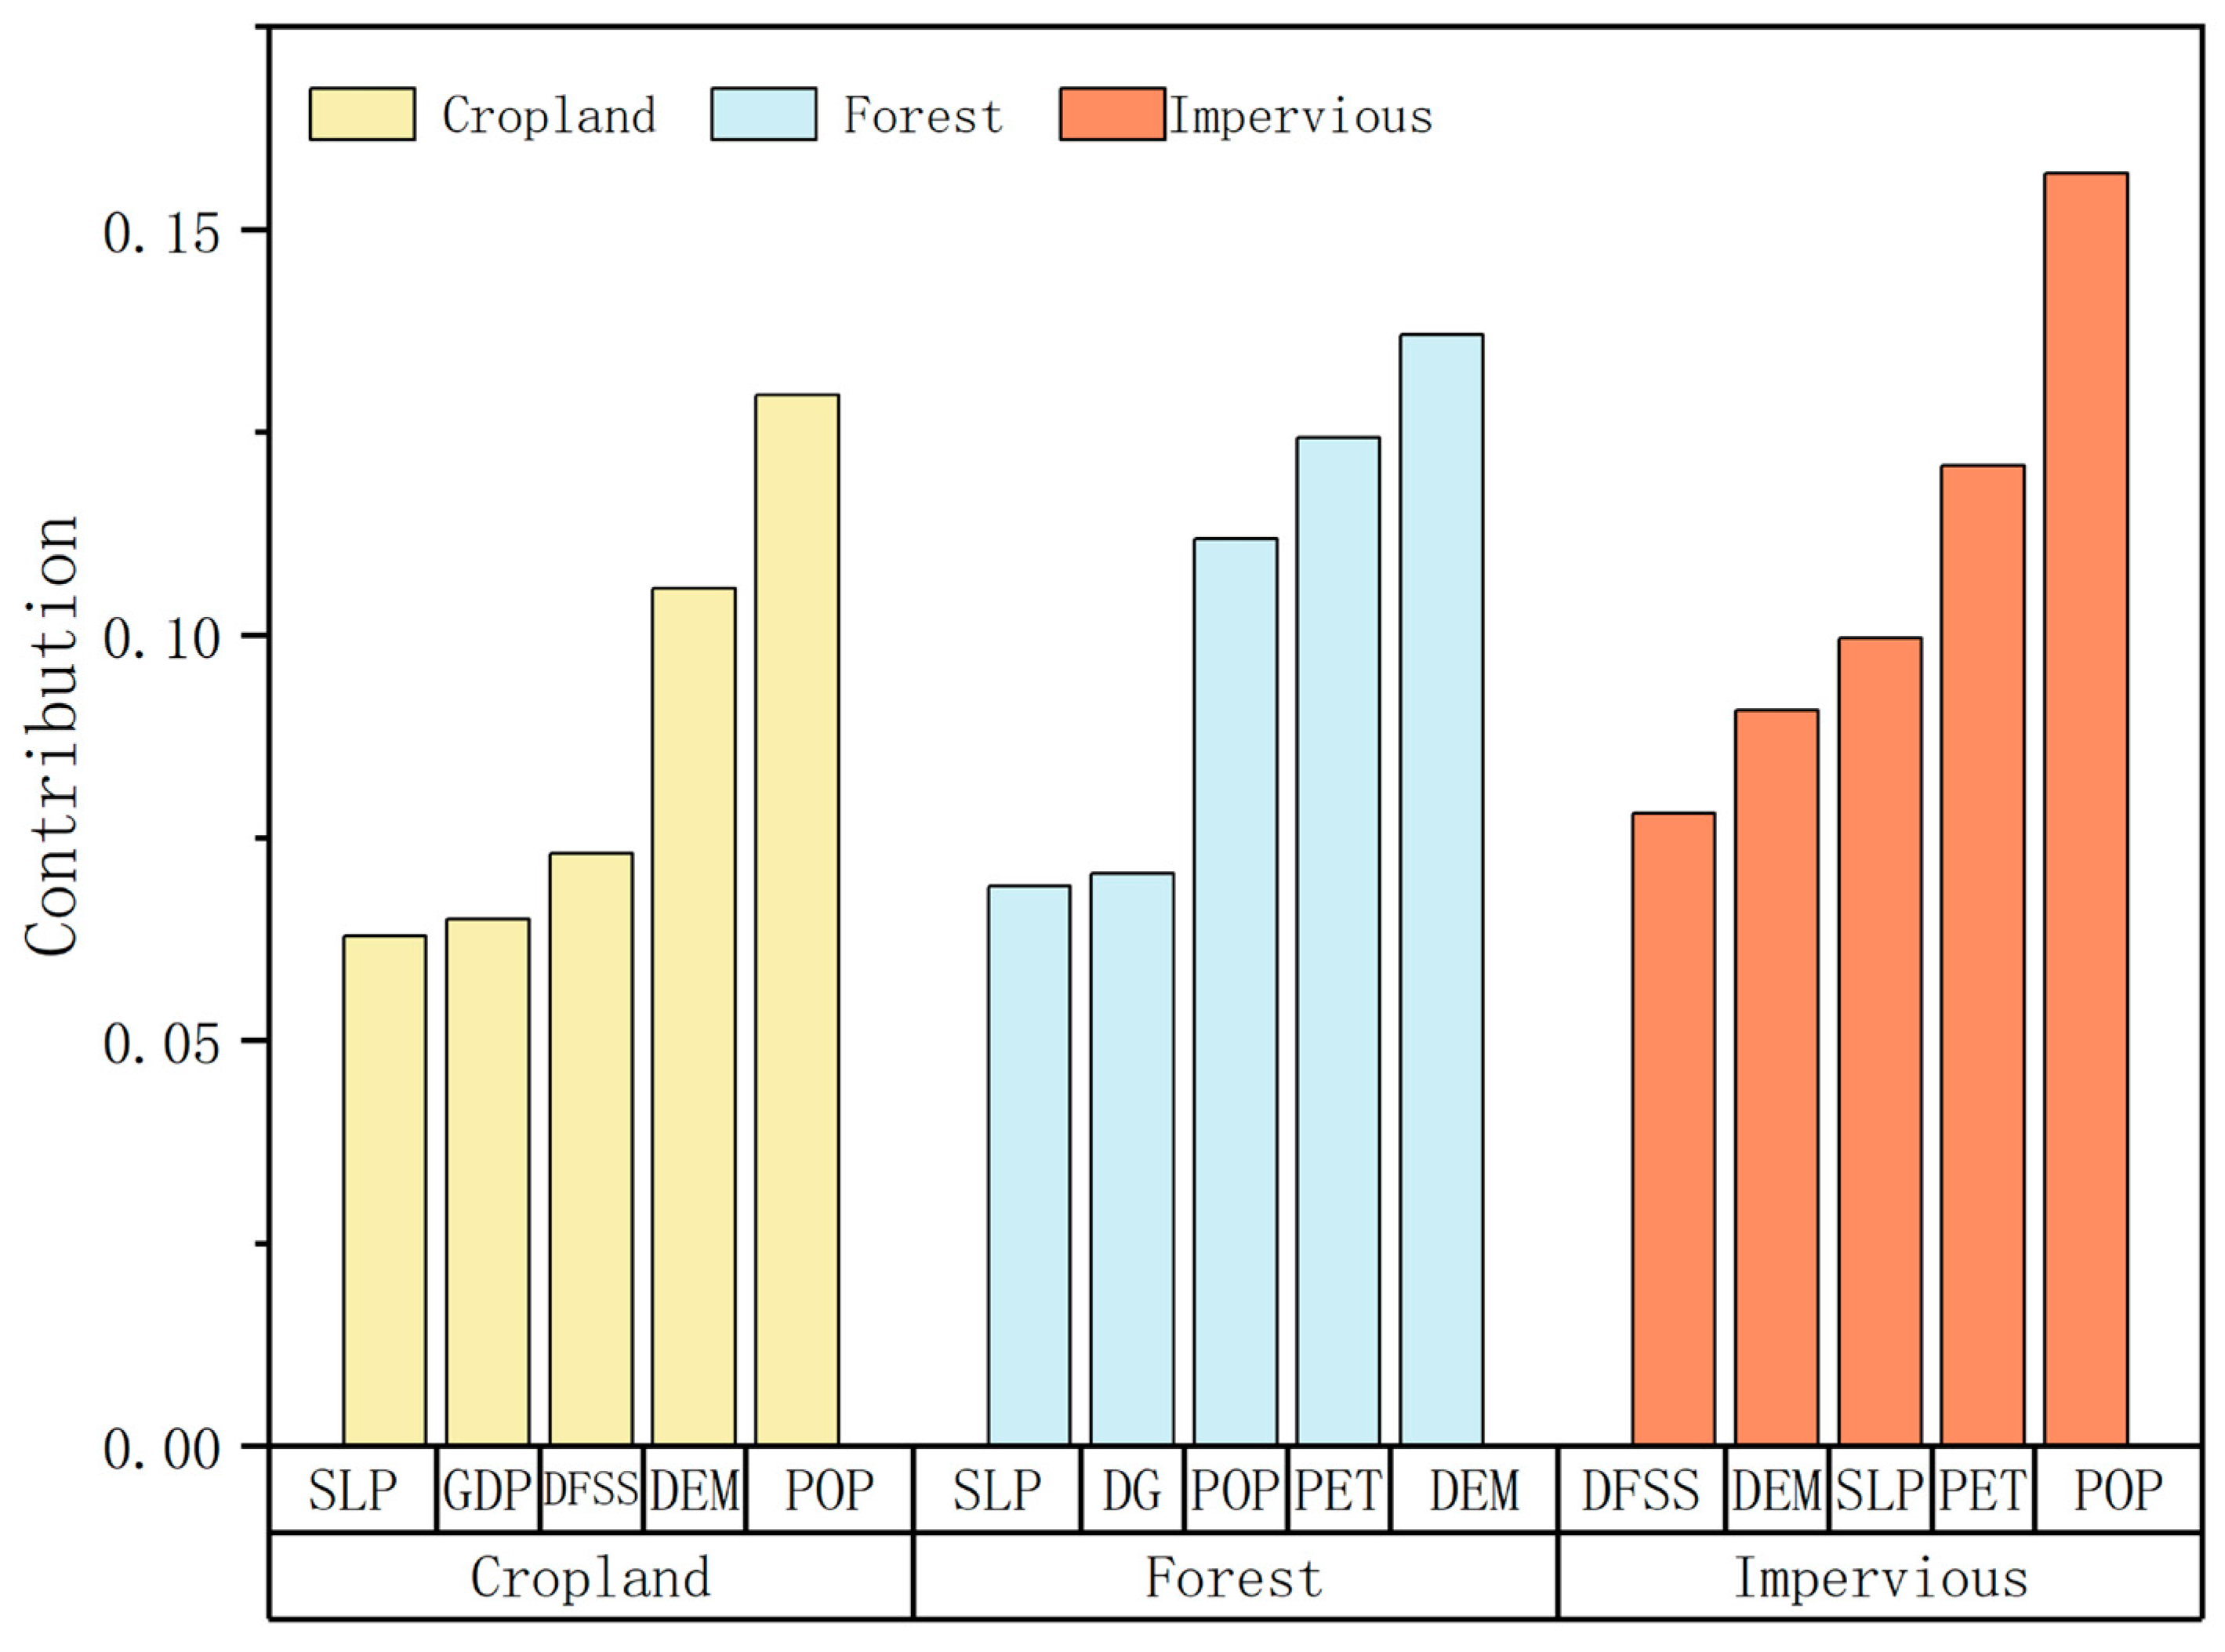
4.1.2. Driving Factor Contribution Degree

The Land Expansion Analysis Strategy (LEAS) of the PLUS model evaluates the contribution of driving factors, as shown in Figure 7. Simulation results of 16 driving factors indicate that the most significant for cropland, forest land, and impervious land are population (POP), the Digital Elevation Model (DEM), and potential evapotranspiration (PET), with average contributions of 0.127, 0.133, and 0.162, respectively.
Population (POP) accounted for a high proportion of contributions across all land use types. Additionally, potential evapotranspiration (PET) from meteorological data significantly contributed to different land uses, particularly forest land. The analysis of contributions indicates that land use change in the Yellow River Basin of Henan Province is greatly influenced by human activities. Frequent human activities significantly affect land types and natural conditions.

4.1.3. Land Use Forecasting

Using land use data from 2000 and 2010, the PLUS model predicted the land use distribution for 2020. Actual land use data from 2020 were input into the verification module, yielding a Kappa coefficient of 0.75. This indicates high accuracy and consistency in the PLUS model’s predictions. The Fom coefficient indicates the correlation between predicted and actual land use development trends. A higher coefficient suggests greater consistency with the actual trend. Generally, a Fom coefficient greater than 0.15 indicates a reliable prediction. In this study, the Fom coefficient is 0.29, indicating good agreement between the predicted and actual trends, confirming the model’s reliability. Similarly, the same parameters were used to forecast land use in 2030 based on 2010 and 2020 data. The results are shown in Figure 8.
In the predicted 2030 land use (Table 4), the trend continues: cropland and grassland areas shrink, while forest land and impervious land areas increase. The reduced cropland area, which decreased by 497.41 km2, was largely converted into impervious land, which increased by 447.37 km2. Shrubland had the highest rate of decline among all land types, decreasing by 29.03% (barren land is not part of this analysis).
In Scenario 1 (economic development priority), the impervious area was preserved and increased due to the emphasis on economic growth. The impervious land increased by 208.90 km2 compared to the predicted 2030 result. The impervious area in Scenario 1 is the largest among the three scenarios, with a 3.79% increase over Scenario 2 and a 14.97% increase over Scenario 3. The increase in impervious area is most significant at the urban boundary of Luoyang. However, both cropland and forest land exhibited a declining trend. Most of the decline in impervious land is concentrated at the edges of Luoyang city (Figure 8d). This is because Luoyang, as the second largest economy in Henan Province, prioritizes urban expansion and implements better urban development measures.
In Scenario 2 (ecological development priority), compared to the predicted 2030 result, forest land increased by 270.00 km2 and water bodies increased by 6.32 km2. However, shrubland and grassland experienced declines of varying degrees. This may be due to forest land having a greater priority in the land conversion process. Among all scenarios, Scenario 2 had the highest forest area and the lowest cropland area. The impervious land area remains largely consistent with other scenarios. Compared to the cropland development priority scenario (Scenario 3), cropland area decreased by 5.1%, while forest land area increased by 5.4%. The increased forest land area is mainly concentrated on the south side of the Taihang Mountains and the east side of the Funiu Mountains, near farming areas, and is mostly converted from cropland (Figure 8e).
In Scenario 3 (cropland development priority), the cropland area is the highest among all scenarios, while the areas of forest land, grassland, water bodies, and impervious land are the smallest. The cropland area increased by 783.18 km2 compared to the predicted 2030 result and by 1053.18 km2 compared to Scenario 2. Most of this increase comes from the conversion of impervious land and forest land (Figure 8f). With China’s emphasis on food security, cropland has been protected in recent years. The retention and slight increase in cropland is likely to continue over the next decade.

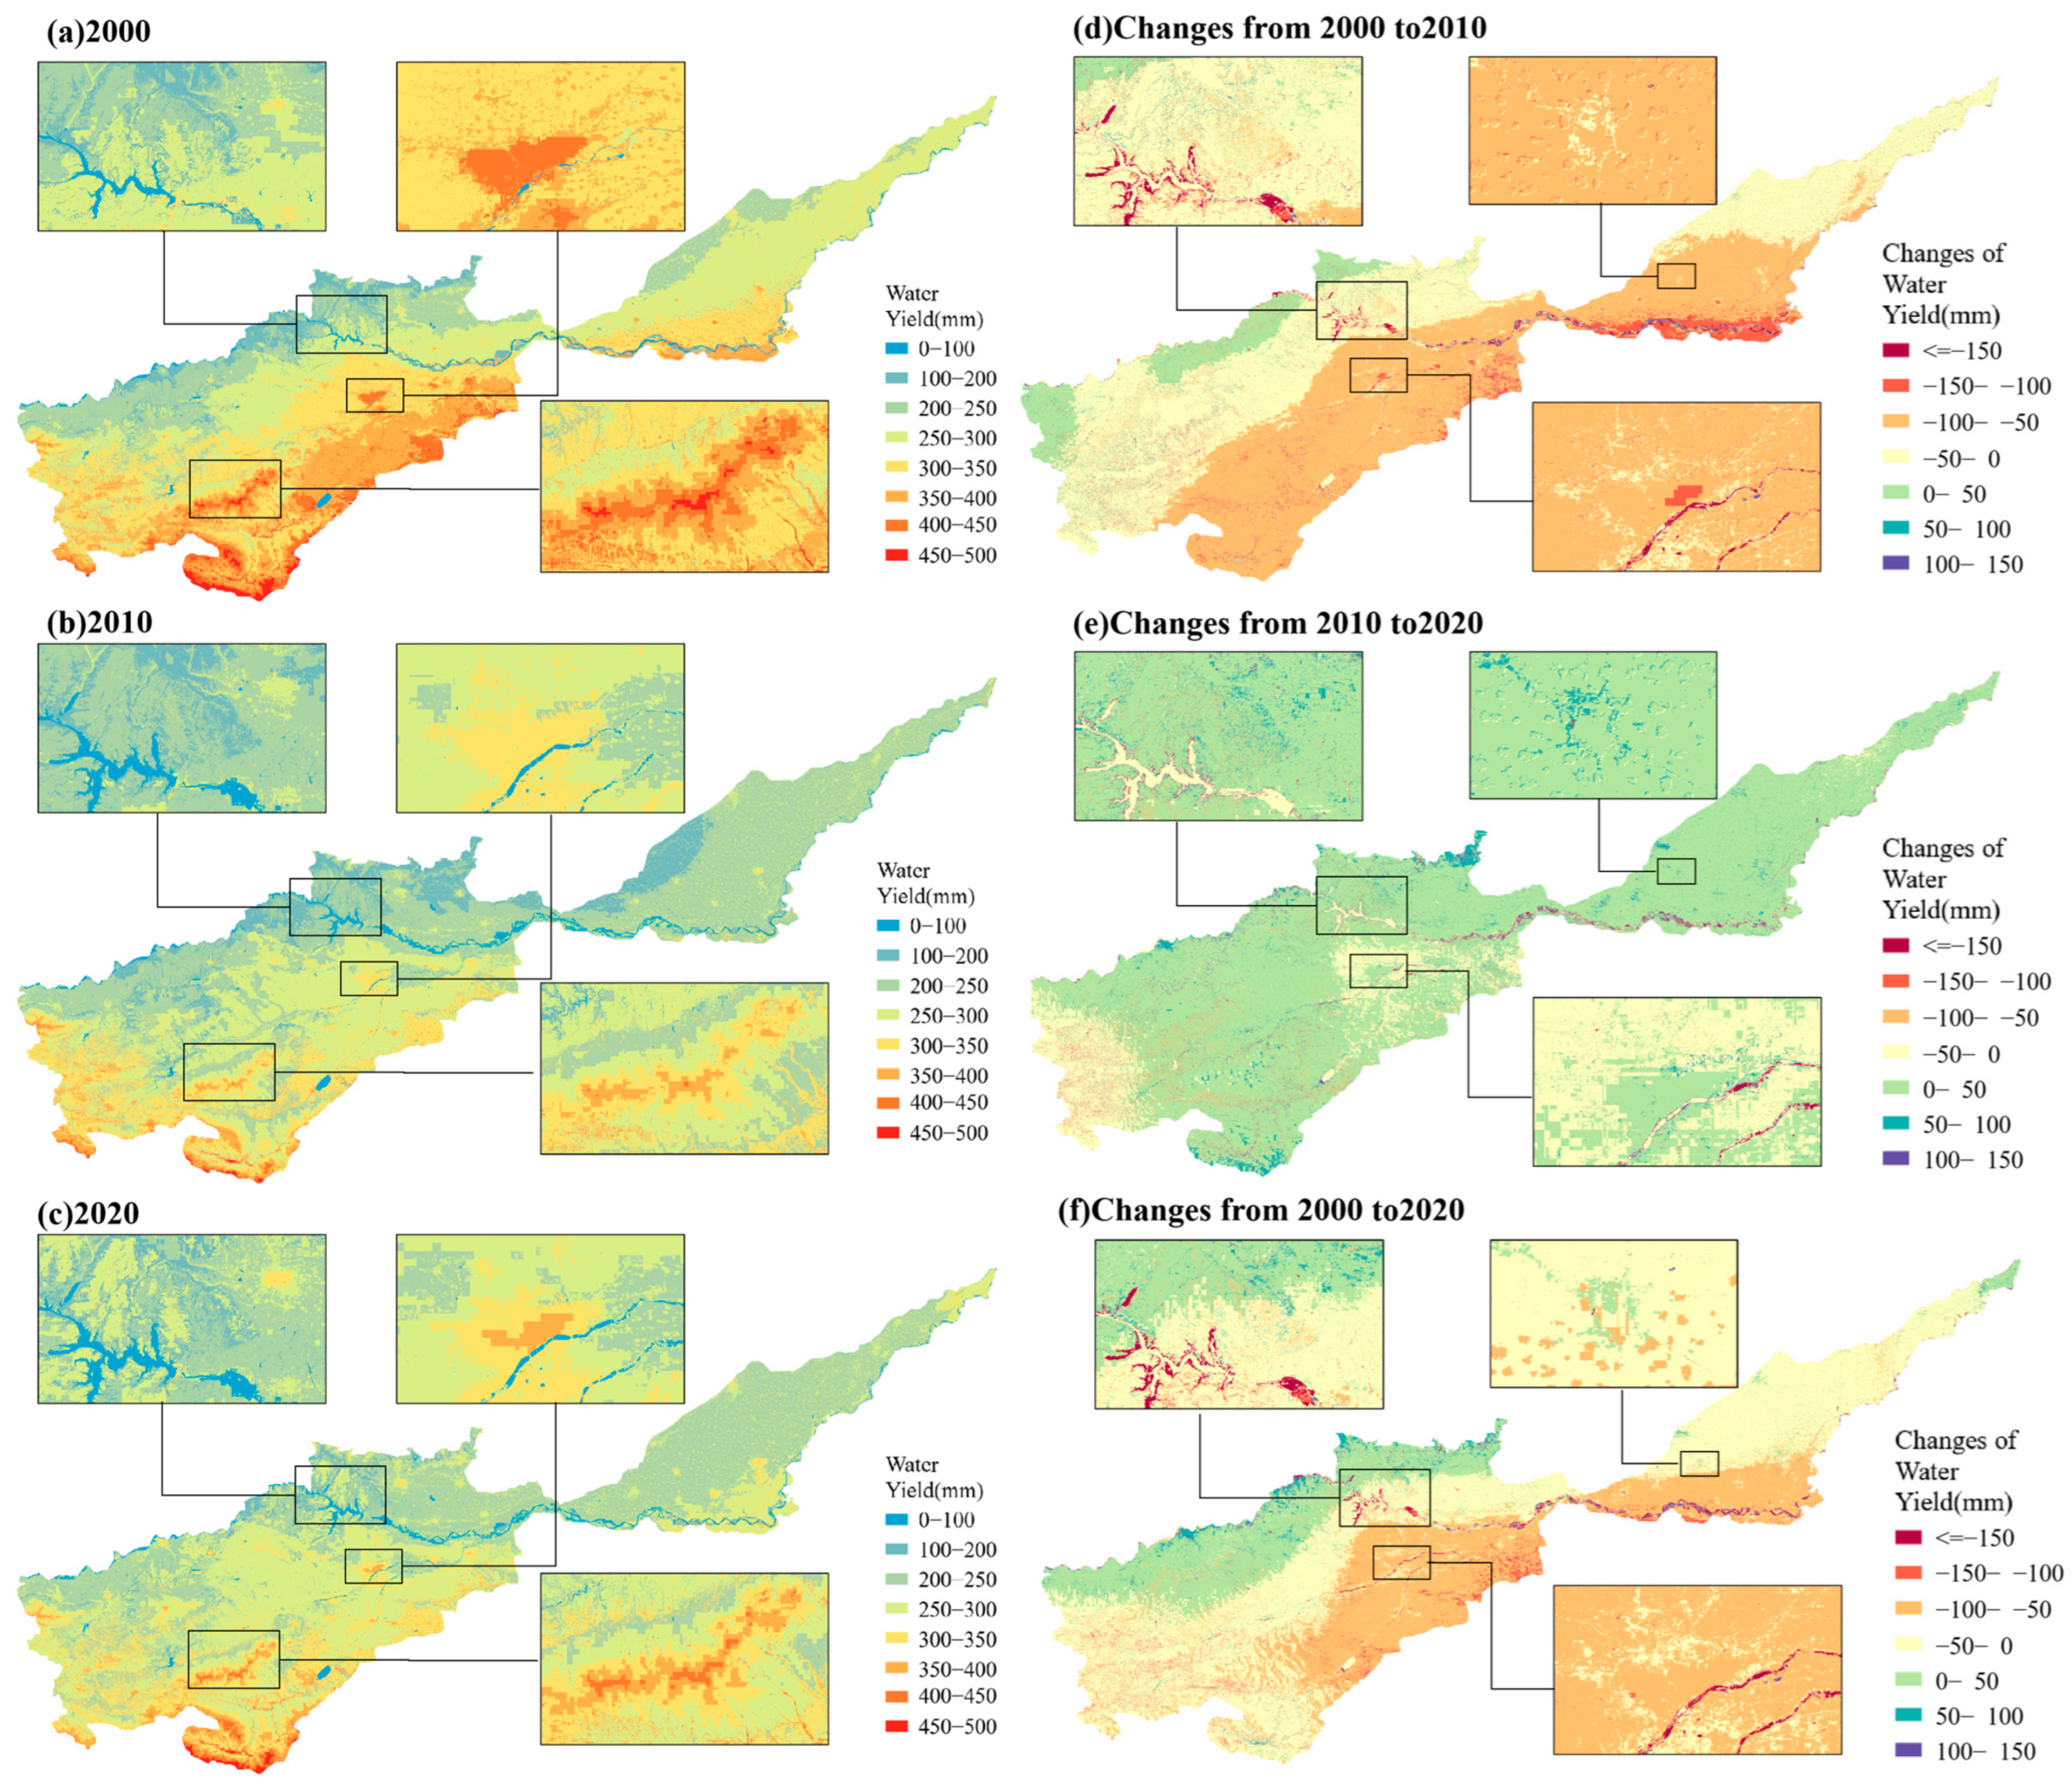
4.2. The Change of Water Yield

4.2.1. Interannual Variation of Water Yield

From 2000 to 2020, the water yield in the Yellow River Basin in Henan Province ranged from 0.00 mm to 716.73 mm (Figure 9). The average water yield in 2000, 2010, and 2020 was 296.22 mm, 248.91 mm, and 263.77 mm, respectively, corresponding to 10.56 billion m3, 8.88 billion m3, and 9.41 billion m3. The average water yield in 2000, 2010, and 2020 was 296.22 mm, 248.91 mm, and 263.77 mm, respectively, corresponding to 10.56 billion m3, 8.88 billion m3, and 9.41 billion m3. The highest average water yield was in 2016 at 320.39 mm, while the lowest was in 2012 at 109.75 mm. Compared to 2000, the average water yield in 2020 decreased by 32.47 mm (1.158 billion m3). Compared to 2010, the average water yield in 2020 increased by 14.86 mm (530 million m3). In the simulation results, part of the data showed a value of 0.0 mm, which all appeared in the water body. In fact, in both the model setting (evapotranspiration coefficient KC) and the reality, the water body tends to have a larger evapotranspiration, so it has a lower water yield or even no water yield. Overall, the inter-annual variation of water yield in the Yellow River Basin in Henan Province shows no significant trend, but there are considerable differences between years. As shown in Figure 9, this figure is a violin diagram of the comparison of water yield and precipitation, reflecting the total data distribution in different years. In terms of data distribution, the shape of the data distribution is very similar, even though the data quantity of water yield and precipitation are different. And, the amount of water yield shows the same trend with precipitation in both dry and wet years. It indicated that precipitation plays a decisive role in the water yield of the study area.
Figure 10a–c illustrate the spatial patterns of water yield in the Yellow River Basin, Henan Province, for the years 2000, 2010, and 2020 under actual scenarios. From a spatial perspective, the water yield depth remained relatively consistent across the years, with low yields in the northwest and high yields in the southwest. In 2000, high-water-yield areas included the upper Yiluo River Basin, the southern Funiu Mountain range, the central Songshan Mountain range, and Luoyang’s urban area. This pattern correlates strongly with precipitation, potential evapotranspiration, and land use types. Areas experiencing high precipitation and low evapotranspiration, such as construction sites, grasslands, and forests, demonstrated robust water yield. Conversely, regions with low precipitation and high evapotranspiration, including cultivated lands and water bodies, exhibited weaker water yield.
Figure 10d–f illustrate the spatial patterns of change in the Yellow River Basin in Henan Province for the periods 2000–2010, 2010–2020, and 2000–2020 under the actual scenario. From 2000 to 2010, water yield decreased in most areas of the basin, affecting 88.9% of the study area. The most significant changes occurred in the Yellow River area following the completion of the Xiaolangdi Reservoir, with a decreased water yield in the southeast of the basin. From 2010 to 2020, water yield mainly increased, with 82.4% of the study area experiencing an increase. The increase was widespread across the region, including construction land expansion areas, while sporadic declines were observed in parts of the western mountains.
Overall, the inter-annual variation of water yield in the Yellow River Basin in Henan Province shows no significant trend, but there are substantial differences across different years. Figure 9 shows a high correlation between water yield and precipitation changes. Water yield differs significantly between dry and wet years, with its distribution consistent with precipitation. This indicates that precipitation plays a decisive role in water yield in the study area. From a spatial perspective, two main factors cause changes in precipitation. First, annual variation in precipitation leads to significant regional changes in water yield. Second, changes in land use types cause variations in water yield in small patches.

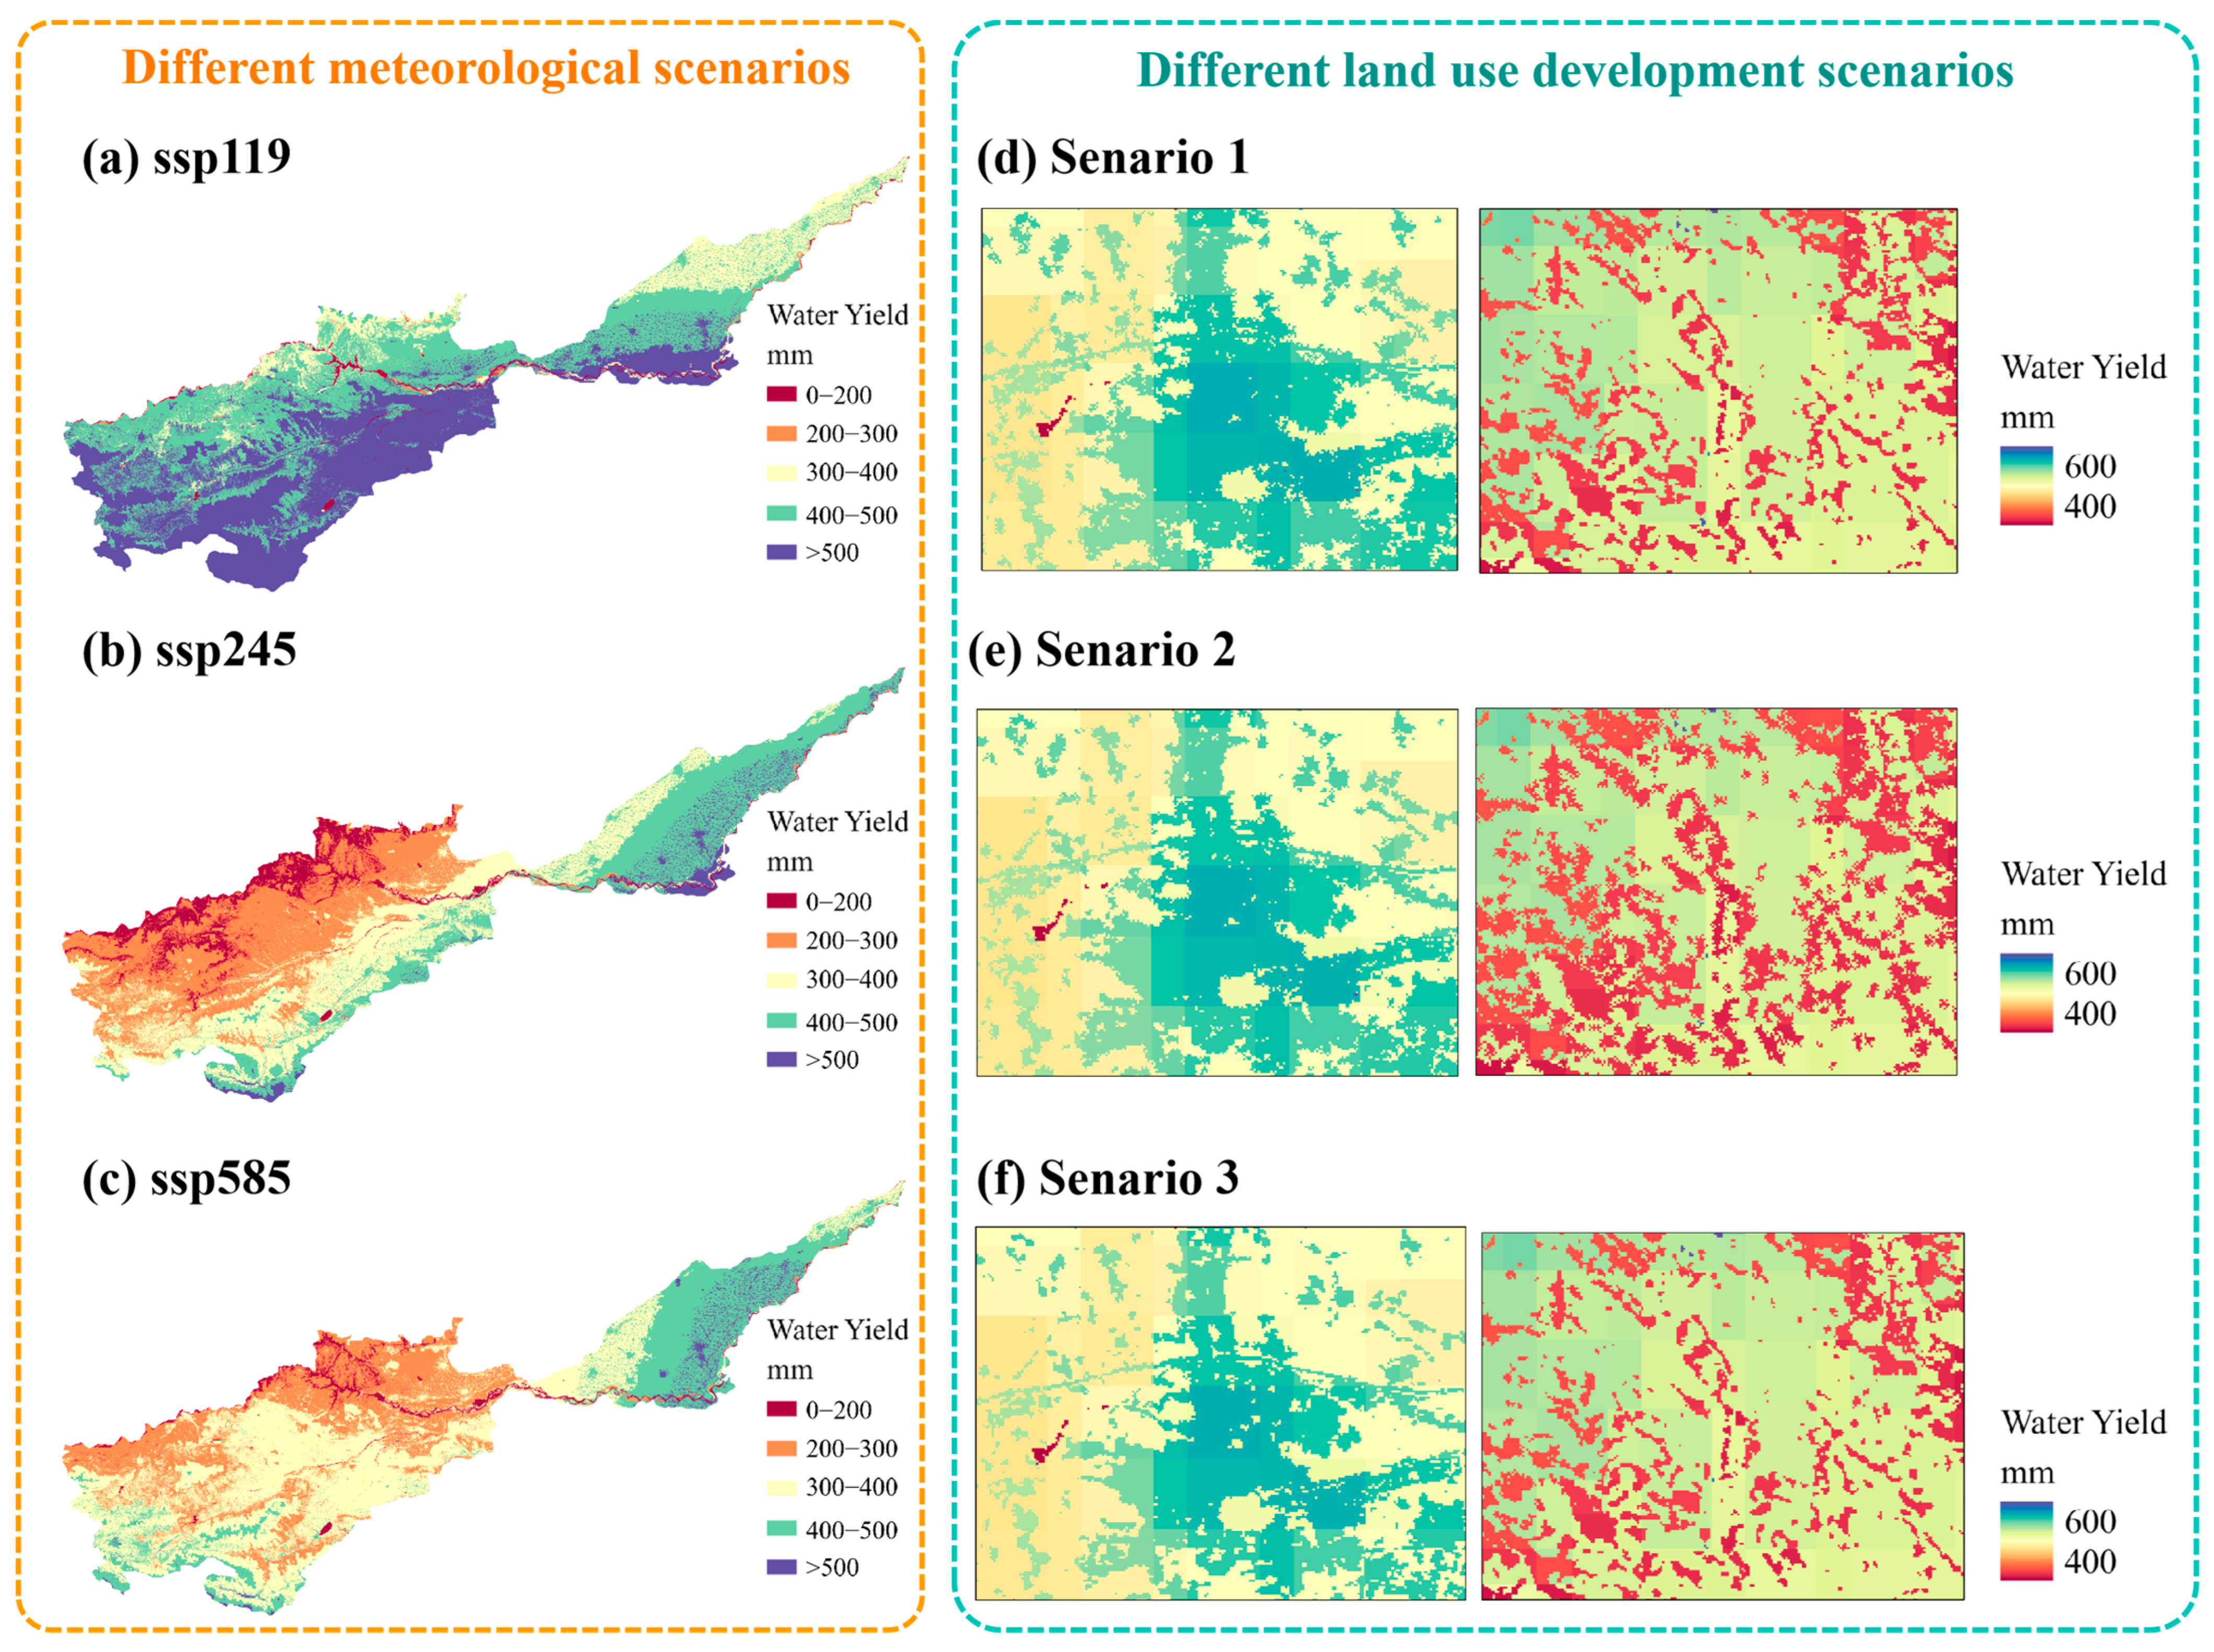
4.2.2. Water Yield under Different Scenarios

From the data structure (Figure 11), the water yield in 2030 varies significantly under different CMIP6 scenarios. Using the land use data from Scenario 1 for simulated 2030 as an example, the water yield under ssp119, ssp245, and ssp585 is 172.73 × 10⁸ m3, 117.78 × 10⁸ m3, and 121.32 × 10⁸ m3, respectively. Compared to ssp119, the water yield in the other two scenarios is lower. Compared to the 2020 water yield data, the water yield in 2030 increased by 78.68 × 10⁸ m3, 23.73 × 10⁸ m3, and 27.27 × 10⁸ m3 over 10 years. Compared to the year 2020, the average precipitation in 2030 under scenarios SSP11.9, SSP24.5, and SSP585 is increased by 269.70 mm, 73.71 mm, and 85.69 mm, respectively. Concurrently, the average potential evapotranspiration is expected to rise by 100.41 mm, 3.93 mm, and 0.88 mm under the same scenarios. The substantial increase in total precipitation, coupled with the relatively minor increase in potential evapotranspiration, indicates that the primary driver for the increased water yield in 2030 is the relatively larger increase in precipitation. Under different land use scenarios, the water yield in Scenario 1, Scenario 2, and Scenario 3 for 2030 is 172.73 × 10⁸ m3, 171.12 × 10⁸ m3, and 172.40 × 10⁸ m3, respectively. Using Scenario 1 as the baseline, the water yield in Scenario 2 and Scenario 3 decreases by 61.13 × 10⁶ m3 and 33.26 × 10⁶ m3, respectively. Overall, the difference in water yield under different meteorological scenarios is significantly greater than that under land use scenarios. Thus, the impact of climate change on water yield in the Yellow River Basin in Henan Province will be more significant in the future.
As shown in Figure 12, all scenarios exhibit a spatial trend of higher water yield in the south and lower yield in the north, with decreasing yields towards mountainous areas. This pattern is similar to previous distributions. Overall, changes in water yield under different land use scenarios are minimal. The contribution of different land use types to the total regional water yield follows this order: cropland, forest land, construction land, grassland, shrubland, water bodies, and barren land. The contribution to total water yield generally aligns with the area of each land use type. Cropland contributes approximately 54.8% of the water yield, occupying about 55.6% of the study region. The three simulated scenarios exhibit overall spatial consistency. However, closer examination of small patches (Figure 12d–f) reveals subtle differences under different land development conditions. In Scenario 1, more construction land results in a larger area with higher water yield. In Scenario 2, larger forest land patches result in a relatively larger area with lower water yield.

4.2.3. Geodetection of Water Yield

Understanding the interaction between water yield and various factors is crucial for rational water resource management. The factor detector shows the individual impact degree of each factor on water yield. As shown in Figure 13b, the factor detector results indicate that the single-factor q-values for precipitation (PRE), distance to government (DG), distance to railroads (DRR), and DEM are relatively high, being 0.37, 0.24, 0.2, 0.23, and 0.13, respectively. These variables exhibit higher q-values among all factors, indicating a more significant impact on water yield in the study area than other parameters. In addition to natural meteorological factors such as PRE, DEM, and PET, socio-economic factors like GDP, DG, and DRR also substantially impact water yield, reflecting social development. In contrast, factors reflecting social scale, such as DRE and POP, and distance indicators for various road levels exhibit lower q-values.
Figure 13a illustrates the interaction of different factors on water yield in the study area. The interaction detector results indicate that interactions between any two factors are enhanced and nonlinear. Among them, the q-value for the interaction between precipitation (PRE) and DEM is the highest at 0.65, followed by the interaction between precipitation (PRE) and potential evapotranspiration (PET) at 0.60. Notably, the single-factor q-value of potential evapotranspiration (PET) is only 0.085, but under the interaction of PRE and PET, it exhibits a strong effect. This indicates that PET does not significantly determine water yield changes alone; instead, water yield is jointly determined by PET and PRE, aligning with the Invest model’s calculation rules. These results suggest that the interaction between precipitation (PRE) and other factors is key to water yield in the study area, with q-values for interactions between PRE and other factors all above or close to 0.4. Additionally, besides the high q-values of PRE with natural factors (PET, DEM, and SLP), the q-values with socio-economic factors (GDP, POP, GD) are also high, implying that regional water yield is driven by both natural and socio-economic factors.

5. Discussion

5.1. Temporal and Spatial Transformation of Land Use

Water yield is a highly complex system, and studying the changes in land use function and value is a method to understand the entire water yield system and its functional patterns [66]. Based on the land use change conversion matrix in Section 4.1.1 for the years 2000–2020, we found that the area of arable land was 22,105.7 km2 in 2000, which decreased to 20,443.6 km2 by 2020, with a total reduction of 7.5%. The change in arable land was the largest among all types of land use. The reduction in arable land was mostly converted into construction land and forested areas, mainly due to the recent intensification of urbanization and the implementation of policies to convert farmland back to forest in China [36]. For the years 2000–2020, which were the fastest growing for both China and Henan Province, the conversion of arable land to construction land was the main trend, with construction land increasing by 47.9% over 20 years. This land use transformation process is consistent with that of Henan Province in previous studies [67]. According to previous studies and the results of this research [68], the water yield from construction land is significantly higher than from other land use types, and thus is certain to have an impact on water yield. For the years 2000–2020, which were the fastest growing for both China and Henan Province, the conversion of arable land to construction land was the main trend, with construction land increasing by 47.9% over 20 years. According to previous studies and the results of this research [69], the water yield from construction land is significantly higher than from other land use types, and thus is certain to have an impact on water yield. On a regional scale, the quantity of land use change over the past twenty years was 12.2%, and the average regional water balance change due to land use alteration does not exceed 3%, suggesting that changes in land use may not significantly affect regional water yield. However, on a smaller scale, these changes in land use are quite significant, as demonstrated in this study by the notable expansions of the urban areas of Luoyang and Sanmenxia.
For future scenarios and the results of scenario simulations under different strategies, compared to the forecasts for 2030, the differences in forecast results across scenarios are not significant, with only some patches showing trends of expansion and contraction. In fact, according to previous studies [36], land use in Henan Province has been regionally stable, which is similar to the results of this study. However, of the three scenarios, Scenario 3 may be more inclined to actual future land use change. In Scenario 3 of this study, the simulated cropland area slightly expanded, while other types of land use remained essentially the same as in 2020, which actually corresponds more closely to the realistic future land use change scenario. This is different from the research of Ji et al. [70] and Zhao et al. [67]. In their study, the cultivated land area still continues to decrease under the cultivated land protection scenario, which is related to the stricter rules of land use transformation set in our model. With the slowing of China’s economic development and the delineation of China’s agricultural land redline, Henan Province, as one of China’s most important agricultural provinces, has seen increasing national emphasis on the protection of arable land; thus, the arable land in the Yellow River basin of Henan Province will certainly not continue to decrease as per previous trends [71]. For scientific research and land management, more attention should be paid to the impact of the survival and expansion of cultivated land area on the ecosystem and water resource management in Henan Province.

5.2. Temporal and Spatial Transformation of Water Yield

From 2000 to 2030, the water yield in the Yellow River Basin of Henan Province shows no significant temporal trend. The variations in water yield across different years are closely related to precipitation. Spatially, the trend is characterized by higher water yield in the south and west, and lower yield in the north and east, with the water yield decreasing from the Funiu Mountain foothills towards the east and north. In terms of land use types, cropland contributes the most to water yield, followed by forest land, which is related to the distribution of land use types. The average water yield depth for cropland is 213.56 mm; for forest land, it is 207.88 mm; and for impervious land, it is 248.48 mm. Compared to other land use/cover types, construction land has the highest water yield depth due to the lack of vegetation interception and lower evapotranspiration. The study by Jian et al. [69] shows the same pattern. In terms of total water yield, cropland and forest land are the most important water-producing areas in the region. The total water yield for cropland is 5.12 × 10¹⁰ m3, and for forest land, it is 2.29 × 10¹⁰ m3, making them more significant than other land types in the study area. Of course it depends on the type of land use, In previous studies, the land use type contributed by the main water production of different types of regions is different [20,26,28]; it mainly depends on the dominant land use type of the region.
The water yield in the study area is primarily controlled by precipitation, consistent with the calculation method of the InVEST model and the inherent meaning of water yield. The magnitude of water yield is directly influenced by precipitation, evapotranspiration, and their balance. The results of this study also confirm this conclusion, showing that water yield in the study area is controlled by annual precipitation. The differences in water yield caused by different CMIP6 data are much greater than those caused by different land use development scenarios. Within a limited time scale, the water yield in this region is mainly controlled by driving factors such as precipitation and evapotranspiration. The study of Shirmohammadi et al. [72] also confirmed that the change of climate conditions is much greater than the change of land use for the change of water yield, which is similar to the results of this study. However, according to subsequent Geodetector analysis, besides precipitation (PRE) as the dominant indicator, natural factors and social factors (such as GDP and population (POP)) show a strong correlation. This indicates that water yield in the study area is determined by a combination of climatic natural conditions and intrinsic social and economic factors (citation), with social and economic factors directly influencing land use types. Previous studies have demonstrated the critical impact of land use types on water yield [28,73]. Changes in land use/cover types directly or indirectly affect water yield by altering the structure and type of the underlying surface. Additionally, soil porosity, soil texture, and structure have an indirect impact on water yield [28,74,75]. In this study, the differences under different land use development scenarios are not significant, mainly because the Yellow River Basin in Henan Province, as one of China’s most important grain-producing areas and one of the most densely populated regions, has stabilized in terms of land use development. On a regional scale, the land use changes in different scenarios are minimal, and water yield is unlikely to be affected by different scenarios. However, on a longer time scale, significant differences in scale may have some impact on water yield, especially on a local small scale. Lang et al.’s [76] research shows that under the scenario without climate change, land use conversion leads to a 0.46% decrease in water production; under the scenario without land use change, climate change leads to a 17.50% increase in regional water production due to precipitation, a conclusion similar to our study. Therefore, in future water resource management, the Yellow River Basin in Henan Province should pay more attention to the impacts of climate change and the potential changes in water yield caused by land use changes on small scales (such as county and city levels).

5.3. Limitations of This Research

In this study, the PLUS-InVEST model was used to clarify the differences in water yield under different land use scenarios, and CMIP6 data were used to invert future changes under different climate conditions. This study used the InVEST model, the PLUS model, and the Geodetector v1.0-5 model to form a unified framework. This comprehensive approach is innovative in assessing the dynamic changes of land use and water yield and their relationships with various factors, providing new perspectives for studying complex ecological and environmental systems. However, this study has certain limitations. Firstly, in the construction of the PLUS model, only natural and social factors were considered, while indicators such as economic development were not included as driving factors in the model. Secondly, the InVEST model’s prediction of water yield is overly dependent on accurate parameters, which introduces a degree of uncertainty. Examples of such parameters include the evapotranspiration coefficient (KC), root depth, and parameter Z. Utilizing extensive empirical data to obtain dynamic water yield coefficients can enhance the accuracy of ecosystem water yield assessments [28]. Lastly, the meteorological data used for different scenarios in the model are forecasted data for the year 2030, which inherently possess some variability. To comprehensively simulate the impacts of climate change, it may be beneficial to use multi-year average data for larger time scales.

6. Conclusions

We utilized the PLUS and InVEST models to simulate and analyze the land use changes and climate changes from 2000 to 2030 in the Yellow River Basin of Henan Province and their impact on the ecosystem. The results indicate that water yield in the study area has a stronger correlation with climate conditions such as precipitation, and only local patches are affected under different land use change scenarios. In different land use scenarios, Scenario 1 (economic development priority) exhibits a relatively significant expansion of construction land, particularly around urban areas; Scenario 2 (ecological development priority) shows forest land expansion with significant restrictions on cropland; Scenario 3 (cropland development priority) demonstrates significant cropland expansion, especially with some impervious land converted to cropland. The water yield in Scenario 1 is relatively high, with an increase of 61.13 × 10⁶ m3 and 33.26 × 10⁶ m3 compared to Scenarios 2 and 3, respectively. Overall, the change does not exceed 0.5%, with only some noticeable changes in small-scale patches. Under different CMIP6 future meteorological data scenarios, the differences in water yield results are significant. The ssp126 (low-stress scenario) shows the highest water yield, with a total value 67% higher than the lowest yield scenario ssp245 (medium-stress scenario). The spatial distribution of data under different scenarios is primarily influenced by precipitation. Finally, through Geodetector v1.0-5 analysis of the driving factors of water yield, the single-factor detection results indicate that water yield in the Yellow River Basin of Henan Province is determined by meteorological factors (precipitation, potential evapotranspiration). The interaction detection results show that the interaction between meteorological factors (precipitation, potential evapotranspiration) and social factors (such as precipitation and population) also has a high driving force, indicating that meteorological factors are the most critical for water yield in the study area, while the combined effect of meteorological and social factors is key to regional water yield. Our study accurately identifies the changes in land use types in the Yellow River Basin of Henan Province and their impact on water yield, providing valuable insights for relevant water resource management policies and urban development planning.

Author Contributions

Conceptualization, X.M., S.L. and L.G.; data curation, X.M., M.F. and C.F.; methodology, L.G.; methodology, X.M.; software, X.M.; formal analysis, X.M.; writing—original draft preparation, X.M.; writing—review and editing, X.M. and S.L.; visualization and J.Z. and Y.L.; supervision, L.G.; project administration, L.G. All authors have read and agreed to the published version of the manuscript.

Funding

This research was funded by the Natural Resources Research Project of Henan Province (Grant No. 2023-382-1); Natural Resources Research Project of Henan Province (Grant No. 2021-178-9) and Henan Academy of Geology Management Research Project (Grant No. 2023-901-XM001-KT01).

Data Availability Statement

The data presented in this study are available through the respective sources.

Conflicts of Interest

The authors declare no conflicts of interest.

References

  1. MEA. Millennium Ecosystem Assessment: Current State & Trends Assessment; Island Press: Washington, DC, USA, 2005. [Google Scholar]
  2. Shan, Y.; Dai, X.; Li, W.; Yang, Z.; Wang, Y.; Qu, G.; Liu, W.; Ren, J.; Li, C.; Liang, S. Detecting spatial-temporal changes of urban environment quality by remote sensing-based ecological indices: A case study in Panzhihua city, Sichuan Province, China. Remote Sens. 2022, 14, 4137. [Google Scholar] [CrossRef]
  3. Millennium Ecosystem Assessment. Ecosystems and Human Well-Being: Biodiversity Synthesis; World Resources Institute: Washington, DC, USA, 2005; Available online: https://www.researchgate.net/publication/269576188_Ecosystems_and_Human_Well-Being_Biodiversity_Synthesis (accessed on 16 July 2024).
  4. Guo, C.; Xu, H. Use of functional distinctness of periphytic ciliates for monitoring water quality in coastal ecosystems. Ecol. Indic. 2019, 96, 213–218. [Google Scholar] [CrossRef]
  5. Han, Z.; Li, B.; Han, Z.; Wang, S.; Peng, W.; Liu, X.; Benson, D. Dynamic Simulation of Land Use and Habitat Quality Assessment in Baiyangdian Basin Using the SD-PLUS Coupled Model. Water 2024, 16, 678. [Google Scholar] [CrossRef]
  6. Aznar-Sánchez, J.A.; Velasco-Muñoz, J.F.; Belmonte-Ureña, L.J.; Manzano-Agugliaro, F. The worldwide research trends on water ecosystem services. Ecol. Indic. 2019, 99, 310–323. [Google Scholar] [CrossRef]
  7. Díaz, M.E.; Figueroa, R.; Alonso, M.L.S.; Vidal-Abarca, M.R. Exploring the complex relations between water resources and social indicators: The Biobío Basin (Chile). Ecosyst. Serv. 2018, 31, 84–92. [Google Scholar] [CrossRef]
  8. Costanza, R.; d’Arge, R.; De Groot, R.; Farber, S.; Grasso, M.; Hannon, B.; Limburg, K.; Naeem, S.; O’neill, R.V.; Paruelo, J. The value of the world’s ecosystem services and natural capital. Nature 1997, 387, 253–260. [Google Scholar] [CrossRef]
  9. Chen, Y.; Xu, X.; Zhang, X.; Singh, V.P.; Li, M. Weather-driven synergistic water-economy-environment regulation of farmland ecosystems. Sci. Total Environ. 2023, 880, 163342. [Google Scholar] [CrossRef]
  10. Ragab, R.; Prudhomme, C. Sw—Soil and Water: Climate change and water resources management in arid and semi-arid regions: Prospective and challenges for the 21st century. Biosyst. Eng. 2002, 81, 3–34. [Google Scholar] [CrossRef]
  11. Bandyopadhyay, J. Water, Ecosystems and Society: A Confluence of Disciplines. Resour. Energy Dev. 2009, 6, 95–96. [Google Scholar]
  12. Pimentel, D.; Berger, B.; Filiberto, D.; Newton, M.; Wolfe, B.; Karabinakis, E.; Clark, S.; Poon, E.; Abbett, E.; Nandagopal, S. Water resources: Agricultural and environmental issues. BioScience 2004, 54, 909–918. [Google Scholar] [CrossRef]
  13. Chanapathi, T.; Thatikonda, S.; Raghavan, S. Analysis of rainfall extremes and water yield of Krishna river basin under future climate scenarios. J. Hydrol. Reg. Stud. 2018, 19, 287–306. [Google Scholar] [CrossRef]
  14. Belete, M.; Deng, J.; Wang, K.; Zhou, M.; Zhu, E.; Shifaw, E.; Bayissa, Y. Evaluation of satellite rainfall products for modeling water yield over the source region of Blue Nile Basin. Sci. Total Environ. 2020, 708, 134834. [Google Scholar] [CrossRef] [PubMed]
  15. Stednick, J.D. Monitoring the effects of timber harvest on annual water yield. J. Hydrol. 1996, 176, 79–95. [Google Scholar] [CrossRef]
  16. Yifru, B.A.; Chung, I.-M.; Kim, M.-G.; Chang, S.W. Assessing the effect of land/use land cover and climate change on water yield and groundwater recharge in East African Rift Valley using integrated model. J. Hydrol. Reg. Stud. 2021, 37, 100926. [Google Scholar] [CrossRef]
  17. Caldwell, P.V.; Miniat, C.F.; Elliott, K.J.; Swank, W.T.; Brantley, S.T.; Laseter, S.H. Declining water yield from forested mountain watersheds in response to climate change and forest mesophication. Glob. Chang. Biol. 2016, 22, 2997–3012. [Google Scholar] [CrossRef]
  18. Natalia, P.; Silvia, F.; Silvina, S.; Miguel, P. Climate change in northern Patagonia: Critical decrease in water resources. Theor. Appl. Climatol. 2020, 140, 807–822. [Google Scholar] [CrossRef]
  19. Hu, J.; Wu, Y.; Wang, L.; Sun, P.; Zhao, F.; Jin, Z.; Wang, Y.; Qiu, L.; Lian, Y. Impacts of land-use conversions on the water cycle in a typical watershed in the southern Chinese Loess Plateau. J. Hydrol. 2021, 593, 125741. [Google Scholar] [CrossRef]
  20. Ye, L.; Cheng, L.; Liu, P.; Liu, D.; Zhang, L.; Qin, S.; Xia, J. Management of vegetative land for more water yield under future climate conditions in the over-utilized water resources regions: A case study in the Xiong’an New area. J. Hydrol. 2021, 600, 126563. [Google Scholar] [CrossRef]
  21. Ercan, M.B.; Maghami, I.; Bowes, B.D.; Morsy, M.M.; Goodall, J.L. Estimating potential climate change effects on the upper neuse watershed water balance using the SWAT model. JAWRA J. Am. Water Resour. Assoc. 2020, 56, 53–67. [Google Scholar] [CrossRef]
  22. Ndhlovu, G.; Woyessa, Y. Modelling impact of climate change on catchment water balance, Kabompo River in Zambezi River Basin. J. Hydrol. Reg. Stud. 2020, 27, 100650. [Google Scholar] [CrossRef]
  23. Gomes, L.; Bianchi, F.; Cardoso, I.; Schulte, R.; Fernandes, R.; Fernandes-Filho, E. Disentangling the historic and future impacts of land use changes and climate variability on the hydrology of a mountain region in Brazil. J. Hydrol. 2021, 594, 125650. [Google Scholar] [CrossRef]
  24. Wang, Q.; Cheng, L.; Zhang, L.; Liu, P.; Qin, S.; Liu, L.; Jing, Z. Quantifying the impacts of land-cover changes on global evapotranspiration based on the continuous remote sensing observations during 1982–2016. J. Hydrol. 2021, 598, 126231. [Google Scholar] [CrossRef]
  25. Li, M.; Li, S.; Liu, H.; Zhang, J. Balancing Water Ecosystem Services: Assessing Water Yield and Purification in Shanxi. Water 2023, 15, 3261. [Google Scholar] [CrossRef]
  26. Yin, L.; Feng, X.; Fu, B.; Wang, S.; Wang, X.; Chen, Y.; Tao, F.; Hu, J. A coupled human-natural system analysis of water yield in the Yellow River basin, China. Sci. Total Environ. 2021, 762, 143141. [Google Scholar] [CrossRef]
  27. Abbott, B.W.; Bishop, K.; Zarnetske, J.P.; Minaudo, C.; Chapin, F.S., III; Krause, S.; Hannah, D.M.; Conner, L.; Ellison, D.; Godsey, S.E. Human domination of the global water cycle absent from depictions and perceptions. Nat. Geosci. 2019, 12, 533–540. [Google Scholar] [CrossRef]
  28. Reheman, R.; Kasimu, A.; Duolaiti, X.; Wei, B.; Zhao, Y. Research on the Change in Prediction of Water Production in Urban Agglomerations on the Northern Slopes of the Tianshan Mountains Based on the InVEST–PLUS Model. Water 2023, 15, 776. [Google Scholar] [CrossRef]
  29. Ouyang, K.; Huang, M.; Gong, D.; Zhu, D.; Lin, H.; Xiao, C.; Fan, Y.; Altan, O. A Novel Framework for Integrally Evaluating the Impacts of Climate Change and Human Activities on Water Yield Services from Both Local and Global Perspectives. Remote Sens. 2024, 16, 3008. [Google Scholar] [CrossRef]
  30. Meijer, K.S.; Schasfoort, F.; Bennema, M. Quantitative Modeling of Human Responses to Changes in Water Resources Availability: A Review of Methods and Theories. Sustainability 2021, 13, 8675. [Google Scholar] [CrossRef]
  31. Xiangzheng, D.; Kaizhong, Y.; Qingqing, S.; Suocheng, D.; Wenge, Z.; Rongxing, G.; Minghong, T.; Pengjun, Z.; Yu, L.; Changhong, M. Urban agglomeration and industrial transformationand development in the Yellow River Basin. J. Nat. Resour. 2021, 36, 273–289. (In Chinese) [Google Scholar]
  32. Tong, L.; Wenxiu, H. Chaos Control of Ec-R-Ev System Based on Coordination. Syst. Eng. Theory Pract. 2002, 22, 8–12. (In Chinese) [Google Scholar]
  33. Lü, C.-M.; Wu, Z.-N. Emergy analysis for sustainable development assessment ofregional water ecological-economics system. Syst. Eng. Theory Pract. 2010, 30, 1293–1298. (In Chinese) [Google Scholar]
  34. Changshuo, H.; Leihua, G.; Bing, Y.; Jinyu, B.; Yuting, Z. Dynamic prediction and regulation of water resource carrying capacity: A case study on the elow River basin. Adv. Water Sci. 2021, 32, 59–67. [Google Scholar] [CrossRef]
  35. Yuyu, G.; Siyue, L.; Rui, L.; Jing, Z. Relationship between landscape pattern and water quality of the multi-scale effects in theYellow River Basin. J. Lake Sci. 2021, 33, 737–748. (In Chinese) [Google Scholar] [CrossRef]
  36. Liu, Y.; Wu, K.; Cao, H. Land-use change and its driving factors in Henan province from 1995 to 2015. Arab. J. Geosci. 2022, 15, 247. [Google Scholar] [CrossRef]
  37. Jiang, L.; Zhang, Y. Modeling urban expansion and agricultural land conversion in Henan Province, China: An integration of land use and socioeconomic data. Sustainability 2016, 8, 920. [Google Scholar] [CrossRef]
  38. Brown, A.E.; Zhang, L.; McMahon, T.A.; Western, A.W.; Vertessy, R.A. A review of paired catchment studies for determining changes in water yield resulting from alterations in vegetation. J. Hydrol. 2005, 310, 28–61. [Google Scholar] [CrossRef]
  39. Feng, X.; Sun, G.; Fu, B.; Su, C.; Liu, Y.; Lamparski, H. Regional effects of vegetation restoration on water yield across the Loess Plateau, China. Hydrol. Earth Syst. Sci. 2012, 16, 2617–2628. [Google Scholar] [CrossRef]
  40. Sun, G.; Zhou, G.; Zhang, Z.; Wei, X.; McNulty, S.G.; Vose, J.M. Potential water yield reduction due to forestation across China. J. Hydrol. 2006, 328, 548–558. [Google Scholar] [CrossRef]
  41. Zhou, G.; Wei, X.; Chen, X.; Zhou, P.; Liu, X.; Xiao, Y.; Sun, G.; Scott, D.F.; Zhou, S.; Han, L. Global pattern for the effect of climate and land cover on water yield. Nat. Commun. 2015, 6, 5918. [Google Scholar] [CrossRef]
  42. Pessacg, N.; Flaherty, S.; Brandizi, L.; Solman, S.; Pascual, M. Getting water right: A case study in water yield modelling based on precipitation data. Sci. Total Environ. 2015, 537, 225–234. [Google Scholar] [CrossRef]
  43. Yang, J.; Huang, X. The 30 m annual land cover dataset and its dynamics in China from 1990 to 2019. Earth Syst. Sci. Data 2021, 13, 3907–3925. [Google Scholar] [CrossRef]
  44. Xiang, K.; Li, Y.; Horton, R.; Feng, H. Similarity and difference of potential evapotranspiration and reference crop evapotranspiration—A review. Agric. Water Manag. 2020, 232, 106043. [Google Scholar] [CrossRef]
  45. Li, D. Assessing the impact of interannual variability of precipitation and potential evaporation on evapotranspiration. Adv. Water Resour. 2014, 70, 1–11. [Google Scholar] [CrossRef]
  46. Peng, S. 1 km Monthly Potential Evapotranspiration Dataset in China (1901–2023); National Tibetan Plateau/Third Pole Environment Data Center: Yangling, China, 2023. [Google Scholar] [CrossRef]
  47. Peng, S. 1 km Multi-Scenario and Multi-Model Monthly Precipitation Data for China (2021–2100). National Tibetan Plateau/Third Pole Environment Data Center: Beijing, China, 2022. [Google Scholar] [CrossRef]
  48. Peng, S.; Ding, Y.; Wen, Z.; Chen, Y.; Cao, Y.; Ren, J. Spatiotemporal change and trend analysis of potential evapotranspiration over the Loess Plateau of China during 2011–2100. Agric. For. Meteorol. 2017, 233, 183–194. [Google Scholar] [CrossRef]
  49. Han, J.; Miao, C.; Gou, J.; Zheng, H.; Zhang, Q.; Guo, X. A new daily gridded precipitation dataset based on gauge observations across mainland China. Earth Syst. Sci. Data Discuss. 2022, 2022, 1–33. [Google Scholar]
  50. Ding, Y.; Peng, S. Spatiotemporal trends and attribution of drought across China from 1901–2100. Sustainability 2020, 12, 477. [Google Scholar] [CrossRef]
  51. Miao, C.; Han, J.; Gou, J. A Daily Gridded Precipitation Dataset Based on Gauge Observations across Mainland China (1961–2022); National Tibetan Plateau/Third Pole Environment Data Center: Beijing, China, 2023. [Google Scholar] [CrossRef]
  52. Carnes, M.R. Description and Evaluation of GDEM-V 3.0; Naval Research Laboratory: Washington, DC, USA, 2009; pp. 1–24. Available online: https://www.researchgate.net/publication/235013345_Description_and_Evaluation_of_GDEM-V_30 (accessed on 16 July 2024).
  53. Aarnoudse, E.; Bluemling, B.; Qu, W.; Herzfeld, T. Groundwater regulation in case of overdraft: National groundwater policy implementation in north-west China. Int. J. Water Resour. Dev. 2019, 35, 264–282. [Google Scholar] [CrossRef]
  54. Tatem, A.J. WorldPop, open data for spatial demography. Sci. Data 2017, 4, 170004. [Google Scholar] [CrossRef]
  55. National Catalogue Service for Geographic Information. Available online: https://www.webmap.cn/ (accessed on 5 September 2024).
  56. Tao, P.; Shaohong, W.; Erfu, D.; Yujie, L. Spatiotemporal variation of water source supply service in Three Rivers Source Area of China based on InVEST model. Chin. J. Appl. Ecol. 2013, 24, 183–189. (In Chinese) [Google Scholar]
  57. Yuanyuan, Y.; Erfu, D.; Hua, F. The Assessment Framework of Ecosystem Service ValueBased on InVEST Model. J. Cap. Norm. Univ. (Nat. Sci. Ed.) 2012, 33, 41–47. (In Chinese) [Google Scholar]
  58. Yang, H.; Cao, J. Analysis of Basin Morphologic Characteristics and Their Influence on the Water Yield of Mountain Watersheds Upstream of the Xiongan New Area, North China. Water 2021, 13, 2903. [Google Scholar] [CrossRef]
  59. Fu, B. On the calculation of the evaporation from land surface. Sci. Atmos. Sin. 1981, 5, 23–31. [Google Scholar]
  60. Zhang, L.; Hickel, K.; Dawes, W.; Chiew, F.H.; Western, A.; Briggs, P. A rational function approach for estimating mean annual evapotranspiration. Water Resour. Res. 2004, 40, W02502. [Google Scholar] [CrossRef]
  61. Donohue, R.J.; Roderick, M.L.; McVicar, T.R. Roots, storms and soil pores: Incorporating key ecohydrological processes into Budyko’s hydrological model. J. Hydrol. 2012, 436, 35–50. [Google Scholar] [CrossRef]
  62. Redhead, J.; Stratford, C.; Sharps, K.; Jones, L.; Ziv, G.; Clarke, D.; Oliver, T.; Bullock, J. Empirical validation of the InVEST water yield ecosystem service model at a national scale. Sci. Total Environ. 2016, 569, 1418–1426. [Google Scholar] [CrossRef] [PubMed]
  63. Liang, X.; Guan, Q.; Clarke, K.C.; Liu, S.; Wang, B.; Yao, Y. Understanding the drivers of sustainable land expansion using a patch-generating land use simulation (PLUS) model: A case study in Wuhan, China. Comput. Environ. Urban Syst. 2021, 85, 101569. [Google Scholar] [CrossRef]
  64. Meimei, W.; Zizhen, J.; Tengbiao, L.; Yongchun, Y.; Zhuo, J. Analysis on absolute conflict and relative conflict of land use in Xining metropolitan area under different scenarios in 2030 by PLUS and PFCI. Cities 2023, 137, 104314. [Google Scholar] [CrossRef]
  65. Wang, J.F.; Li, X.H.; Christakos, G.; Liao, Y.L.; Zhang, T.; Gu, X.; Zheng, X.Y. Geographical detectors-based health risk assessment and its application in the neural tube defects study of the Heshun Region, China. Int. J. Geogr. Inf. Sci. 2010, 24, 107–127. [Google Scholar] [CrossRef]
  66. Ennaanay, D. Impacts of Land Use Changes on the Hydrologic Regime in the Minnesota River Basin. Ph.D. Thesis, University of Minnesota, Minneapolis, MN, USA, 2006. Available online: https://www.proquest.com/openview/a637917a6bcfe3c6b1e040337853160d/1?pq-origsite=gscholar&cbl=18750&diss=y (accessed on 16 July 2024).
  67. Zhao, Y.; Zhang, Y.; Yang, Y.; Li, F.; Dai, R.; Li, J.; Wang, M.; Li, Z. The impact of land use structure change on utilization performance in Henan Province, China. Int. J. Environ. Res. Public Health 2023, 20, 4251. [Google Scholar] [CrossRef]
  68. Zhang, L.; Cheng, L.; Chiew, F.; Fu, B. Understanding the impacts of climate and landuse change on water yield. Curr. Opin. Environ. Sustain. 2018, 33, 167–174. [Google Scholar] [CrossRef]
  69. Jian, Z.; Gang, L.; Lianghua, Q. Temporal and Spatial Dynamics and Scenario Simulation of Water Yield inDaniiangkou Reservoir Area. Sci. Silvae Sin. 2020, 56, 9. (In Chinese) [Google Scholar]
  70. Ji, Z.; Wei, H.; Xue, D.; Liu, M.; Cai, E.; Chen, W.; Feng, X.; Li, J.; Lu, J.; Guo, Y. Trade-off and projecting effects of land use change on ecosystem services under different policies scenarios: A case study in Central China. Int. J. Environ. Res. Public Health 2021, 18, 3552. [Google Scholar] [CrossRef] [PubMed]
  71. Zhou, Y.; Li, X.; Liu, Y. Cultivated land protection and rational use in China. Land Use Policy 2021, 106, 105454. [Google Scholar] [CrossRef]
  72. Shirmohammadi, B.; Malekian, A.; Salajegheh, A.; Taheri, B.; Azarnivand, H.; Malek, Z.; Verburg, P.H. Impacts of future climate and land use change on water yield in a semiarid basin in Iran. Land Degrad. Dev. 2020, 31, 1252–1264. [Google Scholar] [CrossRef]
  73. Liu, M.; Tian, H.; Chen, G.; Ren, W.; Zhang, C.; Liu, J. Effects of land-use and land-cover change on evapotranspiration and water yield in China during 1900–2000. JAWRA J. Am. Water Resour. Assoc. 2008, 44, 1193–1207. [Google Scholar] [CrossRef]
  74. Anand, J.; Gosain, A.K.; Khosa, R. Prediction of land use changes based on Land Change Modeler and attribution of changes in the water balance of Ganga basin to land use change using the SWAT model. Sci. Total Environ. 2018, 644, 503–519. [Google Scholar] [CrossRef]
  75. Pamukcu, P.; Erdem, N.; Serengil, Y.; Randhir, T.O. Ecohydrologic modelling of water resources and land use for watershed conservation. Ecol. Inform. 2016, 36, 31–41. [Google Scholar] [CrossRef]
  76. Lang, Y.; Song, W.; Zhang, Y. Responses of the water-yield ecosystem service to climate and land use change in Sancha River Basin, China. Phys. Chem. Earth Parts A/B/C 2017, 101, 102–111. [Google Scholar] [CrossRef]
Figure 1. The location of Yellow River Basin in Henan province and corresponding river systems.
Water 16 02551 g001
Figure 3. Research framework of this study.
Water 16 02551 g003
Figure 4. The average water yield estimated in the Water Resources Bulletin was compared with the observed water yield (the blue dotted line is the fitting curve; the red dotted line is the 1:1 curve).
Water 16 02551 g004
Figure 5. The visualization of land use transfer matrix: (a) land use transformation, 2000–2010; (b) land use transformation, 2000–2010.
Water 16 02551 g005
Figure 6. Land use expansion: (a) 2000–2010; (b) 2010–2020.
Water 16 02551 g006
Figure 7. The contribution of driving factors to land use.
Water 16 02551 g007
Figure 8. Spatial distribution of land use predicted by PLUS model: (a) actual 2020’s land use; (b) predicted 2020’s land use; (c) predicted 2030’s land use; (d) predicted Scenario 1’s land use of 2030 (economic development priority scenario); (e) predicted Scenario 2’s land use of 2030 (ecological development priority scenario); (f) predicted Scenario 3’s land use of 2030 (cropland development priority scenario).
Water 16 02551 g008
Figure 9. Comparison of data distribution of water yield and precipitation in different years.
Water 16 02551 g009
Figure 10. Spatial distribution of historical water yield: (a) 2000; (b) 2010; (c) 2020; (d) changes from 2000 to 2010; (e) changes from 2010 to 2020; (f) changes from 2000 to 2020.
Water 16 02551 g010
Figure 11. Data distribution of water yield under different scenarios.
Water 16 02551 g011
Figure 12. The water yield spatial difference of different meteorological scenarios and different land use development scenarios in 2030: (a) ssp119’s water yield; (b) ssp245’s water yield; (c) ssp585’s water yield; (d) Scenario 1’s water yield; (e) Scenario 2’s water yield; (f) Scenario 3’s water yield; where (df) are local water yield maps, corresponding to the Luoyang urban area and Funiu Mountain district.
Water 16 02551 g012
Figure 13. Driving factors detection results: (a) the interactive detection results of each driving factor; (b) factor detection results of each driving factor.
Water 16 02551 g013
Table 2. The rule matrix of LUC conversion in three scenarios * (“1” means conversion enabled, “0” means conversion disabled).
Scenario 1
(Economic Development Priority)
Scenario 2
(Ecological Development Priority)
Scenario 3
(Cropland Development Priority)
abcdefgabcdefgabcdefg
a110100111010011000000
b110000101000001100000
c011100101110001111000
d011100101110001111000
e000010100001011000101
f000111111011111001111
g000000100000010000001
*: a—cropland; b—forest; c—shrub; d—grassland; e—water; f—barren; g—impervious land.
Table 3. Transfer matrix of land use during 2000–2020 (km2).
20002020
CroplandForestShrubGrasslandWaterBarrenImperviousTotal
Cropland19,483.1821.00.5177.1198.00.71425.322,105.7
Forest373.78147.93.123.10.40.013.18561.4
Shrub6.4120.820.427.30.00.00.1175.0
Grassland460.6408.310.2572.95.30.012.61469.9
Water87.50.60.00.3245.80.350.6385.1
Barren0.00.00.00.00.00.00.10.1
Impervious32.20.00.00.887.30.52761.02881.8
Total20,443.69498.734.2801.5536.71.54262.8
Table 4. Area of different land use under different development scenarios (km2).
CroplandForestShubGrasslandWaterBarrenImpervious
202020,470.709519.2734.24802.02557.291.454270.42
Predicted 203019,973.299698.2124.30701.39540.320.114717.79
Scenario 119,829.859518.9034.23800.58544.061.094926.69
Scenario 219,703.299968.2124.08665.36546.641.144746.69
Scenario 320,756.479454.3724.08594.34540.320.694285.14
Disclaimer/Publisher’s Note: The statements, opinions and data contained in all publications are solely those of the individual author(s) and contributor(s) and not of MDPI and/or the editor(s). MDPI and/or the editor(s) disclaim responsibility for any injury to people or property resulting from any ideas, methods, instructions or products referred to in the content.

