Article

Mitigation of Membrane Fouling in Membrane Bioreactors Using Granular and Powdered Activated Carbon: An Experimental Study

1
Resource Recovery Laboratory, Faculty of Engineering and Geological Sciences, Department of Chemical and Environmental Engineering, Universidad Católica del Norte, 0610 Angamos Avenue, Antofagasta 1270709, Chile
2
Department of Chemical and Environmental Engineering, Universidad Técnica Federico Santa María, 1680 España Avenue, Valparaíso 2390123, Chile
3
Department of Chemical and Environmental Engineering, Universidad Técnica Federico Santa María, 3939 Vicuña Mackenna Avenue, San Joaquín, Santiago 8940897, Chile
4
Faculty of Marine Sciences, School of Risk Prevention and Environment, Universidad Católica del Norte, 1281 Larrondo, Coquimbo 1780000, Chile
*
Author to whom correspondence should be addressed.
Water 2024, 16(17), 2556; https://doi.org/10.3390/w16172556 (registering DOI)
Submission received: 3 August 2024 / Revised: 31 August 2024 / Accepted: 4 September 2024 / Published: 9 September 2024
(This article belongs to the Special Issue Membrane Technology for Desalination and Wastewater Treatment)

Abstract

:
This experimental study explores the mitigation of membrane fouling in membrane bioreactors (MBRs) through the combined use of granular activated carbon (GAC) and powdered activated carbon (PAC). The research assesses the impact of these materials on the fouling resistance, critical flux, and permeate quality using various mixed liquor suspended solids concentrations and carbon dosages. The results indicate that the GAC-PAC combination significantly reduces the total filtration resistance, particularly the cake layer resistance, by 11.7% to 13.6% compared to setups without activated carbon or with the individual carbon types. The study also reveals that this combination decreased the fouling rate by 15% to 24% at critical flux steps, demonstrating substantial improvements in fouling mitigation and operational efficiency. Furthermore, the GAC-PAC combination, which produces an adsorption process, enhances the permeate quality, achieving the near-complete removal of organic matter, total nitrogen, and turbidity, with total phosphorus removal reaching 99%. These findings demonstrate that the combined use of GAC and PAC not only reduces membrane fouling but also improves the overall MBR performance, making it a viable strategy for enhancing the efficiency of wastewater treatment processes.

1. Introduction

In recent years, the adoption of MBR technologies has significantly advanced the field of wastewater treatment. MBRs, which integrate biological degradation with membrane filtration, offer enhanced efficiency and effectiveness with reduced sludge yield compared to conventional wastewater treatment processes [1,2,3]. Driven by the need for improved water quality and regulatory compliance, this innovative approach has seen increasing application in both municipal and industrial wastewater treatment, with the global installed capacity of MBRs reaching approximately 50,000 m3/d for industrial use and 15 million m3/d for municipal use [3,4,5]. The growing adoption of this technology can be attributed to its compact nature, the generation of high-quality effluents, the ability to withstand high organic loads, and the production of largely disinfected effluents [3,6,7]. However, membrane fouling remains the main drawback preventing the wider application of this technology, involving higher operational costs due to higher energy consumption and more frequent cleaning [8,9,10,11]. For instance, it was reported that, due to the effect of fouling, the transmembrane pressure increase was responsible for 30 to 70% of the energy consumption [12].
Membrane fouling is the undesirable deposition of suspended particles, colloids, and solutes from mixed liquor suspended solids (MLSSs) on the membrane surface and within its pores, which can significantly reduce the membrane performance and lifespan [7,13,14]. Membrane fouling is a critical factor in optimizing MBRs. Therefore, developing mitigation strategies to reduce the fouling effect can enhance operations, decrease costs, and improve the viability of this technology [15,16,17]. Numerous studies have focused on mitigating membrane fouling through various methods and strategies. Common approaches include modifying membrane materials [18,19], optimizing operating and cleaning conditions [8], and employing techniques such as ultrasonic vibrations [20], quorum quenching [21], and the application of anti-adhesins [10], electrical fields [22], and liquid gating technology [23]. Recently, novel strategies have incorporated additives—such as coagulants [24,25], bioflocculants [26], microalgae [27], adsorption agents, and biofilm carriers [28]—to reduce fouling in MBRs.
Studies have evaluated fouling mitigation strategies using powdered activated carbon (PAC) as an adsorbent coupled to the MBR process, showing significant reductions in membrane fouling and increased filtration periods without significantly fouling the membrane surface [28,29,30]. PAC is used in MBRs to mitigate fouling by enhancing the removal of low-molecular-weight organics, extracellular polymeric substances (EPSs), and soluble microbial products (SMPs), which are primary contributors to membrane fouling [28]. PAC-MBR systems can improve the overall process performance, extend membrane filtration periods, and reduce the concentration and deposition of EPSs on membrane surfaces [29,31]. However, some studies have shown that an excessive dosage of PAC in the MBR system leads to PAC deposition on the membrane surface, further aggravating membrane fouling and reducing the overall process performance [32,33].
Studies have shown that granular activated carbon (GAC) significantly enhances MBR performance. Johir et al. [34] found that GAC reduced the sludge volume index, dissolved organic carbon, and chemical oxygen demand (COD) by 95%. Wu et al. [35] demonstrated that fluidized GAC mechanically scrubs the membrane surface, reducing the biofilm layer, maintaining higher flux rates, and decreasing the membrane cleaning frequency. GAC also adsorbs organic substances, EPSs, and SMPs, thereby reducing membrane fouling and improving effluent quality. The combined shearing effect of GAC particles with bubbling or agitation offers a viable long-term solution for fouling mitigation, significantly enhancing the overall reactor performance [35,36,37].
Yu et al. [32] conducted a study that investigated the challenges of membrane fouling in ultrafiltration (UF) for surface water treatment applications. They proposed an integrated system combining fluidized GAC and PAC with UF. PAC improved the effluent quality in this system by adsorbing humic acid-like substances, while fluidized GAC mitigated UF fouling and PAC deposition through mechanical scouring and induced liquid turbulence. The lab-scale evaluation of the integrated GAC-PAC-UF system demonstrated significantly reduced fouling, enhanced effluent quality, and lower energy consumption compared to conventional methods.
Integrating GAC and PAC into MBR systems offers a robust and innovative solution to mitigate membrane fouling, a persistent challenge in wastewater treatment. The synergistic effects of GAC’s mechanical scouring and PAC’s adsorption capabilities significantly reduce membrane fouling, resulting in notable operational benefits such as extended membrane lifespan, reduced cleaning frequency, and overall cost savings. This combined approach not only enhances the efficiency and sustainability of MBR systems but also provides operational flexibility, addressing fouling more effectively than using either material alone. One of the key advantages of this approach is its ability to improve permeate quality while maintaining higher flux stability and lower transmembrane pressure (TMP), which are critical for maintaining efficient and long-term MBR operations. However, the effectiveness of this technology relies on optimizing the dosages of GAC and PAC to prevent excessive PAC deposition, which could otherwise lead to increased fouling. Despite these potential drawbacks, the technology presents a promising solution for both municipal and industrial wastewater treatment applications, where high effluent quality and operational efficiency are paramount. The novelty of this study lies in its experimental investigation of the simultaneous use of both GAC and PAC within an MBR system. While previous studies have explored these materials individually, there is limited information on their combined effects. This research aims to fill this gap by providing comprehensive insights into how the dual application of GAC and PAC can further enhance MBR performance, offering a new strategy to increase the membrane lifespan and improve the overall sustainability of wastewater treatment processes. The findings from this study are expected to contribute significantly to the advancement of MBR technology and its practical applications in the field.

2. Materials and Methods

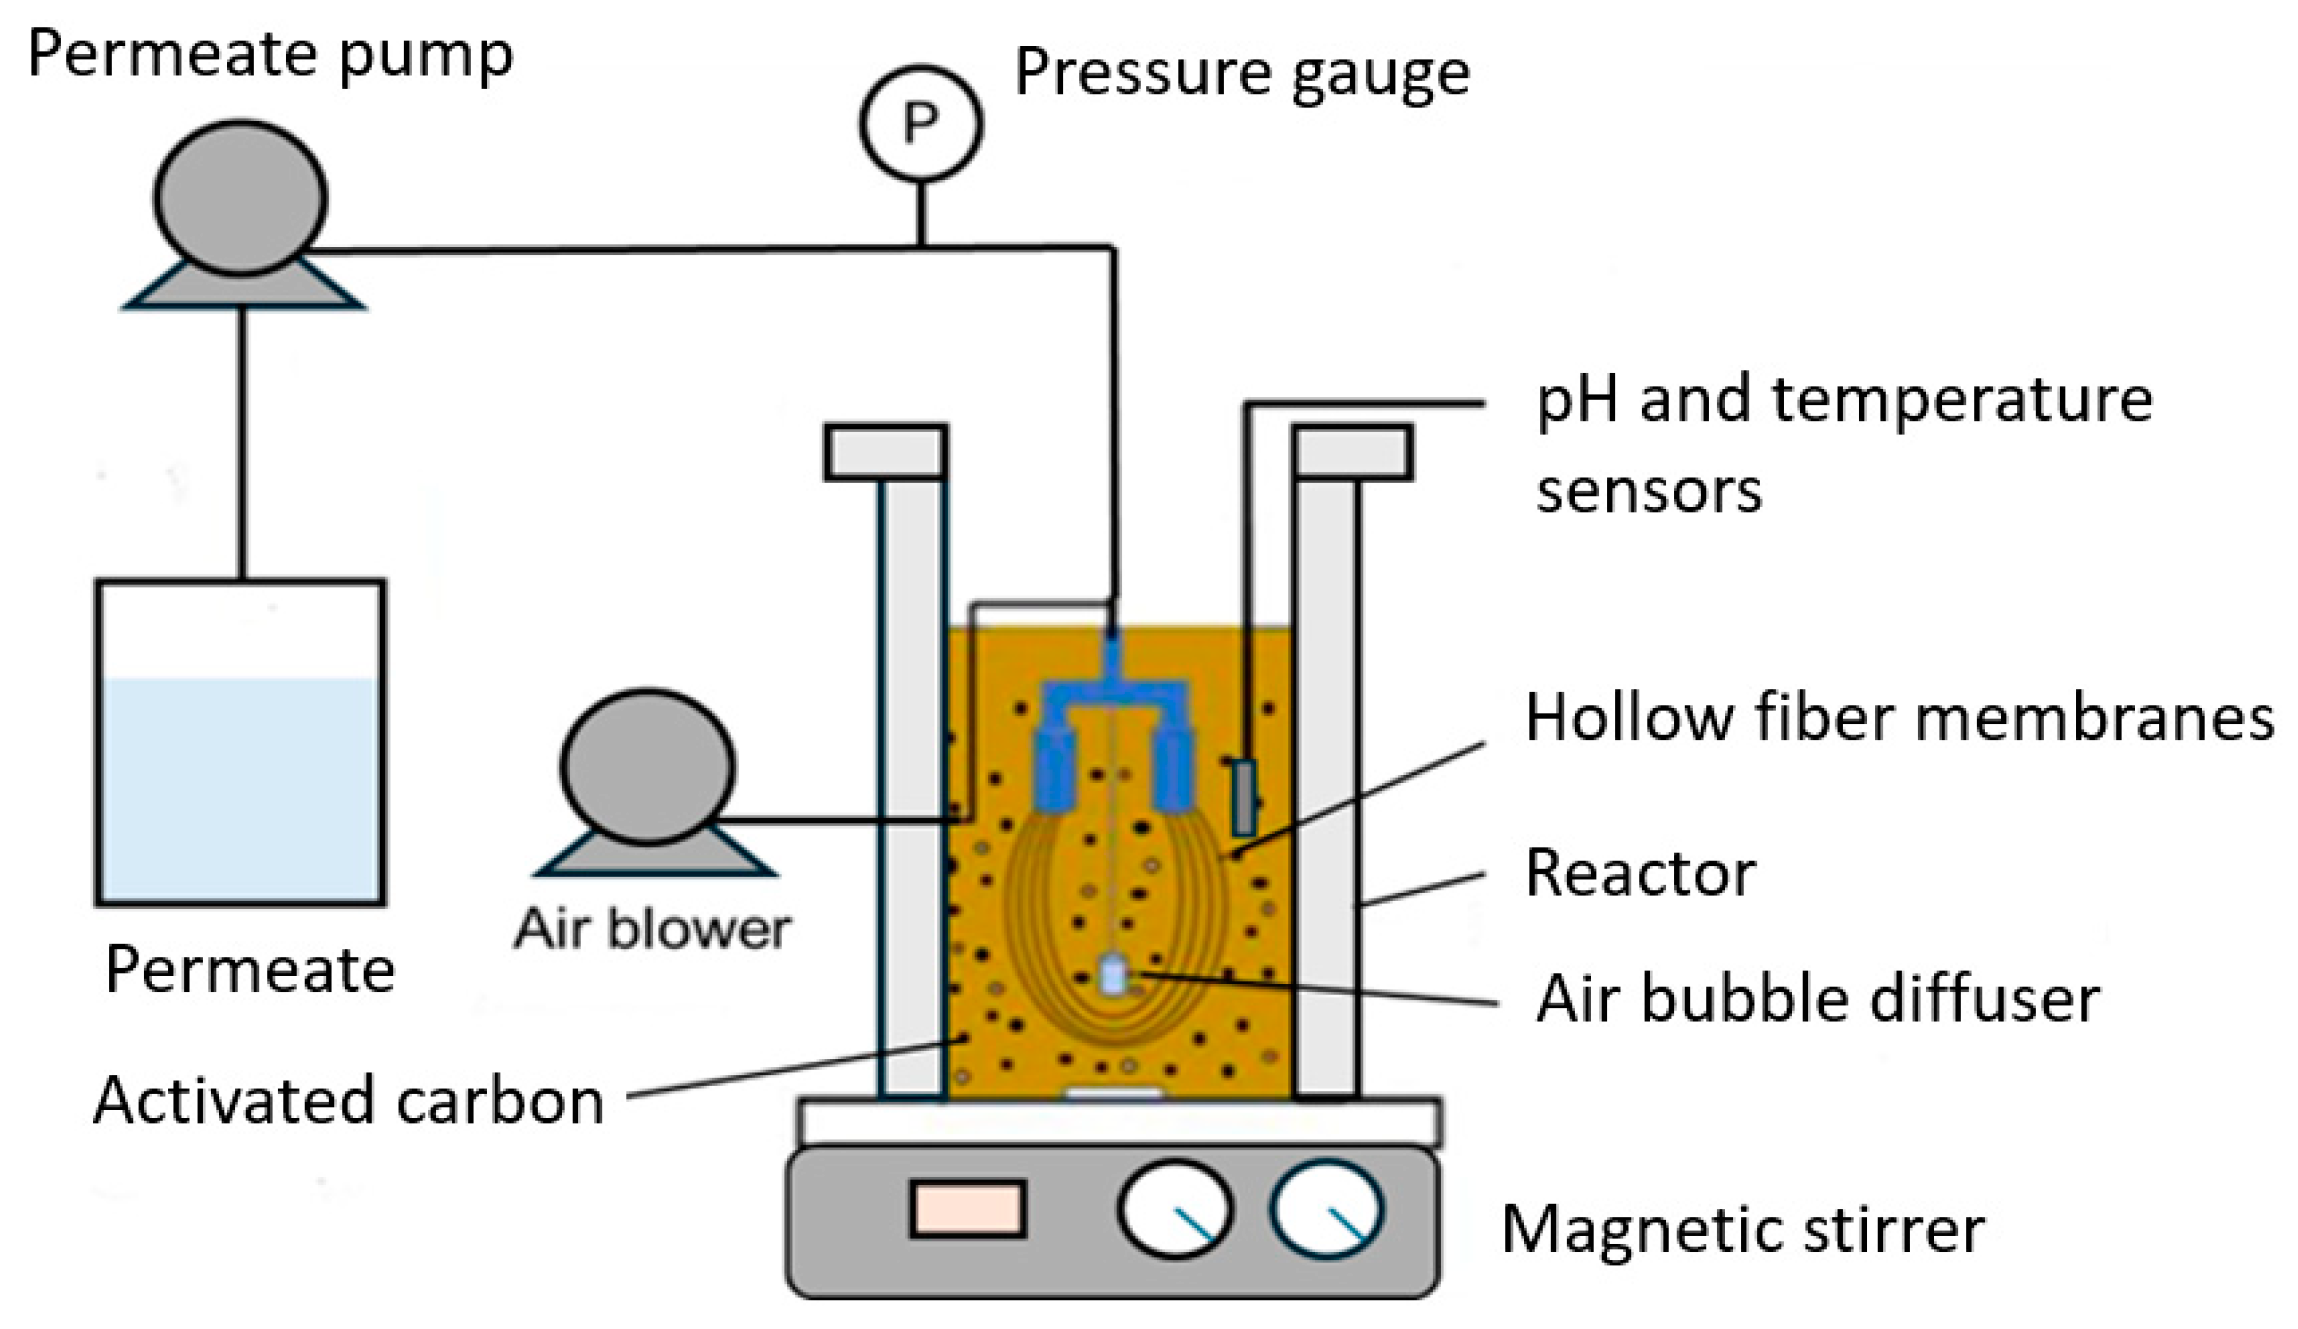
2.1. Membrane Bioreactor

The membrane modules used in this study comprised 100 fibers, each 29–30 cm long, forming a U-shaped membrane module. These membranes are made of PS (polysulfone), with a molecular weight cut-off (MWCO) ranging between 10 and 100 kDa, an inner diameter (ID) of 1 mm, an outer diameter (OD) of 1.6 mm, and a total active area of approximately 0.137 m2 each. Initially, membrane modules were constructed from a new commercially available hollow fiber ultrafiltration module (UF4046 membrane, AQU-90PS model, Shanghai CM Environmental Technology Co. Ltd, Shanghai, China). This module was dismantled to extract the fiber membranes for the creation of new and smaller-capacity modules.
To analyze the impact of GAC and PAC on membrane fouling, identical laboratory-scale MBR systems were utilized, each with a volume of 4 L and an MLSS concentration of 3.4 g/L. The activated sludge samples were obtained from an industrial wastewater treatment plant located in Antofagasta City, Chile. Each MBR contained an immersed PS hollow fiber membrane module. Figure 1 shows a general scheme of the experimental setup.
A magnetic stirrer (MS-H280-Pro model, DLAB, Beijing, China) with a 50 mm stirring bar was used to induce the movement of activated carbon particles, with the stirring speed set to 300 rpm. This continuous stirring ensured a homogeneous distribution of the activated carbon particles within the reactor, preventing the deposition of PAC at the bottom of the reactor and promoting interactions between the particles and the membrane surface. This induced shear effects on the membrane surface caused by the moving activated carbon particles. The permeate flow rate was controlled using a peristaltic pump (BT100-2J model, Longer Precision Pump Co., Ltd, Baoding, China), with the permeate collected in beakers, where its weight was measured using an electronic balance (PCB model, Kern, Balingen, Germany). The permeate pump was operated in continuous suction mode, and TMP was measured by continuous monitoring with digital pressure gauges (IP65 model, Kelp Instruments Co., Ltd, Ningbo, China) to indicate membrane fouling.
Air was continuously supplied to the bioreactor using an air pump (SB-860A model, SOBO, Guangzhou, China) for continuous surface scouring of the membrane at a constant flow rate of approximately 3 L/h, providing oxygen to the activated sludge and generating turbulence to alleviate fouling. Continuous aeration not only supplied the necessary oxygen for biological activity in the reactor but also helped in the movement and deposition of GAC and PAC particles on and between the membrane fibers. An air diffuser was placed at the bottom surrounding the base of the tank and between the hollow fiber membranes. The dissolved oxygen (DO) concentration was measured with a dissolved oxygen meter (MI605 model, Martini Instruments, Cluj-Napoca, Romania). DO and MLSS concentrations were measured during all experiments to ensure consistent operating conditions for the MBRs. A pH meter (HI 5522 model, Hanna Instruments, Smithfield, RI, USA) was used to monitor the pH and temperature of the bioreactors. The reactor operated at room temperature, and the pH ranged from 7 to 7.8 and was controlled using a NaOH or H2SO4 solution. It should be noted that the pH of the permeate was also measured. The reagents used were analytical grade (Sigma-Aldrich, St. Louis, MO, USA), with NaOH in granular form and H2SO4 in liquid form, both with a purity of ≥98%.

2.2. Experimental Configurations

Activated carbon was used at concentrations of 2 and 4 g/L for GAC and 150–300 mg/L for PAC, with combinations of both also tested. The dosages were based on previous studies by Yu et al. [33], Johir et al. [34], Wu et al. [35], and Sohn et al. [37] and were applied once at the start of the experiment. The GAC used was technical grade (Winkler, Santiago, Chile) derived from coconut shells. It was sieved to obtain GAC (0.5–1.68 mm, mesh Nos. 12 and 35) and crushed to produce PAC (<0.088 mm, mesh No. 170). Before each experiment, GAC particles were washed with distilled water to remove fine carbon dust and dried in an oven at 40 °C overnight.
The experimental assays were based on critical flux (Fc) determination tests. The flux values increased progressively from 0.25 to 1 LHM, which was directly related to TMP. Two types of MBRs were used, each with different MLSS concentrations. MBR M1 had a higher concentration of 3.4 g/L MLSSs, while MBR M2 had a lower concentration, diluted from M1 to 1.15 g/L MLSS.
This study evaluated 14 MBR systems with various combinations of sludge concentrations, types of carbon, and carbon dosages (Table 1). For both MBRs M1 and M2, the systems were classified based on the addition of carbon: control MBRs without activated carbon, MBRs with the addition of GAC (2 and 4 g/L) or PAC (150 and 300 mg/L), and MBRs with combinations of GAC and PAC (2 g/L–150 mg/L and 4 g/L–300 mg/L). This comprehensive setup allowed for the systematic evaluation of membrane fouling mitigation strategies using GAC and PAC in different concentrations and combinations, providing valuable insights into their effectiveness in improving MBR performance.

2.3. Analytical Methods

To characterize MLSS and permeate samples, various analyses were conducted in triplicate. The determination of chemical oxygen demand (COD) followed an adapted version of USEPA Method 410.4, suitable for wastewater analysis. Depending on the COD range—higher for sludge and lower for permeate—either 0.2 mL or 2 mL of the sample was used. The reagent kits HI 93754A and HI 93754C (Hanna Instruments, Smithfield, RI, USA) were used. These samples were then reacted in a thermoreactor (HI839800 model, Hanna Instruments, Smithfield, RI, USA) for 2 h at 150 °C. After cooling, the COD values were measured using a spectrophotometer (Iris HI 801 model, Hanna Instruments, Smithfield, RI, USA).
Turbidity measurements were performed on 10 mL samples placed in glass cuvettes. These measurements were also conducted using a turbidimeter (HI98703 model, Hanna Instruments, Smithfield, RI, USA). Total Suspended Solids (TSS) were determined by filtering 10 mL samples through a pre-weighed 0.45 µm filter with a 47 mm diameter (Advantec, Tokyo, Japan). The filters were dried in an oven at 105 °C for 1 h to evaporate the water content and then cooled in a desiccator before weighing to determine the TSSs, following the APHA [38] guidelines.
Total nitrogen was analyzed using 2 mL samples and the chromotropic acid method, with results obtained from the Iris HI 801 spectrophotometer. Similarly, total phosphorus was measured using 5 mL samples based on an adaptation of EPA Method 365.2. This analysis was also performed using the Iris HI 801 spectrophotometer. For the total nitrogen and phosphorus analyses, reagent kits HI93767 and HI93763 (Hanna Instruments, Smithfield, RI, USA) were used, respectively. To ensure data quality, analyses were performed in triplicate to verify precision and reproducibility.

2.4. Fouling Evaluation

2.4.1. Critical Flux Determination

Fc was determined according to the criteria established by Le-Clech et al. [39]. This standard flux-step method for evaluating fouling in an MBR allowed the identification of key parameters, such as the fouling rate, initial TMP increase, and average TMP. These parameters were based on TMP to represent fouling behavior and identify the onset of fouling, referred to as Fc. The method involved establishing an initial flux for a specific duration (step length) and progressively increasing it until a significant rise in TMP was observed.
The flux-step method was implemented using a peristaltic pump (BT100-2J model, Longer Precision Pump Co. Ltd, Baoding, China) along with a hollow fiber membrane to filter water and activated sludge. The system’s operation was initially evaluated, and the permeate fluxes produced at different pump speeds (from 1 to 100 rpm) were determined. This process established the working parameters for each flux step, Fc, and key parameters based on TMP. To increase the membrane flux, the pump speed was gradually regulated while monitoring the system’s TMP. A step length of 20 min was defined for each flux step of 0.25, 0.5, 0.75, 1, 1.25, and 1.5 LHM, with a total duration of 120 min per test.
The initial TMP was recorded one minute after each flux increase to avoid the instability of the initial pressure values. TMP values were recorded from the beginning to the end of all flux steps, and parameters related to fouling, such as the initial TMP increase, fouling rate, and average TMP, were defined. The membrane module was cleaned before each test by first rinsing with distilled water and then soaking in a 0.3% v/v NaClO solution for 30 min [40], followed by another rinse with distilled water to restore permeability to 100%. Membrane cleaning was verified by measuring permeability at a constant water filtration flow after each cleaning cycle. Cleaning was considered effective when the recovered permeability equaled the initial value. The NaClO reagent used has a 5% concentration (Winkler, Santiago, Chile).

2.4.2. Membrane Fouling Resistance Analysis

Membrane fouling resistance was used as a measure of fouling in the different MBRs. The resistance (R), inversely related to the permeate flux (J), is described using Darcy’s law and calculated with Equation (1):
R = TMP µ   J
where J is the permeate flux (LMH), TMP is the transmembrane pressure (bar), and μ is the permeate viscosity (Pa·s).
The total filtration resistance consists of several components: intrinsic membrane resistance (Rm), cake layer resistance (Rc), gel layer resistance (Rg), and irreversible resistance (Ri). According to the series resistance model, the total resistance (Rt) is given by Equation (2) [41]:
R t = R m + R c + R g + R i
Rm is influenced by the membrane material characteristics, such as thickness and pore size, and determines the flux through the membrane for clean water filtration. Rc is associated with the filtration mechanism, depending on the membrane characteristics and the filtered solids. It represents the reversible fraction of the cake layer resistance that can be removed during relaxation or backwashing. Rg is the resistance of the gel layer, primarily formed by SMPs and EPSs, affecting the membrane pores. Ri corresponds to the fraction of the cake layer resistance that cannot be removed during relaxation or backwashing.
Fouling resistance (Rf) is defined as the total resistance due to fouling, excluding Rm, and is represented by Equation (3):
R f = R c + R g + R i
The series resistance model serves as a tool to assess the impact of fouling on the membrane performance [12]. The intrinsic membrane resistance and data from filtration tests, including Fc tests, were used to evaluate membrane fouling resistance. Specifically, the analysis focused on step 4 of the entire Fc analysis period, as this step showed the highest pressure increase, fouling rate, and permeability decrease.
The intrinsic membrane resistance was calculated by measuring the TMP while filtering only water at the beginning of each test. The cake resistance was then obtained by measuring the TMP during filtration in the MBRs with sludge using various GAC-PAC combinations.

3. Results

3.1. Determination of Critical Flux

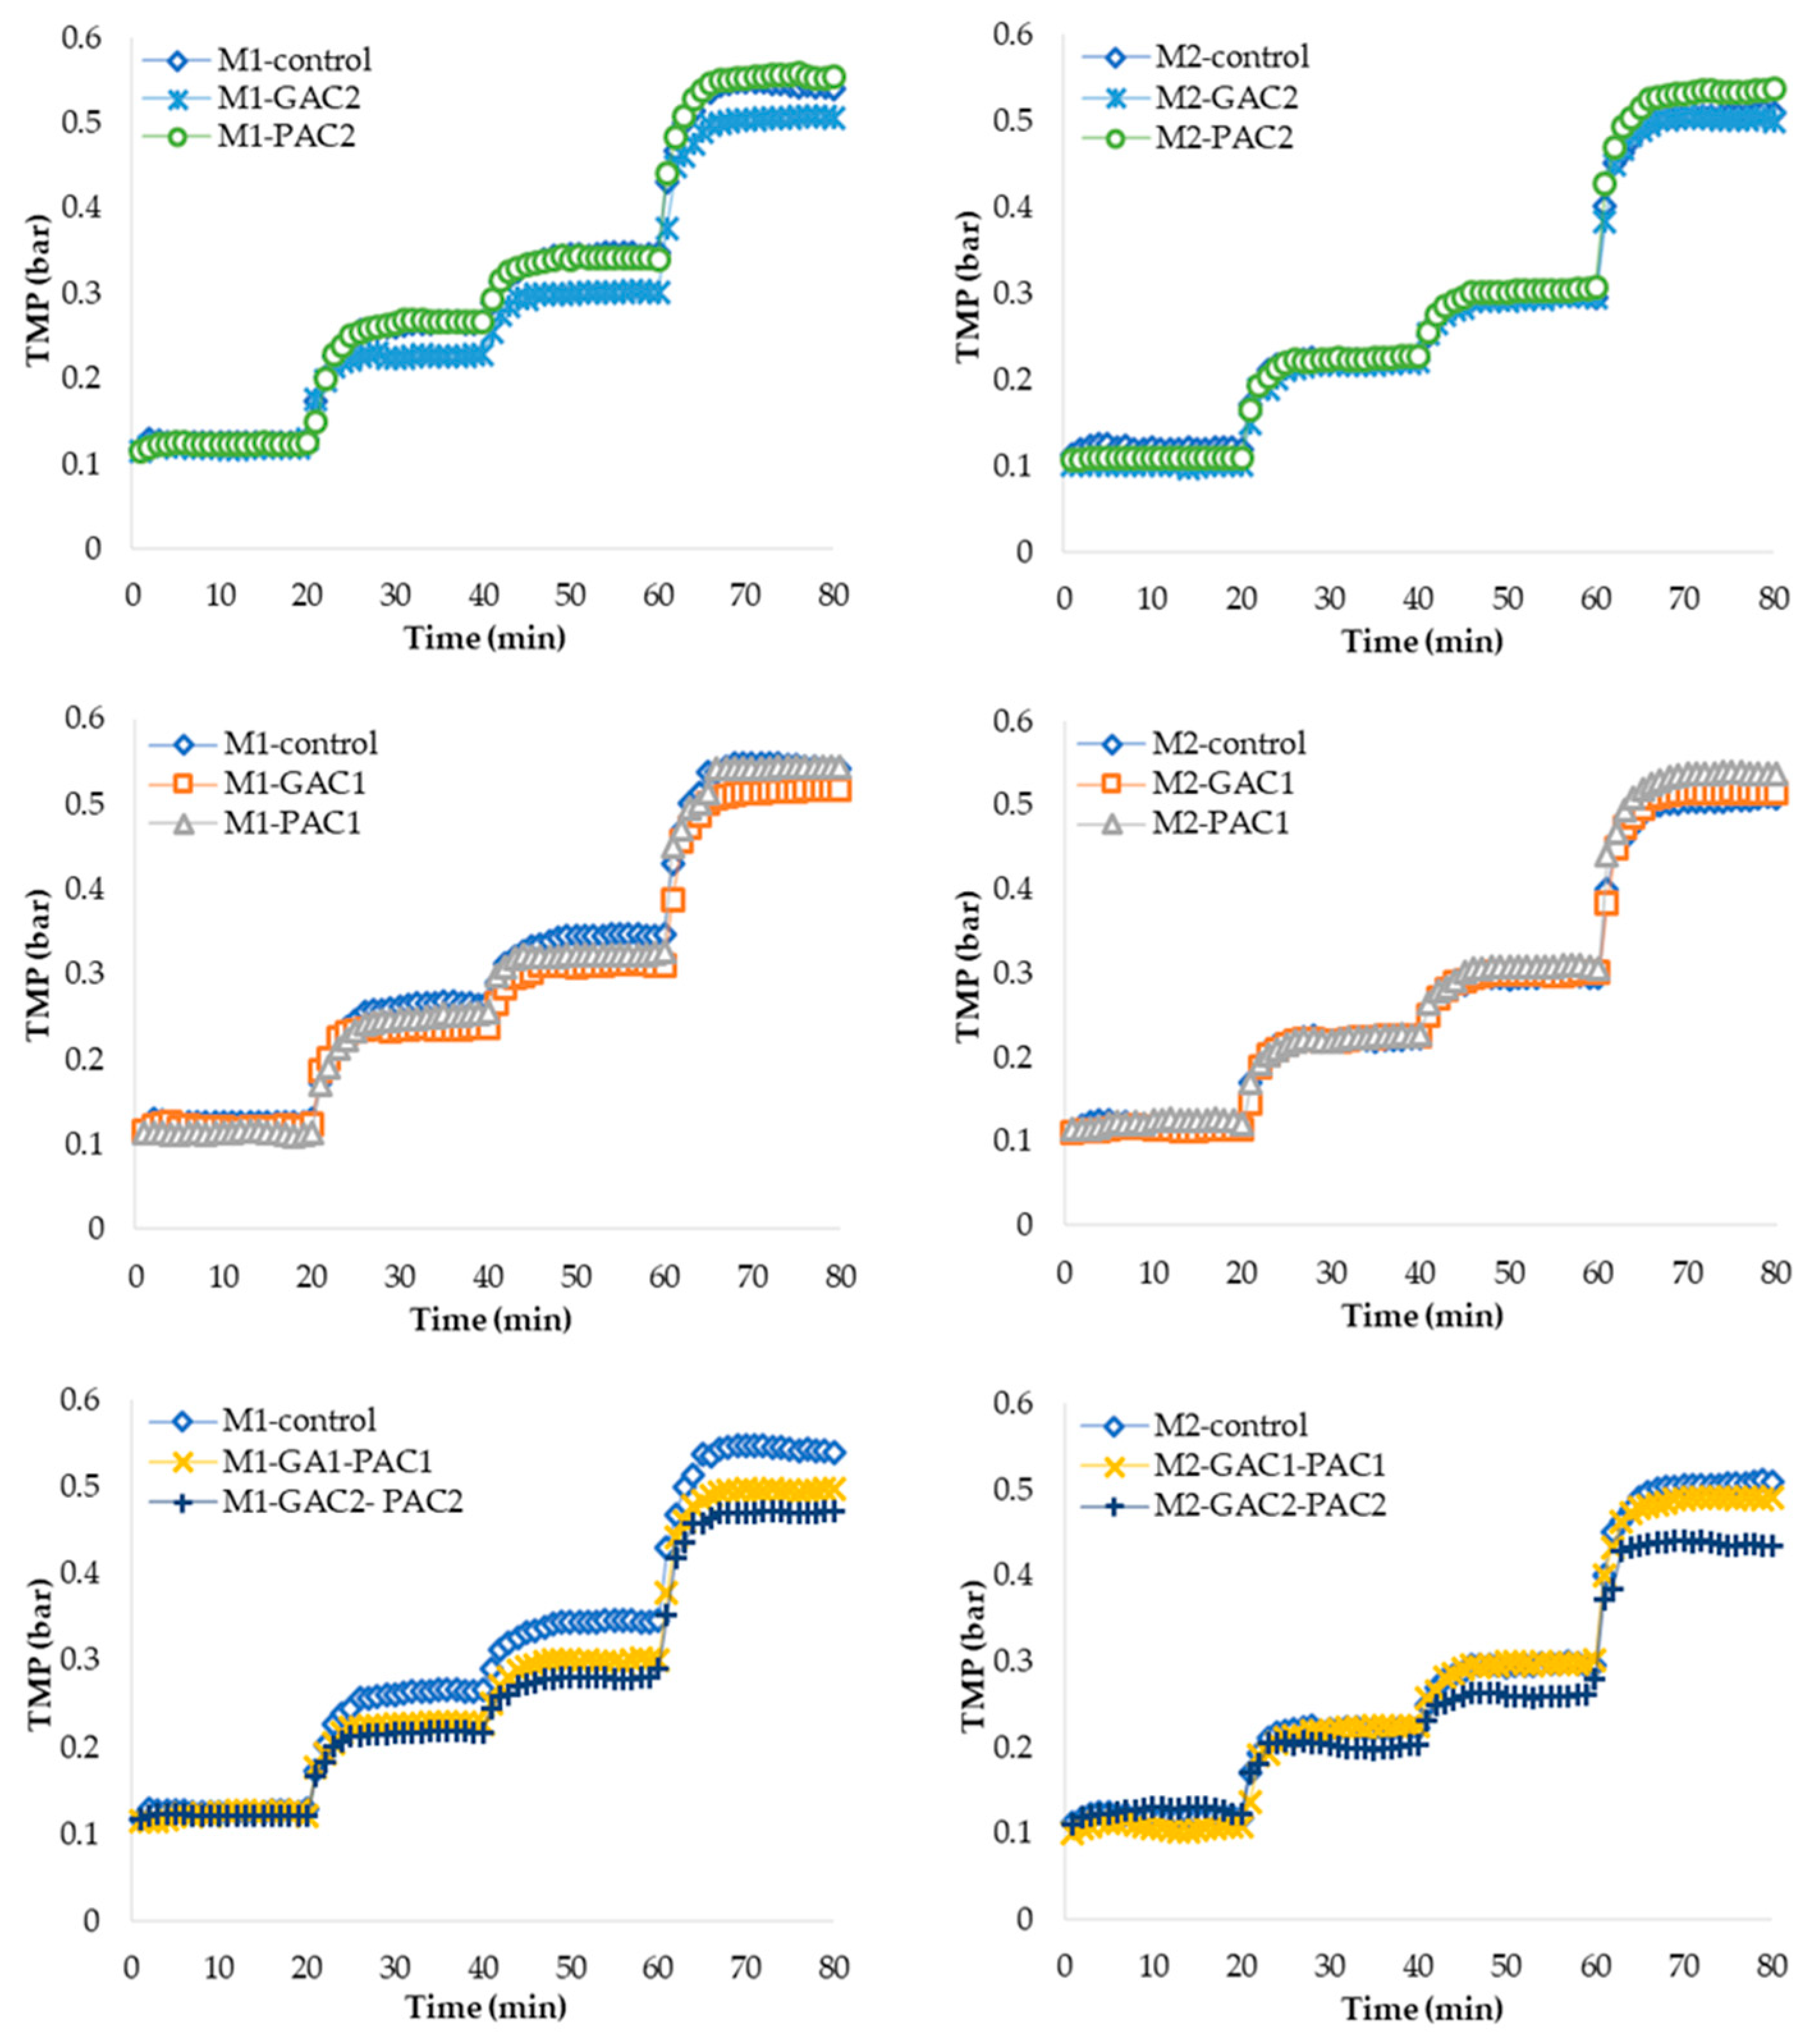
3.1.1. Analysis of TMP Changes with Varying MLSS Concentrations and Activated Carbon Dosages

To analyze the fouling of the MBR systems, a standard step flow determination was carried out. Key parameters such as the fouling rate, initial increase in TMP, and average TMP were identified, which allowed for the representation of the fouling behavior of the MBR and the identification of its Fc.
The change in TMP and the determination of Fc for the MBRs named M1 and M2 are shown in Figure 2. The M1 MBRs contain more concentrated MLSSs, while M2 MBRs have diluted MLSSs at one-third the concentration of M1. A control MBR and various MBRs with the addition of activated carbon at different doses of GAC, PAC, and their combination were used. Due to the lower concentration in the M2 MBRs, they exhibit a lower TMP compared to M1. Starting from flux 2, or the second step, the MBRs show a gradual increase in TMP as the flux increases. This increase is more prominent at flux 4 during the fourth step, between 61 and 80 min, for all MBRs. However, the TMP becomes more critical in MBRs with the addition of only PAC; this could be due to the deposition of particles on the membrane surface, as reported by Jiang et al. [42]. Additionally, it is inferred that, due to the relatively small size of PAC particles, they can be retained on the membrane surface despite aeration and agitation, which increases the transmembrane pressure. A high TMP also suggests greater membrane fouling, negatively impacting the efficiency of the MBR process.
Conversely, MBRs with the addition of GAC have a lower TMP than the control MBR, and MBRs with the addition of activated carbon in the GAC-PAC combination at different doses have an even lower TMP, which is reduced by up to 13.6%. This could be explained by Yu et al.’s [32] findings, which indicated that fluidized GAC mitigates UF fouling and PAC deposition through mechanical scouring and induced liquid turbulence. These mechanisms help to maintain lower TMP levels and enhance the overall efficiency and sustainability of the MBR systems. Additionally, when comparing MBRs M1 and M2, the lower sludge concentration results in a lower TMP in all scenarios, and the TMP is further reduced with the addition of the GAC-PAC combination.

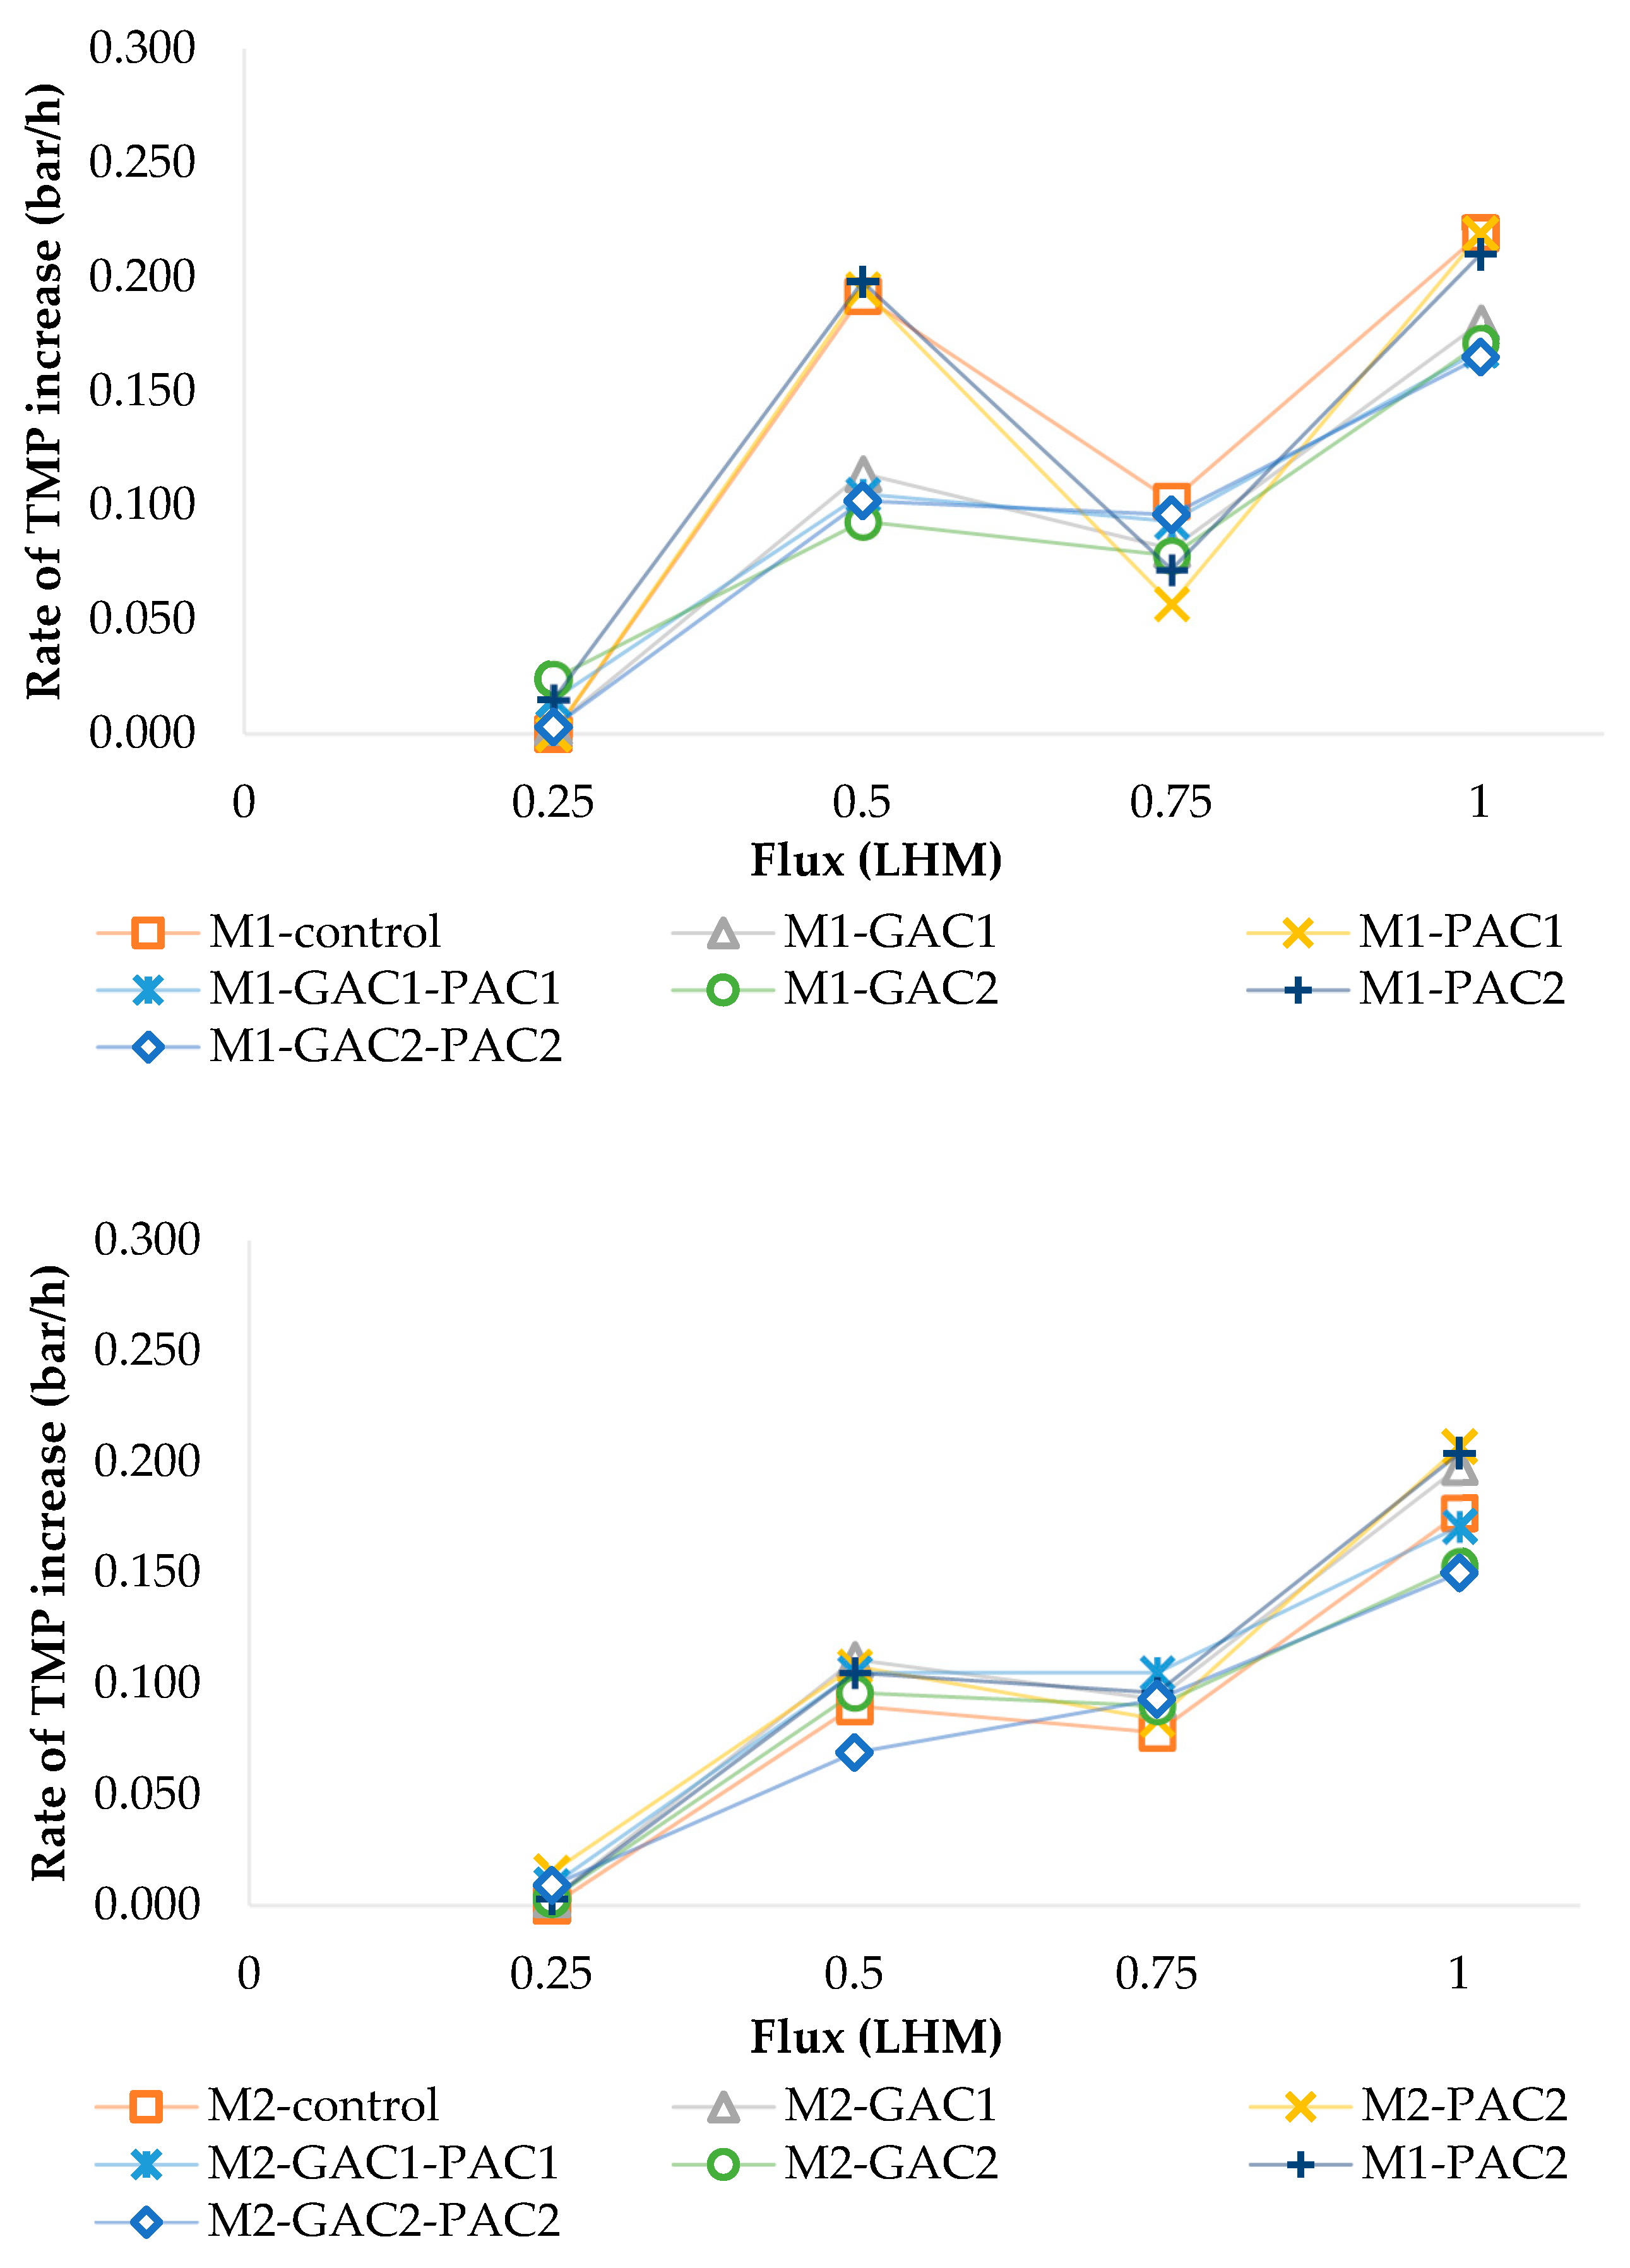
3.1.2. Fouling Rate and Flux Evaluation

Fouling rates were evaluated to determine the Fc in MBR systems. The results show that the initial increase in TMP, along with the fouling rate, is a good indicator for identifying the transition to a Fc. Figure 3 shows that at step 4, or when reaching a flux equal to 1 LHM, the highest fouling rates are observed for M1 and M2, with values of 0.110 and 0.089 bar/h, respectively. Thus, the control MBR and those with the addition of PAC show a higher increase in the fouling rate during filtration at a flux of 1 LHM compared to the addition of GAC or a GAC-PAC combination, which allows for a reduction in the fouling rate between 15% and 24% at the most critical step.
The clean water permeability is higher than the values obtained with the filtration of activated sludge in the MBR systems under the same operating conditions, as shown in Figure 4. Additionally, these graphs illustrate that at a certain flux, the TMP of the sludge starts to diverge significantly from the TMP of the water, becoming more pronounced at step 4. This indicates that the TMP closest to the TMP of the water corresponds to the MBRs with the addition of GAC2-PAC2.

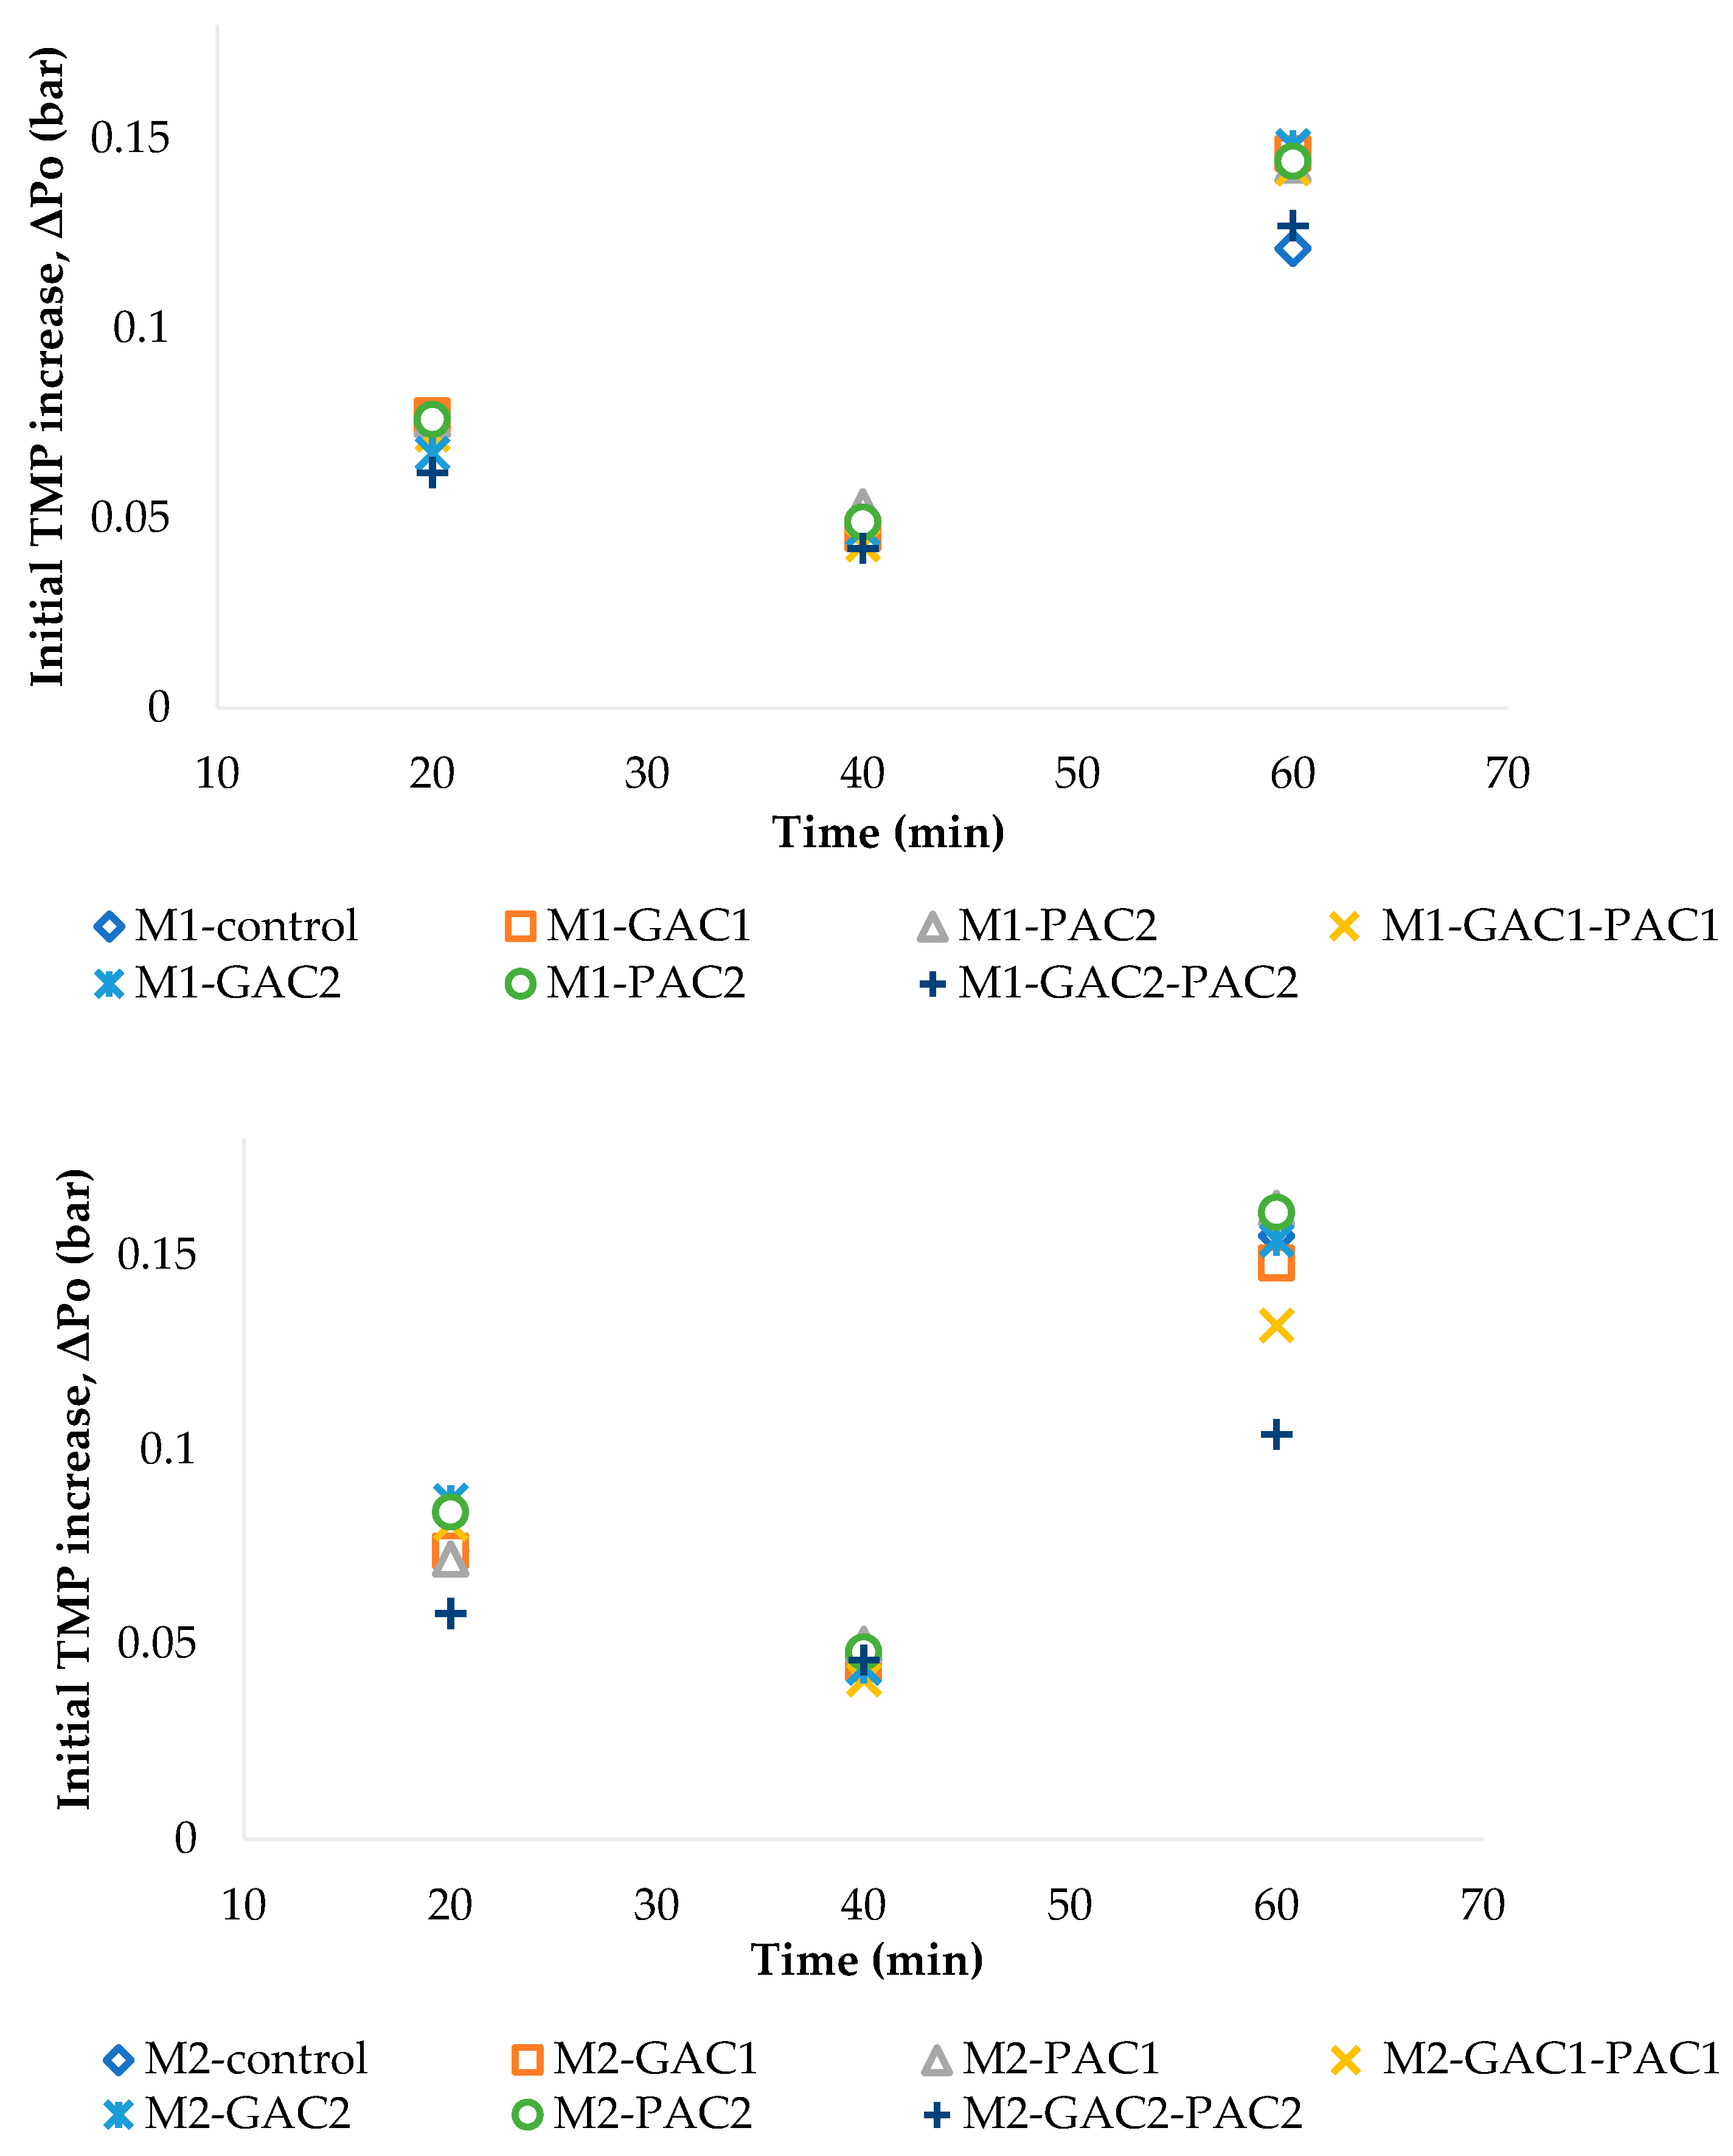
3.1.3. Initial Increase in TMP

For each flow step, the initial increase in TMP (ΔP0) was calculated to identify the Fc in the MBRs. The initial increase in TMP is a key parameter indicating membrane resistance and the onset of fouling as the flow increases. At low fluxes, the constant value of ΔP0 (bar) represents the increase that would occur under clean water conditions, which is directly related to the membrane resistance. However, fouling and rapid accumulation on the membrane surface occur at the beginning of the flux step at higher fluxes, as indicated by ΔP0. Even though ΔP0 appears constant, fouling still occurs, and when it begins to increase, it can be considered the Fc. As shown in Figure 5, the initial increase in TMP (ΔP0) grows with the increase in flux, reaching its maximum value at flux step 4, between 61 and 80 min, for the different MBRs.
As Heo et al. [43] mentioned, the calculated parameters, such as TMP, appear to be good indicators of membrane fouling. These results could indicate the flux value at which fouling becomes significant. In this way, the test achieved a fouling rate of zero in the MBRs at step 1, which can be characterized as a subcritical operation. However, as Le-Clech et al. [39] noted, an Fc value could also be defined based on a more arbitrary rate, such as a fouling rate of 0.06 bar/hour, as mentioned by those authors. Considering this, there are MBRs in which steps 2 and 3 generate a lower fouling rate, close to 0.06 bar/hour.
Thus, these steps can be regarded as subcritical operations, and the Fc would begin after these steps. Based on the results of all the indicators, it can be determined that step 4, between fluxes of 0.75 and 1 LHM, is a critical operation for both types of sludge. However, in M1, with the more concentrated sludge, the critical operation could begin before step 4, likely due to the amount of biomass present, but with the addition of GAC and GAC-PAC, this can change, reducing the fouling rate.
The filtration of activated sludge in an MBR is often accompanied by a significant decrease in flux due to the formation of cake layers and fouling, as noted by Du et al. [44] and Nabi et al. [45]. Therefore, stable fluxes can be produced if the Fc is not exceeded. Below the Fc, the TMP is usually lower and increases linearly, whereas, above the Fc, the pressure increases more rapidly, indicating the formation of a cake layer, which is usually accompanied by an increase in TMP and/or a decrease in flux.

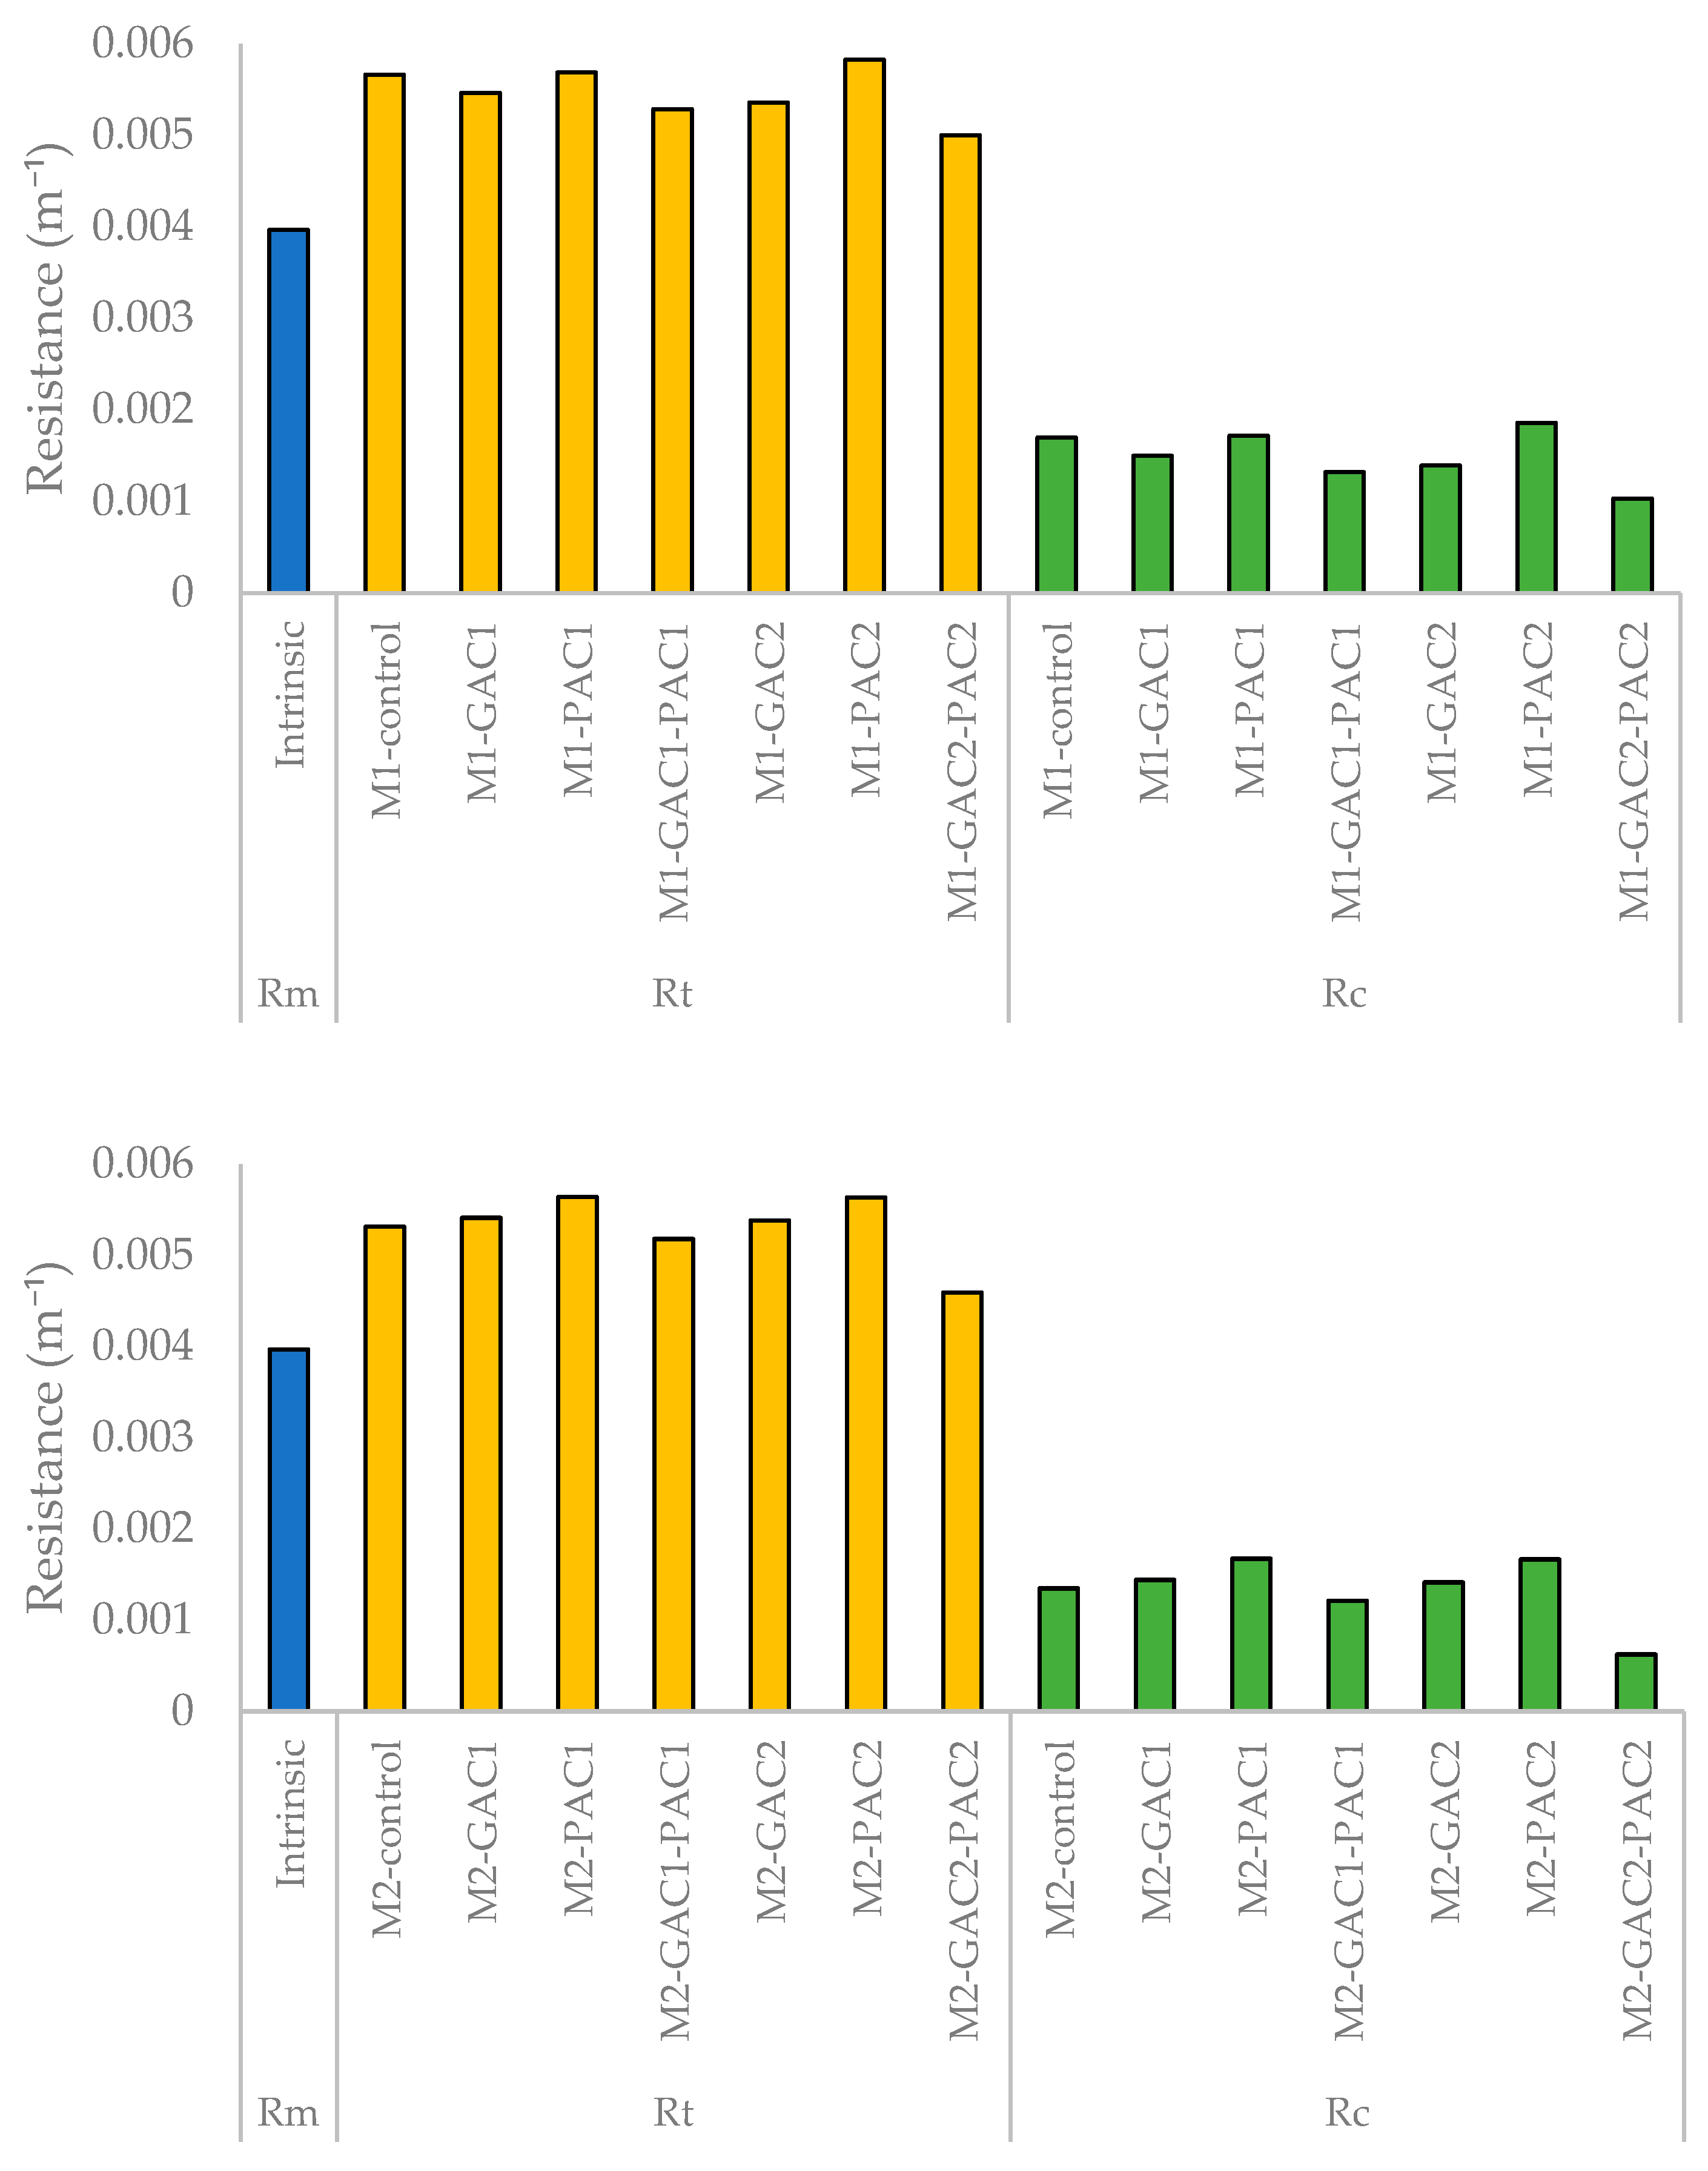
3.2. Membrane Fouling Resistance Analysis

The results of the membrane resistance analysis are summarized in Figure 6. The MBRs with the combined addition of GAC and PAC showed a lower total resistance compared to the other MBRs. The total resistance includes the intrinsic resistance and fouling resistance, with the latter considering the resistance of the fouling layer associated with the filtration mechanism. The value of irreversible resistance (Ri) was not considered in the calculation, as the membranes did not experience irreversible fouling, which was demonstrated after cleaning. This is likely because there was not enough time for it to develop, given that the information was gathered from Fc tests conducted for 120 min. Therefore, the total fouling resistance depends on the resistance of the cake layer.
As a result, the fouling resistance increased with the concentration of PAC, remained constant with GAC, decreased with the GAC-PAC combination, and more prominently decreased with the increased concentration of the GAC-PAC combination. The results indicated that the reduction in total resistance was mainly due to the decrease in cake resistance, where the addition of GAC-PAC to the MBR could be responsible for this improvement. Specifically, for the MBRs with the addition of activated carbon in the GAC-PAC combination, a decrease in total resistance between 11.7% and 13.6% was observed.

3.3. Permeate Water Quality

The MBRs operating without the addition of activated carbon already exhibit high removal rates for various effluent quality parameters, such as organic matter, turbidity, total nitrogen, and phosphorus, as shown in Table 2. However, the results demonstrate a slight increase in the removal of each measured parameter. In concentrated sludge, organic matter and total nitrogen removal approaches 100%, while the MBRs with undiluted sludge show slightly lower removal rates. This is more clearly observed for total phosphorus, where the percentage is farther from 100% compared to the other parameters. Adding activated carbon in various combinations improves total phosphorus removal, achieving 99% removal with the addition of GAC-PAC. Turbidity removal was almost complete in all scenarios.
Using the step method, the critical flux determination results show that fouling mitigation improved with the suspension of GAC particles, and this effect was more pronounced with the GAC-PAC combination. Additionally, the combination increased the critical flux or, in other words, reduced the TMP more effectively than using only GAC or no activated carbon particles. The fouling rate was higher in the control MBR and the MBRs with PAC. For the control MBR, this is likely due to pore blockage caused by biomass compounds or particles, and for the PAC, as mentioned by Shao et al. [46] and Jiang et al. [42], PAC can deposit on the surface, increasing the fouling rate or TMP. Shao et al. [38] also observed that PAC deposition could become very difficult or impossible to remove.
Shao et al. [46] further noted that PAC and deposited organic matter have synergistic effects on fouling when they form the cake layer together, adhering more to the surface. Their experiments on MBRs containing humic acid and bovine serum albumin demonstrated this. Another factor to consider is the particle size of PAC. Larger PAC particles are more easily removed by physical cleaning because stronger shear forces are generally applied to larger particles during cleaning, making it more difficult for organic matter to play a role during deposition on these particles.
There are membrane-cleaning approaches indicating that the addition of abrasive particles can interfere with the formation or removal of the cake layer, improving membrane filtration due to mechanical abrasion and shear-induced diffusion forces throughout the membranes [35,47]. Therefore, the reduced fouling rate with the GAC-PAC combination can be attributed to the physical abrasion effect on the membrane surface caused by fluidized GAC particles, affecting biomass and PAC deposition on the membrane surface. This was proposed by Yu et al. [25] for GAC-PAC coupled with an ultrafiltration system, where PAC improves the effluent quality while fluidized GAC mitigates fouling from filtration and PAC deposition.
Thus, activated carbon not only provides the capacity for removing the required organic compounds but also acts to clean the membrane, helping to reduce fouling. Consequently, the Fc should be increased through the combined scrubbing effect of GAC and activated carbon adsorption.

4. Conclusions

This study demonstrates that combining GAC and PAC significantly mitigates membrane fouling in membrane bioreactors, reducing the total filtration resistance, particularly the cake layer resistance, by 11.7% to 13.6%. This combination also enhanced the permeate quality, achieving the near-complete removal of organic matter, total nitrogen, and turbidity, with total phosphorus removal reaching 99%. Additionally, the GAC-PAC combination showed higher operational efficiency, increased the Fc, reduced the transmembrane pressure, and decreased the fouling rate by 15% to 24% at Fc steps, demonstrating substantial improvements in fouling mitigation and operational efficiency. These results highlight the beneficial impact of GAC-PAC in maintaining a lower TMP, higher flux stability, and improved overall MBR performance. These findings suggest that the GAC-PAC combination is a promising strategy, not only improving the filtration efficiency and effluent quality but also potentially reducing operational costs by minimizing the membrane-cleaning frequency and extending subcritical operation periods, which means less frequent membrane replacements.

Author Contributions

Conceptualization, Investigation, Methodology, and Writing—Original Draft, N.M.; Conceptualization, Investigation, Methodology, Validation, and Writing—Review and Editing, C.M.-A.; Funding Acquisition, Validation, and Writing—Review and Editing, P.G.; Investigation, Validation, and Writing—Review and Editing, R.P.; Conceptualization, Funding Acquisition, Supervision, Validation, and Writing—Review and Editing, J.C.-O. All authors have read and agreed to the published version of the manuscript.

Funding

This research was sponsored by Agencia Nacional de Investigación y Desarrollo de Chile (ANID) grants: Concurso de Fomento a la Vinculación Internacional para Instituciones de Investigación Regionales 2021 (FOVI210079), Fondef IDeA 2022 (ID22I10350), and PIA/APOYO AFB230003.

Data Availability Statement

The data presented in this study are available on request from the corresponding author.

Acknowledgments

The authors extend their sincere appreciation to the reviewers for their expertise and thoughtful review of this manuscript.

Conflicts of Interest

The authors declare that they have no known competing financial interests or personal relationships that could have appeared to influence the work reported in this paper.

References

  1. Zhao, Y.; Qiu, Y.; Mamrol, N.; Ren, L.; Li, X.; Shao, J.; Yang, X.; van der Bruggen, B. Membrane bioreactors for hospital wastewater treatment: Recent advancements in membranes and processes. Front. Chem. Sci. Eng. 2022, 16, 634–660. [Google Scholar] [CrossRef]
  2. Qrenawi, L.I.; Rabah, F.K. Membrane Bioreactor (MBR) as a Reliable Technology for Wastewater Treatment. J. Membr. Sci. Res. 2023, 9, 548826. [Google Scholar] [CrossRef]
  3. Rahman, T.U.; Roy, H.; Islam, R.; Tahmid, M.; Fariha, A.; Mazumder, A.; Tasnim, N.; Pervez, N.; Cai, Y.; Naddeo, V.; et al. The advancement in membrane bioreactor (MBR) technology toward sustainable industrial wastewater management. Membranes 2023, 13, 181. [Google Scholar] [CrossRef]
  4. Judd, S. The status of industrial and municipal effluent treatment with membrane bioreactor technology. Chem. Eng. J. 2016, 305, 37–45. [Google Scholar] [CrossRef]
  5. Torre, A.; Vázquez-Rowe, I.; Parodi, E.; Kahhat, R. A multi-criteria decision framework for circular wastewater systems in emerging megacities of the Global South. Sci. Total. Environ. 2024, 912, 169085. [Google Scholar] [CrossRef] [PubMed]
  6. Judd, S. The MBR Book: Principles and Applications of Membrane Bioreactors for Water and Wastewater Treatment; Butterworth-Heinemann: Oxford, UK, 2010. [Google Scholar]
  7. Iorhemen, O.T.; Hamza, R.A.; Tay, J.H. Membrane fouling control in membrane bioreactors (MBRs) using granular materials. Bioresour. Technol. 2017, 240, 9–24. [Google Scholar] [CrossRef]
  8. Oghyanous, F.A.; Etemadi, H.; Yegani, R.; Ghofrani, B. Membrane fouling and removal performance of submerged aerobic membrane bioreactors: A comparative study of optimizing operational conditions and membrane modification. J. Chem. Technol. Biotechnol. 2022, 97, 1190–1199. [Google Scholar] [CrossRef]
  9. Wang, Z.; Zeng, J.; Shi, Y.; Ling, G. MBR membrane fouling diagnosis based on improved residual neural network. J. Environ. Chem. Eng. 2023, 11, 109742. [Google Scholar] [CrossRef]
  10. Zamora, R.; McEvoy, J.; Colbert, C.; Olivares, J.C.; Kaewlom, P.; Khan, E. Blocking bacterial appendage attachment to wastewater treatment membranes using anti-adhesins. Chemosphere 2023, 323, 138246. [Google Scholar] [CrossRef]
  11. Nguyen, P.-T.; Tran, D.P.H.; Le, L.-T.; Lin, C.; Oanh, L.T.K.; Tra, V.-T.; Bui, X.-T. Characterization of reciprocation membrane bioreactor on treatment performance, energy consumption and membrane fouling. Bioresour. Technol. 2023, 381, 129146. [Google Scholar] [CrossRef] [PubMed]
  12. Liu, Q.; Ren, J.; Lu, Y.; Zhang, X.; Roddick, F.A.; Fan, L.; Wang, Y.; Yu, H.; Yao, P. A review of the current in-situ fouling control strategies in MBR: Biological versus physicochemical. J. Ind. Eng. Chem. 2021, 98, 42–59. [Google Scholar] [CrossRef]
  13. Wang, S.; Chew, J.W.; Liu, Y. An environmentally sustainable approach for online chemical cleaning of MBR with activated peroxymonosulfate. J. Membr. Sci. 2020, 600, 117872. [Google Scholar] [CrossRef]
  14. Bertino, A.; Falasconi, M.B.; Mazzeo, L.; Piemonte, V. Membranes for the Water Biotreatment, in Current Trends and Future Developments on (Bio-) Membranes; Elsevier: Amsterdam, The Netherlands, 2024; pp. 549–604. [Google Scholar] [CrossRef]
  15. Wang, Z.; Ma, J.; Tang, C.Y.; Kimura, K.; Wang, Q.; Han, X. Membrane cleaning in membrane bioreactors: A review. J. Membr. Sci. 2014, 468, 276–307. [Google Scholar] [CrossRef]
  16. Asif, M.B.; Ren, B.; Li, C.; He, K.; Zhang, X.; Zhang, Z. Understanding the role of in-situ ozonation in Fe(II)-dosed membrane bioreactor (MBR) for membrane fouling mitigation. J. Membr. Sci. 2021, 633, 119400. [Google Scholar] [CrossRef]
  17. Maddela, N.R.; Abiodun, A.S.; Zhang, S.; Prasad, R. Biofouling in membrane bioreactors—Mitigation and current status: A review. Appl. Biochem. Biotechnol. 2023, 195, 5643–5668. [Google Scholar] [CrossRef]
  18. Behboudi, A.; Mohammadi, T.; Ulbricht, M. High performance antibiofouling hollow fiber polyethersulfone nanocomposite membranes incorporated with novel surface-modified silver nanoparticles suitable for membrane bioreactor application. J. Ind. Eng. Chem. 2023, 119, 298–314. [Google Scholar] [CrossRef]
  19. Chen, Y.; Sheng, Q.; Wei, J.; Wen, Q.; Ma, D.; Li, J.; Xie, Y.; Shen, J.; Sun, X. Novel strategy for membrane biofouling control in MBR with nano-MnO2 modified PVDF membrane by in-situ ozonation. Sci. Total. Environ. 2022, 808, 151996. [Google Scholar] [CrossRef]
  20. Frontistis, Z.; Sarmpanis, A.; Lykogiannis, G. Utilizing ultrasonic vibrations to mitigate membrane fouling in domestic wastewater membrane bioreactors: A mini review. J. Chem. Technol. Biotechnol. 2023, 98, 2798–2805. [Google Scholar] [CrossRef]
  21. Syafiuddin, A.; Boopathy, R.; Mehmood, M.A. Recent advances on bacterial quorum quenching as an effective strategy to control biofouling in membrane bioreactors. Bioresour. Technol. Rep. 2021, 15, 100745. [Google Scholar] [CrossRef]
  22. Zhang, R.; Hao, L.; Cheng, K.; Xin, B.; Sun, J.; Guo, J. Research progress of electrically-enhanced membrane bioreactor (EMBR) in pollutants removal and membrane fouling alleviation. Chemosphere 2023, 331, 138791. [Google Scholar] [CrossRef]
  23. Wang, S.; Zhang, Y.; Han, Y.; Hou, Y.; Fan, Y.; Hou, X. Design of Porous Membranes by Liquid Gating Technology. Accounts Mater. Res. 2021, 2, 407–419. [Google Scholar] [CrossRef]
  24. Xu, L.; Wei, C.; Siddique, M.S.; Yu, W. Insight into the effect of in-situ galvanic micro-coagulation on membrane fouling mitigation treating surface water. J. Membr. Sci. 2020, 610, 118234. [Google Scholar] [CrossRef]
  25. Esteki, S.; Karsaz, M.; Ghofrani, B.; Yegani, R.; Majidi, S. Combination of membrane bioreactor with chemical coagulation for the treatment of real pharmaceutical wastewater: Comparison of simultaneous and consecutive pre-treatment of coagulation on MBR performance. J. Water Process. Eng. 2024, 60, 105108. [Google Scholar] [CrossRef]
  26. Yang, Y.; Guo, W.; Ngo, H.H.; Zhang, X.; Liang, S.; Deng, L.; Cheng, D.; Zhang, H. Bioflocculants in anaerobic membrane bioreactors: A review on membrane fouling mitigation strategies. Chem. Eng. J. 2024, 486, 150260. [Google Scholar] [CrossRef]
  27. Yang, Y.; Guo, W.; Ngo, H.H.; Zhang, X.; Ye, Y.; Peng, L.; Wei, C.; Zhang, H. Mini critical review: Membrane fouling control in membrane bioreactors by microalgae. Bioresour. Technol. 2024, 406, 131022. [Google Scholar] [CrossRef] [PubMed]
  28. Gkotsis, P.; Zouboulis, A.; Mitrakas, M. Using additives for fouling control in a lab-scale MBR; comparing the anti-fouling potential of coagulants, PAC and bio-film carriers. Membranes 2020, 10, 42. [Google Scholar] [CrossRef] [PubMed]
  29. Asif, M.B.; Ren, B.; Li, C.; Maqbool, T.; Zhang, X.; Zhang, Z. Evaluating the impacts of a high concentration of powdered activated carbon in a ceramic membrane bioreactor: Mixed liquor properties, hydraulic performance and fouling mechanism. J. Membr. Sci. 2020, 616, 118561. [Google Scholar] [CrossRef]
  30. Zhang, Y.; Wang, X.; Ye, H.; Zhou, L.; Zhao, Z. Effect and mechanism of reduced membrane bioreactor fouling by powdered activated carbon. Water Sci. Technol. 2021, 83, 1005–1016. [Google Scholar] [CrossRef]
  31. Gkotsis, P.K.; Banti, D.C.; Peleka, E.N.; Zouboulis, A.I.; Samaras, P.E. Fouling issues in membrane bioreactors (MBRs) for wastewater treatment: Major mechanisms, prevention and control strategies. Processes 2014, 2, 795–866. [Google Scholar] [CrossRef]
  32. Yu, S.; Wang, J.; Zhao, Z.; Cai, W. Simultaneous coupling of fluidized granular activated carbon (GAC) and powdered activated carbon (PAC) with ultrafiltration process: A promising synergistic alternative for water treatment. Sep. Purif. Technol. 2022, 282, 120085. [Google Scholar] [CrossRef]
  33. Liu, Y.; Cui, X.; Zhang, X.; Ren, J.; Li, H.; Wang, Z.; Guo, W.; Ngo, H.H. Recent advances and trends of carbon-based biocarriers for performance enhancement of anaerobic membrane bioreactor system. J. Water Process. Eng. 2024, 59, 104949. [Google Scholar] [CrossRef]
  34. Johir, M.; Shanmuganathan, S.; Vigneswaran, S.; Kandasamy, J. Performance of submerged membrane bioreactor (SMBR) with and without the addition of the different particle sizes of GAC as suspended medium. Bioresour. Technol. 2013, 141, 13–18. [Google Scholar] [CrossRef]
  35. Wu, B.; Zamani, F.; Lim, W.; Liao, D.; Wang, Y.; Liu, Y.; Chew, J.W.; Fane, A.G. Effect of mechanical scouring by granular activated carbon (GAC) on membrane fouling mitigation. Desalination 2017, 403, 80–87. [Google Scholar] [CrossRef]
  36. Aslam, M.; Kim, J. Investigating membrane fouling associated with GAC fluidization on membrane with effluent from anaerobic fluidized bed bioreactor in domestic wastewater treatment. Environ. Sci. Pollut. Res. 2019, 26, 1170–1180. [Google Scholar] [CrossRef]
  37. Sohn, W.; Guo, W.; Ngo, H.H.; Deng, L.; Cheng, D.; Zhang, X. A review on membrane fouling control in anaerobic membrane bioreactors by adding performance enhancers. J. Water Process. Eng. 2021, 40, 101867. [Google Scholar] [CrossRef]
  38. APHA; AWWA; WEF. Standard Methods for the Examination of Water and Wastewater, 22nd ed.; American Public Health Association, American Water Works Association, and Water Environment Federation: Washington, DC, USA, 2012. [Google Scholar]
  39. Le Clech, P.; Jefferson, B.; Chang, I.S.; Judd, S.J. Critical flux determination by the flux-step method in a submerged membrane bioreactor. J. Membr. Sci. 2003, 227, 81–93. [Google Scholar] [CrossRef]
  40. Yang, W.; Paetkau, M.; Cicek, N. Improving the performance of membrane bioreactors by powdered activated carbon dosing with cost considerations. Water Sci. Technol. 2010, 62, 172–179. [Google Scholar] [CrossRef]
  41. Choo, K.-H.; Lee, C.-H. Membrane fouling mechanisms in the membrane-coupled anaerobic bioreactor. Water Res. 1996, 30, 1771–1780. [Google Scholar] [CrossRef]
  42. Jiang, Y.; Liu, Y.; Shi, D.; Fu, W.; Sun, P.-F.; Li, J.; Shao, S. Membrane fouling in a powdered activated carbon—membrane bioreactor (PAC-MBR) for micro-polluted water purification: Fouling characteristics and the roles of PAC. J. Clean. Prod. 2020, 277, 122341. [Google Scholar] [CrossRef]
  43. Heo, S.; Nam, K.; Woo, T.; Yoo, C. Digitally-transformed early-warning protocol for membrane cleaning based on a fouling-cumulative sum chart: Application to a full-scale MBR plant. J. Membr. Sci. 2022, 643, 120080. [Google Scholar] [CrossRef]
  44. Du, X.; Shi, Y.; Jegatheesan, V.; Haq, I.U. A Review on the mechanism, impacts and control methods of membrane fouling in MBR system. Membranes 2020, 10, 24. [Google Scholar] [CrossRef] [PubMed]
  45. Nabi, M.; Liang, H.; Zhou, Q.; Cao, J.; Gao, D. In-situ membrane fouling control and performance improvement by adding materials in anaerobic membrane bioreactor: A review. Sci. Total. Environ. 2023, 865, 161262. [Google Scholar] [CrossRef] [PubMed]
  46. Shao, S.; Cai, L.; Li, K.; Li, J.; Du, X.; Li, G.; Liang, H. Deposition of powdered activated carbon (PAC) on ultrafiltration (UF) membrane surface: Influencing factors and mechanisms. J. Membr. Sci. 2017, 530, 104–111. [Google Scholar] [CrossRef]
  47. Huang, X.; Wu, J. Improvement of membrane filterability of the mixed liquor in a membrane bioreactor by ozonation. J. Membr. Sci. 2008, 318, 210–216. [Google Scholar] [CrossRef]
Figure 1. Schematic of the experimental setup.
Water 16 02556 g001
Figure 2. Evolution of TMP during Fc measurement of MBRs with GAC and PAC at various doses and combinations in MBR M1 and MBR M2.
Water 16 02556 g002
Figure 3. The evolution of the fouling rate during Fc measurement for MBR M1 and MBR M2.
Water 16 02556 g003
Figure 4. Permeability for the tests conducted in MBR M1 and MBR M2.
Water 16 02556 g004
Figure 5. Initial increase in TMP (ΔP0) in MBR M1 and MBR M2.
Water 16 02556 g005
Figure 6. Intrinsic membrane resistance, total resistance, and cake layer resistance for MBR M1 and MBR M2.
Water 16 02556 g006
Table 1. MBR experimental configurations.
IDMLSSPACGAC
g/Lmg/Lg/L
M13.4000
M1-GAC 13.4002
M1-PAC 13.401500
M1-GAC-PAC 13.402150
M1-GAC 23.4004
M1-PAC 23.403000
M1-GAC-PAC 23.404300
M21.1500
M2-GAC 11.1502
M2-PAC 11.151500
M2-GAC-PAC 11.152150
M2-GAC 21.1504
M2-PAC 21.153000
M2-GAC-PAC 21.154300
Table 2. Removal efficiency (%) of MBR configurations.
IDRemoval (%)
CODTNTPTurbidity
M198.8599.1391.7299.95
M1-GAC 199.1599.4797.8599.96
M1-PAC 199.2999.4797.5599.98
M1-GAC-PAC 199.3299.7398.7799.98
M1-GAC 299.2999.6798.7799.96
M1-PAC 299.3499.7398.7799.99
M1-GAC-PAC 299.4399.8099.0899.97
M298.3099.1398.7799.96
M2-GAC 198.9598.4799.9799.96
M2-PAC 198.9599.9899.9899.96
M2-GAC-PAC 199.5499.9999.9799.99
M2-GAC 298.9599.9996.2699.96
M2-PAC 299.0899.8899.9799.97
M2-GAC-PAC 299.6799.9999.9799.99
Disclaimer/Publisher’s Note: The statements, opinions and data contained in all publications are solely those of the individual author(s) and contributor(s) and not of MDPI and/or the editor(s). MDPI and/or the editor(s) disclaim responsibility for any injury to people or property resulting from any ideas, methods, instructions or products referred to in the content.

