
A Novel Integrated Approach to Assess Groundwater Appropriateness for Agricultural Uses in the Eastern Coastal Region of India

 ,
,
Abstract
:1. Introduction
2. Materials and Methods
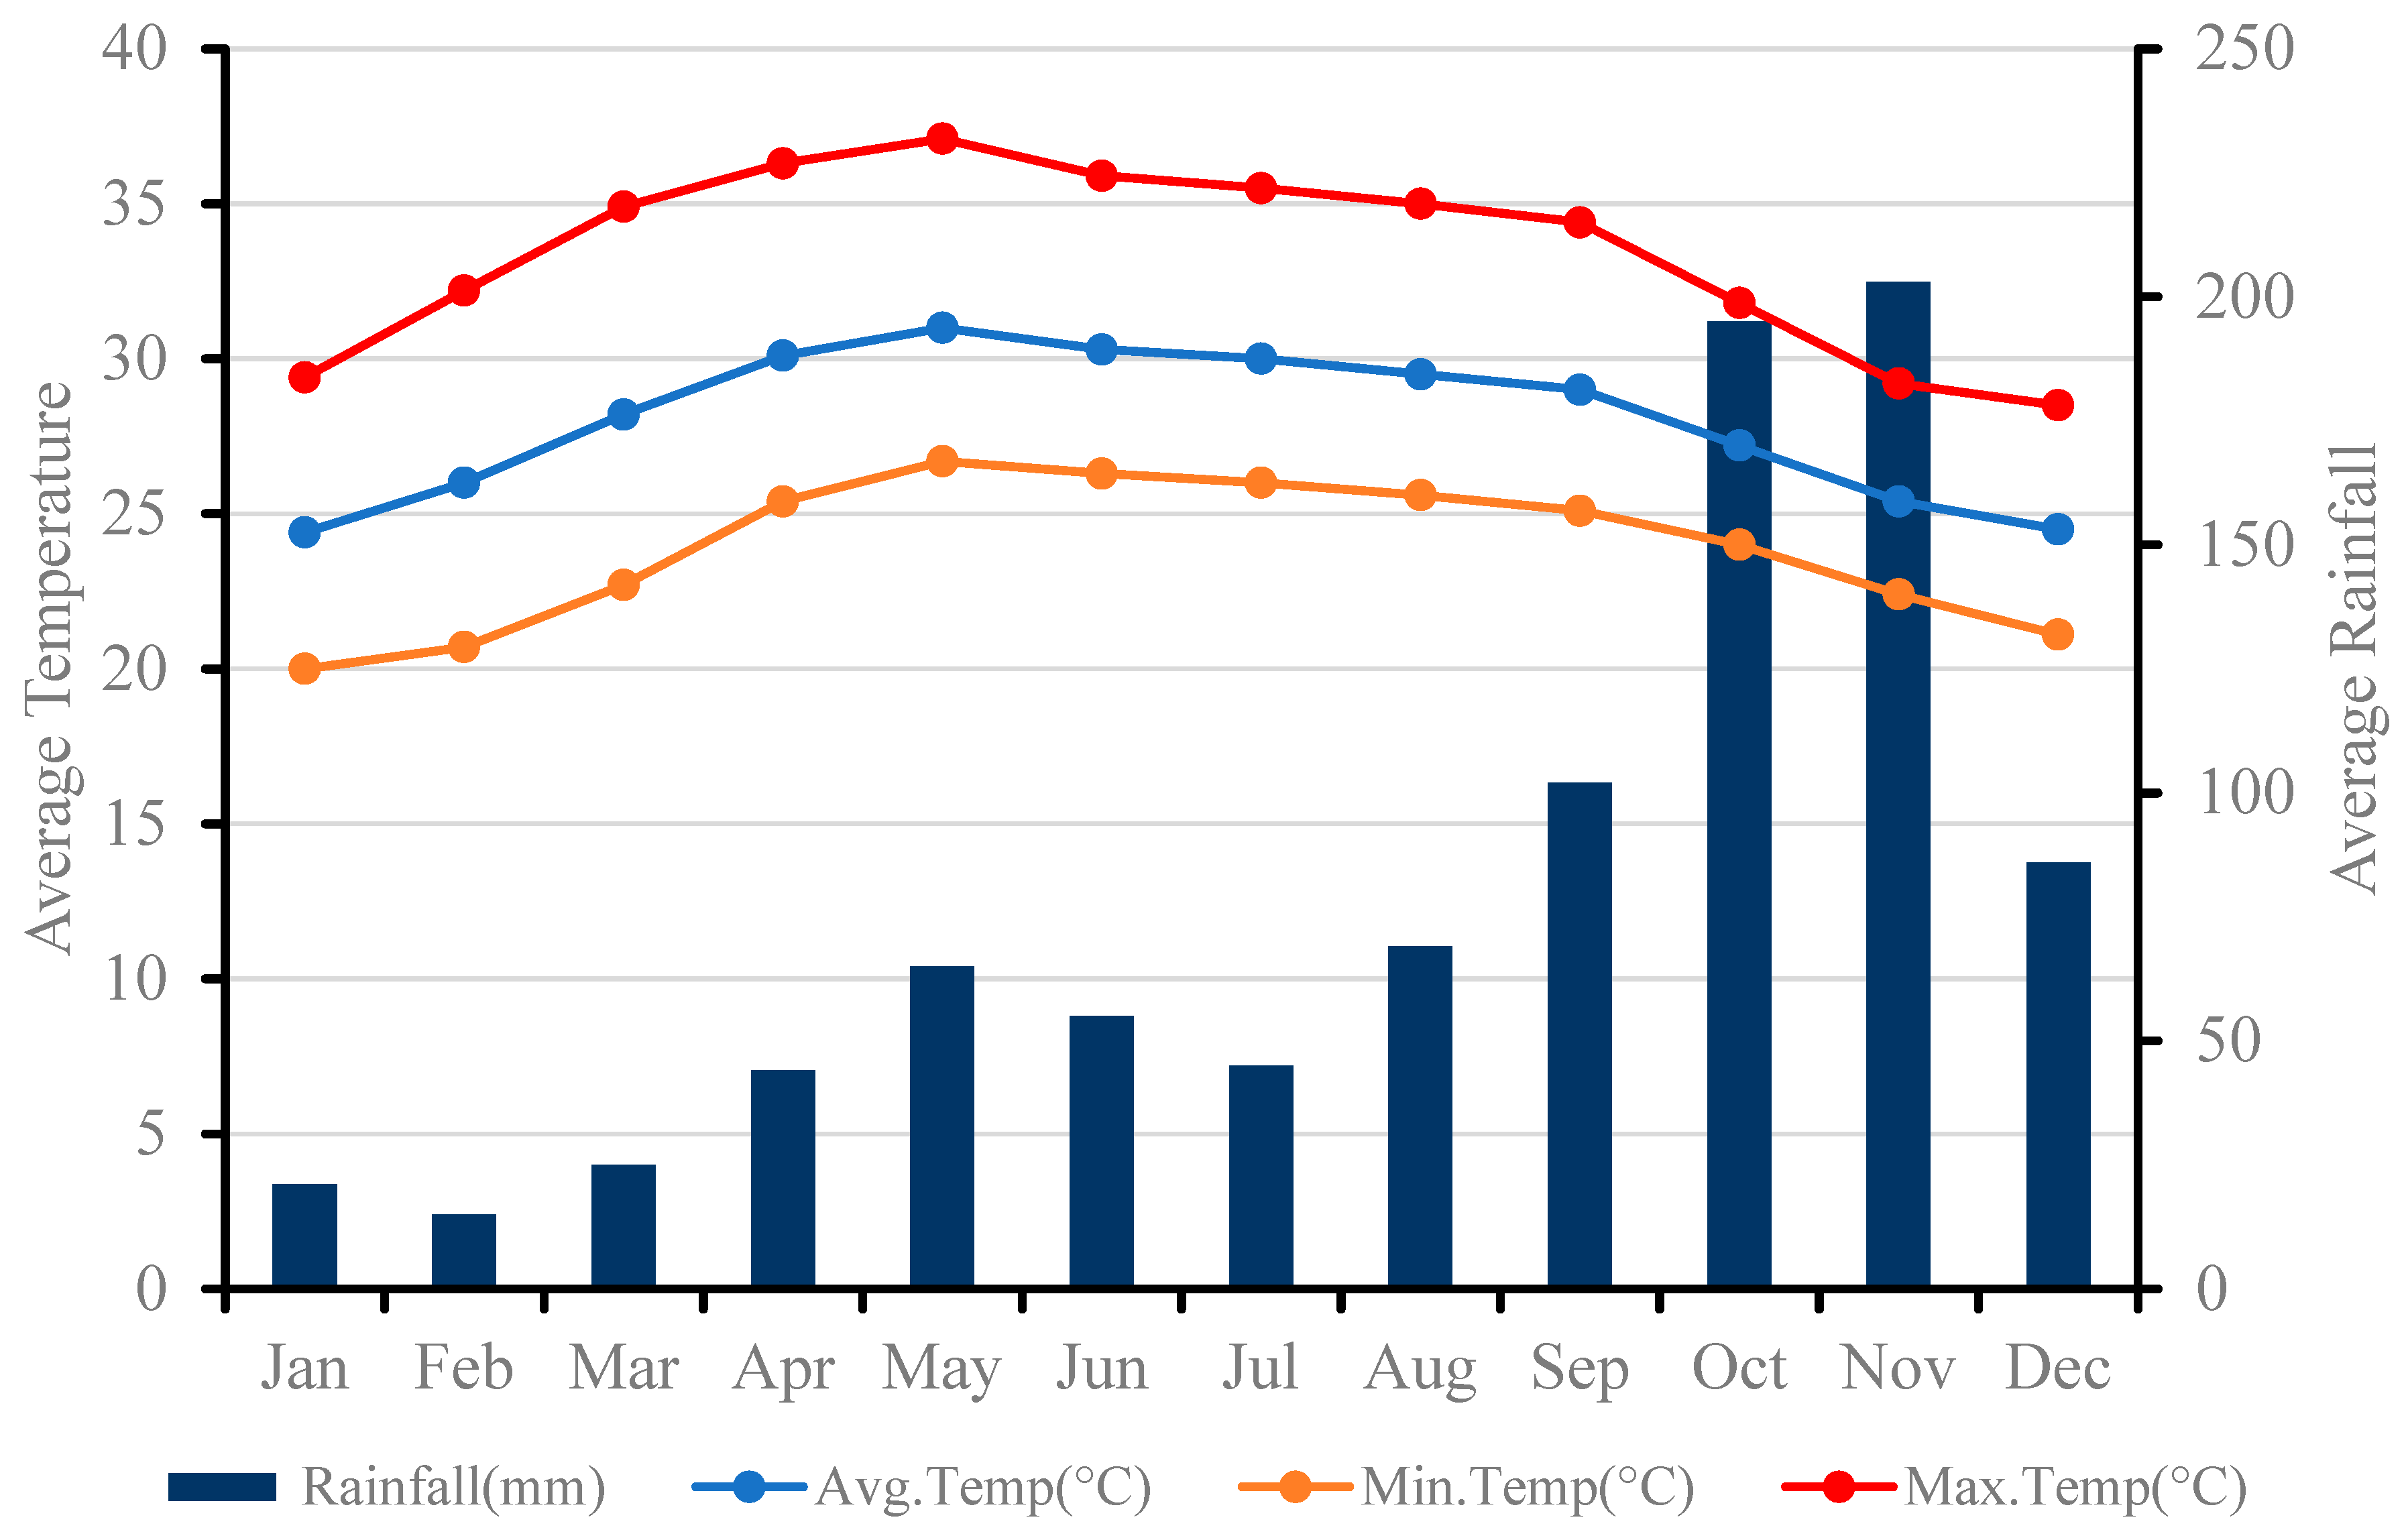
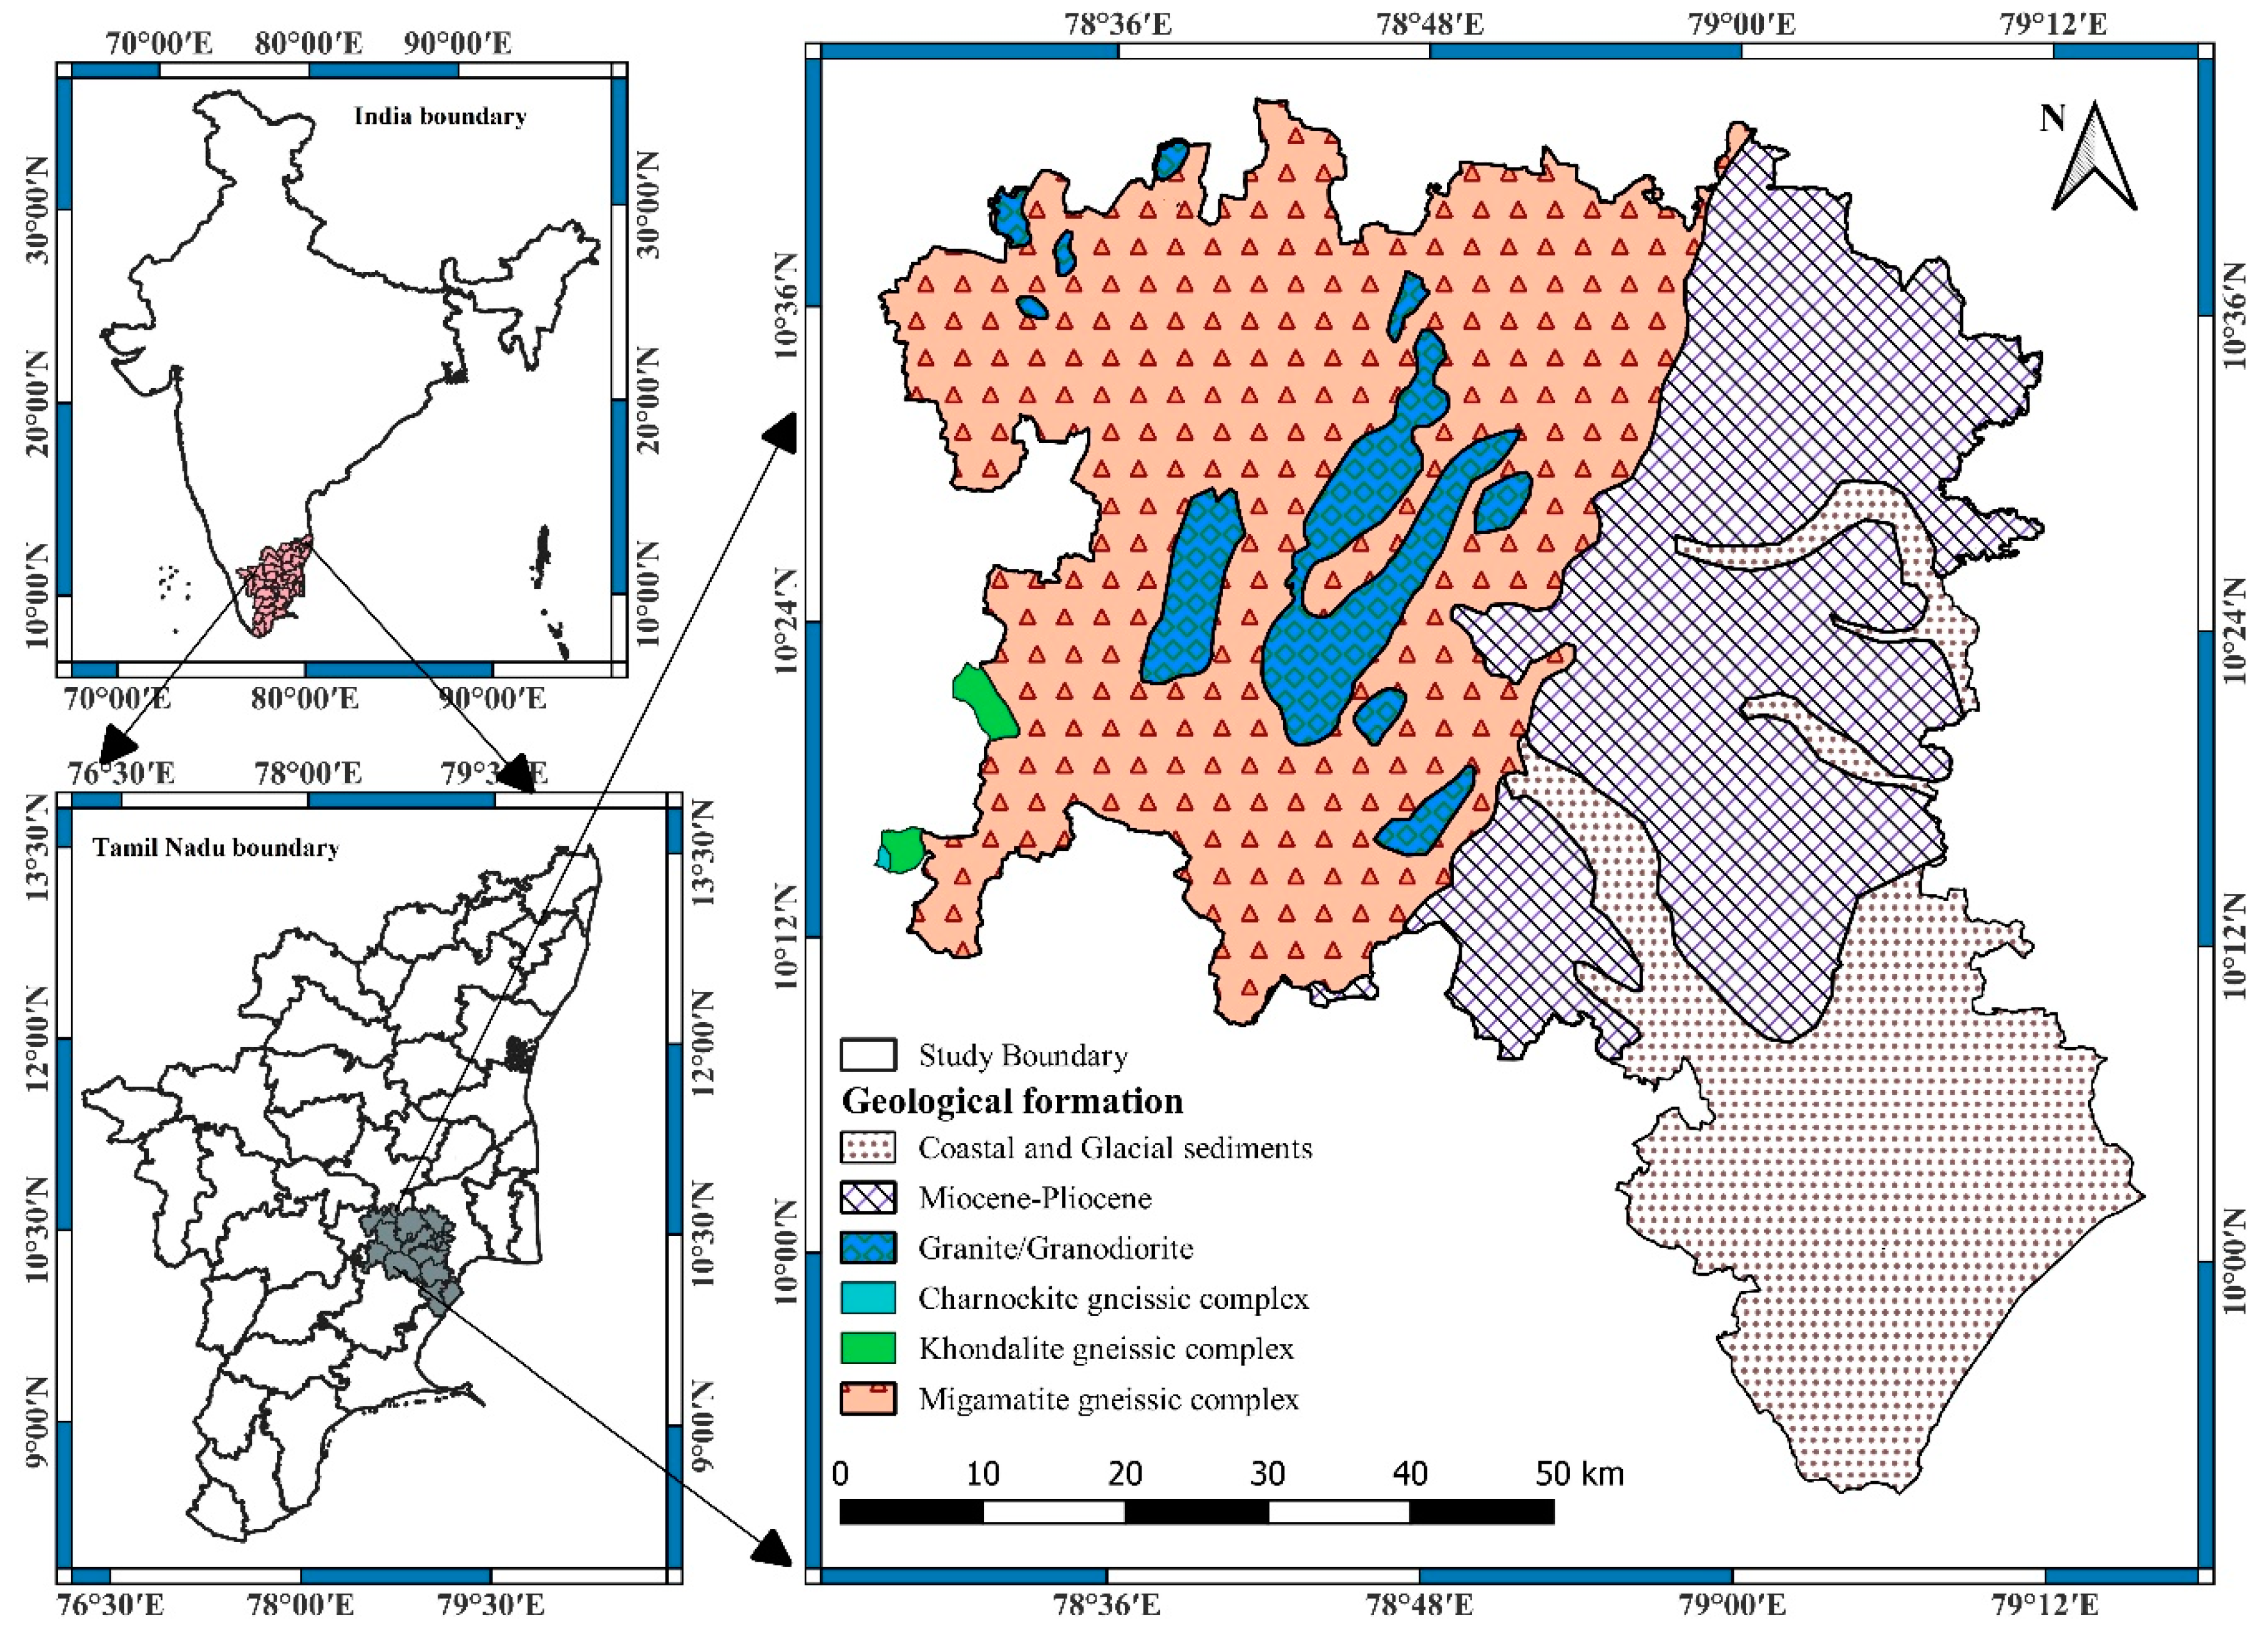
2.1. Study Area
2.2. Geological Composition
2.3. Hydrogeology
2.4. Agricultural Pattern
2.5. Methodology
2.5.1. Sample Collection and Analysis
2.5.2. Agriculture Suitability Index (ASI)
2.5.3. Chlorinity Index (CI)
2.5.4. Mineral Saturation Index (MSI)
2.5.5. Seawater Mixing Index (SMI)
2.5.6. Unsupervised Machine Learning (USML) Techniques
3. Results
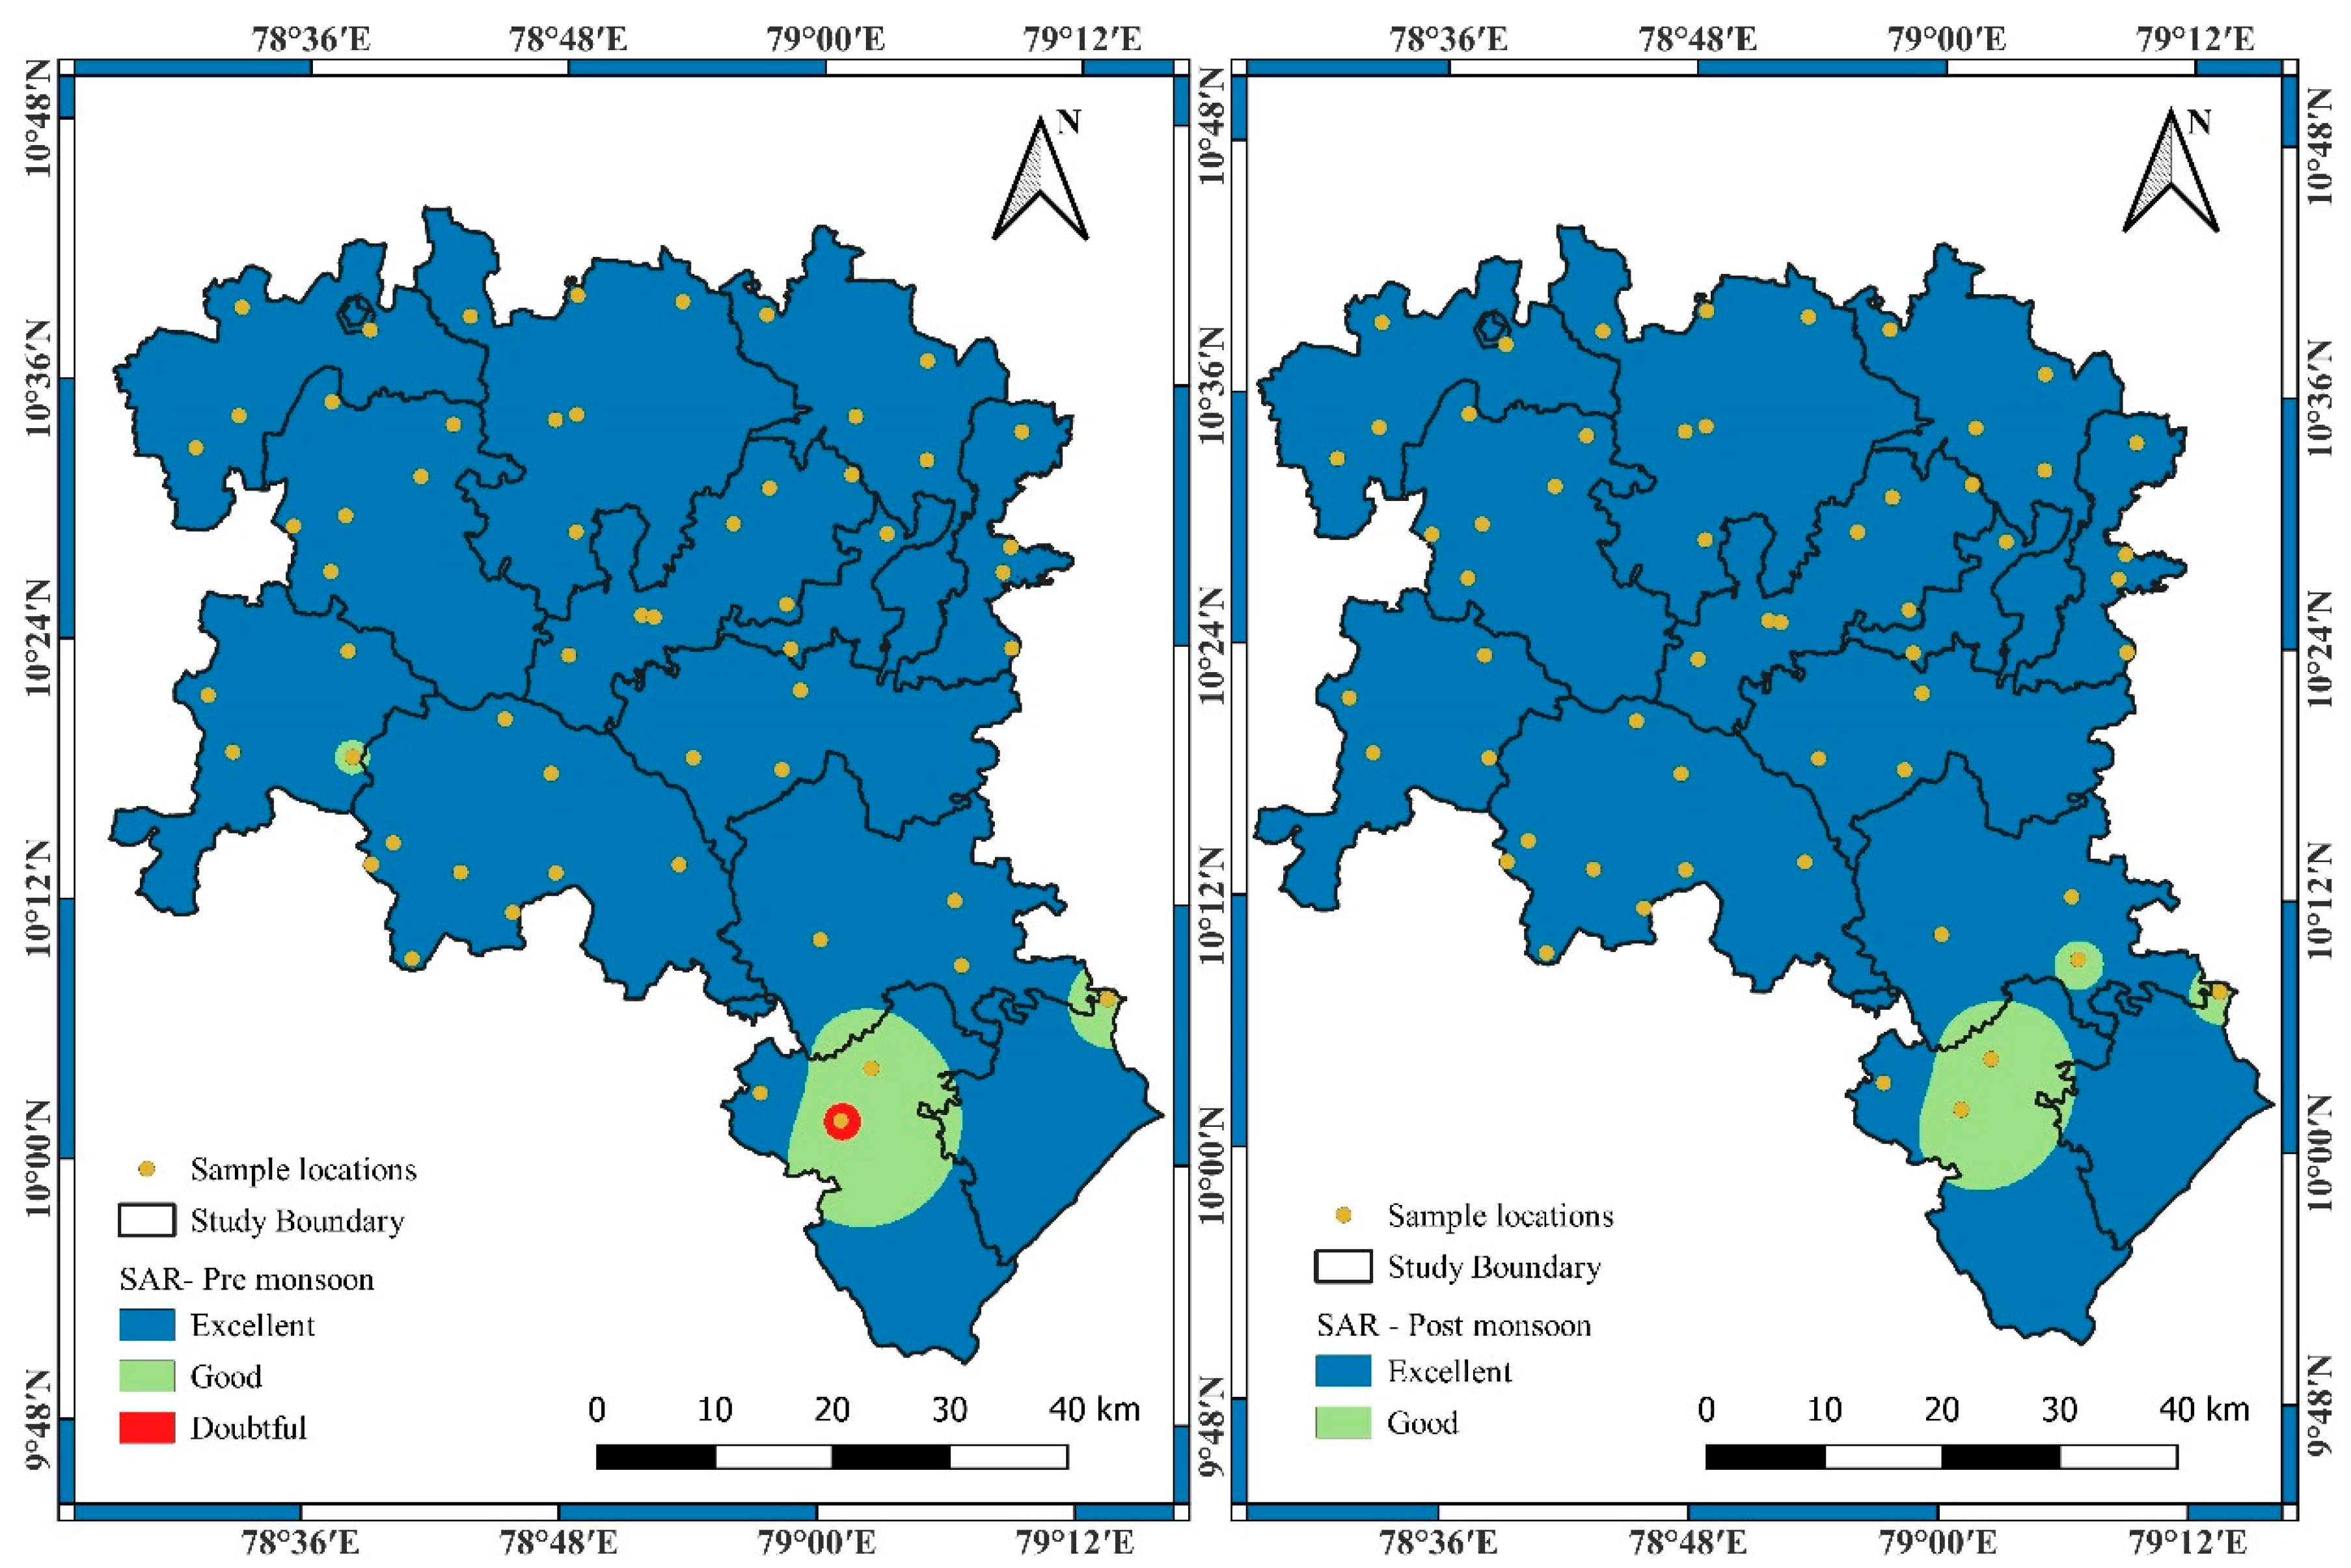
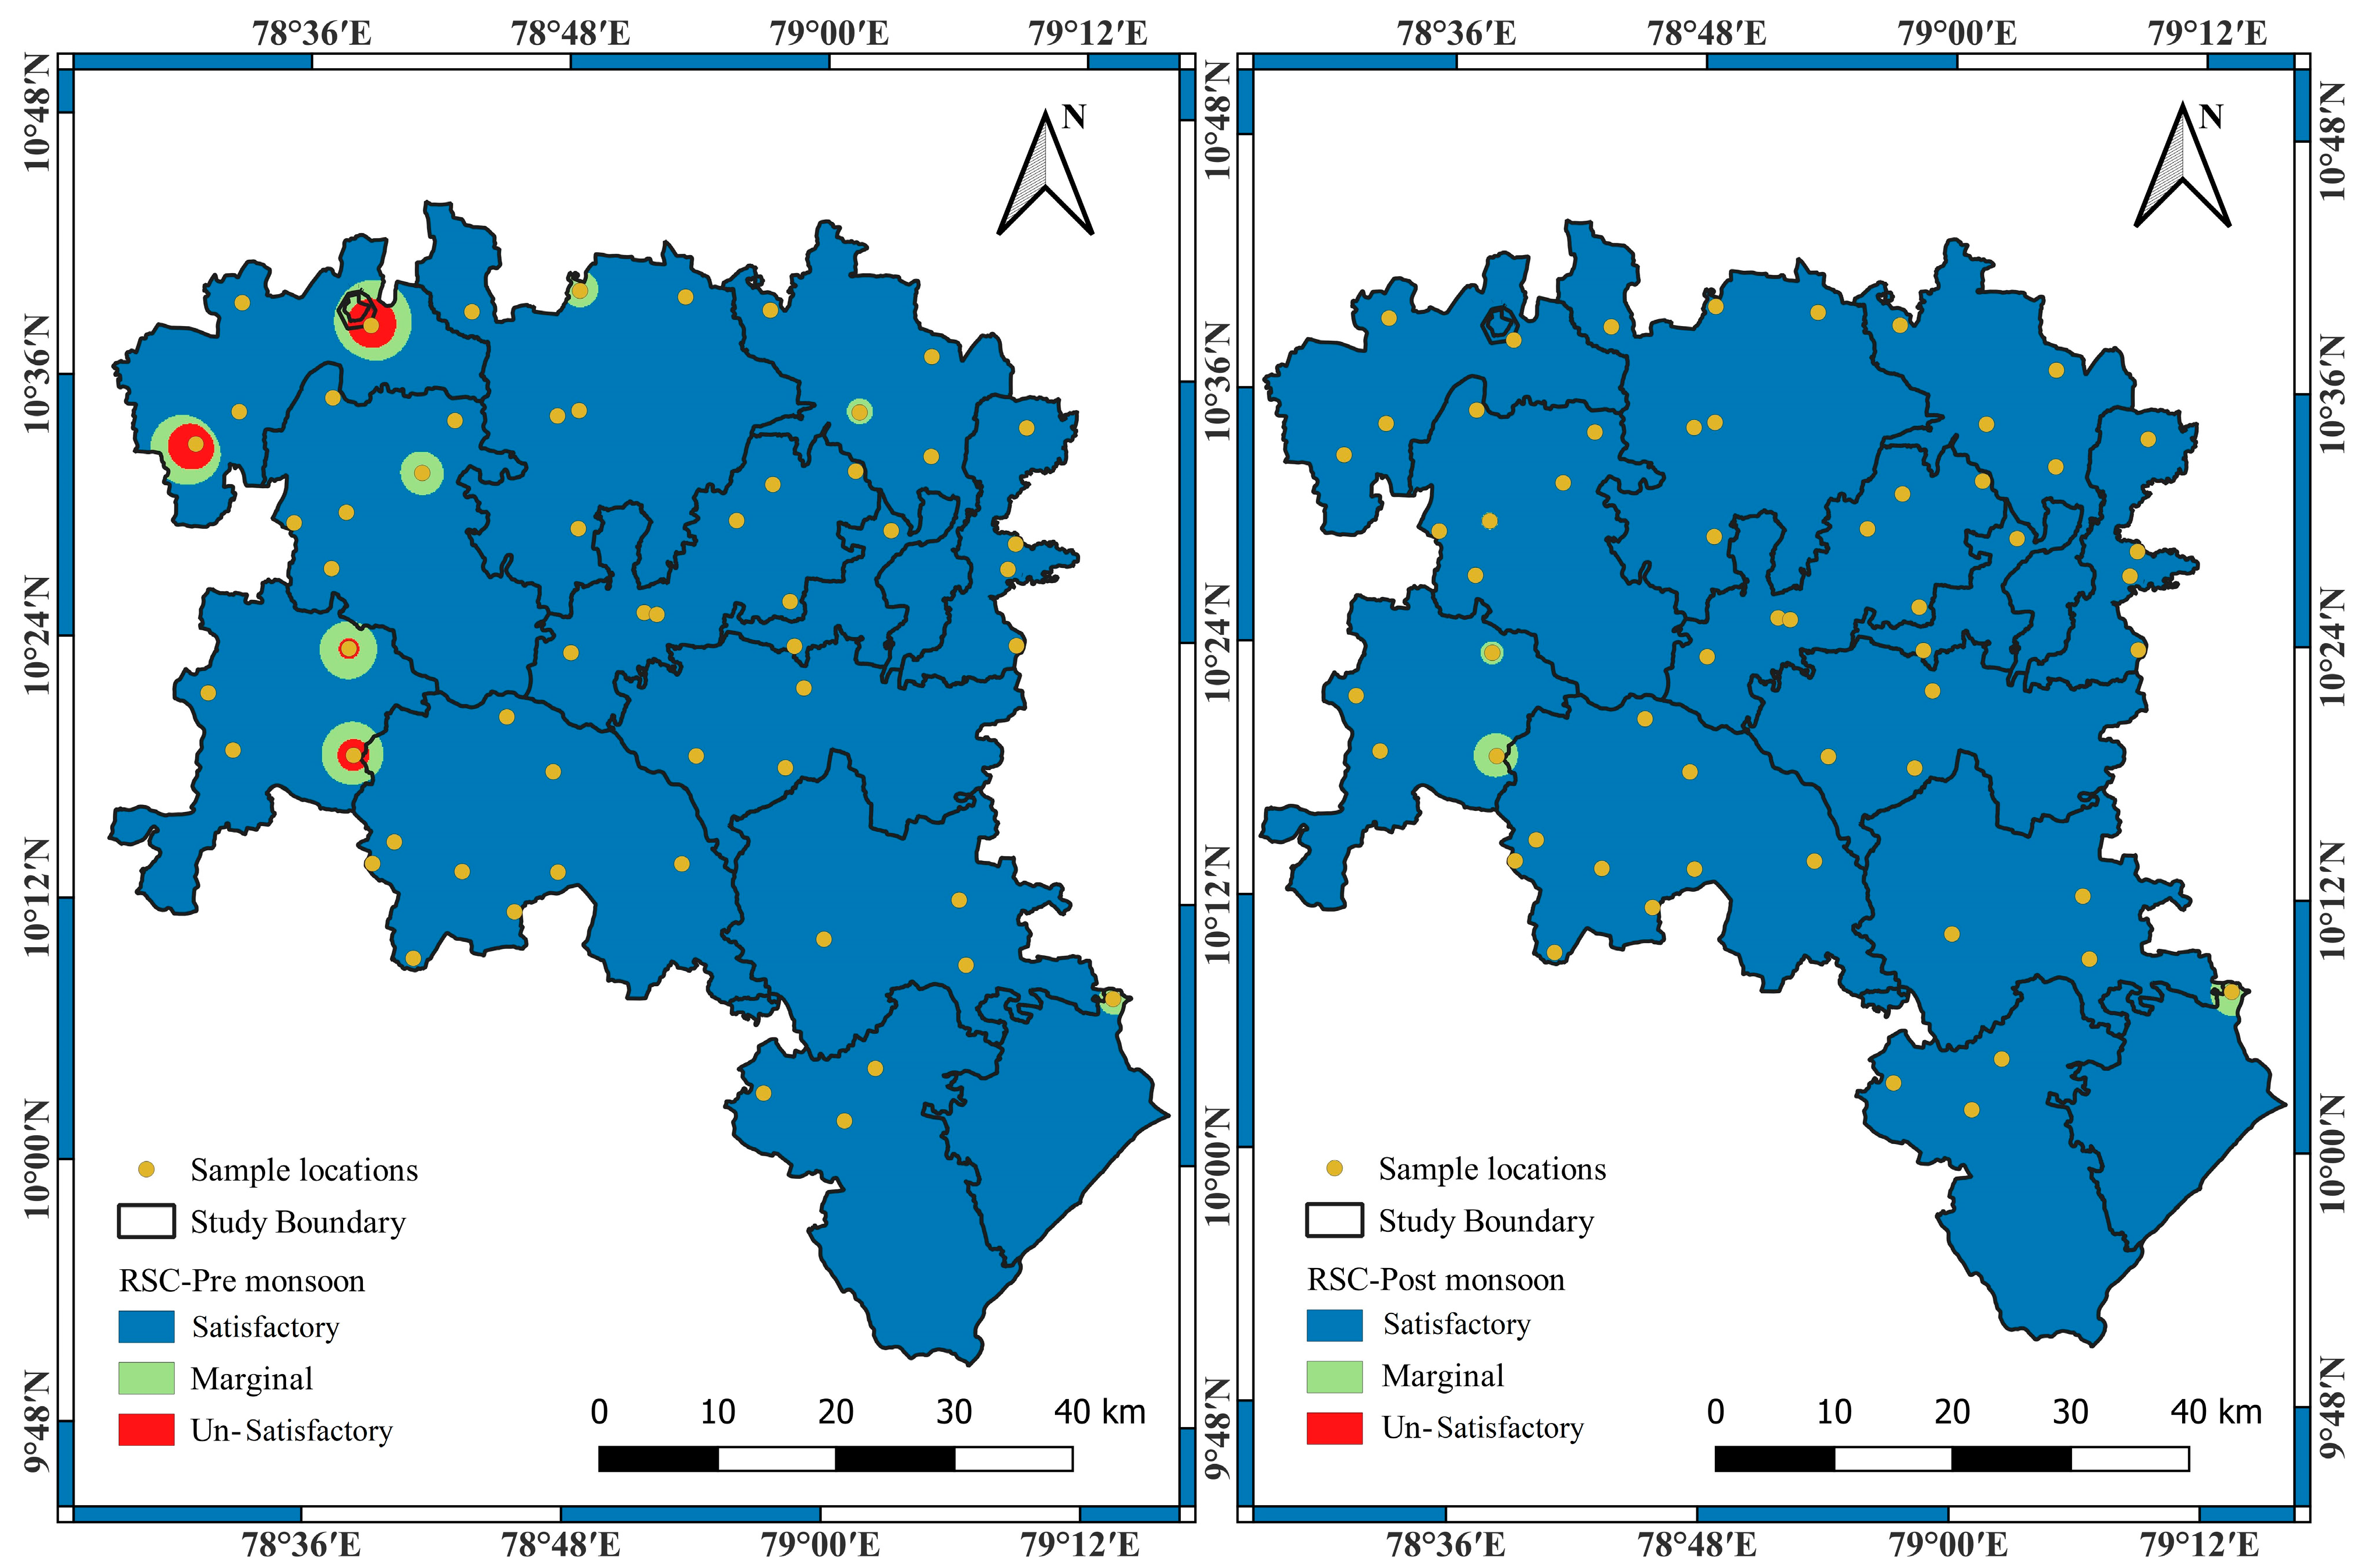
3.1. Suitability of Groundwater Using Various Irrigation Indices
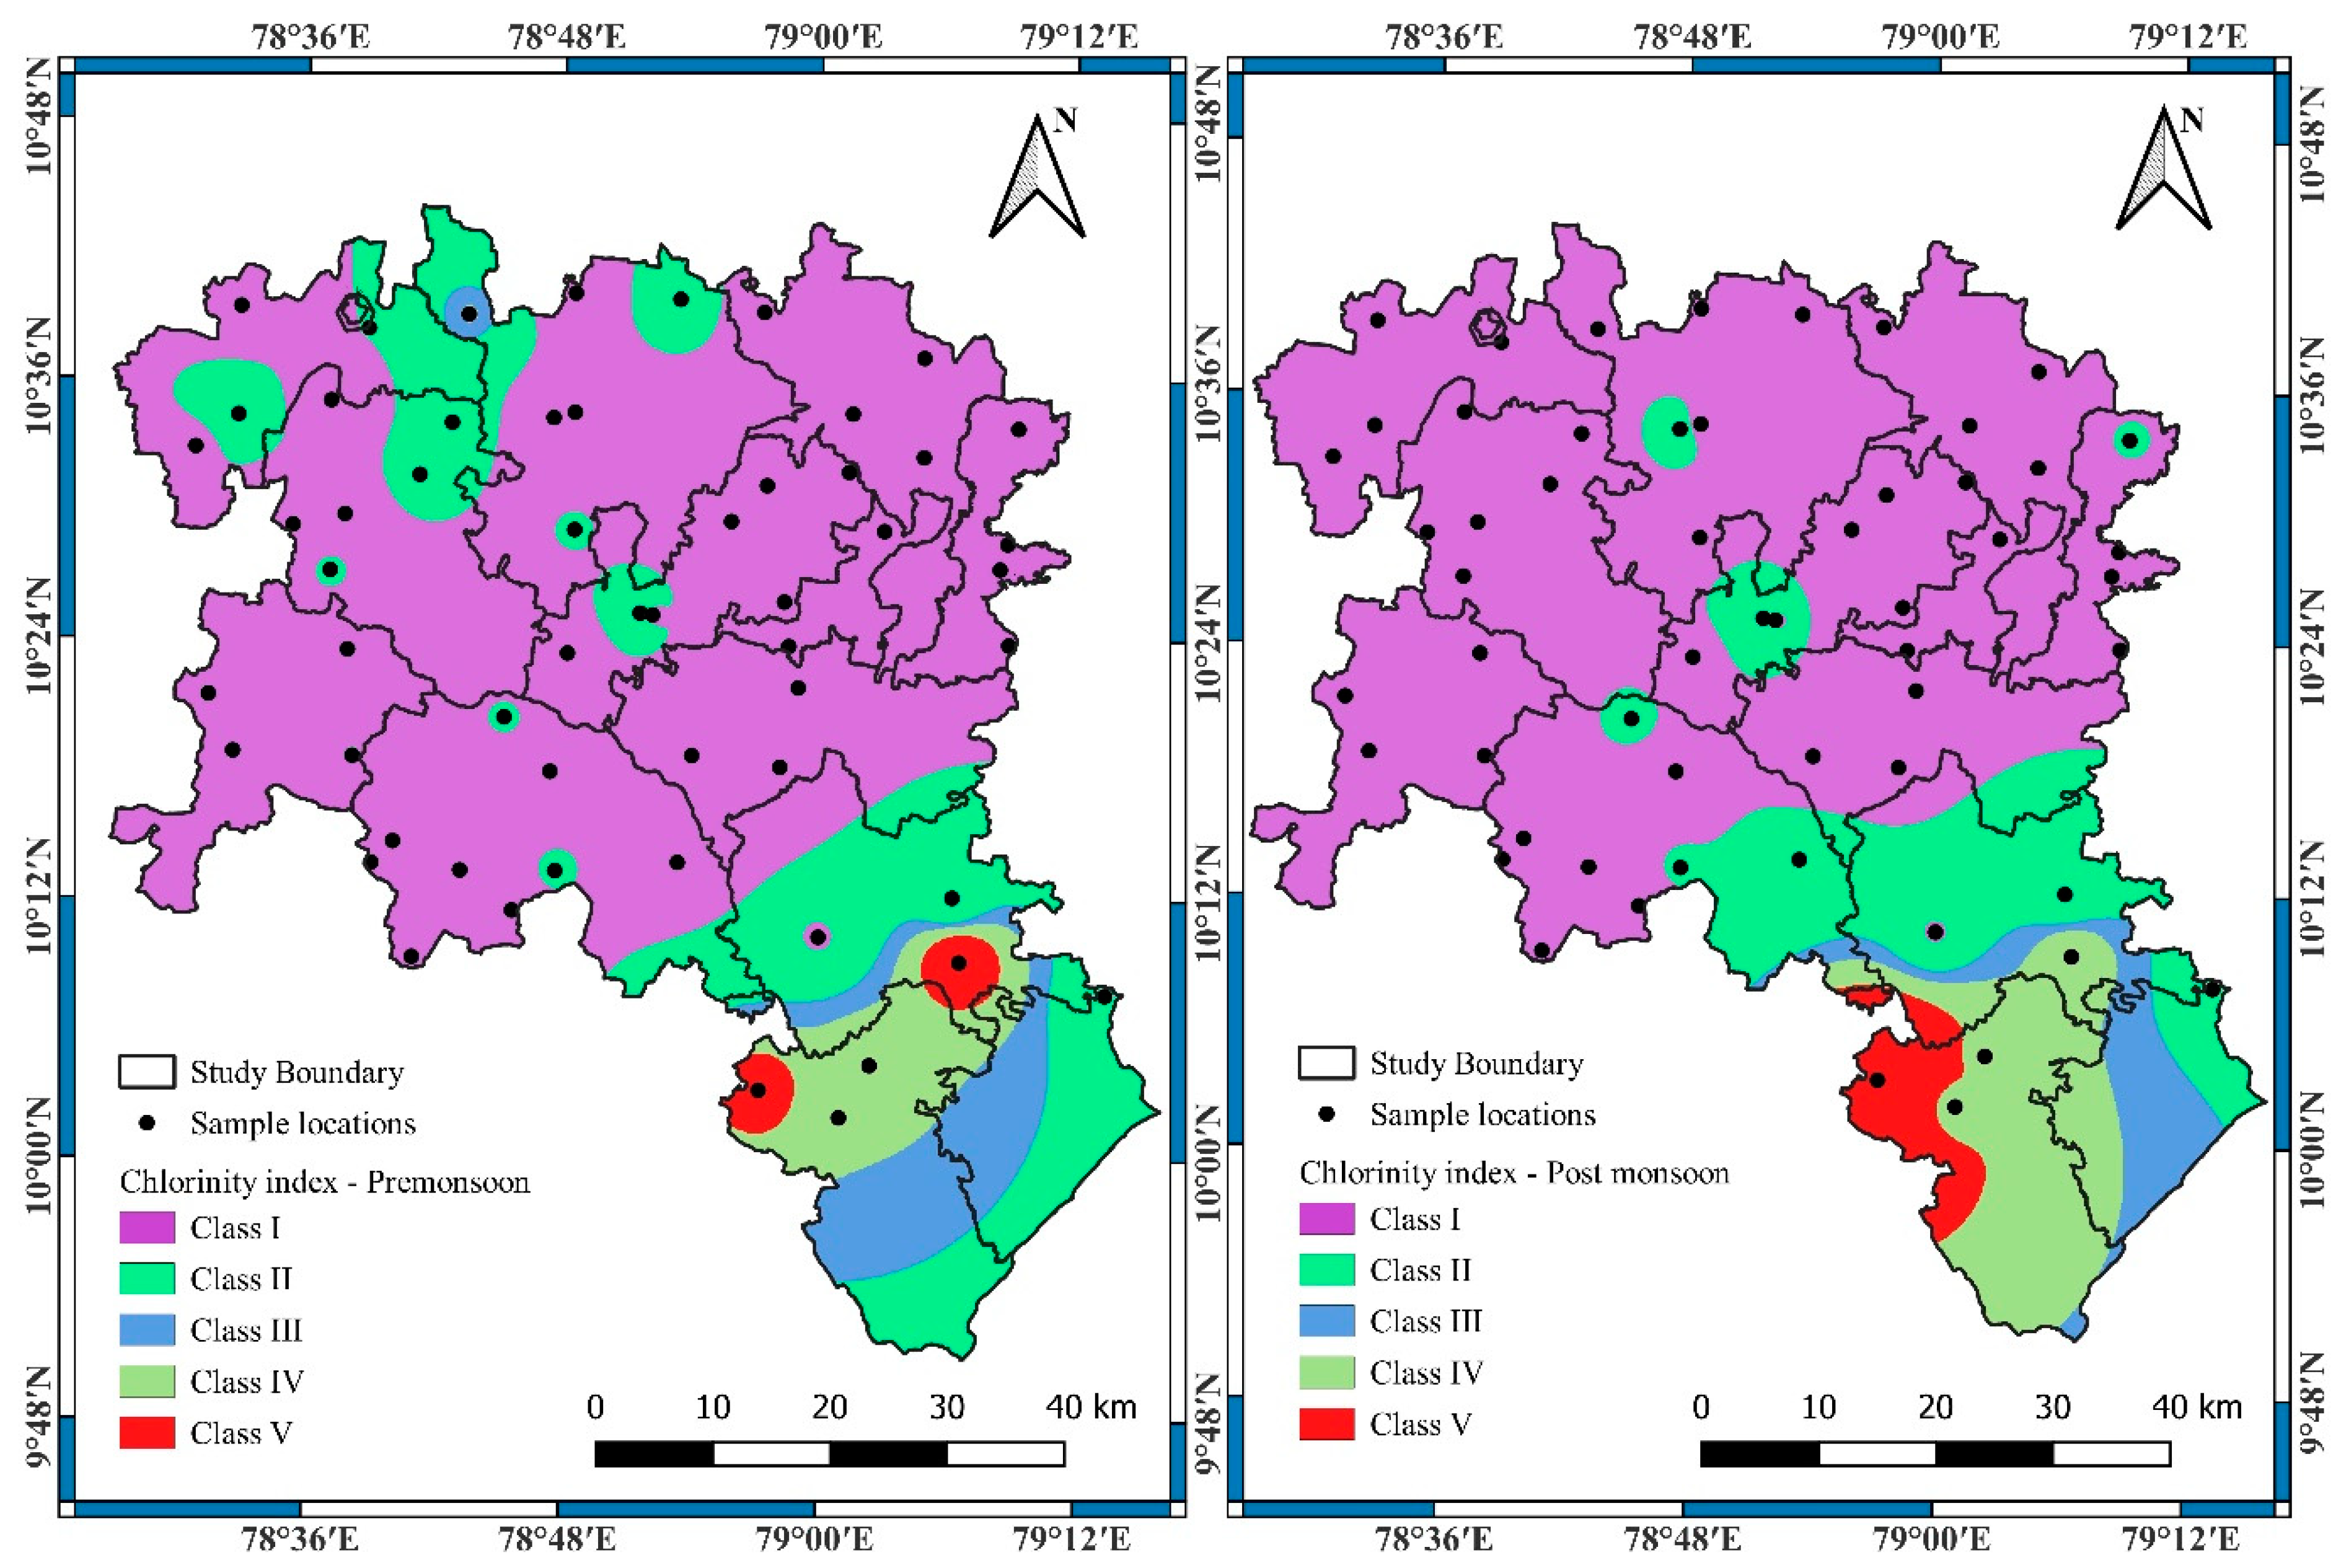
3.2. Effect of Chloride on Groundwater Based on the CI
3.3. Chemical Equilibrium Based on the MSI
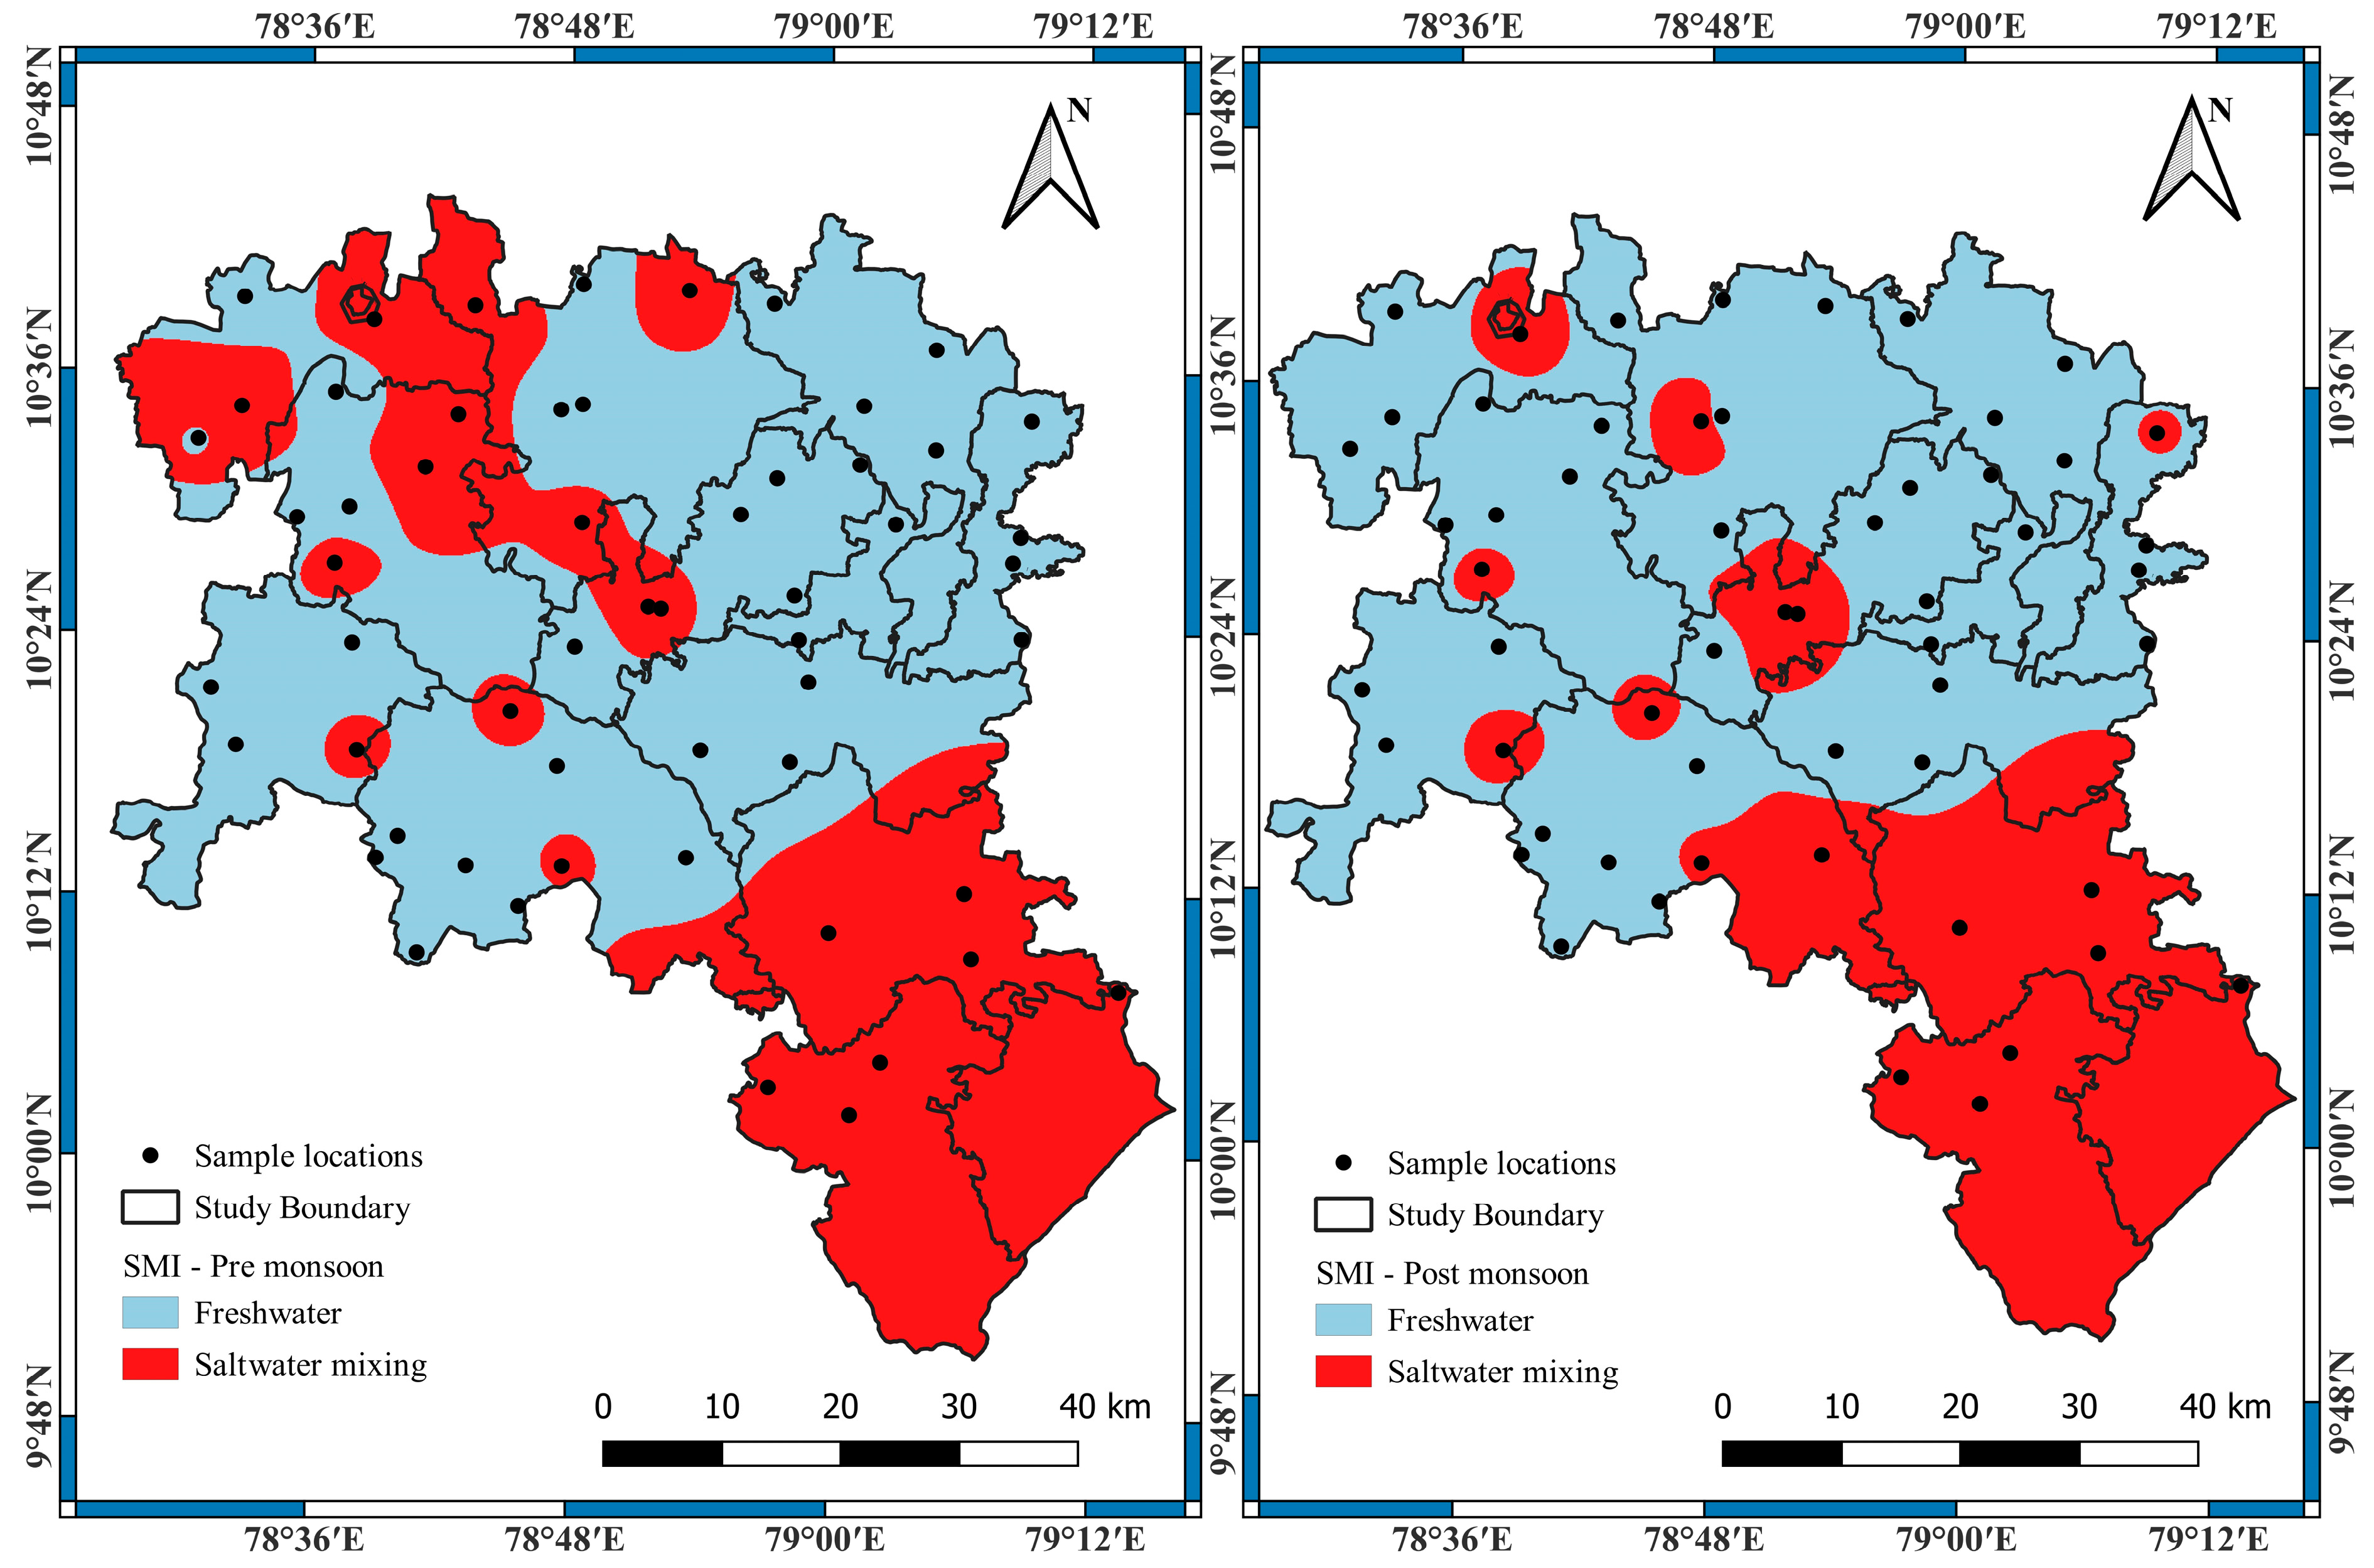
3.4. SMI for the Study Region
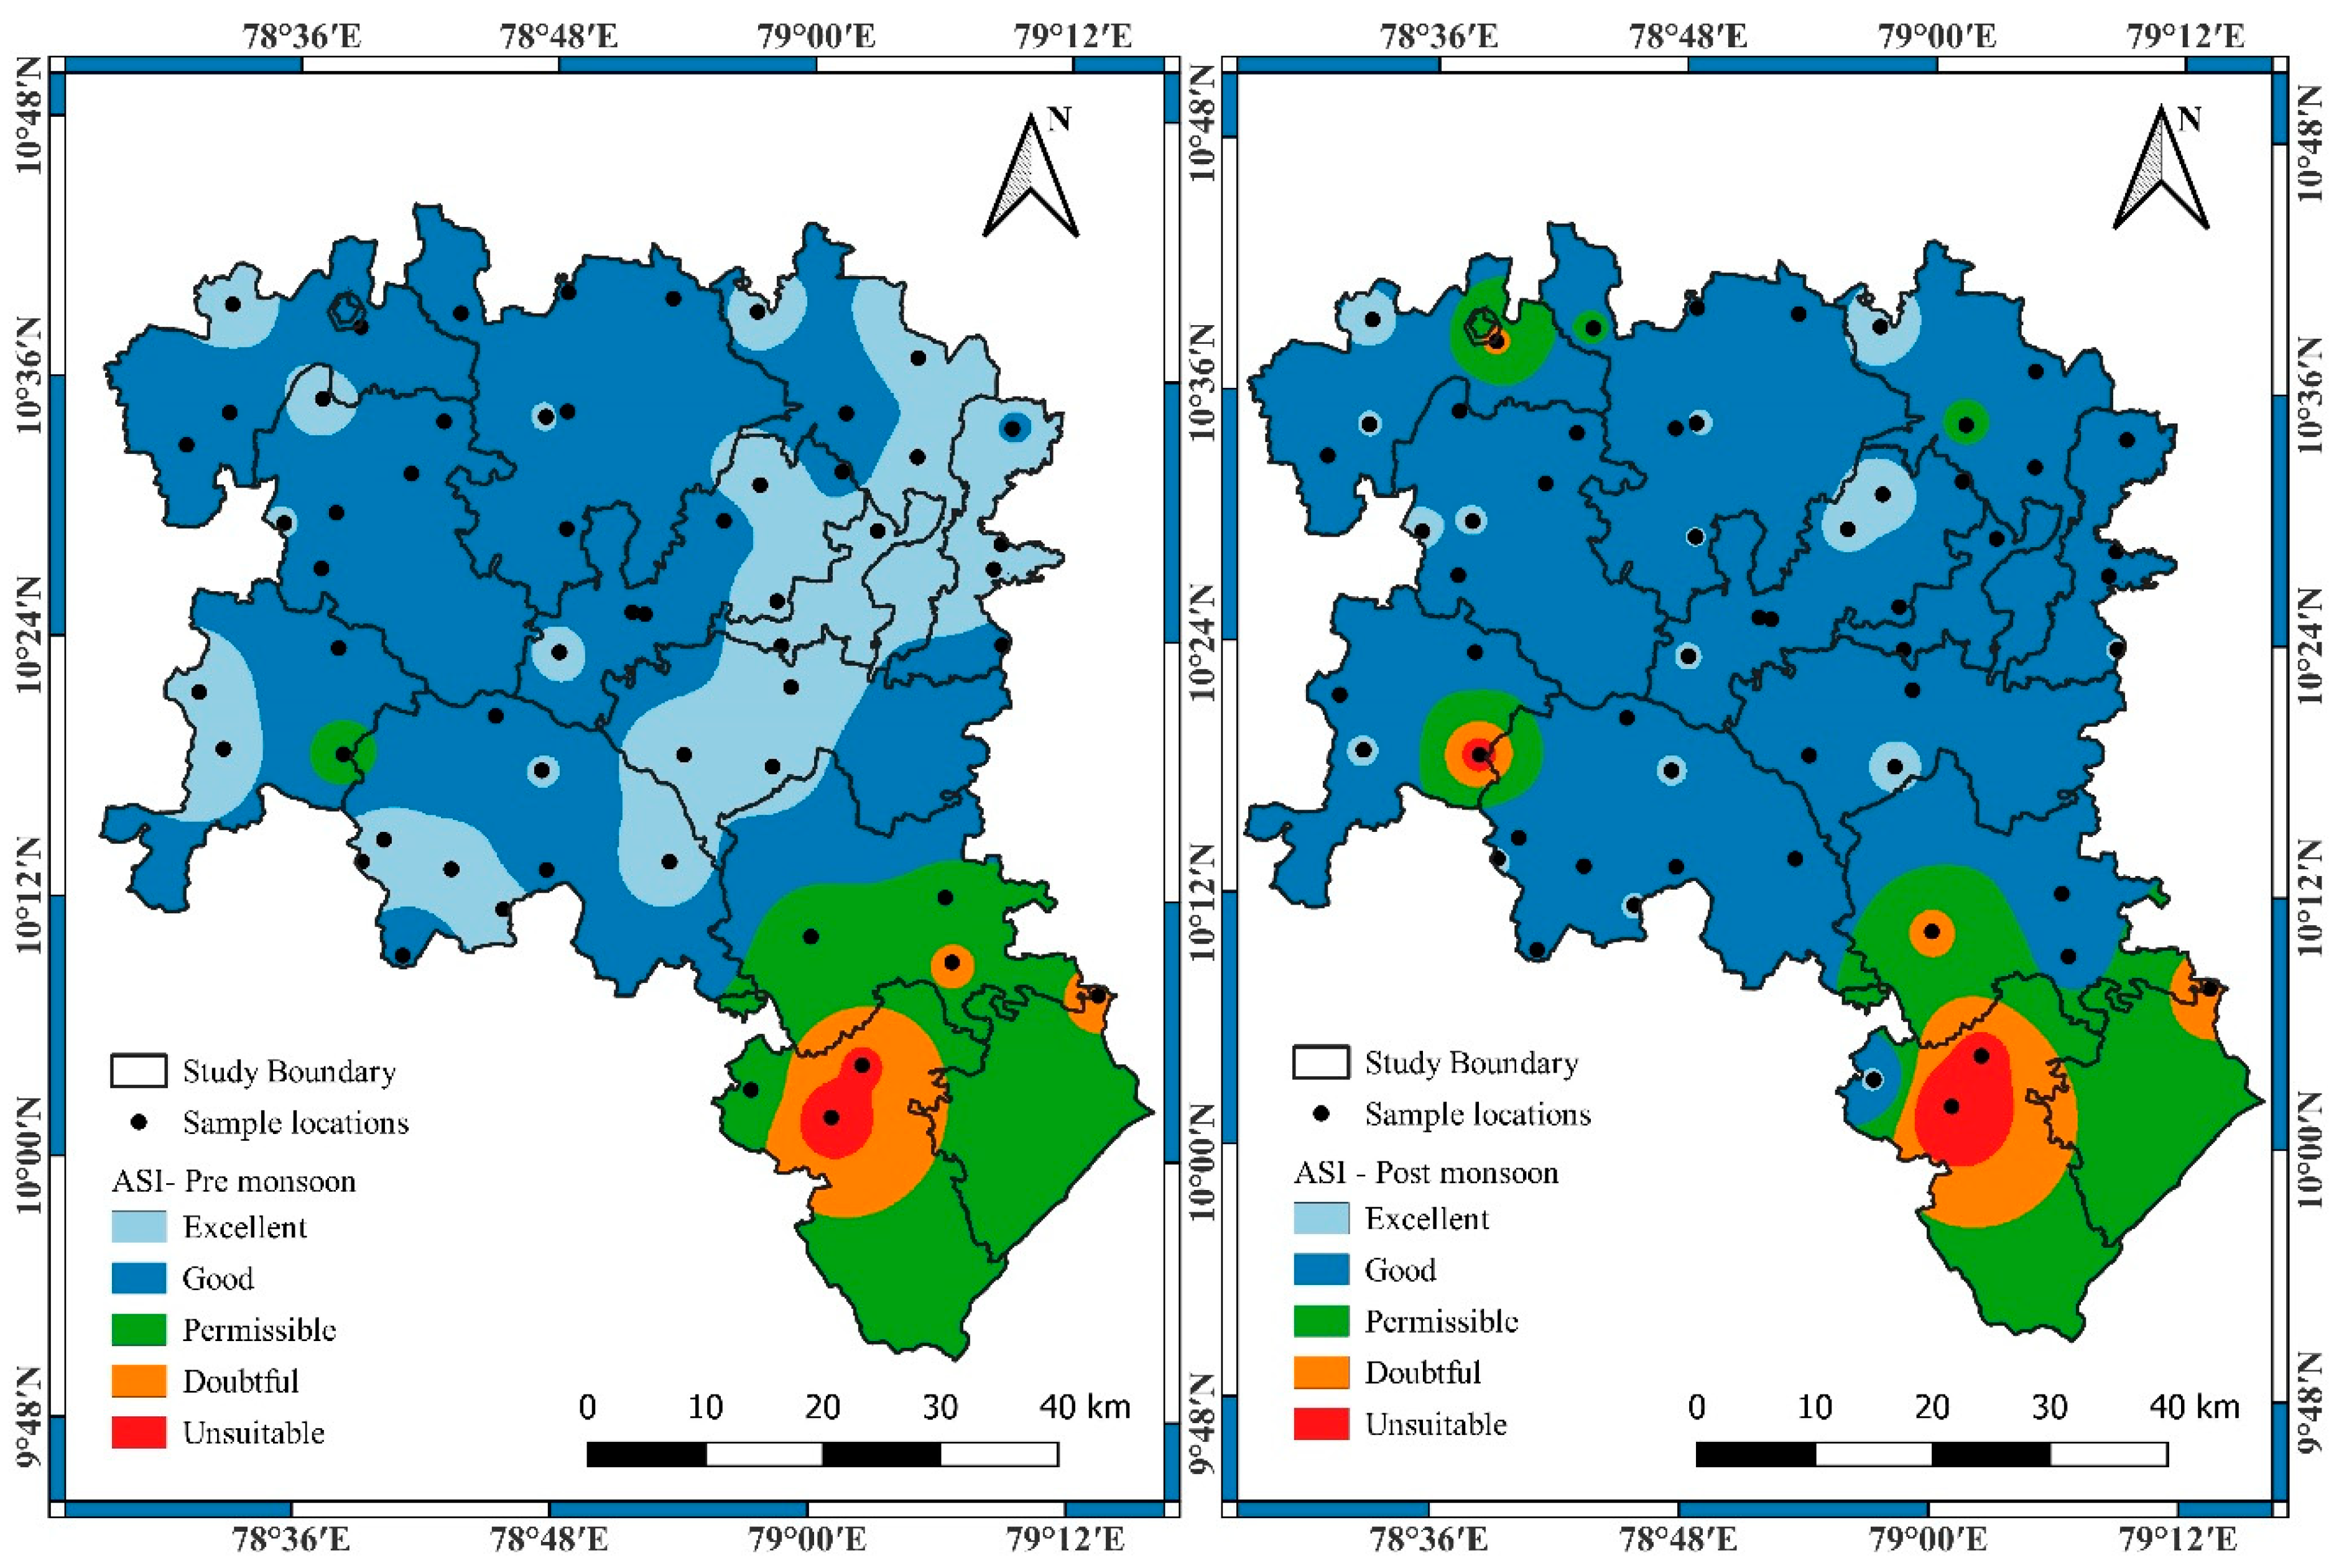
3.5. Overall Suitability of Groundwater Based on the ASI
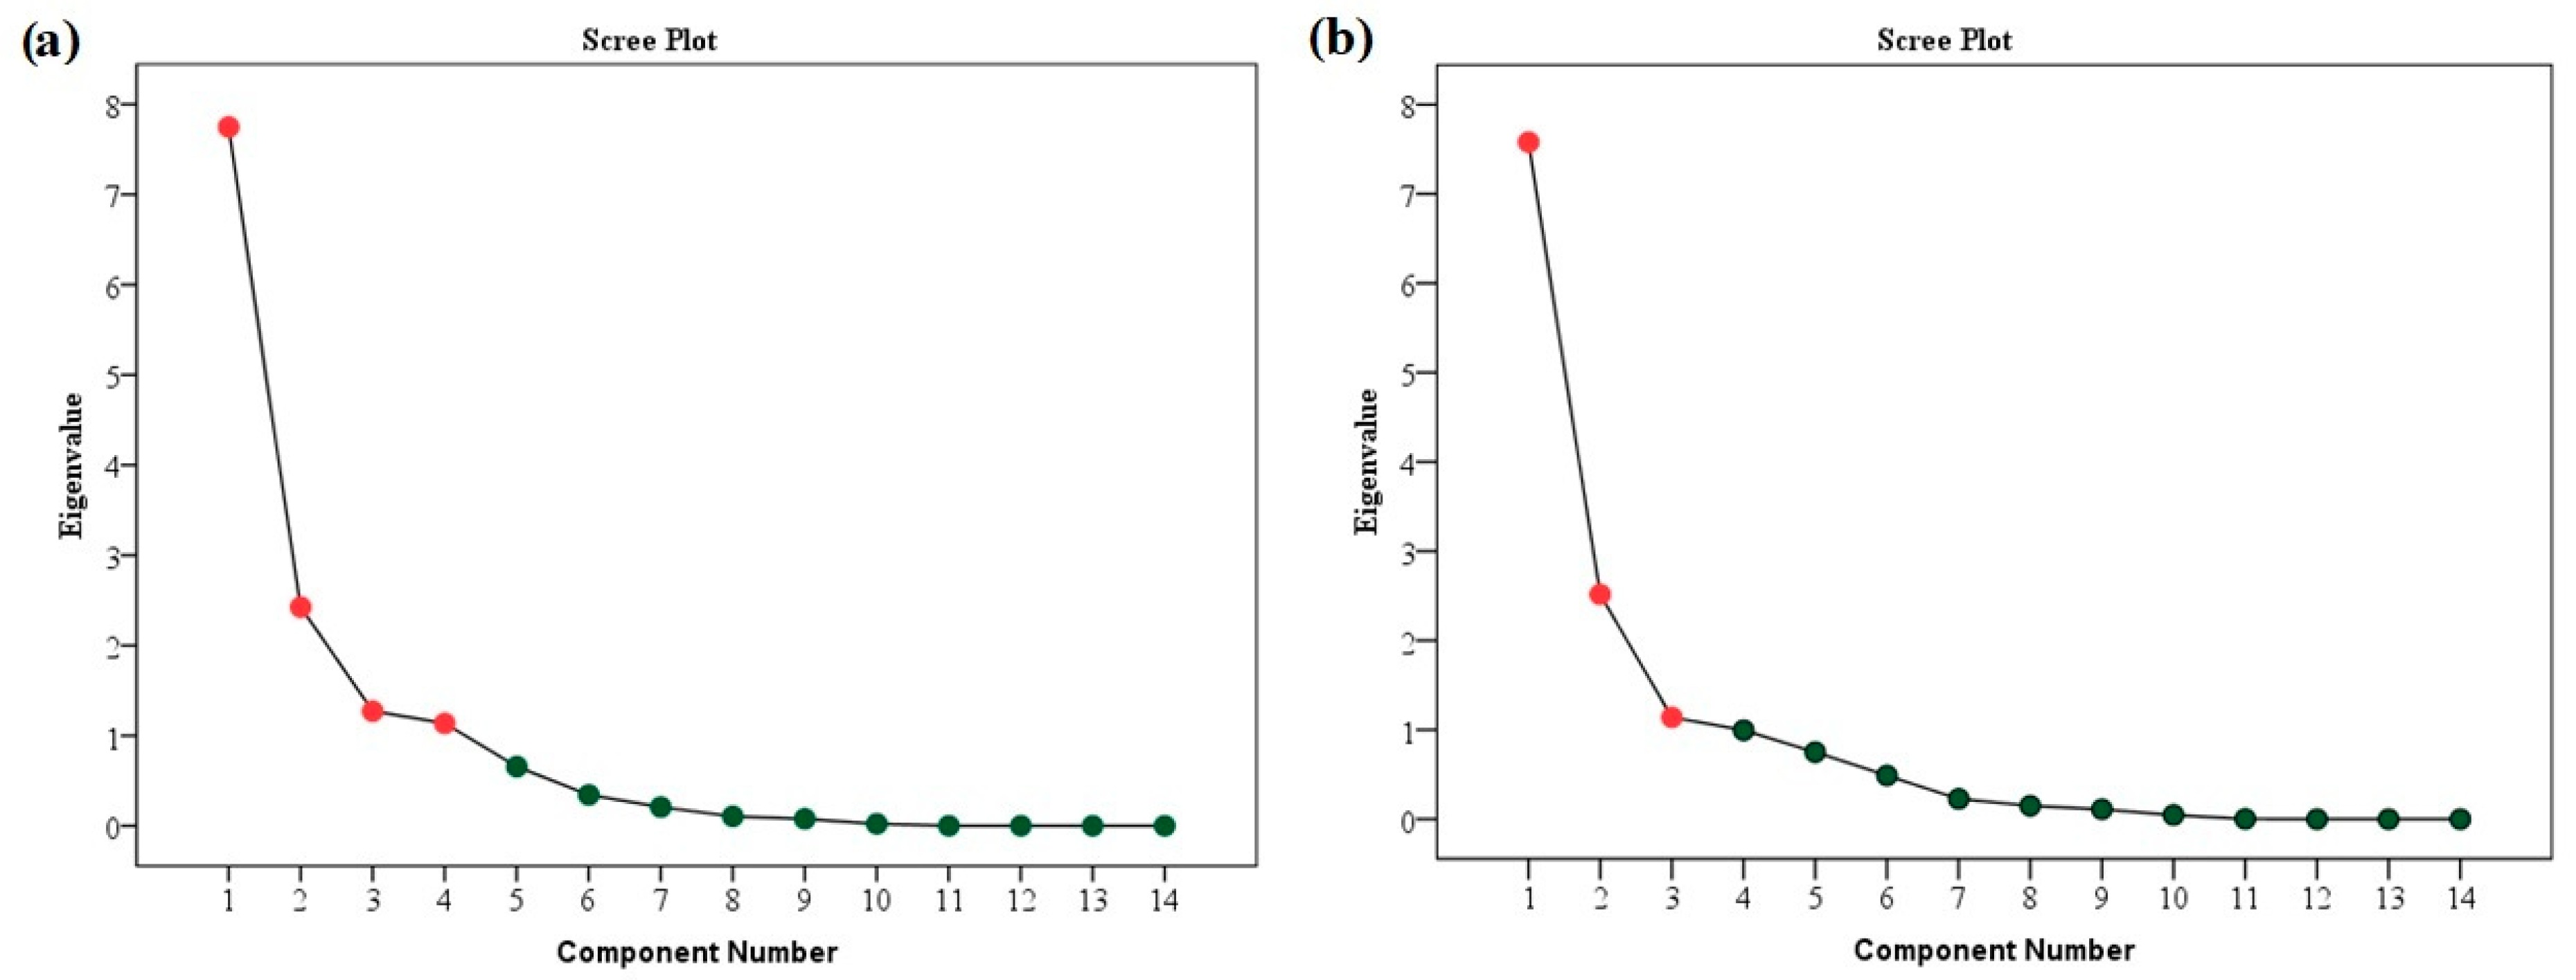
3.6. Ionic Strength Identification Using USML Techniques
3.7. Discussion
4. Conclusions
Supplementary Materials
Author Contributions
Funding
Data Availability Statement
Conflicts of Interest
References
- Panneerselvam, B.; Muniraj, K.; Pande, C.; Ravichandran, N.; Thomas, M.; Karuppannan, S. Geochemical evaluation and human health risk assessment of nitrate-contaminated groundwater in an industrial area of South India. Environ. Sci. Pollut. Res. 2022, 29, 86202–86219. [Google Scholar] [CrossRef] [PubMed]
- Sankar, K.; Karunanidhi, D.; Kalaivanan, K.; Subramani, T.; Shanthi, D.; Balamurugan, P. Integrated hydrogeophysical and GIS based demarcation of groundwater potential and vulnerability zones in a hard rock and sedimentary terrain of Southern India. Chemosphere 2023, 316, 137305. [Google Scholar] [CrossRef]
- Creel, L. Ripple Effects: Population and Coastal Regions; Population Reference Bureau: Washington, DC, USA, 2003; pp. 1–7. [Google Scholar]
- Kouadri, S.; Pande, C.B.; Panneerselvam, B.; Moharir, K.N.; Elbeltagi, A. Prediction of irrigation groundwater quality parameters using ANN, LSTM, and MLR models. Environ. Sci. Pollut. Res. 2021, 29, 21067–21091. [Google Scholar] [CrossRef] [PubMed]
- Pande, C.B.; Moharir, K.N.; Panneerselvam, B.; Singh, S.K.; Elbeltagi, A.; Pham, Q.B.; Varade, A.M.; Rajesh, J. Delineation of groundwater potential zones for sustainable development and planning using analytical hierarchy process (AHP), and MIF techniques. Appl. Water Sci. 2021, 11, 186. [Google Scholar] [CrossRef]
- Shunmugapriya, K.; Panneerselvam, B.; Muniraj, K.; Ravichandran, N.; Prasath, P.; Thomas, M.; Duraisamy, K. Integration of multi criteria decision analysis and GIS for evaluating the site suitability for aquaculture in southern coastal region, India. Mar. Pollut. Bull. 2021, 172, 112907. [Google Scholar] [CrossRef]
- Charoenlerkthawin, W.; Bidorn, K.; Burnett, W.C.; Sasaki, J.; Panneerselvam, B.; Bidorn, B. Effectiveness of grey and green engineered solutions for protecting the low-lying muddy coast of the Chao Phraya Delta, Thailand. Sci. Rep. 2022, 12, 20448. [Google Scholar] [CrossRef]
- Kaliyappan, S.P.; Muniraj, K.; Rajendran, G.; Bidorn, B.; Thomas, M.; Panneerselvam, B. Seasonal Variation of Groundwater Quality for Irrigation Purposes in a Semi-Arid Region in Tamil Nadu, India. In Climate Change Impact on Groundwater Resources: Human Health Risk Assessment in Arid and Semi-Arid Regions; Springer International Publishing: Cham, Switzerland, 2022; pp. 163–180. [Google Scholar]
- Panneerselvam, B.; Ravichandran, N.; Kaliyappan, S.P.; Karuppannan, S.; Bidorn, B. Quality and Health Risk Assessment of Groundwater for Drinking and Irrigation Purpose in Semi-Arid Region of India Using Entropy Water Quality and Statistical Techniques. Water 2023, 15, 601. [Google Scholar] [CrossRef]
- Basack, S.; Loganathan, M.; Goswami, G.; Khabbaz, H.; Basack, S.; Loganathan, M.; Goswami, G.; Khabbaz, H. Saltwater Intrusion into Coastal Aquifers and Associated Risk Management: Critical Review and Research Directives. J. Coast. Res. 2022, 38, 654–672. [Google Scholar] [CrossRef]
- Cantelon, J.A.; Guimond, J.A.; Robinson, C.E.; Michael, H.A.; Kurylyk, B.L. Vertical Saltwater Intrusion in Coastal Aquifers Driven by Episodic Flooding: A Review. Water Resour. Res. 2022, 58, e2022WR032614. [Google Scholar] [CrossRef]
- Panneerselvam, B.; Muniraj, K.; Pande, C.; Ravichandran, N. Prediction and evaluation of groundwater characteristics using the radial basic model in Semi-arid region, India. Int. J. Environ. Anal. Chem. 2021, 103, 1377–1393. [Google Scholar] [CrossRef]
- Alfarrah, N.; Walraevens, K. Groundwater Overexploitation and Seawater Intrusion in Coastal Areas of Arid and Semi-Arid Regions. Water 2018, 10, 143. [Google Scholar] [CrossRef]
- Abu Salem, H.S.; Gemail, K.S.; Junakova, N.; Ibrahim, A.; Nosair, A.M. An Integrated Approach for Deciphering Hydrogeochemical Processes during Seawater Intrusion in Coastal Aquifers. Water 2022, 14, 1165. [Google Scholar] [CrossRef]
- Hajji, S.; Allouche, N.; Bouri, S.; Aljuaid, A.M.; Hachicha, W. Assessment of Seawater Intrusion in Coastal Aquifers Using Multivariate Statistical Analyses and Hydrochemical Facies Evolution-Based Model. Int. J. Environ. Res. Public Health 2022, 19, 155. [Google Scholar] [CrossRef] [PubMed]
- Panthi, J.; Pradhanang, S.M.; Nolte, A.; Boving, T.B. Saltwater intrusion into coastal aquifers in the contiguous United States—A systematic review of investigation approaches and monitoring networks. Sci. Total Environ. 2022, 836, 155641. [Google Scholar] [CrossRef]
- WHO World Health Organization. Guidelines for Drinking-Water Quality, 4th ed.; Incorporating the 1st Addendum; WHO World Health Organization: Geneva, Switzerland, 2017.
- Abd-Elaty, I.; Kuriqi, A.; Bhat, S.A.; Zelenakova, M. Sustainable management of two-directional lateral and upconing saltwater intrusion in coastline aquifers to alleviate water scarcity. Hydrol. Process. 2022, 36, e14646. [Google Scholar] [CrossRef]
- Alshehri, F.; Almadani, S.; El-Sorogy, A.S.; Alwaqdani, E.; Alfaifi, H.J.; Alharbi, T. Influence of seawater intrusion and heavy metals contamination on groundwater quality, Red Sea coast, Saudi Arabia. Mar. Pollut. Bull. 2021, 165, 112094. [Google Scholar] [CrossRef]
- Asare, A.; Appiah-Adjei, E.K.; Ali, B.; Owusu-Nimo, F. Assessment of seawater intrusion using ionic ratios: The case of coastal communities along the Central Region of Ghana. Environ. Earth Sci. 2021, 80, 307. [Google Scholar] [CrossRef]
- Bhagat, C.; Puri, M.; Mohapatra, P.K.; Kumar, M. Imprints of seawater intrusion on groundwater quality and evolution in the coastal districts of south Gujarat, India. Case Stud. Chem. Environ. Eng. 2021, 3, 100101. [Google Scholar] [CrossRef]
- Dhakate, R.; Ratnalu, G.V.; Sankaran, S. Hydrogeochemical and isotopic study for evaluation of seawater intrusion into shallow coastal aquifers of Udupi District, Karnataka, India. Geochemistry 2020, 80, 125647. [Google Scholar] [CrossRef]
- Abdalla, F. Ionic ratios as tracers to assess seawater intrusion and to identify salinity sources in Jazan coastal aquifer, Saudi Arabia. Arab. J. Geosci. 2016, 9, 40. [Google Scholar] [CrossRef]
- Akshitha, V.; Balakrishna, K.; Udayashankar, H.N. Assessment of hydrogeochemical characteristics and saltwater intrusion in selected coastal aquifers of southwestern India. Mar. Pollut. Bull. 2021, 173, 112989. [Google Scholar] [CrossRef] [PubMed]
- Lee, J.-Y.; Song, S.-H. Groundwater chemistry and ionic ratios in a western coastal aquifer of Buan, Korea: Implication for seawater intrusion. Geosci. J. 2007, 11, 259–270. [Google Scholar] [CrossRef]
- Prusty, P.; Farooq, S. Seawater intrusion in the coastal aquifers of India—A review. HydroResearch 2020, 3, 61–74. [Google Scholar] [CrossRef]
- Maurya, P.; Kumari, R.; Mukherjee, S. Hydrochemistry in integration with stable isotopes (δ18O and δD) to assess seawater intrusion in coastal aquifers of Kachchh district, Gujarat, India. J. Geochem. Explor. 2019, 196, 42–56. [Google Scholar] [CrossRef]
- Gopinath, S.; Srinivasamoorthy, K.; Saravanan, K.; Prakash, R.; Karunanidhi, D. Characterizing groundwater quality and seawater intrusion in coastal aquifers of Nagapattinam and Karaikal, South India using hydrogeochemistry and modeling techniques. Hum. Ecol. Risk Assess. Int. J. 2019, 25, 314–334. [Google Scholar] [CrossRef]
- Slama, F.; Slama, F.; Nasri, N.; Nasri, N.; Bouhlila, R.; Bouhlila, R. Delineating the origins and processes of groundwater salinization and quality degradation in a coastal irrigated plain, Korba (Northeastern Tunisia). Mar. Pollut. Bull. 2022, 181, 113914. [Google Scholar] [CrossRef]
- Hassan, A.M.; Ersoy, A.F. Statistical assessment of seasonal variation of groundwater quality in Çarşamba coastal plain, Samsun (Turkey). Environ. Monit. Assess. 2022, 194, 135. [Google Scholar] [CrossRef]
- Wilcox, L.V. Classification and Use of Irrigation Waters; Circular No. 969; U.S. Geological Survey, Department of Agriculture: Washington, DC, USA, 1955; p. 19. [Google Scholar]
- Abu Al Naeem, M.F.; Yusoff, I.; Ng, T.F.; Maity, J.P.; Alias, Y.; May, R.; Alborsh, H. A study on the impact of anthropogenic and geogenic factors on groundwater salinization and seawater intrusion in Gaza coastal aquifer, Palestine: An integrated multi-techniques approach. J. Afr. Earth Sci. 2019, 156, 75–93. [Google Scholar] [CrossRef]
- Ayari, J.; Ouelhazi, H.; Charef, A.; Barhoumi, A. Delineation of seawater intrusion and groundwater quality assessment in coastal aquifers: The Korba coastal aquifer (Northeastern Tunisia). Mar. Pollut. Bull. 2023, 188, 114643. [Google Scholar] [CrossRef]
- Kim, R.-H.; Kim, J.-H.; Ryu, J.-S.; Koh, D.-C. Hydrogeochemical characteristics of groundwater influenced by reclamation, seawater intrusion, and land use in the coastal area of Yeonggwang, Korea. Geosci. J. 2019, 23, 603–619. [Google Scholar] [CrossRef]
- Shin, K.; Koh, D.-C.; Jung, H.; Lee, J. The Hydrogeochemical Characteristics of Groundwater Subjected to Seawater Intrusion in the Archipelago, Korea. Water 2020, 12, 1542. [Google Scholar] [CrossRef]
- Mohanty, A.K.; Rao, V.G. Hydrogeochemical, seawater intrusion and oxygen isotope studies on a coastal region in the Puri District of Odisha, India. Catena 2019, 172, 558–571. [Google Scholar] [CrossRef]
- Satheeskumar, V.; Subramani, T.; Lakshumanan, C.; Roy, P.D.; Karunanidhi, D. Groundwater chemistry and demarcation of seawater intrusion zones in the Thamirabarani delta of south India based on geochemical signatures. Environ. Geochem. Health 2021, 43, 757–770. [Google Scholar] [CrossRef] [PubMed]
- Taşan, M.; Taşan, S.; Demir, Y. Estimation and uncertainty analysis of groundwater quality parameters in a coastal aquifer under seawater intrusion: A comparative study of deep learning and classic machine learning methods. Environ. Sci. Pollut. Res. 2022, 30, 2866–2890. [Google Scholar] [CrossRef] [PubMed]
- Balamurugan, P.; Kumar, P.; Shankar, K. Dataset on the suitability of groundwater for drinking and irrigation purposes in the Sarabanga River region, Tamil Nadu, India. Data Brief 2020, 29, 105255. [Google Scholar] [CrossRef] [PubMed]
- Balamurugan, P.; Kumar, P.; Shankar, K.; Nagavinothini, R.; Vijayasurya, K. Non-carcinogenic risk assessment of groundwater in southern part of Salem District in Tamilnadu, India. J. Chil. Chem. Soc. 2020, 65, 4697–4707. [Google Scholar] [CrossRef]
- Panneerselvam, B.; Karuppannan, S.; Muniraj, K. Evaluation of drinking and irrigation suitability of groundwater with special emphasizing the health risk posed by nitrate contamination using nitrate pollution index (NPI) and human health risk assessment (HHRA). Hum. Ecol. Risk Assess. Int. J. 2020, 27, 1324–1348. [Google Scholar] [CrossRef]
- Panneerselvam, B.; Muniraj, K.; Thomas, M.; Ravichandran, N. GIS-Based Legitimatic Evaluation of Groundwater’s Health Risk and Irrigation Susceptibility Using Water Quality Index, Pollution Index, and Irrigation Indexes in Semiarid Region. In Groundwater Resources Development and Planning in the Semi-Arid Region; Springer International Publishing: Cham, Switzerland, 2021; pp. 239–268. [Google Scholar]
- Climate Data for Cities Worldwide. Available online: https://en.climate-data.org/asia/india/tamil-nadu/pudukkottai-24013/ (accessed on 15 April 2024).
- Pudukkotai District Profile. Tamilnadu Water Supply and Drainage Board. Available online: http://www.twadboard.tn.gov.in/content/pudukottai (accessed on 15 March 2023).
- Suresh, S. District Groundwater Brochure, Pudukkottai District, Tamil Nadu; Central Groundwater Board, South Eastern Coastal Region: Chennai, India, 2008; pp. 1–21. [Google Scholar]
- APHA. Standard Methods for the Examination of Water and Wastewater, 23rd ed.; American Public Health Association: Washington, DC, USA, 2017. [Google Scholar]
- Ramalingam, S.; Panneerselvam, B.; Kaliappan, S.P. Effect of high nitrate contamination of groundwater on human health and water quality index in semi-arid region, South India. Arab. J. Geosci. 2022, 15, 242. [Google Scholar] [CrossRef]
- Sridharan, M.; Nathan, D.S. Groundwater quality assessment for domestic and agriculture purposes in Puducherry region. Appl. Water Sci. 2017, 7, 4037–4053. [Google Scholar] [CrossRef]
- Parkhurst, D.L.; Appelo, C.A.J. User’s guide to PHREEQC Version 2: A Computer Program for Speciation, Batch-Reaction, One-Dimensional Transport, and Inverse Geochemical Calculations; No. 99-4259; USGS Water-Resources Investigations Report; USGS: Reston, VA, USA, 1999; pp. 99–4259. [Google Scholar]
- Park, S.-C.; Yun, S.-T.; Chae, G.-T.; Yoo, I.-S.; Shin, K.-S.; Heo, C.-H.; Lee, S.-K. Regional hydrochemical study on salinization of coastal aquifers, western coastal area of South Korea. J. Hydrol. 2005, 313, 182–194. [Google Scholar] [CrossRef]
- Sivaranjani, S.; Ellappan, V.; Karthick, L.A. Appraisal of Seawater Mixing Index in Coastal Aquifer of Karaikal, Southern India Using Geospatial Technology. J. Geol. Soc. India 2019, 94, 641–644. [Google Scholar] [CrossRef]
- Panneerselvam, B.; Muniraj, K.; Duraisamy, K.; Pande, C.; Karuppannan, S.; Thomas, M. An integrated approach to explore the suitability of nitrate-contaminated groundwater for drinking purposes in a semiarid region of India. Environ. Geochem. Health 2022, 45, 647–663. [Google Scholar] [CrossRef] [PubMed]
- Panneerselvam, B.; Muniraj, K.; Thomas, M.; Ravichandran, N.; Bidorn, B. Identifying influencing groundwater parameter on human health associate with irrigation indices using the Automatic Linear Model (ALM) in a semi-arid region in India. Environ. Res. 2021, 202, 111778. [Google Scholar] [CrossRef] [PubMed]
- Samtio, M.S.; Hakro, A.A.A.D.; Jahangir, T.M.; Mastoi, A.S.; Lanjwani, M.F.; Rajper, R.H.; Lashari, R.A.; Agheem, M.H.; Noonari, M.W. Impact of rock-water interaction on hydrogeochemical characteristics of groundwater: Using multivariate statistical, water quality index and irrigation indices of chachro sub-district, thar desert, sindh, Pakistan. Groundw. Sustain. Dev. 2023, 20, 100878. [Google Scholar] [CrossRef]
- Aravinthasamy, P.; Karunanidhi, D.; Rao, N.S.; Subramani, T.; Srinivasamoorthy, K. Irrigation risk assessment of groundwater in a non-perennial river basin of South India: Implication from irrigation water quality index (IWQI) and geographical information system (GIS) approaches. Arab. J. Geosci. 2020, 13, 1125. [Google Scholar] [CrossRef]
- Awad, E.S.; Imran, N.S.; Albayati, M.M.; Snegirev, V.; Sabirova, T.M.; Tretyakova, N.A.; Alsalhy, Q.F.; Al-Furaiji, M.H.; Salih, I.K.; Majdi, H.S. Groundwater Hydrogeochemical and Quality Appraisal for Agriculture Irrigation in Greenbelt Area, Iraq. Environments 2022, 9, 43. [Google Scholar] [CrossRef]
- Batarseh, M.; Imreizeeq, E.; Tilev, S.; Al Alaween, M.; Suleiman, W.; Al Remeithi, A.M.; Al Tamimi, M.K.; Al Alawneh, M. Assessment of groundwater quality for irrigation in the arid regions using irrigation water quality index (IWQI) and GIS-Zoning maps: Case study from Abu Dhabi Emirate, UAE. Groundw. Sustain. Dev. 2021, 14, 100611. [Google Scholar] [CrossRef]
- Mondal, N.C.; Singh, S.; Singh, V.S. Hydrochemical characteristic of coastal aquifer from Tuticorin, Tamil Nadu, India. Environ. Monit. Assess. 2011, 175, 531–550. [Google Scholar] [CrossRef]
- Chakraborty, T.K.; Islam, S.; Ghosh, G.C.; Ghosh, P.; Zaman, S.; Habib, A.; Hossain, R.; Bosu, H.; Islam, R.; Al Imran, M.; et al. Human health risk and hydro-geochemical appraisal of groundwater in the southwest part of Bangladesh using GIS, water quality indices, and multivariate statistical approaches. Toxin Rev. 2023, 42, 285–299. [Google Scholar] [CrossRef]
- El Osta, M.; Masoud, M.; Alqarawy, A.; Elsayed, S.; Gad, M. Groundwater Suitability for Drinking and Irrigation Using Water Quality Indices and Multivariate Modeling in Makkah Al-Mukarramah Province, Saudi Arabia. Water 2022, 14, 483. [Google Scholar] [CrossRef]
- Mahammad, S.; Islam, A.; Shit, P.K. Geospatial assessment of groundwater quality using entropy-based irrigation water quality index and heavy metal pollution indices. Environ. Sci. Pollut. Res. 2022, 30, 116498–116521. [Google Scholar] [CrossRef] [PubMed]
- Masoud, M.; El Osta, M.; Alqarawy, A.; Elsayed, S.; Gad, M. Evaluation of groundwater quality for agricultural under different conditions using water quality indices, partial least squares regression models, and GIS approaches. Appl. Water Sci. 2022, 12, 244. [Google Scholar] [CrossRef]
- Zafar, M.M.; Sulaiman, M.A.; Prabhakar, R.; Kumari, A. Evaluation of the suitability of groundwater for irrigational purposes using irrigation water quality indices and geographical information systems (GIS) at Patna (Bihar), India. Int. J. Energy Water Resour. 2022, 8, 241–254. [Google Scholar] [CrossRef]
- Zakir, H.; Sharmin, S.; Akter, A.; Rahman, S. Assessment of health risk of heavy metals and water quality indices for irrigation and drinking suitability of waters: A case study of Jamalpur Sadar area, Bangladesh. Environ. Adv. 2020, 2, 100005. [Google Scholar] [CrossRef]
- Khanoranga; Khalid, S. An assessment of groundwater quality for irrigation and drinking purposes around brick kilns in three districts of Balochistan province, Pakistan, through water quality index and multivariate statistical approaches. J. Geochem. Explor. 2019, 197, 14–26. [Google Scholar] [CrossRef]
- Kumari, M.; Rai, S.C. Hydrogeochemical Evaluation of Groundwater Quality for Drinking and Irrigation Purposes Using Water Quality Index in Semi Arid Region of India. J. Geol. Soc. India 2020, 95, 159–168. [Google Scholar] [CrossRef]
- Nguyen, T.T.; Kawamura, A.; Tong, T.N.; Amaguchi, H.; Nakagawa, N.; Gilbuena, R.; Du Bui, D. Identification of spatio-seasonal hydrogeochemical characteristics of the unconfined groundwater in the Red River Delta, Vietnam. Appl. Geochem. 2015, 63, 10–21. [Google Scholar] [CrossRef]
- Richards, L. Diagnosis and Improvement of Saline And Alkali Soils. In Agricultural Handbook; US Department of Agriculture: Washington, DC, USA, 1954; p. 60. [Google Scholar]
- Alhamd, A.D.; Ibrahim, M.A. Unveiling soil and groundwater salinity dynamics and its impact on date palm yield in Southern Basrah, Iraq. DYSONA-Appl. Sci. 2024, 5, 25–32. [Google Scholar]
- Khouri, L.; Sallom, A. The impact of spatial and temporal shifts on Orontes River water quality parameters. DYSONA-Appl. Sci. 2023, 4, 35–41. [Google Scholar]


| S. No. | Parameter | Relative Weight (Wi) | Wi | Si |
|---|---|---|---|---|
| 1 | Sodium absorption ratio (SAR) | 5 | 0.2273 | 18 |
| 2 | Percentage sodium (PS) | 4 | 0.1818 | 60% |
| 3 | Permeability index (PI) | 4 | 0.1818 | 25 |
| 4 | Magnesium absorption ratio (MAR) | 3 | 0.1364 | 50 |
| 5 | Potential salinity (PS) | 2 | 0.0909 | 10 |
| 6 | Kelly’s ratio (KR) | 1 | 0.0455 | 2 |
| Chloride Concentration (g/L) | Water Class | Purpose of Use |
|---|---|---|
| 0 to 0.3 | Class I | Suitable for all types of crops |
| 0.3 to 0.7 | Class II | Suitable for crops with high, medium, and low salt tolerance |
| 0.7 to 0.9 | Class III | Suitable for crops with high and medium salt tolerance |
| 0.9 to 1.3 | Class IV | Suitable for crops with high salt tolerance |
| Above 1.3 | Class V | Not suitable for any crops |
| Category | Pre Monsoon | Post Monsoon | Water Type | Change in Quality | ||
|---|---|---|---|---|---|---|
| Sample Count | Sample % | Sample Count | Sample % | |||
| Sodium absorption ratio (SAR) | ||||||
| Less than 10 | 52 | 92.86 | 50 | 89.29 | Excellent | −3.57 |
| 10 to 18 | 4 | 7.14 | 5 | 8.93 | Good | 1.79 |
| 18 to 26 | 0 | 0 | 1 | 1.79 | Doubtful | 1.79 |
| Greater than 26 | 0 | 0 | 0 | 0.00 | Unsuitable | 0.00 |
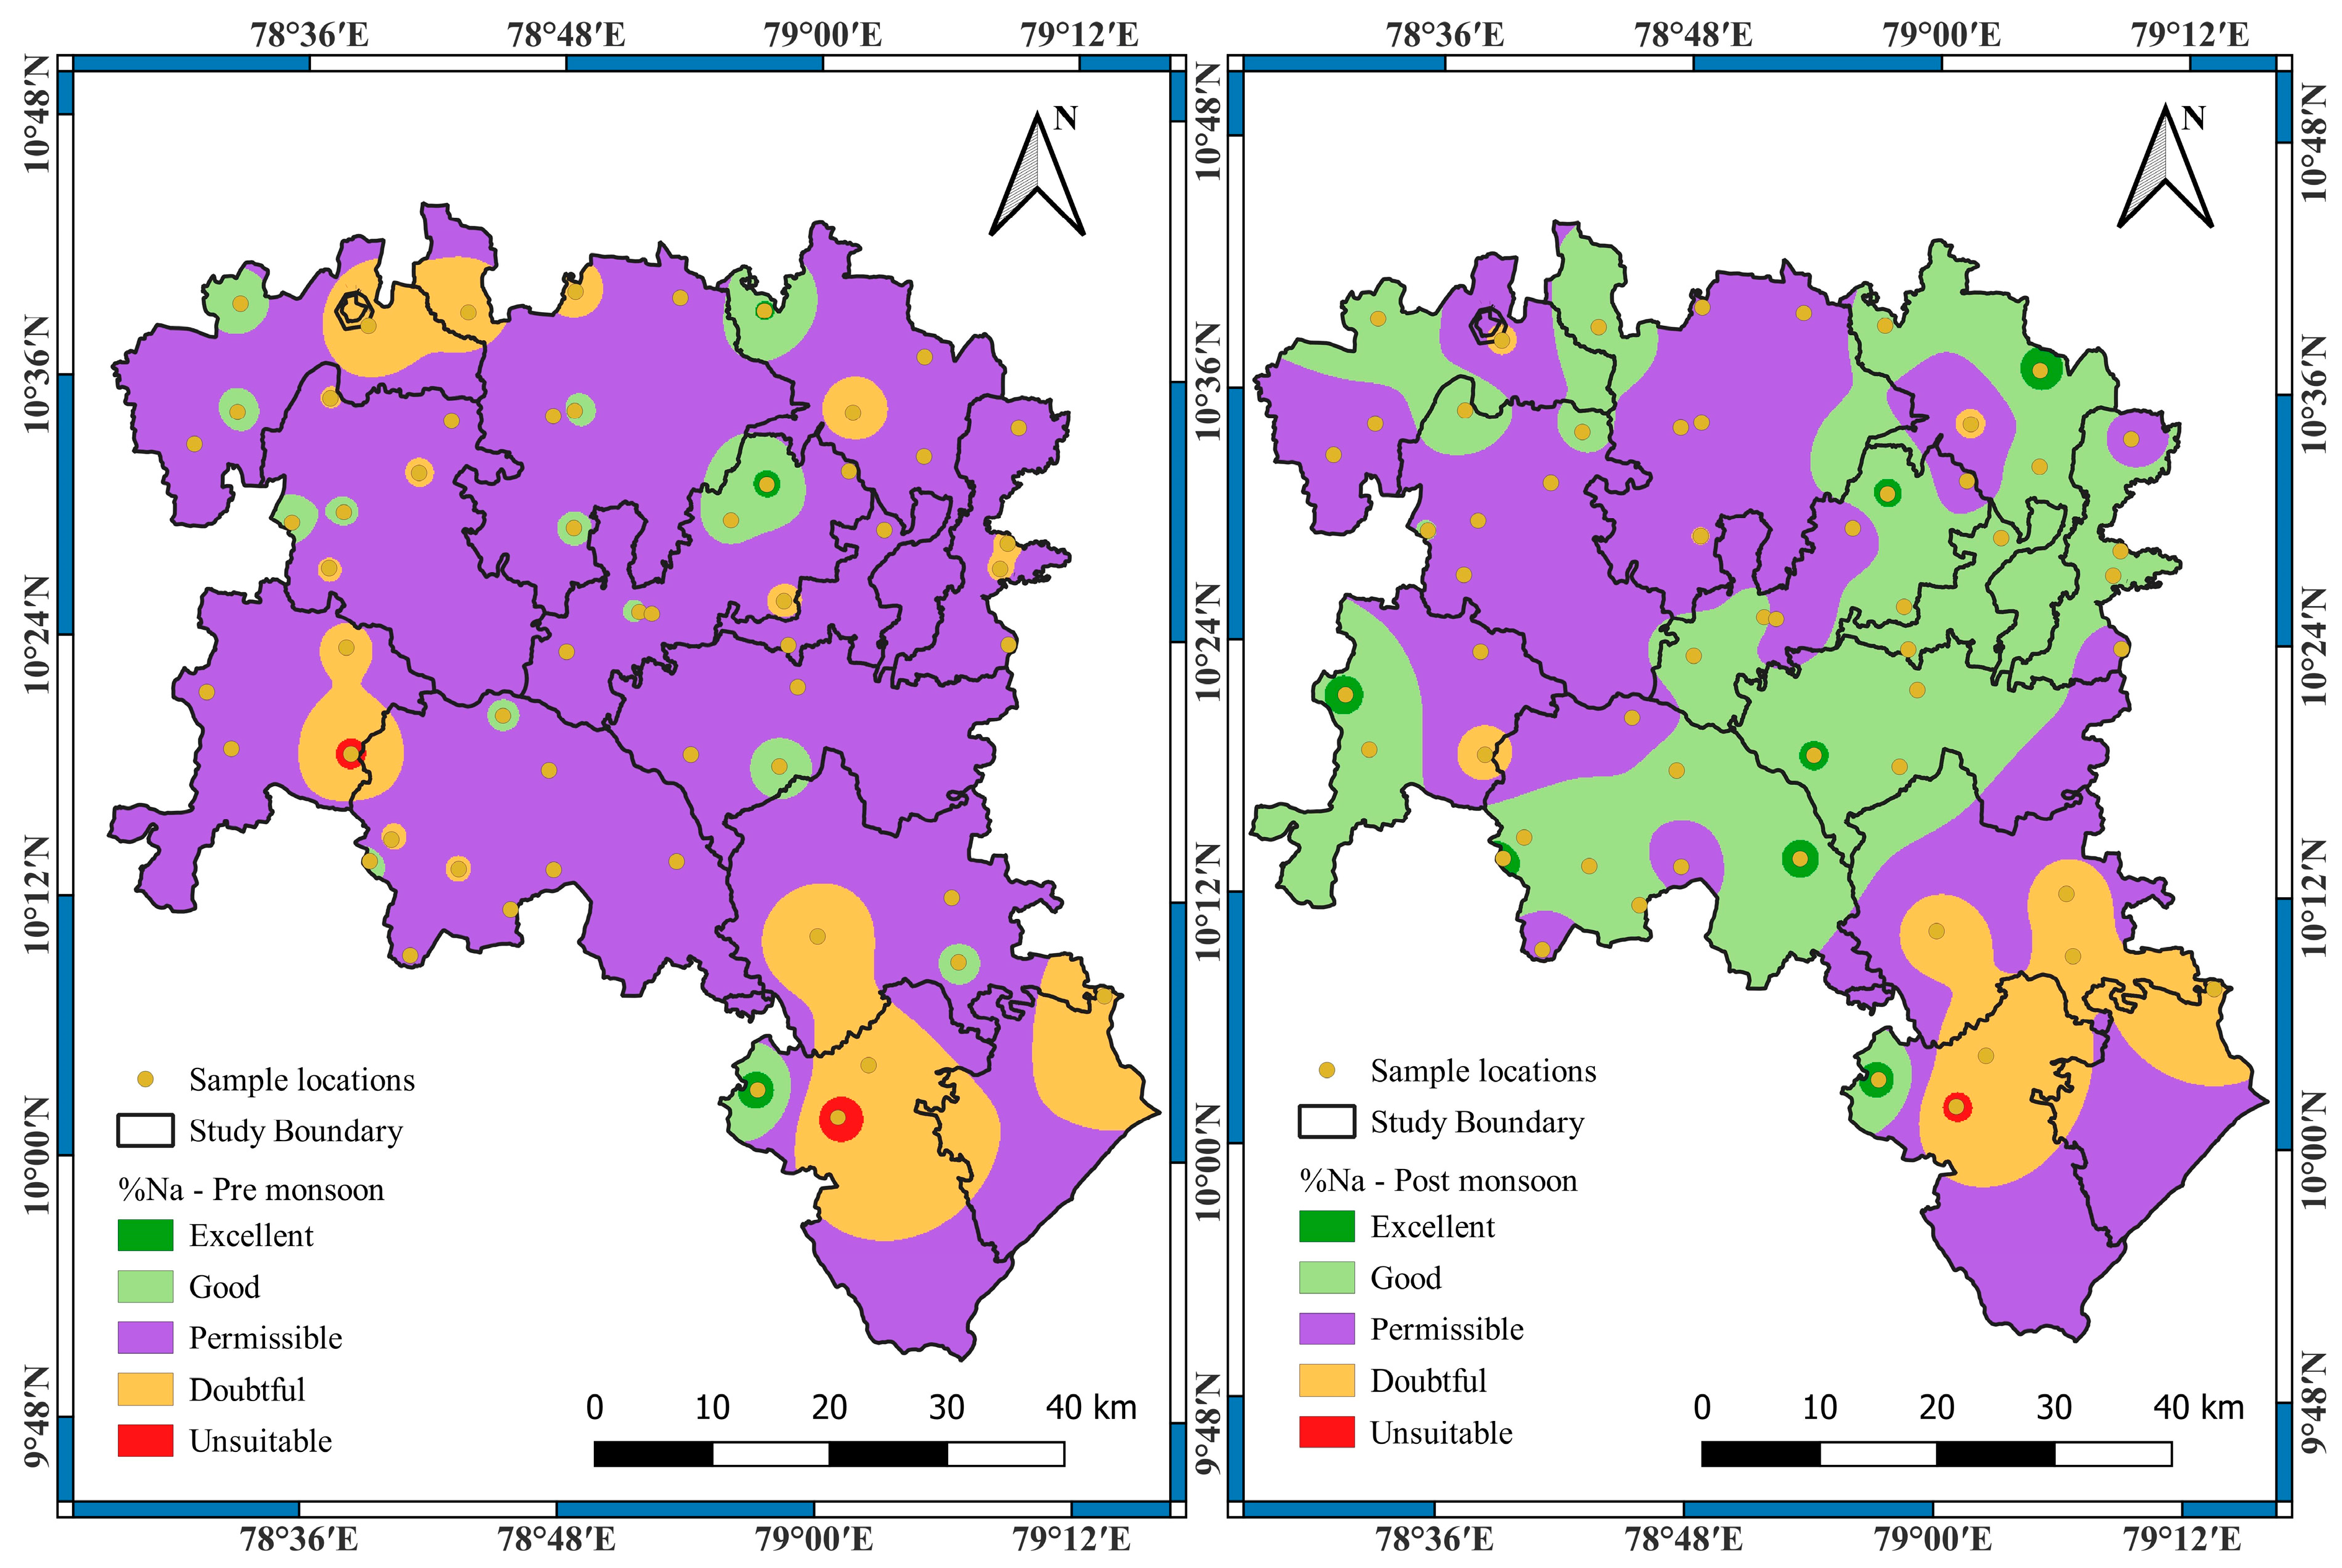
| Percent sodium (%Na) | ||||||
| 0 to 20 | 10 | 17.86 | 2 | 3.57 | Excellent | −14.29 |
| 20 to 40 | 18 | 32.14 | 13 | 23.21 | Good | −8.93 |
| 40 to 60 | 15 | 26.79 | 22 | 39.29 | Permissible | 12.50 |
| 60 to 80 | 13 | 23.21 | 16 | 28.57 | Doubtful | 5.36 |
| Greater than 80 | 0 | 0 | 3 | 5.36 | Unsuitable | 5.36 |
| Residual sodium carbonate (RSC) | ||||||
| Less than 1.25 | 51 | 91.07 | 46 | 82.14 | Satisfactory | −8.93 |
| 1.25 to 2.5 | 3 | 5.36 | 4 | 7.14 | Marginal | 1.78 |
| Greater than 2.5 | 2 | 3.57 | 6 | 10.71 | Un-Satisfactory | 7.14 |
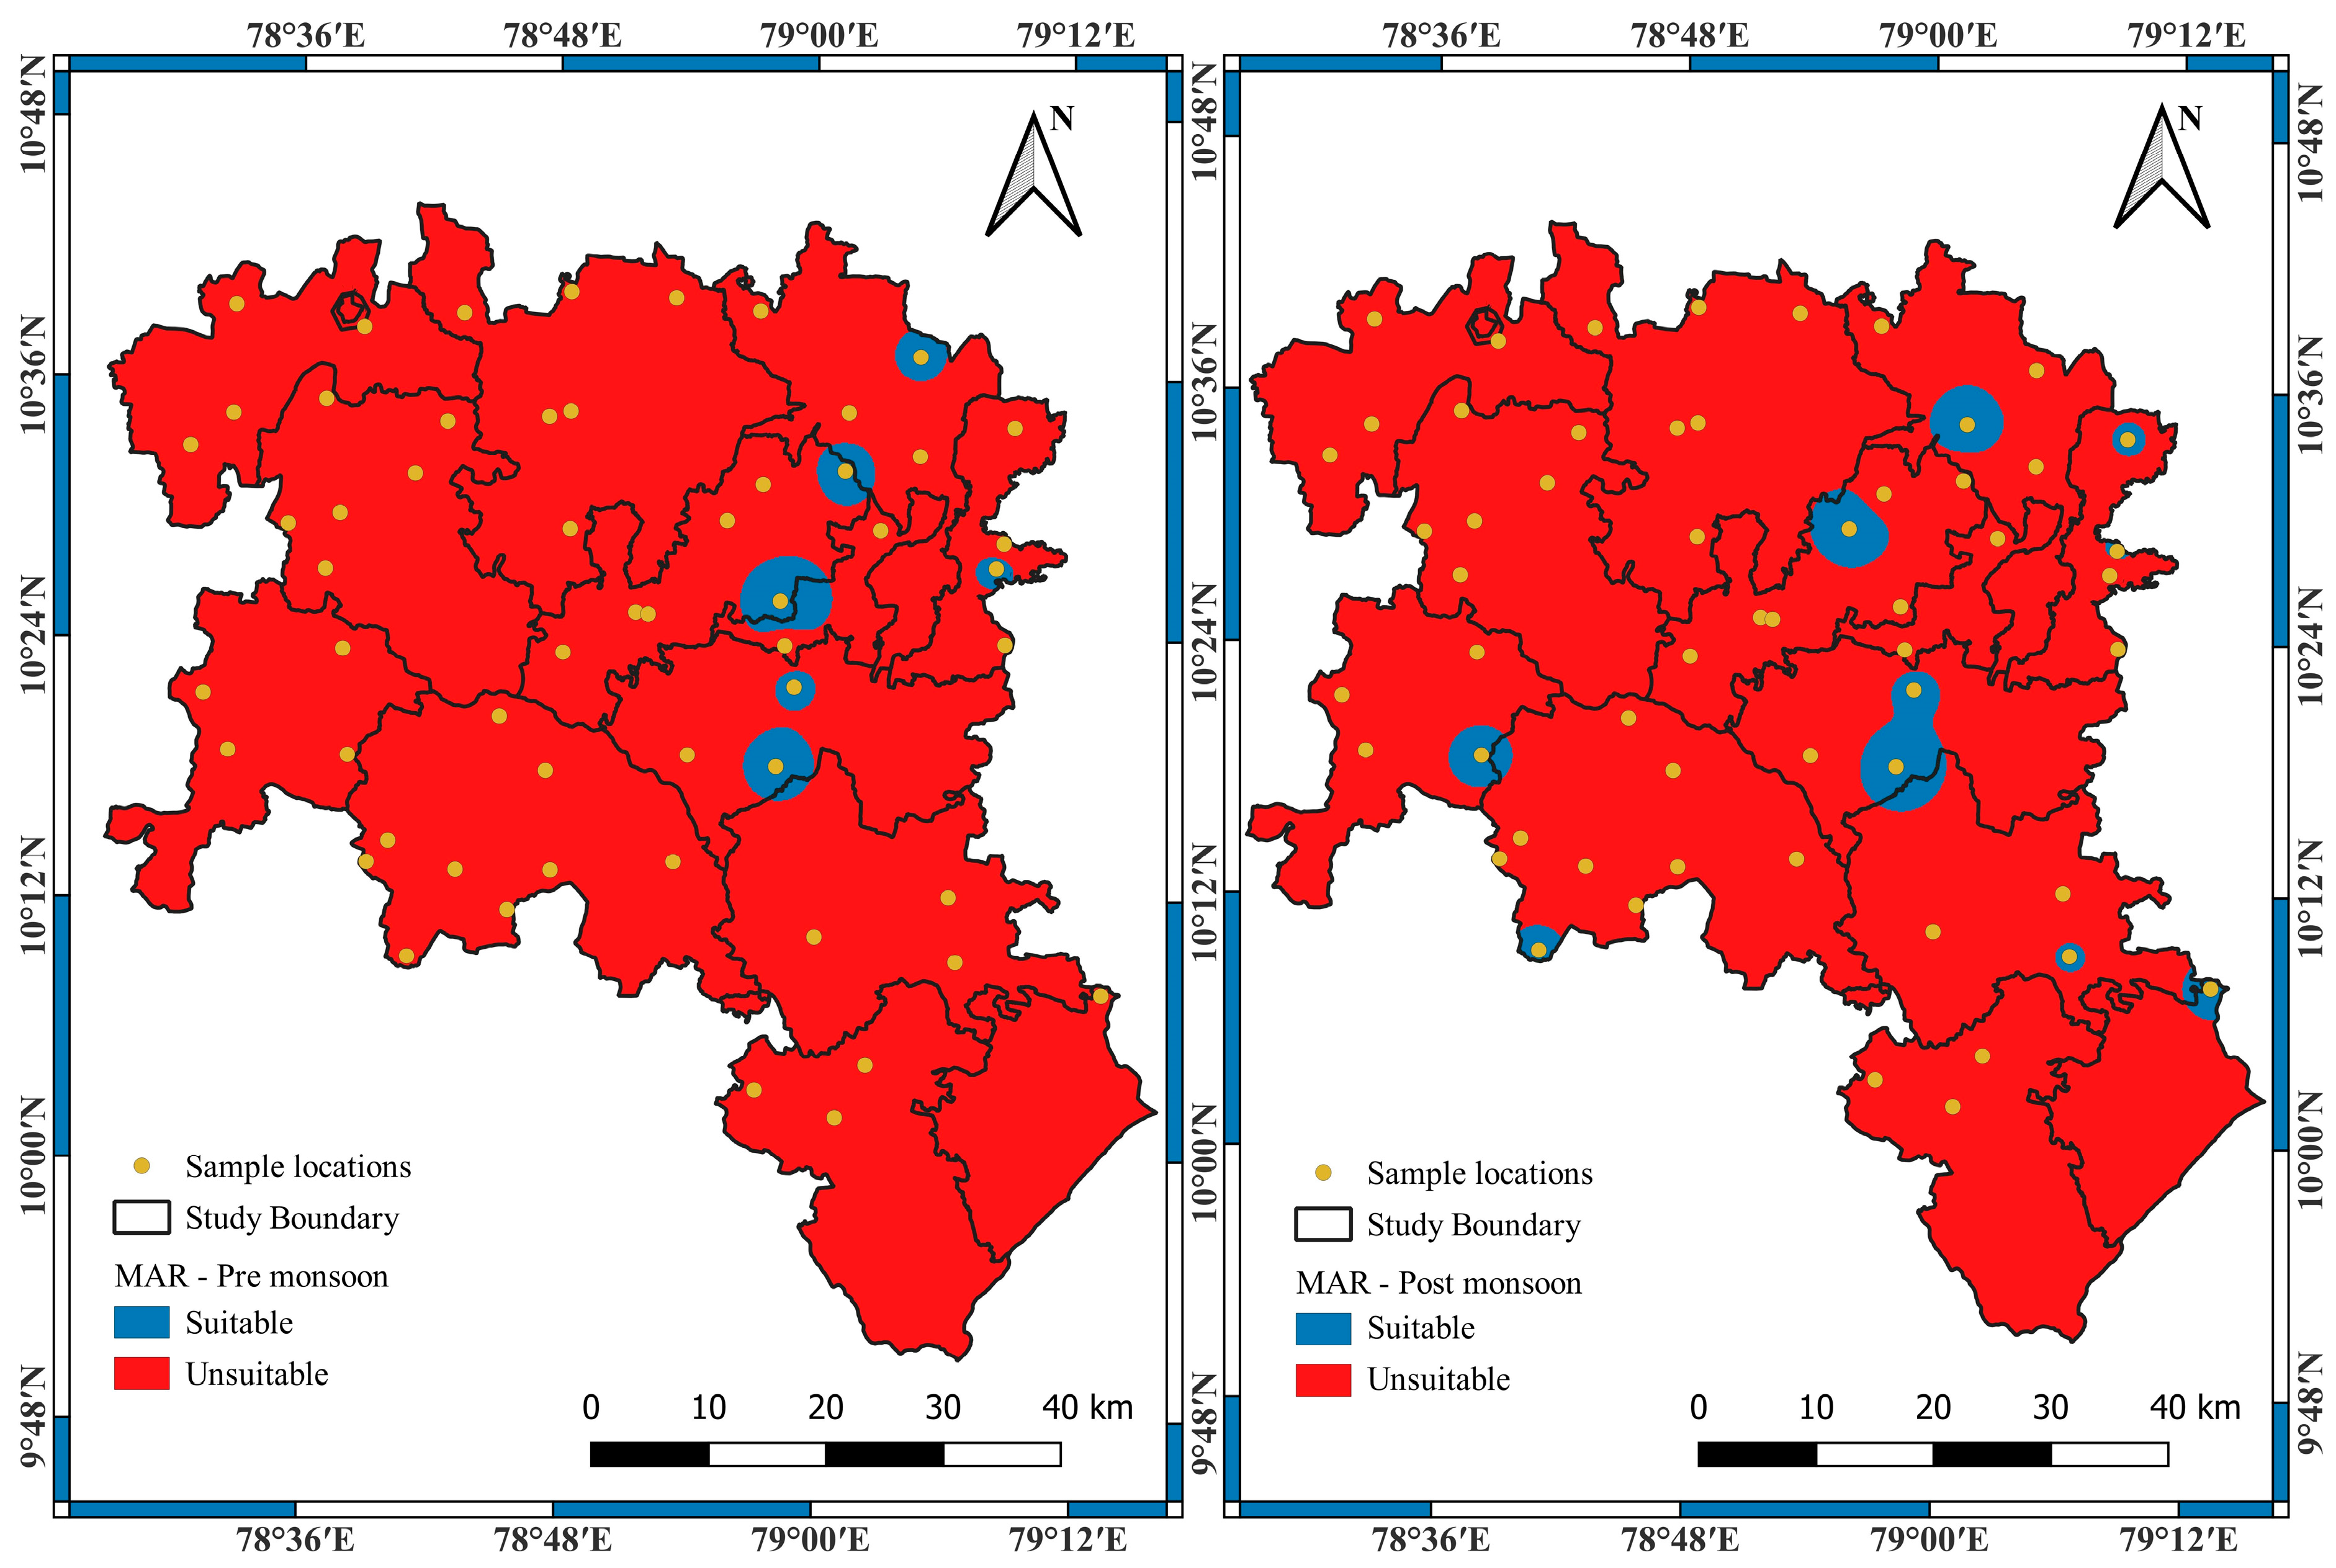
| Magnesium absorption ratio (MAR) | ||||||
| Less than 50 | 10 | 17.86 | 6 | 10.71 | Suitable | −7.15 |
| Greater than 50 | 46 | 82.14 | 50 | 89.29 | Unsuitable | 7.15 |
| Permeability index (PI) | ||||||
| Greater than 75 | 41 | 73.21 | 25 | 44.64 | Class I | −28.57 |
| 75 to 25 | 14 | 25 | 31 | 55.36 | Class II | 30.36 |
| Less than 25 | 1 | 1.79 | 0 | 0 | Class III | −1.79 |
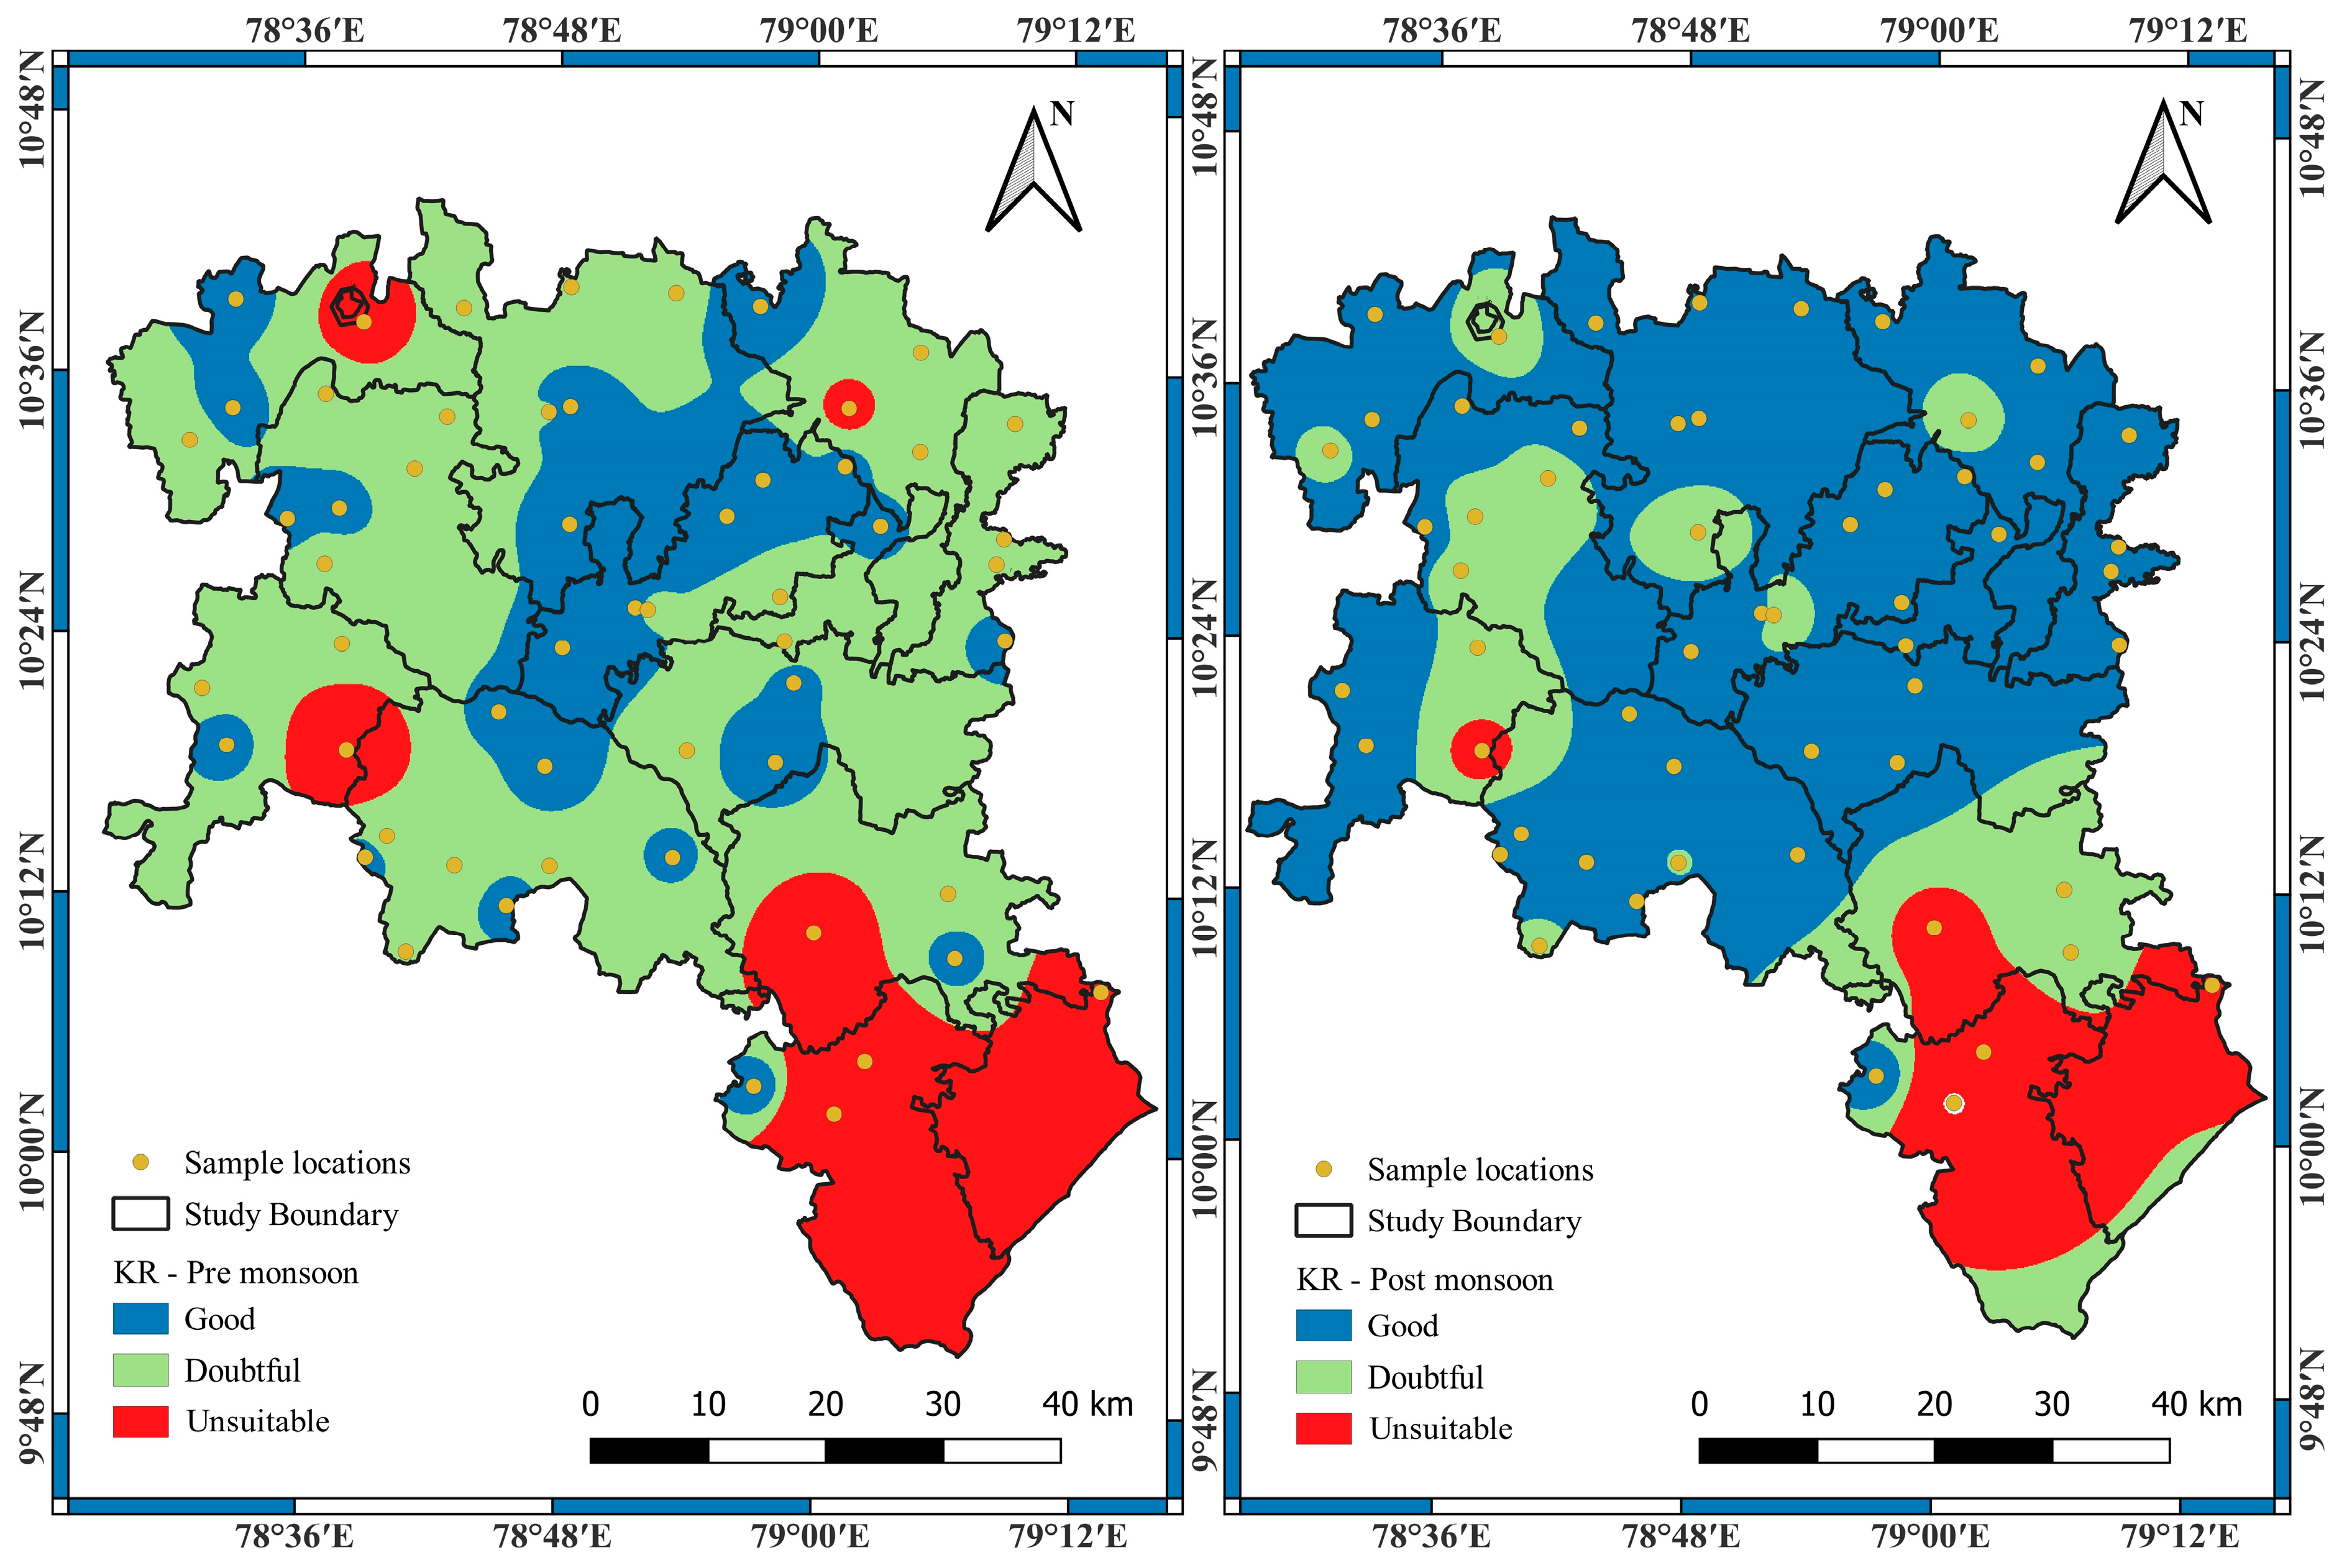
| Kelly’s ratio (KR) | ||||||
| Less than 1 | 37 | 66.07 | 23 | 41.07 | Good | −25.00 |
| 1 to 2 | 13 | 23.21 | 26 | 46.43 | Doubtful | 23.22 |
| Greater than 2 | 6 | 10.71 | 7 | 12.5 | Unsuitable | 1.79 |
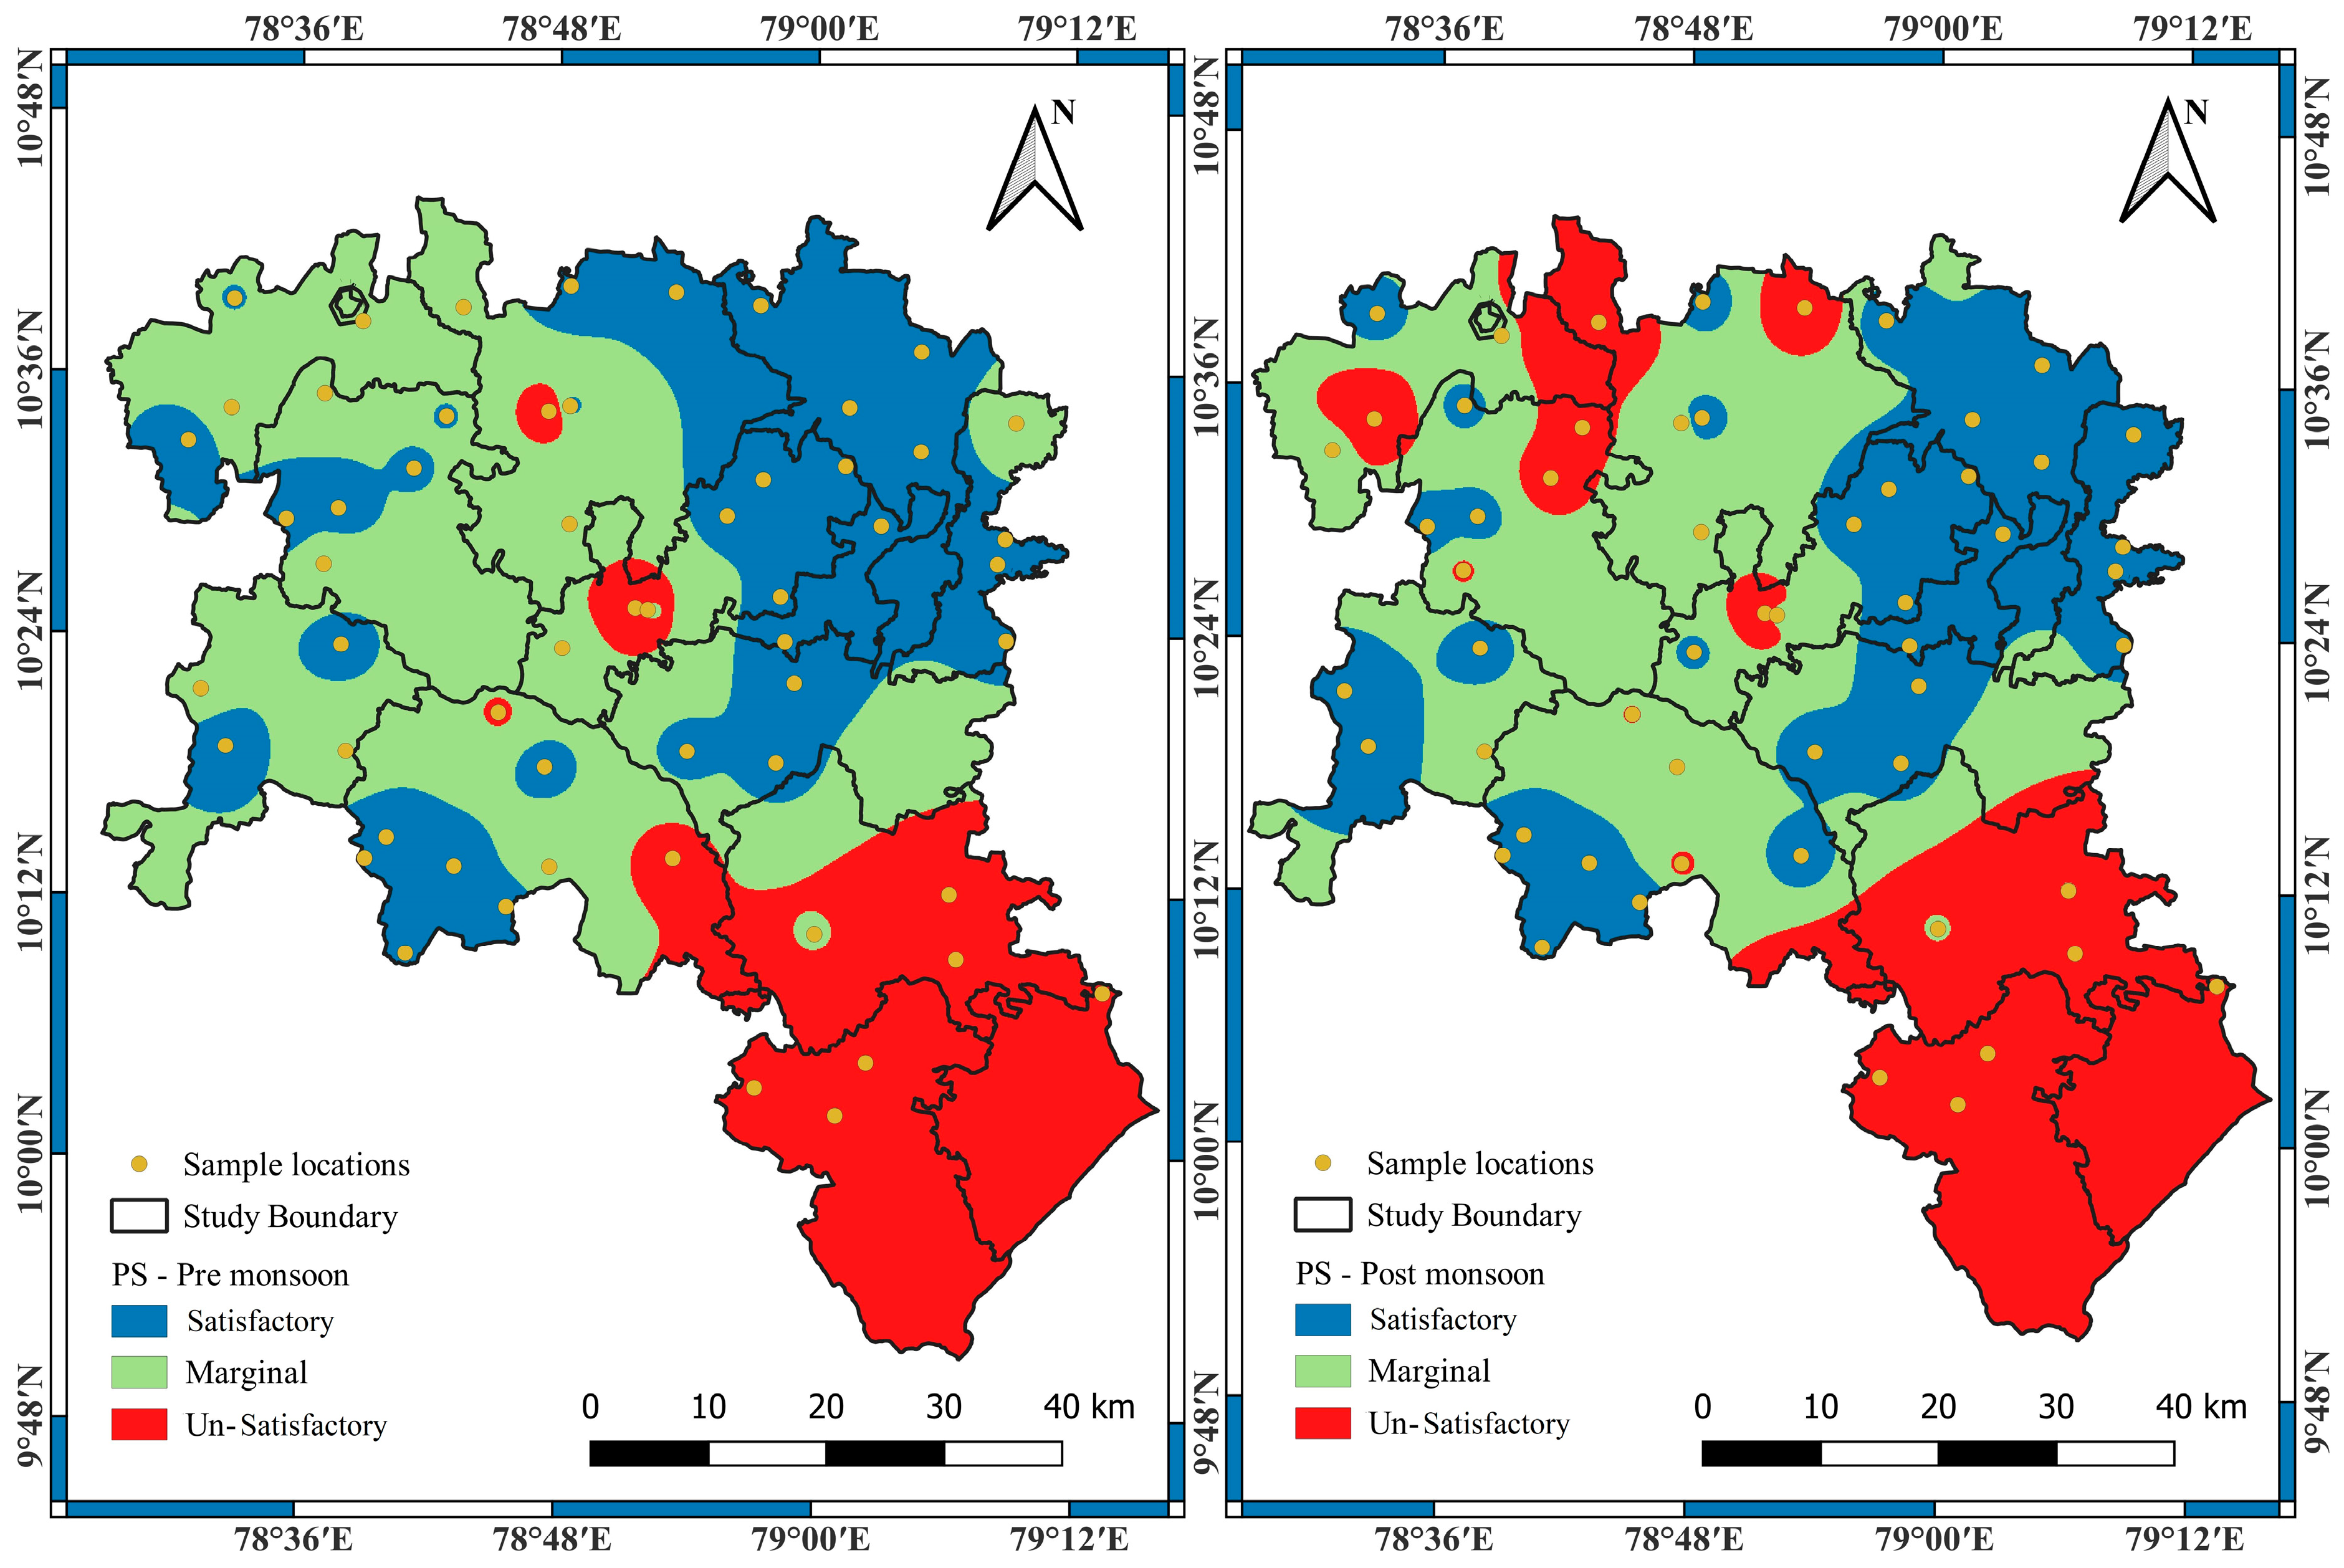
| Potential salinity (PS) | ||||||
| Less than 5 | 33 | 58.93 | 35 | 62.5 | Good | 3.57 |
| 5 to 10 | 9 | 16.07 | 12 | 21.43 | Doubtful | 5.36 |
| Greater than 10 | 14 | 25 | 9 | 16.07 | Unsuitable | −8.93 |
| Chloride Concentration (mg/L) | Pre Monsoon | Post Monsoon | Water Class | ||
|---|---|---|---|---|---|
| Sample Count | Sample % | Sample Count | Sample % | ||
| 0 to 300 | 38 | 67.86 | 41 | 73.21 | Class I |
| 300 to 700 | 13 | 23.21 | 10 | 17.86 | Class II |
| 700 to 900 | 0 | 0.00 | 1 | 1.79 | Class III |
| 900 to 1300 | 2 | 3.57 | 3 | 5.36 | Class IV |
| Above 1300 | 3 | 5.36 | 1 | 1.79 | Class V |
| Range of ASI | Pre Monsoon | Post Monsoon | Water Uses | ||
|---|---|---|---|---|---|
| Sample Count | % Sample | Sample Count | % Sample | ||
| 0 to 50 | 26 | 46.43 | 17 | 30.36 | For all types of crops |
| 50 to 100 | 20 | 35.71 | 31 | 55.36 | For all types of crops |
| 100 to 150 | 6 | 10.71 | 2 | 3.57 | Crops with low and medium salt tolerance |
| 150 to 200 | 2 | 3.57 | 3 | 5.36 | Crops with medium and high salt tolerance |
| GT 200 | 2 | 3.57 | 3 | 5.36 | Unsuitable for all crops |
| Rotated Component Matrix | |||||||
|---|---|---|---|---|---|---|---|
| Parameter/Component | Pre Monsoon | Post Monsoon | |||||
| 1 | 2 | 3 | 4 | 1 | 2 | 3 | |
| pH | −0.353 | 0.771 | −0.190 | −0.387 | −0.069 | 0.689 | −0.539 |
| Total dissolved solids | 0.908 | 0.028 | 0.404 | 0.072 | 0.981 | 0.055 | 0.168 |
| EC | 0.908 | 0.033 | 0.405 | 0.073 | 0.982 | 0.060 | 0.119 |
| Total hardness | 0.978 | −0.064 | 0.120 | 0.106 | 0.950 | −0.078 | 0.218 |
| Ca2+ | 0.971 | −0.065 | 0.147 | 0.006 | 0.871 | −0.131 | 0.363 |
| Mg2+ | 0.951 | −0.061 | 0.099 | 0.166 | 0.955 | −0.063 | 0.177 |
| Na+ | 0.197 | 0.192 | 0.956 | 0.043 | 0.951 | 0.145 | 0.119 |
| K+ | 0.712 | 0.043 | 0.204 | 0.113 | 0.399 | 0.104 | −0.137 |
| Cl− | 0.622 | −0.064 | 0.756 | 0.049 | 0.989 | −0.041 | 0.089 |
| SO42− | 0.987 | −0.023 | 0.015 | 0.026 | 0.686 | 0.148 | 0.530 |
| CO32− | −0.070 | 0.896 | 0.234 | −0.209 | −0.004 | 0.896 | −0.074 |
| HCO3− | 0.511 | 0.596 | 0.288 | 0.365 | 0.142 | 0.771 | 0.436 |
| NO3− | 0.084 | −0.070 | 0.039 | 0.938 | 0.183 | −0.028 | 0.775 |
| F− | 0.081 | 0.692 | −0.002 | 0.422 | 0.024 | 0.731 | −0.031 |
| Component | Pre Monsoon | Post Monsoon | ||||
|---|---|---|---|---|---|---|
| Total | % of Variance | Cumulative % | Total | % of Variance | Cumulative % | |
| 1 | 7.749 | 55.348 | 55.348 | 7.580 | 54.144 | 54.144 |
| 2 | 2.425 | 17.324 | 72.672 | 2.515 | 17.965 | 72.109 |
| 3 | 1.272 | 9.086 | 81.758 | 1.139 | 8.133 | 80.242 |
| 4 | 1.137 | 8.121 | 89.879 | 0.996 | 7.112 | 87.354 |
| 5 | 0.658 | 4.698 | 94.577 | 0.750 | 5.354 | 92.708 |
| 6 | 0.344 | 2.457 | 97.034 | 0.489 | 3.489 | 96.198 |
| 7 | 0.209 | 1.494 | 98.529 | 0.226 | 1.615 | 97.813 |
| 8 | 0.105 | 0.753 | 99.281 | 0.149 | 1.065 | 98.878 |
| 9 | 0.078 | 0.556 | 99.837 | 0.110 | 0.783 | 99.661 |
| 10 | 0.022 | 0.157 | 99.994 | 0.045 | 0.323 | 99.984 |
| 11 | 0.001 | 0.004 | 99.998 | 0.002 | 0.013 | 99.998 |
| 12 | 0.000 | 0.002 | 100.000 | 0.000 | 0.002 | 99.999 |
| 13 | 4.55 × 10⁻⁵ | 0.000 | 100.000 | 0.000 | 0.001 | 100.000 |
| 14 | −1.01 × 10⁻¹⁷ | −7.26 × 10⁻¹⁷ | 100.000 | 2.74 × 10⁻¹⁶ | 1.95 × 10⁻¹⁵ | 100.000 |
Disclaimer/Publisher’s Note: The statements, opinions and data contained in all publications are solely those of the individual author(s) and contributor(s) and not of MDPI and/or the editor(s). MDPI and/or the editor(s) disclaim responsibility for any injury to people or property resulting from any ideas, methods, instructions or products referred to in the content. |
© 2024 by the authors. Licensee MDPI, Basel, Switzerland. This article is an open access article distributed under the terms and conditions of the Creative Commons Attribution (CC BY) license (https://creativecommons.org/licenses/by/4.0/).
Share and Cite
Kaliyappan, S.P.; Hasher, F.F.b.; Abdo, H.G.; Sajil Kumar, P.J.; Paneerselvam, B. A Novel Integrated Approach to Assess Groundwater Appropriateness for Agricultural Uses in the Eastern Coastal Region of India. Water 2024, 16, 2566. https://doi.org/10.3390/w16182566
Kaliyappan SP, Hasher FFb, Abdo HG, Sajil Kumar PJ, Paneerselvam B. A Novel Integrated Approach to Assess Groundwater Appropriateness for Agricultural Uses in the Eastern Coastal Region of India. Water. 2024; 16(18):2566. https://doi.org/10.3390/w16182566
Chicago/Turabian StyleKaliyappan, Shunmuga Priya, Fahdah Falah ben Hasher, Hazem Ghassan Abdo, Pazhuparambil Jayarajan Sajil Kumar, and Balamurugan Paneerselvam. 2024. "A Novel Integrated Approach to Assess Groundwater Appropriateness for Agricultural Uses in the Eastern Coastal Region of India" Water 16, no. 18: 2566. https://doi.org/10.3390/w16182566