Abstract
As one of the biggest ports, the aquatic ecology of Shanghai Port has a significant impact on the health of surrounding residents and aquatic animals. Therefore, this study explored the composition and distribution of bacteria, pathogens, and ARGs at Shanghai Ports by high-throughput sequencing. The results showed that the bacterial community was dominated by the Proteobacteria at the phylum level. With the refinement of classification level, the main composition of bacteria in different samples shows significant differences. In contrast, there was no significant difference in the composition and distribution of pathogens among the samples. It indicates that pathogens and ARGs have steady community composition at Shanghai Port. Pseudomonas aeruginosa and Salmonella enterica could be regarded as candidate indicator pathogens. macB, tetA (58), and evgS were the main ARGs, and they showed a close relationship with Mycobacterium tuberculosis, Magnaporthe oryzae, Streptococcus pneumonia, Xanthomonas oryzae, and Vibrio cholerae in different sites and layers. This may lead to the transfer of ARGs between different pathogens, resulting in more threatening pathogens. The results showed that the pathogens and ARGs present posed a risk of transmission and were potentially harmful to residents in the environment. They can spread to any other ports in the world through the transmission of ballast water, posing a threat to humans and local ecology. In order to keep human health, it is necessary to pay more attention to the water environment of ports and increase the monitoring. Furthermore, it is essential to strengthen the supervision of external source pollution input due to the special features of the port.
1. Introduction
Estuarine and coastal areas have the most productive and diverse ecosystems because of their unique geographical location where land and ocean, freshwater and saltwater interconnect [1,2]. Ports and their estuaries or harbors usually play a key role in coastal regions and countries for developed and developing countries [3]. With the development of the world economy, the rapid urbanization and industrialization became threatening the coastal ecology in coastal areas around the world [4]. Marine and fresh water in port areas are usually polluted due to port activities for a long time [5]. Therefore, it is crucial to study the distribution and composition of microorganisms in ports. Pathogens, including pathogenic bacteria, are critical to ecosystems in coastal areas as they play an important role in controlling and regulating the community structure of microorganisms and nutrient cycling.
As an important part of the pelagic microbial planktonic in aquatic environments, bacteria have a direct effect on biogeochemical cycles and trophic dynamics in the ocean [6]. Furthermore, bacteria can affect the community structure of phytoplankton in the aquatic environment by regulating the abundance of specific phytoplankton [7]. Bacterial structure and function are easily influenced by human activities, so bacteria have always been used for decades as an indicator of anthropogenic perturbations that affect aquatic environments [8,9]. The characteristics of bacterial communities in marine ecology vary greatly depending on geographical location [10], and there is a close relationship between environmental parameters and bacterial community structure [11,12].
Some pathogens play a particular role in the ecological environment. Pathogens in the water environment can cause significant damage to fisheries, aquaculture, and ecosystems [13]. Pathogens can not only influence the structure and stability of food webs [14] but are also critical to ecosystems because they can regulate their host densities and affect the circulation of nutrients [15]. The changes in pathogen abundance can influence ecosystems, community structures, and aquaculture by influencing the host population [16]. For example, as one of the most profitable fisheries in America, the Southern New England lobster stock has significantly decreased due to the impact of epizootic shell disease [17]. In addition, the significant decline of the long-spined sea urchin (Diadema antillarum) contributed to coral reef ecology deterioration in the region in the 1980s in the Caribbean [18,19]. In addition, pathogens are also an important issue for human health. People may contract gastrointestinal, respiratory, and other diseases by being exposed to bacteria and pathogens in the ocean [20]. According to the estimate, approximately 2.2 million people die caused by diseases (mainly acute gastroenteritis) transmitted by the water environment [21]. However, pathogens can sometimes play an essential role in the environment. For example, pathogens, including pathogenic bacteria, play a positive role in crippling and mitigating algal blooms by shifting natural plankton populations and accelerating plankton succession [7]. Parasites increased biodiversity through influencing energy flow and the structure of the food web on mudflats in New Zealand [22]. In forests of eastern North America, Cryphonectria parasitica has increased local diversity by controlling the abundance of dominant or codominant species (American chestnut) during the early to mid-1900s [23]. In recent years, antibiotic resistance genes (ARGs) have gradually received more attention as an emerging contaminant [24]. The abuse of antibiotics has caused widespread antibiotic residues in various natural environments. ARGs have been detected in various environments around the world, such as rivers [25], solids [26], air [27], lakes [28], ballast water [29], lake sediments [30], marine sediments [31], and so on. With the widespread use of antibiotics in various fields [32], the problem of bacterial resistance is becoming increasingly serious [33]. Even low concentrations of antibiotic residues can still cause selective pressure on bacteria in the environment, resulting in intensifying antibiotic resistance bacteria and producing ARGs [34]. Furthermore, antimicrobial residues have posed serious and potential harm for human health. For example, antimicrobial residues may be absorbed by the human body through the food chain [35]. As a new contaminant, ARGs might be more harmful to humans than the antibiotic residue due to their transmissibility [36]. According to relevant research’s conclusions, there were an estimated 4·95 million deaths associated with bacteria-carried ARGs, including 1·27 million deaths attributable to bacteria-carried ARGs in 2019 [37]. ARGs can spread between bacteria and pathogens through vertical gene transfer (VGT) and horizontal gene transfer (HGT), and these bacteria and pathogens can survive in the environment for several years [38].
As one of the world’s largest ports, Shanghai Port is facing enormous environmental pressure while promoting economic development. Therefore, elucidating the composition and distribution of bacteria, pathogens, and ARGs among different ports in Shanghai can be conducive to understanding the aquatic ecological environment of ports. In this study, we investigated abundance, diversity, and community composition of bacteria, pathogens, and ARGs through high-throughput sequencing. At the same time, the results of this study contribute to understanding the pollution of ARGs at Shanghai Ports. It will also provide important insights for the protection and management of port ecosystems.
2. Materials and Methods
2.1. Collection of River Water Samples
Water samples were collected from four ports in Shanghai from July to September 2023. The locations of ports are shown in Figure 1 and Table 1. Three samples were taken from the upper water (50 cm below the water surface, U), middle water (between the water surface and bottom, M), and bottom water (50 cm above the sediments, B) at each port. Each sampling site sampled 15 L of water and mixed it using an upright water collector, repeatedly three times. All water samples were stored in 1L sterile brown polyethylene bottles. All bottles were stored in polyethylene ice boxes at 4 °C and were quickly transported to the laboratory within 2 h.
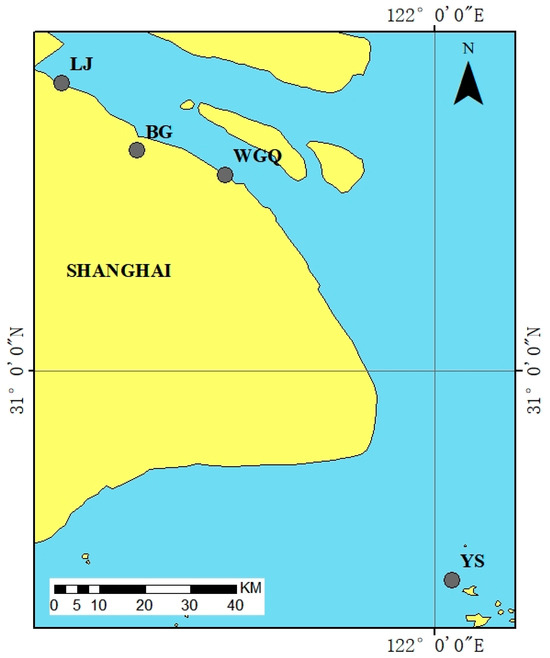
Figure 1.
Sampling sites at Shanghai Port.

Table 1.
Shanghai Port sampling site information.
2.2. Preparation of Water Samples
Water samples of 1 L each were filtered by a 3 μm sterilized filter membrane to remove the large-sized organism and impurities. Then, the filtered water was filtered using a 0.22 μm polycarbonate membrane to collect bacteria. Moreover, 0.22 μm membranes were transferred using sterile forceps into 1.5 mL centrifuge tubes and sent to a commercial laboratory (Guangzhou Meige Co., Ltd., Guangzhou, China) for high-throughput metagenomic sequencing with the Illumina HiSeq 2500 platform (Illumina, CA, USA).
2.3. High-Throughput Metagenomic Sequencing
DNA extraction was performed using the ALFA-SEQ Fast Magnetic Bacteria DNA Kit (FINDROP, Guangzhou, China) according to instructions. The ultra-micro spectrophotometer (Nanodrop 2000c; Thermo, Waltham, MA, USA) was used to measure the concentration and purity of DNA according to the rate of absorbance at different wavelengths.
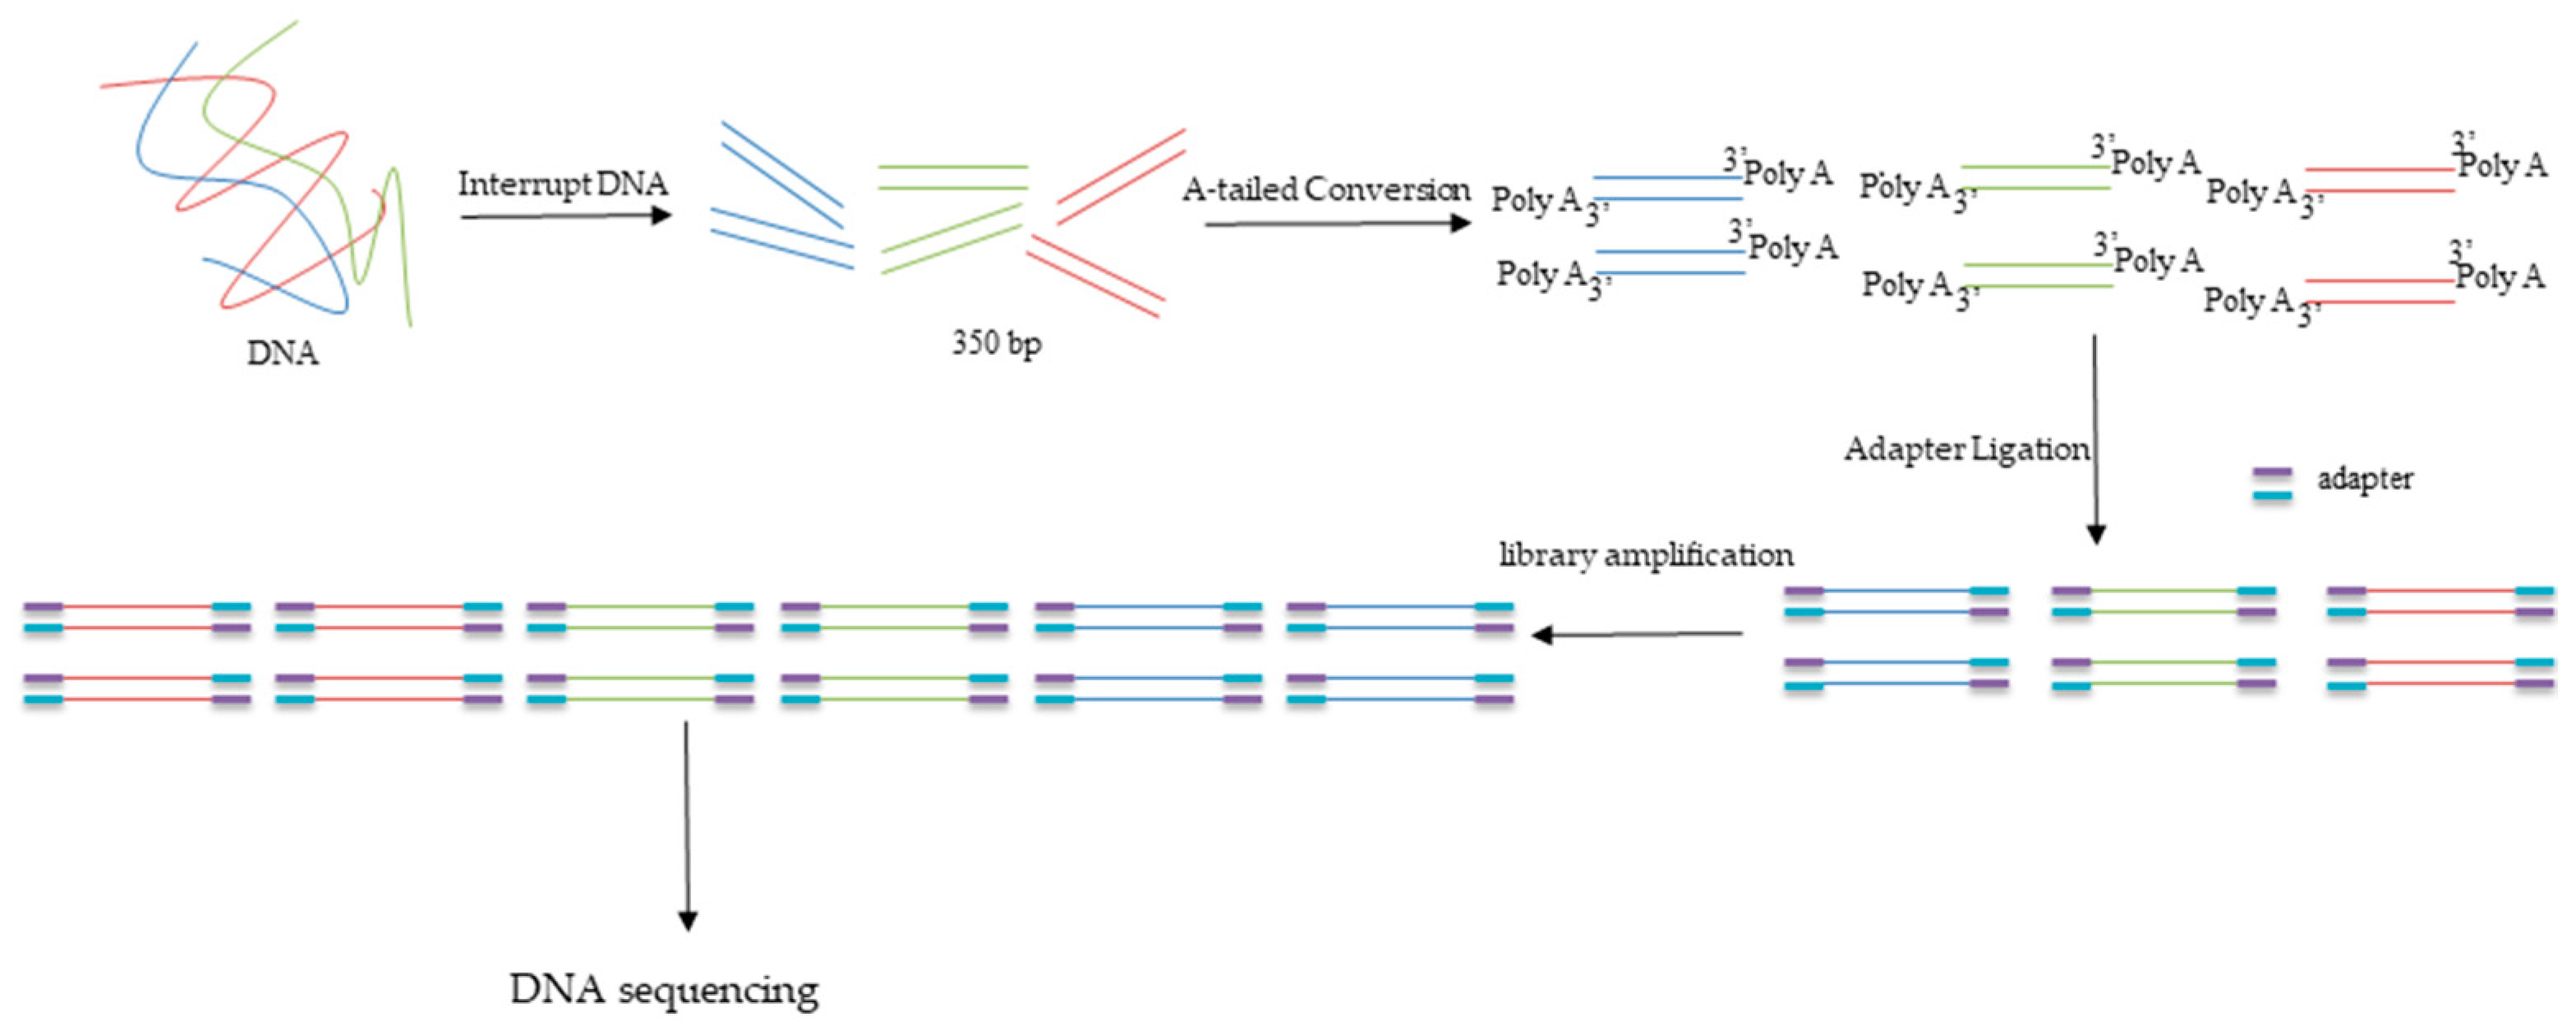
The qualified DNA samples were used to construct a DNA library by using the ALFA-SEQ DNA Library Prep Kit (FINDROP, Guangzhou, China). The DNA was randomly interrupted into 350 bp fragments after adding fragment buffer using Covaris R230 (Covaris, Woburn, MA, USA). The fragments were used to build libraries after A-tailed conversion, adapter ligation, post-ligation cleanup, library amplification, and post-PCR cleanup. The diagram was shown in Figure 2. Approximately 15 Gb of sequencing data were sequenced from every DNA sample.
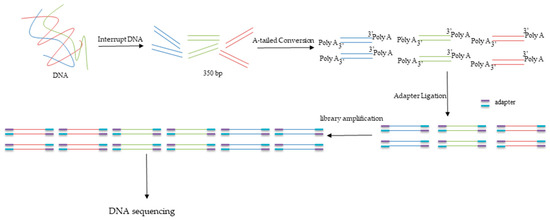
Figure 2.
Schematic diagram of DNA library construction.
To ensure and control the quality and reliability of sequencing results, Trimmomactic (LEADING: 3 TRAILING: 3 SLIDINGWINDOW: 5:20 MINLEN: 50) was used to control the data quality, where “LEADING: 3” represents the removal data’s basic group quality score at 5′ end less than 3; “TRAILING: 3” represents the removal data’s basic group quality score with at 3′ end less than 3; “SLIDINGWINDOW: 5:20” represents the removal data’s average quality score less than 20 for any 5 base pairs from the 5′ end to the 3′ end; “MINLEN: 50” represents the removal data less than 50 bp. The quality score (Q) was calculated by Formula (1) as follows:
where “P” is probability of base group recognition errors.
The software MEGAHIT (Version 1.1.3) (https://github.com/voutcn/megahit, accessed on 10 February 2024) was used to assemble these qualified data by setting parameters (k-mer: min 35, max 95, step 20). These assembled data were called Scafflods, and they were broken from N linkage to obtain Scaftigs. Scaftigs were removed if it was shorter than 500 bp, and they were used to predict the open reading frames (ORFs) by Prodiagl (https://github.com/hyattpd/Prodigal, accessed on 10 February 2024). The clean reads were mapped to the ORFs to obtain the number and length of ORFs. Linclust [39] was used to cluster genes and eliminate redundancy based on clean data and ORFs. The longest sequence served as the representative sequence in each cluster, and these sequences constitute the gene catalogs. The clean reads were mapped to the gene catalogs using bbmap software (Version 39.00) to obtain the number of clean data compared with per gene. The relative abundance of genes in the samples was calculated by Formula (2) as follows:
where “Gk” is the relative abundance of k gene; “rk” is the number of clean data compared with k gene; and “Lk” is the length of k gene.
Gene catalogs were mapped to the NCBI-NR database using Blast version 2.2.31++ (https://blast.ncbi.nlm.nih.gov/Blast.cgi, accessed on 10 February 2024) to classify species in samples at all levels. According to the Antibiotic Resistance Genes (ARDB) database and the Pathogen–Host Interactions (PHI) database, ARGs and pathogens were classified in samples.
2.4. Data Statistical Analysis
The relative abundance maps of bacteria and pathogens with clustering trees are plotted using R (V. 4.3.0) based on the Bray–Curtis metric. Analysis of Similarities (Anoism) was used to show the difference in sample sites. Alpha diversity of pathogens was assessed using the Shannon index. A bubble map was used to explore and visualize data of dominant pathogens and ARGs. Heatmaps were generated based on the percentages of ARGs in different samples using color changes to show abundance. The correlation between bacteria, pathogens, and ARGs was analyzed by Spearman’s correlation heatmap.
3. Results
3.1. High-Throughput Sequencing Results
In this study, the raw data of different sites (BG, WQG, LJ, YS) and different layers (U, M, B) were 15.88 ± 0.77 Gbp, 20.62 ± 6.71 Gbp, 21.12 ± 3.92 Gbp, 17.29 ± 3.21 Gbp, 20.15 ± 3.50 Gbp, 21.22 ± 6.11 Gbp, and 19.48 ± 5.56 Gbp, respectively. The clean data of BG, WQG, LJ, YS, U, M, and B were 11.96 ± 2.39 Gbp, 14.31 ± 2.94 Gbp, 14.62 ± 2.85 Gbp, 13.21 ± 1.13 Gbp, 12.59 ± 2.92 Gbp, 13.41 ± 3.84 Gbp, and 14.88 ± 2.59 Gbp. The effectives of BG, WQG, LJ, YS, U, M, and B were 69.25 ± 17.80, 67.91 ± 1.85, 71.57 ± 16.80, 74.13 ± 14.33, 64.21 ± 6.14, 64.71 ± 3.68, and 83.23 ± 13.47. The total number of Scaftigs at BG, WQG, LJ, YS, U, M, and B were 670,918 ± 151,331, 624,703 ± 144,363, 306,665 ± 38,778, 422,707.5 ± 46,925.5, 430,114 ± 98,023, 557,254.5 ± 211,811.5, and 545,068 ± 277,181. The lengths of the longest Scaftigs at BG, WQG, LJ, YS, U, M, and B were 184,714 bp, 687,021 bp, 402,585 bp, 943,574 bp, 943,574 bp, 598,874 bp, and 622,968 bp (Table 2). The information for each sample was shown in Table S1. The results of bacterial annotation, pathogen annotation, and ARG annotation were obtained through processing these data.
Table 2.
Information of high-throughput sequencing results.
3.2. Community Structure and Distribution of Bacteria
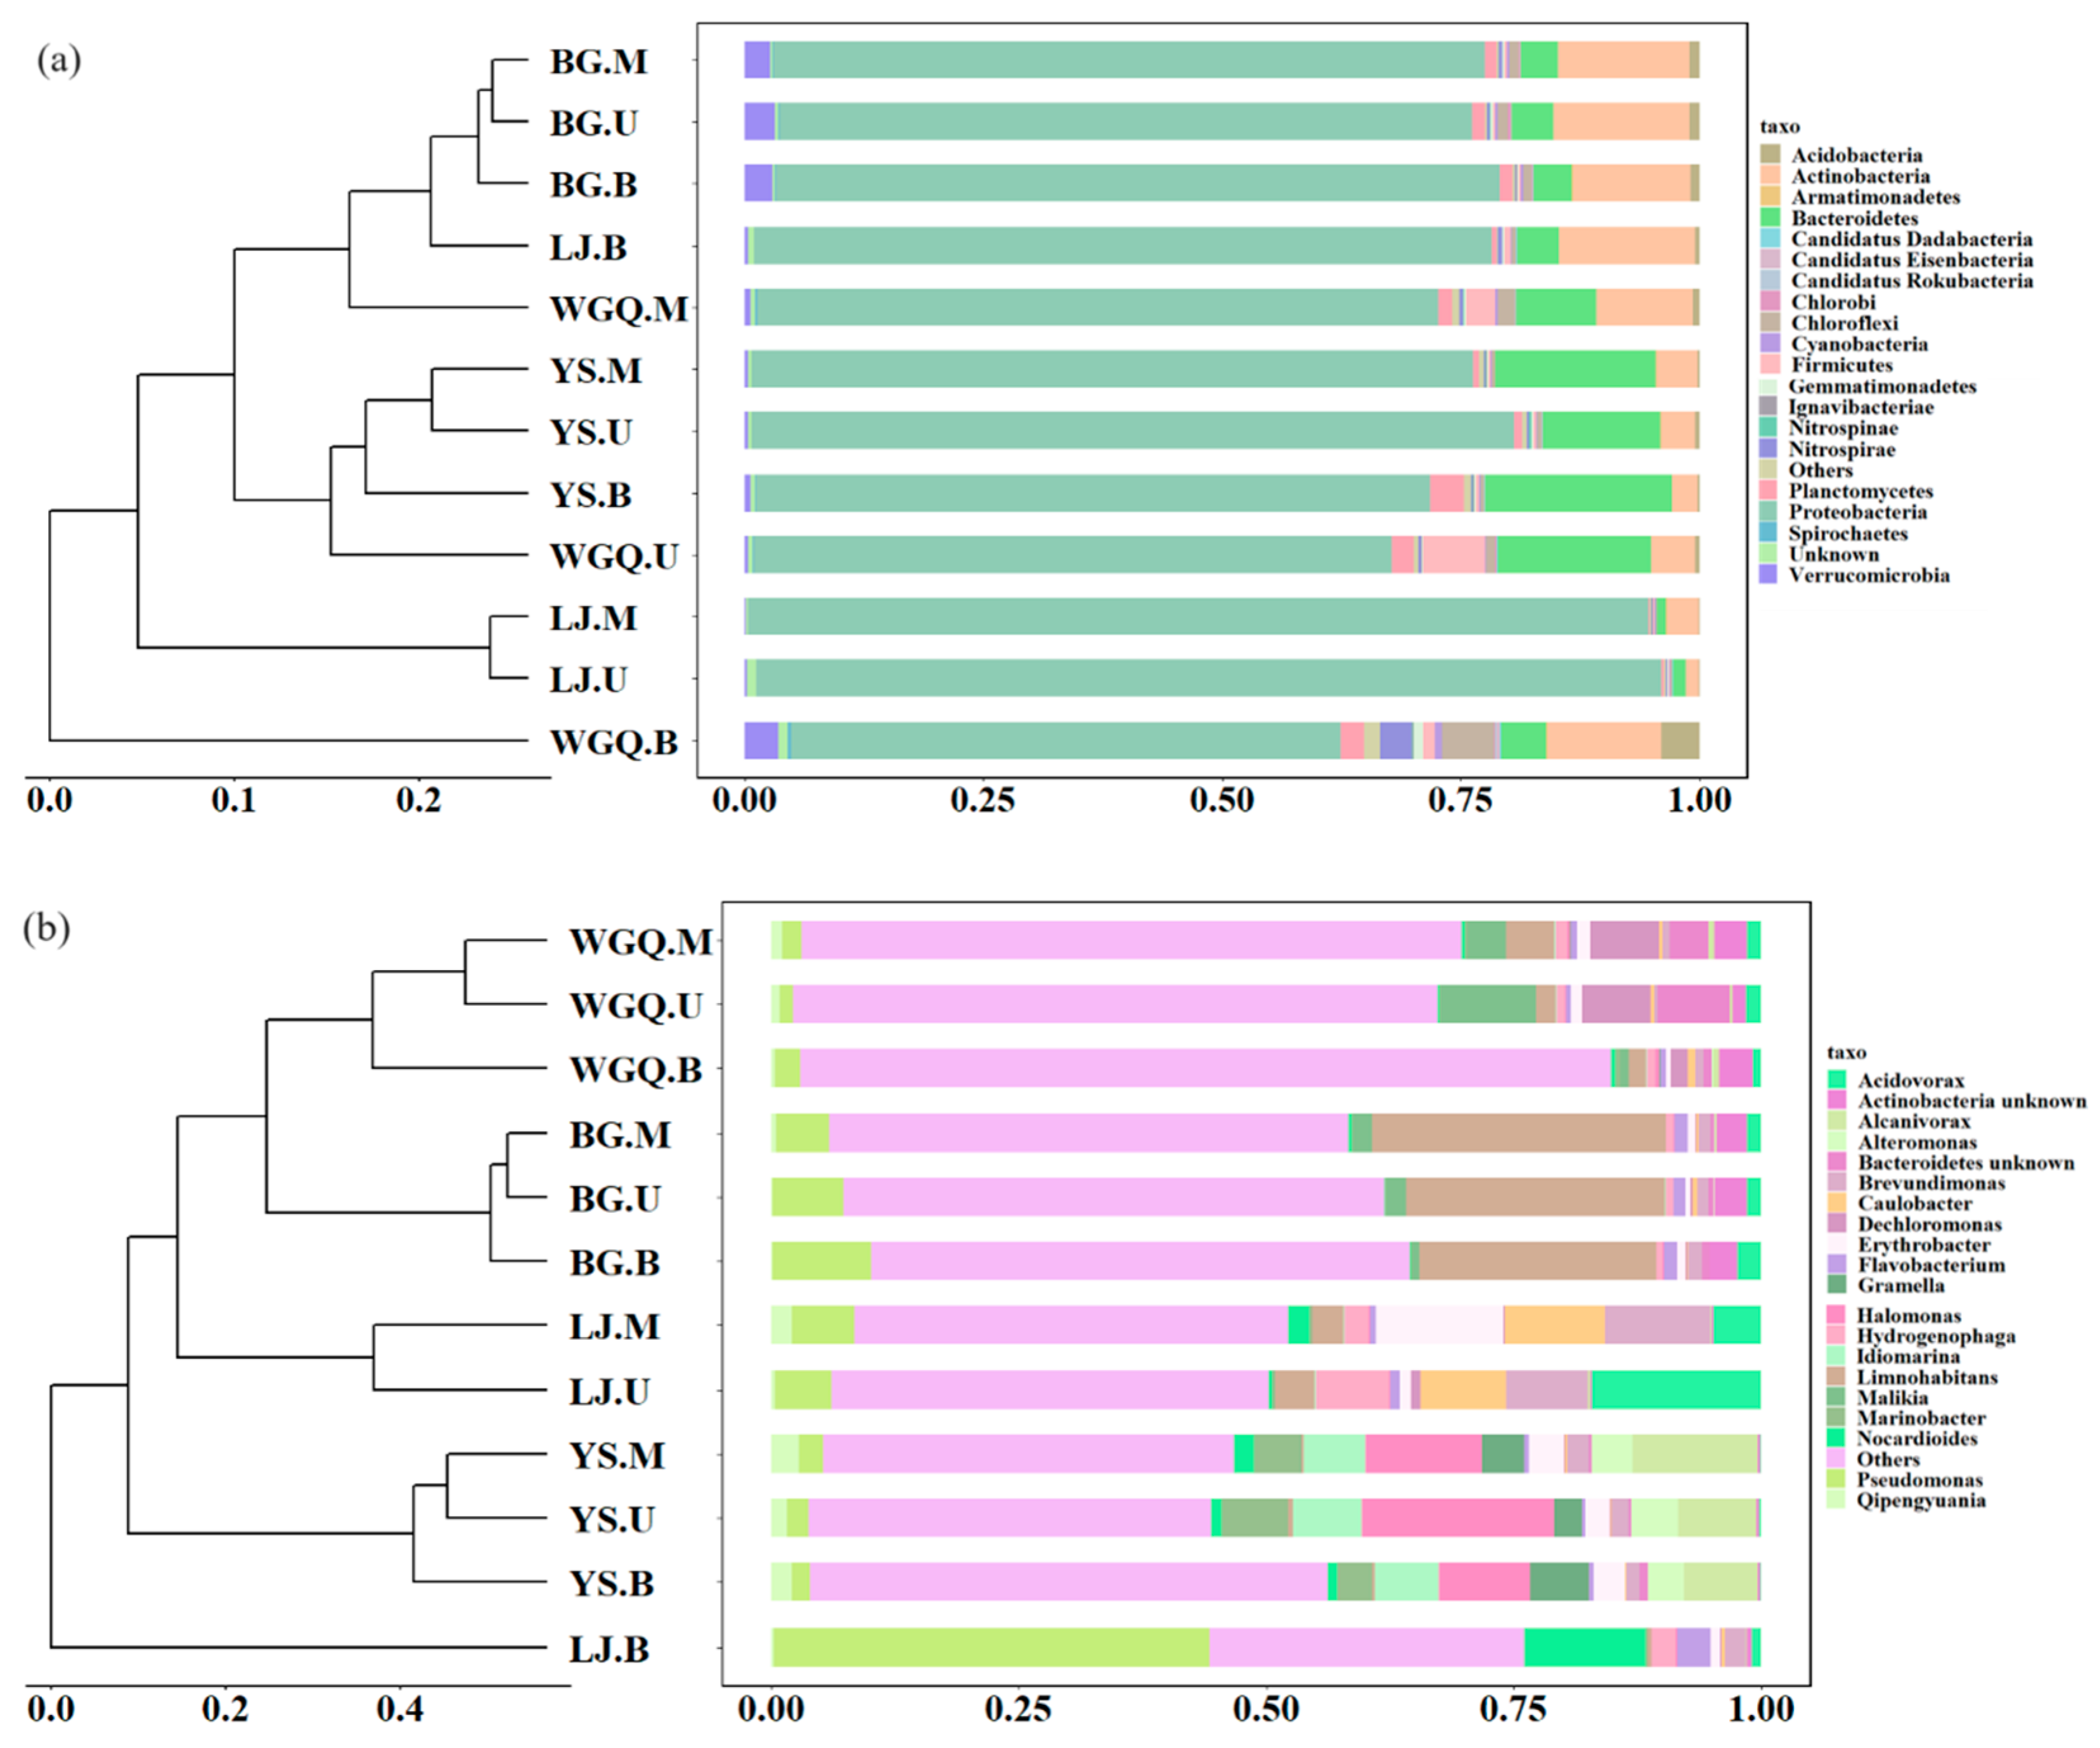
There are significant differences among different sites’ samples in the bacterial community at the phylum (Figure 3a) and genus (Figure 3b) level. The dominant phylum in all samples was Proteobacteria, accounting for over 50% of total bacterial abundance (Figure 3a). However, the relative abundance of Proteobacteria showed significant differences in different sites. Compared with the other three sites (71.52%), the relative abundance of Proteobacteria was significantly higher (88.72%) in LJ. In addition, except for Proteobacteria, Bacteroidetes had high abundance in YS (16.21%) and WGQ (9.74%) site samples, and Actinobacteria had high abundance in BG (13.38%) and WGQ (8.90%) site samples.
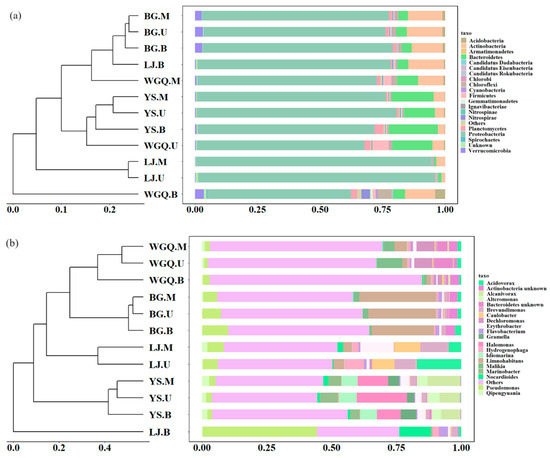
Figure 3.
Clustering analysis and relative abundance of the bacteria at phylum (a) and genus (b) level.
Most samples of the same site were gathered at the genus level according to clustering analysis (Figure 3b). From spatial distribution, the compositions of the bacterial community between U samples and M samples were similar but showed differences with B samples at the same site. The result of NMDS (Figure S2a) was in line with clustering analysis by dimensionality reduction analysis. The dominant genera were significantly different in four sites based on Anosim analysis (Figure S3). Pseudomonas sp. (7.49%) and Limnohabitans sp. (26.60%) were dominant genera in BG site, while Halomonas sp. (13.37%) and Alcanivorax sp. (9.32%) were dominant genera in YS site. However, the dominant bacteria genera varied in different water layers at WGQ and LJ sites. In WGQ.U, Malikia sp. (9.56%), Dechloromonas sp. (6.91%), and Bacteroidetes unknown sp. (7.32%) were significantly enriched. Dechloromonas sp. (6.99%) and Actinobacteria unknown sp. (3.47%) were the dominant genera in WGQ.M and WGQ.B, respectively. The LJ.U samples contained a relatively high abundance of Acidovorax sp. (17.20%), Brevundimonas sp. (8.28%), and Caulobacter sp. (8.57%). Brevundimonas sp. (10.68%), Erythrobacter sp. (12.87%), and Caulobacter sp. (10.96%) enriched in LJ.M. The relative abundances of Pseudomonas sp. (44.04%) and Nocardioides sp. (12.35%) were obviously higher than other samples in LJ.B.
Based on Bray–Curtis distance, the clustering tree was drawn, and the bar graph displayed the similarities and differences in bacteria composition among samples at phylum (Figure 3a), class (Figure S1a), genus (Figure 3b), and species (Figure S1b) levels. In the BG and YS sites, different layer samples were grouped together, indicating that there is no significant difference in bacteria composition in different layers of the BG and YS sites at the phylum (Figure 3a), class (Figure S1a), genus (Figure 3b), and species (Figure S1b) levels. Instead, different layer samples were not gathered together at different levels in the WGQ and LJ sites, indicating that depth might affect the composition of bacterial communities in the limited water depth of ports.
3.3. Diversity and Composition of Pathogens
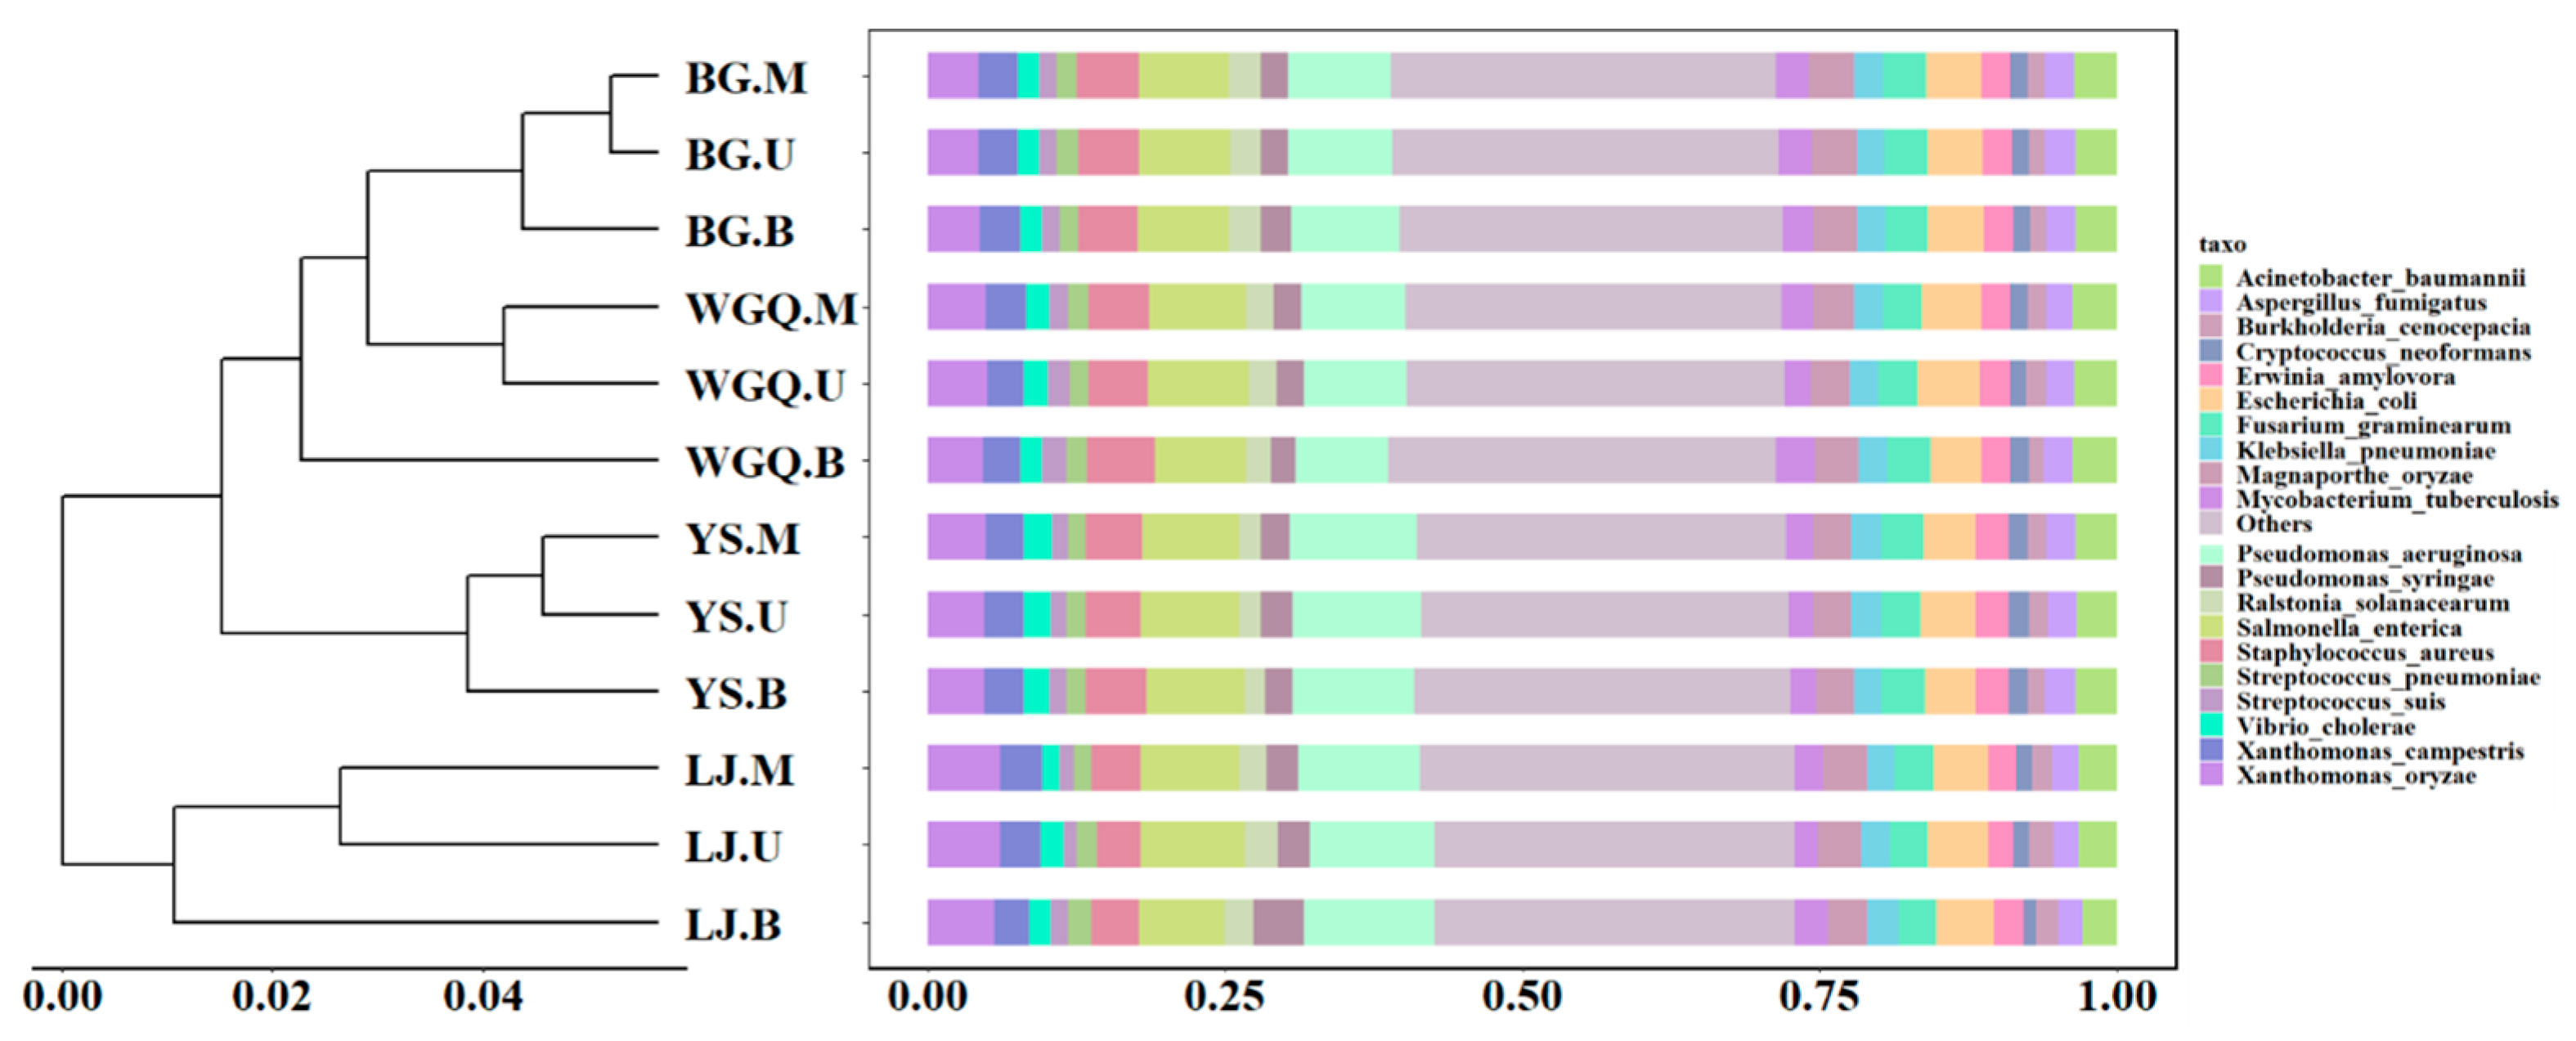
The annotation of pathogens was obtained by comparing clean data with the PHI database. A total of 215 pathogens were identified from all samples, and the number of pathogens varied at four sites. The number of pathogens at the BG (209) site was less than WGQ (215), LJ (214), and YS (214) sites. However, the composition of pathogens showed no significant difference among different sites and different layers according to the Bray–Curtis distance of the bar graph (Figure 4). The result of NMDS (Figure S2b) was consistent with clustering results. This result differed from the clustering results of bacteria, indicating that pathogens were not completely correlated with bacteria community composition at the same site. The dominant pathogens were Pseudomonas aeruginosa (9.59%), Salmonella enterica (8.01%), Xanthomonas oryzae (4.97%), Staphylococcus aureus (4.79%), and Escherichia coli (4.65%). Except for Xanthomonas oryzae, the other four dominant pathogens could infect human beings. Furthermore, Gammaproteobacteria occupied an important place in pathogens, and seven pathogens belonged to Gammaproteobacteria among the top 20 pathogens (Figure 4).
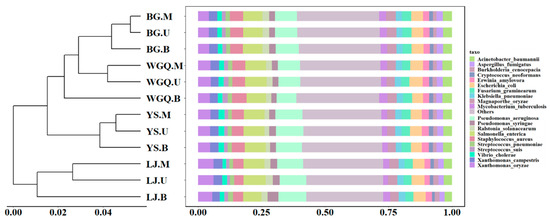
Figure 4.
Clustering analysis and relative abundance of the pathogens.
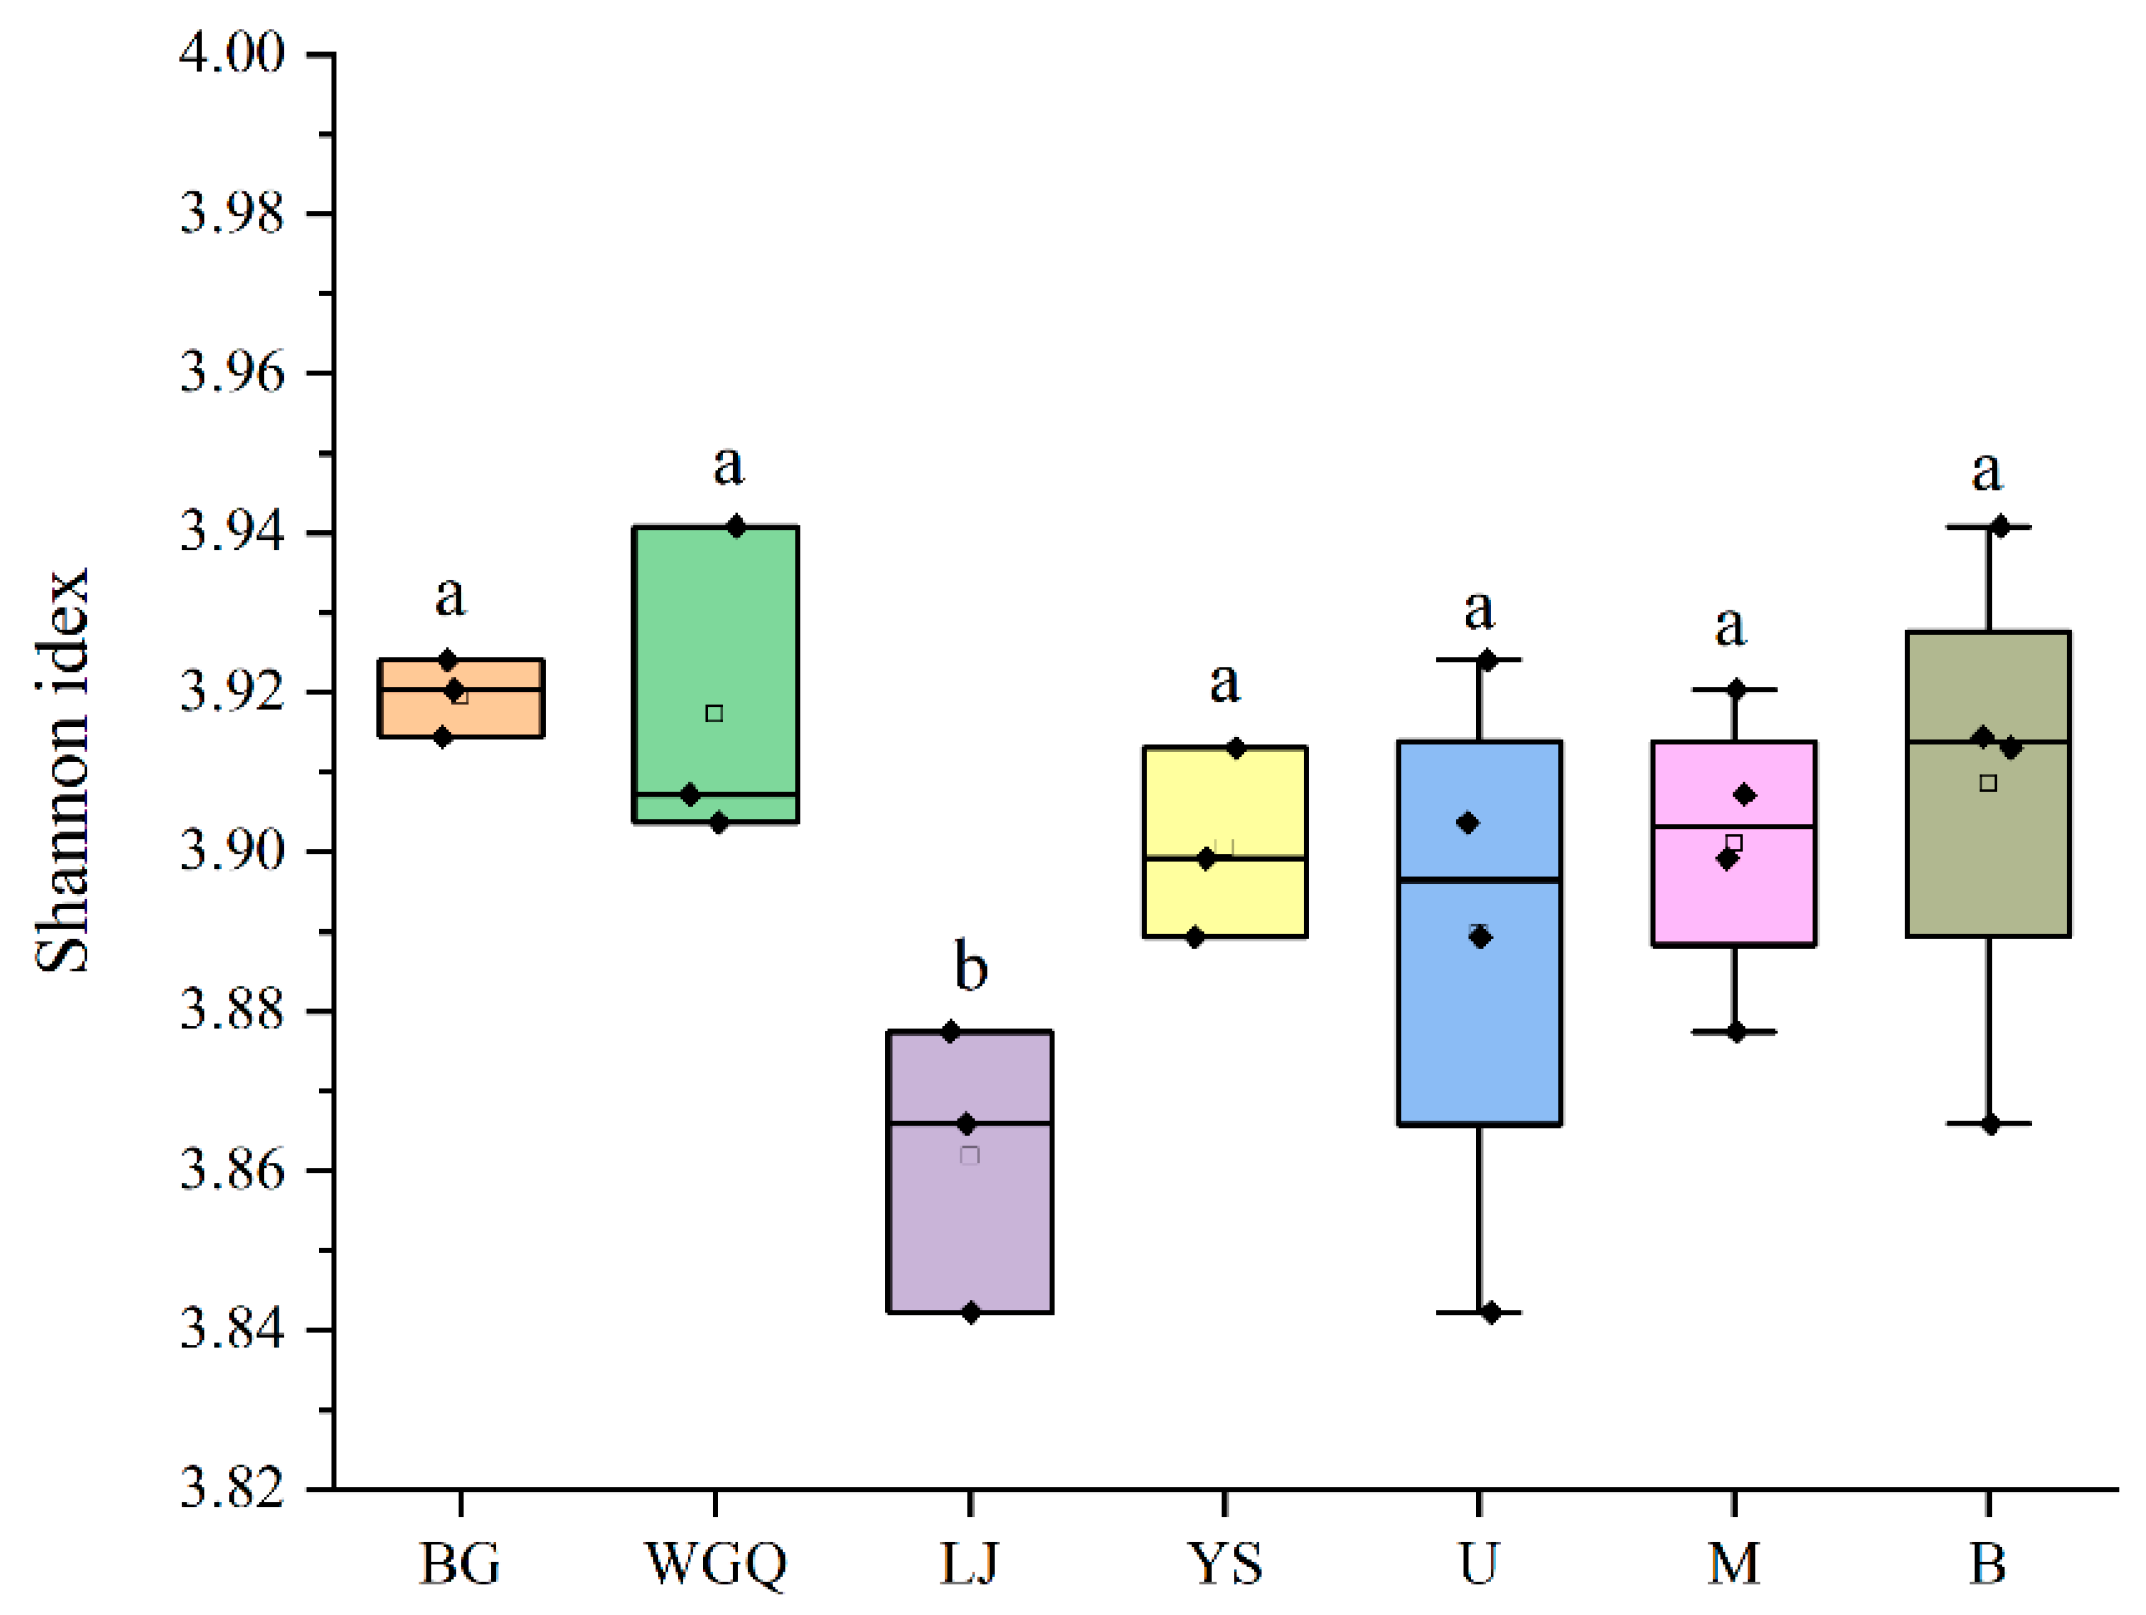
The α-diversity of the pathogens in four site samples was shown in Figure 5. The Simpson index in the LJ site was significantly lower than the other three sites (p < 0.05), and the Simpson index of different layers had no significant differences (p > 0.05). It was a similar trend with α-diversity of bacteria (Figure S4). This finding suggests that bacteria may contribute to the diversity of pathogens in this unique ecosystem of port. The detection rate of pathogens varied among samples, and the LJ site (13.32%) was higher than other sites (Table S2). In addition, the rate of B layer is significantly lower (p < 0.05) than other layers, indicating that the proportion of pathogens may not be related to its diversity in ports.
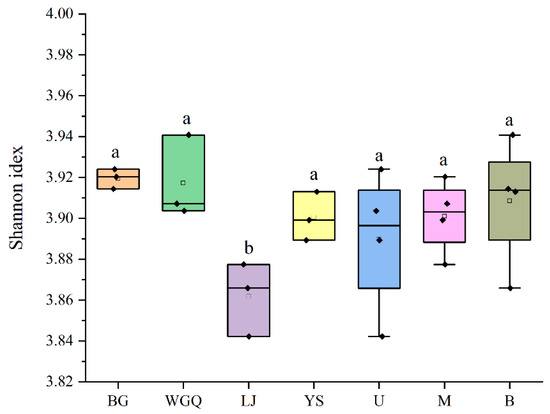
Figure 5.
Alpha diversity index of the pathogen community. The letters “a” and “b” represent that there is a significant difference between the two groups, and the same letter means that the difference is not significant.
3.4. Indicator Species of Bacteria and Pathogens
Bubble charts represent the annotation and abundance of species through the change in bubbles’ size and color. In this study, the species of bacteria and pathogens that could be biomarkers in different sites were identified by the top 20 at genus and species level, respectively (Figure 6). In BG site samples, significant enrichment was observed for the Limnohabitans sp. belonging to the Betaproteobacteria class. In WGQ site samples, an obvious accumulation was noted for Dechloromonas sp. and Malikia sp. belonging to the Betaproteobacteria class. In LJ site samples, Pseudomonas, Acidovorax sp., and Brevundimonas sp. could be served as belonging to the Gammaproteobacteria, Betaproteobacteria, and Alphaproteobacteria, respectively. In YS site samples, Halomonas sp. and Alcanivorax sp. belonging to the Gammaproteobacteria were a clear aggregation (Figure 6a). Furthermore, no bacteria were found as candidate indicators in the same water layer at different sites. However, as a pathogen, Pseudomonas aeruginosa and Salmonella enterica could be regarded as candidate indicators in different layers at four sites due to their high abundance belonging to the Gammaproteobacteria and Enterobacteriaceae, respectively (Figure 6b).
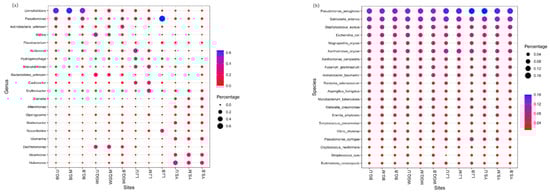
Figure 6.
Bubbles map of bacteria and pathogens using the top 20 genera (a) and top 20 species (b), respectively.
3.5. Diversity and Composition of the ARGs
The ARGs were identified through comparing clean data with the ARDB database. A total of 2359 ARGs and 33 ARG types were detected in all samples, and the number of ARGs was different in BG (2194), WGQ (2287), LJ (2160), and YS (2201) sites. The number of ARGs was not significantly different in the U (2310), M (2310), and B (2316) layers. ARGs were classified according to the type of antibiotic resistance, and the dominant ARG types were similar in different sites (Figure 7). The main types of ARGs detected were multidrug (34.64%), tetracycline (10.16%), peptide (9.36%), macrolide (9.06%), glycopeptide (5.88%), aminoglycoside (5.11%), and fluoroquinolone (3.60%) in BG (Figure 7a). Furthermore, the multidrug ARGs (35.2% vs. 41.8%) of BG and WGQ were significantly lower than LJ and YS, and tetracycline ARGs (10.4% vs. 8.8%) showed the opposite trend.
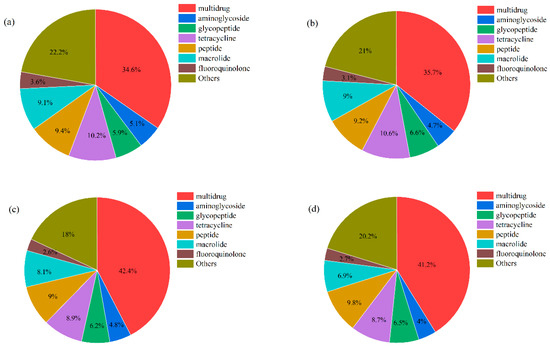
Figure 7.
The main ARG types in BG (a), WGQ (b), LJ (c), and YS (d) sites.
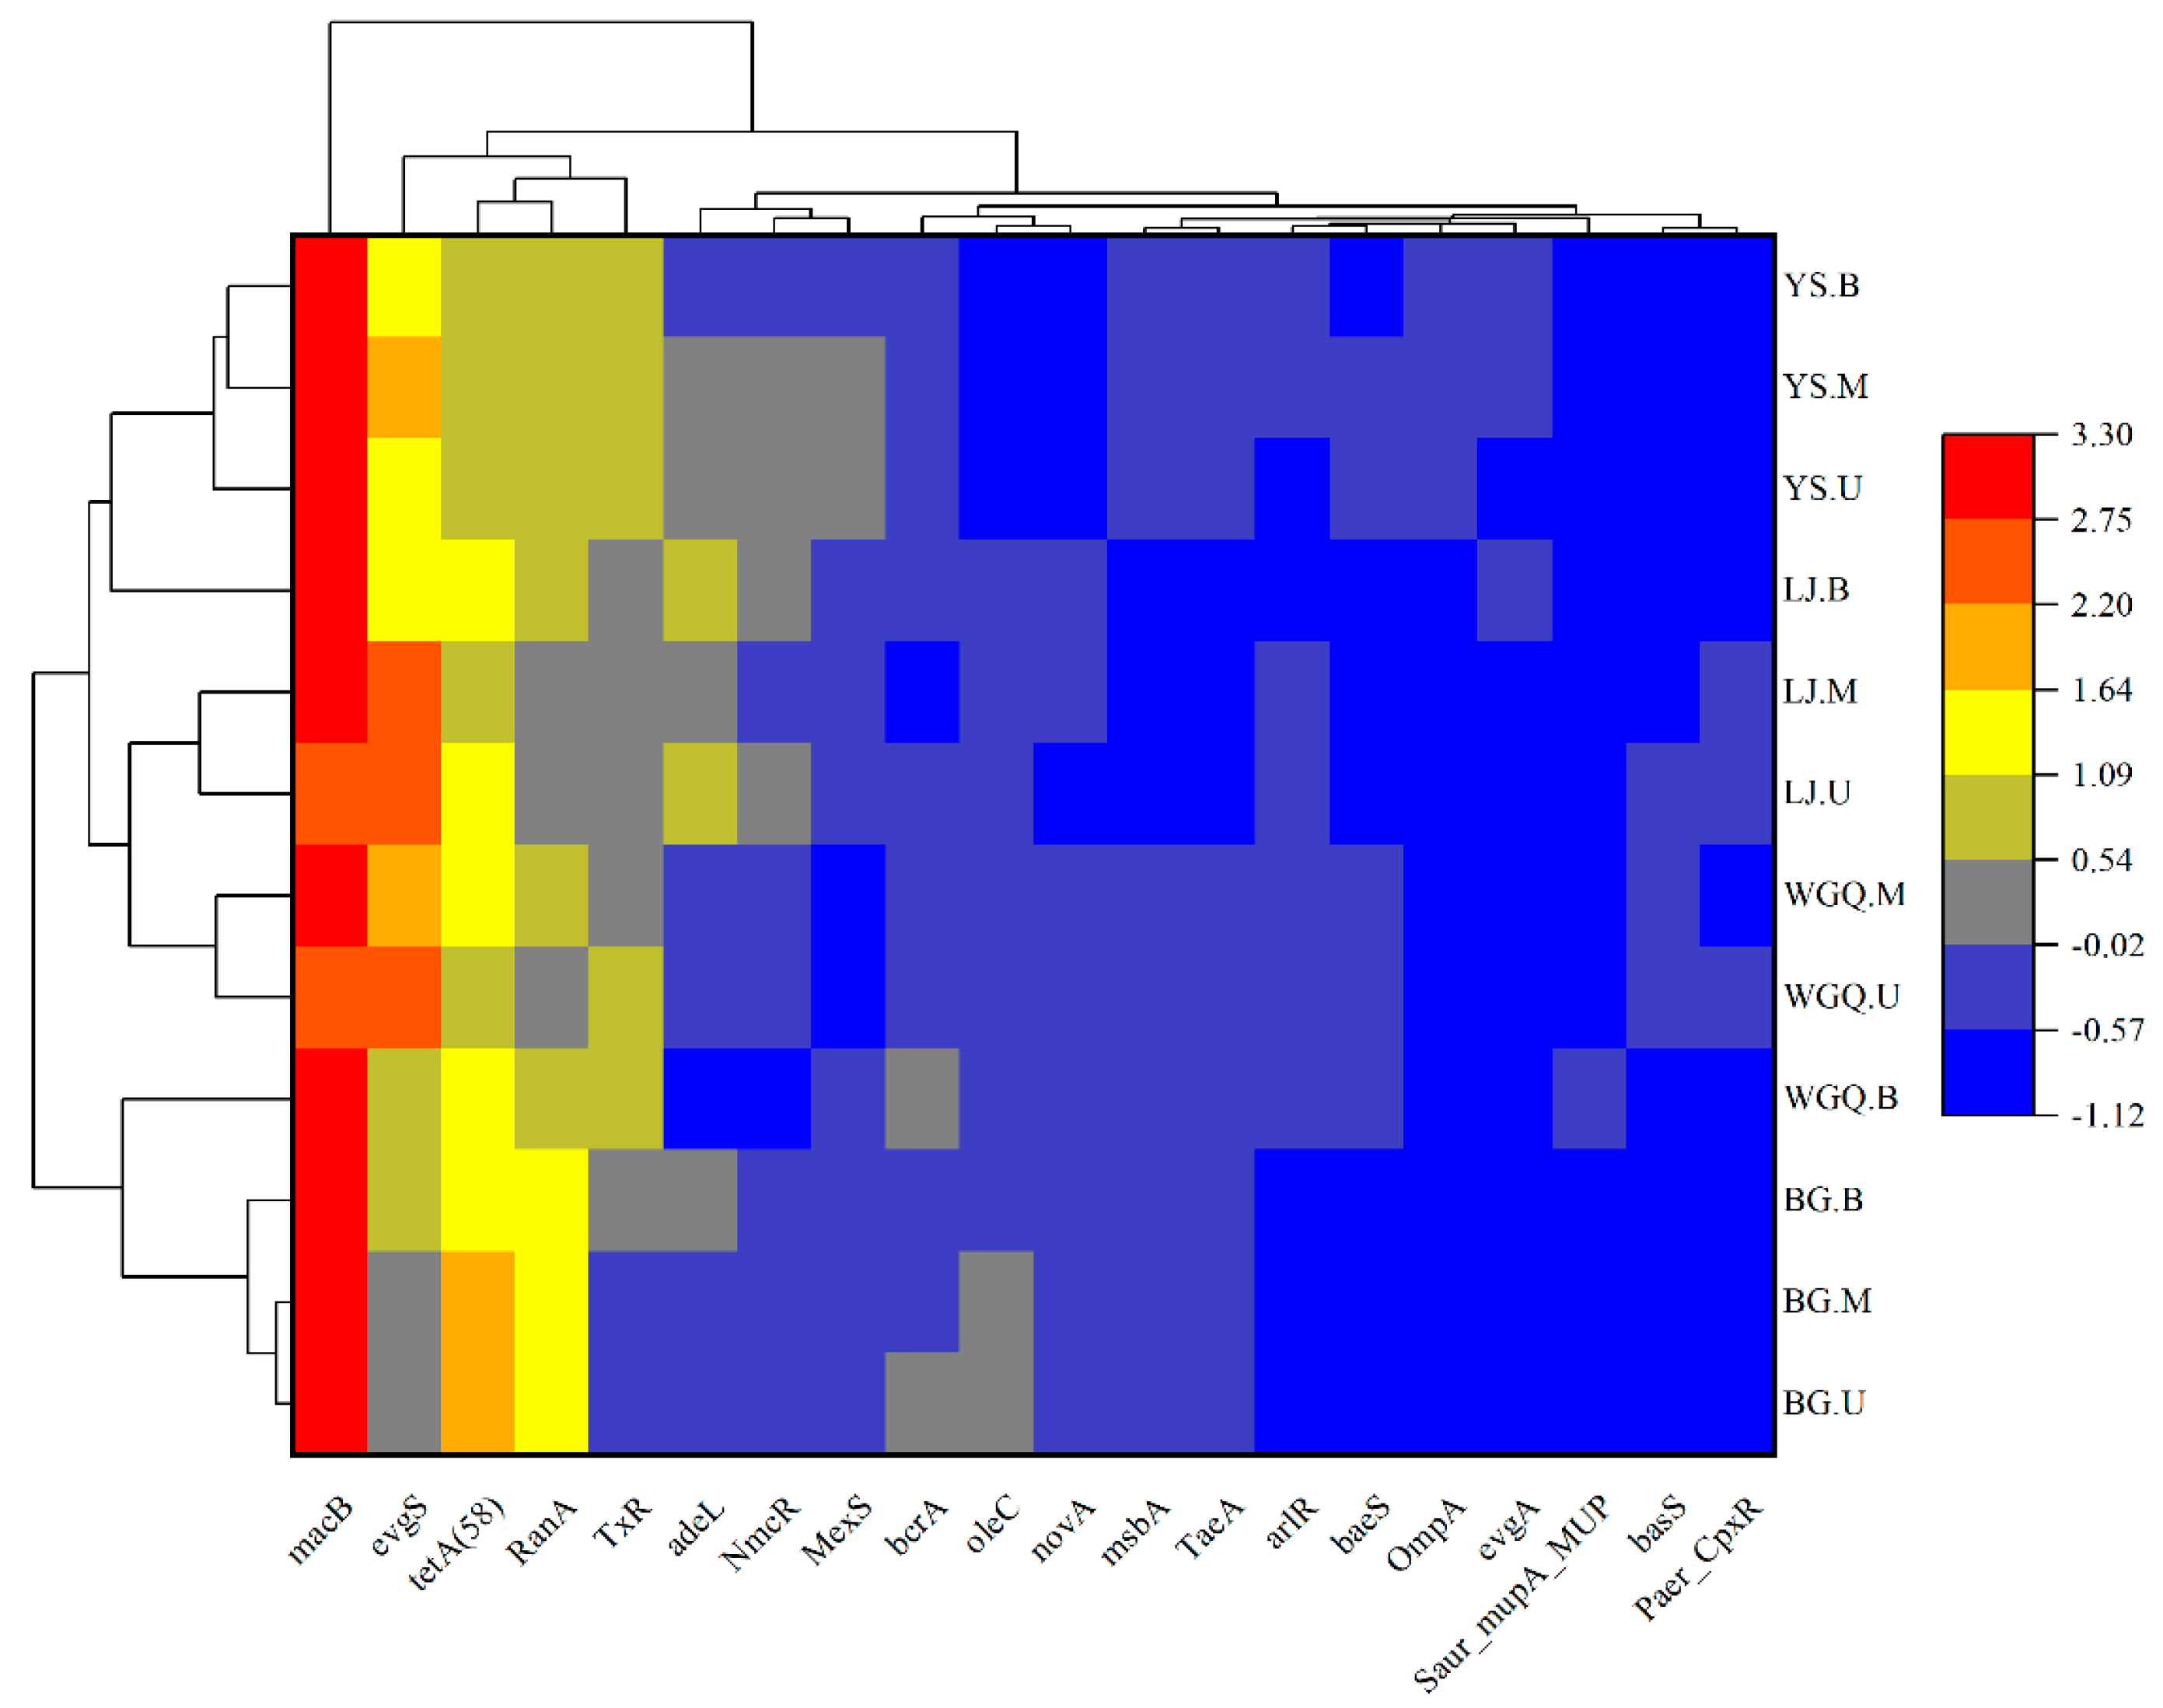
The top 20 ARGs were selected to analyze the clustering heatmap according to their relative abundances (Figure 8). The macB showed a trend of prevalence, and tetA (58) also occupied a high percentage of ARGs in all samples. Except for BG.U, other samples showed a high relative abundance of evgS. The results showed that the dominant ARGs at different sites were similar in all samples.
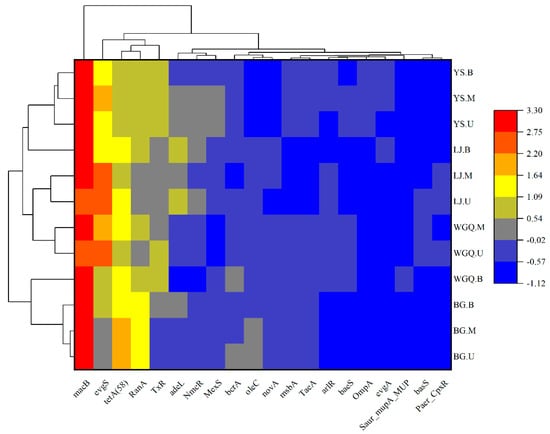
Figure 8.
Clustering heatmap analysis of the top 20 ARGs.
3.6. Correlation between Bacteria, Pathogens, and ARGs
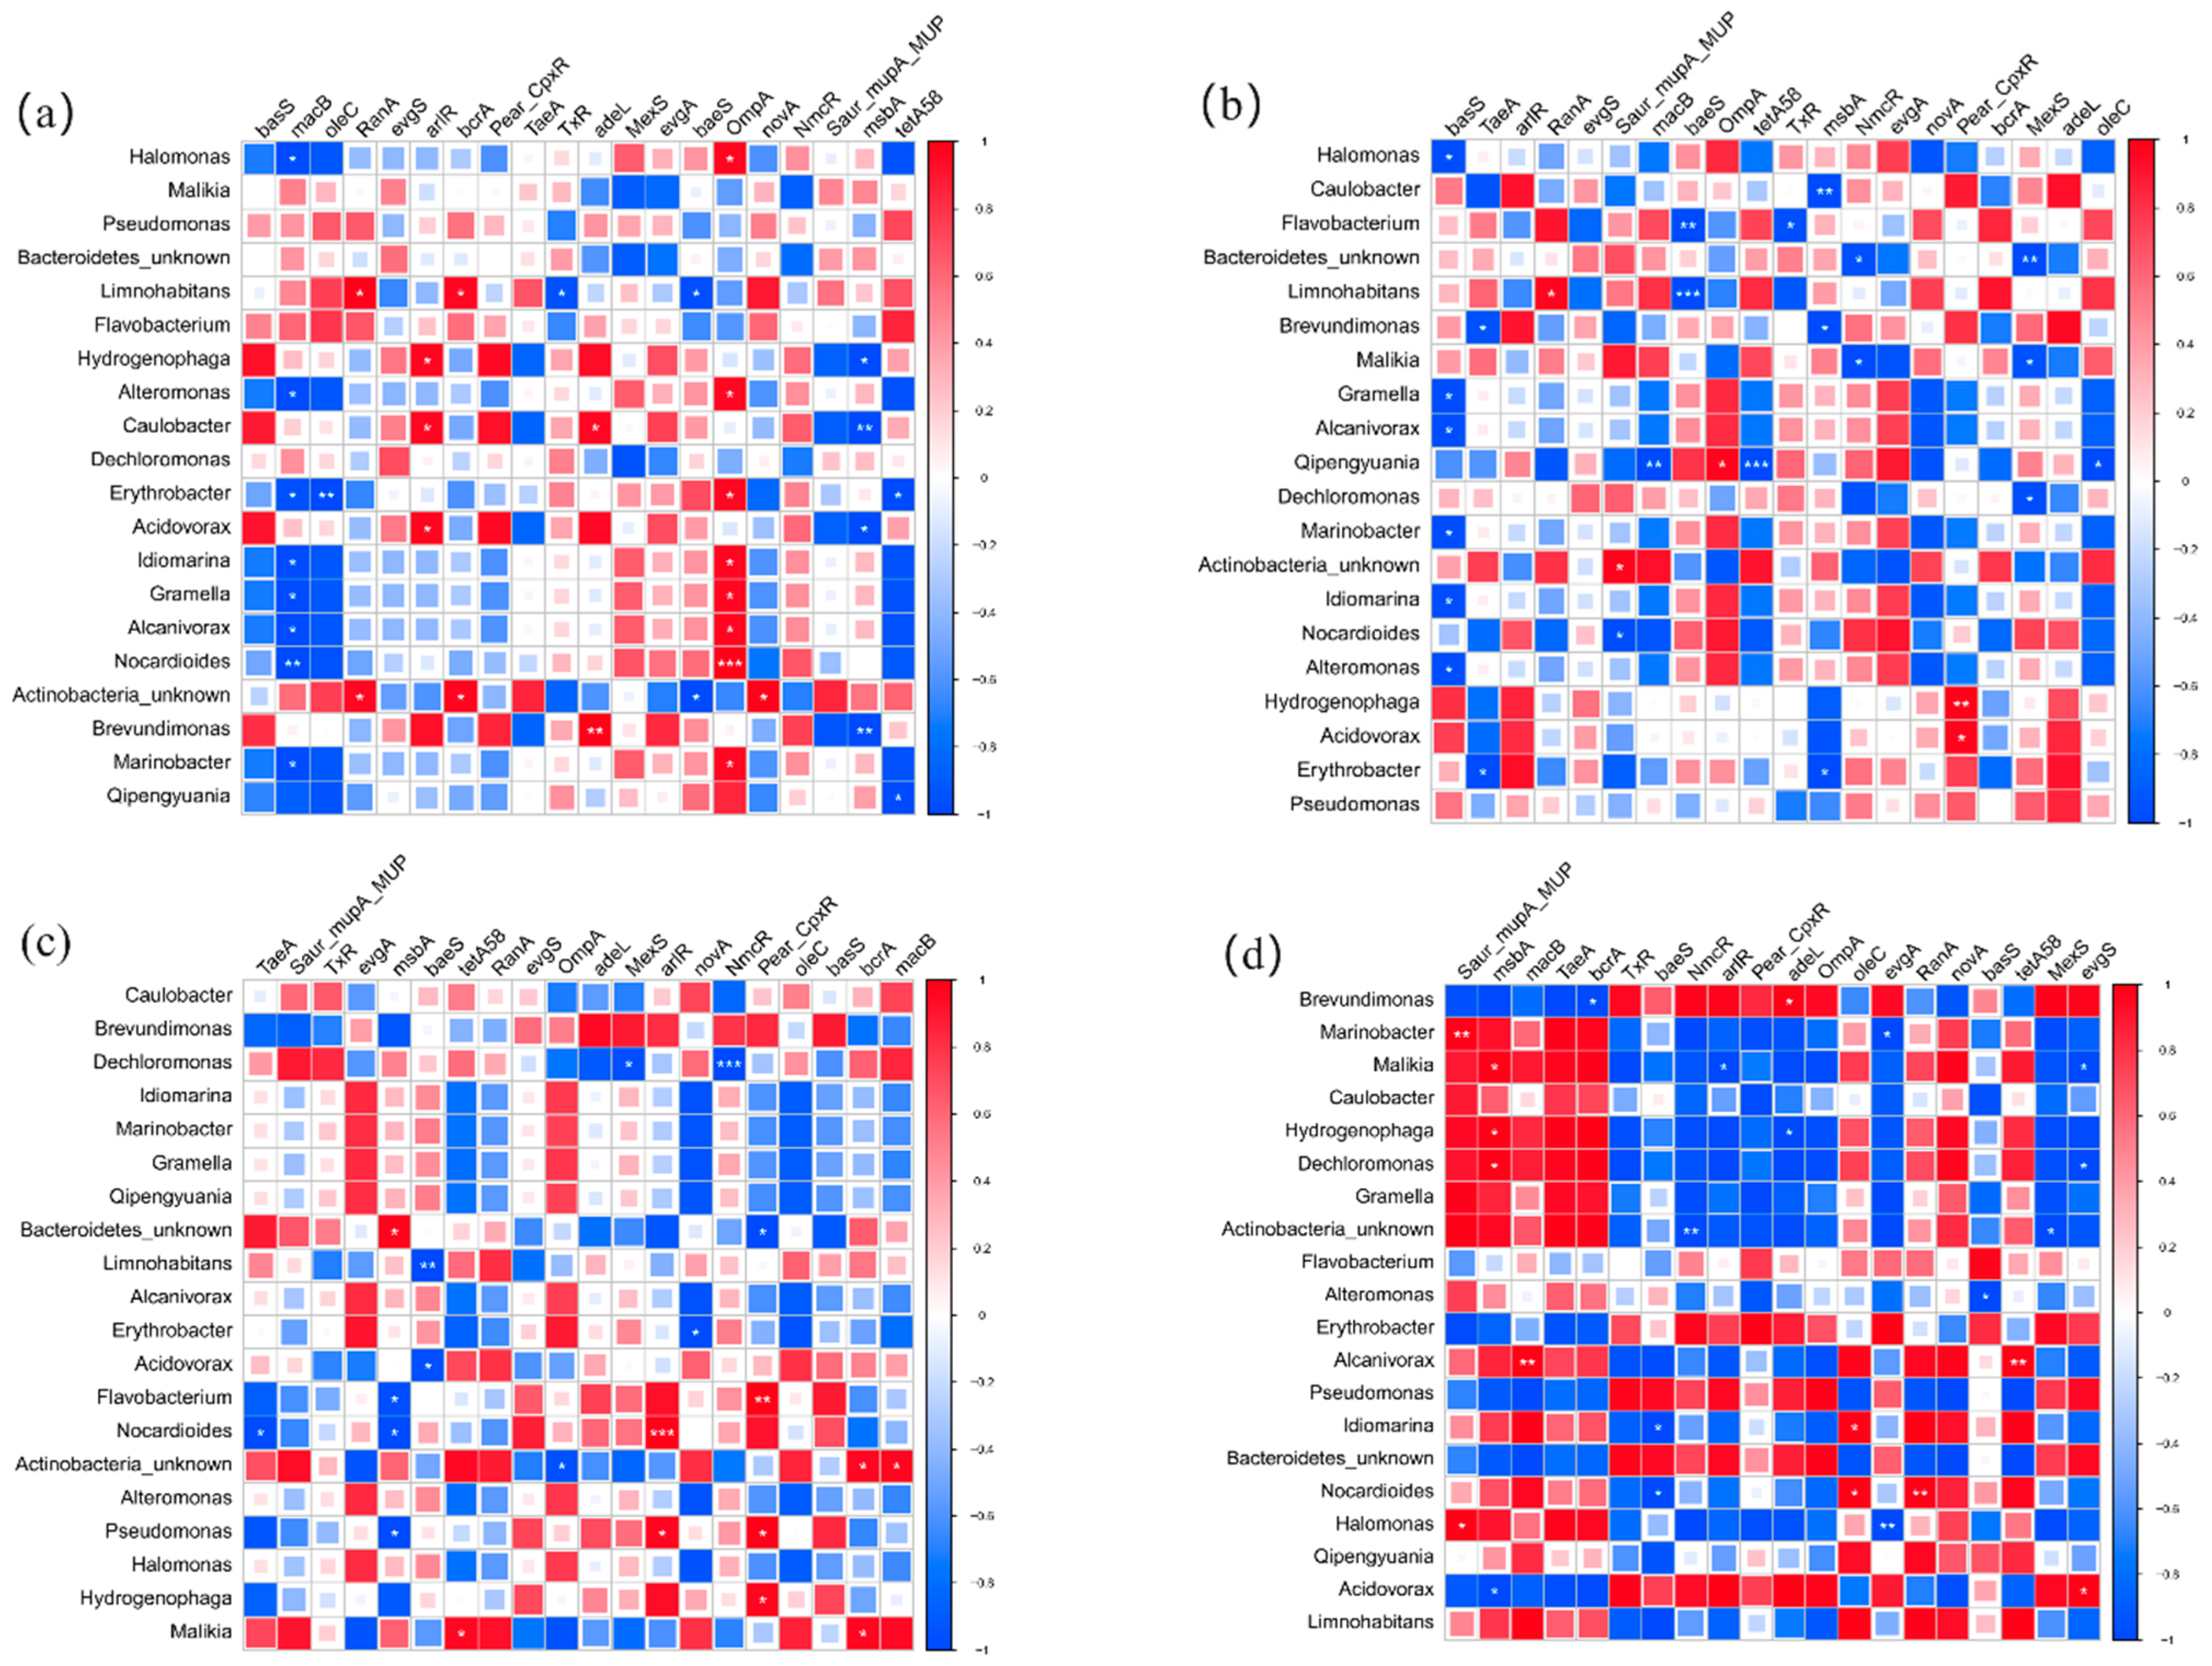
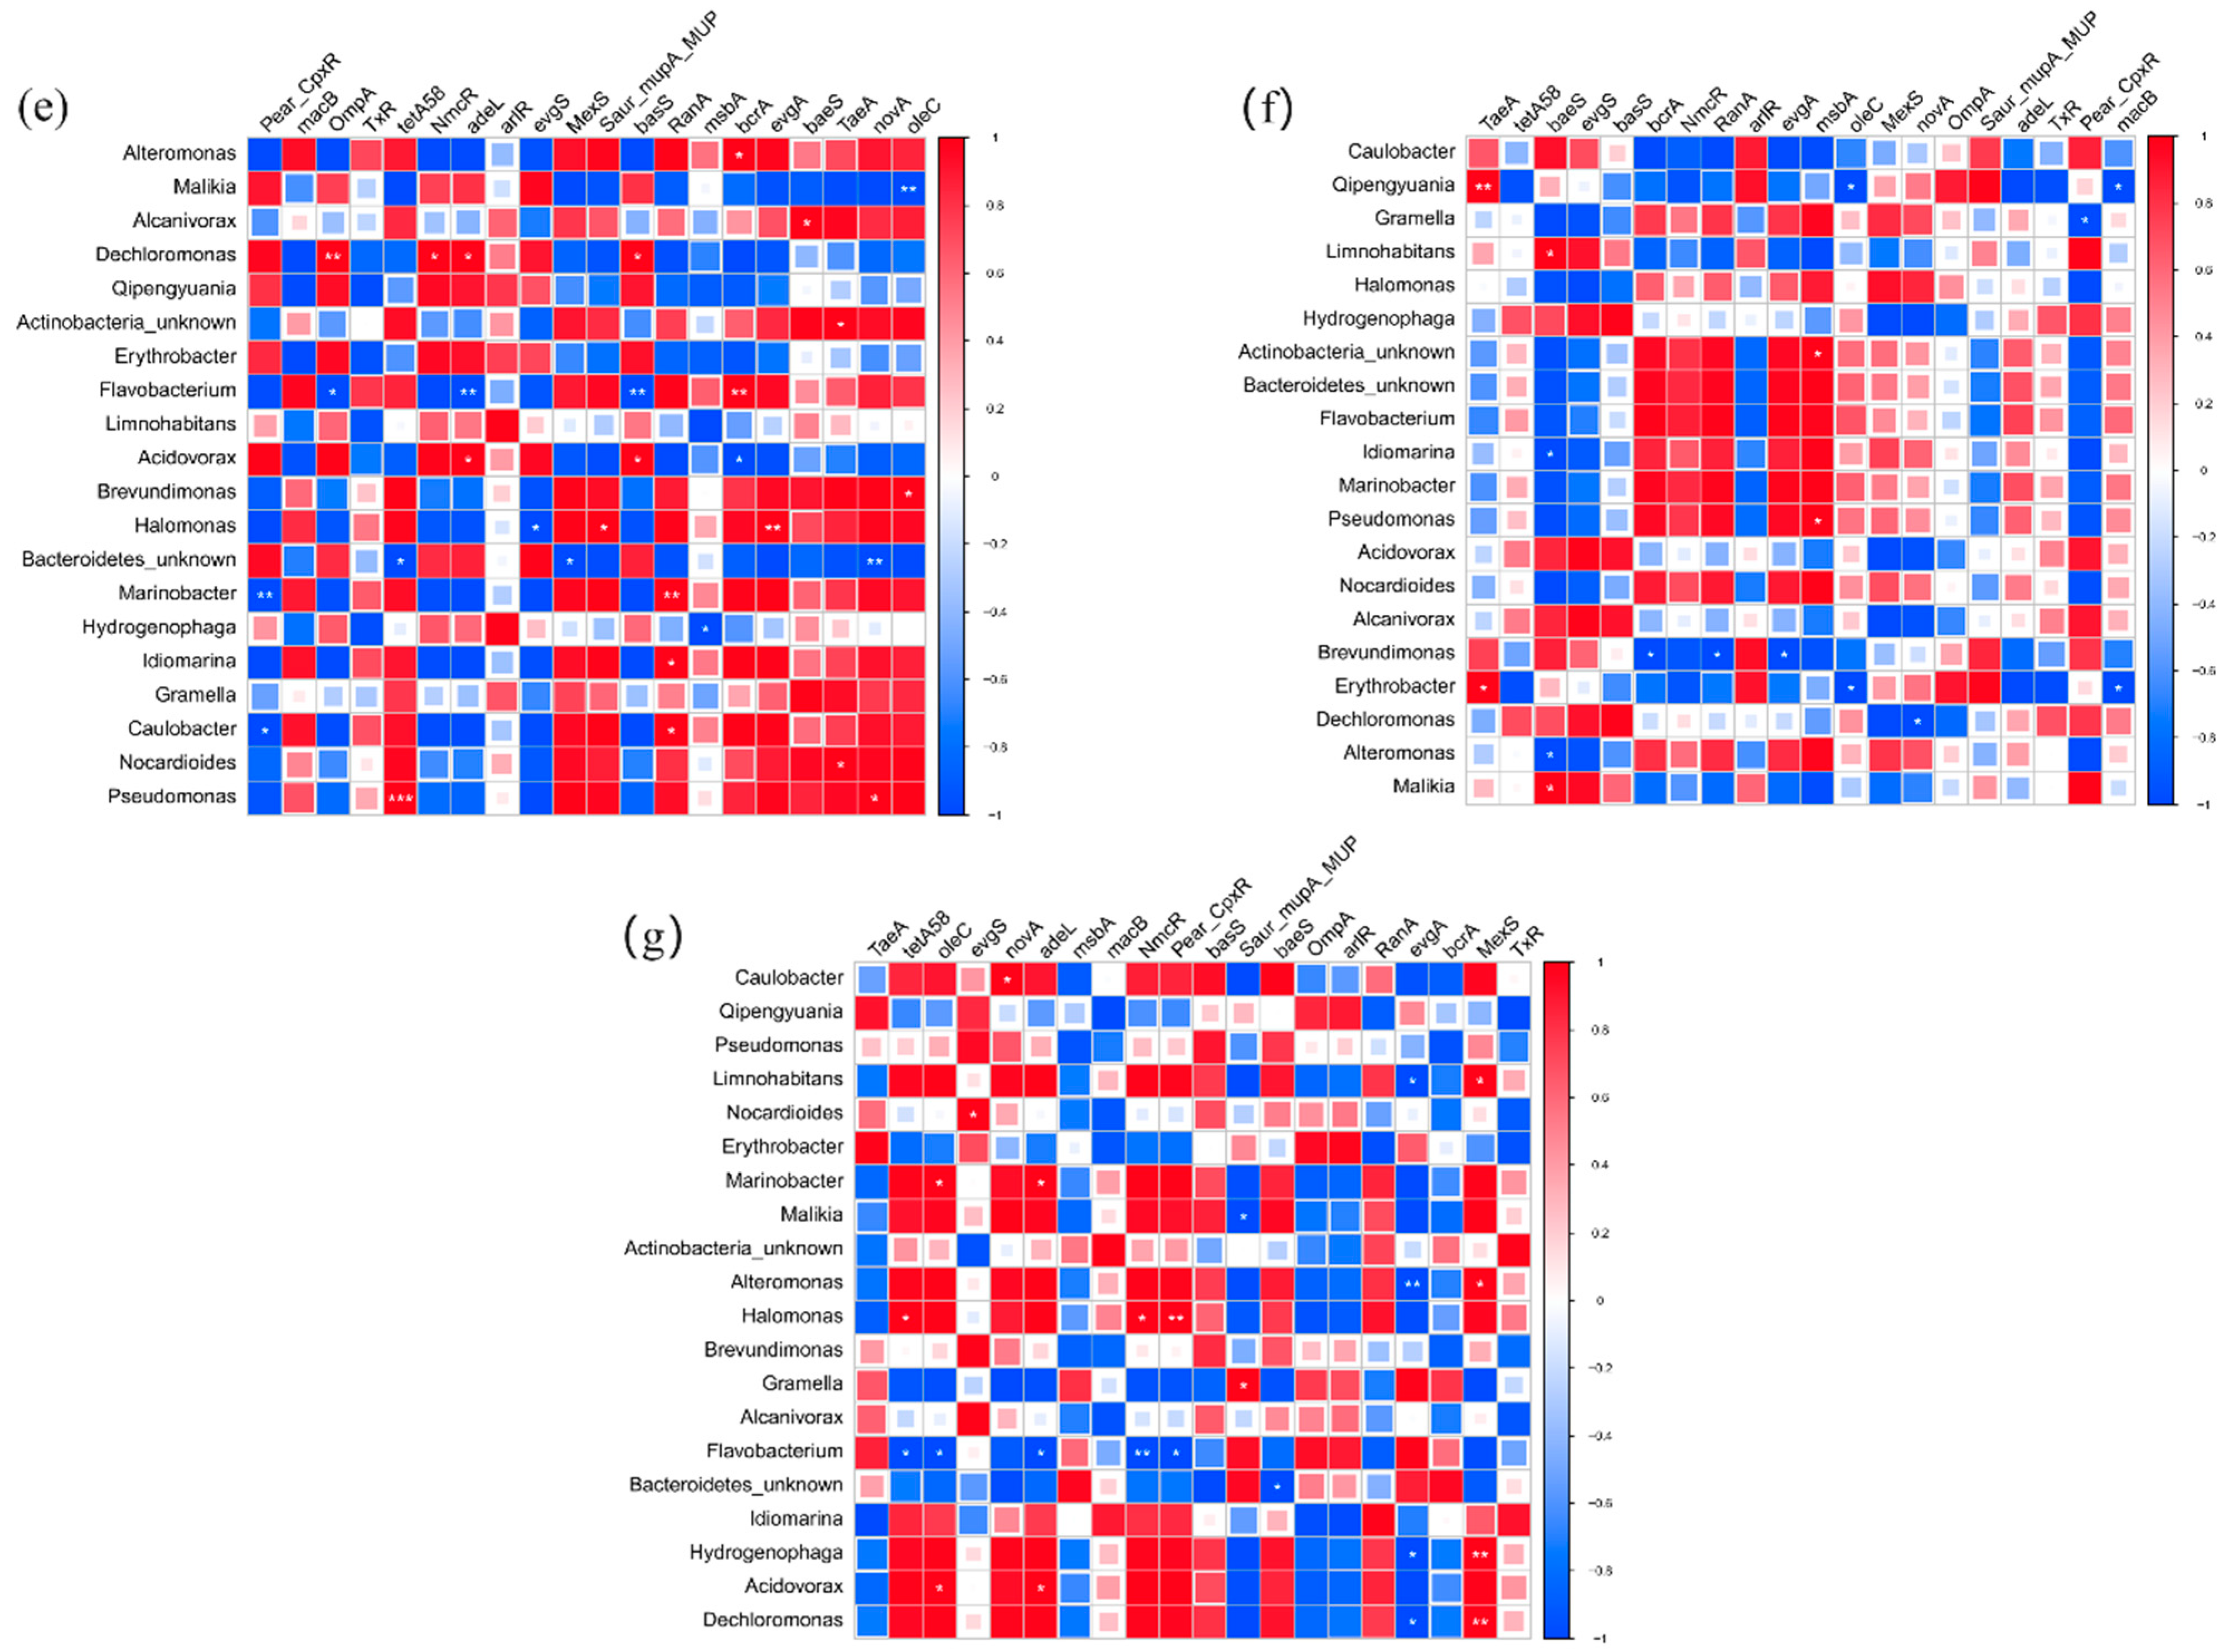
The top 20 bacterial genera and 20 pathogens were chosen to analyze the interrelationships between the top 20 ARGs. The distribution of host-bacteria-carried ARGs was obviously different among four sites and three layers. In U layers, Halomonas sp., Alteromonas sp., Erythrobacter sp., Idiomarina Gramella sp., Alcanivorax sp., Marinobacter sp., and Idiomarina sp. were positively correlated with OmpA. It indicated that OmpA might have spread among bacteria. Acidovorax sp. and Hydrogenophaga sp. might be the host bacteria of Pear_CpxR in M layers. Malikia sp., Npcardioides sp., Flavobacterium sp., and Actinobacteria_unkonw sp. showed positive relationships with tetA (58), arIR, Pear_CpxR, and macB in B layers, respectively. Compared with U layers (14), the number of bacteria that had a positive correlation with ARGs was obviously decreased in M (5) and B (7) layers. It indicated that the diffusion and propagation of ARGs were more widespread in upper water. In addition, the bacteria genera that had a positive correlation with the main ARGs were completely different in four sites. In the BG site, Acidovorax sp. might be the host bacteria of evgS. Pseudomonas sp. showed a significant relationship with tetA (58) on the WGQ site. In the YS site, Halomonas sp. and Nocardioides sp. were closely related to tetA (58) and evgS, respectively. No bacteria had a positive relationship with the main ARGs in LJ sites. These bacteria were not dominant bacteria in corresponding samples at all.
Although the composition of pathogens and ARGs was similar in all samples, the correlation was not identical between pathogens and ARGs in different sites and layers. More than half of pathogens had significant correlation with ARGs. Mycobacterium tuberculosis had a positive correlation with novA, RanA, and bcrA in U layers (Figure S5a), and it was positive with tetA (58), oleC, macB, and novA in M layers (Figure S5b). It showed that Mycobacterium tuberculosis might carry multiple types of ARGs. Magnaporthe oryzae might be the host bacteria of dominant ARGs (macB and tatA (58)) in B layers (Figure S5c). In addition, the host pathogens of the main ARGs in different also varied in different. Streptococcus pneumonia and Xanthomonas oryzae had positive correlation with macB and evgs, respectively, in the BG site (Figure S5d). Streptococcus pneumoniae and Vibrio cholerae showed a high positive correlation with macB and tetA (58), respectively, in the LJ site (Figure S5f). In the WGQ site, Streptococcus suis might be the host pathogen of macB, and evgS might be carried with Salmonella enterica and Erwinia amylovora (Figure S5e). Xanthomonas campestris might be the host pathogen of macB in the YS site (Figure S5g). The analysis showed that not all dominant ARGs had potential host pathogens, and not all dominant pathogens were significant with ARGs in all (Figure 9).

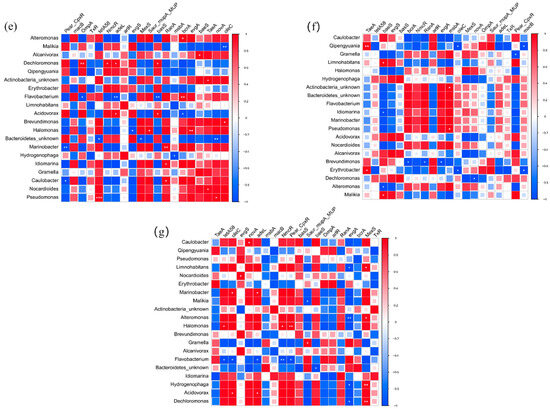
Figure 9.
The correlation between bacteria and ARGs in U (a), M (b), B (c) layers, BG (d), WGQ (e), LJ (f), and YS (g) sites. (* p < 0.1, ** p < 0.05, *** p < 0.01).
4. Discussion
4.1. Occurrence and Distribution of the Bacteria
The cluster analysis of bacterial composition showed differences in bacterial communities among different sites (Figure 3). Proteobacteria, Bacteroidetes, and Actinobacteria were the main bacteria in different sites and layers of Shanghai Port. Proteobacteria was the dominant phylum in all samples, occupying more than 57% of the total bacterial sequences. The relative abundance of Proteobacteria was also significantly different among sites and was lowest in WGQ sites. In different samples, the Alphaproteobacteria, Betaproteobacteria, and Gammaproteobacteria were the main class of bacteria, and the relative abundance of Alphaproteobacteria and Betaproteobacteria was higher than Gammaproteobacteria in BG, LJ, and WGQ sites. Gammaproteobacteria exhibited a completely opposite trend. In previous studies, Gammaproteobacteria was a mostly dominant bacteria class in saltwater and participated in the nutrient cycling of coastal ecosystems [40], and Alphaproteobacteria and Betaproteobacteria were mostly dominant bacteria classes in freshwater [41,42], which was consistent with our findings and indicates that salinity was a key factor affecting the composition of Proteobacteria in port.
As the dominant genus of BG, Limnohabitans sp. has often been detected in rivers and lakes in previous studies and is considered a dominant group of freshwater planktonic bacteria worldwide [43]. Dechloromonas sp. and Malikia sp. were abundant bacteria genera at WGQ. Dechloromonas sp. played an important role in the degradation process of organic matter in wastewater environments [44] and the removal of phosphorus and nitrogen [45]. Furthermore, Malikia sp. was significantly associated with the concentration of wastewater and linked with denitrification and nitrogen fixation [46]. The high abundance of Dechloromonas sp. and Malikia sp. indicated that WGQ might be severely polluted by nitrogen and phosphorus pollution. Acidovorax sp., Erythrobacter sp., and Pseudomonas sp. were the main components of LJ U, M, and B, respectively. As an aerobic denitrifying bacterium, Pseudomonas sp. was closely related to nitrogen metabolism by converting nitrate into gaseous nitrogen [47]. Furthermore, Acidovorax sp. had remarkable gene expression about the nitrogen metabolism pathway in a polluted basin based on gene expression [48]. Erythrobacter sp. had a strong ability to degrade polycyclic aromatic hydrocarbons [49], and its abundance is significantly correlated with the concentration of low-molecular-weight polycyclic aromatic hydrocarbons [50]. As the concentration of low molecular weight polycyclic aromatic hydrocarbons in the environment increases, the abundance of Erythrobacter sp. also increases [50]. It shows that LJ might be polluted by nitrogen and polycyclic aromatic hydrocarbons. Halomonas sp. and Alcanivorax sp. were the main genera of YS, and Alcanivorax sp. was always detected in environments related to hydrocarbon exposure [51,52]. Halomonas sp. and Alcanivorax sp. could effectively degrade hydrocarbons and their derivatives [53,54]. As the quality of the water environment improves, the abundance of Halomonas sp. also increases [55]. It showed that the water environment may have been contaminated with hydrocarbons before, and it has now improved at the YS site. Overall, the analysis of bacteria composition indicated that different sites are affected by different types of pollution, which may be due to the different functions of different sites and the frequency of human activities [56].
4.2. Potential Risk of Pathogens and ARGs
Antibiotics are widely used and even abused worldwide, and it leads to the widespread emergence of ARGs. The water body is considered a major reservoir of ARGs and pathogens. Ports receive water bodies from multiple sources, such as rivers, ballast water, wastewater, and so on. In previous studies, sulfonamide resistance genes and tetracycline resistance genes are prevalent in Huangpu and Yangtze rivers around the Shanghai Port [57,58]. However, in our study, sulfonamide resistance genes only occupy a small part of detected ARGs in port. The main ARGs were the resistant genes of macrolide, tetracycline, and aminoglycoside. The majority of main ARGs (e.g., macB, evgS, and RanA) enable hosts to acquire antibiotic resistance via antibiotic efflux pumping pathways in samples. It shows that the distribution and composition of ARGs have uniqueness in port water. In previous studies, the distribution of ARGs can be affected by the water flow velocity, and high flow diluted the ARGs in rivers [59,60]. Due to closed or semi-closed structures, the flow velocity of water in port areas is usually completely different from rivers, which may be the reason for the differences in ARGs. In addition, as a dominant ARG, macB is usually detected in wastewater after an anaerobic–oxic process, which indicates that Shanghai Port may be affected by related wastewater pollution [61]. We find that there is a significant correlation among ARGs in samples through correlation analysis (Figure S6). As the dominant ARGs, macB and tetA(58) not only have a strong positive correlation with themselves but also show positive relationships with oleC, RanA, and novA. It seems that the interaction among ARGs might be the prime driving force.
Pathogens are widely distributed in water and pose a threat to human health worldwide, and it poses a great challenge to medical treatment when pathogens carry ARGs. In this study, we found Pseudomonas aeruginosa, Salmonella enterica, Staphylococcus aureus, and Escherichia coli are dominant pathogens in port. They are related to common diseases (pneumonia, fever, and infection purulente) transmitted through water, which demonstrates the risk of disease at Shanghai Port and poses a challenge to the recreational activities in the surrounding area. These pathogens have often been found to be associated with multidrug resistance in previous studies [37,62,63]. In this study, these pathogens are also closely related to ARGs. Although this phenomenon is not found in all samples, it is still enough to draw attention. Compared with the detection rate of pathogens in the Yangtze river (1.2%) in previous studies [64], the detection rate of pathogens in ports (12.63%) is significantly higher. Furthermore, among all 215 pathogens, 48 species can infect primates (22.33%), 26 species can infect fish (12.09%), and 10 species can simultaneously infect both fish and primates (4.65%), demonstrating a threat to human health. All of these suggest that Shanghai Port is a potential threat to the health of surrounding residents. What is more, Pseudomonas aeruginosa and Salmonella enterica are the dominant pathogens of Shanghai Port and have been used as indicators about water pollution [65,66]. They could have potential to be used as candidate indicators in Shanghai Port and could be evaluated as a supplement to traditional detection indicators (E. coli) associated with port water safety in future studies. In previous studies, microbial indicators have been successfully used as one of the indicators for monitoring ecosystems [67]. In addition, we found that pathogens positively related to the same ARGs vary in different layers and sites. Due to HGT, ARGs may spread in pathogen communities, leading to the emergence of more challenging pathogens for human health.
As the main source of ballast water, port water is highly likely to be transported to other ports around the world. It may lead to the outbreak of diseases and the invasion of alien species. For example, the Vibrio cholerae carried in ballast water is also considered the main cause of the South American’s cholera pandemic that occurred in the early 1990s [68]. In this study, the composition of pathogens and ARGs is different from the previous composition of ballast water arriving at Shanghai port and surrounding ports [29,69]. It also puts forward new requirements for port management and ballast water management and treatment.
5. Conclusions
Shanghai Port not only plays a critical role in the economy but also affects the ecosystem of the coastal areas around Shanghai. This study shows that pathogens and ARGs have a more stable community composition and distribution compared to bacteria. Therefore, Pseudomonas aeruginosa, Salmonella enterica, and macB might be used as indicators to evaluate the relevant risks in Shanghai Port. In addition, we found many bacteria and pathogens are potential hosts for ARGs, and ARGs might transmit by VGT. It not only poses a threat to the surrounding coastal residents but also may spread to the world through ballast water, thereby threatening the health of people around the world. Therefore, it should pay more attention to monitoring these pathogens and ARGs in Shanghai Port in future studies. It is necessary to improve relevant regulations and strengthen the development of rapid detection technology in order to effectively control the spread of bacteria, pathogens, and ARGs in the future. This will reduce the deaths caused by pathogen-carried ARGs and help us to have a deeper understanding of the ecological environment in ports.
Supplementary Materials
The following supporting information can be downloaded at: https://www.mdpi.com/article/10.3390/w16182569/s1. Figure S1: Clustering analysis and relative abundance of the bacteria at class (a) and species (b) level; Figure S2: NMDS analysis of bacteria (a) and pathogen (b); Figure S3: Analysis diagrom of Anosim differences between different site; Figure S4: Alpha diversity index of bacteria community, the letters “a” and “b” represent that there is a significant difference between the two groups and same letter means that the difference is not significant; Figure S5: The correlation between pathogens and ARGs in U (a), M (b), B (c) layers, BG (d), WGQ (e), LJ (f) and YS (g) sites. (* p < 0.1, ** p < 0.05, *** p < 0.01); Figure S6: The correlation among ARGs in all samples. (* p< 0.1, ** p < 0.05, *** p < 0.01); Table S1: Information of high-throughput sequencing results; Table S2: Information of detection rate in samples.
Author Contributions
L.H.: conceptualization, methodology, investigation, formal analysis, writing—original manuscript, visualization, and writing—review and editing; J.X.: review and editing; H.W.: resources, editing, and project administration. All authors have read and agreed to the published version of the manuscript.
Funding
This study was supported by the National Key Research and Development Program of China (2022YFC2302800).
Data Availability Statement
The data presented in this study are available upon request from the corresponding author.
Conflicts of Interest
The authors declare that they have no known competing financial interests or personal relationships, which may affect the work reported in this study.
References
- Ward, N.D.; Megonigal, J.P.; Bond-Lamberty, B.; Bailey, V.L.; Butman, D.; Canuel, E.A.; Diefenderfer, H.; Ganju, N.K.; Goni, M.A.; Graham, E.B.; et al. Representing the function and sensitivity of coastal interfaces in Earth system models. Nat. Commun. 2020, 11, 2458. [Google Scholar] [CrossRef]
- Patel, V.; Munot, H.; Shouche, Y.S.; Madamwar, D. Response of bacterial community structure to seasonal fluctuation and anthropogenic pollution on coastal water of Alang-Sosiya ship breaking yard, Bhavnagar, India. Bioresour. Technol. 2014, 161, 362–370. [Google Scholar] [CrossRef] [PubMed]
- Li, Z.Y.; Luan, W.X.; Wang, X.T.; Wan, S.L.; Su, M.; Zhang, Z.C. Spatial expansion regular pattern and driving factors of estuarine and coastal harbors. Ocean Coast. Manag. 2022, 216, 105980. [Google Scholar] [CrossRef]
- Pan, K.; Wang, W.X. Trace metal contamination in estuarine and coastal environments in China. Sci. Total Environ. 2012, 421, 3–16. [Google Scholar] [CrossRef]
- Darbra, R.M.; Pittam, N.; Royston, K.A.; Darbra, J.P.; Journee, H. Survey on environmental monitoring requirements of European ports. J. Environ. Manag. 2009, 90, 1396–1403. [Google Scholar] [CrossRef]
- Azam, F.; Fenchel, T.M.; Field, J.G.; Gray, J.S.; Meyer-Reil, L.-A.; Thingstad, F.J.M.E.P.S. The Ecological Role of Water-Column Microbes in the Sea*. Mar. Ecol.-Prog. Ser. 1983, 10, 257–263. [Google Scholar] [CrossRef]
- Bigalke, A.; Meyer, N.; Papanikolopoulou, L.A.; Wiltshire, K.H.; Pohnert, G. The Algicidal Bacterium Kordia algicida Shapes a Natural Plankton Community. Appl. Environ. Microbiol. 2019, 85, e02779-18. [Google Scholar] [CrossRef] [PubMed]
- Lazarus, E.D. Toward a Global Classification of Coastal Anthromes. Land 2017, 6, 13. [Google Scholar] [CrossRef]
- Rajendran, N.; Suwa, Y.; Urushigawa, Y. Distribution of phospholipid ester-linked fatty acid biomarkers for bacteria in the sediment of Ise Bay, Japan. Mar. Chem. 1993, 42, 39–56. [Google Scholar] [CrossRef]
- Treusch, A.H.; Vergin, K.L.; Finlay, L.A.; Donatz, M.G.; Burton, R.M.; Carlson, C.A.; Giovannoni, S.J. Seasonality and vertical structure of microbial communities in an ocean gyre. ISME J. 2009, 3, 1148–1163. [Google Scholar] [CrossRef]
- Andersson, A.F.; Riemann, L.; Bertilsson, S. Pyrosequencing reveals contrasting seasonal dynamics of taxa within Baltic Sea bacterioplankton communities. ISME J. 2010, 4, 171–181. [Google Scholar] [CrossRef] [PubMed]
- Gilbert, J.A.; Field, D.; Swift, P.; Newbold, L.; Oliver, A.; Smyth, T.; Somerfield, P.J.; Huse, S.; Joint, I. The seasonal structure of microbial communities in the Western English Channel. Environ. Microbiol. 2009, 11, 3132–3139. [Google Scholar] [CrossRef]
- Behringer, D.C.; Silliman, B.R.; Lafferty, K.D. Marine Disease Ecology, 1st ed.; Oxford University Press: Oxford, UK; New York, NY, USA, 2020; p. ix. 269p. [Google Scholar]
- Selakovic, S.; de Ruiter, P.C.; Heesterbeek, H. Infectious disease agents mediate interaction in food webs and ecosystems. Proc. R. Soc. B-Biol. Sci. 2014, 281, 20132709. [Google Scholar] [CrossRef]
- Carlson, C.J.; Hopkins, S.; Bell, K.C.; Dona, J.; Godfrey, S.S.; Kwak, M.L.; Lafferty, K.D.; Moir, M.L.; Speer, K.A.; Strona, G.; et al. A global parasite conservation plan. Biol. Conserv. 2020, 250, 108596. [Google Scholar] [CrossRef]
- Groner, M.L.; Maynard, J.; Breyta, R.; Carnegie, R.B.; Dobson, A.; Friedman, C.S.; Froelich, B.; Garren, M.; Gulland, F.M.D.; Heron, S.F.; et al. Managing marine disease emergencies in an era of rapid change. Philos. Trans. R. Soc. B Biol. Sci. 2016, 371, 20150364. [Google Scholar] [CrossRef]
- Hoenig, J.M.; Groner, M.L.; Smith, M.W.; Vogelbein, W.K.; Taylor, D.M.; Landers, D.F.; Swenarton, J.T.; Gauthier, D.T.; Sadler, P.; Matsche, M.A.; et al. Impact of disease on the survival of three commercially fished species. Ecol. Appl. 2017, 27, 2116–2127. [Google Scholar] [CrossRef]
- Onufryk, J.I.; Ebersole, J.P.; DeFilippo, J.; Beck, G. Diadema antillarum on St. Croix, USVI: Current Status and Interactions with Herbivorous Fishes. Yale J. Biol. Med. 2018, 91, 391–397. [Google Scholar]
- Behrens, M.D.; Lafferty, K.D. Effects of marine reserves and urchin disease on southern Californian rocky reef communities. Mar. Ecol. Prog. Ser. 2004, 279, 129–139. [Google Scholar] [CrossRef]
- Graciaa, D.S.; Cope, J.R.; Roberts, V.A.; Cikesh, B.L.; Kahler, A.M.; Vigar, M.; Hilborn, E.D.; Wade, T.J.; Backer, L.C.; Secor, E.; et al. Outbreaks Associated with Untreated Recreational Water—United States, 2000–2014. Am. J. Transplant. 2018, 67, 701–706. [Google Scholar] [CrossRef]
- WHO. Water Sanitation and Health [EB/OL]. 2015. Available online: https://www.who.int/teams/environment-climate-change-and-health/water-sanitation-and-health (accessed on 10 February 2024).
- Thompson, R.M.; Mouritsen, K.N.; Poulin, R. Importance of parasites and their life cycle characteristics in determining the structure of a large marine food web. J. Anim. Ecol. 2005, 74, 77–85. [Google Scholar] [CrossRef]
- Castello, J.D.; Leopold, D.J.; Smallidge, P.J. Pathogens, patterns, and processes in forest ecosystems. Bioscience 1995, 45, 16–24. [Google Scholar] [CrossRef]
- Sun, X.F.; Wang, X.C.; Han, Q.; Yu, Q.L.; Wanyan, R.J.; Li, H. Bibliometric analysis of papers on antibiotic resistance genes in aquatic environments on a global scale from 2012 to 2022: Evidence from universality, development and harmfulness. Sci. Total Environ. 2024, 909, 168597. [Google Scholar] [CrossRef]
- Lekunberri, I.; Villagrasa, M.; Balcazar, J.L.; Borrego, C.M. Contribution of bacteriophage and plasmid DNA to the mobilization of antibiotic resistance genes in a river receiving treated wastewater discharges. Sci. Total Environ. 2017, 601, 206–209. [Google Scholar] [CrossRef]
- Wang, F.H.; Qiao, M.; Lv, Z.E.; Guo, G.X.; Jia, Y.; Su, Y.H.; Zhu, Y.G. Impact of reclaimed water irrigation on antibiotic resistance in public parks, Beijing, China. Environ. Pollut. 2014, 184, 247–253. [Google Scholar] [CrossRef]
- Li, J.; Cao, J.J.; Zhu, Y.G.; Chen, Q.L.; Shen, F.X.; Wu, Y.; Xu, S.Y.; Fan, H.; Da, G.; Huang, R.J.; et al. Global Survey of Antibiotic Resistance Genes in Air. Environ. Sci. Technol. 2018, 52, 10975–10984. [Google Scholar] [CrossRef]
- Wang, Y.; Lu, S.; Liu, X.; Chen, J.; Han, M.; Wang, Z.; Guo, W. Profiles of antibiotic resistance genes in an inland salt-lake Ebinur Lake, Xinjiang, China: The relationship with antibiotics, environmental factors, and microbial communities. Ecotoxicol. Environ. Saf. 2021, 221, 112427. [Google Scholar] [CrossRef]
- Lv, B.Y.; Cui, Y.X.; Tian, W.; Wei, H.W.; Chen, Q.H.; Liu, B.L.; Zhang, D.; Xie, B. Vessel transport of antibiotic resistance genes across oceans and its implications for ballast water management. Chemosphere 2020, 253, 126697. [Google Scholar] [CrossRef]
- Liu, C.; Chen, J.P.; Yang, Y.Y.; Teng, Y.G.; Chen, H.Y. Biogeography and diversity patterns of antibiotic resistome in the sediments of global lakes. J. Environ. Sci. 2023, 127, 421–430. [Google Scholar] [CrossRef]
- Habibi, N.; Uddin, S.; Lyons, B.; Al-Sarawi, H.A.; Behbehani, M.; Shajan, A.; Razzack, N.A.; Zakir, F.; Alam, F. Antibiotic Resistance Genes Associated with Marine Surface Sediments: A Baseline from the Shores of Kuwait. Sustainability 2022, 14, 8029. [Google Scholar] [CrossRef]
- Levy, S.B.; Marshall, B. Antibacterial resistance worldwide: Causes, challenges and responses. Nat. Med. 2004, 10, S122–S129. [Google Scholar] [CrossRef]
- Stalder, T.; Barraud, O.; Casellas, M.; Dagot, C.; Ploy, M.C. Integron involvement in environmental spread of antibiotic resistance. Front. Microbiol. 2012, 3, 119. [Google Scholar] [CrossRef]
- Jampani, M.; Mateo-Sagasta, J.; Chandrasekar, A.; Fatta-Kassinos, D.; Graham, D.W.; Gothwal, R.; Moodley, A.; Chadag, V.M.; Wiberg, D.; Langan, S. Fate and transport modelling for evaluating antibiotic resistance in aquatic environments: Current knowledge and research priorities. J. Hazard. Mater. 2024, 461, 132527. [Google Scholar] [CrossRef]
- Giacometti, F.; Shirzad-Aski, H.; Ferreira, S. Antimicrobials and Food-Related Stresses as Selective Factors for Antibiotic Resistance along the Farm to Fork Continuum. Antibiotics 2021, 10, 671. [Google Scholar] [CrossRef]
- Fu, S.Z.; Wang, Q.Y.; Wang, R.; Zhang, Y.X.; Lan, R.T.; He, F.L.; Yang, Q. Horizontal transfer of antibiotic resistance genes within the bacterial communities in aquacultural environment. Sci. Total Environ. 2022, 820, 153286. [Google Scholar] [CrossRef]
- Murray, C.J.L.; Ikuta, K.S.; Sharara, F.; Swetschinski, L.; Aguilar, G.R.; Gray, A.; Han, C.; Bisignano, C.; Rao, P.; Wool, E.; et al. Global burden of bacterial antimicrobial resistance in 2019: A systematic analysis. Lancet 2022, 399, 629–655. [Google Scholar] [CrossRef]
- Chen, Y.; Shen, W.T.; Wang, B.; Zhao, X.; Su, L.H.; Kong, M.; Li, H.; Zhang, S.H.; Li, J. Occurrence and fate of antibiotics, antimicrobial resistance determinants and potential human pathogens in a wastewater treatment plant and their effects on receiving waters in Nanjing, China. Ecotoxicol. Environ. Saf. 2020, 206, 111371. [Google Scholar] [CrossRef]
- Steinegger, M.; Söding, J. Clustering huge protein sequence sets in linear time. Nat. Commun. 2018, 9, 2542. [Google Scholar] [CrossRef]
- Evans, F.F.; Egan, S.; Kjelleberg, S. Ecology of type II secretion in marine gammaproteobacteria. Environ. Microbiol. 2008, 10, 1101–1107. [Google Scholar] [CrossRef]
- Liu, Z.H.; Huang, S.B.; Sun, G.P.; Xu, Z.C.; Xu, M.Y. Phylogenetic diversity, composition and distribution of bacterioplankton community in the Dongjiang River, China. FEMS Microbiol. Ecol. 2012, 80, 30–44. [Google Scholar] [CrossRef]
- Mizusawa, N.; Reza, M.S.; Oikawa, C.; Kuga, S.; Iijima, M.; Kobiyama, A.; Yamada, Y.; Ikeda, Y.; Ikeda, D.; Ikeo, K.; et al. Diversity and functions of bacterial communities in water and sediment from the watershed of the Tama River flowing a highly urbanized area. Fish. Sci. 2021, 87, 697–715. [Google Scholar] [CrossRef]
- Kasalicky, V.; Zeng, Y.H.; Piwosz, K.; Simek, K.; Kratochvilová, H.; Koblízek, M. Aerobic Anoxygenic Photosynthesis Is Commonly Present within the Genus Limnohabitans. Appl. Environ. Microbiol. 2018, 84, e02116-17. [Google Scholar] [CrossRef] [PubMed]
- He, Q.L.; Song, Q.; Zhang, S.L.; Zhang, W.; Wang, H.Y. Simultaneous nitrification, denitrification and phosphorus removal in an aerobic granular sequencing batch reactor with mixed carbon sources: Reactor performance, extracellular polymeric substances and microbial successions. Chem. Eng. J. 2018, 331, 841–849. [Google Scholar] [CrossRef]
- Zhao, W.H.; Bi, X.J.; Peng, Y.Z.; Bai, M. Research advances of the phosphorus-accumulating organisms of Candidatus Accumulibacter, Dechloromonas and Tetrasphaera: Metabolic mechanisms, applications and influencing factors. Chemosphere 2022, 307, 135675. [Google Scholar] [CrossRef]
- Ruprecht, J.E.; Birrer, S.C.; Dafforn, K.A.; Mitrovic, S.M.; Crane, S.L.; Johnston, E.L.; Wemheuer, F.; Navarro, A.; Harrison, A.J.; Turner, I.L.; et al. Wastewater effluents cause microbial community shifts and change trophic status. Water Res. 2021, 200, 117206. [Google Scholar] [CrossRef]
- Lv, P.Y.; Luo, J.X.; Zhuang, X.L.; Zhang, D.Q.; Huang, Z.B.; Bai, Z.H. Diversity of culturable aerobic denitrifying bacteria in the sediment, water and biofilms in Liangshui River of Beijing, China. Sci. Rep. 2017, 7, 10032. [Google Scholar] [CrossRef]
- Su, X.; Xu, F.Q.; Chen, S.J.; Gou, F.; Shi, Y.C.; Xing, Z.L.; Peng, R.Q.; Deng, Y.Y.; Zhang, T.; Xiong, J.; et al. Microecological health assessment of water environment and sediment based on metagenomics: A case study of Guixi River in Chongqing, China. Environ. Monit. Assess. 2023, 195, 970. [Google Scholar] [CrossRef]
- Oberbeckmann, S.; Kreikemeyer, B.; Labrenz, M. Environmental Factors Support the Formation of Specific Bacterial Assemblages on Microplastics. Front. Microbiol. 2018, 8, 2709. [Google Scholar] [CrossRef]
- Lu, J.X.; Li, M.T.; Tan, J.C.; He, M.Y.; Wu, H.M.; Kang, Y.; Hu, Z.; Zhang, J.; Guo, Z.Z. Distribution, sources, ecological risk and microbial response of polycyclic aromatic hydrocarbons in Qingdao bays, China. Environ. Pollut. 2023, 338, 122687. [Google Scholar] [CrossRef]
- Olivera, N.L.; Nievas, M.L.; Lozada, M.; del Prado, G.; Dionisi, H.M.; Siñeriz, F. Isolation and characterization of biosurfactant-producing Alcanivorax strains: Hydrocarbon accession strategies and alkane hydroxylase gene analysis. Res. Microbiol. 2009, 160, 19–26. [Google Scholar] [CrossRef]
- Wu, Y.H.; Lai, Q.L.; Zhou, Z.W.; Qiao, N.; Liu, C.L.; Shao, Z.Z. Alcanivorax hongdengensis sp. nov., an alkane-degrading bacterium isolated from surface seawater of the straits of Malacca and Singapore, producing a lipopeptide as its biosurfactant. Int. J. Syst. Evol. Microbiol. 2009, 59, 1474–1479. [Google Scholar] [CrossRef]
- Zadjelovic, V.; Gibson, M.I.; Dorador, C.; Christie-Oleza, J.A. Genome of Alcanivorax sp. 24: A hydrocarbon degrading bacterium isolated from marine plastic debris. Mar. Genom. 2020, 49, 100686. [Google Scholar] [CrossRef]
- Yusupova, A.A.; Giruts, M.V.; Vylekzhanina, D.S.; Semenova, E.M.; Gordadze, G.N. Formation of Petroleum Hydrocarbons from Prokaryote Biomass: 4. Formation of Petroleum Biomarker Hydrocarbons from the Biomass of Halomonas titanicae Bacteria Isolated from Romashkino Crude Oil. Pet. Chem. 2022, 62, 405–410. [Google Scholar] [CrossRef]
- Zhang, J.; Tang, Y.; Kou, Z.G.; Teng, X.; Cai, W.; Hu, J. Shift of Sediments Bacterial Community in the Black-Odor Urban River during In Situ Remediation by Comprehensive Measures. Water 2019, 11, 2129. [Google Scholar] [CrossRef]
- Gomes, N.C.M.; Manco, S.C.; Pires, A.C.C.; Gonçalves, S.F.; Calado, R.; Cleary, D.F.R.; Loureiro, S. Richness and composition of sediment bacterial assemblages in an Atlantic port environment. Sci. Total Environ. 2013, 452, 172–180. [Google Scholar] [CrossRef]
- Jiang, L.; Hu, X.L.; Xu, T.; Zhang, H.C.; Sheng, D.; Yin, D.Q. Prevalence of antibiotic resistance genes and their relationship with antibiotics in the Huangpu River and the drinking water sources, Shanghai, China. Sci. Total Environ. 2013, 458, 267–272. [Google Scholar] [CrossRef]
- Guo, X.P.; Yang, Y.; Lu, D.P.; Niu, Z.S.; Feng, J.N.; Chen, Y.R.; Tou, F.Y.; Garner, E.; Xu, J.; Liu, M.; et al. Biofilms as a sink for antibiotic resistance genes (ARGs) in the Yangtze Estuary. Water Res. 2018, 129, 277–286. [Google Scholar] [CrossRef]
- Nnadozie, C.E.; Odume, O.N. Freshwater environments as reservoirs of antibiotic resistant bacteria and their role in the dissemination of antibiotic resistance genes. Environ. Pollut. 2019, 254, 113067. [Google Scholar] [CrossRef]
- Jerde, C.L.; Olds, B.P.; Shogren, A.J.; Andruszkiewicz, E.A.; Mahon, A.R.; Bolster, D.; Tank, J.L. Influence of Stream Bottom Substrate on Retention and Transport of Vertebrate Environmental DNA. Environ. Sci. Technol. 2016, 50, 8770–8779. [Google Scholar] [CrossRef]
- Huang, D.W.; Li, B.; Qiu, Y.; Li, J. Distribution and co-occurrence of antibiotic resistance genes and bacterial pathogens in the effluent of decentralized sewage treatment systems in China. Int. Biodeterior. Biodegrad. 2023, 180, 105596. [Google Scholar] [CrossRef]
- Harakeh, S.; Yassine, H.; El-Fadel, M. Antimicrobial-resistance of Streptococcus pneumoniae isolated from the lebanese environment. Mar. Environ. Res. 2006, 62, 181–193. [Google Scholar] [CrossRef]
- Harris, A.; Torres-Viera, C.; Venkataraman, L.; DeGirolami, P.; Samore, M.; Carmeli, Y. Epidemiology and clinical outcomes of patients with multiresistant Pseudomonas aeruginosa. Clin. Infect. Dis. 1999, 28, 1128–1133. [Google Scholar] [CrossRef]
- Wan, X.L.; Li, J.; Wang, S.Y.; Fan, F.; McLaughlin, R.W.; Wang, K.X.; Wang, D.; Zheng, J.S. Biogeographic patterns of potential pathogenic bacteria in the middle and lower reaches of the Yangtze River as well as its two adjoining lakes, China. Front. Microbiol. 2022, 13, 972243. [Google Scholar] [CrossRef] [PubMed]
- Reem, A.; Almansoob, S.; Senan, A.M.; Raj, A.K.; Shah, R.J.; Shrewastwa, M.K.; Kumal, J.P.P. Pseudomonas aeruginosa and related antibiotic resistance genes as indicators for wastewater treatment. Heliyon 2024, 10, e29798. [Google Scholar] [CrossRef]
- Siddiqee, M.H.; Henry, R.; Coulthard, R.; Schang, C.; Williamson, R.; Coleman, R.; Rooney, G.; Deletic, A.; McCarthy, D. Salmonella enterica Serovar Typhimurium and Escherichia coli Survival in Estuarine Bank Sediments. Int. J. Environ. Res. Public Health 2018, 15, 2597. [Google Scholar] [CrossRef]
- Stewart, J.R.; Gast, R.J.; Fujioka, R.S.; Solo-Gabriele, H.M.; Meschke, J.S.; Amaral-Zettler, L.A.; del Castillo, E.; Polz, M.F.; Collier, T.K.; Strom, M.S.; et al. The coastal environment and human health: Microbial indicators, pathogens, sentinels and reservoirs. Environ. Health 2008, 7, S3. [Google Scholar] [CrossRef]
- McCarthy, S.A.; Khambaty, F.M. International dissemination of epidemic Vibrio cholerae by cargo ship ballast and other nonpotable waters. Appl. Environ. Microbiol. 1994, 60, 2597–2601. [Google Scholar] [CrossRef]
- Wang, L.; Wang, Q.; Xue, J.Z.; Xiao, N.Y.; Lv, B.Y.; Wu, H.X. Effects of holding time on the diversity and composition of potential pathogenic bacteria in ship ballast water. Mar. Environ. Res. 2020, 160, 104979. [Google Scholar] [CrossRef] [PubMed]


Disclaimer/Publisher’s Note: The statements, opinions and data contained in all publications are solely those of the individual author(s) and contributor(s) and not of MDPI and/or the editor(s). MDPI and/or the editor(s) disclaim responsibility for any injury to people or property resulting from any ideas, methods, instructions or products referred to in the content. |
© 2024 by the authors. Licensee MDPI, Basel, Switzerland. This article is an open access article distributed under the terms and conditions of the Creative Commons Attribution (CC BY) license (https://creativecommons.org/licenses/by/4.0/).