Article

Assessing the Hydrologic Response of a Major Drinking Water Reservoir to Extreme Flood Events and Climate Change Using SWAT and OASIS

1
Department of Geosciences, University of Rhode Island, Kingston, RI 02881, USA
2
Department of Civil and Environmental Engineering, University of Rhode Island, Kingston, RI 02881, USA
*
Author to whom correspondence should be addressed.
Water 2024, 16(18), 2572; https://doi.org/10.3390/w16182572
Submission received: 23 July 2024 / Revised: 30 August 2024 / Accepted: 7 September 2024 / Published: 11 September 2024

Abstract

:
Extreme flood events present a significant challenge for operators and managers of large drinking water reservoirs. Detailed flood response analysis can predict the hydrology response of a reservoir to changing climate conditions and can aid in managing the reservoir in anticipation of extreme events. Herein, the Soil and Water Assessment Tool (SWAT), a watershed model, was used in conjunction with a reservoir management model, the Operational Analysis and Simulation of Integrated Systems (OASIS) model, to evaluate extreme flood events across a set of initial reservoir storage capacities across various CMIP6 climate scenarios. The SWAT model was calibrated and validated with PRISM climate data in conjunction with land and soil cover data and multi-site gauged stream discharges. The validated model demonstrated satisfactory performance (NSE = 0.55 and R2 = 0.56) for total reservoir inflow. The resulting inflow values from SWAT were utilized to set up a calibrated/validated OASIS model (NSE = 0.55 and R2 = 0.68). OASIS was then used to assess alternative operating rules for the reservoir under varying climate scenarios (RCP4.5 and RCP8.5) and extreme events (synthetic hurricanes). Focusing on a major reservoir in the Northeastern United States, the analysis of the reservoir response was based on (1) reservoir volume–elevation curve, (2) daily reservoir inflow, (3) daily precipitation, (4) spillway flow, and (5) reservoir evaporation. Projected future scenarios indicate a >20% increase in precipitation in April compared to historical records, coupled with likely reduced runoff from November to March. With extreme conditions most likely in the month of April, RCP4.5 and RCP8.5 projections suggest that most scenarios result in a 10–15% increase in the mean of 3D30Y runoff volumes, and a 150% increase under the most extreme conditions. For 7D30Y runoff volumes in April, the RCP4.5 and RCP8.5 analyses reveal an increased likelihood of the reservoir elevation reaching overspill flow levels during the latter half of the simulation period (2020 to 2080). Our findings indicate that simulations with SWAT coupled with OASIS can assist reservoir managers in regulating water levels in anticipation of extreme precipitation events.

1. Introduction

Extreme weather events affect the hydrologic response of drinking water reservoirs, and how these reservoirs are managed to minimize detrimental downstream effects must be determined. Since 2000, there have been at least 40 dam failures globally due to extreme precipitation events [1]. Notably, in February 2017, the water level in the Oroville Dam in California quickly rose after heavy rainfall upstream. The water eventually flowed over the top of the dam and heavily damaged its concrete spillway [2]. Although a dam collapse was avoided, nearly 200,000 people had to be evacuated. It stands to reason that a change in reservoir operating procedures in anticipation of this extreme weather event could have avoided, or minimized, the damage that occurred because of spillover.
The average age of dams in the United States exceeds 60 years, and many are in poor to fair condition [3]. Most climate models suggest that winter and spring rains in the western part of the U.S.A. could increase by up to 30 percent by the end of the century [4]. This could stress these dams further and possibly increase the potential for dam failures, such as the failure of the Rapidan Dam along the Blue Earth River in Minnesota, USA after an extreme rain event in June 2024. In the eastern part of the U.S.A., i.e., in the New England region where this study site is located, the most significant precipitation increases will occur in spring and fall [5,6]. The average annual rainfall in the New England region (1040 mm) is predicted to increase by an additional 7% (low emissions scenario) to 14% (high emissions scenario) [5,6,7]. Increasing runoff during early spring is of particular concern in this region because the evapotranspiration rates are low and the soil may still be frozen. At the same time, New England winter precipitation is forecasted to change to rain rather than snow. Climate change has already resulted in a 9-day reduction in snow coverage days across the New England region [7,8,9,10,11]. Furthermore, the average March flows in the region’s rivers are predicted to increase, and peak flows might occur approximately 5.4 days earlier than in the 1930s [8,12]. In addition to changes in seasonal precipitation patterns, the New England region is prone to strong winter storms, referred to as Nor’easters, and hurricane landfalls in late summer and fall [13]. Among these, the Great New England Hurricane of 21 September 1938, stands out as this storm caused unprecedented damage across the northeastern New England Atlantic shore [13,14].
These changes in precipitation patterns suggest that current reservoir management procedures must be reviewed and possibly adjusted to minimize the risk of flooding. This need is exemplified by the Scituate Reservoir watershed of Rhode Island, which overflowed and flooded downstream settlements in response to the 500-year extreme weather event of March 2010 [15,16]. Like many others, this reservoir has not been used for flood mitigation in the past. The main hypothesis was that a detailed flood response analysis predicts a reservoir’s hydrology response to changing climate conditions and can aid in managing the reservoir in the future.
This study focused on the Scituate Reservoir, the largest reservoir and most important source of drinking water in Rhode Island (RI), providing commercial and domestic water needs for 64% of the state. The flood response of the Scituate Reservoir was studied previously using the Hydrologic Engineering Center’s (CEIWR-HEC) Hydrologic Modeling System (HEC-HMS) and Hydrologic Engineering Center’s River Analysis System (HEC-RAS). These models predicted the flood risk in the Pawtuxet River basin downstream from the reservoir [17]; however, they did not define a reservoir mitigation model to predict flood levels for extreme storm events.
One example of a reservoir management model is OASIS (Operational Analysis and Simulation of Integrated Systems), a commercial water resources/operation tool (Hydrologic Inc.) used for real-time flood operations and drought management. OASIS simulates the physical attributes of a water supply system as a network of nodes (reservoirs, demand locations, junctions) and arcs (aqueducts and streams, usually between nodes) (algorithm shown in Supplemental Figure S1). Based on user-supplied time series of tributary inflows and water demands, physical system attributes (storage vs. elevation for a reservoir, head–discharge relations, spillway capacities, current system status), and specified operating rules, an OASIS model provides a forecast of daily volumes for diversions and releases along with associated changes in storage fSor all reservoirs. The model uses a linear program solver to seek a solution that maximizes the overall value for the system for that day. The water mass balance conditions, physical/hydraulic attributes, and user-defined operating rules are described by coded operating constraints and operating goals. Several reservoir operators have successfully used OASIS. For instance, OASIS was used in conjunction with New York City’s Operation Support Tool (OST) and water quality tool (CE-QUAL-W2) to assess drought and turbidity during future climate conditions in the Catskill drinking water supply system [18,19,20,21]. OASIS was also applied in Asheville, North Carolina, and in New Jersey, for drought plan implementation [22,23].
Another hypothesis was that linking a reservoir management model, like OASIS, with a watershed model, the Soil and Water Assessment Tool (SWAT), provides a tool for predicting reservoir responses to extreme events. SWAT is one of the most widely used models for reservoir-controlled watershed modeling [24,25,26]. Previously, the SWAT reservoir model was used for assessing water quality or for water storage or reservoir capacity assessment [27,28,29,30,31,32,33,34,35,36], beside other uses. The semi-distributed hydrologic parameter SWAT model can be refined by integrating it into a reservoir management model. This integrated modeling approach is used worldwide [37,38,39,40,41,42,43,44,45,46].
One of our main objectives was to evaluate extreme flood events using a set of initial reservoir storage capacities across a range of climate scenarios. To the best of our knowledge, our study is the first to use SWAT in combination with the OASIS model for assessing water storage or reservoir capacity under future climate scenarios. Another research novelty is that although Providing Regional Climates for Impacts Studies (PRECIS) data were used in some studies to evaluate future climate parameters and for flood mitigation purposes [41,47,48,49,50], none used OASIS reservoir simulation combined with Representative Concentration Pathways (RCP) climate scenarios. In addition, while some studies modeled current and future irrigation water shortages or excesses linked to reservoirs [51,52], none implemented reservoir flood mitigation functions. Finally, many coupled models require the integration of multiple tools and models, such as hydrology tools, reservoir operation models, and stochastic scenarios, which poses challenges for replicability across diverse settings in hydrological studies. For example, some researchers used five different models (including a reservoir operation model and a genetic algorithm optimization model) to simulate the Cumberland River in Nashville, Tennessee [53]. Similarly, Turner et al. (2017) presented a model of seasonal streamflow forecasts in emergency response reservoir management and used a bias-corrected climate model and four different hydrologic models, including a forecast-guided stochastic scenario called FoGSS [54]. Our study demonstrates that comparable results can be achieved with fewer tools, using the SWAT and OASIS models only, which enhances robustness and facilitates broader applicability across varied environmental contexts. It is noted that sedimentation processes or ice dam phenomena are not considered herein. As well, remotely sensed data, like MODIS, that provide valuable information about flood detection and mapping, and Synthetic Aperture Radar (SAR) data, which are instrumental in mapping flood extents and identifying inundation areas [53,54], were not used. Overall, the integration of the SWAT and OASIS model frameworks offers valuable insights into improving reservoir management strategies amidst hydro-climatic extreme events. Beyond the specific reservoir studied here, this research holds relevance for reservoir managers globally, equipping them with enhanced preparedness for future climate extremes.

2. Study Area

The Scituate Reservoir (13.7 km2) is owned and operated by the Providence Water Supply Board (PWSB). It is part of the Pawtuxet River Watershed in Rhode Island, United States (239.4 km2), a sub-basin of the Narragansett Bay Watershed. The Scituate Reservoir watershed is mostly forested (55% deciduous, 10% coniferous), while open water and wetlands account for 7.5% and 10.5%, respectively. Only 9.9% of the area is residential, and 5% is otherwise developed [55]. The watershed receives an average annual precipitation of 1196 mm. In March 2010, three consecutive storm events brought about 406.4 mm of rainfall, causing severe floods in the study area [56]. This 500-year flood resulted in approximately 100 million USD in losses, shutting down a major national highway (I-95) for days and putting a wastewater treatment plant out of commission [57].
The elevation of the study area varies from 43 to 247 m, with the highest elevations found in the northwestern part of the study area. The watershed is snow-dominated, with the northern part receiving the highest snowfall. The main river feeding and draining the reservoir is the Pawtuxet River, which contributes 40% of the river water entering the reservoir. The Scituate Reservoir watershed receives 1.007 × 10⁶ m3/day in precipitation. The reservoir water has an average annual temperature range between 8.9 °C and 10.5 °C. The reservoir’s outflow is located at Gainer Memorial Dam (Latitude: 41–45′13″ N, Longitude: 071–35′02″ W). Average outflow and withdrawal are 1.600 × 10⁶ m3/day and 0.3166 × 10⁶ m3/day, respectively, while the average annual evapotranspiration (ET) is 533–634 mm [58]. A minimum water release is required to sustain environmental flow in the river downstream (0.37 × 10⁵ m/day).
An outfall controls the water level in the reservoir at 87.2 m above NAVD88, which corresponds to a usable storage capacity of 138.4 × 10⁶ m3. The reservoir’s outfall elevation can be raised to about 87.6 m by two flashboards, each 0.205 m tall. These flashboards are placed in up to 44 bays (3.09 m wide each) along the spillway (136.2 m total width), stacked on top of each other, and when used, the maximum storage is 144.4 × 10⁶ m3. Water is diverted from the reservoir to a nearby drinking water plant. Of the three intakes available for diversion, only the upper one at 77.5 m above NAVD88 is used during standard reservoir operation (Figure 1). Dead storage is the volume of water below the second intake (72.3 m), representing 7% of the total storage capacity. Because of quality concerns, dead storage water would not be available for supply purposes.

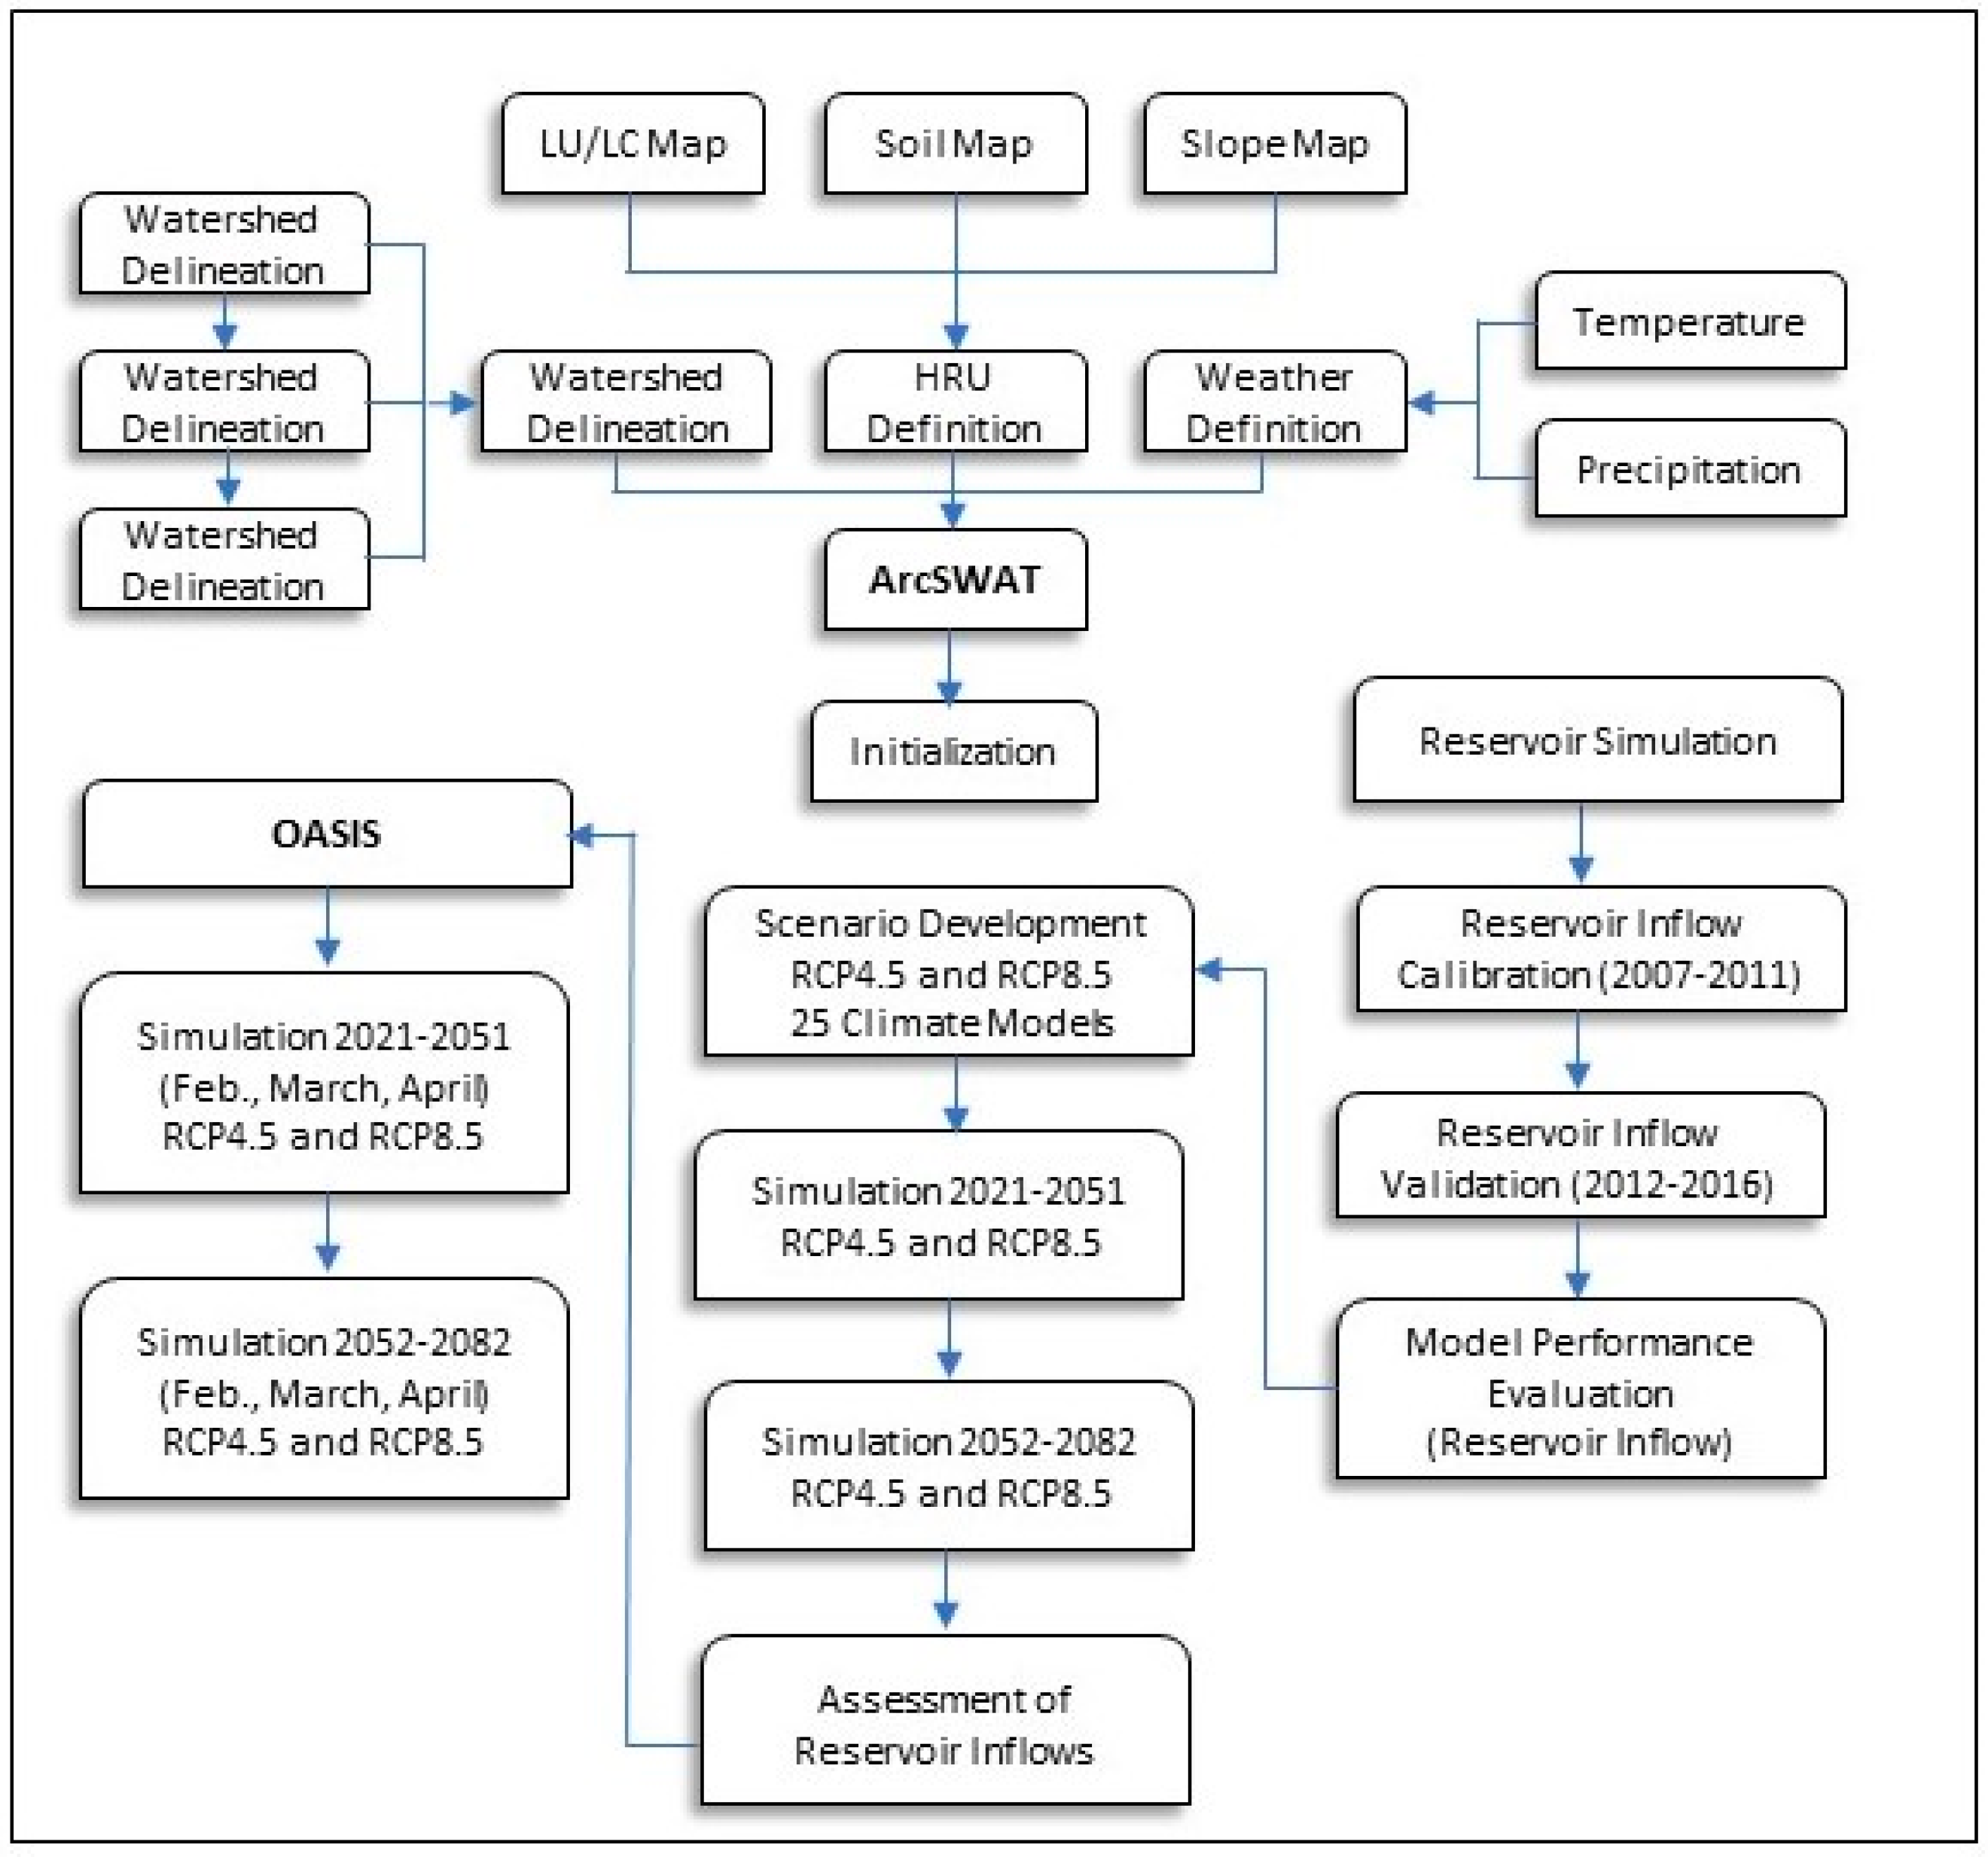
3. Modeling Approach

The integration of a hydrologic model with a reservoir management model requires setting up the models in sequence (Figure 2). Firstly, the hydrologic response of the reservoir is simulated using SWAT, with historical data used for model calibration and validation. The total inflow to the reservoir basin calculated by the SWAT model then serves as the input for the OASIS model.
The SWAT input data consisted of elevations obtained from the United States Geological Survey National Elevation Dataset (NED), land use data from the Rhode Island Geographic Information System (RIGIS), and gridded soil data from the Soil Survey Geographic Database (SSURGO) at a 10 m resolution. Precipitation data were acquired from the Parameter-elevation Regressions on Independent Slopes Model (PRISM climate data), while streamflow data were obtained from USGS gauge stations, specifically station 01115098. The reservoir elevation, storage, and water release data were obtained from the Providence Water Supply Board (PWSB), which operates the reservoir. The calibration period for precipitation and river gauge data was from 1 January 2008, to 31 December 2012, and the validation period was from 1 January 2013 to 31 December 2015. The performance of the SWAT model was assessed using three statistical measures: the Nash–Sutcliffe coefficient (NSE), the coefficient of determination (R2), and the Percentage Bias (PBIAS), which compares observed and simulated inflow.
The reservoir management model, OASIS, was set up separately using data provided by PWSB, including reservoir elevation, storage, water release, and potential flood control storage. Historical inflow was calculated from the mass balance of the reservoir equation. In OASIS, generalized model building blocks are referred to as demand and junction nodes and arcs, which facilitate the conveyance of water from the intake to the drinking water plant or connect with spillover or the required minimum release of water to the river (see Figure S1). Water enters the reservoir node from outside the system, representing the total inflow to the reservoir basin calculated by the SWAT model. This inflow was divided into three components: (i) plant influent, (ii) mandated environmental release to the downstream river, and (iii) spillway overflow during periods when the reservoir elevation exceeds the spillway elevation, with or without flashboards. The fraction of spillway water was added to the environmental release to define the total outflow. The OASIS model was calibrated and validated against usable storage. The calibration period for all OASIS input parameters was from 1995 to 2003, and the validation period was from 2004 to 2015.
After calibrating and validating both models, they were used in combination to forecast future extreme events. Weather data from RCP 4.5 and RCP 8.5 climate models were imported into the calibrated SWAT model. The reservoir inflow was evaluated for two different time periods, namely 2021–2051 and 2052–2082 (Figure 2). Additionally, three hypothetical hurricane events were simulated using the SWAT model to examine the reservoir inflow (Table 1). The total reservoir inflow generated from SWAT under these climate scenarios was utilized as input parameter for the OASIS model (Figure 2). Integrating SWAT and OASIS models facilitated the generation of simulated reservoir elevations. It enabled the modeling of water release patterns (“reservoir management options”) that mitigated the potential for downstream flooding during extreme events.
Accessing reservoir management strategies involves a combination of traditional methods and modern techniques that consider climate change scenarios. Reservoir operators traditionally initiate flood control measures by implementing autumn storage drawdowns to create flood space. These strategies are based on historical observations, considering multi-day runoff volumes and precipitation events with multi-decadal reoccurrence intervals. In the context of climate change, where precipitation patterns and storm frequencies may be less predictable, a more effective method involves leveraging predictive models and advanced analytics [59,60].
The months of August through October were studied for assessing the impact of hurricanes (Table 1). To predict the precipitation resulting from winter storms under climate change scenarios, the ratio changes in 30-day maximum 30-year runoff volumes (3D30Y) from the base period (2006–2017) to future periods were computed. The 3D30Y metric for the November to March period was considered as a proxy indicator of flood control. This period was chosen to allow reservoir levels to be confidently lowered by managers before the period with the highest storm frequency (February to April). The influence of climate change on April flooding for each model under the RCP4.5 and RCP8.5 scenarios was also examined. A lead time of 7 days was assumed for predicting reservoir elevation, as weather forecasting 5–7 days in advance is now standard [61]. The OASIS model was simulated for seven days each year during the time slices of 2021–2051 and 2052–2082 (7D30Y). These simulations were used to assess the uncertainty associated with potential increases in flood levels.

3.1. Preprocessing of Climate Projection

A comprehensive set of 23 climate models (SI-B), representative of the RCP4.5 and RCP8.5 emission pathways, was employed in the SWAT model to generate future reservoir inflow data. The global circulation models (GCMs) and regional circulation model (RCM) data provided by the World Climate Research Program [62] were utilized for this purpose. The Coupled Model Inter-comparison Project (CMIP), periodically conducted by the WCRP, has been instrumental in producing global climate projections. Notably, CMIP6 has significantly contributed to the Assessment Reports of the Intergovernmental Panel on Climate Change [63].
In this study, the Localized Constructed Analogs (LOCA) statistical downscaled CMIP5 climate projections were employed. The LOCA method is a statistical approach that enables the generation of downscaled estimates suitable for hydrological simulations. It achieves this by matching appropriate analog days from observational data using a multi-scale spatial matching scheme. LOCA projections have demonstrated a higher level of reliability in representing extreme weather events compared to other projection methods [64,65,66].
To obtain climate data projections for the period spanning from 2006 to 2099, the geo-data portal (GDP) of the USGS website, specifically the Center for Integrated Data Analytics, was accessed. The historical period from 2006 to 2017 was considered, and a parametric transformation technique was applied to the quantile–quantile relationship between observed precipitation for the study area and historical precipitation from LOCA climate projections [64,65,66,67,68,69,70]. This quantile mapping technique facilitated adjustment and bias correction of the distribution of LOCA climate projections, aligning them with observed precipitation in the study area. For this study, LOCA projections under RCP4.5 and RCP8.5 scenarios were utilized to obtain temperature and precipitation values for the period from 2021 to 2082.

3.2. OASIS: Initial Reservoir Elevation Setting during Synthetic Hurricanes and Winter Storm

Hurricanes typically hit the study area between August and October. The last major hurricane (‘Bob’) made landfall in the study area over 30 years ago (1991). Lacking more recent hurricane data, three recent hurricanes that made landfall along the mid-Atlantic shoreline were considered (Table 1). To assess the potential impact of these events, the precipitation data (Figure 3) were integrated into SWAT to simulate hypothetical total inflow to the reservoir. The simulated reservoir inflows were then analyzed using the OASIS model to evaluate the reservoir’s response and identify optimal options for system operation.
An OASIS model was developed for future climate projections (23 climate models) based on RCP4.5 and RCP8.5 climate scenarios and two 30-year slices: 2021–2051 and 2052–2082. Initially, the focus was on the month of April because winter storms typically occur in the study area during that time.
Historical monthly average reservoir elevation was 85.8 m in April over the 1975 to 2010 period (Figure 4A). At this elevation, the reservoir capacity is 94% (Figure 4C). Over the same period, the minimum monthly reservoir elevation was 82.05 m, equivalent to 62% reservoir capacity.
No severe floods were linked to hurricanes in the study area between 1975 to 2010. Therefore, three synthetic hurricane-caused flooding events were simulated (ExE I through III; (Figure 3). These three events differed in timing, duration, and intensity of the related extreme precipitation events (Table 1). The reservoir’s response to a hurricane event inflow was then modeled with OASIS. Each of the three hurricane scenario simulations in OASIS captured three initial reservoir elevations and corresponding storage capacity percentages: (1) at 82.2 m, 51% reservoir capacity (IR_51), (2) at 85.2 m, 80% reservoir capacity (IR_80, and (3) at 86.8 m, 98% reservoir capacity (IR_98). The scenario IR_51 condition reflects the historical lowest monthly condition of the reservoir in August over the 1975 to 2010 period (Figure 4B,C). The scenario IR_80 condition reflects the historical average monthly condition of the reservoir in August over the 1975 to 2010 period (Figure 4B,C). The average monthly condition of the reservoir in November to March over 1975 to 2010 represents the highest (87.0 m) reservoir elevation (Figures S3–S6). The IR-98 initial conditions represent the worst-case scenario, i.e., an extreme event when the reservoir is near full capacity (98%). Then, these three initial reservoir conditions were tested under the three hypothetical hurricane scenarios. These data sets are ExE I through III (Table 1).
An initial reservoir capacity of 98% (equivalent to 87 m reservoir elevation) was chosen to simulate an extreme Nor’easter-like storm event with RCP 4.5 and RCP 8.5 scenarios among 23 ensembles.

4. Result and Discussion

In this section, the quality of the SWAT and OASIS models after calibration and validation is discussed first, followed by the reservoir response to RCP4.5 and RCP8.5 projections. The results of the winter storm simulations are then presented, followed by the hypothetical hurricane events. The implications of the findings for reservoir management are discussed subsequently.

4.1. SWAT Calibration and Validation

The total inflow of the reservoir from eleven sub-watersheds was analyzed using SWAT. To ensure the accuracy of the model, nine of these sub-watersheds were calibrated and validated using daily streamflow gauge measurements, both in terms of daily and seasonal data (File S3). The daily data results of all but one sub-watershed were classified as “satisfactory” during the validation period, with an NSE of 0.55, a coefficient of determination (R2) of 0.56, and a PBIAS of −8.9%. One sub-watershed was deemed “very good” (NSE = 0.89, R2 = 0.90, and PBIAS of 10.9%). The model’s performance during different seasons for all sub-watersheds was “very good”, with NSE ranging from 0.65 to 0.78, R2 ranging from 0.65 to 0.75, and PBIAS ranging from −8% to −11% during monthly calibration and validation. Overall, the total reservoir inflow was deemed “satisfactory” (NSE = 0.56, R2 = 0.55, and PBIAS of −11.0%). The details of SWAT model calibration and validation and their parameters have been previously described.

4.2. OASIS Calibration and Validation

The OASIS model simulates the reservoir elevation and was calibrated using historical data of total inflow and evaporation from 1 January 1995, to 31 December 2003. By analyzing the relationship between reservoir elevation and usable storage (Figure 4C), the model-predicted functional storage was derived and compared with the observed usable storage. The calibration phase yielded a “very good” agreement (NSE = 0.88 and R2 =0.93) (File S3). During the subsequent validation period, the performance of the OASIS model was “satisfactory” (NSE = 0.55 and R2 =0.68). Overall, the OASIS model produced acceptable performance and can be utilized to assess the impact of extreme events on this reservoir.

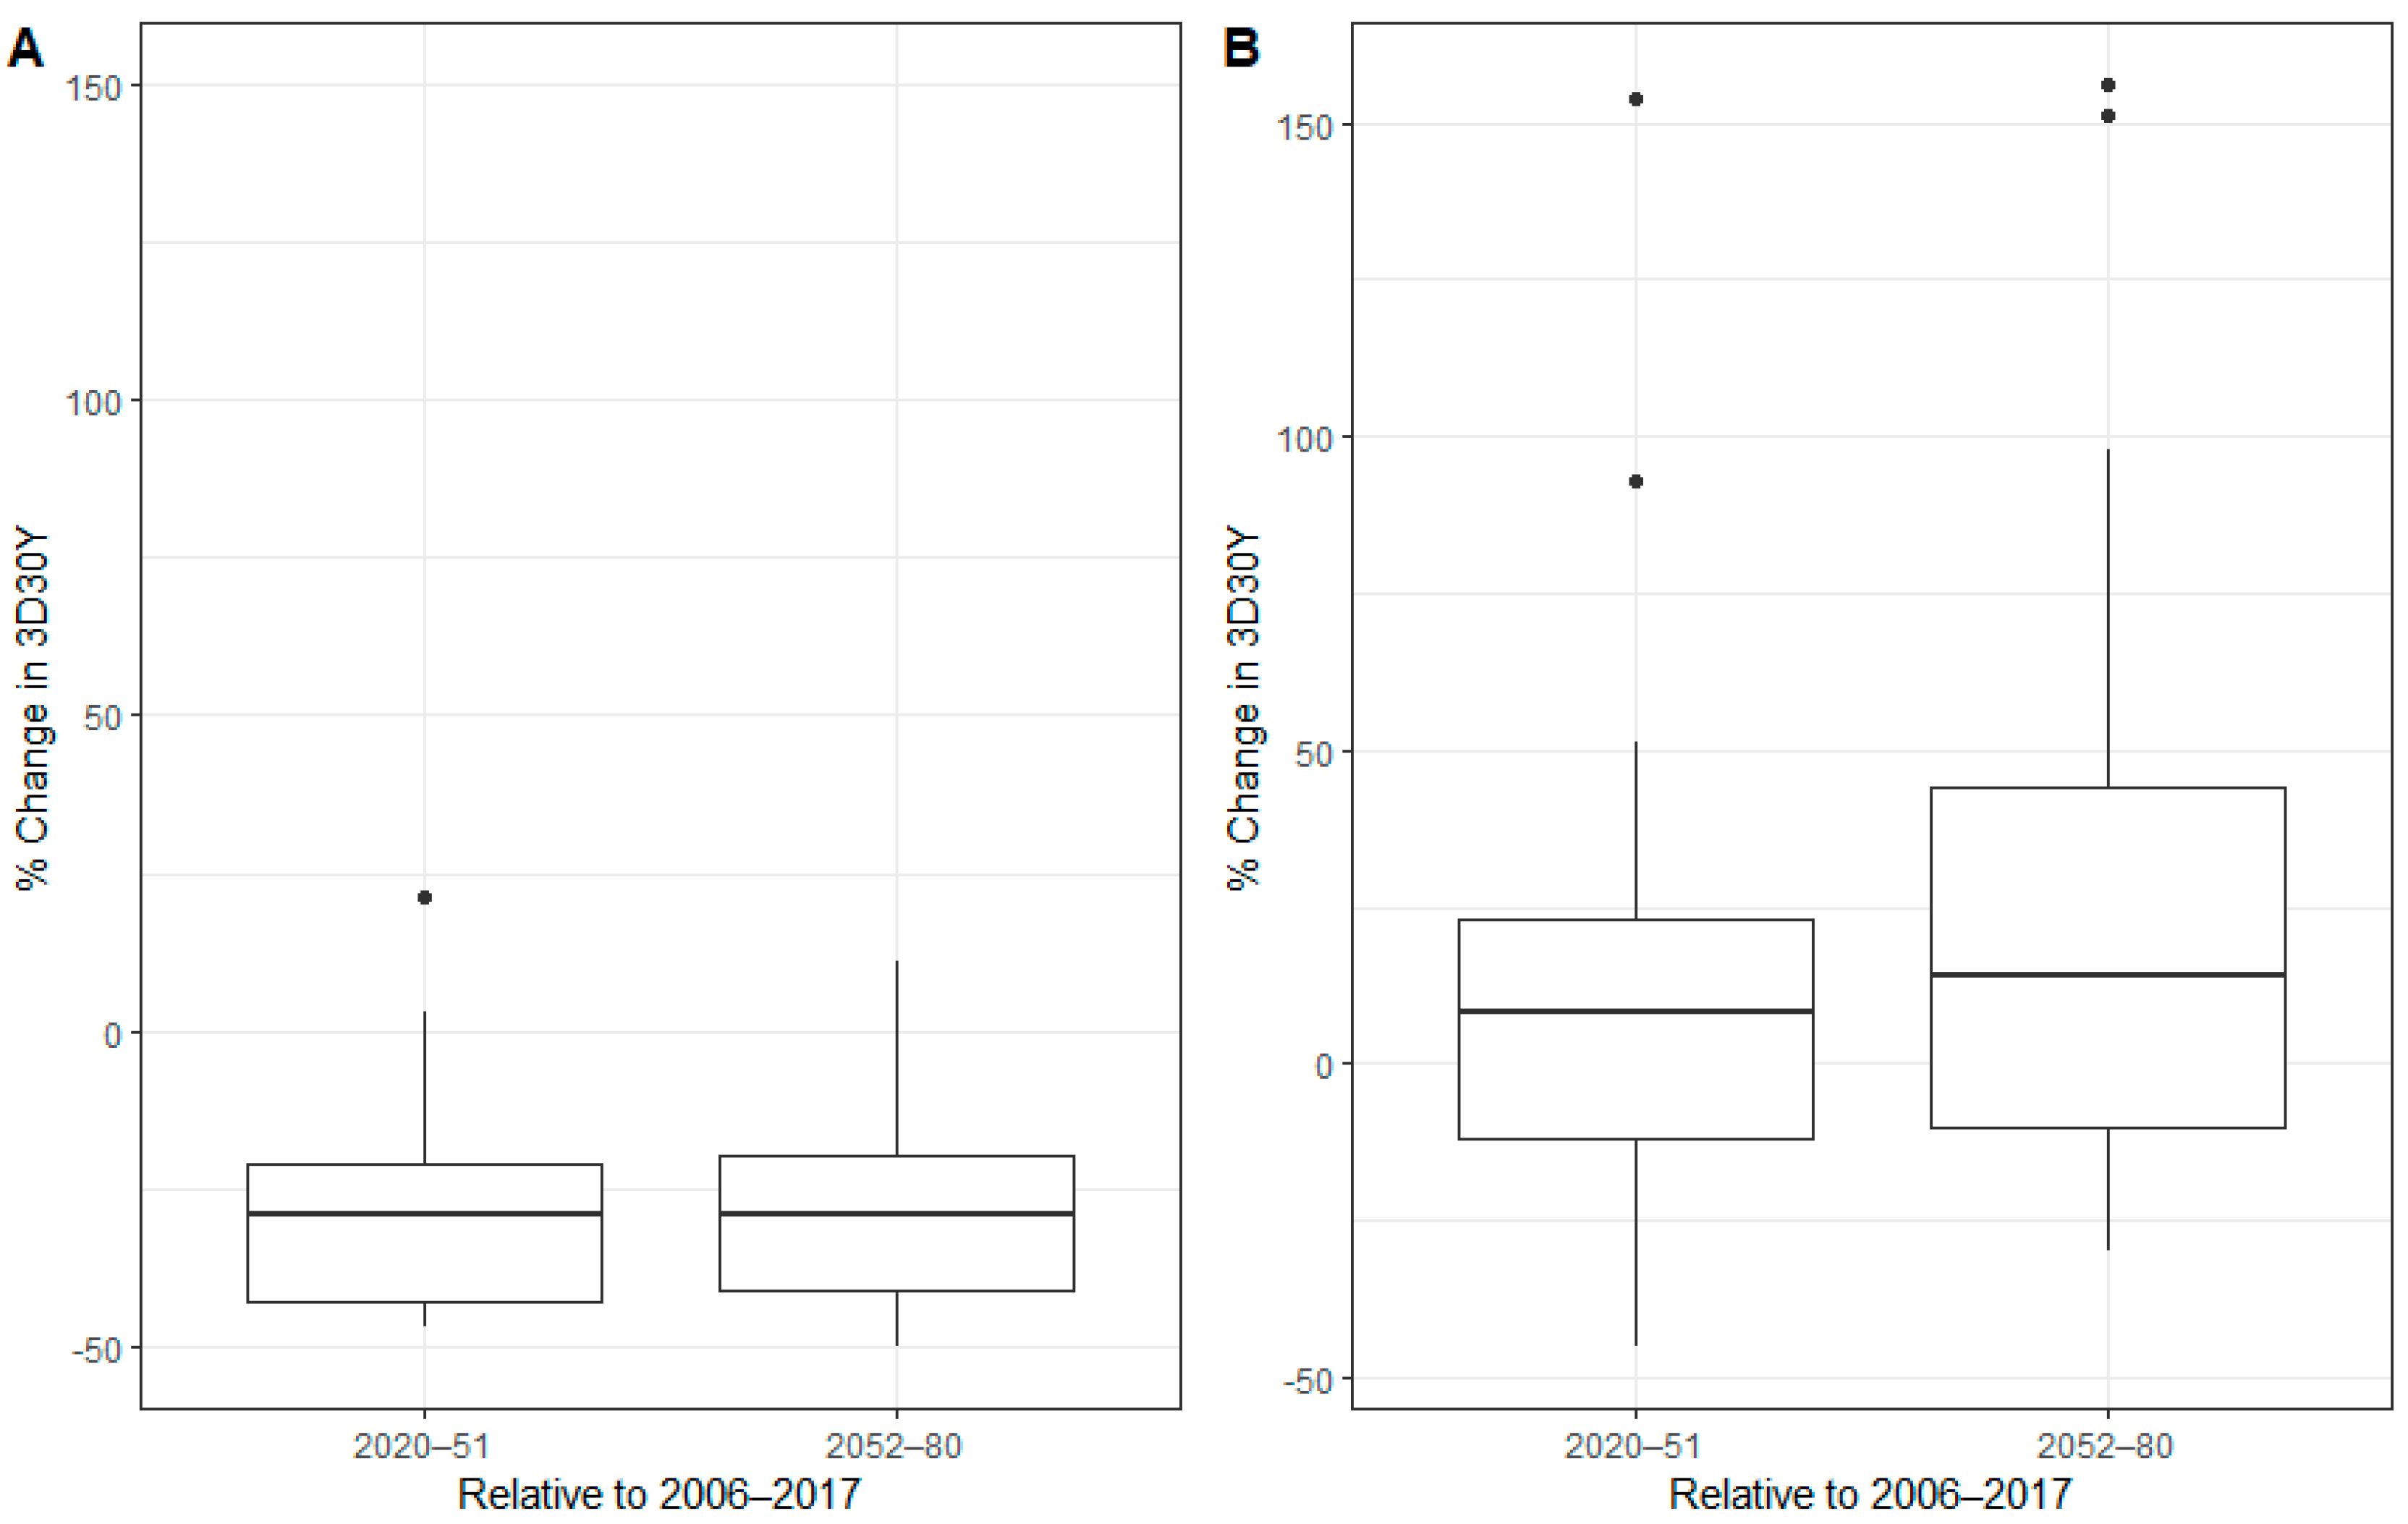
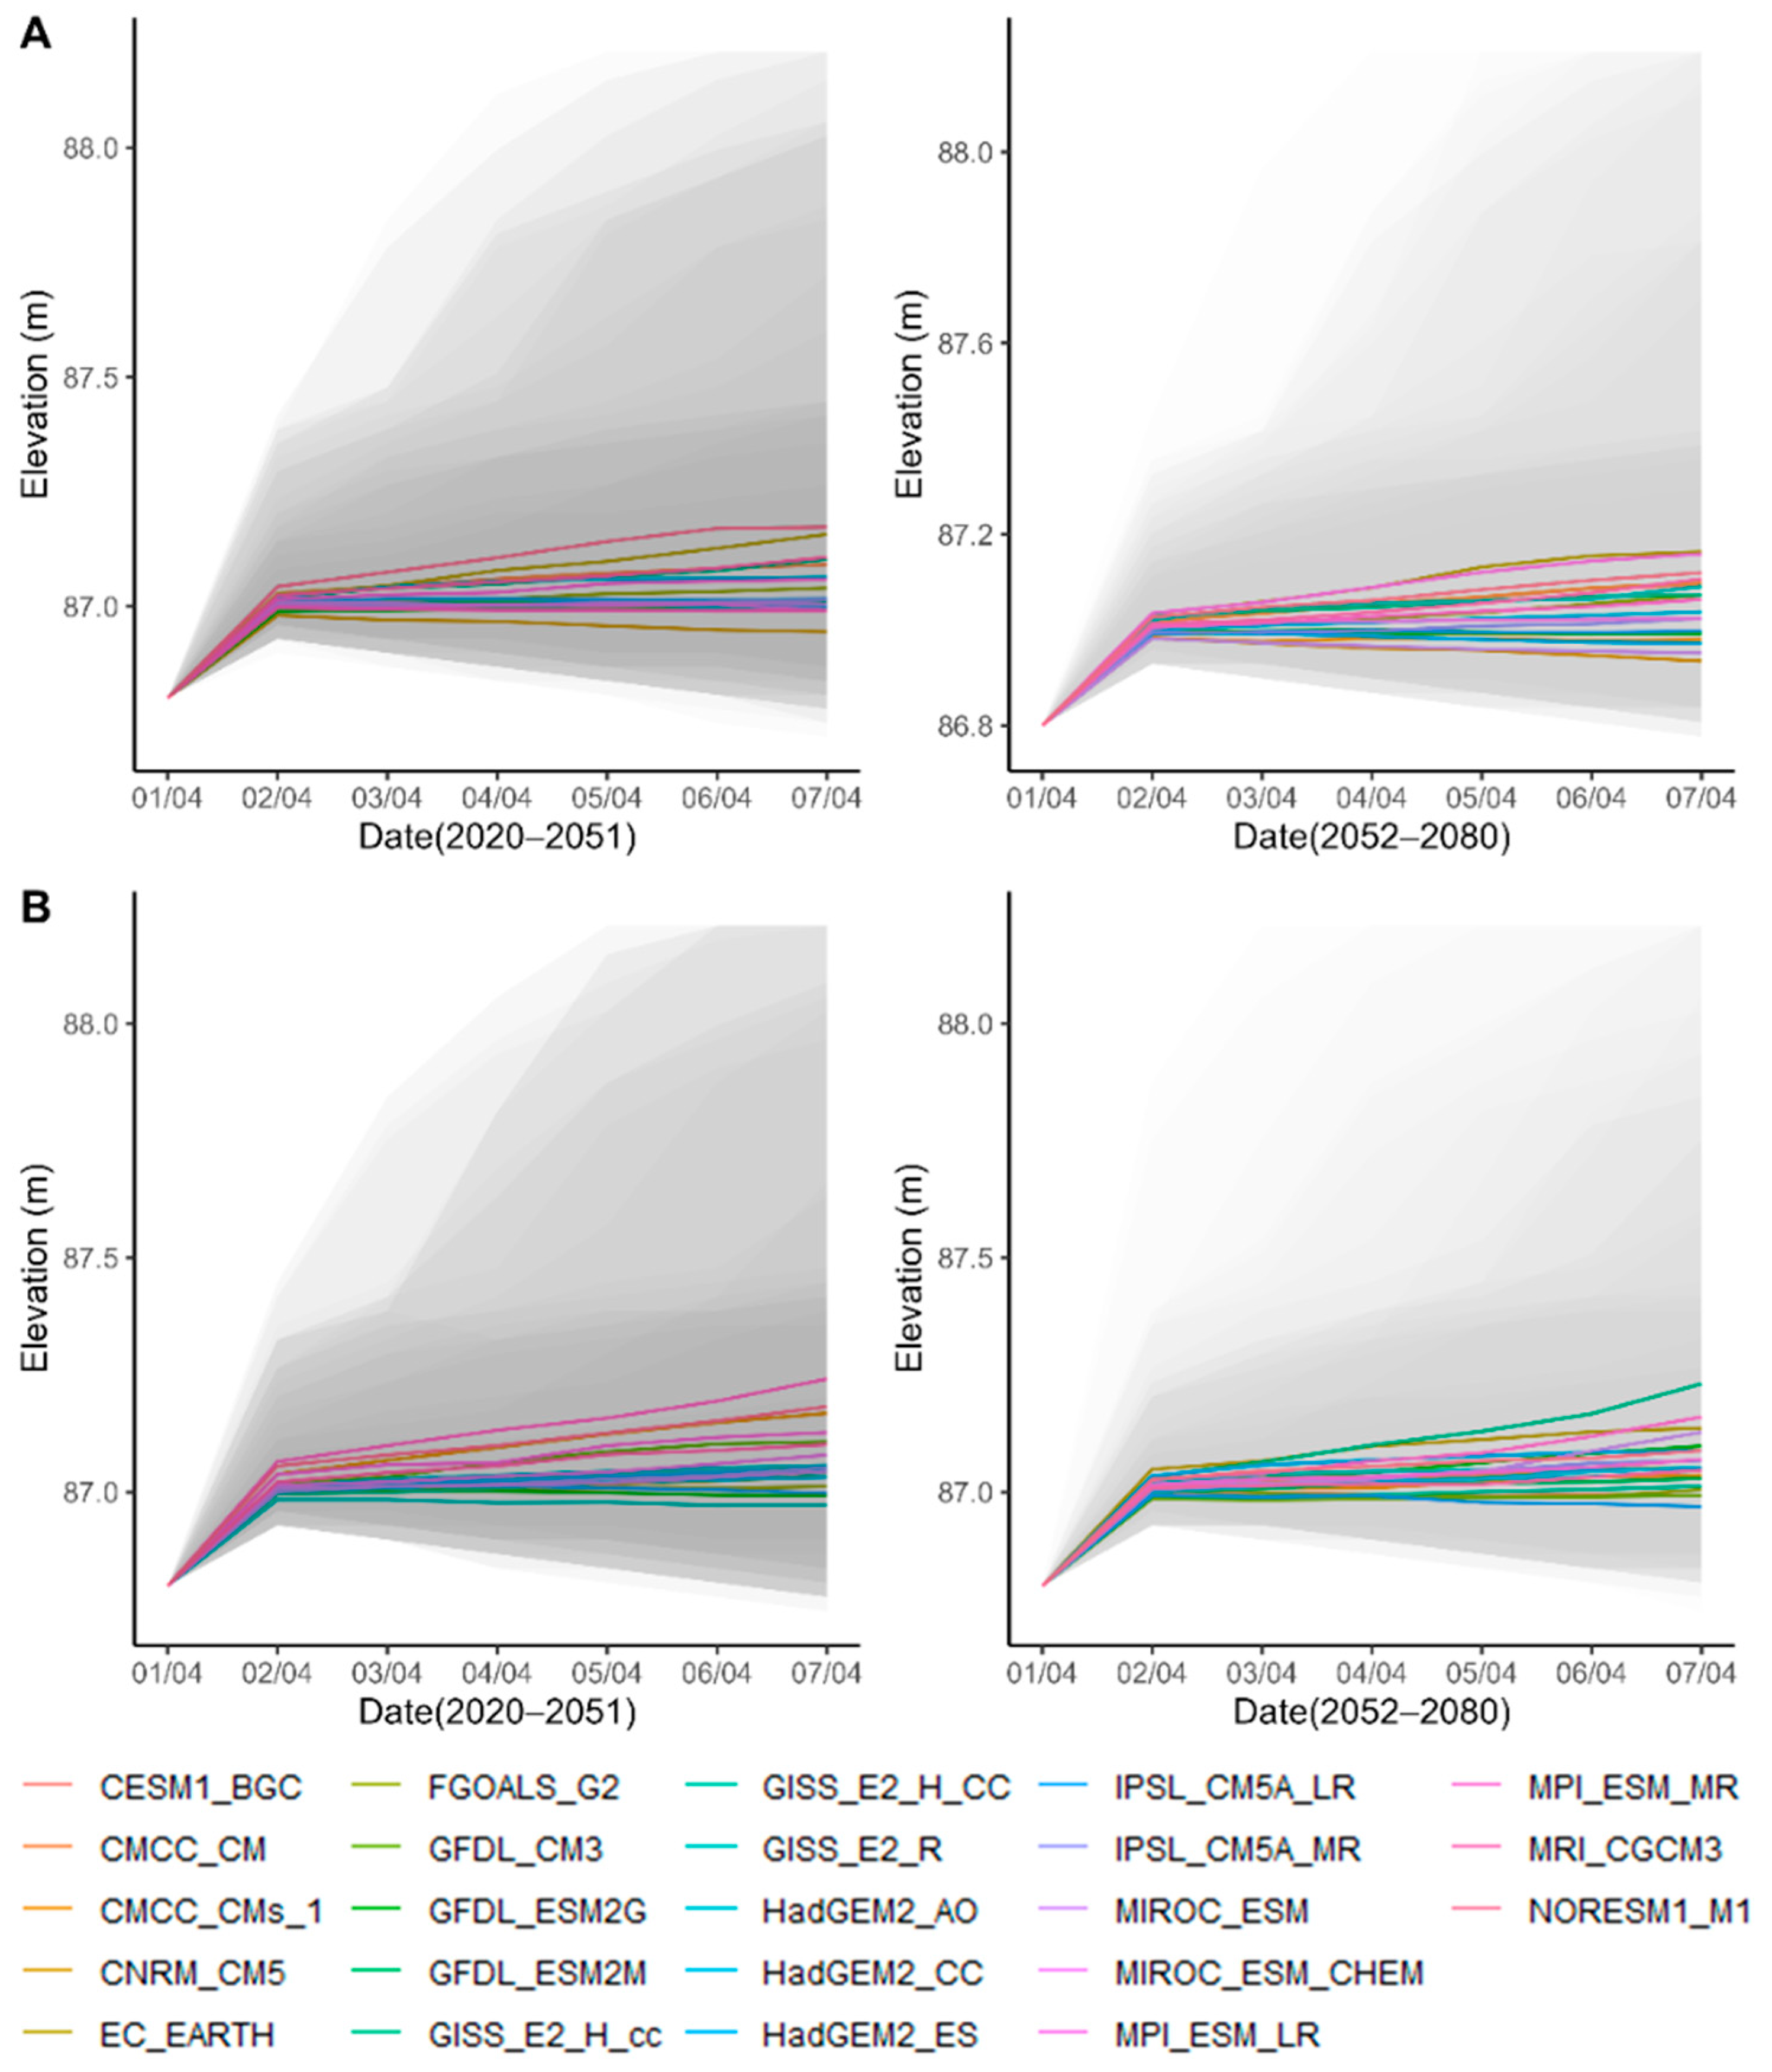
4.3. Reservoir Response to RCP4.5 and RCP8.5 Projections

Nor’easter storms are common in the study area in February to April. Focusing on these months, a comparison of projected changes in total monthly precipitation suggests that among the RCP4.5 climate models, 52% predicted an >10% increase for the month of March during 2021–2051 and >20% for 2052–2082, compared to the historical period (2006–2017). For April, ~40% of the RCP4.5 climate models predicted a >20% increase in precipitation during the same future periods (Table 2 (a)). Among the RCP8.5 climate models, 88% predicted a >20% increase in total monthly precipitation for future March and April periods compared to historical records (Table 2 (b)). Together, these findings indicate an increased likelihood of future flooding events in the study area, regardless of the climate scenario considered.
A notable 70% or higher percentage of climate models predicted an increase in April rainfall over the 2020–2051 and the 2052–2080 periods under RCP4.5 and RCP8.5 projections (Table 2). The projected February precipitation models generally predicted lower amounts of rainfall than historical, particularly under RCP4.5 projections.
To analyze the impact of future precipitation scenarios on the reservoir, the SWAT model output for reservoir inflow was integrated into OASIS. Figure 5 illustrates the impact of RCP4.5 and RCP8.5 projections on the reservoir. It presents the percentage change future periods of 3D30Y relative to the base (2006–2017 period), distributed across impact ensemble members, focusing on November to March and April. Most scenarios indicate a decrease in the 3D30Y volume for November to March, suggesting a potential decline in the occurrence of winter season floods related to this period in the future. Conversely, most scenarios suggest an increase in the mean of 3D30Y for April, around 10–15% (Figure 5B). Under the most extreme conditions, the increase in 3D30Y for April can reach up to 150%.
The data set implies that reservoir managers may be less concerned in the future about extreme events taking place during the period from November to March (Figure 5A), but likely face management challenges once April arrives (Figure 5B). In other words, future reservoir operation rules can anticipate operating the reservoir at high storage capacity during much of the winter and early spring. However, reservoir levels should be proactively reduced before April to provide storage capacity as the likelihood of extreme events increases in future years.
Even though monthly precipitation is increasing according to climate models, runoff and reservoir elevation do not necessarily increase at the same rate due to evaporation (Evp) and groundwater (GW) losses. Therefore, a separate analysis of runoff and reservoir elevation was conducted, and the impact of the climate models on average reservoir elevation in April was examined, as this period is predicted to be the most affected in terms of increasing precipitation. The analysis of the RCP4.5 models (Figure 6A) and RCP8.5 scenarios (Figure 6B) for 7D30Y April reveals that the reservoir elevation may increasingly reach overspill flow level (87.2 m) during the latter half of the simulation period (2020 to 2080). The data further suggest that Evp and infiltration to GW losses would be outweighed by the predicted increase in precipitation and that even though monthly precipitation would increase, the runoff would not change at the same rate as precipitation. However, there is significant uncertainty, with the 95th percentile of climate models predicting a likelihood of spillover occurring at least some of the time.

4.4. Comparison of Reservoir Impact on Flooding during Hurricane Events

The ExE II scenario was the most intenseuuuu storm event simulated, i.e., the precipitation rate would have been five times higher than the average for the study area, equivalent to a 500-year return period event. The SWAT simulation indicates that the maximum reservoir inflow rate during the ExE II event would have been 378 m3/s.
If hypothetical hurricane ExE II had hit when the reservoir was at 51% reservoir capacity (i.e., at initial elevation 82.2 m), the combined SWAT/OASIS model would have predicted a rise by 3.2 m in reservoir elevation. Although the spillover flow elevation (87.2 m) would not be reached, the reservoir capacity would have changed from 51% to 80%, illustrating that under the simulated conditions and the timing of the storm, the reservoir could have accommodated the excess inflow. However, on 27 October 2012, the reservoir was at 80% capacity (Table 3). Under that baseline condition, significant overflow (around 127 m3/s) would have occurred within one day of the extreme event. The reservoir would have stayed at overflow levels for 14 days (16 days under the 98% scenario).
If ExE I hurricane had hit the study area on 26 August 2011, the SWAT simulation indicates that the maximum reservoir inflow rate would have been 254 m3/s and the reservoir elevation would have increased from 82.1 m to 84.2 m within one day, based on OASIS (Figure 7). This event would have changed the reservoir capacity from 51% to 80% without resulting in spillover. However, when ExE I was simulated under IR_80 and IR_98 conditions, the reservoir would have reached the spillover elevation (87.2 m) after 4 days and 2 days, respectively, resulting in ~110 m3/s spillover flow under both conditions. The reservoir would have remained in an overflow state for 18 days without spill board intervention.
The ExE III precipitation intensity was intermediate relative to the other two hurricanes (Table 1), but the rain produced by ExE III was spread out over three days, resulting in a broader peak, including a secondary peak, compared to the other two hurricanes (Figure 7). The simulated reservoir level surged to 87.9 m across all three baseline reservoir elevation scenarios within 13, 7, and 4 days. With a total spillway elevation of 87.61 m utilizing two flashboards, the absence of precautionary measures could lead to overflow prevention failure. The spillway elevation would have been exceeded in all three initial reservoir elevation scenarios. Among these, the EXE III synthetic hurricane scenario most effectively demonstrated the reservoir’s inability to prevent overflow following this extreme event. The ExE III scenario also suggest that relatively minor extreme events can set conditions for a more significant extreme event when occurring within a short time (~days) from each other. The additive character of consecutive storms leading to a major event was illustrated in the actual study area in March 2012, when a week of moderate consecutive storms resulted in a massive 500-year flooding event. It is speculated that if the SWAT/OASIS model had been available at the time, it could have warned the reservoir managers about storage capacity limits and might have given them time for a controlled release of reservoir water before the cumulative storm events.

5. Conclusions

The study investigated reservoir management options during extreme weather events in the New England region. It was hypothesized that (1) linking a reservoir management model like OASIS with a watershed model like SWAT could accurately predict reservoir responses to extreme events, such as Nor’easter storms and hurricanes, and (2) the effects of future climates on the reservoir could be predicted with reasonable accuracy. To test these hypotheses, inflow data from SWAT were fed into a calibrated and validated OASIS model, utilizing two climate projections (RCP4.5 and RCP8.5). The reservoir response to future winter storms and hypothetical hurricane scenarios was then assessed.
Insights gained from the study revealed increasing precipitation during certain times of the year contrasted with decreased amounts in others, as well as cascading effects from consecutive storms. These findings underscore the complexity of reservoir management and provide opportunities to explore alternative operating guidelines.
Projected future scenarios indicate a >20% increase in precipitation for April compared to historical records, coupled with likely reduced runoff from November to March. RCP4.5 and RCP8.5 projections suggest a 10–15% increase in the 3D30Y mean for April, with extreme conditions potentially leading to an increase of up to 150%. Analysis also shows an increased likelihood of the reservoir elevation reaching overspill flow levels (87.2 m) during the latter half of the simulation period (2020 to 2080).
These shifts challenge reservoir management by requiring a balance between securing adequate water storage capacity and using the reservoir for flood control. In reservoirs not originally designed for flood control, such as the one studied, maintaining year-round water supply often takes precedence over flood control.
Simulations also indicate that extreme precipitation events will become more frequent in the future, making it more likely that reservoirs will reach or exceed capacity. This may reduce the pressure on reservoir managers to keep reservoirs near full capacity year-round. A model-based approach, using the combined SWAT/OASIS tool along with accurate long-term weather forecasts, could support reservoir operators in prioritizing flood control over maximum storage capacity. This approach may help mitigate future extreme precipitation damage.
The benefits of combining watershed and reservoir simulations were demonstrated through modeling hypothetical hurricane events and strong winter storms. The combined SWAT/OASIS model proved useful for predicting reservoir responses to current and future extreme events. Integrating climate change scenarios and advanced analytics, including real-time monitoring, with reliable long-term forecasts, supports proactive decision-making and reduces risks associated with changing climatic conditions.
Despite these insights, gaps in understanding the long-term impacts of climate change and extreme events are acknowledged, in addition to the importance of local conditions, such as the frequency and intensity of extreme events, drainage patterns, and hydrogeologic characteristics, that influence surface runoff and reservoir dynamics. Additionally, the study did not address potential effects of ice dam formation or sedimentation on reservoir infrastructure and water quality. Further research is warranted to develop a comprehensive understanding of reservoir dynamics in the context of climate change.

Supplementary Materials

The following supporting information can be downloaded at: https://www.mdpi.com/article/10.3390/w16182572/s1, Supplementary Files S1–S3.

Author Contributions

S.P.: Conceptualization, Methodology, Data Processing, Software, Calibration, Validation, Formal analysis, Writing—Original draft preparation, Editing. S.M.P.: Conceptualization, Funding acquisition, Methodology, Model/Software supervision, Writing—Reviewing and Editing. T.B.B.: Conceptualization, Funding acquisition, Methodology, Model/Software supervision, Writing—Reviewing and Editing. All authors have read and agreed to the published version of the manuscript.

Funding

This research was funded by the Rhode Island-Community Development Block Grant-Disaster Relief AWD05373, Multistate Hatch Grant S1063 and S1089, and College of Environment and Life Sciences, University of Rhode Island.

Data Availability Statement

Data can be made available upon request.

Acknowledgments

We would like to acknowledge the Providence Water Supply Board (PWSB) for giving us the regional data. We also acknowledge Steven Nebiker, Hazen and Sawyer, for helping us set up the OASIS model.

Conflicts of Interest

The authors declare no conflict of interest.

References

  1. Vahedifard, F.; Madani, K.; AghaKouchak, A.; Thota, S.K. Are We Ready for More Dam Removals in the United States. Environ. Res. Infrastruct. Sustain. 2021, 1, 013001. [Google Scholar] [CrossRef]
  2. National Climate Data Center. Billion-Dollar Weather and Climate Disasters; National Climate Data Center (NCDC): Asheville, NC, USA, 2017. [Google Scholar]
  3. American Society of Civil Engineers. Report Card on America’s Infrastructure: Dams; The American Society of Civil Engineers (ASCE): Washington, DC, USA, 2017. [Google Scholar]
  4. Robinson, J.D.; Vahedifard, F.; AghaKouchak, A. Rainfall-Triggered Slope Instabilities under a Changing Climate: Comparative Study Using Historical and Projected Precipitation Extremes. Can. Geotech. J. 2017, 54, 117–127. [Google Scholar] [CrossRef]
  5. Hayhoe, K.; Wake, C.P.; Huntington, T.G.; Luo, L.; Schwartz, M.D.; Sheffield, J.; Wood, E.; Anderson, B.; Bradbury, J.; DeGaetano, A. Past and Future Changes in Climate and Hydrological Indicators in the US Northeast. Clim. Dyn. 2007, 28, 381–407. [Google Scholar] [CrossRef]
  6. Huntington, T.G.; Richardson, A.D.; McGuire, K.J.; Hayhoe, K. Climate and Hydrological Changes in the Northeastern United States: Recent Trends and Implications for Forested and Aquatic Ecosystems. Can. J. For. Res. 2009, 39, 199–212. [Google Scholar] [CrossRef]
  7. Keim, B.D.; Rock, B. Chapter 2—The New England Region’s Changing Climate. In Preparing for a Changing Climate: The Potential Consequences of Climate Variability and Change. The New England Regional Assessment Overview; The U.S. Global Change Research Program; University of New Hampshire: Durham, NH, USA, 2001; pp. 8–17. [Google Scholar]
  8. Hodgkins, G.A.; Dudley, R.W. Changes in the Timing of Winter–Spring Streamflows in Eastern North America, 1913–2002. Geophys. Res. Lett. 2006, 33, L06402. [Google Scholar] [CrossRef]
  9. Burakowski, E.A.; Wake, C.P.; Braswell, B.; Brown, D.P. Trends in Wintertime Climate in the Northeastern United States: 1965–2005. J. Geophys. Res. Atmos. 2008, 113, D20114. [Google Scholar] [CrossRef]
  10. Rustad, L.E.; Campbell, J.; Dukes, J.S.; Huntington, T.; Lambert, K.F.; Mohan, J.; Rodenhouse, N. Changing Climate, Changing Forests: The Impacts of Climate Change on Forests of the Northeastern United States and Eastern Canada; US Department of Agriculture, Forest Service, Northern Research Station: Newtown Square, PA, USA, 2012; ISBN 1505826985. [Google Scholar]
  11. Homer, C.; Dewitz, J.; Jin, S.; Xian, G.; Costello, C.; Danielson, P.; Gass, L.; Funk, M.; Wickham, J.; Stehman, S. Conterminous United States Land Cover Change Patterns 2001–2016 from the 2016 National Land Cover Database. ISPRS J. Photogramm. Remote Sens. 2020, 162, 184–199. [Google Scholar] [CrossRef]
  12. Hartley, S.; Dingman, S.L. Effects of Climatic Variability on Winter-Spring Runoff in New England River Basins. Phys. Geogr. 1993, 14, 379–393. [Google Scholar] [CrossRef]
  13. Morang, A. Hurricane Barriers in New England and New Jersey: History and Status after Five Decades. J. Coast. Res. 2016, 32, 181–205. [Google Scholar] [CrossRef]
  14. Schlichting, K.M. Misremembering Risk in the Age of Hurricanes: The Rhode Island Coast in the 1930s–1950s. Coast. Stud. Soc. 2022, 1, 10–33. [Google Scholar] [CrossRef]
  15. Zarriello, P.J.; Ahearn, E.A.; Levin, S.B. Magnitude of Flood Flows for Selected Annual Exceedance Probabilities in Rhode Island through 2010; US Geological Survey: Reston, VA, USA, 2012. [Google Scholar]
  16. Burke, J.L. The Great Flood of 2010: A Municipal Response. J. N. Engl. Water Work. Assoc. 2012, 126, 230. [Google Scholar]
  17. Hashemi, M.R.; Kouhi, S.; Kian, R.; Spaulding, M.; Steele, S.; Damon, C.; Boyd, J. Integrated Watershed and River Modeling Study of the Pawtuxet River; University of Rhode Island: Narragansett, RI, USA, 2017. [Google Scholar]
  18. National Academies of Science, Engineering, and Medicine (NASEM). Review of the New York City Department of Environmental Protection Operations Support Tool for Water Supply; The National Academies Press: Washington, DC, USA, 2019. [Google Scholar] [CrossRef]
  19. Rush, P.V.; Murphy, T.; Mayer, R.A.; Johnstone, T.; Olivio, D.; Woods, H.J. Water System Safe Yield Calculation; New York City Department of Environmental Protection: New York, NY, USA, 2011. [Google Scholar]
  20. Rossi, N.; DeCristofaro, L.; Steinschneider, S.; Brown, C.; Palmer, R. Potential Impacts of Changes in Climate on Turbidity in New York City’s Ashokan Reservoir. J. Water. Resour. Plan. Manag. 2016, 142, 04015066. [Google Scholar] [CrossRef]
  21. Gelda, R.K.; Mukundan, R.; Matonse, A.H.; Owens, E.M.; Mead, J. Assessment of Climate Change Impacts on New York City Water Supply System. In World Environmental and Water Resources Congress 2020; American Society of Civil Engineers: Reston, VA, USA, 2020; pp. 152–166. [Google Scholar]
  22. Rivera, M.; Nebiker, S.; Wright, B. Dynamic Reservoir Operations Support Sustainable Water Management. Opflow 2016, 42, 12–16. [Google Scholar] [CrossRef]
  23. Stephenson, D. Water Resource Management, 1st ed.; CRC Press: London, UK, 2003; Volume 336. [Google Scholar] [CrossRef]
  24. Neitsch, S.L.; Arnold, J.G.; Kiniry, J.R.; Srinivasan, R.; Williams, J.R. Soil and Water Assessment Tool User’s Manual; Texas Water Resources Institute: College Station, TX, USA, 2002. [Google Scholar]
  25. Gassman, P.W.; Reyes, M.R.; Green, C.H.; Arnold, J.G. The Soil and Water Assessment Tool: Historical Development, Applications, and Future Research Directions. Trans. ASABE 2007, 50, 1211–1250. [Google Scholar] [CrossRef]
  26. Shaabani, M.K.; Abedi-Koupai, J.; Eslamian, S.S.; Gohari, S.A.R. Simulation of the Effects of Climate Change, Crop Pattern Change, and Developing Irrigation Systems on the Groundwater Resources by SWAT, WEAP and MODFLOW Models: A Case Study of Fars Province, Iran. Environ. Dev. Sustain. 2024, 26, 10485–10511. [Google Scholar] [CrossRef]
  27. Xu, Z.X.; Pang, J.P.; Liu, C.M.; Li, J.Y. Assessment of Runoff and Sediment Yield in the Miyun Reservoir Catchment by Using SWAT Model. Hydrol. Process. Int. J. 2009, 23, 3619–3630. [Google Scholar] [CrossRef]
  28. Hunink, J.E.; Niadas, I.A.; Antonaropoulos, P.; Droogers, P.; De Vente, J. Targeting of Intervention Areas to Reduce Reservoir Sedimentation in the Tana Catchment (Kenya) Using SWAT. Hydrol. Sci. J. 2013, 58, 600–614. [Google Scholar] [CrossRef]
  29. Liu, X.; Yang, M.; Meng, X.; Wen, F.; Sun, G. Assessing the Impact of Reservoir Parameters on Runoff in the Yalong River Basin Using the SWAT Model. Water 2019, 11, 643. [Google Scholar] [CrossRef]
  30. Al-Ansari, N.; Ezz-Aldeen, M.; Knutsson, S. Application of Swat Model to Estimate the Sediment Load from the Left Bank of Mosul Dam. J. Adv. Sci. Eng. Res. 2013, 3, 47–61. [Google Scholar]
  31. Mishra, A.; Froebrich, J.; Gassman, P.W. Evaluation of the SWAT Model for Assessing Sediment Control Structures in a Small Watershed in India. Trans. ASABE 2007, 50, 469–477. [Google Scholar] [CrossRef]
  32. Licciardello, F.; Toscano, A.; Cirelli, G.L.; Consoli, S.; Barbagallo, S. Evaluation of Sediment Deposition in a Mediterranean Reservoir: Comparison of Long Term Bathymetric Measurements and SWAT Estimations. Land Degrad. Dev. 2017, 28, 566–578. [Google Scholar] [CrossRef]
  33. Gessese, A.; Yonas, M. Prediction of Sediment Inflow to Legedadi Reservoir Using SWAT Watershed and CCHE1D Sediment Transport Models. Nile Basin Water Eng. Sci. Mag. 2008, 1, 65–74. [Google Scholar]
  34. Afshar, A.A.; Hassanzadeh, Y. Determination of Monthly Hydrological Erosion Severity and Runoff in Torogh Dam Watershed Basin Using SWAT and WEPP Models. Iran. J. Sci. Technol. Trans. Civ. Eng. 2017, 41, 221–228. [Google Scholar] [CrossRef]
  35. Lee, J.; Lee, Y.; Woo, S.; Kim, W.; Kim, S. Evaluation of Water Quality Interaction by Dam and Weir Operation Using SWAT in the Nakdong River Basin of South Korea. Sustainability 2020, 12, 6845. [Google Scholar] [CrossRef]
  36. Nazari-Sharabian, M.; Taheriyoun, M. Climate Change Impact on Water Quality in the Integrated Mahabad Dam Watershed-Reservoir System. J. Hydro-Environ. Res. 2022, 40, 28–37. [Google Scholar] [CrossRef]
  37. Chou, F.N.F.; Wu, C.W. Stage-Wise Optimizing Operating Rules for Flood Control in a Multi-Purpose Reservoir. J. Hydrol. 2015, 521, 245–260. [Google Scholar] [CrossRef]
  38. Hsu, N.S.; Wei, C.C. A Multipurpose Reservoir Real-Time Operation Model for Flood Control during Typhoon Invasion. J. Hydrol. 2007, 336, 282–293. [Google Scholar] [CrossRef]
  39. Turner, S.W.D.; Bennett, J.; Robertson, D.; Galelli, S. Value of Seasonal Streamflow Forecasts in Emergency Response Reservoir Management. Hydrol. Earth Syst. Sci. Discuss. 2017, 691, 1–26. [Google Scholar] [CrossRef]
  40. Montaldo, N.; Mancini, M.; Rosso, R. Flood Hydrograph Attenuation Induced by a Reservoir System: Analysis with a Distributed Rainfall-Runoff Model. Hydrol. Process. 2004, 18, 545–563. [Google Scholar] [CrossRef]
  41. Prasanchum, H.; Kangrang, A. Optimal Reservoir Rule Curves under Climatic and Land Use Changes for Lampao Dam Using Genetic Algorithm. KSCE J. Civ. Eng. 2018, 22, 351–364. [Google Scholar] [CrossRef]
  42. Sun, Y.; Zhang, W.; Peng, H.; Zhou, F.; Jiang, A.; Chen, X.; Wang, H. The Impacts of Climate Change on the Hydrological Process and Water Quality in the Three Gorges Reservoir Area, China. Water 2023, 15, 1542. [Google Scholar] [CrossRef]
  43. Taye, M.T.; Ebrahim, G.Y.; Nigussie, L.; Hagos, F.; Uhlenbrook, S.; Schmitter, P. Integrated Water Availability Modelling to Assess Sustainable Agricultural Intensification Options in the Meki Catchment, Central Rift Valley, Ethiopia. Hydrol. Sci. J. 2022, 67, 2271–2293. [Google Scholar] [CrossRef]
  44. Wu, J.; Yen, H.; Arnold, J.G.; Yang, Y.C.E.; Cai, X.; White, M.J.; Santhi, C.; Miao, C.; Srinivasan, R. Development of Reservoir Operation Functions in SWAT+ for National Environmental Assessments. J. Hydrol. 2020, 583, 124556. [Google Scholar] [CrossRef]
  45. Jordan, S.; Quinn, J.; Zaniolo, M.; Giuliani, M.; Castelletti, A. Advancing Reservoir Operations Modelling in SWAT to Reduce Socio-Ecological Tradeoffs. Environ. Model. Softw. 2022, 157, 105527. [Google Scholar] [CrossRef]
  46. Zhang, X.; Xu, Y.-P.; Fu, G. Uncertainties in SWAT Extreme Flow Simulation under Climate Change. J. Hydrol. 2014, 515, 205–222. [Google Scholar] [CrossRef]
  47. Hamid, A.T.; Sharif, M.; Narsimlu, B. Assessment of Climate Change Impacts on Streamflows in Satluj River Basin, India Using SWAT Model. Int. J. Hydrol. Sci. Technol. 2017, 7, 134–157. [Google Scholar] [CrossRef]
  48. Easton, Z.M.; Fuka, D.R.; White, E.D.; Collick, A.S.; Biruk Ashagre, B.; McCartney, M.; Awulachew, S.B.; Ahmed, A.A.; Steenhuis, T.S. A Multi Basin SWAT Model Analysis of Runoff and Sedimentation in the Blue Nile, Ethiopia. Hydrol. Earth Syst. Sci. 2010, 14, 1827–1841. [Google Scholar] [CrossRef]
  49. Thongwan, T.; Kangrang, A.; Techarungreungsakul, R.; Ngamsert, R. Future Inflow under Land Use and Climate Changes and Participation Process into the Medium-Sized Reservoirs in Thailand. Adv. Civ. Eng. 2020, 2020, 812530. [Google Scholar] [CrossRef]
  50. Kangrang, A.; Prasanchum, H.; Sriworamas, K.; Ashrafi, S.M.; Hormwichian, R.; Techarungruengsakul, R.; Ngamsert, R. Application of Optimization Techniques for Searching Optimal Reservoir Rule Curves: A Review. Water 2023, 15, 1669. [Google Scholar] [CrossRef]
  51. Chen, S.; Li, Y.; Shin, J.; Kim, T. Constructing Confidence Intervals of Extreme Rainfall Quantiles Using Bayesian, Bootstrap, and Profile Likelihood Approaches. Sci. China Technol. Sci. 2016, 59, 573–585. [Google Scholar] [CrossRef]
  52. Turner, S.W.D.; Bennett, J.C.; Robertson, D.E.; Galelli, S. Complex Relationship between Seasonal Streamflow Forecast Skill and Value in Reservoir Operations. Hydrol. Earth Syst. Sci. 2017, 21, 4841–4859. [Google Scholar] [CrossRef]
  53. Nimiroski, M.T.; Waldron, M.C. Sources of Sodium and Chloride in the Scituate Reservoir Drainage Basin, Rhode Island; US Department of the Interior, US Geological Survey: Reston, VA, USA, 2002. [Google Scholar]
  54. Hodgkins, G.A.; Dudley, R.W.; Huntington, T.G. Changes in the Timing of High River Flows in New England over the 20th Century. J. Hydrol. 2003, 278, 244–252. [Google Scholar] [CrossRef]
  55. Bent, G.C.; Lombard, P.J. Flood-Inundation Maps for the Pawtuxet River in West Warwick, Warwick, and Cranston, Rhode Island; US Geological Survey: Reston, VA, USA, 2018. [Google Scholar]
  56. Wild, E.C.; Nimiroski, M.T. Estimated Water Use and Availability in the Pawtuxet and Quinebaug River Basins, Rhode Island, 1995–1999; US Geological Survey: Reston, VA, USA, 2007. [Google Scholar]
  57. Shin, S.; Pokhrel, Y.; Yamazaki, D.; Huang, X.; Torbick, N.; Qi, J.; Pattanakiat, S.; Ngo-Duc, T.; Nguyen, T.D. High Resolution Modeling of River-floodplain-reservoir Inundation Dynamics in the Mekong River Basin. Water Resour. Res. 2020, 56, e2019WR026449. [Google Scholar] [CrossRef]
  58. Stern, H.; Davidson, N.E. Trends in the Skill of Weather Prediction at Lead Times of 1–14 Days. Q. J. R. Meteorol. Soc. 2015, 141, 2726–2736. [Google Scholar] [CrossRef]
  59. Findell, K.L.; Sutton, R.; Caltabiano, N.; Brookshaw, A.; Heimbach, P.; Kimoto, M.; Osprey, S.; Smith, D.; Risbey, J.S.; Wang, Z. Explaining and Predicting Earth System Change: A World Climate Research Programme Call to Action. Bull. Am. Meteorol. Soc. 2023, 104, E325–E339. [Google Scholar] [CrossRef]
  60. Tokarska, K.B.; Stolpe, M.B.; Sippel, S.; Fischer, E.M.; Smith, C.J.; Lehner, F.; Knutti, R. Past Warming Trend Constrains Future Warming in CMIP6 Models. Sci. Adv. 2020, 6, eaaz9549. [Google Scholar] [CrossRef] [PubMed]
  61. Pierce, D.W.; Cayan, D.R.; Maurer, E.P.; Abatzoglou, J.T.; Hegewisch, K.C. Improved Bias Correction Techniques for Hydrological Simulations of Climate Change. J. Hydrometeorol. 2015, 16, 2421–2442. [Google Scholar] [CrossRef]
  62. Pierce, D.W.; Cayan, D.R.; Thrasher, B.L. Statistical Downscaling Using Localized Constructed Analogs (LOCA). J. Hydrometeorol. 2014, 15, 2558–2585. [Google Scholar] [CrossRef]
  63. Pierce, D.W.; Cayan, D.R.; Feldman, D.R.; Risser, M.D. Future Increases in North American Extreme Precipitation in CMIP6 Downscaled with LOCA. J. Hydrometeorol. 2023, 24, 951–975. [Google Scholar] [CrossRef]
  64. Dosio, A.; Paruolo, P.; Rojas, R. Bias Correction of the ENSEMBLES High Resolution Climate Change Projections for Use by Impact Models: Analysis of the Climate Change Signal. J. Geophys. Res. Atmos. 2012, 117, D16106. [Google Scholar] [CrossRef]
  65. Piani, C.; Weedon, G.P.; Best, M.; Gomes, S.M.; Viterbo, P.; Hagemann, S.; Haerter, J.O. Statistical Bias Correction of Global Simulated Daily Precipitation and Temperature for the Application of Hydrological Models. J. Hydrol. 2010, 395, 199–215. [Google Scholar] [CrossRef]
  66. Walton, D.; Berg, N.; Pierce, D.; Maurer, E.; Hall, A.; Lin, Y.; Rahimi, S.; Cayan, D. Understanding Differences in California Climate Projections Produced by Dynamical and Statistical Downscaling. J. Geophys. Res. Atmos. 2020, 125, e2020JD032812. [Google Scholar] [CrossRef]
  67. Gudmundsson, L.; Bremnes, J.B.; Haugen, J.E.; Skaugen, T.E. Downscaling RCM Precipitation to the Station Scale Using Quantile Mapping–a Comparison of Methods. Hydrol. Earth Syst. Sci. Discuss. 2012, 9, 6185–6201. [Google Scholar]
  68. Kershaw, T.; Eames, M.; Coley, D. Assessing the Risk of Climate Change for Buildings: A Comparison between Multi-Year and Probabilistic Reference Year Simulations. Build Environ. 2011, 46, 1303–1308. [Google Scholar] [CrossRef]
  69. Moriasi, D.N.; Arnold, J.G.; Van Liew, M.W.; Bingner, R.L.; Harmel, R.D.; Veith, T.L. Model Evaluation Guidelines for Systematic Quantification of Accuracy in Watershed Simulations. Trans ASABE 2007, 50, 885–900. [Google Scholar] [CrossRef]
  70. Paul, S.; Pradhanang, S.M.; Boving, T.B. Assessing the Reservoir Inflow Relationship for Effective Flood Mitigation: A Hydrologic Modeling Approach for Scituate Reservoir, Rhode Island. J. N. Engl. Water Work. Assoc. 2024, 138, 49. [Google Scholar]
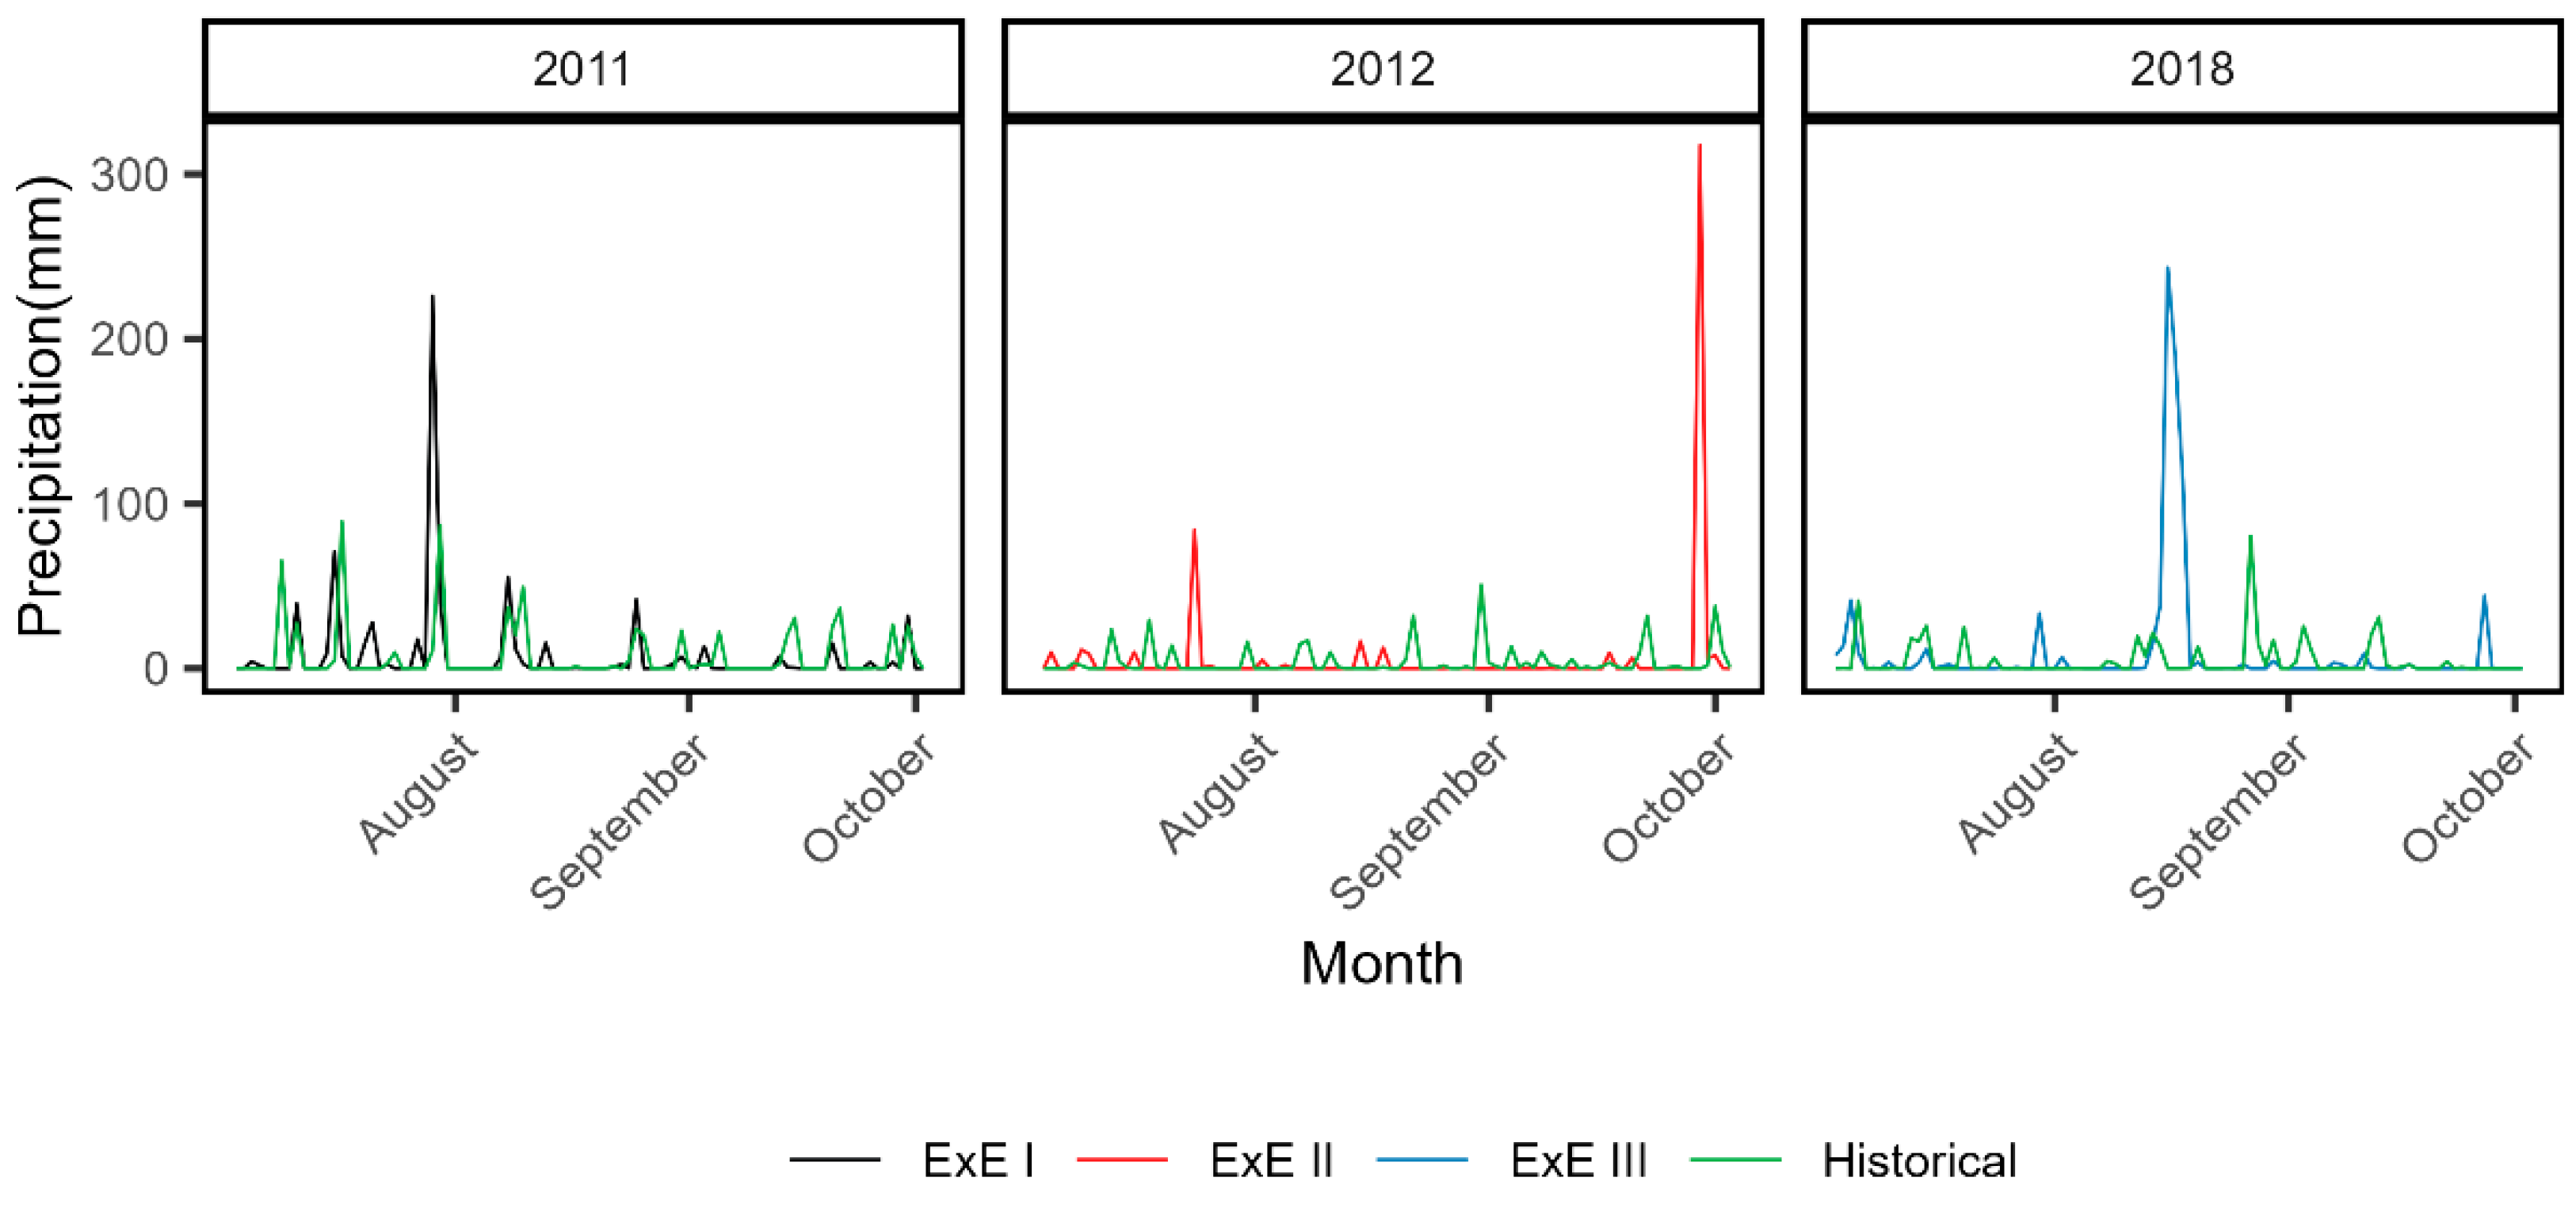
Figure 1. Relevant elevations and capacity percentages of the Scituate Reservoir in Rhode Island, USA (Not to scale). All elevations are referenced to NAVD88.
Water 16 02572 g001
Figure 2. Integration of SWAT and OASIS models workflow for assessing extreme events. ArcSWAT is an ArcGIS-ArcView extension and interface for SWAT.
Water 16 02572 g002
Figure 3. The graphs show the temporal distribution of the respective precipitation events relative to historic data. Actual hurricane names were replaced with hurricane IDs to avoid the impression that these hurricanes hit the New England study area.
Water 16 02572 g003
Figure 4. (A) Average reservoir elevation in April from 1975 to 2010. (B) Average August reservoir elevation from 1975 to 2010. (C) Relationship between reservoir elevation and usable storage. Note that capacities exceeding 100% are realized by using flashboards. Elevations are referenced to NAVD88.
Water 16 02572 g004
Figure 5. (A) Percent change in 3D30Y November to March and (B) 3D30Y April, relative to the reservoir baseline, distributed across 25 impact ensemble scenarios for the two periods relative to 2006 to 2017.
Water 16 02572 g005
Figure 6. (A) RCP4.5 and (B) RCP8.5 reservoir elevations in 7D30Y April, distributed across the 23 impact ensemble scenarios when the reservoir elevation is 98%. Colored lines indicate average reservoir elevation corresponding to each climate model. Gray area indicates uncertainty.
Water 16 02572 g006
Figure 7. Reservoir response to three hypothetical hurricane events when the initial reservoir elevation corresponded to the 51% (red dashed line), 80% (red dotted line) and 98% (red dash-dot line) baseline reservoir capacities. Black lines refer to reservoir inflow (left y-axis).
Water 16 02572 g007
Table 1. Hurricane events, occurrence, rainfall amount, and location of landfall. The actual hurricane characteristics (time and precipitation) were used as hypothetical event scenarios in a coupled SWAT/OASIS model.
Synthetic
Hurricane ID
Actual
Hurricane
Name
Actual Landfall
Location
Date, YearMax. 24 h Rainfall (mm) and Event MagnitudeTotal Rainfall
Amount
(mm)
Normal
Precipitation
(mm)
ExE IIreneDelaware26–27 August, 2011226.1 (50 y)26510.9
ExE IISandyEaston, MD27 October, 2012317.5 (500 y)3311.8
ExE IIIFlorenceWilmington, NC17 September, 2018254.0 (100 y)5840.3
Table 2. Change in total monthly precipitation (%) from historical precipitation datasets for (a) RCP4.5 and (b) RCP8.5 bias-corrected climate models for two time periods (2021 to 2051 and 2052 to 2082). Gray: Negative deviation, White: Positive deviation.
(a)
Model NameFeb
(2021–2051)
Mar
(2021–2051)
April
(2021–2051)
Feb
(2052–2082)
Mar
(2052–2082)
April
(2052–2082)
CESM1-BGC−61318−11544
CMCC-CM−62141−52922
CNRM-CM581632118−10
CSIRO-MK3−8363623225
EC-EARTH−30−21−1239
FGOALS-G2−148−16484
GFDL-CM3−13−12−9322−18
GFDL-ESM2G421−157−2
GFDL-ESM2M3962823422
GISS-E2-R −20223314−1938
HadGEM2-ES81320−164742
HadGEM2-AO222325252719
HadGEM2-CC−28−203−29−917
IPSL-CM5A-LR−128102417
IPSL-CM5A-MR−13−12−8−16−2327
MIROC-ESM225318373624
MIROC-ESM-CHEM3282521339
MIROC5−22−17−19−628
MPI-ESM-LR45721195031
MPI-ESM-MR−22452575229
MRI-CGCM3−23512−21212
NORESM1-M11088−3−117
CMCC-CMS_1−23−237−3−100
GISS-E2-H-CC−4533152022
(b)
CMCC-CMS_12416214028
CESM1-BGC43530−93338
CMCC-CM9483445625
CNRM-CM516241021377
CSIRO-MK333025−95038
EC-EARTH13143312665
FGOALS-G2−10825−7−8−9
GFDL-CM3−13−3−4−5622
GFDL-ESM2G−1915171528
GFDL-ESM2M−7−122551124
GISS-E2-R 17151331127
HadGEM2-ES−2413595821
HadGEM2-AO71937−8327
HadGEM2-CC−102389−83656
IPSL-CM5A-LR112810252520
IPSL-CM5A-MR−11−725−16521
MIROC-ESM19722844117
MIROC-ESM-CHEM312237274176
MIROC555634374541
MPI-ESM-LR217−21442−3
MPI-ESM-MR−254773441
MRI-CGCM3−924685849
NORESM1-M1−89−1141313
Table 3. Comparison of reservoir response with average condition.
Hurricane
Scenario
MonthAverage Historical
Reservoir Elevation
(m above NAVD88)
Average Monthly Reservoir CapacitySimulated Flow after Hurricane (m3/s)Change in
Reservoir Capacity
under Baseline
Scenarios
Range of Overspill
(m3/s)
IR_51IR_80IR_98
ExE IAugust85.1480%25480%>100%>100%100–110
ExE IIOctober86.189%37886%>100%>100%120–127
ExE IIISeptember85.6585%132>100%>100%>100%122–128
Disclaimer/Publisher’s Note: The statements, opinions and data contained in all publications are solely those of the individual author(s) and contributor(s) and not of MDPI and/or the editor(s). MDPI and/or the editor(s) disclaim responsibility for any injury to people or property resulting from any ideas, methods, instructions or products referred to in the content.

