Climate Change Contributions to Water Conservation Capacity in the Upper Mekong River Basin

Abstract
:1. Introduction
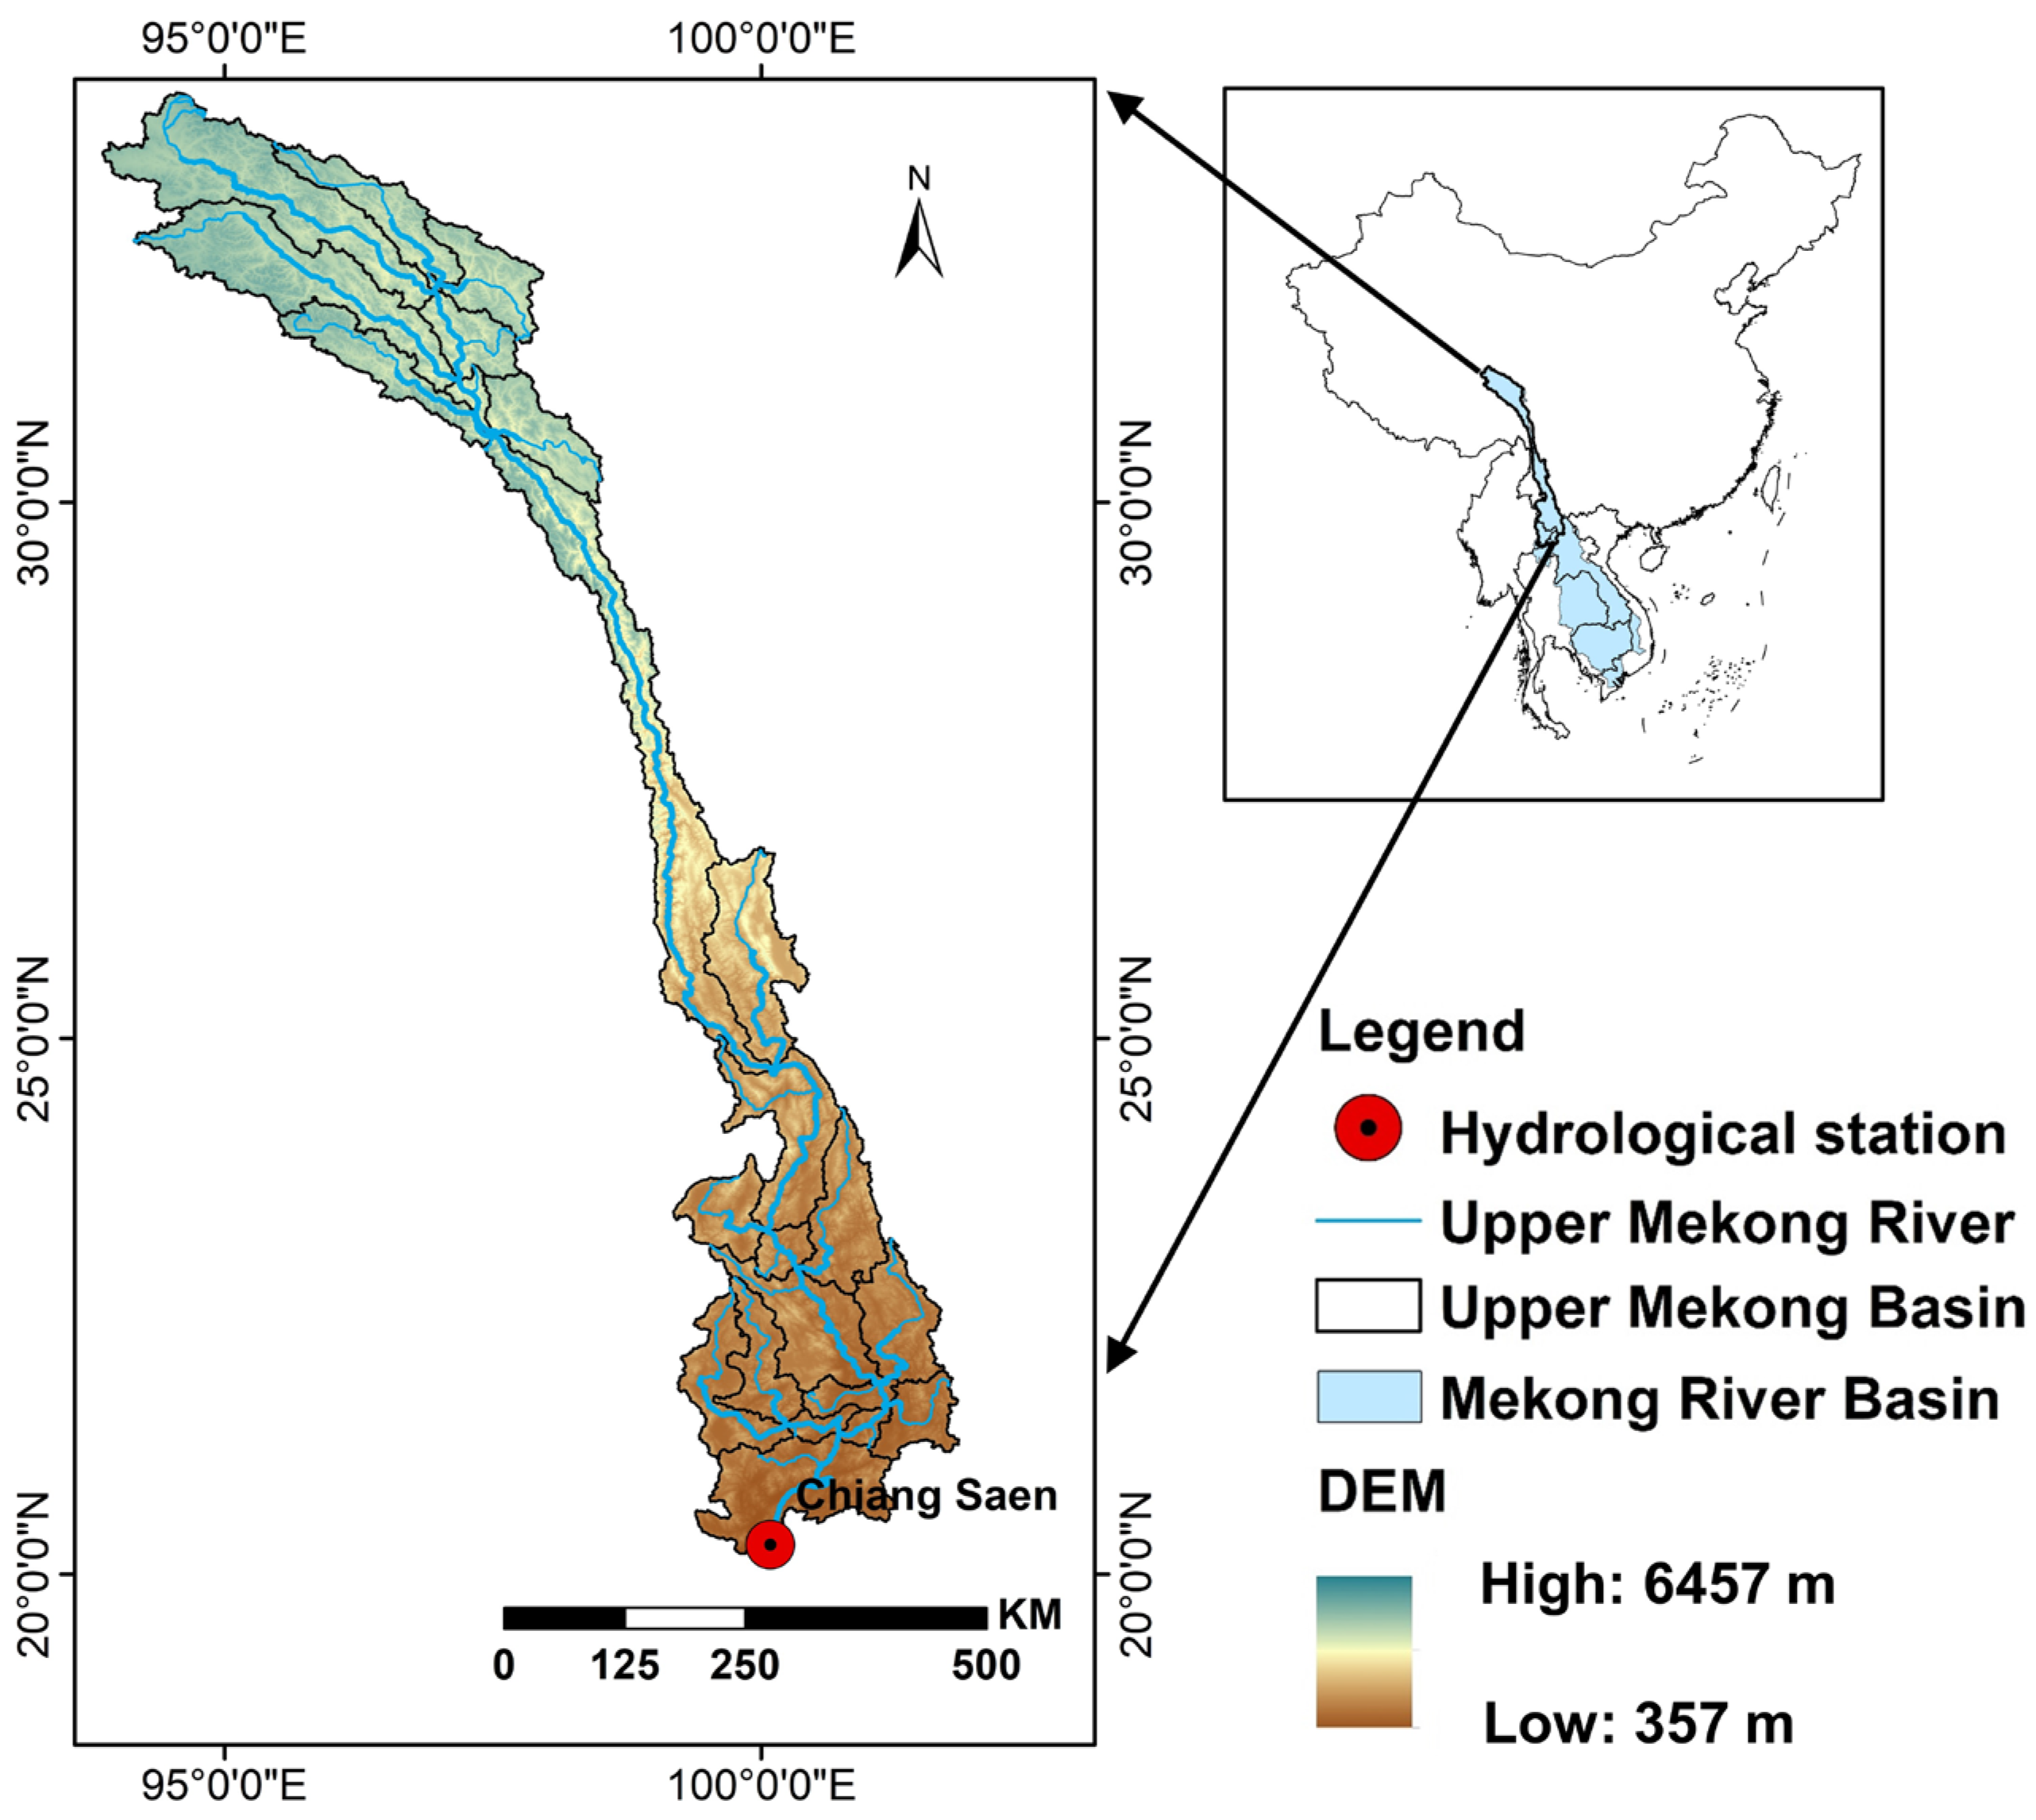
2. Study Area
3. Materials and Methods
3.1. Data Collection and Pre-Processing
3.2. Water Conservation Calculation Method
3.3. Unique Contribution of Climate Change
3.4. SWAT Model
3.4.1. Construction of the SWAT Model
3.4.2. Calibration and Validation of SWAT
3.5. Mann–Kendall Test Method
3.5.1. Trend Test
3.5.2. Change Point Test
4. Results
4.1. Model Evaluation
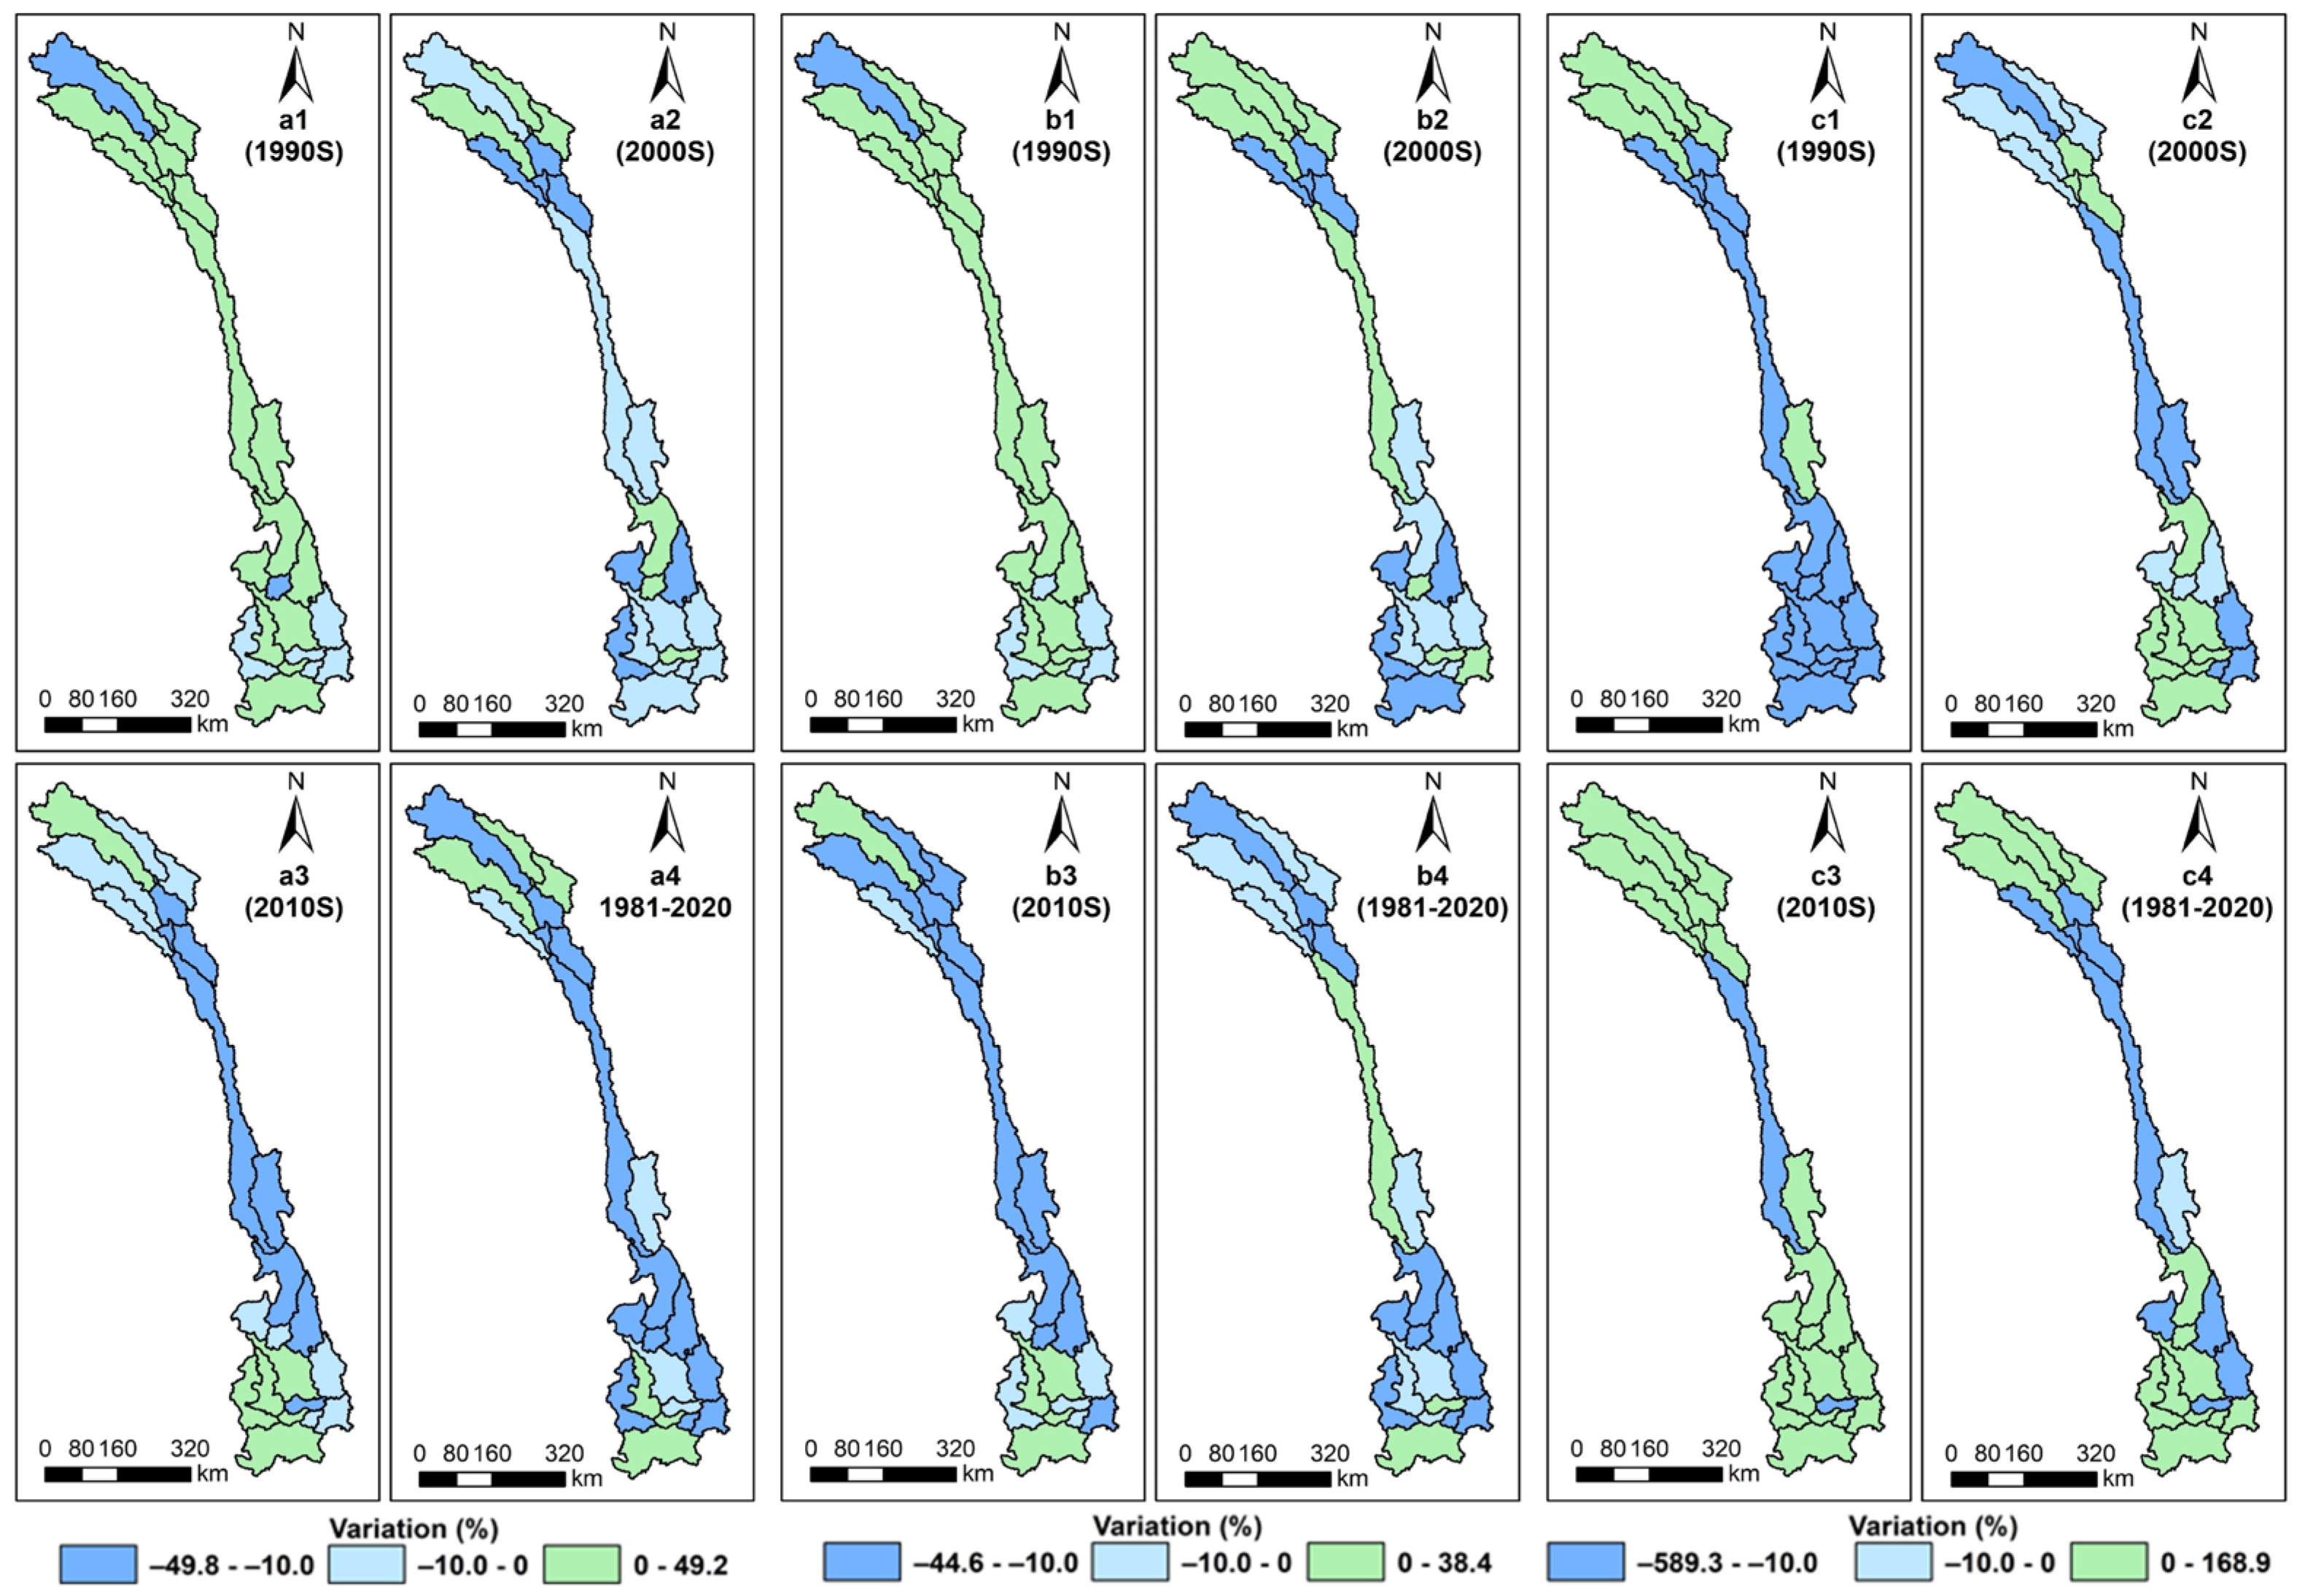
4.2. Temporal and Spatial Variations in Water Conservation Capacity in the UMRB from 1981 to 2020
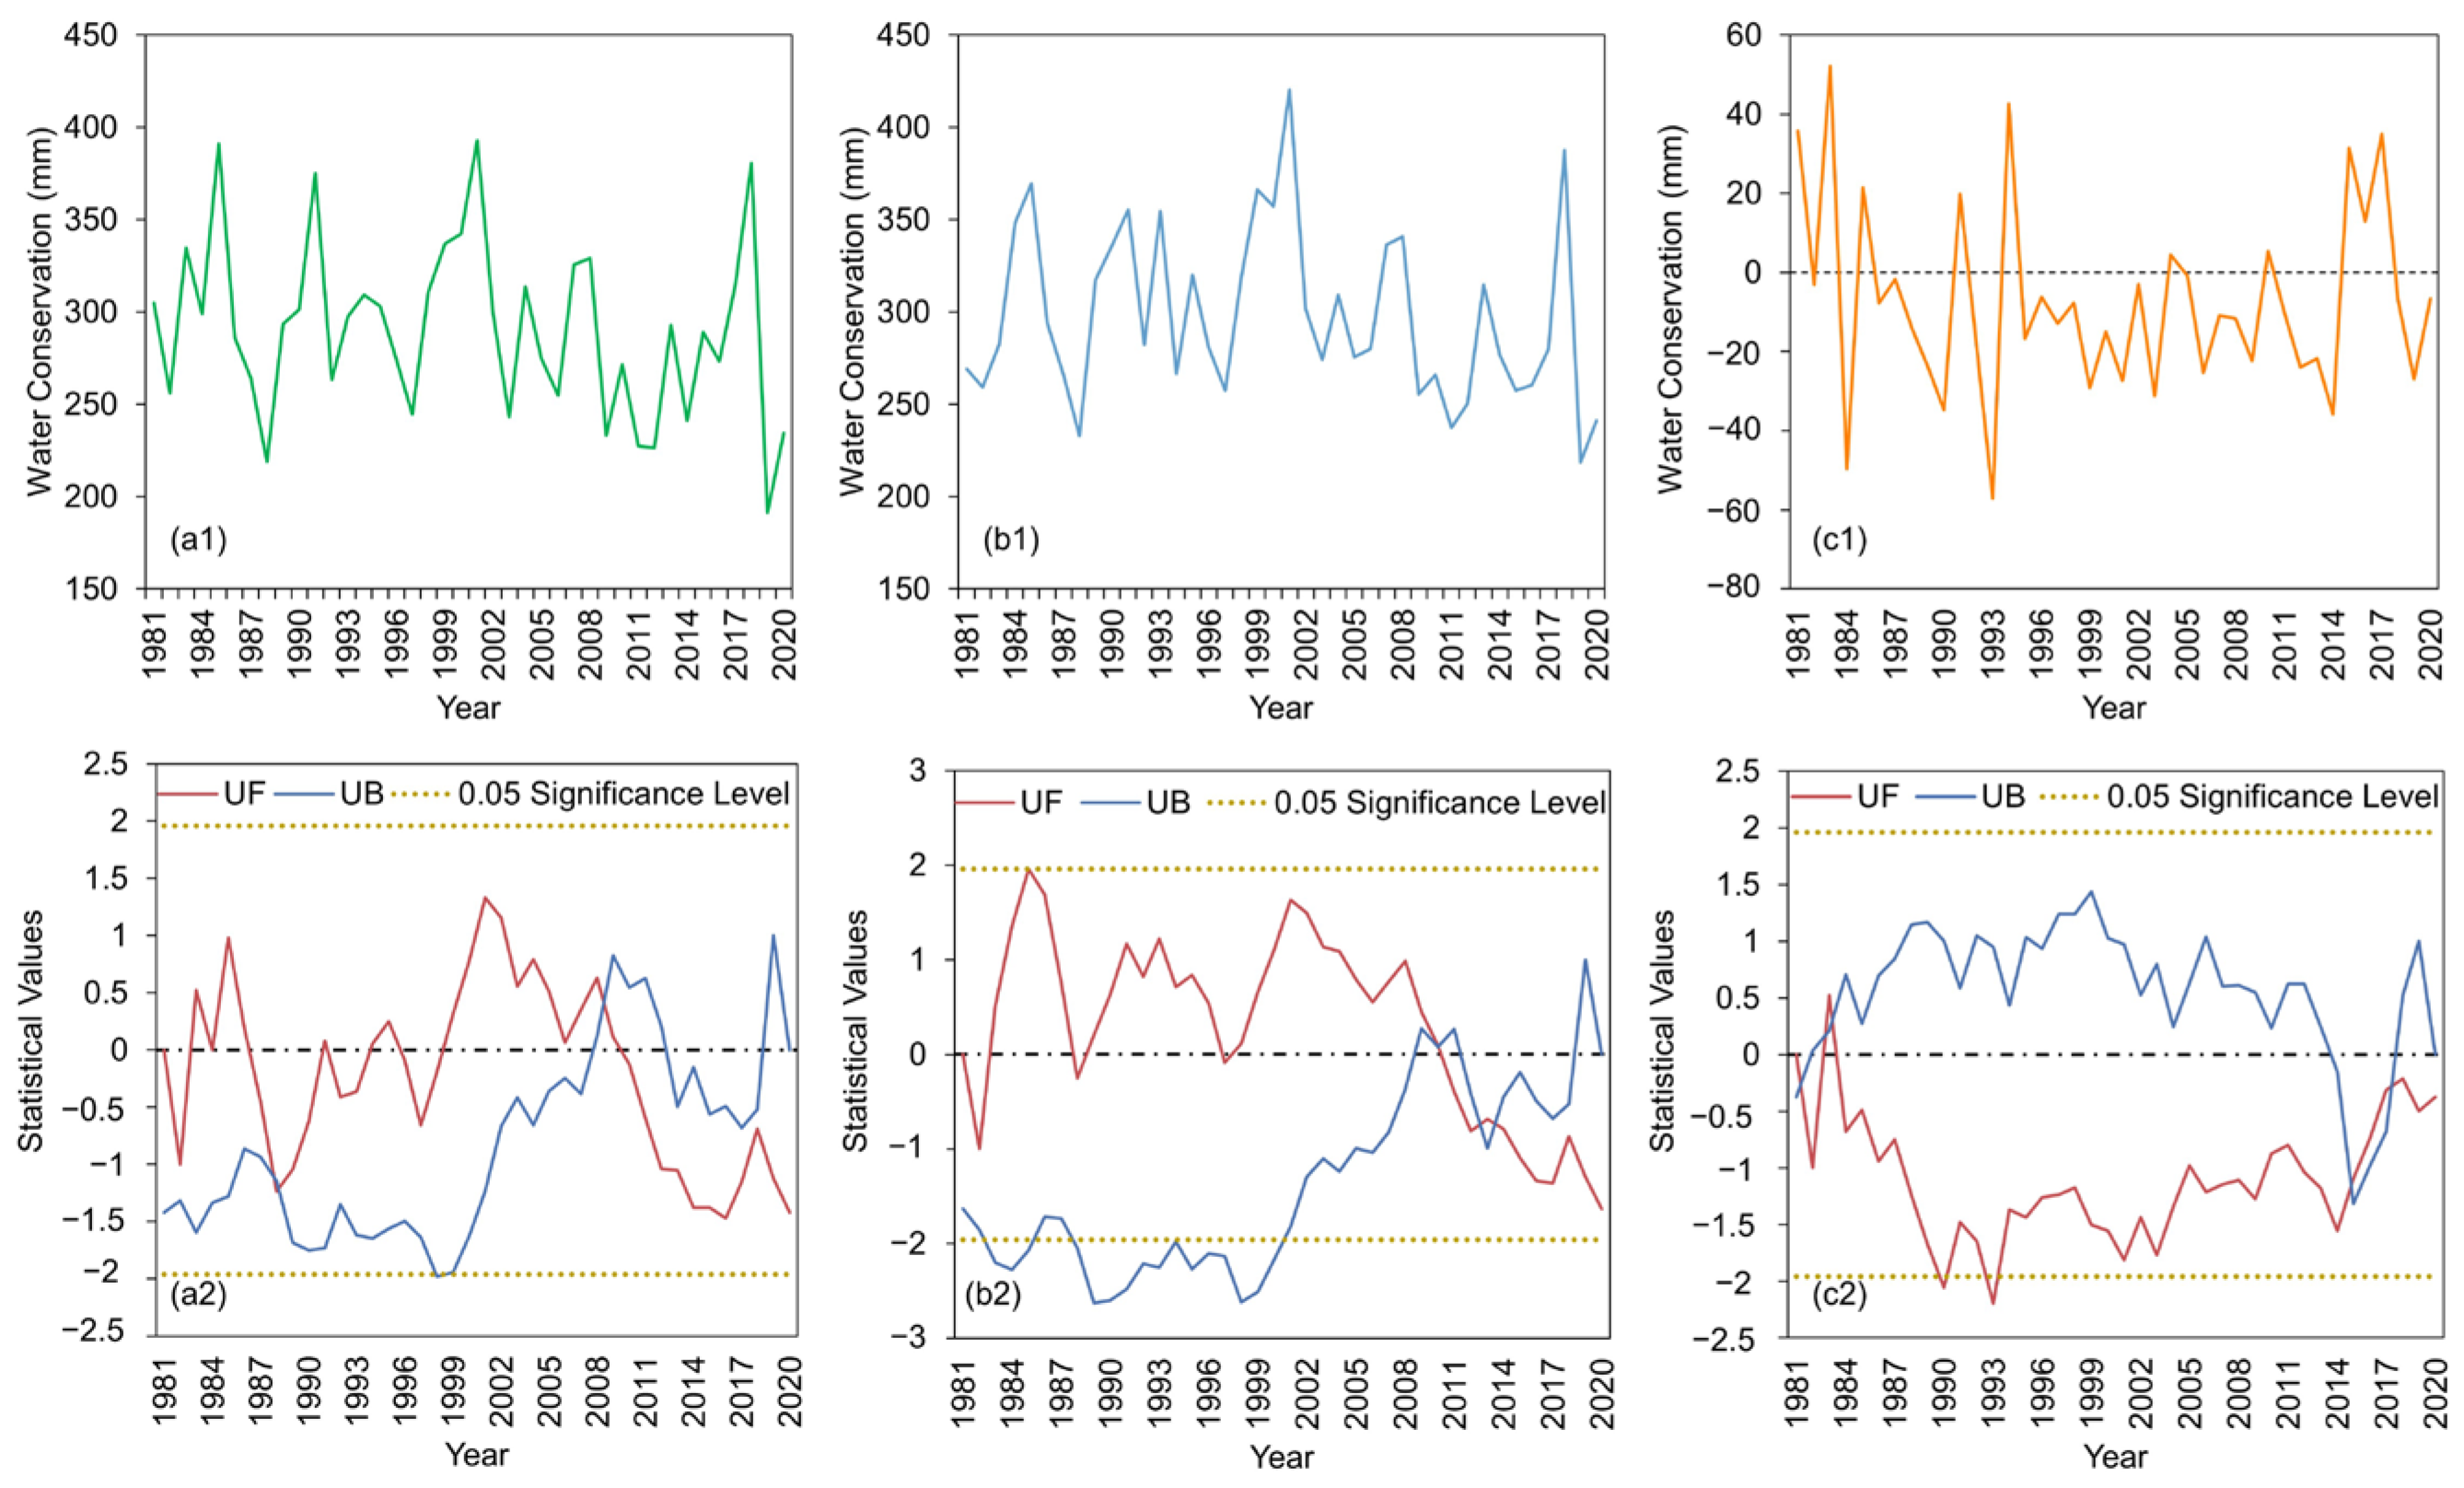
4.2.1. Annual Variations
4.2.2. Variations in Rainy and Dry Seasons
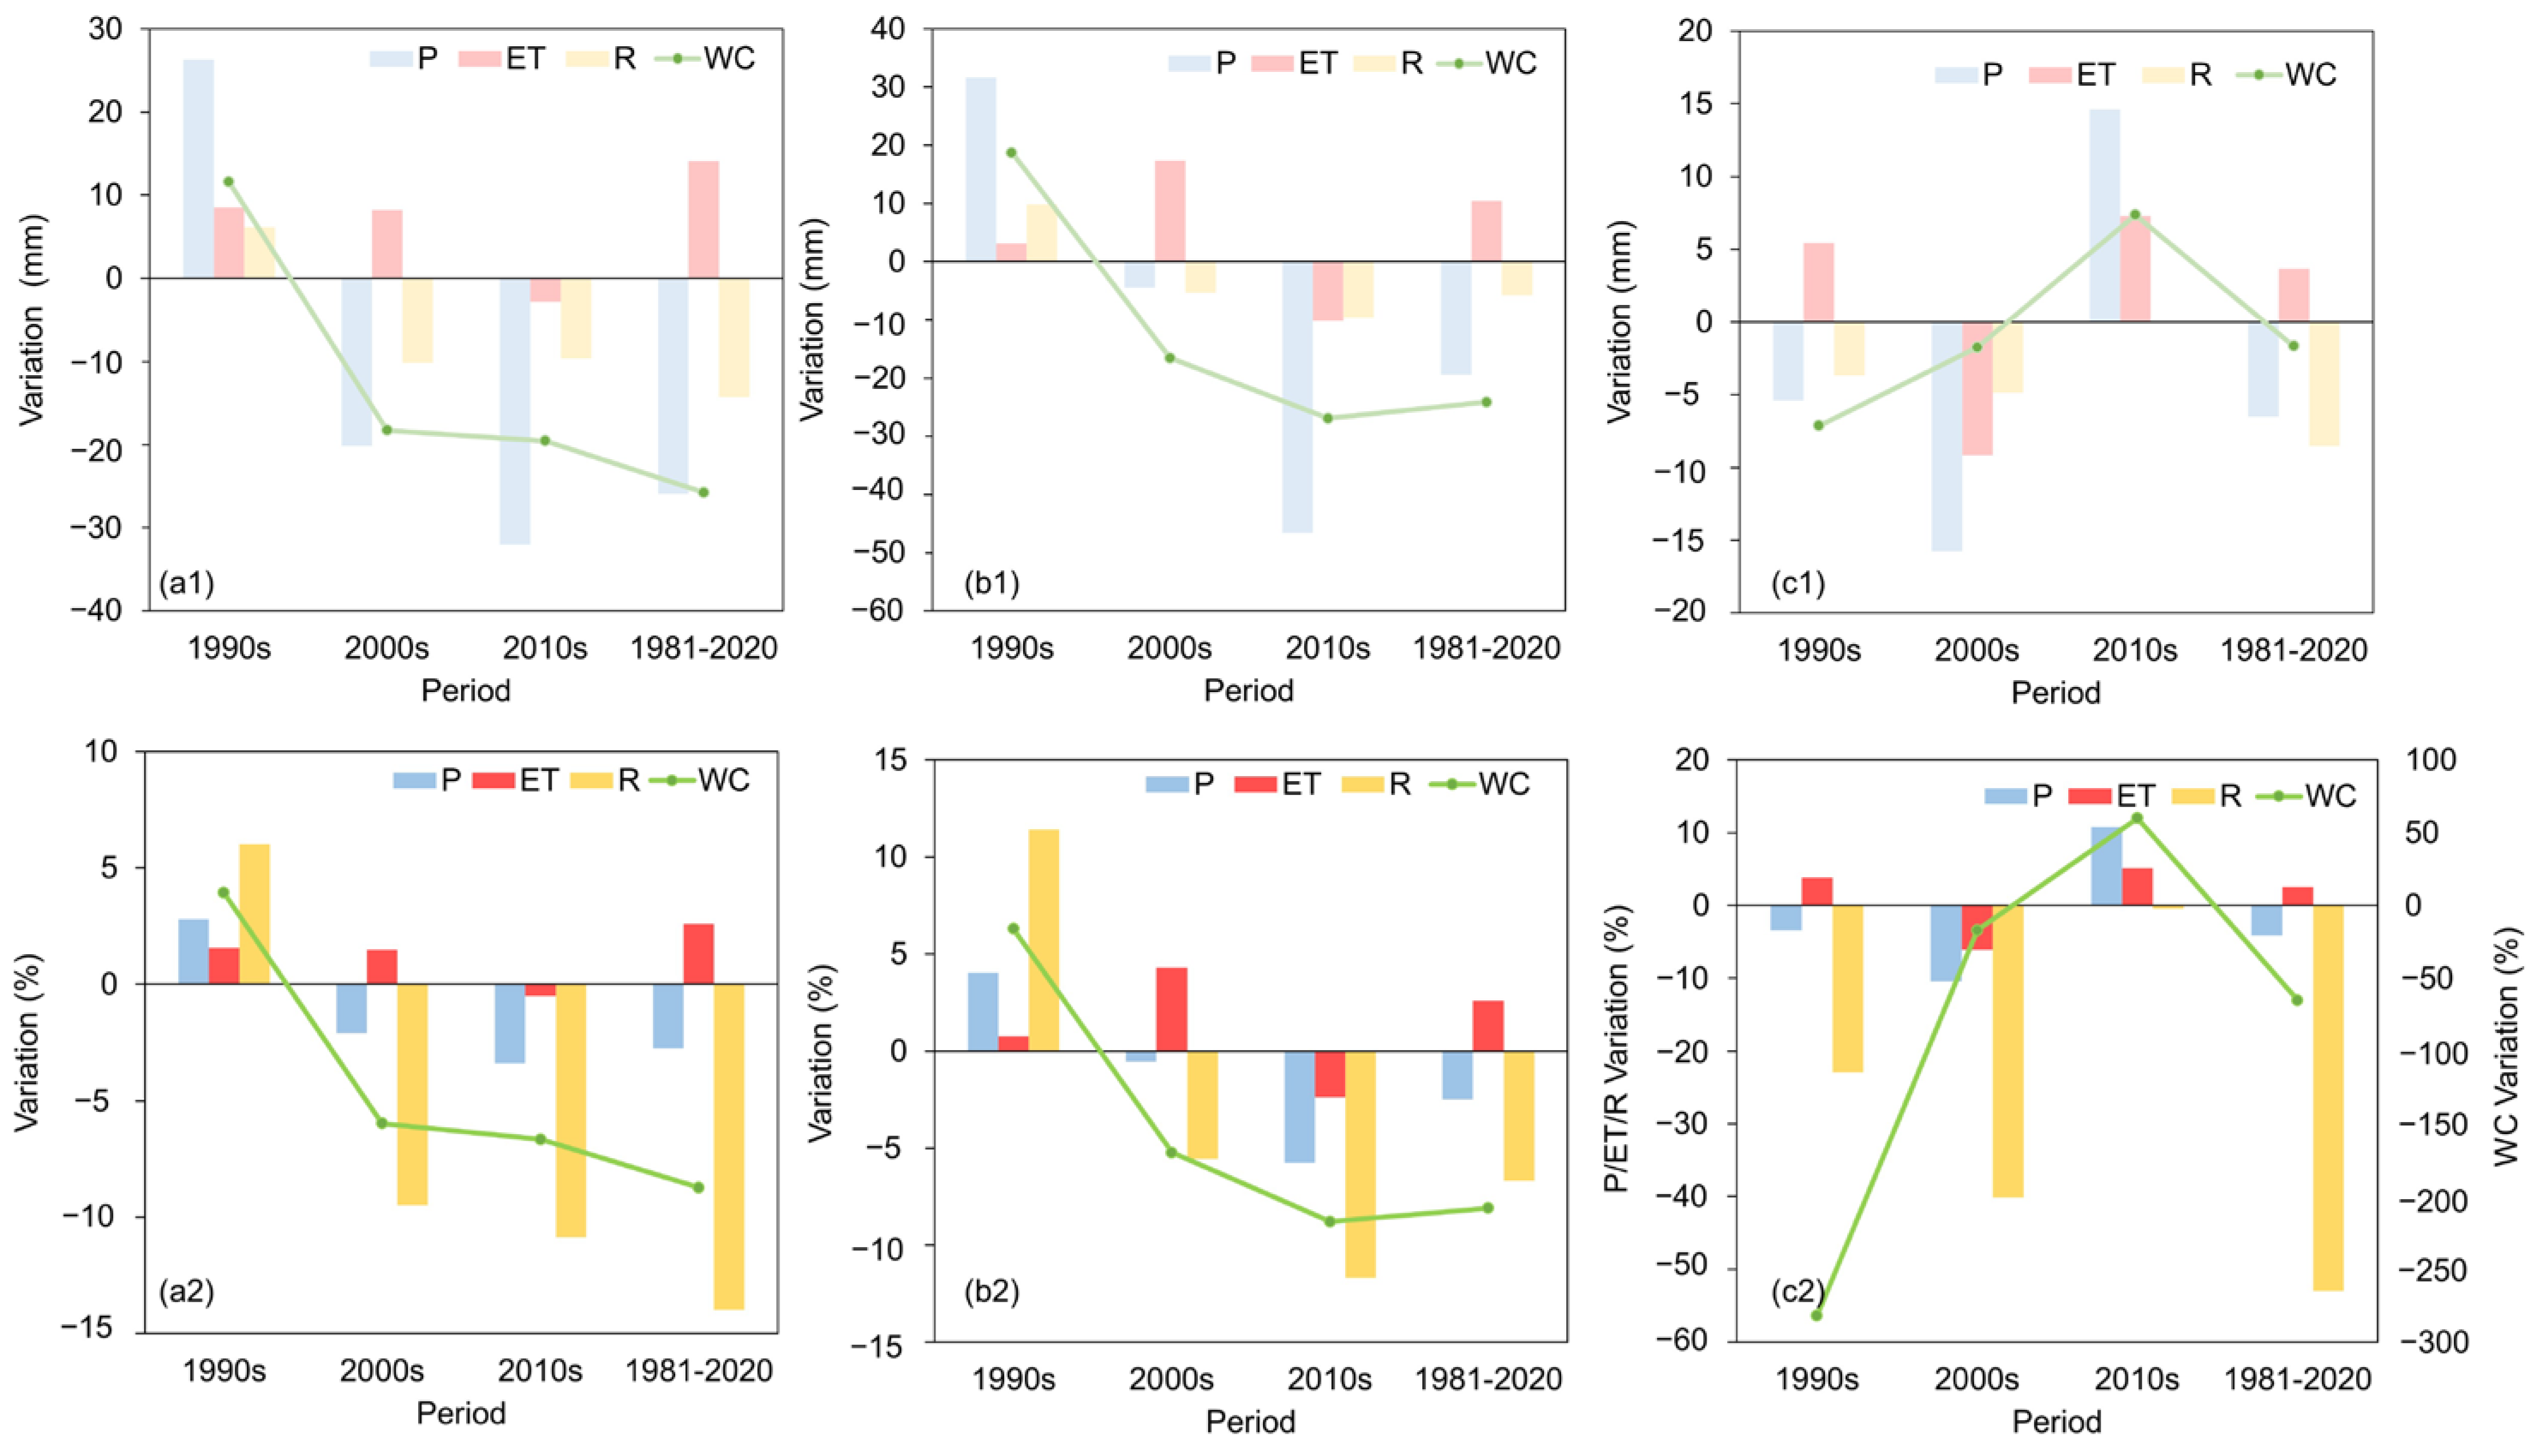
4.3. Unique Contribution of Climate Change to Water Conservation in the UMRB
4.3.1. Annual Contribution
4.3.2. Unique Contribution in Rainy and Dry Seasons
5. Discussion
5.1. How Does Climate Change Contribute to Water Conservation Capacity in the UMRB?
5.2. Precipitation’s Dominance in Water Conservation: Temporal and Spatial Analysis
5.3. Assessing the Difference across Annual, Rainy, and Dry Seasons
5.4. Developing Intervention Strategies for Augmenting Water Conservation Capacity in the UMRB
6. Conclusions
Supplementary Materials
Author Contributions
Funding
Data Availability Statement
Acknowledgments
Conflicts of Interest
References
- Li, R.; Zhu, G.; Lu, S.; Sang, L.; Meng, G.; Chen, L.; Jiao, Y.; Wang, Q. Effects of Urbanization on the Water Cycle in the Shiyang River Basin: Based on a Stable Isotope Method. Hydrol. Earth Syst. Sci. 2023, 27, 4437–4452. [Google Scholar] [CrossRef]
- WWAP (World Water Assessment Programme). The United Nations World Water Development Report 4: Managing Water under Uncertainty and Risk; UNESCO: Paris, France, 2012; ISBN 978-92-3-104235-5. [Google Scholar]
- Schewe, J.; Heinke, J.; Gerten, D.; Haddeland, I.; Arnell, N.W.; Clark, D.B.; Dankers, R.; Eisner, S.; Fekete, B.M.; Colón-González, F.J.; et al. Multimodel Assessment of Water Scarcity under Climate Change. Proc. Natl. Acad. Sci. USA 2014, 111, 3245–3250. [Google Scholar] [CrossRef]
- Bijay Halder, S.S.H.S.; Rana, B.; Juneng, L.; Pande, C.B.; Alshehery, S.; Elsahabi, M.; Yadav, K.K.; Naganna, S.R. Cloud Computing-Based Estimation of Peninsular India’s Long-Term Climate Change Impacts on Rainfall, Surface Temperature, and Geospatial Indices. Geomat. Nat. Hazards Risk 2024, 15, 2381635. [Google Scholar] [CrossRef]
- Zhao, Y.; Li, J.; Tian, Y.; Li, J. Distinguishing Extreme Precipitation Mechanisms Associated with Atmospheric Rivers and Nonatmospheric Rivers in the Lower Yangtze River Basin. J. Clim. 2024, 37, 3995–4010. [Google Scholar] [CrossRef]
- Pimentel, D.; Berger, B.; Filiberto, D.; Newton, M.; Wolfe, B.; Karabinakis, E.; Clark, S.; Poon, E.; Abbett, E.; Nandagopal, S. Water Resources: Agricultural and Environmental Issues. BioScience 2004, 54, 909–918. [Google Scholar] [CrossRef]
- IPCC. Climate Change 2013—The Physical Science Basis: Working Group I Contribution to the Fifth Assessment Report of the Intergovernmental Panel on Climate Change; Cambridge University Press: Cambridge, UK, 2013. [Google Scholar]
- IPCC. Climate Change 2022—Mitigation of Climate Change: Working Group III Contribution to the Sixth Assessment Report of the Intergovernmental Panel on Climate Change; Cambridge University Press: Cambridge, UK, 2022; ISBN 978-1-00-915792-6. [Google Scholar]
- Che, X.; Jiao, L.; Zhu, X.; Wu, J.; Li, Q. Spatial-Temporal Dynamics of Water Conservation in Gannan in the Upper Yellow River Basin of China. Land 2023, 12, 1394. [Google Scholar] [CrossRef]
- Jia, G.; Hu, W.; Zhang, B.; Li, G.; Shen, S.; Gao, Z.; Li, Y. Assessing Impacts of the Ecological Retreat Project on Water Conservation in the Yellow River Basin. Sci. Total Environ. 2022, 828, 154483. [Google Scholar] [CrossRef]
- Wu, Q.; Song, J.; Sun, H.; Huang, P.; Jing, K.; Xu, W.; Wang, H.; Liang, D. Spatiotemporal Variations of Water Conservation Function Based on EOF Analysis at Multi Time Scales under Different Ecosystems of Heihe River Basin. J. Environ. Manag. 2023, 325, 116532. [Google Scholar] [CrossRef]
- Zhang, Y.; Zhang, B.; Ma, B.; Yao, R.; Wang, L. Evaluation of the Water Conservation Capacity of the Weihe River Basin Based on the Integrated Valuation of Ecosystem Services and Tradeoffs Model. Ecohydrology 2022, 15, e2465. [Google Scholar] [CrossRef]
- Sultan, D.; Tsunekawa, A.; Haregeweyn, N.; Adgo, E.; Tsubo, M.; Meshesha, D.T.; Masunaga, T.; Aklog, D.; Fenta, A.A.; Ebabu, K. Efficiency of Soil and Water Conservation Practices in Different Agro-Ecological Environments in the Upper Blue Nile Basin of Ethiopia. J. Arid Land 2018, 10, 249–263. [Google Scholar] [CrossRef]
- Chen, Y.; Liu, X.; Ma, Y.; He, J.; He, Y.; Zheng, C.; Gao, W.; Ma, C. Variability Analysis and the Conservation Capacity of Soil Water Storage under Different Vegetation Types in Arid Regions. CATENA 2023, 230, 107269. [Google Scholar] [CrossRef]
- Zhang, Y.; Du, J.; Guo, L.; Sheng, Z.; Wu, J.; Zhang, J. Water Conservation Estimation Based on Time Series NDVI in the Yellow River Basin. Remote Sens. 2021, 13, 1105. [Google Scholar] [CrossRef]
- Hou, P.; Zhai, J.; Jin, D.-D.; Zhou, Y.; Chen, Y.; Gao, H.-F. Assessment of Changes in Key Ecosystem Factors and Water Conservation with Remote Sensing in the Zoige. Diversity 2022, 14, 552. [Google Scholar] [CrossRef]
- Abouabdillah, A.; White, M.; Arnold, J.G.; De Girolamo, A.M.; Oueslati, O.; Maataoui, A.; Lo Porto, A. Evaluation of Soil and Water Conservation Measures in a Semi-arid River Basin in Tunisia Using SWAT. Soil Use Manag. 2014, 30, 539–549. [Google Scholar] [CrossRef]
- Li, M.; Liang, D.; Xia, J.; Song, J.; Cheng, D.; Wu, J.; Cao, Y.; Sun, H.; Li, Q. Evaluation of Water Conservation Function of Danjiang River Basin in Qinling Mountains, China Based on InVEST Model. J. Environ. Manag. 2021, 286, 112212. [Google Scholar] [CrossRef]
- Xu, F.; Zhao, L.; Jia, Y.; Niu, C.; Liu, X.; Liu, H. Evaluation of Water Conservation Function of Beijiang River Basin in Nanling Mountains, China, Based on WEP-L Model. Ecol. Indic. 2022, 134, 108383. [Google Scholar] [CrossRef]
- Zhao, G.; Tian, S.; Jing, Y.; Cao, Y.; Liang, S.; Han, B.; Cheng, X.; Liu, B. Establishing a Quantitative Assessment Methodology Framework of Water Conservation Based on the Water Balance Method under Spatiotemporal and Different Discontinuous Ecosystem Scales. J. Environ. Manag. 2023, 346, 119006. [Google Scholar] [CrossRef]
- Wang, Z.; Cao, J. Spatial-Temporal Pattern Study on Water Conservation Function Using the SWAT Model. Water Supply 2021, 21, 3629–3642. [Google Scholar] [CrossRef]
- Ma, D.; Qian, B.; Gu, H.; Sun, Z.; Xu, Y. Assessing Climate Change Impacts on Streamflow and Sediment Load in the Upstream of the Mekong River Basin. Int. J. Climatol. 2021, 41, 3391–3410. [Google Scholar] [CrossRef]
- Yuan, X.; Wang, J.; He, D.; Lu, Y.; Sun, J.; Li, Y.; Guo, Z.; Zhang, K.; Li, F. Influence of Cascade Reservoir Operation in the Upper Mekong River on the General Hydrological Regime: A Combined Data-Driven Modeling Approach. J. Environ. Manag. 2022, 324, 116339. [Google Scholar] [CrossRef]
- Gleick, P.H. Climate Change, Hydrology, and Water Resources. Rev. Geophys. 1989, 27, 329–344. [Google Scholar] [CrossRef]
- Amare, M.T.; Demissie, S.T.; Beza, S.A.; Erena, S.H. Impacts of Land Use/Land Cover Changes on the Hydrology of the Fafan Catchment Ethiopia. J. Geovis. Spat. Anal. 2024, 8, 10. [Google Scholar] [CrossRef]
- Qiu, D.; Xu, R.; Gao, P.; Mu, X. Effect of Vegetation Restoration Type and Topography on Soil Water Storage and Infiltration Capacity in the Loess Plateau, China. CATENA 2024, 241, 108079. [Google Scholar] [CrossRef]
- Belachew, A.; Mekuria, W.; Nachimuthu, K. Factors Influencing Adoption of Soil and Water Conservation Practices in the Northwest Ethiopian Highlands. Int. Soil Water Conserv. Res. 2020, 8, 80–89. [Google Scholar] [CrossRef]
- Hoang, L.P.; van Vliet, M.T.H.; Kummu, M.; Lauri, H.; Koponen, J.; Supit, I.; Leemans, R.; Kabat, P.; Ludwig, F. The Mekong’s Future Flows under Multiple Drivers: How Climate Change, Hydropower Developments and Irrigation Expansions Drive Hydrological Changes. Sci. Total Environ. 2019, 649, 601–609. [Google Scholar] [CrossRef]
- Tang, J.; Yin, X.-A.; Yang, P.; Yang, Z. Assessment of Contributions of Climatic Variation and Human Activities to Streamflow Changes in the Lancang River, China. Water Resour. Manag. 2014, 28, 2953–2966. [Google Scholar] [CrossRef]
- Zhai, H.J.; Hu, B.; Luo, X.Y.; Qiu, L.; Tang, W.J.; Jiang, M. Spatial and Temporal Changes in Runoff and Sediment Loads of the Lancang River over the Last 50 Years. Agric. Water Manag. 2016, 174, 74–81. [Google Scholar] [CrossRef]
- Han, Z.; Long, D.; Fang, Y.; Hou, A.; Hong, Y. Impacts of Climate Change and Human Activities on the Flow Regime of the Dammed Lancang River in Southwest China. J. Hydrol. 2019, 570, 96–105. [Google Scholar] [CrossRef]
- Liu, H.; Wang, Z.; Ji, G.; Yue, Y. Quantifying the Impacts of Climate Change and Human Activities on Runoff in the Lancang River Basin Based on the Budyko Hypothesis. Water 2020, 12, 3501. [Google Scholar] [CrossRef]
- Liu, Y.; Chen, W.; Li, L.; Huang, J.; Wang, X.; Guo, Y.; Ji, G. Assessing the Contribution of Vegetation Variation to Streamflow Variation in the Lancang River Basin, China. Front. Ecol. Evol. 2023, 10, 1058055. [Google Scholar] [CrossRef]
- Xie, M.; Li, Y.; Cai, X. Hydrological Responses to the Synergistic Climate and Land-Use Changes in the Upper Lancang River Basin. Environ. Res. Lett. 2024, 19, 014045. [Google Scholar] [CrossRef]
- Ma, D.; Xu, Y.-P.; Xuan, W.; Gu, H.; Sun, Z.; Bai, Z. Do Model Parameters Change under Changing Climate and Land Use in the Upstream of the Lancang River Basin, China? Hydrol. Sci. J. 2020, 65, 1894–1908. [Google Scholar] [CrossRef]
- Bibi, S.; Song, Q.; Zhang, Y.; Liu, Y.; Kamran, M.A.; Sha, L.; Zhou, W.; Wang, S.; Gnanamoorthy, P. Effects of Climate Change on Terrestrial Water Storage and Basin Discharge in the Lancang River Basin. J. Hydrol. Reg. Stud. 2021, 37, 100896. [Google Scholar] [CrossRef]
- Gui, Z.; Chen, X.; He, Y. Spatiotemporal Analysis of Water Resources System Vulnerability in the Lancang River Basin, China. J. Hydrol. 2021, 601, 126614. [Google Scholar] [CrossRef]
- Wang, W.; Lu, H.; Ruby Leung, L.; Li, H.-Y.; Zhao, J.; Tian, F.; Yang, K.; Sothea, K. Dam Construction in Lancang-Mekong River Basin Could Mitigate Future Flood Risk from Warming-Induced Intensified Rainfall. Geophys. Res. Lett. 2017, 44, 10–378. [Google Scholar] [CrossRef]
- Liu, S.; Lu, P.; Liu, D.; Jin, P.; Wang, W. Pinpointing the Sources and Measuring the Lengths of the Principal Rivers of the World. Int. J. Digit. Earth 2009, 2, 80–87. [Google Scholar] [CrossRef]
- Wang, S.; Zhang, L.; She, D.; Wang, G.; Zhang, Q. Future Projections of Flooding Characteristics in the Lancang-Mekong River Basin under Climate Change. J. Hydrol. 2021, 602, 126778. [Google Scholar] [CrossRef]
- Shi, W.; Yu, X.; Liao, W.; Wang, Y.; Jia, B. Spatial and Temporal Variability of Daily Precipitation Concentration in the Lancang River Basin, China. J. Hydrol. 2013, 495, 197–207. [Google Scholar] [CrossRef]
- Zhang, X.; Liu, L.; Chen, X.; Gao, Y.; Xie, S.; Mi, J. GLC_FCS30: Global Land-Cover Product with Fine Classification System at 30 m Using Time-Series Landsat Imagery. Earth Syst. Sci. Data Discuss. 2020, 2020, 1–31. [Google Scholar] [CrossRef]
- Fischer, G.; Nachtergaele, F.; Prieler, S.; Van Velthuizen, H.; Verelst, L.; Wiberg, D. Global Agro-Ecological Zones Assessment for Agriculture (GAEZ 2008); IIASA: Laxenburg, Austria; FAO: Rome, Italy, 2008; Volume 10. [Google Scholar]
- Gassman, P.W.; Reyes, M.R.; Green, C.H.; Arnold, J.G. The Soil and Water Assessment Tool: Historical Development, Applications, and Future Research Directions. Trans. ASABE 2007, 50, 1211–1250. [Google Scholar] [CrossRef]
- Arnold, J.G.; Moriasi, D.N.; Gassman, P.W.; Abbaspour, K.C.; White, M.J.; Srinivasan, R.; Santhi, C.; Harmel, D.; Griensven, A.V.; Van Liew, M.W.; et al. SWAT: Model Use, Calibration, and Validation. Trans. ASABE 2012, 55, 1491–1508. [Google Scholar] [CrossRef]
- Krause, P.; Boyle, D.; Bäse, F. Comparison of Different Efficiency Criteria for Hydrological Model Assessment. Adv. Geosci. 2005, 5, 89–97. [Google Scholar] [CrossRef]
- Moriasi, D.N.; Arnold, J.G.; Van Liew, M.W.; Bingner, R.L.; Harmel, R.D.; Veith, T.L. Model Evaluation Guidelines for Systematic Quantification of Accuracy in Watershed Simulations. Trans. ASABE 2007, 50, 885–900. [Google Scholar] [CrossRef]
- Yun, X.; Tang, Q.; Wang, J.; Liu, X.; Zhang, Y.; Lu, H.; Wang, Y.; Zhang, L.; Chen, D. Impacts of Climate Change and Reservoir Operation on Streamflow and Flood Characteristics in the Lancang-Mekong River Basin. J. Hydrol. 2020, 590, 125472. [Google Scholar] [CrossRef]
- Istanbulluoglu, E.; Bras, R.L. On the Dynamics of Soil Moisture, Vegetation, and Erosion: Implications of Climate Variability and Change. Water Resour. Res. 2006, 42. [Google Scholar] [CrossRef]
- Dai, A. Increasing Drought under Global Warming in Observations and Models. Nat. Clim. Change 2013, 3, 52–58. [Google Scholar] [CrossRef]
- Kundzewicz, Z.W. Climate Change Impacts on the Hydrological Cycle. Ecohydrol. Hydrobiol. 2008, 8, 195–203. [Google Scholar] [CrossRef]
- Eltahir, E.A.B.; Bras, R.L. Precipitation Recycling. Rev. Geophys. 1996, 34, 367–378. [Google Scholar] [CrossRef]
- Wang, Y.; Ye, A.; Peng, D.; Miao, C.; Di, Z.; Gong, W. Spatiotemporal Variations in Water Conservation Function of the Tibetan Plateau under Climate Change Based on InVEST Model. J. Hydrol. Reg. Stud. 2022, 41, 101064. [Google Scholar] [CrossRef]
- Owuor, S.O.; Butterbach-Bahl, K.; Guzha, A.C.; Rufino, M.C.; Pelster, D.E.; Díaz-Pinés, E.; Breuer, L. Groundwater Recharge Rates and Surface Runoff Response to Land Use and Land Cover Changes in Semi-Arid Environments. Ecol. Process. 2016, 5, 16. [Google Scholar] [CrossRef]
- Shrestha, S.; Cui, S.; Xu, L.; Wang, L.; Manandhar, B.; Ding, S. Impact of Land Use Change Due to Urbanisation on Surface Runoff Using GIS-Based SCS–CN Method: A Case Study of Xiamen City, China. Land 2021, 10, 839. [Google Scholar] [CrossRef]
- Xue, J.; Li, Z.; Feng, Q.; Gui, J.; Zhang, B. Spatiotemporal Variations of Water Conservation and Its Influencing Factors in Ecological Barrier Region, Qinghai-Tibet Plateau. J. Hydrol. Reg. Stud. 2022, 42, 101164. [Google Scholar] [CrossRef]
- Hu, W.; Li, G.; Gao, Z.; Jia, G.; Wang, Z.; Li, Y. Assessment of the Impact of the Poplar Ecological Retreat Project on Water Conservation in the Dongting Lake Wetland Region Using the InVEST Model. Sci. Total Environ. 2020, 733, 139423. [Google Scholar] [CrossRef] [PubMed]


| Scenarios | Climate | Land Use |
|---|---|---|
| M1 | 1980s | 1985 |
| M2 | 1990s | 1985 |
| M3 | 1990s | 1995 |
| M4 | 2000s | 1995 |
| M5 | 2000s | 2005 |
| M6 | 2010s | 2005 |
| M7 | 1980s | 1985 |
| M8 | 2010s | 1985 |
| Factors | Z | Change Point Value |
|---|---|---|
| Annual Precipitation | −0.90 | 1982 1986 1989 2008 2017 2018 |
| Annual Evaporation | 1.41 | 1994 |
| Annual Surface Runoff | −2.06 | 2002 |
| Annual Water Conservation | −1.41 | 1988 2008 |
| Rainy Precipitation | −0.78 | 1982 2014 2016 2018 |
| Rainy Evaporation | 2.46 | 1997 |
| Rainy Surface Runoff | −1.25 | 2003 |
| Rainy Water Conservation | −1.62 | 2010 2013 |
| Dry Precipitation | −1.06 | 1982 1984 1985 1994 2015 2019 |
| Dry Evaporation | 0.13 | 1981 1984 1987 1988 2002 2005 2008 2014 |
| Dry Surface Runoff | −1.88 | 1987 1995 1996 |
| Dry Water Conservation | −0.36 | 1981 1983 2015 2017 |
Disclaimer/Publisher’s Note: The statements, opinions and data contained in all publications are solely those of the individual author(s) and contributor(s) and not of MDPI and/or the editor(s). MDPI and/or the editor(s) disclaim responsibility for any injury to people or property resulting from any ideas, methods, instructions or products referred to in the content. |
© 2024 by the authors. Licensee MDPI, Basel, Switzerland. This article is an open access article distributed under the terms and conditions of the Creative Commons Attribution (CC BY) license (https://creativecommons.org/licenses/by/4.0/).
Share and Cite
Luo, Y.; Cao, Z.; Zhao, X.; Wu, C. Climate Change Contributions to Water Conservation Capacity in the Upper Mekong River Basin. Water 2024, 16, 2601. https://doi.org/10.3390/w16182601
Luo Y, Cao Z, Zhao X, Wu C. Climate Change Contributions to Water Conservation Capacity in the Upper Mekong River Basin. Water. 2024; 16(18):2601. https://doi.org/10.3390/w16182601
Chicago/Turabian StyleLuo, Yuanyuan, Zhaodan Cao, Xiaoer Zhao, and Chengqiu Wu. 2024. "Climate Change Contributions to Water Conservation Capacity in the Upper Mekong River Basin" Water 16, no. 18: 2601. https://doi.org/10.3390/w16182601