Article

Spatiotemporal Dynamics and Drivers of Coastal Wetlands in Tianjin–Hebei over the Past 80 Years

1
Tianjin Center (North China Center of Geoscience Innovation), China Geological Survey (CGS), CGS Key Laboratory of Coast Geo-Environment and Tianjin Key Laboratory of Coast Geological Processes and Environmental Safety, Tianjin 300170, China
2
Tianjin Tian Ke Digital Innovation Science and Technology Co., Ltd., Tianjin 300100, China
3
Institute of Surface-Earth System Science, School of Earth System Science, Tianjin University, Tianjin 300072, China
*
Author to whom correspondence should be addressed.
Water 2024, 16(18), 2612; https://doi.org/10.3390/w16182612
Submission received: 19 August 2024 / Revised: 10 September 2024 / Accepted: 11 September 2024 / Published: 14 September 2024
(This article belongs to the Special Issue Soil and Groundwater Quality and Resources Assessment)

Abstract

:
Coastal wetland ecosystems are critical due to their diverse ecological and economic benefits, yet they have been significantly affected by human activities over the past century. Understanding the spatiotemporal changes and underlying factors influencing these ecosystems is crucial for developing effective ecological protection and restoration strategies. This study examines the Tianjin–Hebei coastal wetlands using topographic maps from the 1940s and Landsat satellite imagery from 1975, 2000, and 2020, supplemented by historical literature and field surveys. The aim is to analyze the distribution and classification of coastal wetlands across various temporal intervals. The findings indicate an expansion of the Tianjin–Hebei coastal wetlands from 7301.34 km2 in the 1940s to 8041.73 km2 in 2020. However, natural wetlands have declined by approximately 44.36 km2/year, while constructed wetlands have increased by around 53.61 km2/year. The wetlands have also become increasingly fragmented, with higher numbers of patches and densities. The analysis of driving factors points to human activities—such as urban construction, cultivated land reclamation, sea aquaculture, and land reclamation—as the primary contributors to these changes. Furthermore, the study addresses the ecological and environmental issues stemming from wetland changes and proposes strategies for wetland conservation. This research aims to enhance the understanding among researchers and policymakers of the dynamics and drivers of coastal wetland changes, as well as the major challenges in their protection, and to serve as a foundation for developing evidence-based conservation and restoration strategies.

1. Introduction

Coastal wetlands, which are vital ecosystems closely linked to the ocean, play a crucial role in maintaining ecological integrity and enhancing economic prosperity. In China, coastal areas support 46% of the population and contribute 60% to its GDP [1]. These regions have seen a significant depletion of natural wetlands due to intensive human activities. Global studies indicate that since 1900, 64% of wetlands worldwide have been lost [2], with China experiencing a 54% reduction in wetland area since 1980 [3]. National surveys conducted between 2003 and 2013 reveal a total decrease of nearly 34,000 km2 in China’s wetlands, primarily in natural wetlands [4]. This decline has disrupted the natural processes of coastal evolution, as well as hydrological regimes, leading to soil and water quality degradation, vegetation loss, and a reduction in biodiversity and ecosystem services [5,6,7]. Consequently, there is an urgent need for enhanced wetland conservation efforts.
Understanding the dynamics of wetlands and the forces driving their changes is essential for developing effective conservation and restoration strategies. Previous studies have explored changes in coastal wetlands using remote sensing and field surveys [8,9,10]. For example, the wetlands in Louisiana are shaped by a combination of natural factors, such as hurricanes, and human activities [11]. Likewise, Mexican coastal wetlands are influenced by sea-level rise, tropical storm frequency, and changes in coastal watershed elevations [12]. In Sri Lanka, the decline of mangroves in the Puttlam Lagoon has been attributed to shrimp farming and salt industries [13]. Along China’s coast, human activities since 2000 have significantly altered coastal wetlands, as evidenced by studies from the Bohai Bay area [14,15,16,17]. Despite these insights, distinguishing between natural evolution and human-induced degradation remains challenging due to extensive human modification. Therefore, long-term research is crucial to assess the impacts of natural processes versus human activities on coastal wetlands.
Although Landsat satellites have provided high-quality earth observation data with extensive spatial and temporal coverage since the 1970s, these data only reflect changes over the past 50 years. To gain a more comprehensive understanding of long-term wetland evolution, a multi-source data-integration approach is needed. For example, combining historical maps, remote sensing imagery, and extensive field surveys can address the limitations of relying on a single data source. Existing studies have used multi-temporal maps and broad field investigations to establish coastline data for mainland China since the 1940s [18]. This multi-source approach extends the temporal scale and helps to more accurately reveal the natural evolution trends of wetlands and the impacts of human activities.
This study utilizes a combination of multi-source remote sensing data, topographic maps, and field surveys to reconstruct the spatiotemporal distribution of Tianjin and Hebei coastal wetlands over the past eight decades. It investigates the factors driving changes in wetlands, assesses the influences of natural and human activities, and seeks to provide scientific insights and decision-making support for their conservation.

2. Materials and Methods

2.1. Study Area

The study area is located in the mid-latitude zone on the western coast of the Bohai Sea, characterized as a semi-closed marine environment [19]. It includes three prefecture-level cities in Tianjin and Hebei—Binhai New Area, Tangshan, and Cangzhou (115.7° E–119.6° E, 37.5° N–40.5° N)—covering approximately 39,574 km2 (Figure 1). These cities are strategically significant and play crucial roles in the coordinated development of the Beijing–Tianjin–Hebei region.
The area connects with the Pacific Ocean and the Yellow Sea through straits between the Liaodong Peninsula and the Shandong Peninsula. The seabed deepens gradually from the coastline into the gulf, averaging a depth of 12.5 m (https://www.stats.gov.cn/sj/ndsj/2011/indexeh.htm (accessed on 6 June 2024)). The coastal terrain, typically below +5 m above sea level, features a west-to-east gradient, sloping gently towards the sea from north to south and west to east. Numerous rivers, including the Haihe, Duliujian, and Dagu Rivers, traverse the coastal plain and flow into the gulf. Notably, Tianjin City is undergoing long-term tectonic subsidence, estimated at approximately 1.3 to 2.0 mm per year [20]. This geological process has a significant impact on the local coastline morphology, marine environments, and ecosystems [21,22].

2.2. Data Source

This study utilizes a combination of Landsat series satellite images, topographic maps from the U.S. Army Map Service, and field survey data to comprehensively and accurately analyze the ecological and environmental changes in Bohai Bay and its surrounding areas. The remote sensing images provide long-term observational data, the topographic maps reflect historical topographic conditions, and the field surveys ensure the authenticity and reliability of the data.

2.2.1. Coastal Area Images

For this study, Landsat MSS/TM/OLI series sensor image data from 1975, 2000, and 2020 were obtained. The data underwent processing, including geometric correction, radiometric calibration, atmospheric correction, and mosaic registration. This ensured consistency in the projection of the imagery and vector data.

2.2.2. Topographic Map Data

The U.S. Army Map Service compiled a set of 1:250,000 topographic maps of China’s coastal areas, primarily reflecting the coastal terrain conditions of the early 1940s (https://maps.lib.utexas.edu/maps/ams/china/ (accessed on 7 May 2024)). These maps employ the Universal Transverse Mercator (UTM) projection and adhere to rigorous cartographic standards suitable for modern mapping. This includes standardized map sheet numbering, map title, mosaic diagrams, scale, legend, textual annotations, latitude and longitude grid, kilometer grid, control points, contour lines, depth contours, elevation points, boundary lines, shorelines, schematic distribution of information sources, and accuracy specifications. Evaluated from the perspectives of cartographic standards, coverage, scale, and printing quality, this set of map data is the only available large-scale spatial data relevant to research in this area, making it of significant reference value for related studies.

2.2.3. Field Survey Data

To ensure the accuracy and reliability of data on coastal wetland changes, this study conducted field verifications at 119 points to assess the coastal wetland distribution as of 2020. During these verifications, high-precision GPS equipment was employed to calibrate geographic coordinates and compare these with remote sensing images, ensuring precise positioning. Moreover, this study incorporates previous field survey data, historical maps, literature, and images from the Google Earth platform. In-depth discussions with local residents and experts were also conducted to gain insight into the historical changes in wetlands and the impact of human activities. These field verifications confirmed that the indoor interpretations of wetland distribution aligned with the actual conditions, providing a reliable data foundation for subsequent research.

2.3. Methods

2.3.1. Definition and Classification of Coastal Wetlands

Coastal wetlands, defined as water areas not exceeding a depth of 6 m and their adjacent submerged zones, include permanent water bodies, intertidal areas, and coastal lowlands. This definition follows the guidelines set by the Wetland classification (GB/T 24708-2009) [23]. According to the convention, wetlands are categorized into two levels: the first classifies the coastal wetland systems in Tianjin and Hebei as either natural or constructed wetlands; the second further classifies natural wetlands based on their geomorphological features and constructed wetlands based on their primary functional uses. Detailed classifications are depicted in Table 1.
Using multi-temporal Landsat remote sensing images and field survey data processed, water boundaries were extracted. Visual interpretation methods were used to derive spatial and attribute data for coastal wetlands. Additionally, topographic map data underwent spatial registration, which facilitated the reconstruction and measurement of coastal wetland areas in Tianjin and Hebei from the 1940s, thus restoring the historical distribution patterns of these wetlands.

2.3.2. Extraction Methods for Coastal Wetlands

In analyzing coastal wetlands, it is crucial to accurately differentiate between water bodies and vegetation. The Modified Normalized Difference Water Index (MNDWI) is a valuable tool for this purpose. It leverages satellite imagery bands, specifically focusing on the distinct spectral properties of water and vegetation.
Water strongly absorbs and minimally reflects in the shortwave infrared (SWIR) band, while vegetation reflects more light. This contrast is enhanced by the MNDWI, effectively highlighting water bodies and suppressing vegetation signals. This method is particularly beneficial in urban environments, where shadows from buildings might otherwise mimic water bodies in spectral data, leading to potential misclassification.
The MNDWI improves the accuracy of water extraction by enhancing contrast and reducing confusion in complex landscapes [24,25,26]. The formula for the MNDWI is:
MNDWI = (GREEN − SWIR)/(GREEN + SWIR)
where “GREEN” refers to the green light band and “SWIR” refers to the shortwave infrared band.
Following the index calculation, threshold segmentation is applied to accurately delineate water boundaries. Optimal thresholds are determined through iterative adjustments and the incorporation of auxiliary data, such as higher-resolution remote sensing images and topographic information. The aim is to maximize the accuracy of water body extraction while minimizing the misclassification of other land features. After segmentation, manual visual editing refines and adjusts the water boundary, finalizing the attributes of identified water bodies based on researcher expertise.

2.3.3. Calculation Method for Wetland Dynamic Changes

The change in area for various wetland types over time is quantified using the following formula to calculate the dynamic change ( K ) of a single wetland type:
K = U b U a U a × 1 T × 100 %
Here, K represents the annual change in area of a specific wetland type within the study area, and U a and U b denote the area of the wetland type at the beginning and end of the study period T years, respectively.

2.3.4. Trajectory Analysis Method

The trajectory analysis method clarifies the temporal evolution of specific attributes within time-series data, suitable for both continuous and discontinuous phenomena. Trajectories are denoted by codes such as “111” or “AAB”, each representing types of coastal wetlands across geographic grid cells at different times within the study period. This analysis effectively illustrates changes in coastal wetland types across various locations [27,28]. The formula for this is expressed as:
C T = 10 n 1 P 1 + 10 n 2 P 2 + + 10 n i P i + + P n
Here, C T represents the change trajectory code for each grid within the study time series; n   denotes the number of time nodes within the series ( n > 1); and P i represents the coastal wetland type data at the n -th time node.
Using raster data from 1940, 1975, 2000, and 2020, this paper conducted an analysis with ArcGIS 10.2 to examine the changes in coastal wetlands. With four time points, there are theoretically 2401 different change trajectory codes. After empirical analysis and field investigations, we excluded codes that indicated no change, were deemed unreasonable, or covered small and insignificant areas. The remaining codes were then ranked by the number of raster cells they included. It was determined that the top 20 trajectory codes, which cover 75.27% of all areas showing change, effectively represent the primary types of changes in coastal wetlands over the study period.

2.3.5. Landscape Pattern Analysis Method

To thoroughly understand the development and evolution of the coastal region around Bohai Bay, landscape ecological research methods are utilized. Key indicators, such as patch density (PD) and number of patches (NP), are analyzed using Fragstats 4.2 software to study the landscape pattern characteristics of the study area [29,30].

3. Results

3.1. Changes in Coastal Wetland Area

3.1.1. Coastal Wetland Area Changes in Total

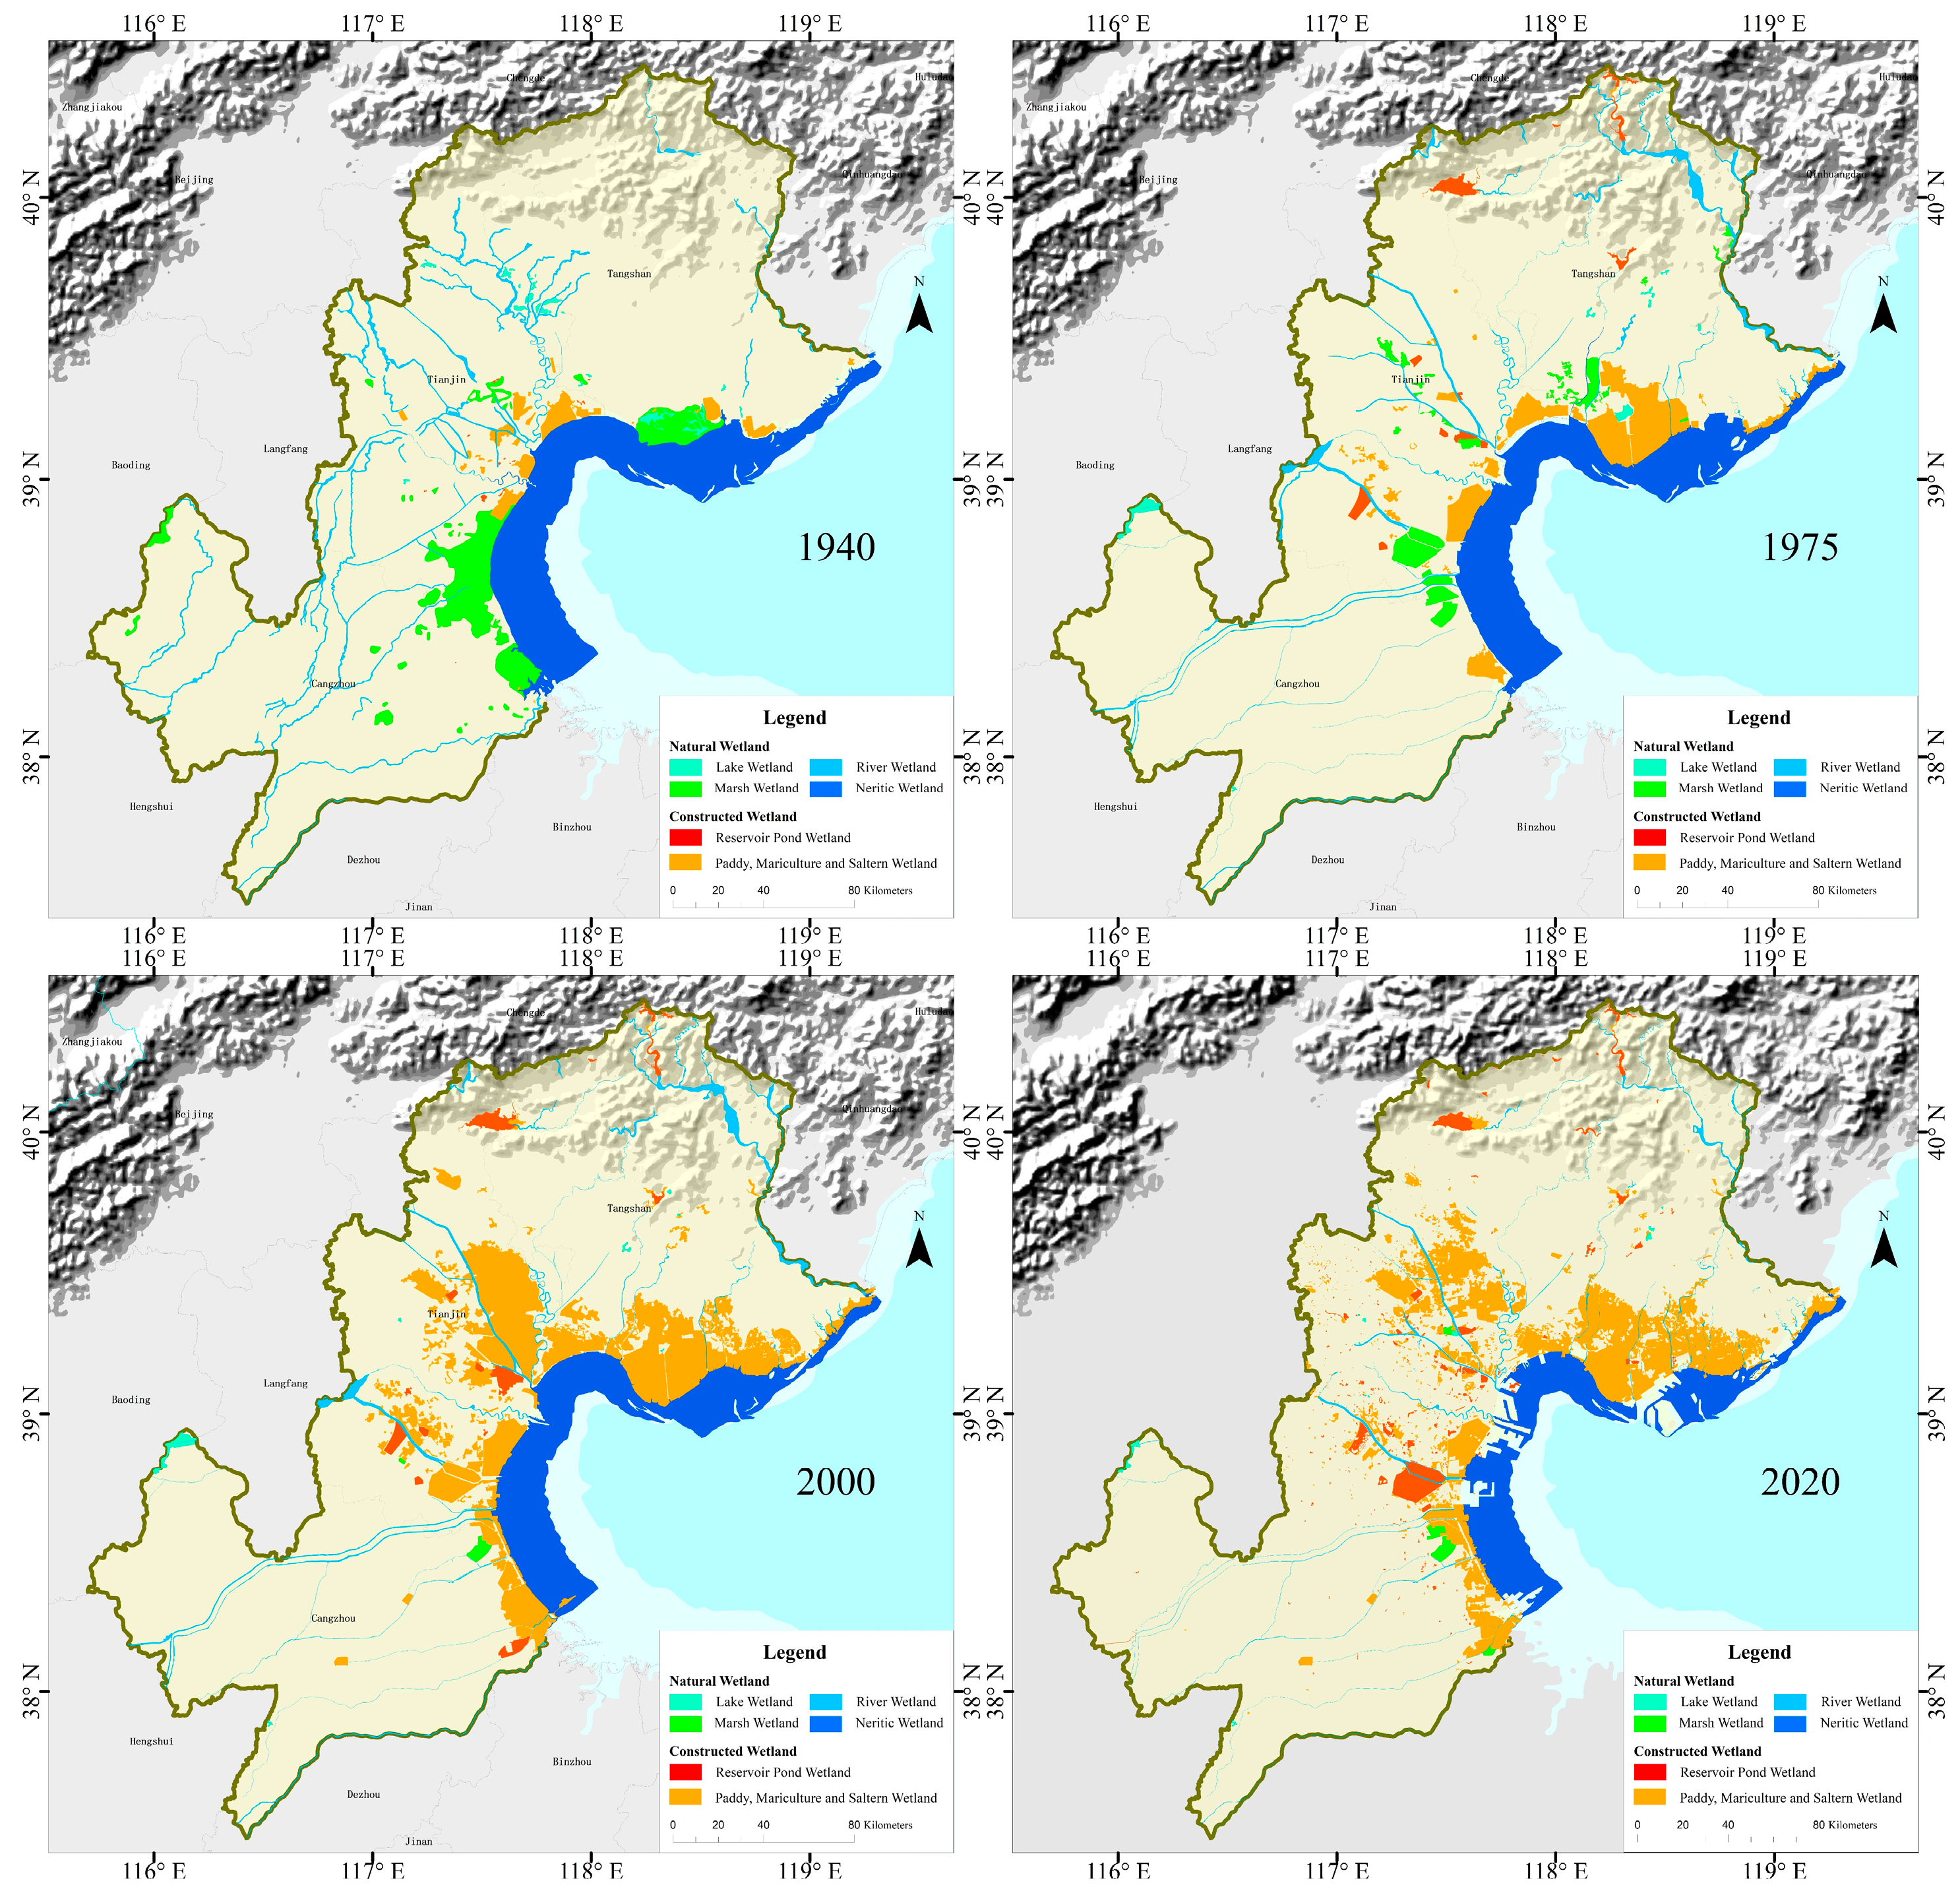
The spatial distribution of coastal wetlands in Tianjin–Hebei has seen significant alterations from 1940 to 2020, as depicted in Figure 2 and Table 2. During this 80-year period, there were considerable shifts in wetland types and areas.
Initially, in the constructed wetland categories, areas of paddy, mariculture, and saltern wetlands exhibited steady growth from 1940 to 1975, with an average annual increase of 32.40 km2 (Table 3). This increase accelerated to 131.11 km2 annually between 1975 and 2000. However, starting in the 21st century, this trend reversed, with the area of constructed wetlands experiencing an annual loss of 36.97 km2 from 2000 to 2020. Conversely, the area of reservoir pond wetlands consistently expanded, increasing by 7.28 km2 annually from 1940 to 1975, by 4.07 km2 annually from 1975 to 2000, and by 13.00 km2 annually since 2000, marking a nearly 44-fold increase over the entire study period.
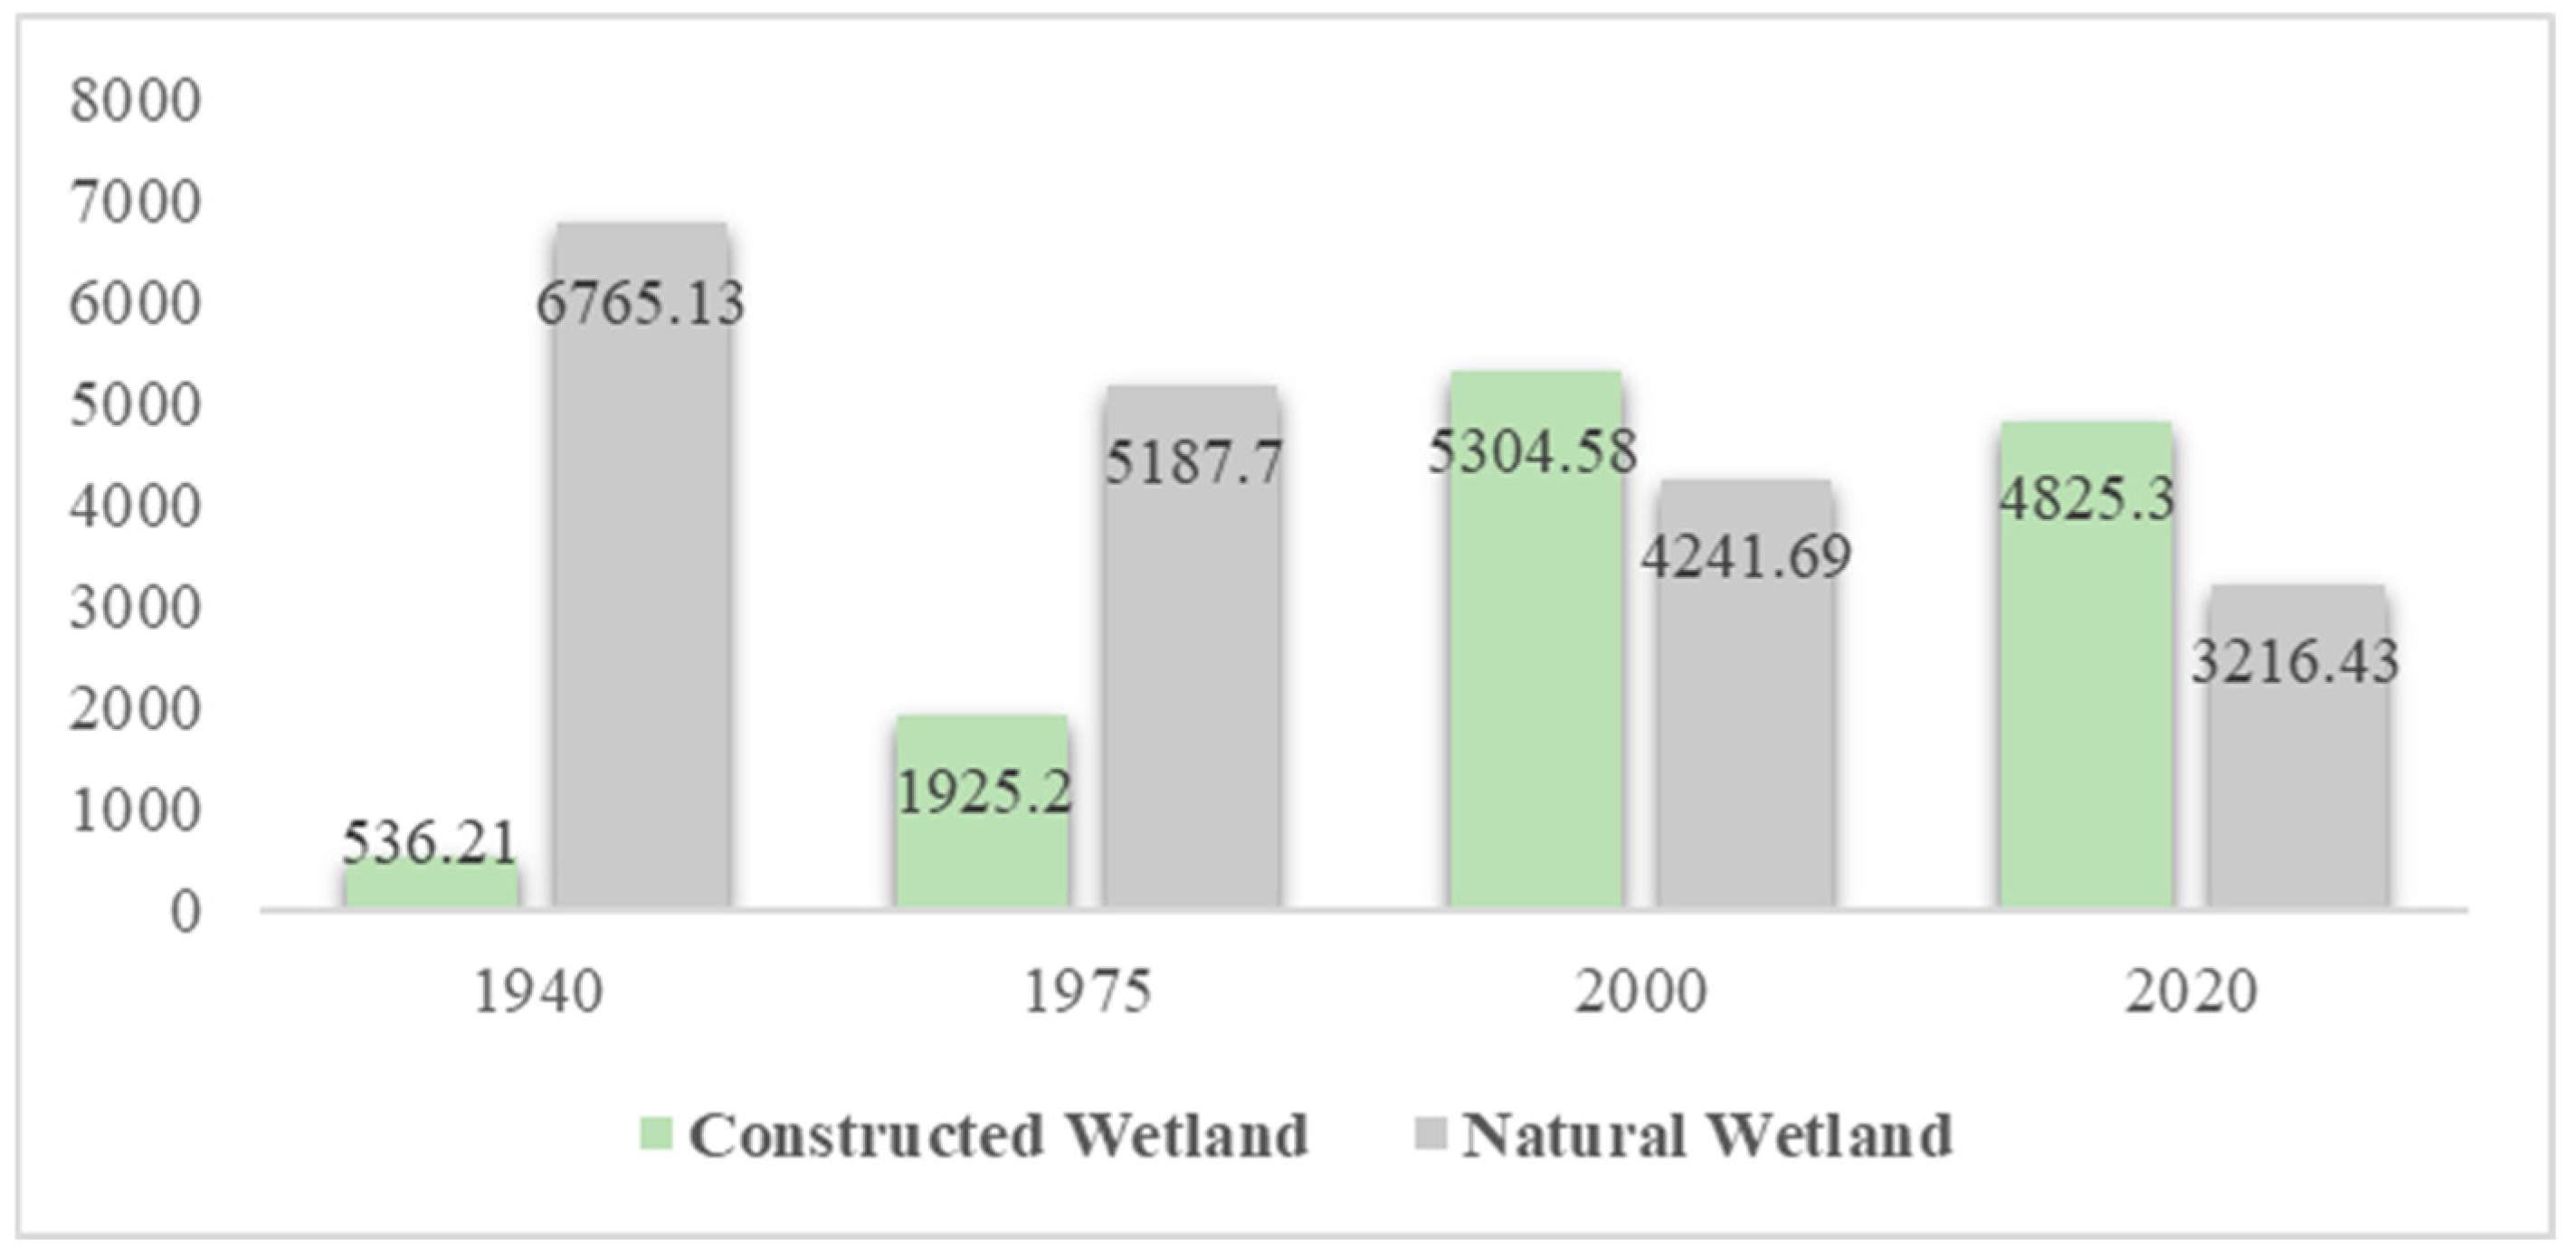
Natural wetlands, on the other hand, have generally exhibited a declining trend (Figure 3). Lake wetlands steadily decreased, with an annual reduction ranging between 0.82 km2 and 1.79 km2. Neritic wetlands remained relatively stable from 1940 to 1975, experienced a slight annual reduction from 1975 to 2000, and then saw a sharp increase in the annual reduction to 33.25 km2 after 2000. River wetlands displayed the most significant decrease from 2000 to 2020, with an annual reduction of 18.56 km2. The changes in marsh wetlands were notably complex: these wetlands experienced an average annual reduction of 25.8 km2 from 1940 to 2000, but from 2000 to 2020, they saw a slight increase, growing by 2.34 km2 annually.
Overall, the area of coastal wetlands demonstrated a pattern of decrease, increase, and subsequent decrease again over the study period. Initially, there was a slight decrease from 1940 to 1975, followed by a significant increase from 1975 to 2000, reaching a historical peak of 9546.27 km2. However, from 2000 to 2020, there was another decline, although the area remained relatively high.

3.1.2. Coastal Wetland Area Changes in Different Cities

Regional analysis reveals distinct trends in wetland area changes across Tianjin, Tangshan, and Cangzhou (Table 4 and Table 5). In Tianjin, the wetland area decreased from 1940 to 1975, followed by a significant increase from 1975 to 2000. However, it exhibited a decreasing trend again from 2000 to 2020. In Tangshan, wetland areas showed relatively stable fluctuations overall but experienced a decrease from 2000 to 2020. Conversely, in Cangzhou, the wetland area decreased from 1940 to 1975, saw a slight increase from 1975 to 2000, and then decreased again from 2000 to 2020.

3.2. Changes in Coastal Wetland Landscape Patterns and Types

From 1940 to 2020, the fragmentation of the Tianjin–Hebei coastal wetlands has consistently increased. The fragmentation indices, NP and PD, for various wetland types over different periods are detailed in Table 6. Over the last 80 years, there have been significant changes in the NP values. Specifically, the NP value for paddy fields, mariculture zones, and saltern wetlands surged from 27 in 1940 to 559 in 2020, marking a more than 20-fold increase and highlighting severe fragmentation in these areas. River wetlands also saw increased fragmentation, with NP values rising from 40 to 307. Reservoir pond wetlands initially experienced a slight decrease, followed by stabilization, and then a significant increase to 420 from 2000 to 2020, indicating heightened fragmentation. Conversely, the NP values for lake wetlands decreased from 26 in 1940 to 14 in 2020, suggesting improved connectivity and reduced fragmentation. Coastal wetlands showed a slight overall increase in NP but remained relatively stable. However, marsh wetlands saw a marked decrease in NP, dropping from 32 in 1940 to 4 in 2020, signifying a substantial reduction in fragmentation.
The PD values highlight distinct trends across various wetland types from 1940 to 2020. The PD for paddy fields, mariculture zones, and saltern wetlands continued to increase, from 0.0037 to 0.0693, indicating a growing number of patches per unit area and further deepening the fragmentation. Reservoir pond wetlands initially remained stable and then experienced a slight increase in PD, reflecting a gradual rise in patch density. River wetlands saw an initial increase followed by a slight decrease, yet overall, the PD remained higher than in 1940, suggesting a general upward trend in patch density. Conversely, lake and marsh wetlands displayed significant decreases in PD, dropping from 0.0036 to 0.0017 and from 0.0044 to 0.0005, respectively. These reductions indicate decreased patch densities, suggesting improved connectivity within lake and marsh wetland landscapes. Finally, neritic wetlands showed minor fluctuations but a slight overall increase in PD.
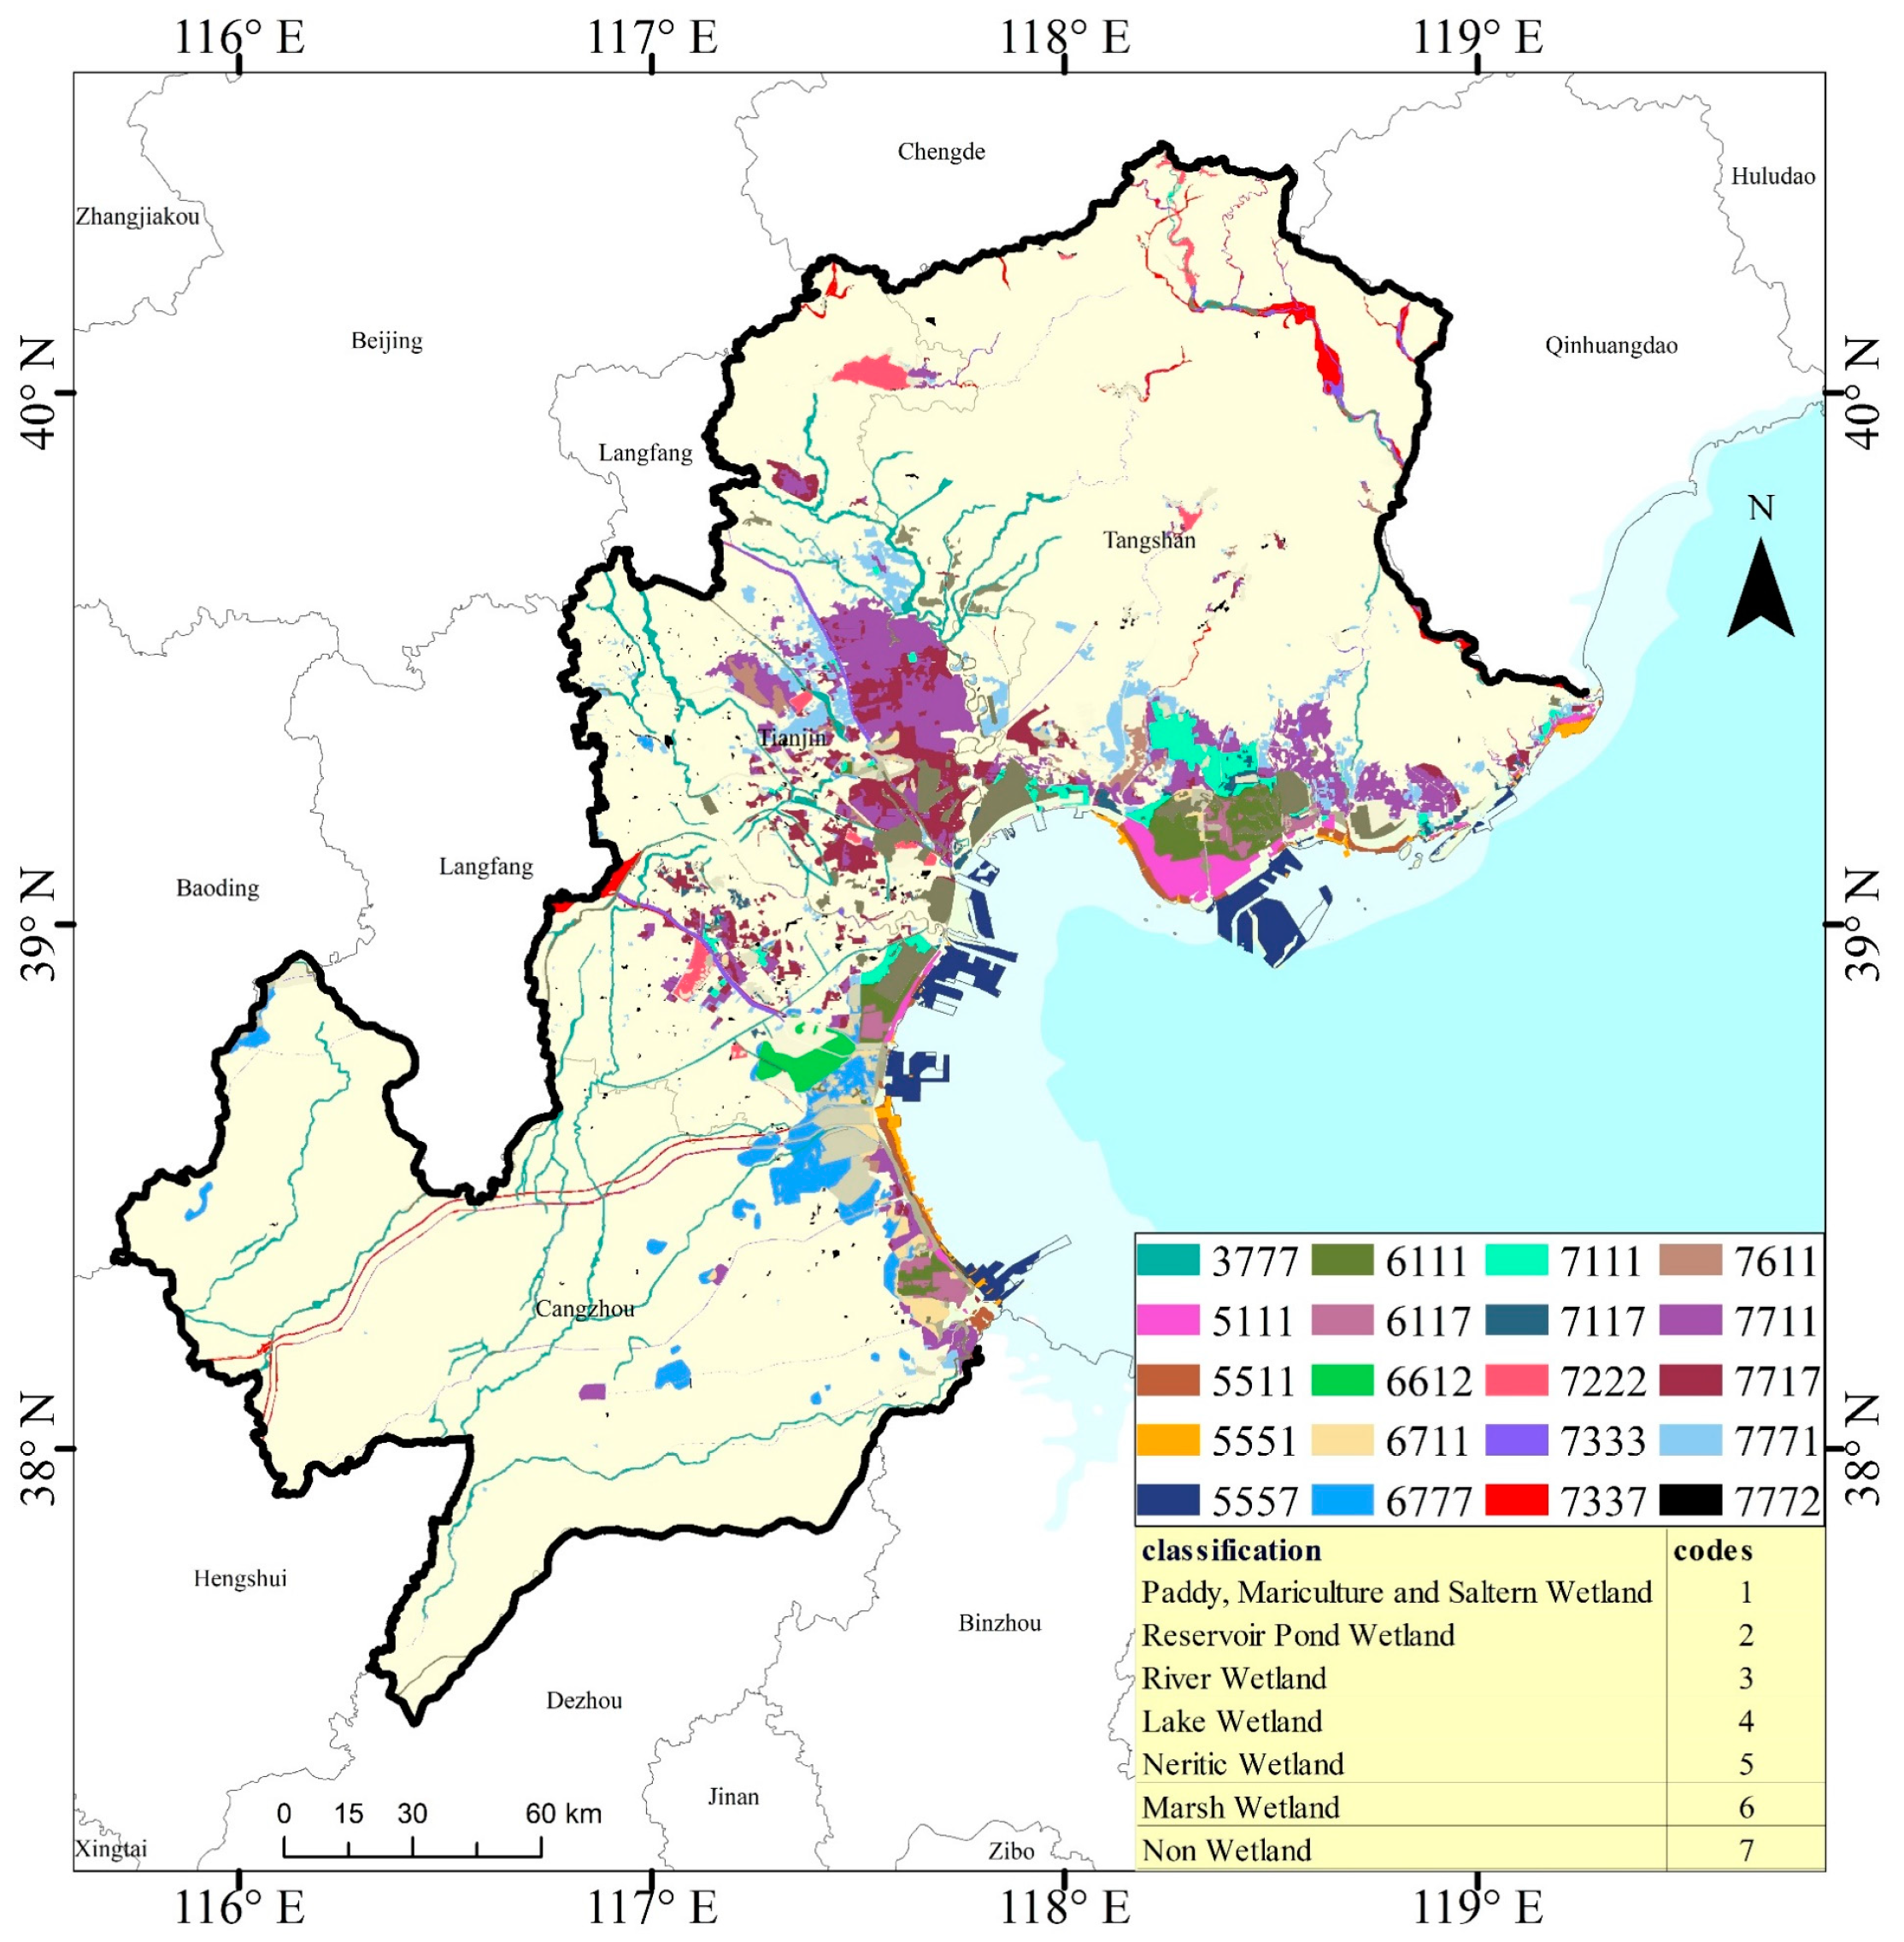
Furthermore, from 1940 to 2020, significant land-use transformations occurred in the study area, particularly in coastal wetlands (Figure 4). Key changes include the conversion of non-wetland areas into paddy, mariculture, and saltern wetlands (codes “7711” and “7771”), primarily in central eastern Tianjin and southern Tangshan. Additionally, code “3777” indicates a decline in riverine wetlands, with sections along major rivers being converted into non-wetland areas before 1975. Other codes, such as “7717”, “5577”, and others, represent wetlands transformed into non-wetland zones, concentrated along coastal regions where land reclamation is prevalent. Internal transformations within wetlands, such as code “6111”, which denotes the conversion of marsh wetlands into paddy fields, mariculture zones, and saltern wetlands, were primarily observed in the Caofeidian region of Tangshan.
In summary, over the past 80 years, coastal wetlands have undergone significant changes in landscape patterns, with a notable increase in landscape fragmentation. Additionally, the primary trajectories of wetland-type changes include the conversion of wetlands into non-wetlands. These changes indicate major adjustments in landscape structure and may have profound impacts on the stability and functionality of the ecosystem.

4. Discussion

4.1. Analysis of Driving Mechanisms

Over the past 80 years, the landscape of the Tianjin–Hebei coastal wetlands has undergone substantial changes. The area of natural wetlands decreased by 3549 km2, while constructed wetlands increased by 4289 km2. The primary transformations included conversions from wetlands to non-wetland areas and from non-wetland areas to paddy fields, mariculture zones, and saltern wetlands. The expansion of constructed wetlands is directly linked to human activities, whereas the decline in natural wetlands can be attributed to both natural processes and human impacts.
From 1940 to 1975, constructed wetlands expanded by 1389 km2, an increase of 259% from 1940 levels. Concurrently, natural wetlands decreased by 1577 km2, a 23% reduction from 1940. This period saw 868 km2 of natural wetlands converted to constructed types, with an additional 749 km2 of non-wetland areas also being transformed. This phase was marked by rapid growth in constructed wetlands and significant declines in natural wetlands, largely driven by intensified human land-use activities.
Between 1975 and 2000, constructed wetlands further expanded by 3379 km2, a 176% increase compared to 1975. During the same period, natural wetlands decreased by 946 km2, an 18% decline from 1940. In this era, 752 km2 of natural wetlands were converted into constructed wetlands, and 2766 km2 of non-wetlands were transformed. While the expansion of constructed wetlands continued robustly, the annual loss of natural wetlands slowed. The development and utilization of non-wetland areas also played crucial roles in shaping wetland dynamics during this time.
From 2000 to 2020, constructed wetlands decreased slightly by 479 km2, a 1% decline compared to 2000. In contrast, natural wetlands experienced a more substantial reduction of 1025 km2, a 24% decrease from 2000. This period involved the conversion of 148 km2 of natural wetlands into constructed wetlands, while 952 km2 of non-wetlands were also converted. Despite the decrease in the area of constructed wetlands, the trend of natural wetland reduction persisted. The significant conversion of non-wetlands into constructed wetlands underscores the ongoing demand for coastal land for economic development.
The observed patterns of coastal wetland changes from 1940 to 1975, from 1975 to 2000, and from 2000 to 2020, reflecting the enduring and evolving impacts of human activities on these ecosystems. These changes not only mirror the evolution of economic and social needs in the coastal regions but also illuminate the varied development strategies adopted across different historical periods.
In the early years following the establishment of the People’s Republic of China, constrained by a nascent economic foundation, the government prioritized the development of salt production in coastal regions to bolster national economic growth and support livelihoods [31]. This strategic emphasis led to substantial expansions in areas such as the Hangu Salt Field in Tianjin, the Nanpu Salt Field in Tangshan, and the Daqinghe Salt Field, collectively growing from 386 km2 during the early founding period to 1452 km2 by 2000, establishing a widespread distribution of salt pans.
During the 1980s and 1990s, as China embarked on profound economic reforms and opened its markets internationally, there was a concerted effort to develop the marine economy along the coastal regions, catalyzing the rapid growth of mariculture [32]. On the Cangzhou coast of the Tianjin–Hebei region, mariculture expanded by 50 km2, leading to an artificial extension of the shoreline by approximately 3 km.
As the 21st century began, globalization accelerated international trade, intensifying the demand for logistical hubs such as ports [14]. This dynamic spurred extensive land reclamation efforts in coastal zones, including Dalian Port, the Tianjin Port–Lingang Economic Zone, and Caofeidian, where reclaimed land areas exceeded 100 km2, pushing the shoreline seaward by up to approximately 23 km.
Since 2014, recognizing the need to safeguard marine ecological resources and achieve sustainable development in the marine economy [33], the Chinese government has implemented policies to suspend the approval of new sea reclamation projects and regional plans. This regulatory shift has contributed significantly to stabilizing the coastal shoreline and enhancing environmental conservation efforts.
Upon examining the continuous evolution of human activities alongside economic and social developments in the study area, it is clear that these activities have not only spurred regional growth on a large scale but also had significant impacts on wetland ecosystems at a more localized level. This impact underscores the complex relationship between economic development and the natural environment. Despite the fact that the expansion of constructed wetlands has somewhat compensated for the reduction of natural wetlands, the concurrent expansion of reservoirs and land reclamation activities has exacerbated the pressure on wetland ecosystems.
Since 1949, China has made significant advances in reservoir construction, beginning with six large reservoirs in the early 1940s. Today, after more than 70 years, the number has soared to over 98,000 [34]. These reservoirs have played crucial roles in flood control, disaster mitigation, energy provision, and securing stable water supplies for agriculture across China [35,36]. At the same time, the development of basic water conservancy infrastructure, coupled with human activities such as agricultural irrigation, has significantly expanded the Reservoir Pond Wetlands in the study area, from 14 km2 in 1940 to 631 km2 by 2020.
Figure 4 shows that from 1940 to 1975, river wetlands in the study area underwent a significant narrowing of river channels. This change was driven by factors such as rapid population growth and increasing land demands, leading to extensive development along riverbanks. This development encroached upon or diverted river channels, consequently reducing their width. For example, the width of the Xuanhui River near Baoguantun Town in Nanpi County, Cangzhou City, Hebei Province, decreased from 387 m in 1940 to 68 m by 2020. Additionally, reservoir construction likely disrupted natural water flows, reducing upstream water volumes and contributing to the narrowing of downstream river channels. Furthermore, increased agricultural water usage in some areas has led to significant groundwater depletion, posing serious threats to the sustainability of wetland ecosystems [37,38,39], particularly evident in the extensive drying of lakes and marsh wetlands.
Concurrently, the rapid growth of port clusters has driven extensive land reclamation efforts, significantly altering wetland distributions and types. Notably, the reclamation projects at Caofeidian Port, Tianjin Port, and Dalian Port are among the largest in China, together reclaiming 310 km2 from shallow waters to develop deep-water ports and industries such as steel, chemicals, and power [40]. During the study period, paddy, mariculture, and saltern wetlands expanded by 3672 km2, while neritic wetlands experienced an annual loss of 1377 km2, indicating worrying trends in both the amount of change and the reduction in area. Moreover, rising sea levels pose additional challenges, intensifying the impact on shallow sea wetlands [41,42,43,44,45].
Since 1940, activities such as land reclamation, water conservancy projects, agricultural development, and urbanization have profoundly and irreversibly impacted the wetland ecosystems of the Tianjin–Hebei coastal region. Initially, natural erosion processes, including shoreline degradation and widespread erosion due to rising sea levels, primarily shaped these wetlands, particularly in Northern Dashentang and Southern Xujiabao to Dakouhe areas [46,47]. However, from the 1960s onward, human activities have become the dominant forces reshaping the coastal wetland landscape, marking a significant shift. Tianjin and Hebei provinces experienced land gains of 412 km2 and 938 km2, respectively, between 1940 and 2014, which are primarily attributed to human activities. The areas of sea encroachment were 2 km2 and 20 km2, respectively, likely dominated by erosion in the estuarine delta regions [18]. These findings underscore that although human factors are now predominant, natural factors such as extreme climate events and sea-level rise continue to subtly influence coastal wetland dynamics [48].
In conclusion, the evolution of wetlands in the Tianjin–Hebei coastal region over the past 80 years has predominantly featured a decline in natural wetlands coupled with an increase in artificial wetlands. This shift reflects a gradual transition from natural processes to human-driven forces as the primary drivers of change in these ecosystems.

4.2. Analysis of Ecological and Environmental Problems Caused by Changes in Coastal Wetlands

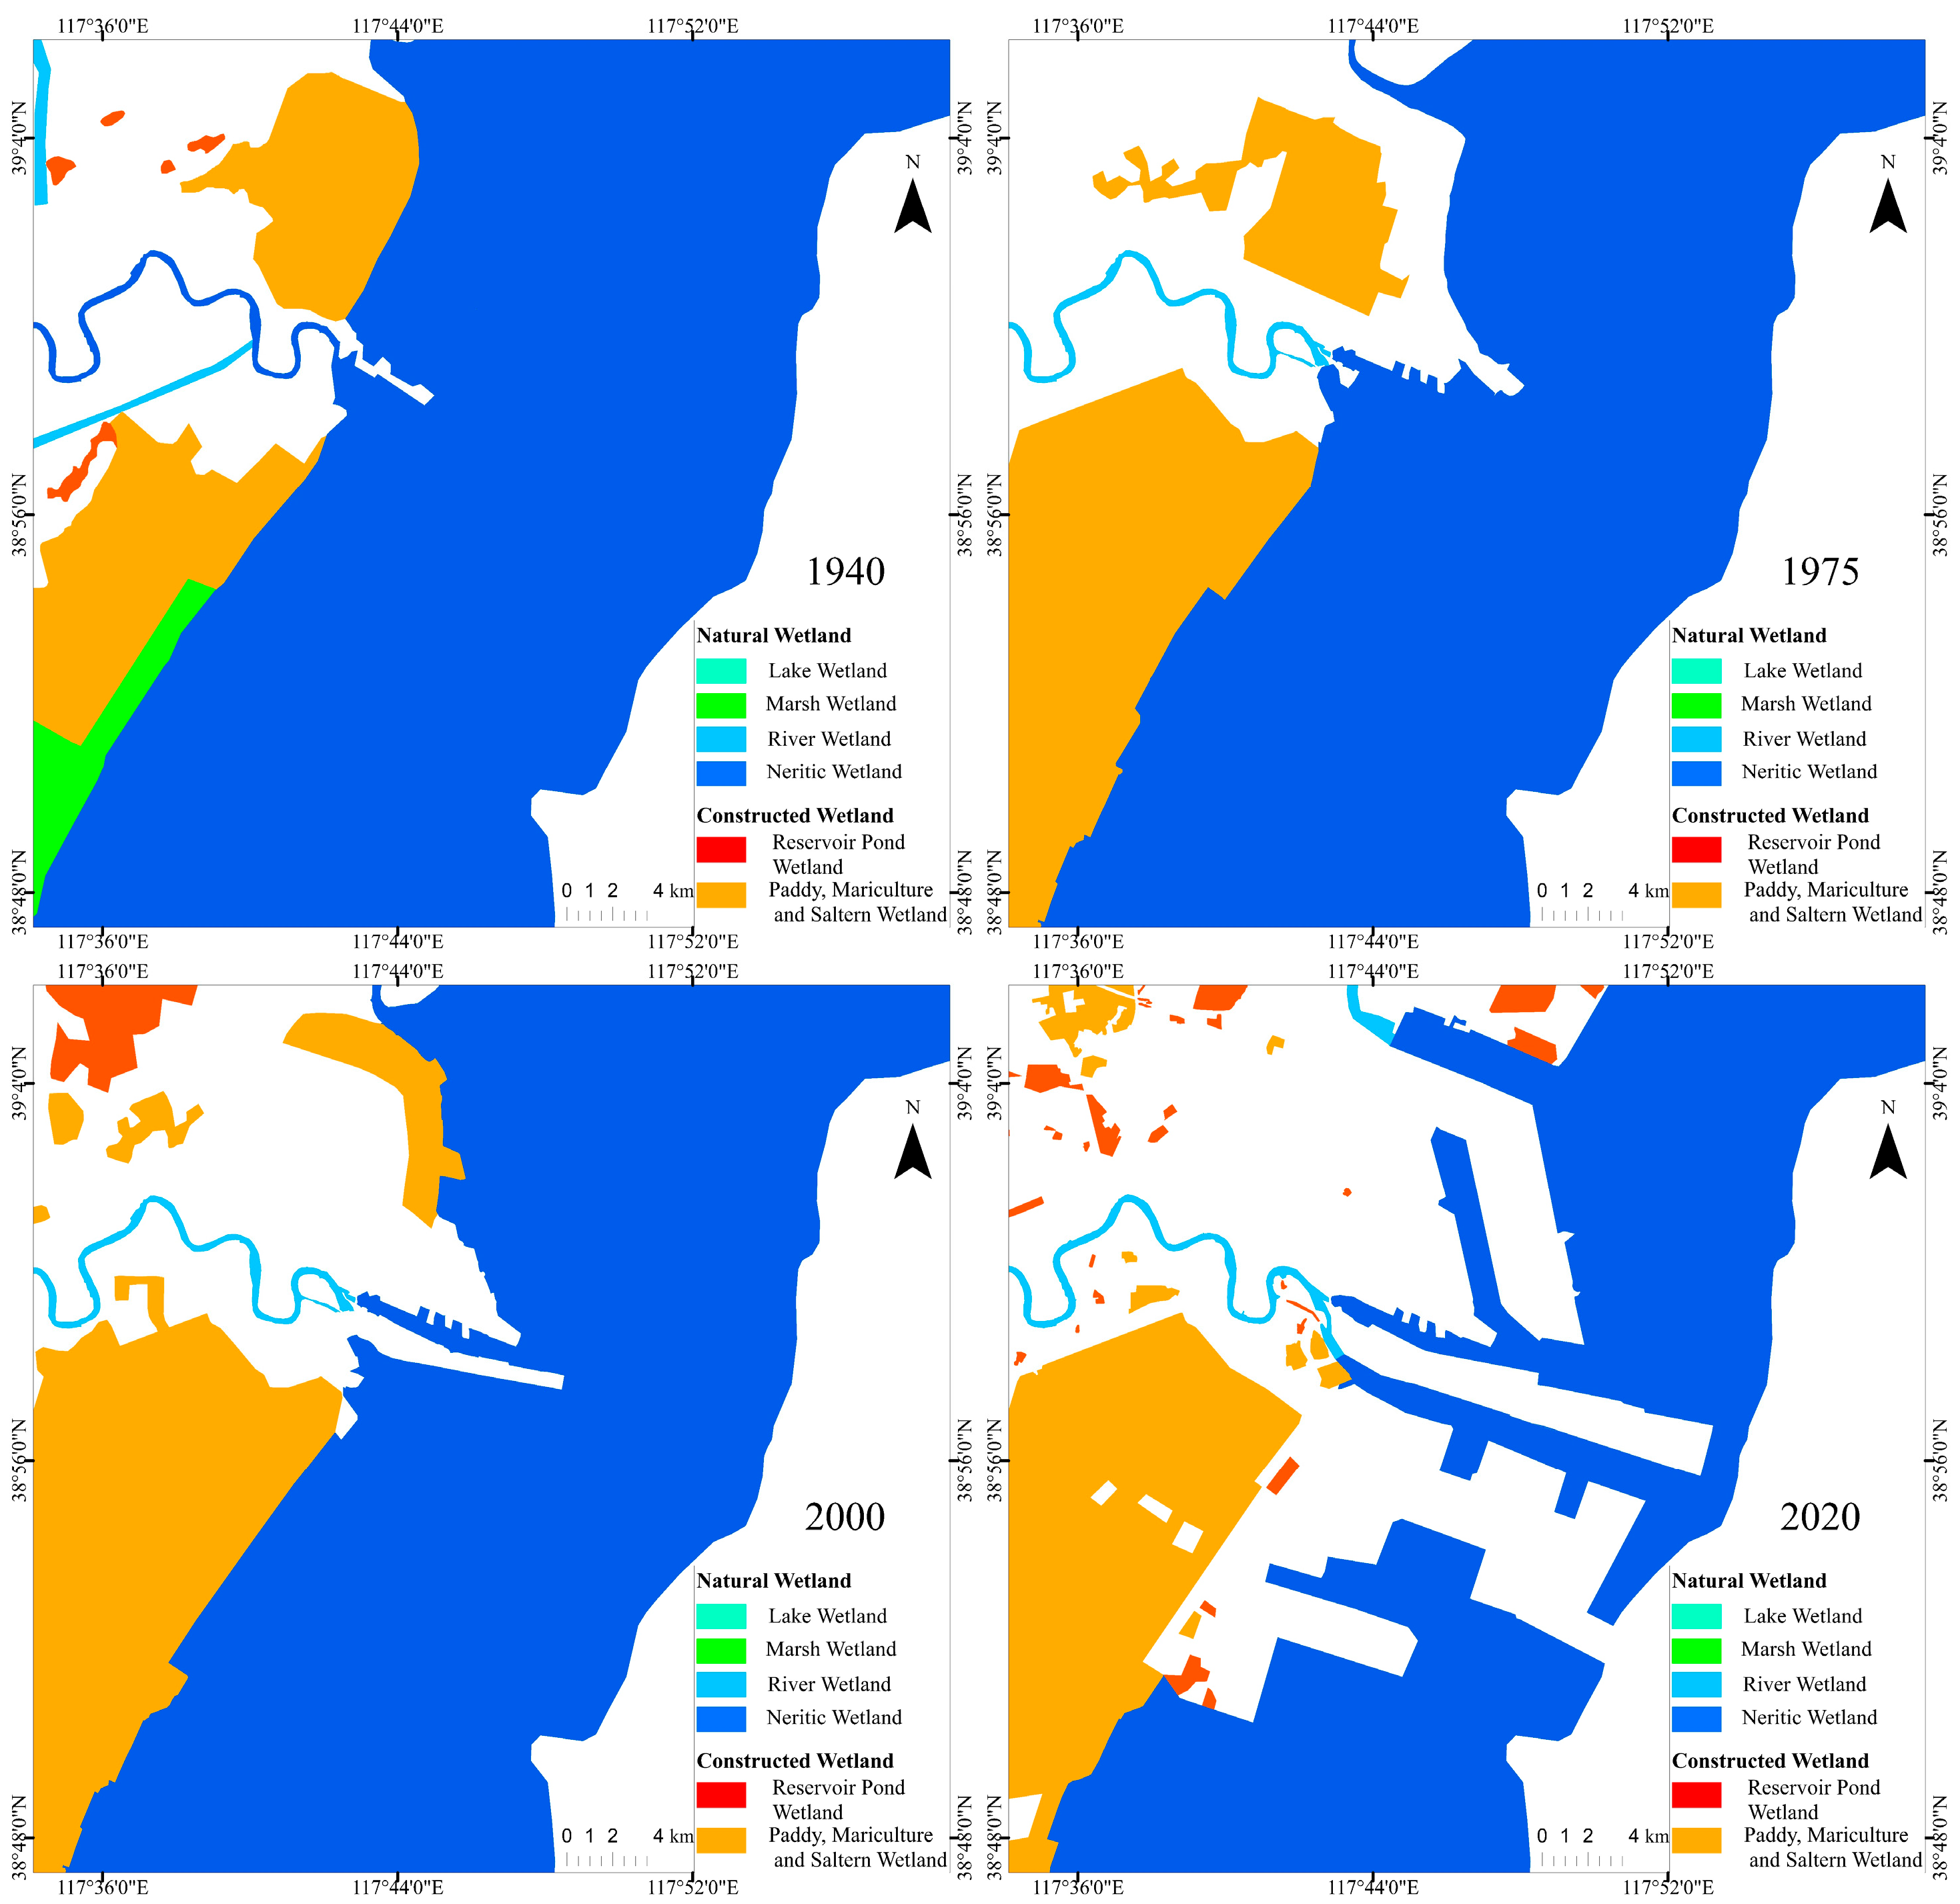
The changes in coastal wetland types and the degree of fragmentation will ultimately manifest in the ecological environment. Figure 5 highlights the evolving distribution of wetlands around Tianjin Port, showing a trend towards increased fragmentation as formerly contiguous wetlands have fragmented into smaller, scattered patches. With the intensification of human activities such as port construction, industrial development, agricultural expansion, and aquaculture, wetland distribution has increasingly become fragmented, and wetland types have frequently changed. This situation has significantly reduced the ecological connectivity of wetlands and undermined the overall integrity and stability of the ecosystem, with this trend becoming more pronounced [49,50].
Fragmentation not only involves the physical separation and dispersion of landscapes but also profoundly disrupts the continuity and natural fluidity of ecosystems, thereby weakening interdependence and ecological cooperation. Land reclamation activities disrupt ecological connectivity, leading to the reduction or disappearance of original habitats that are crucial for various fish and bird species. Research has indicated varying impacts of coastal wetland changes on different waterbird species, particularly migratory, transient, and endangered birds, which face heightened risks during migration, reproduction, and survival [51,52,53]. Furthermore, the use of fertilizers, pesticides, and pharmaceuticals in fisheries and agriculture contributes to water and environmental pollution, directly affecting waterbirds through poisoning and mortality [54]. The NP and PD values for reservoir pond wetlands also show a progressive increase, indicating worsening landscape fragmentation. Reservoir construction alters hydrological conditions, significantly affecting animal behavior, vegetation phenology, and the seasonal dynamics of the hydrological cycle [55,56]. The fragmentation of river wetlands into smaller patches, influenced by both natural and anthropogenic factors, has complex and enduring effects on biodiversity. While these impacts may not manifest immediately, extensive and rapid human-induced fragmentation can disrupt ecosystem integrity and connectivity over the long term, adversely affecting biodiversity and habitat quality [57,58].
In contrast, lake Wetlands and marsh wetlands show a slight decline in NP and PD values, likely stemming from significant reductions in their respective areas. This trend signals ongoing environmental concerns. The stability of woody plant communities may be compromised due to water source depletion, while aquatic organisms face potential population declines or even extinction risks due to habitat loss. Furthermore, unique species within marsh communities may struggle to adapt to changing environmental conditions [59]. However, this decline could also reflect conservation efforts such as the establishment of wetland reserves and ecological water replenishment initiatives, which have facilitated the expansion and connectivity of wetland patches, thereby enhancing overall wetland connectivity. Conversely, neritic wetlands exhibit relatively stable fragmentation levels, likely influenced by their inherent characteristics, geographic positioning, and environmental conditions.
The observed trend of landscape fragmentation in the Tianjin–Hebei coastal wetlands underscores the diverse adverse impacts on the ecological environment. Effective strategies must be implemented to mitigate wetland fragmentation and uphold the health and stability of these critical ecosystems.

4.3. Suggestions for Protection and Restoration

Based on a detailed analysis of changes and driving factors in coastal wetlands over the last 80 years, along with an assessment of current challenges, we propose the following recommendations:

4.3.1. Addressing the Decline in Natural Wetlands

  • Government authorities should enact rigorous regulations and policies aimed at halting further development and destruction of natural wetlands. This includes stringent measures to protect existing wetlands and prevent their degradation [60].
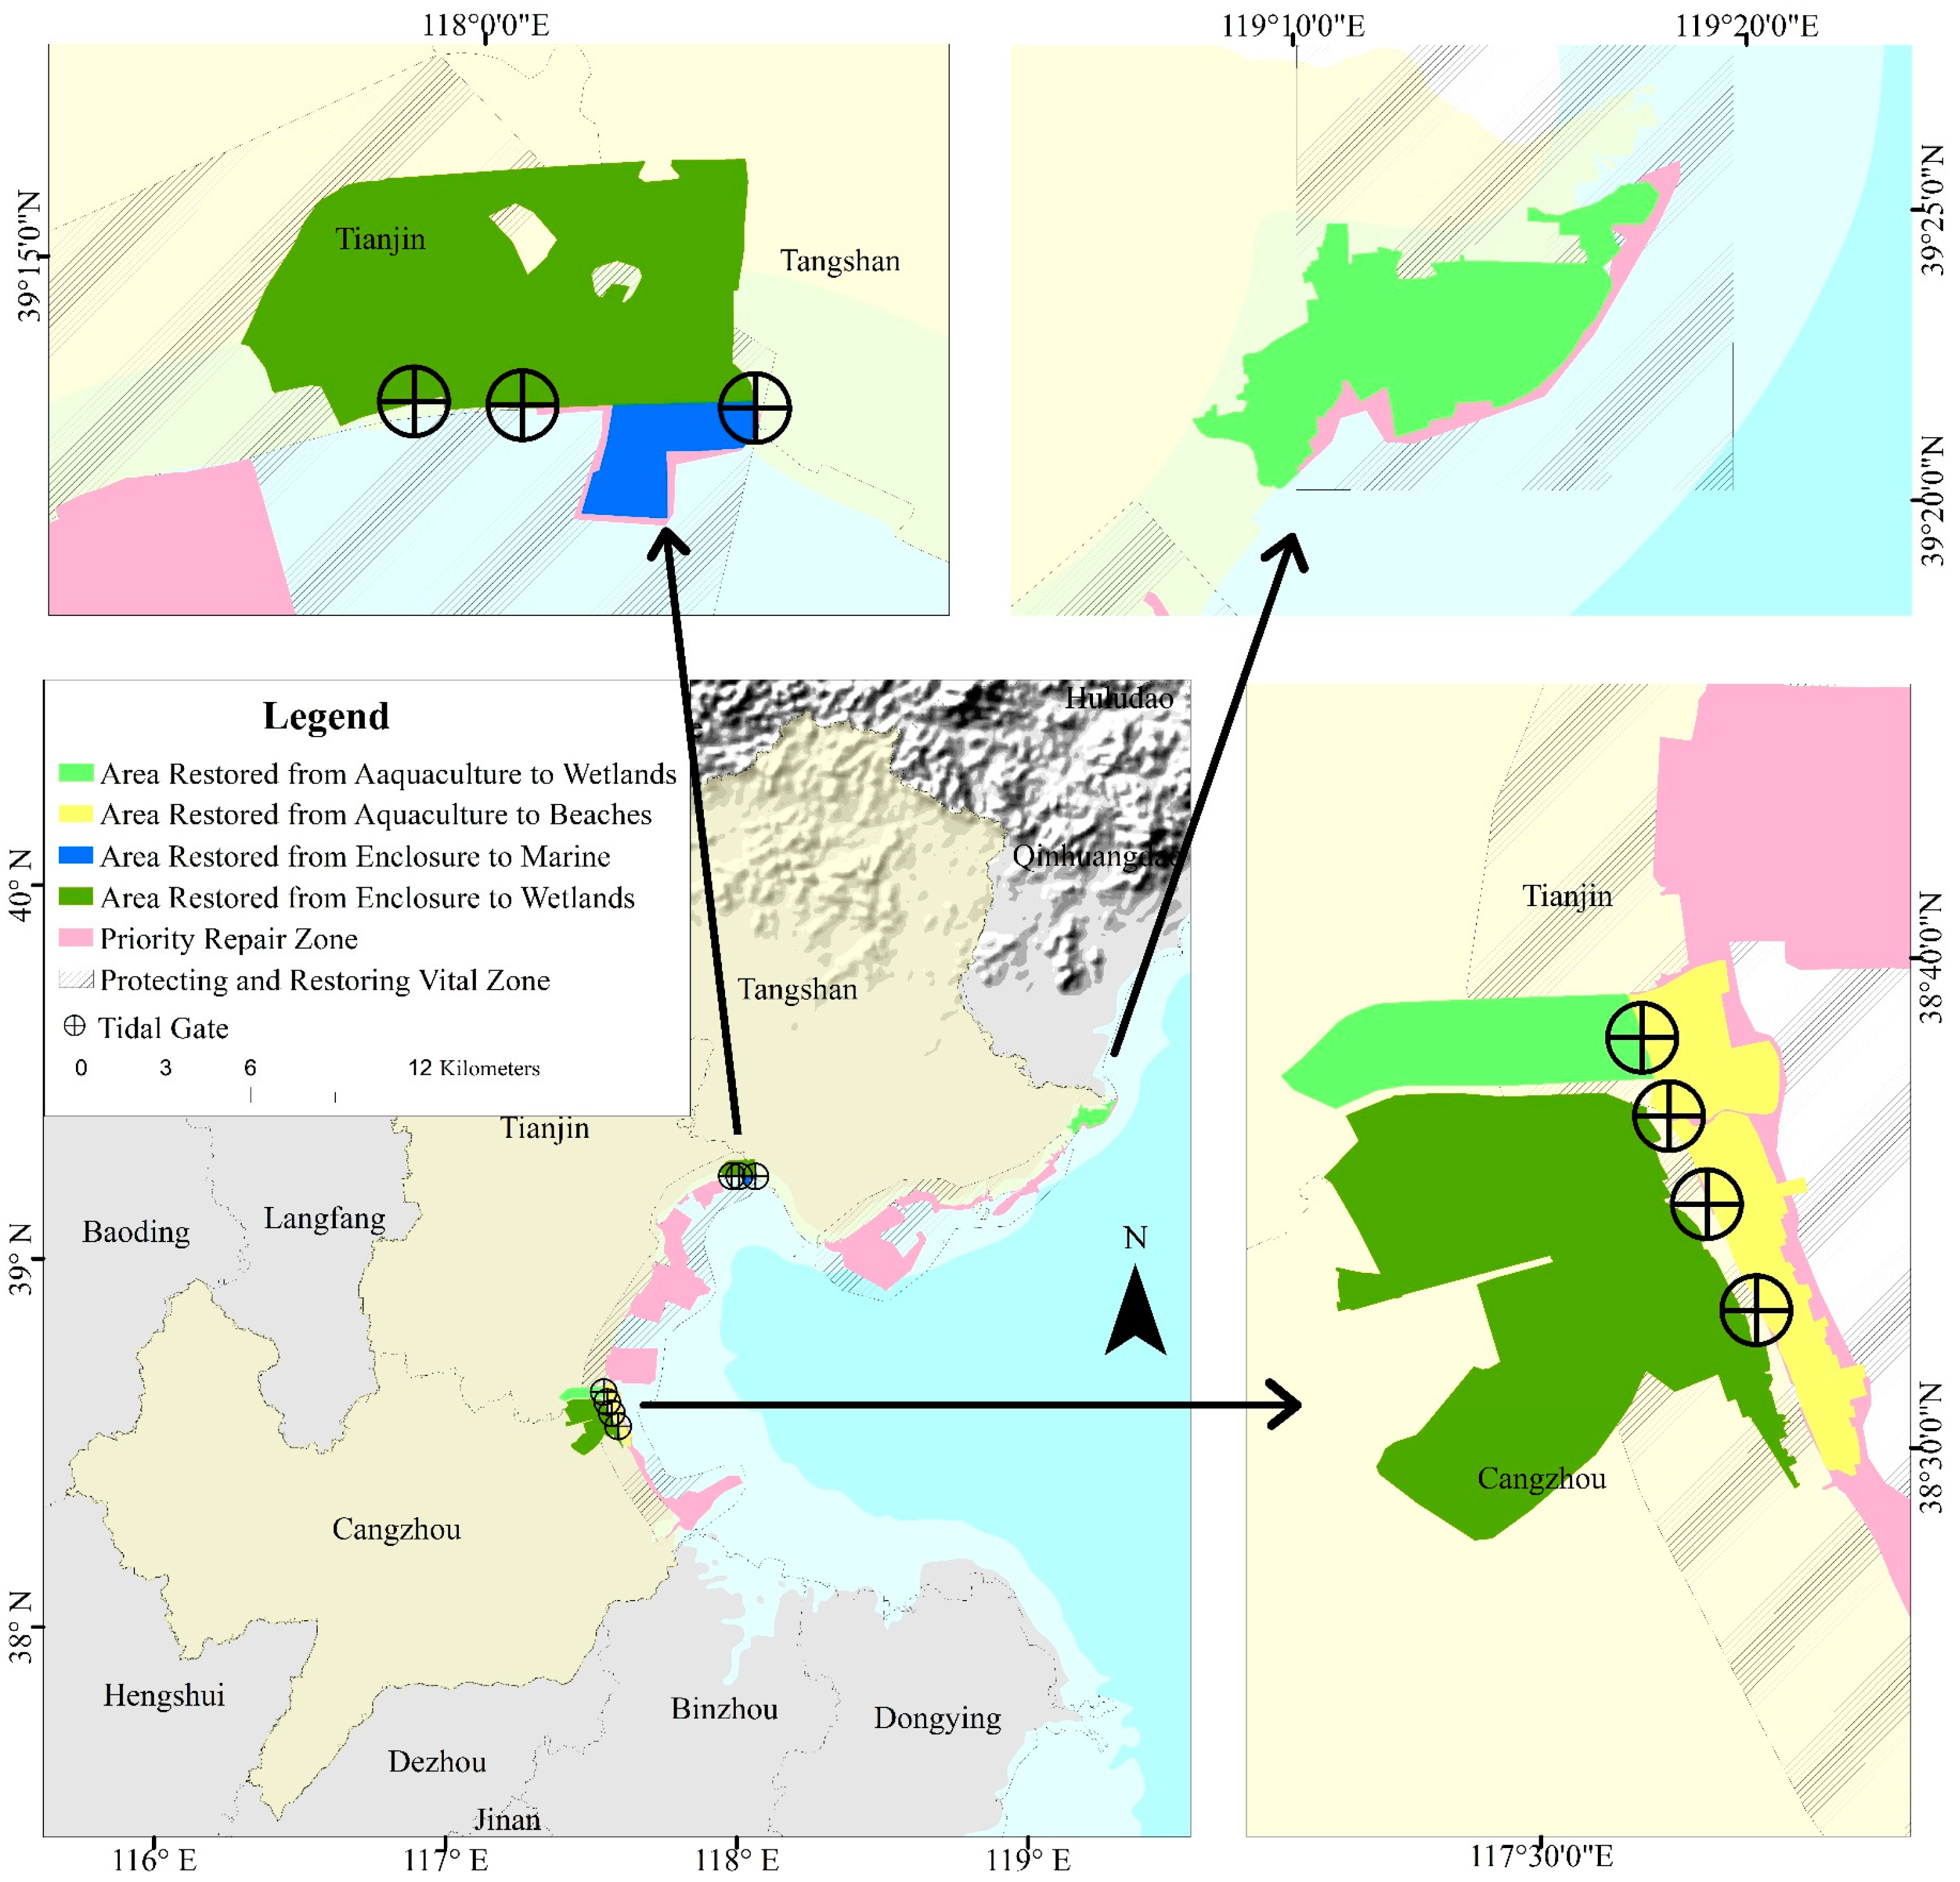
  • Focus should be on ecological restoration initiatives in heavily impacted wetland areas. Strategies may include reclaiming aquaculture zones for wetland purposes, restoring enclosed areas to their natural wetland state, and reintegrating coastal areas with wetlands. These efforts aim to progressively enhance the extent and quality of natural wetland habitats [61].

4.3.2. Addressing Wetland Fragmentation

  • It is crucial to establish ecological corridors between wetlands to maintain connectivity within wetland ecosystems. These corridors facilitate the movement and genetic exchange of wetland biopopulations, thereby promoting ecological resilience and biodiversity conservation [62].
  • Addressing human-induced disruptions to wetland hydrology is essential. Remedial measures, such as installing controllable tidal gates and optimizing drainage networks, should be prioritized. These actions aim to stabilize and enhance the hydrological conditions necessary for sustainable wetland ecosystems.
For detailed recommendations and specific restoration strategies tailored to different locations, please refer to Figure 6, which provides an illustrative guide to restoration engineering solutions.

5. Conclusions

Based on comprehensive analyses utilizing remote sensing, topographic maps, and field survey data, this study investigates the dynamic changes and driving factors influencing the Tianjin–Hebei coastal wetlands from 1940 to 2020. The key conclusions are as follows:
  • Overall, the coastal wetland area has shown a pattern of decrease, increase, and then a subsequent decrease, though it remains relatively extensive in the current period. Specifically, Tianjin and Tangshan have experienced fluctuating increases in wetland areas historically, with recent decades showing a decline. In contrast, Cangzhou has seen a fluctuating decrease in wetland areas.
  • Coastal wetlands have undergone significant landscape changes, particularly with an increase in fragmentation. The primary change in wetland types is the conversion of wetlands into non-wetlands.
  • In response to the observed changes and challenges in coastal wetlands over the past eight decades, we recommend the following: First, strengthen wetland protection policies and enforce strict regulations to prevent further degradation. Second, focus on restoring damaged wetlands and expanding natural wetland habitats. Establish ecological corridors to improve connectivity and support the migration of species. These measures are essential for preserving coastal wetland ecosystems, protecting biodiversity, and promoting sustainable development.

Author Contributions

Conceptualization: F.W. (Fu Wang), F.W. (Feicui Wang); Methodology: F.W. (Feicui Wang), K.Z.; Investigation: F.W. (Fu Wang), P.Y., T.W., Y.H., L.Y.; Writing—original draft: F.W. (Feicui Wang); Writing—review and editing: F.W. (Fu Wang), F.W. (Feicui Wang). All authors have read and agreed to the published version of the manuscript.

Funding

This research was funded by NSFC (No. 42293261), China Geological Survey Program (DD20189506, DD20211301).

Data Availability Statement

The original contributions presented in the study are included in the article, any further inquiries, please email directly to the corresponding author.

Acknowledgments

We would like to thank Shi, P X, and Wen, M Z for their assistance in verifying the accuracy of the data and conducting field research for this article.

Conflicts of Interest

Author Zhu, K was employed by Tianjin Tian Ke Digital Innovation Science and Technology Co., Ltd. The remaining authors declare that the research was conducted in the absence of any commercial or financial relationships that could be construed as a potential conflict of interest.

References

  1. Li, C.; Wang, F.; Yang, P.; Wang, F.C.; Hu, Y.Z.; Zhao, Y.L.; Tian, L.; Zhao, R. Assessment ecological risk of heavy metal caused by high-intensity land reclamation in Bohai Bay, changing trend analyzation and carbon storage assessment of China. China Geol. 2024, 7, 1–11. [Google Scholar] [CrossRef]
  2. Bn, P.O.T. Ramsar Convention on Wetlands. Ramsar Fact Sheet 3 Wetlands: A Global Disappearing Act 2015. Available online: https://www.ramsar.org/sites/default/files/documents/library/factsheet3_global_disappearing_act_0.pdf (accessed on 16 March 2024).
  3. Ye, S.; Pei, L.; He, L.; Xie, L.; Zhao, G.; Yuan, H.; Laws, E.A. Wetlands in China: Evolution, Carbon Sequestrations and Services, Threats, and Preservation/Restoration. Water 2022, 14, 1152. [Google Scholar] [CrossRef]
  4. The State Forestry Administration of The Peoples’s Republic of China. China Wetlands Resource; China Forestry Publishing House: Beijing, China, 2015. [Google Scholar]
  5. Cui, B.; He, Q.; Gu, B.; Bai, J.; Liu, X. China’s Coastal Wetlands: Understanding Environmental Changes and Human Impacts for Management and Conservation. Wetlands 2016, 36, 1–9. [Google Scholar] [CrossRef]
  6. Ning, H.; Jiang, W.J.; Sheng, Y.Z.; Wang, K.L.; Chen, S.M.; Zhang, Z.; Liu, F.T. Comprehensive evaluation of nitrogen contamination in water ecosystems of the Miyun reservoir watershed, northern China: Distribution, source apportionment and risk assessment. Environ. Geochem. Health 2024, 46, 278. [Google Scholar] [CrossRef]
  7. Jiang, W.J.; Meng, L.S.; Liu, F.T.; Sheng, Y.Z.; Chen, S.M.; Yang, J.L.; Mao, H.R.; Zhang, J.; Zhang, Z.; Ning, H. Distribution, source investigation, and risk assessment of topsoil heavy metals in areas with intensive anthropogenic activities using the positive matrix factorization (PMF) model coupled with self-organizing map (SOM). Environ. Geochem. Health 2023, 45, 6353–6370. [Google Scholar] [CrossRef]
  8. Orimoloye, I.R.; Mazinyo, S.P.; Kalumba, A.M.; Nel, W.; Adigun, A.I.; Ololade, O.O. Wetland shift monitoring using remote sensing and GIS techniques: Landscape dynamics and its implications on Isimangaliso Wetland Park, South Africa. Earth Sci. Inform. 2019, 12, 553–563. [Google Scholar] [CrossRef]
  9. Dang, A.T.; Kumar, L.; Reid, M.; Nguyen, H. Remote Sensing Approach for Monitoring Coastal Wetland in the Mekong Delta, Vietnam: Change Trends and Their Driving Forces. Remote Sens. 2021, 13, 3359. [Google Scholar] [CrossRef]
  10. Zhu, J.F.; Zhou, Y.; Wang, S.X.; Wang, L.T.; Liu, W.L.; Li, H.Y.; Mei, J.J. Analysis of changes of Baiyangdian wetland from 1975 to 2018 based on remote sensing. Natl. Remote Sens. Bull. 2019, 23, 971–986. [Google Scholar] [CrossRef]
  11. Couvillion, B.R.; Beck, H.; Schoolmaster, D.; Fischer, M. Land Area Change in Coastal Louisiana (1932 to 2016); U.S. Geological Survey: Reston, VA, USA, 2017. [CrossRef]
  12. White, E.E., Jr.; Ury, E.A.; Bernhardt, E.S.; Yang, X. Climate change driving widespread loss of coastal forested wetlands throughout the North American coastal plain. Ecosystems 2021, 25, 812–827. [Google Scholar] [CrossRef]
  13. Bournazel, J.; Kumara, M.P.; Jayatissa, L.P.; Viergever, K.; Morel, V.; Huxham, M. The impacts of shrimp farming on land-use and carbon storage around Puttalam lagoon, Sri Lanka. Ocean. Coast. Manag. 2015, 113, 18–28. [Google Scholar] [CrossRef]
  14. Tian, B.; Wu, W.; Yang, Z.; Zhou, Y. Drivers, trends, and potential impacts of long-term coastal reclamation in China from 1985 to 2010. Estuar. Coast. Shelf Sci. 2016, 170, 83–90. [Google Scholar] [CrossRef]
  15. Cheng, M.; Huang, B.; Kong, L.; Ouyang, Z. Ecosystem spatial changes and driving forces in the Bohai coastal zone. Int. J. Environ. Res. Public Health 2019, 16, 536. [Google Scholar] [CrossRef] [PubMed]
  16. Zhu, G.; Xie, Z.; Li, T.; Ma, Z.; Xu, X. Assessment ecological risk of heavy metal caused by high-intensity land reclamation in Bohai Bay, China. PLoS ONE 2017, 12, e0175627. [Google Scholar] [CrossRef]
  17. Wei, F.; Han, G.X.; Zhang, J.P.; Li, Y.Z.; Zhao, J.M. Temporal and spatial dynamic evolution of coastal wetland under the action of sea reclamation in Bohai Rim during 1980–2015. Chin. J. Ecol. 2018, 37, 1527–1537. [Google Scholar] [CrossRef]
  18. Hou, X.Y.; Hou, W.; Wu, T. Shape changes of major gulfs along the mainland of China since the early 1940s. Acta Geogr. Sin. 2016, 71, 118–129. [Google Scholar] [CrossRef]
  19. Ding, Y.; Wei, H. Research of the influential factors on the simulation of storm surge in the Bohai Sea. Open Mech. Eng. J. 2014, 8, 151–156. [Google Scholar] [CrossRef]
  20. Wang, R.B.; Zhou, W.; Li, F.L.; Wang, H.; Yang, G.Y.; Yao, Z.J.; Kuang, S.J. Tectonic subsidence and prospect of ground subsidence control in Tianjin area. Hydrogeol. Eng. Geol. 2003, 5, 12–17. [Google Scholar] [CrossRef]
  21. McKee, M.; White, J.R.; Putnam-Duhon, L.A. Simulated storm surge effects on freshwater coastal wetland soil porewater salinity and extractable ammonium levels: Implications for marsh recovery after storm surge. Estuar. Coast. Shelf Sci. 2016, 181, 338–344. [Google Scholar] [CrossRef]
  22. Wang, H.; Shang, Z.W.; Wang, F. On the muddy coast, western Bohai Bay, China. Geol. Bull. China 2010, 29, 641–649. Available online: http://dzhtb.cgs.cn/en/article/id/20100502 (accessed on 4 April 2024).
  23. GB/T 24708-2009; Wetland Classification. National Forestry and Grassland Administration of China: Beijing, China, 2009.
  24. NH, R.K. Study of fluctuations in surface area of Lake Haramaya using NDWI and MNDWI methods. J. Geospat. Inf. Sci. Eng. 2022, 5, 36–41. [Google Scholar] [CrossRef]
  25. Chang, L.; Cheng, L.; Huang, C.; Qin, S.; Fu, C.; Li, S. Extracting urban water bodies from Landsat imagery based on mNDWI and HSV transformation. Remote Sens. 2022, 14, 5785. [Google Scholar] [CrossRef]
  26. Wang, S.; Zhang, L.; Zhang, H.; Han, X.; Zhang, L. Spatial–temporal wetland landcover changes of poyang lake derived from Landsat and HJ-1A/B data in the dry season from 1973–2019. Remote Sens. 2020, 12, 1595. [Google Scholar] [CrossRef]
  27. Liu, J.Y.; Wang, D.C.; Sun, R.H.; Wang, F.C.; Hu, B.X.; Chen, J.H.; Sun, Z.C. Study on spatial relevance of ecological-land loss based on change trajectory analysis method. Geographical Research. Geogr. Res. 2020, 39, 103–114. [Google Scholar] [CrossRef]
  28. Huang, Y.; Wang, F.Y.; Cai, T.J.; Wang, D.C.; Wang, Q.Q.; Chen, W.G. Landscape pattern dynamic analysis based on change trajectory method in Bohai rim area. J. Soil Water Conserv. 2015, 29, 314–319. [Google Scholar] [CrossRef]
  29. Zong, X.Y.; Gao, L.H.; Qiao, Y.L.; Lin, S. Study on dynamic changes of wetland landscape pattern in yellow river delta. J. Geo-Inf. Sci. 2009, 11, 91–97. [Google Scholar] [CrossRef]
  30. Li, Y.Z.; Yu, J.B.; Han, G.X.; Wang, X.H.; Wang, Y.L.; Guan, B. Dynamic evolution of natural wetlands in Yellow River Delta and related driving factors. Chin. J. Ecol. 2011, 30, 1535–1541. Available online: https://www.cje.net.cn/CN/Y2011/V30/I07/1535 (accessed on 5 April 2024).
  31. Bao, J.; Gao, S.; Ge, J. Dynamic land use and its policy in response to environmental and social-economic changes in China: A case study of the Jiangsu coast (1750–2015). Land Use Policy 2019, 82, 169–180. [Google Scholar] [CrossRef]
  32. Wang, Q.; Liu, H.; Sui, J. Mariculture: Developments, present status and prospects. Aquac. China Success Stories Mod. Trends 2018, 38–54. [Google Scholar] [CrossRef]
  33. Bai, J.Y.; Sui, J.X. Requirement of rule of law for the marine ecological protection:an empirical study under the revision of the draft of the marine environment protection law. J. Shandong Univ. Sci. Technol. 2018, 3, 74–83. [Google Scholar] [CrossRef]
  34. Li, A.H.; Bai, L.L.; Huang, H.J.; Yang, X.R.; Zhao, Z.N. Optimization and enhancement of flood-control reservoir layout and function in China in the new era. China Water Resour. 2023, 14, 8–10. [Google Scholar] [CrossRef]
  35. Kundzewicz, Z.W.; Su, B.; Wang, Y.; Xia, J.; Huang, J.; Jiang, T. Flood risk and its reduction in China. Adv. Water Resour. 2019, 130, 37–45. [Google Scholar] [CrossRef]
  36. Liu, J.; Zang, C.; Tian, S.; Liu, J.; Yang, H.; Jia, S.; You, L.; Liu, B.; Zhang, M. Water conservancy projects in China: Achievements, challenges and way forward. Glob. Environ. Chang. 2013, 23, 633–643. [Google Scholar] [CrossRef]
  37. Liu, T.; Liu, L.; Luo, Y.; Lai, J. Simulation of groundwater evaporation and groundwater depth using SWAT in the irrigation district with shallow water table. Environ. Earth Sci. 2015, 74, 315–324. [Google Scholar] [CrossRef]
  38. Li, D.; Tian, P.; Luo, Y.; Dong, B.; Cui, Y.; Khan, S. Importance of stopping groundwater irrigation for balancing agriculture and wetland ecosystem. Ecol. Indic. 2021, 127, 107747. [Google Scholar] [CrossRef]
  39. Les Landes, A.A.; Aquilina, L.; De Ridder, J.; Longuevergne, L.; Pagé, C.; Goderniaux, P. Investigating the respective impacts of groundwater exploitation and climate change on wetland extension over 150 years. J. Hydrol. 2014, 509, 367–378. [Google Scholar] [CrossRef]
  40. Duan, H.; Zhang, H.; Huang, Q.; Zhang, Y.; Hu, M.; Niu, Y.; Zhu, J. Characterization and environmental impact analysis of sea land reclamation activities in China. Ocean Coast. Manag. 2016, 130, 128–137. [Google Scholar] [CrossRef]
  41. Masson-Delmotte, V.; Zhai, P.; Pirani, A.; Connors, S.L.; Péan, C.; Chen, Y.; Goldfarb, L.; Gomis, M.I.; Matthews, J.B.R.; Berger, S.; et al. Climate Change 2021: The Physical Science Basis. Contribution of Working Group I to the Sixth Assessment Report of the Intergovernmental Panel on Climate Change. 2021, Volume 2, p. 2391. Available online: https://www.ipcc.ch/report/ar6/wg1/downloads/report/IPCC_AR6_WGI_FrontMatter.pdf (accessed on 7 June 2024).
  42. Ministry of Natural Resources of the People’s Republic of China. China Natural Resources Bulletin 2023. Available online: https://gi.mnr.gov.cn/202402/P020240312701247258838.pdf (accessed on 17 June 2024).
  43. Wang, F.; Wang, H.; Li, J.F.; Wang, F.C.; Tian, L.Z.; Yu, Q.; Huang, Z.Q.; Fang, J.; Hu, Y.Z.; Xiao, G.Q.; et al. Evolution and trending prediction of the Chinese mainland coasts since 20 ka BP: Implication for ecological protection and restoration. Geol. China 2023, 50, 61–83. [Google Scholar] [CrossRef]
  44. Wang, F.; Li, J.F.; Shi, P.X.; Shang, Z.W.; Li, Y.; Wang, H. The impact of sea-level rise on the coast of Tianjin-Hebei, China. China Geol. 2019, 2, 26–39. [Google Scholar] [CrossRef]
  45. Wang, F.; Hu, Y.Z.; Tian, L.Z.; Shi, P.X.; Li, J.F.; Chen, Y.S.; Li, Y.; Shang, Z.W.; Jiang, X.Y.; Yuan, H.F.; et al. Sea Level Change in Bohai Bay. N. China Geol. 2024, 47, 1–20. [Google Scholar] [CrossRef]
  46. Li, J.F.; Kang, H.; Wang, H.; Pei, Y.D. Modern geological action and discussion of influence factors on the west coast of Bohai Bay, China. Geol. Surv. Res. 2007, 30, 295–301. [Google Scholar] [CrossRef]
  47. Shi, P.X.; Wang, F.; Shang, Z.W.; Li, Y. The present situation and changing characteristics of the shorelines along Tianjin-Hebei coastal areas and proposal for protection. Geol. Bull. China 2016, 35, 1630–1637. [Google Scholar] [CrossRef]
  48. Sheng, Y.; Baars, O.; Guo, D.; Whitham, J.; Srivastava, S.; Dong, H. Mineral-bound trace metals as cofactors for anaerobic biological nitrogen fixation. Environ. Sci. Technol. 2023, 57, 7206–7216. [Google Scholar] [CrossRef] [PubMed]
  49. Gómez-Baggethun, E.; Tudor, M.; Doroftei, M.; Covaliov, S.; Năstase, A.; Onără, D.F.; Mierlă, M.; Marinov, M.; Doroșencu, A.-C.; Lupu, G.; et al. Gabriel Changes in ecosystem services from wetland loss and restoration: An ecosystem assessment of the Danube Delta (1960–2010). Ecosyst. Serv. 2019, 39, 100965. [Google Scholar] [CrossRef]
  50. Jiang, M.; Chen, H.; Chen, Q.; Wu, H.; Chen, P. Wetland ecosystem integrity and its variation in an estuary using the EBLE index. Ecol. Indic. 2015, 48, 252–262. [Google Scholar] [CrossRef]
  51. Ding, X.; Shan, X.; Chen, Y.; Li, M.; Li, J.; Jin, X. Variations in fish habitat fragmentation caused by marine reclamation activities in the Bohai coastal region, China. Ocean Coast. Manag. 2020, 184, 105038. [Google Scholar] [CrossRef]
  52. Jackson, M.V.; Carrasco, L.R.; Choi, C.-Y.; Li, J.; Ma, Z.; Melville, D.S.; Mu, T.; Peng, H.-B.; Woodworth, B.K.; Yang, Z.; et al. Multiple habitat use by declining migratory birds necessitates joined-up conservation. Ecol. Evol. 2019, 9, 2505–2515. [Google Scholar] [CrossRef] [PubMed]
  53. Kan, Z.; Chen, B.; Yu, W.; Chen, G.; Ma, Z.; Hu, W.; Liao, J.; Du, H. Forecasting land-cover change effects on waterbirds in Xiamen Bay, China: Determining prospective species winners and losers. Mar. Environ. Res. 2023, 188, 106003. [Google Scholar] [CrossRef]
  54. Møller, A.P.; Laursen, K. Reversible effects of fertilizer use on population trends of waterbirds in Europe. Biol. Conserv. 2015, 184, 389–395. [Google Scholar] [CrossRef]
  55. Alho, C.J.R. Environmental effects of hydropower reservoirs on wild mammals and freshwater turtles in Amazonia: A review. Oecologia Aust. 2011, 15, 593–604. [Google Scholar] [CrossRef]
  56. Wang, D.C.; Wang, F.C.; Huang, Y.; Duan, X.W.; Liu, J.Y.; Hu, B.X.; Sun, Z.C.; Chen, J.H. Examining the effects of hydropower station construction on the surface temperature of the Jinsha River Dry-Hot Valley at different seasons. Remote Sens. 2018, 10, 600. [Google Scholar] [CrossRef]
  57. Fuller, M.R.; Doyle, M.W.; Strayer, D.L. Causes and consequences of habitat fragmentation in river networks. Ann. N. Y. Acad. Sci. 2015, 1355, 31–51. [Google Scholar] [CrossRef] [PubMed]
  58. Zedler, J.B.; Kercher, S. Wetland resources: Status, trends, ecosystem services, and restorability. Annu. Rev. Environ. Resour. 2005, 30, 39–74. [Google Scholar] [CrossRef]
  59. Castello, M.; Poldini, L.; Altobelli, A. The aquatic and wetland vegetation of Lake Doberdò: An analysis for conservation value assessment of a disappearing lake of the Classical Karst (North East Italy). Plant Sociol. 2021, 58, 75–106. [Google Scholar] [CrossRef]
  60. Zhang, H.; Jia, E.R.; Chen, S.; Fang, Y.X.; Dong, K.; Jia, W. Experience of Haikou wetlands conservation and restoration. Environ. Sustain. Dev. 2021, 2, 144–150. [Google Scholar]
  61. Zhu, C.Y.; Li, J.S.; Li, A.L.; Shen, K.M.; Wang, P.P.; Yan, Z.C.; Yuan, L. Analysis of temporal and spatial changes of the Laoshan Bay shoreline and discussion on ecological restoration. Mar. Geol. Front. 2024, 40, 63–72. [Google Scholar] [CrossRef]
  62. Zhuan, Q.; Yu, X.G.; Lin, Z.L.; Wen, R.; Zhang, J.W.; Long, Z.X. Assessment of Ecological Restoration Effect and Conservation Measures of Xinglin Bay in Xiamen. Ocean. Dev. Manag. 2021, 38, 91–98. [Google Scholar] [CrossRef]
Figure 1. Location map of the study area.
Water 16 02612 g001
Figure 2. Distribution of wetlands in different periods.
Water 16 02612 g002
Figure 3. Nature and constructed wetland in different periods (Unit: km2).
Water 16 02612 g003
Figure 4. Spatial distribution of the main trajectory codes for wetland changes in the study area.
Water 16 02612 g004
Figure 5. Illustrates the wetland distribution around Tianjin Port.
Water 16 02612 g005
Figure 6. Schematic diagram of coastal wetland restoration locations and projects in the study area.
Water 16 02612 g006
Table 1. Wetland classification.
Level 1Level 2Interpretation Markers
Natural WetlandRiver WetlandWater 16 02612 i001
Lake WetlandWater 16 02612 i002
Neritic WetlandWater 16 02612 i003
Marsh WetlandWater 16 02612 i004
Constructed WetlandReservoir Pond WetlandWater 16 02612 i005
Paddy, Mariculture, and Saltern WetlandWater 16 02612 i006
Table 2. Area of wetland types in different periods (Unit: km2).
PrimarySecondary1940197520002020
Constructed WetlandPaddy, Mariculture, and Saltern Wetland521.821655.94933.544194.18
Reservoir Pond Wetland14.39269.3371.04631.12
Natural
Wetland
River Wetland1044.87930.16864.41493.25
Lake Wetland132.12103.5969.7233.83
Neritic Wetland3965.253506.523253.482588.52
Marsh Wetland1622.89647.4354.08100.83
Total7301.347112.99546.278041.73
(Note: High-resolution aerial image analysis and field verification were conducted to validate remote sensing interpretations of coastal wetlands in 2020. The classification accuracy achieved was 88.80%.)
Table 3. Wetland types’ changes in different periods (Unit: km2/a).
PrimarySecondary1940–19751975–20002000–20201940–2020
Constructed WetlandPaddy, Mariculture, and Saltern Wetland32.40131.11−36.9745.90
Reservoir Pond Wetland7.284.0713.007.71
Natural
Wetland
River Wetland−3.28−2.63−18.56−6.90
Lake Wetland−0.82−1.35−1.79−1.23
Neritic Wetland−13.11−10.12−33.25−17.21
Marsh Wetland−27.87−23.732.34−19.03
Total−45.0797.33−75.239.25
Table 4. Wetland changes in different regions (Unit: km2).
1940197520002020
Tianjin2890.212681.754402.613508.33
Constructed Wetland420.87797.382898.922378.43
Natural Wetland2469.341884.371503.691129.9
Tangshan2352.853016.183412.933048.34
Constructed Wetland113.131005.021838.711922.08
Natural Wetland2239.722011.161574.221126.26
Cangzhou2058.281414.971730.731485.06
Constructed Wetland2.21122.8566.95524.79
Natural Wetland2056.071292.171163.78960.27
Table 5. Wetland dynamic changes in different regions (Unit: km2/a).
1940–19751975–20002000–20201940–2020
Tianjin−5.9668.83−44.717.73
Constructed Wetland10.7684.06−26.0224.47
Natural Wetland−16.71−15.23−18.69−16.74
Tangshan18.9515.87−18.238.69
Constructed Wetland25.4833.354.1722.61
Natural Wetland−6.53−17.48−22.40−13.92
Cangzhou−18.3812.63−12.28−7.17
Constructed Wetland3.4517.77−2.116.53
Natural Wetland−21.83−5.14−10.18−13.70
Table 6. Changes in number of landscape patches (NP) and patch density (PD) since 1940.
PrimarySecondary1940197520002020
NPPDNPPDNPPDNPPD
Constructed WetlandPaddy, Mariculture, and Saltern Wetland270.0037380.00531840.01935590.0693
Reservoir Pond Wetland150.0021140.0020160.00174200.0521
Natural
Wetland
River Wetland400.00551000.01411630.01713070.0381
Lake Wetland260.003680.001170.0007140.0017
Neritic Wetland50.000790.0013150.001680.0010
Marsh Wetland320.0044320.004520.000240.0005
Disclaimer/Publisher’s Note: The statements, opinions and data contained in all publications are solely those of the individual author(s) and contributor(s) and not of MDPI and/or the editor(s). MDPI and/or the editor(s) disclaim responsibility for any injury to people or property resulting from any ideas, methods, instructions or products referred to in the content.