Abstract
The Mississippi Delta region has worse population health outcomes, including higher overall cardiovascular and infant mortality rates. Water quality has yet to be considered as a factor in these health disparities. The objective of this paper is to determine overall differences in basic water quality indicators, electrolytes of cardiovascular importance, trace elements, heavy metals, and radioactive ions of groundwater in delta and non-delta counties in states along the Mississippi River. Data were sourced from the major-ions dataset of the U.S. Geological Survey. We used the Wilcoxon rank sum test to determine the difference in water quality parameters. Overall, delta counties had lower total dissolved solids (TDS) (47 and 384 mg/L, p-value < 0.001), calcium (7 and 58 mg/L; p-value < 0.001), magnesium (2 and 22 mg/L; p-value < 0.001), and potassium (1.57 and 1.80 mg/L; p-value < 0.001) and higher sodium (38 mg/L and 22 mg/L; p-value < 0.001) compared to non-delta counties. Overall, there were no statistical differences in trace elements, heavy metals, and radioactive ions across delta versus non-delta counties. These results underscore the need for further epidemiological studies to understand if worse health outcomes in delta counties could be partially explained by these parameters.
1. Introduction
The Mississippi Delta region is defined by the Delta Regional Authority (DRA) as 252 counties or parishes in Alabama, Arkansas, Illinois, Kentucky, Louisiana, Missouri, Mississippi, and Tennessee [1]. While most of the states (except for Alabama) are selected based on distance-proximity from the Mississippi River, Alabama Delta counties were selected based on topography [1]. This region has historically had worse population health outcomes compared to the rest of the United States [2]. For delta and non-delta counties, respectively, in Mississippi Delta states, the mean age-adjusted all-cause mortality rate was 1047.19 and 969.4 per 100,000 population, the age-adjusted heart disease mortality rate was 352.05 and 320.3 per 100,000 population, the infant mortality rate was 9.56 and 7.74 per 1000 live births, life expectancy of females was 77.18 and 78.42 years, and the life expectancy for males was 69.89 and 70.40 years in 2005 [3].
Contributing factors to these health disparities have been explored in other studies [4], yet differences in water quality in this region have not been widely considered. Good quality drinking water is essential for optimal population health outcomes as water intake can be an appreciable source of essential nutrients like electrolytes and trace elements [5,6]. Proficient intake of electrolytes, such as sodium, calcium, magnesium, and potassium are essential for blood pressure regulation and cardiovascular and metabolic function [7,8,9]. Trace elements are also important for population health outcomes [10,11]. Drinking water can also be a source of detrimental heavy metals (e.g., mercury, arsenic, cadmium, and chromium) and radioactive elements (e.g., radon) that are risk factors for chronic diseases such as cancers and cardiometabolic diseases [12].
Many people in the United States acquire their drinking water from wells where water quality is not monitored by the United States Environmental Protection Agency (USEPA). The EPA recommends testing well water for contaminants, but well users are not told to test their water for electrolyte (e.g., calcium) and trace element (e.g., copper) concentrations [13]. Many public utility companies also use groundwater sources for piped water supply. Differences in water quality could be a contributor to health disparities in the delta. Our study aims to determine differences in water quality parameters (organic nitrogen, pH, total dissolved solids (TDS), specific conductance), major electrolyte concentrations (sodium, calcium, magnesium, potassium, chlorine, alkalinity as CaCO3), trace element concentrations (cobalt, copper, iron, manganese, molybdenum, selenium, zinc), and heavy metal and radioactive ion concentrations (arsenic, cadmium, chromium, lead, uranium, strontium, radon-226, radon-228) among groundwater samples used as drinking water sources in delta and non-delta counties. Our specific aim is to determine significant differences in medians among delta and non-delta counties overall and in each state.
2. Methods
Data were sourced from the major-ions dataset created by the U.S. Geological Survey [14]. It includes chemical data and physical properties from 123,699 wells across different years from the Continental United States, Alaska, Hawaii, Puerto Rico, the U.S. Virgin Islands, Guam, and American Samoa compiled in 2016 from 16 sources that individually tested the water samples. We restricted our analyses to the 4653 wells used as public supply or domestic wells located in the eight states serviced by the Delta Regional Authority (DRA), Alabama, Arkansas, Illinois, Kentucky, Louisiana, Mississippi, Missouri, and Tennessee. Counties were categorized as delta if they were one of the counties serviced by the Delta Regional Authority, otherwise, they were categorized as non-delta. Our analysis included 178 delta counties and 246 non-delta counties.
We created summary tables (Tables S1–S4) and reported the mean, standard deviation, median, interquartile range, and range of basic water quality parameters, major electrolyte concentrations, trace element concentrations, heavy metal concentrations, and radioactive ion concentrations for delta and non-delta counties for all water samples.
We then created boxplots for groundwater chemical concentrations for basic water quality parameters, major electrolyte concentrations, trace element concentrations, heavy metal concentrations, and radioactive ion concentrations and plotted chemicals’ median, inter-quartile range, and outlier values of the groundwater chemicals. Data were grouped by state and separated into delta and non-delta counties for each plot. Differences in median concentrations of water chemicals across delta versus non-delta counties for each state were determined using Wilcoxin rank sum test [15]. We used the ggplot2 package in RStudio version 2024.04.1+748.
3. Results
A total of 4653 wells were included in our analysis from 424 different counties with 178 delta counties and 246 non-delta counties. In total, 1452 wells were in delta counties and 3201 were in non-delta counties. These wells were either used for public water supply or domestic purposes. Well counts in each state were 134 in Alabama, 549 in Arkansas, 1601 in Illinois, 143 in Kentucky, 811 in Louisiana, 641 in Mississippi, 330 in Missouri, and 44 in Tennessee.
Considering all states together, delta counties and non-delta counties had the following median values of water quality parameters, respectively: 0.10 mg/L and 0.16 mg/L for organic nitrogen (p-value < 0.001), 7.40 and 7.20 for pH (p-value < 0.001) and 247 mg/L and 383 mg/L for TDS (p-value < 0.001), and 366 μS/cm and 570 μS/cm for specific conductance (p-value < 0.001) (Table S1). When comparing delta versus non-delta counties across each state, delta counties had higher organic nitrogen in Missouri (0.18 vs. 0.17 mg/L, p-value = 0.036); higher PH in Alabama (7.40 vs. 6.70, p-value = 0.002) and Missouri (7.50 vs. 7.40, p-value = 0.003); lower PH in Illinois (7.00 vs. 7.20, p-value = <0.0001), Kentucky (7.00 vs. 7.30, p-value = 0.0344), Mississippi (7.60 vs. 7.90, p-value <0.0001), and Tennessee (6.20 vs. 7.10, p-value <0.0001); and higher TDS in Alabama (166 and 129 mg/L, p-value = 0.044) and Arkansas (252 and 215 mg/L, p-value = 0.004); lower TDS in Illinois (349 and 472 mg/L, p-value < 0.0001), Louisiana (277 and 345 mg/L, p-value < 0.001), and Tennessee (144 and 155 mg/L, p-value = 0.009) (Figure 1).
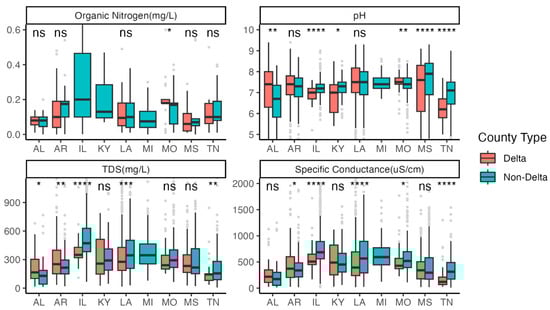
Figure 1.
Boxplots comparing basic water quality parameters in delta versus non-delta counties across eight delta states. Statistical significance is represented above each corresponding boxplot where one star (*) represents p-value < 0.05, two stars (**) represent p-value < 0.01, three stars (***) represent p-value < 0.001, four stars (****) represents p-value < 0.0001, and ns represents non-significance. The dots above the solid lines (whiskers) indicate outliers.
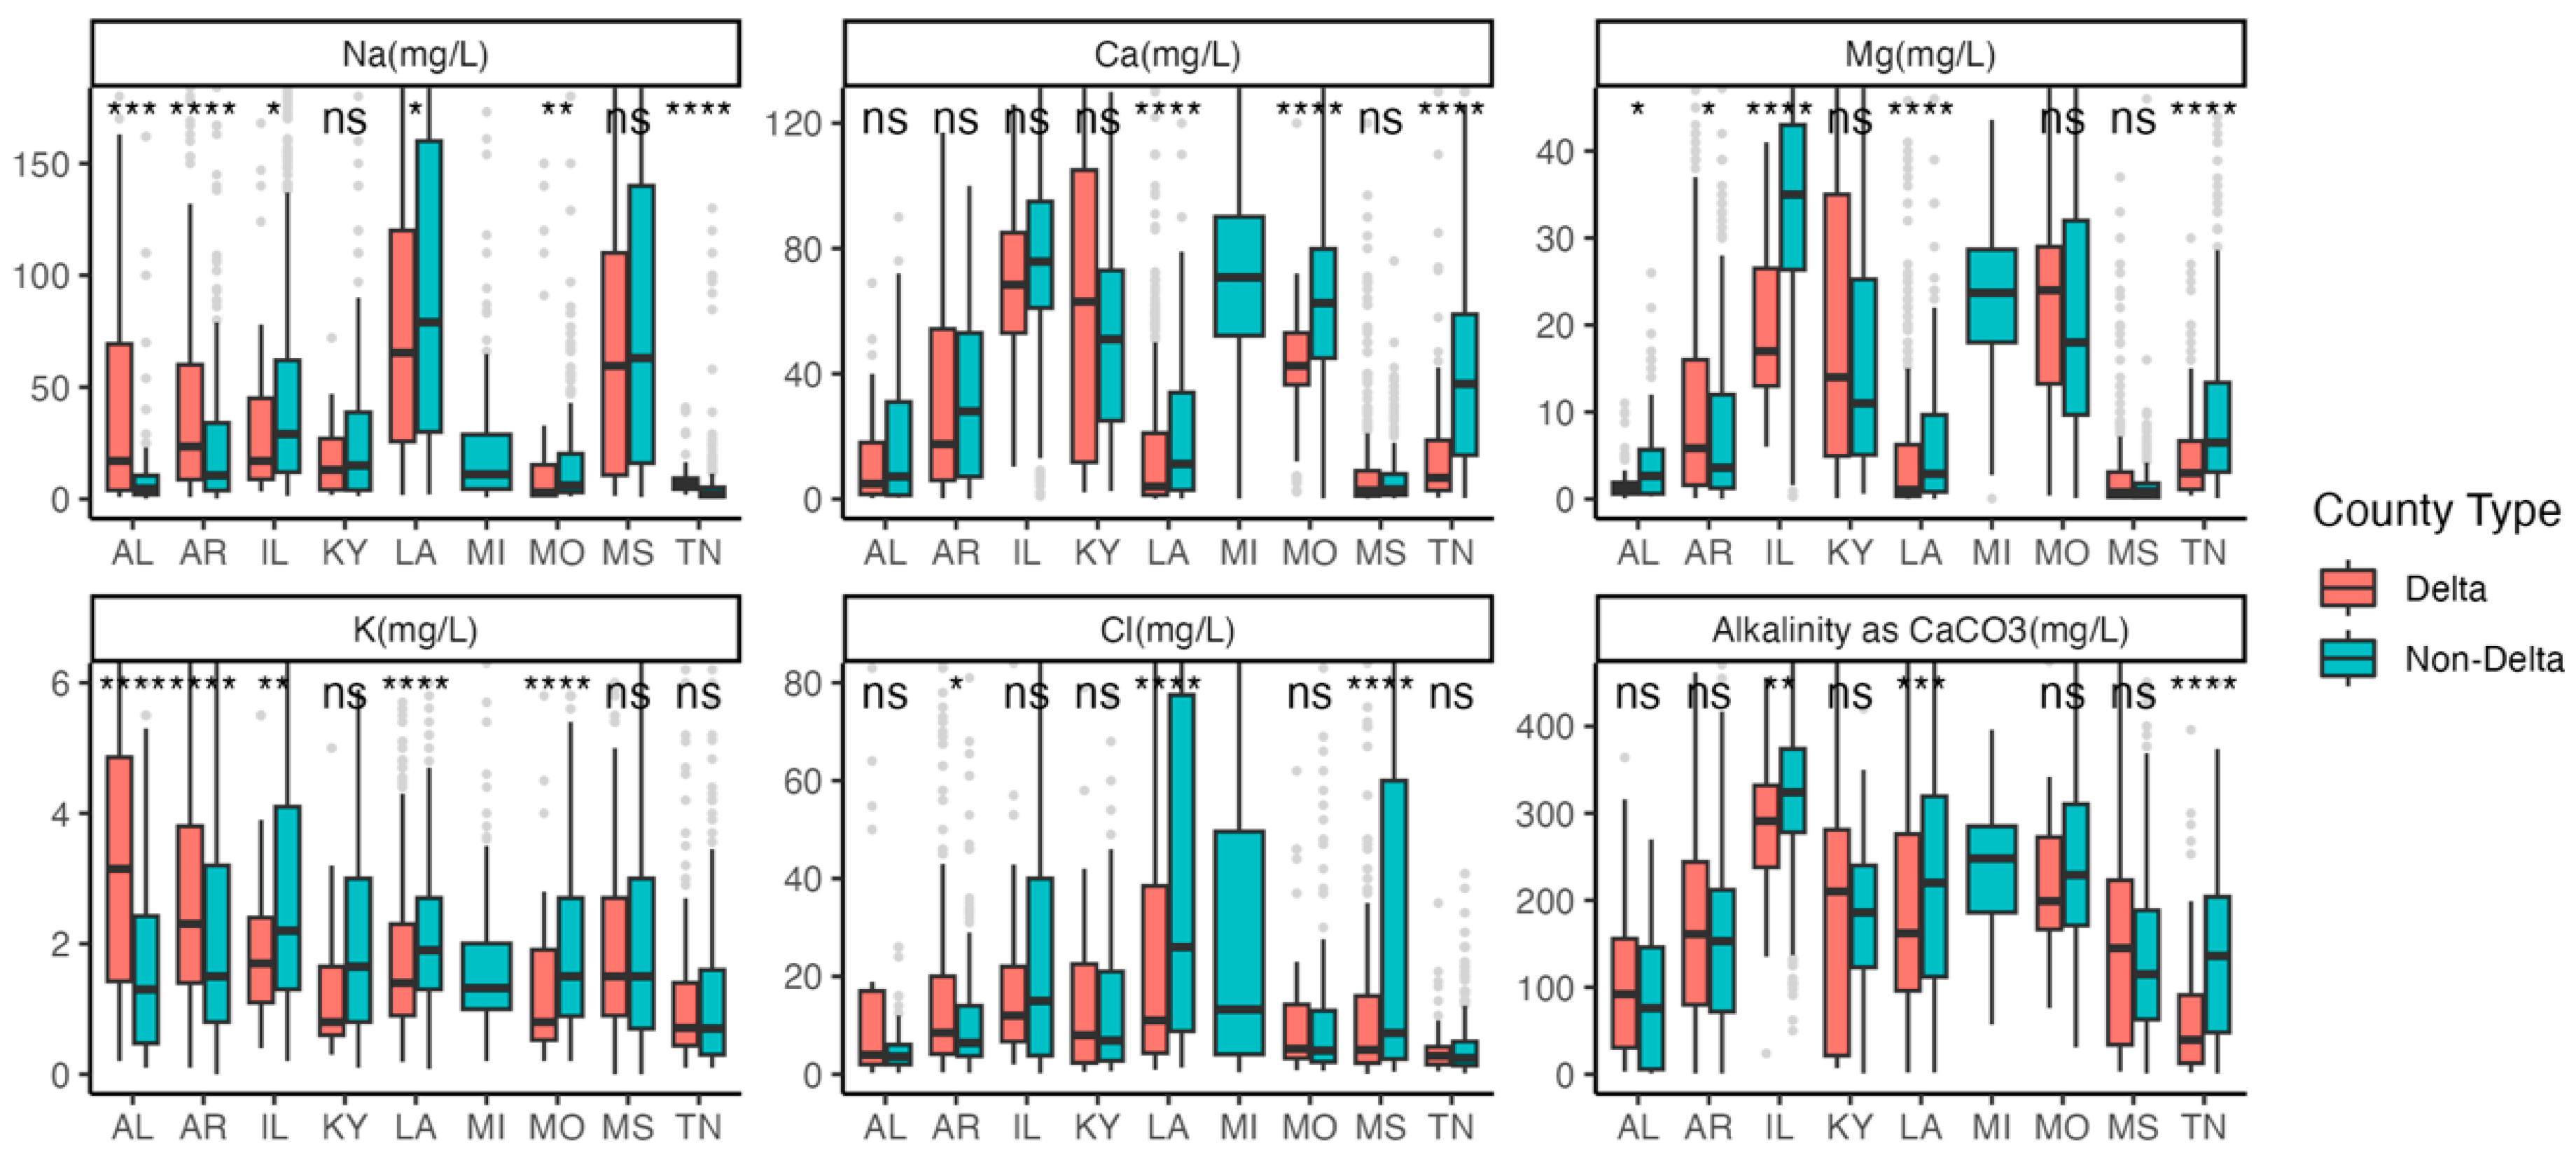
Delta counties and non-delta counties had the following median values of major electrolytes, respectively: 7 mg/L and 59 mg/L for calcium (p-value < 0.001), 1.57 mg/L and 1.75 mg/L of potassium (p-value < 0.001), 2 mg/L and 22 mg/L of magnesium (p-value < 0.001), 38 mg/L and 21 mg/L of sodium (p-value < 0.001), 8 mg/L and 9 mg/L of chloride (p-value = 0.061), and 153 mg/L and 259 mg/L of alkalinity by CaCO3 (p-value < 0.001) (Table S2). When comparing delta versus non-delta counties across each state, delta counties had higher sodium in Alabama (17 and 5 mg/L, p-value < 0.0001), Arkansas (24 and 11 mg/L, p-value < 0.0001), and Tennessee (7 and 2, p-value < 0.0001); lower Na in Illinois (17 and 29 mg/L, p-value = 0.035), Louisiana (65 and 79 mg/L, p-value = 0.0012), and Missouri (3 and 6 mg/L, p-value = 0.001); lower calcium in Louisiana (4 and 11 mg/L, p-value < 0.0001), Missouri (43 and 63 mg/L, p-value < 0.0001), and Tennessee (7 and 37 mg/L, p-value < 0.0001); lower Mg in Alabama (1.2 and 2.6 mg/L, p-value = 0.024), Illinois (17 and 35 mg/L, p-value < 0.0001), Louisiana (1 and 3 mg/L, p-value < 0.0001), and Tennessee (3 and 6 mg/L, p-value < 0.0001); higher magnesium in Arkansas (6 and 4 mg/L, p-value = 0.046); lower potassium in Illinois (1.7 and 2.2 mg/L, p-value = 0.003), Louisiana (1.40 and 1.90 mg/L, p-value < 0.0001), and Missouri (0.80 and 1.50 mg/L, p-value < 0.0001); and higher potassium in Alabama (3.15 and 1.30 mg/L, p-value < 0.0001) and Arkansas (2.30 and 1.50 mg/L, p-value < 0.0001) (Figure 2).
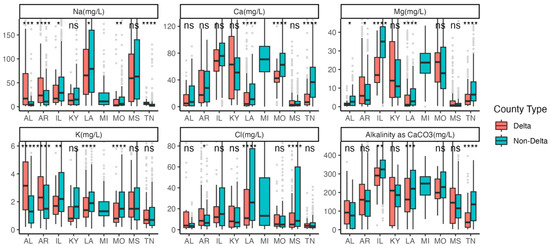
Figure 2.
Boxplots comparing major electrolytes concentrations in delta versus non-delta counties across eight delta states. Statistical significance is represented above each corresponding boxplot where one star (*) represents p-value < 0.05, two stars (**) represent p-value < 0.01, three stars (***) represent p-value < 0.001, four stars (****) represent p-value < 0.0001, and ns represents non-significance.
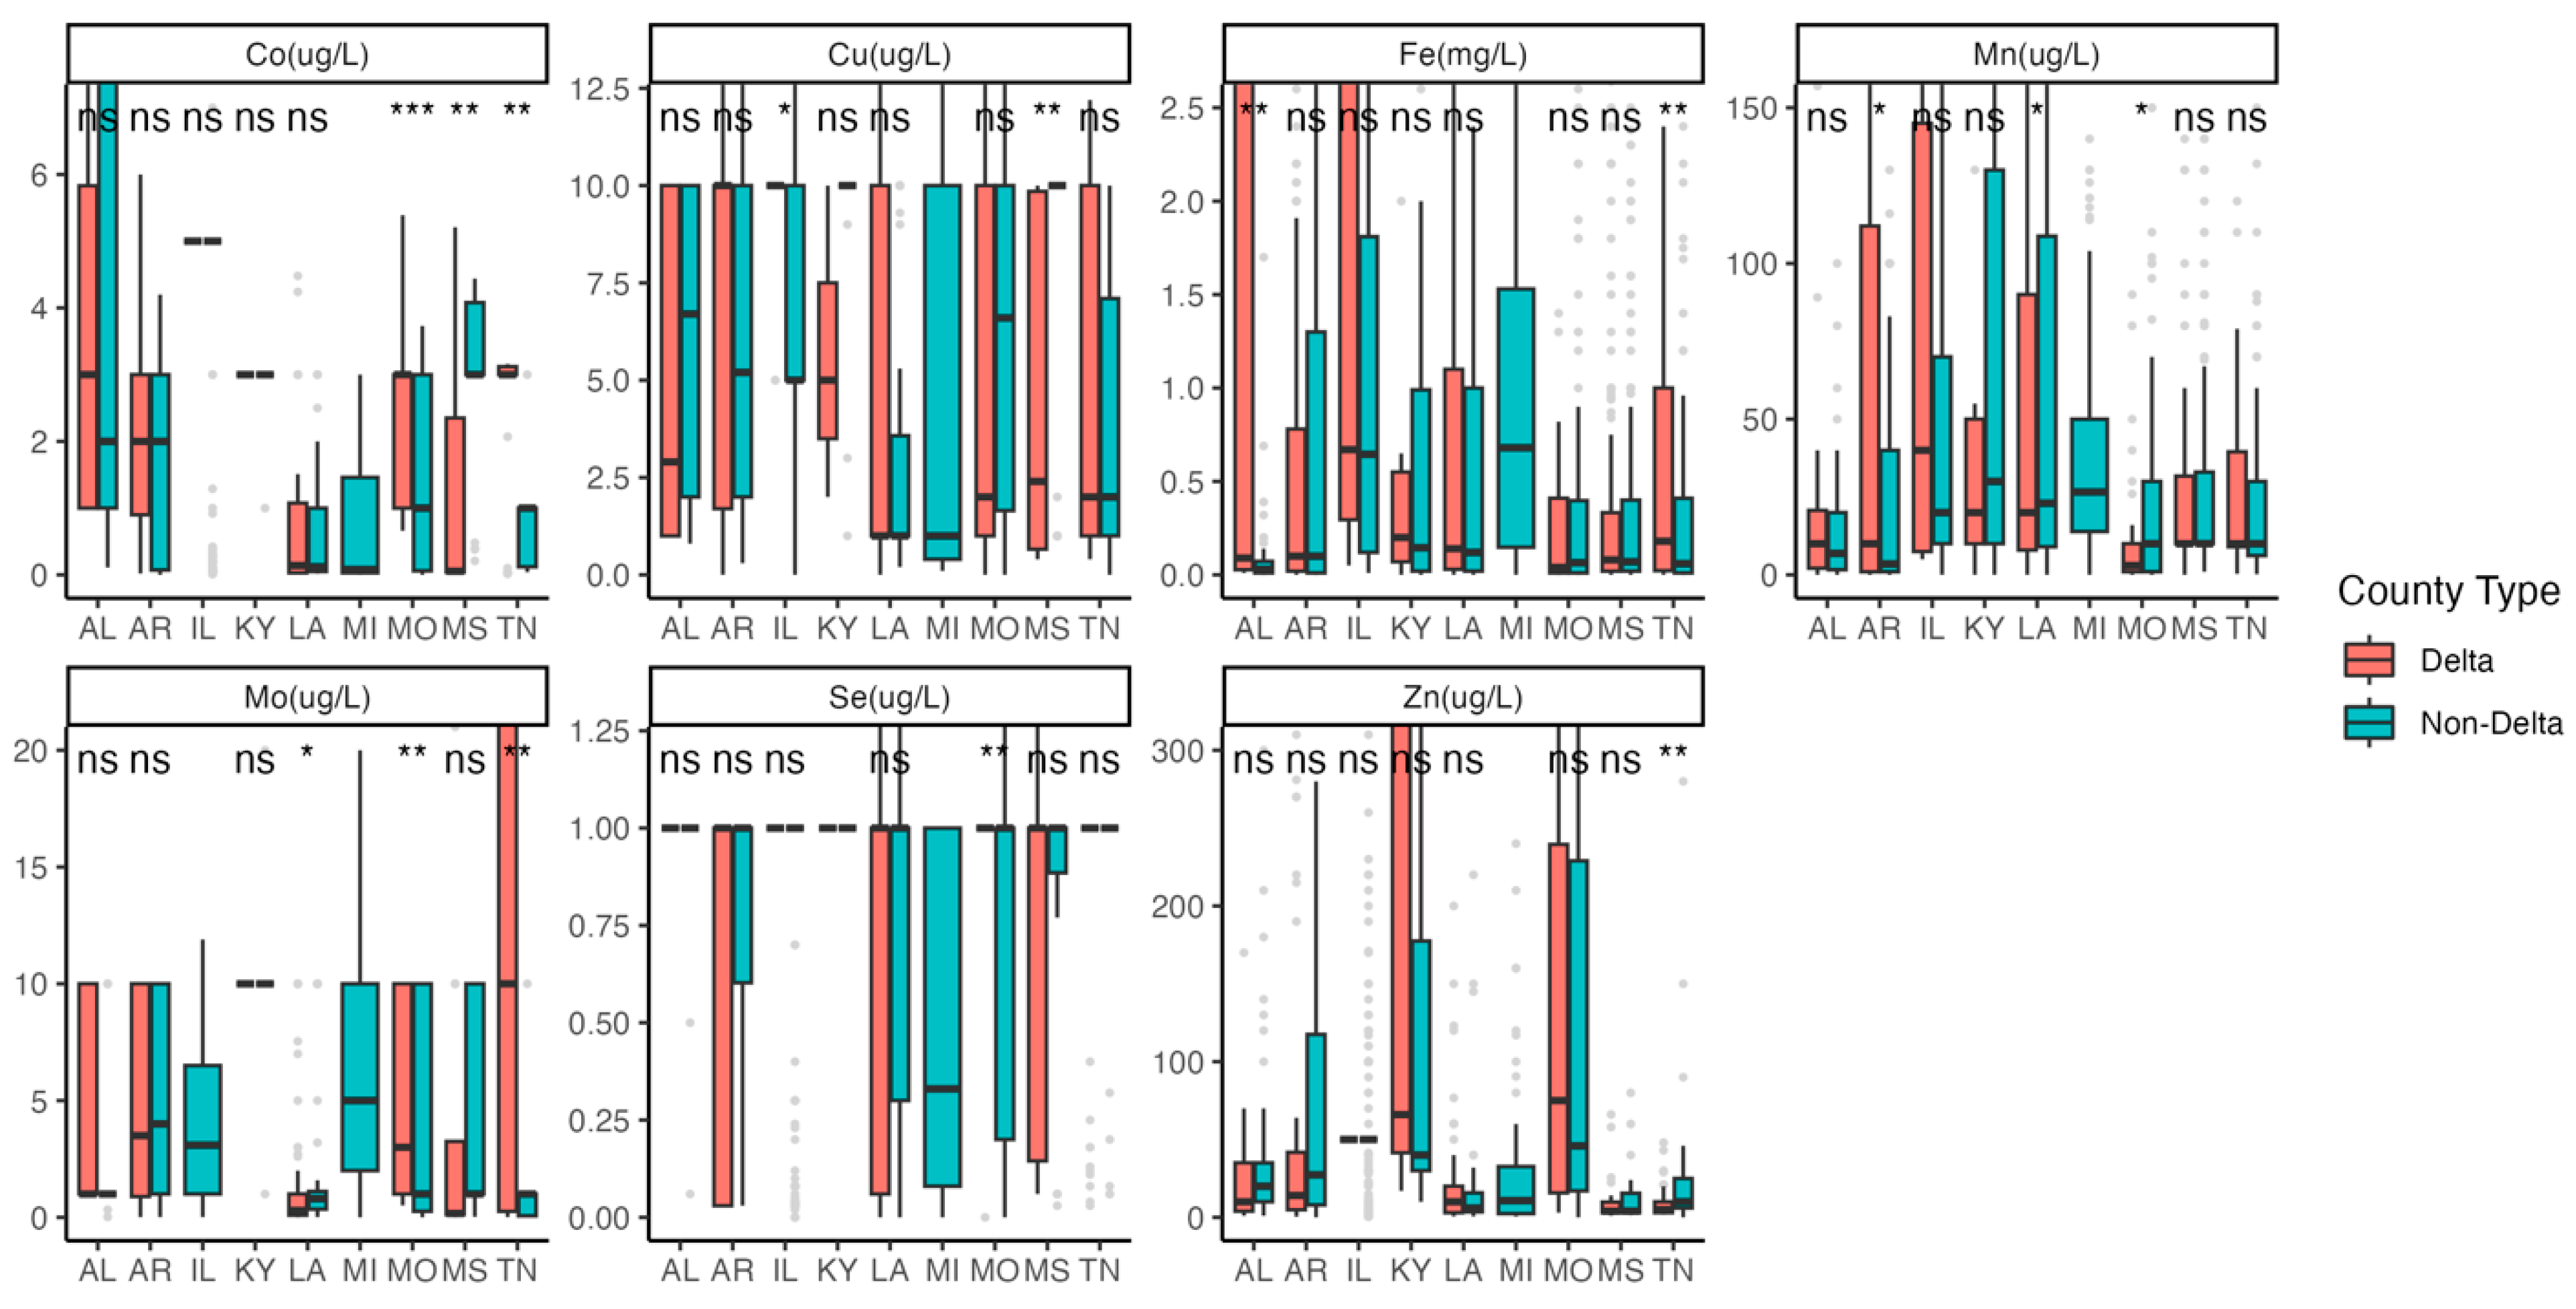
Delta counties and non-delta counties had the following median values of trace element concentrations: 3 μg/L and 5 μg/L of cobalt (p-value < 0.001), 2 μg/L and 5 μg/L of copper (p-value < 0.001), 0.11 mg/L and 0.25 mg/L of iron (p-value < 0.001), 10 μg/L and 20 μg/L of manganese (p-value = 0.002), 1 μg/L and 1.13 μg/L of molybdenum (p-value > 0.9), 1 μg/L and 1 μg/L of selenium (p-value < 0.001), and 10 μg/L and 50 μg/L of zinc (p-value < 0.001) (Table S3). When comparing delta versus non-delta counties across each state, delta counties had higher copper in Illinois (10 and 5 μg/L, p-value = 0.011); lower copper in Mississippi (2.40 and 10 μg/L, p-value = 0.003); higher iron in Alabama (0.09 and 0.03 mg/L, p-value = 0.002 and Tennessee (0.18 and 0.06 mg/L, p-value = 0.009); higher manganese in Arkansas (10 and 4 μg/L, p-value = 0.041); lower manganese in Louisiana (20 and 23 μg/L, p-value = 0.038) and Missouri (3 and 10 μg/L, p-value = 0.027); and lower zinc in Tennessee (5 and 10 μg/L, p-value = 0.009). Small sample size prevented conclusive results for cobalt, molybdenum, and selenium. Most trace elements showed no significant difference between delta and non-delta counties in all states (Figure 3).
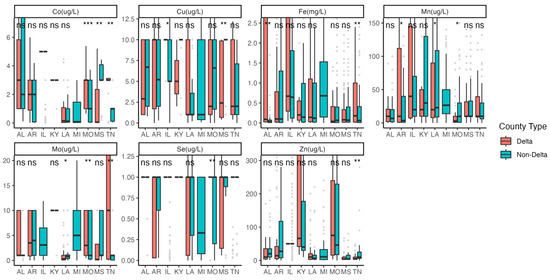
Figure 3.
Boxplots comparing trace element concentrations in delta versus non-delta counties across eight delta states. Statistical significance is represented above each corresponding boxplot where one star (*) represents p-value < 0.05, two stars (**) represent p-value < 0.01, three stars (***) represent p-value < 0.001, and ns represents non-significance.
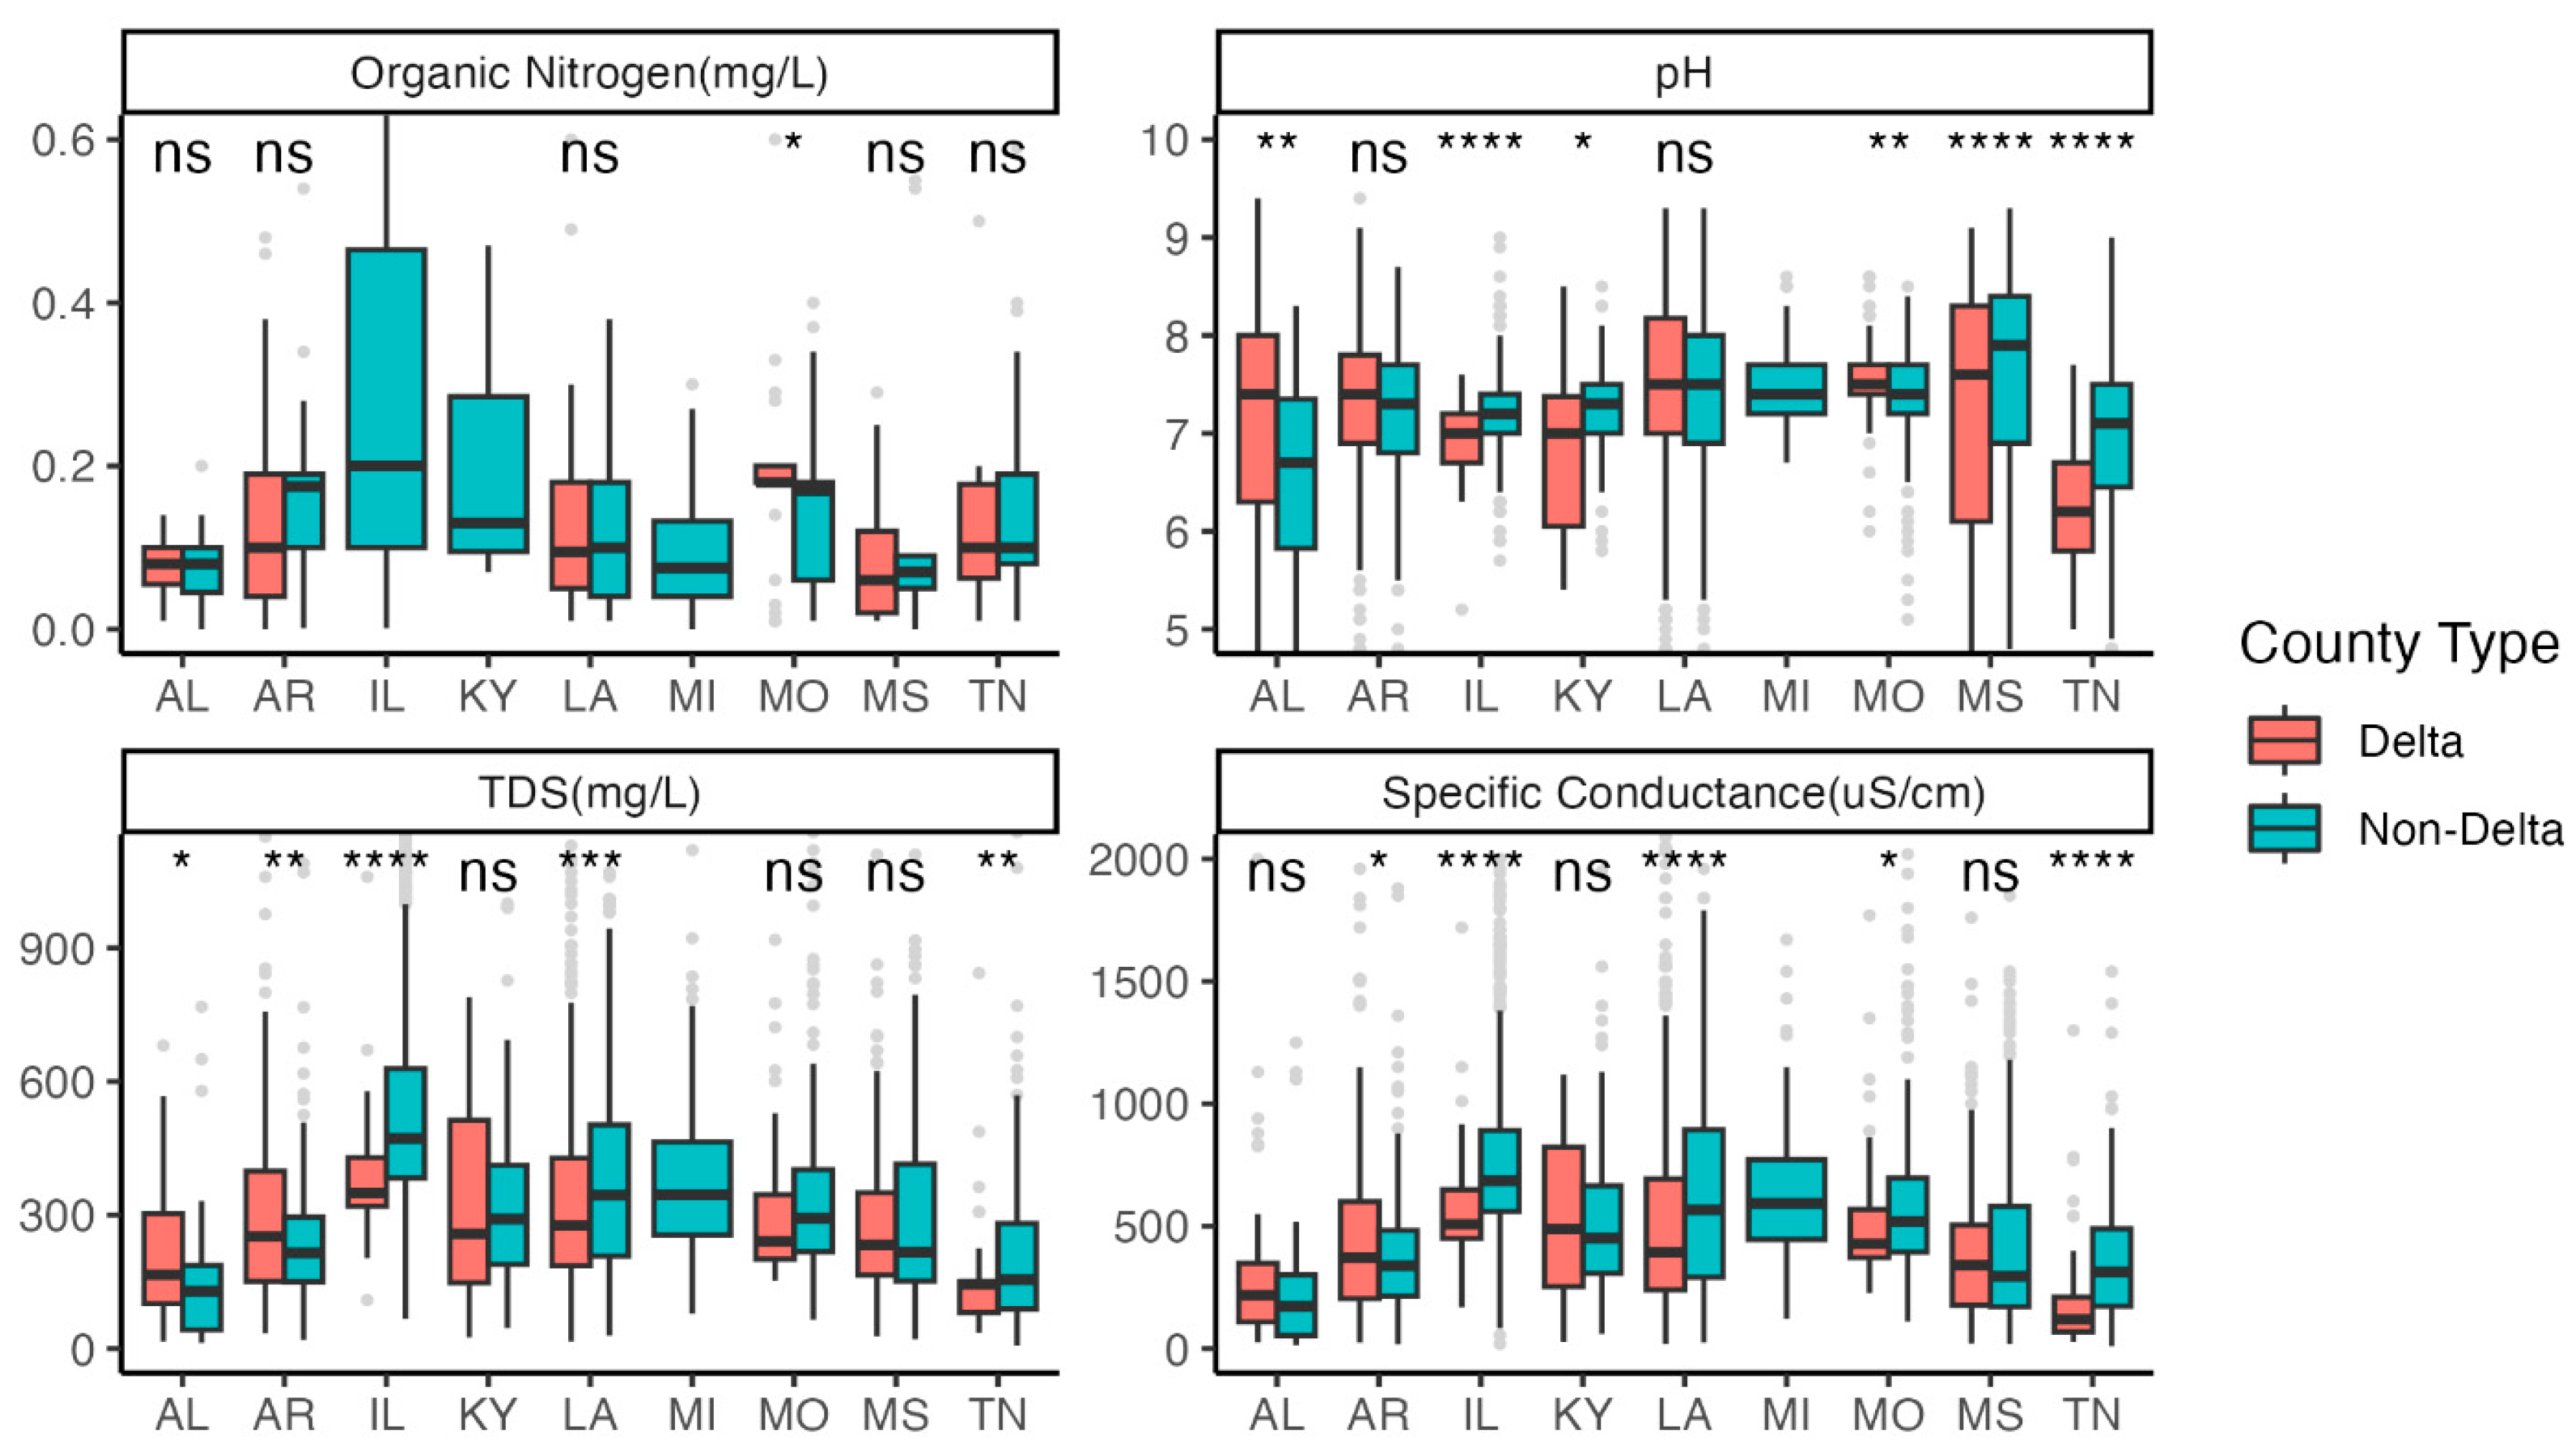
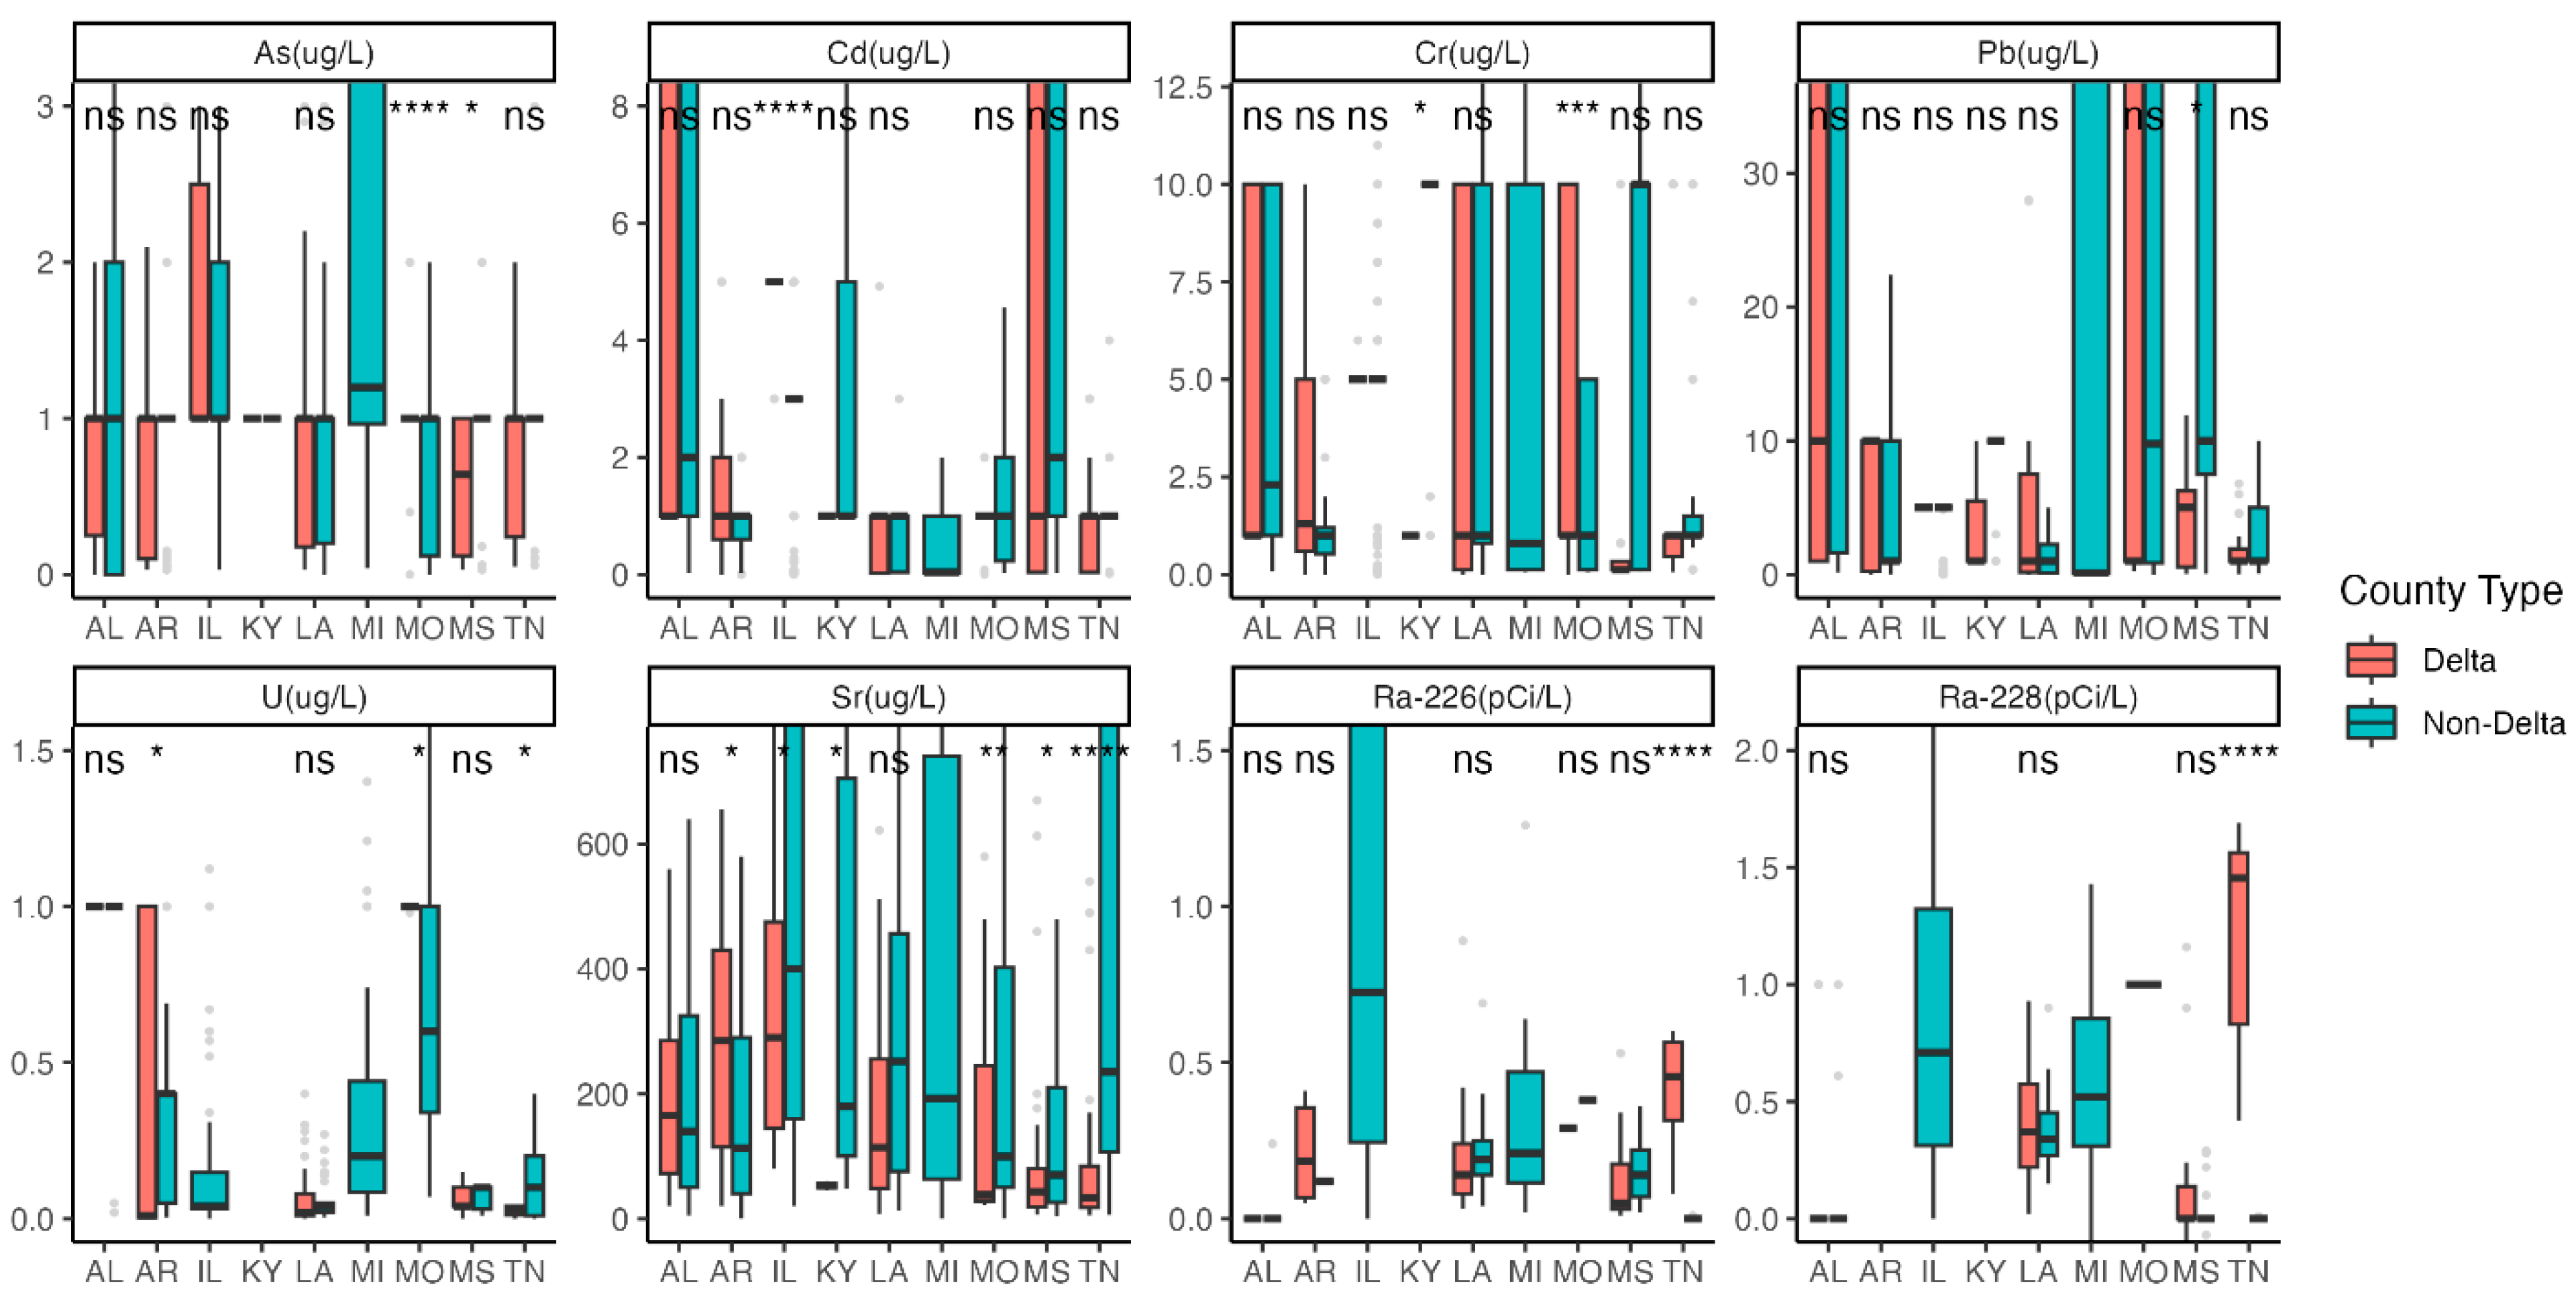
Delta counties and non-delta counties had the following median values of each heavy metal or radioactive ion, respectively: 1 μg/L and 1 μg/L for arsenic (p-value < 0.001), 1 μg/L and 3 μg/L for cadmium (p-value < 0.001), 1 μg/L and 5 μg/L for chromium (p-value < 0.001), 1 μg/L and 5 μg/L for lead (p-value < 0.001), 0.04 μg/L and 0.1 μg/L for uranium (p-value < 0.001), 86 μg/L and 340 μg/L for strontium (p-value < 0.001), 0.10 pCi/L and 0.15 pCi/L for radon-226 (p-value = 0.6), and 0.23 pCi/L and 0.20 pCi/L for radon-228 (p-value = 0.6). When comparing between states, a large majority showed no significant difference between delta and non-delta counties. There were low concentrations of heavy metals and radioactive ions in all samples from all regions (Figure 4).

Figure 4.
Boxplots comparing heavy metals and radioactive ion concentrations in delta versus non-delta counties across eight delta states. Statistical significance is represented above each corresponding boxplot where one star (*) represents p-value < 0.05, two stars (**) represents p-value < 0.01, three stars (***) represents p-value < 0.001, four stars (****) represents p-value < 0.0001, and ns represents non-significance.
4. Discussion
We found that drinking water in delta counties had significantly lower pH and significantly lower TDS for most states when compared to non-delta counties. Drinking water in delta counties had significantly higher sodium and lower calcium, magnesium, and potassium in most states. The state-wise comparison suggests that a large majority of states showed non-significant differences in drinking water for the trace elements, heavy metals, and radioactive ions studied and thus they are not likely different. The concentrations of heavy metals and radioactive ions we studied were very small and further support that these are likely not different concentrations between delta and non-delta counties.
Low pH and/or low TDS increase the corrosiveness of water and can lead to corrosion of distribution pipes and thus to leaching of contaminants and metals [16,17]. Lead distribution pipes are still widespread in the US with an EPA survey finding around 9.2 million lead distribution pipes [18]. The intake of lead is detrimental even in very low levels; exposure in adults can cause decline in cognitive and renal function as well as hypertension and cardiovascular problems [19]. Children are more affected by lead exposure and can have long-term detriments to cognitive function, increased behavioral problems, and many more symptoms [19]. Non-delta counties are more likely to intake alkaline water which has been suggested to lead to better health with evidence of positive effects on hydration, gastrointestinal symptoms, and blood glucose levels, but research on these outcomes is not definitive [20]. Low TDS can indicate low essential mineral content [21], thus, those in delta counties could be intaking lower nutrients (e.g., calcium, magnesium, and potassium) essential to optimal health through drinking water than those in non-delta counties generally.
Drinking water in delta counties had higher sodium and lower calcium, magnesium, and potassium than non-delta counties. These electrolytes are important for blood pressure regulation and cardiovascular health; a high intake of sodium is associated with high blood pressure and worse cardiovascular health [22] while an adequate intake of calcium, magnesium, and potassium is required for vascular functions and blood pressure control [8,23,24,25]. United States citizens generally intake inadequate amounts of calcium, magnesium, and potassium [26], and water can be an appreciable source for the intake of these electrolytes [5]. Without optimum concentrations in their drinking water, residents in delta counties may not be able to compensate for low dietary intake of these electrolytes, which could contribute to worse health outcomes. Sodium is an essential electrolyte, but excessive sodium intake is detrimental to human health [27]. Since the U.S. population generally has a dietary sodium intake above the recommended national limit [28], the additional sodium from drinking water can increase the disease burden [29]. Due to climate change, drinking water salinity is increasing in many regions such as in coastal Louisiana where saltwater intrusion has increased the sodium contents in drinking water supplies [30,31].With continuing rising sea levels, saltwater intrusion is likely to have a great impact on drinking water quality in the coastal delta counties in Louisiana [31].However, in our results we found that delta counties in Louisiana had lower sodium content than non-delta counties, which could be explained by rainfall increasing water flow of the Mississippi river, moving the saltwater downstream during the time of data collection [32]. High sodium content in drinking water has been linked to hypertension and gestational hypertension in other settings [33,34]. Similarly, drinking water low in magnesium and calcium has been associated with higher mortality and cardiovascular disease burden [35,36,37].
When comparing delta and non-delta counties between states, there was a large majority of non-significant differences for the trace elements, heavy metals, and radioactive ions we studied and thus they are not likely different. The concentrations of heavy metals and radioactive ions we studied were very low at the source level. Trace elements are important for health with deficiencies in iron associated with anemia [38] and deficiencies in zinc associated with many symptoms including declined immune functioning, alopecia, and celiac disease [39]. The intake of trace elements through drinking water could improve health problems related to deficiencies. Heavy metal exposure through drinking water has detrimental public health consequences; for example, arsenic exposure is associated with hypertension, cardiovascular disease, and lung cancer [12], mercury exposure is associated with cardiovascular effects and renal dysfunction [40], and lead exposure is associated with cognitive issues, hypertension, and lung and bladder cancer [12,19]. The exposure of radon is linked to lung cancer [41]. Even though we did not find source level differences across the counties, this does not mean there is no difference; smaller geographical regions such as different water sources can have widely different concentrations.
Our study had several strengths and limitations. The overall sample size was large, allowing for our delta versus non-delta counties analyses for all states combined to be stronger. Data were compiled by a national laboratory, with sufficient quality control ensuring data were taken from trustworthy sources. We covered many different parameters including organic nitrogen, pH, TDS, specific conductance, sodium, calcium, magnesium, potassium, chloride, alkalinity as CaCO3, cobalt, copper, iron, manganese, molybdenum, selenium, zinc, arsenic, cadmium, chromium, lead, uranium, strontium, radon-226, and radon-228. For some parameters, there was too small a sample size, such as selenium, uranium, radon-226, and radon-228, leading to inconclusive results. We also did not have well samples from every county designated as a delta county by the delta regional authority. Moreover, groundwater water qualities may vary temporally. We were unable to include groundwater quality data after 2016 and hence were not able to compare the most recent water quality parameters for delta and non-delta counties.
5. Conclusions
Health disparities in the delta region of the United States could be partially explained by differences in water quality in these regions, particularly differences in pH, TDS, sodium, calcium, magnesium, and potassium. Previous studies suggest that these differences in water quality parameters are significantly associated with adverse population health outcomes in other settings [7,8,9,12,35]. These results highlight the need for further epidemiological studies to understand if health disparities in delta counties could be partially explained by these parameters. Future epidemiological studies are needed to explore the relationships between distribution pipe corrosion from low pH and TDS, lower mineral intake, and the poor health outcomes of the delta. To understand a better connection between drinking water quality and population health, water samples at point of use (e.g., tap-water samples) and individual household member health outcome data should be collected. Comparisons for smaller geographical regions should also be considered; small spatial differences can lead to significant differences in ions and heavy metal concentrations and different well samples can have widely different concentrations.
Supplementary Materials
The following supporting information can be downloaded at: https://www.mdpi.com/article/10.3390/w16182622/s1. Table S1:Comparison of basic water quality parameters across delta versus non-delta counties. p-values represent results of Wilcoxon Rank Sum tests between delta and non-delta counties for each parameter; Table S2: Comparison of major electrolyte concentrations of cardiovascular importance across delta versus non-delta counties. p-values represent results of Wilcoxon Rank Sum tests between delta and non-delta counties for each electrolyte; Table S3: Comparison of trace element concentrations across delta versus non-delta counties. p-values represent results of Wilcoxon Rank Sum tests between delta and non-delta counties for each element; Table S4: Comparison of heavy metals and radioactive ions concentrations across delta versus non-delta counties. p-values represent results of Wilcoxon Rank Sum tests between delta and non-delta counties for each metal or ion.
Author Contributions
Conceptualization, A.M.N.; Methodology, A.M.N.; Formal analysis, E.V.P.; Writing—original draft, E.V.P.; Writing—review & editing, C.J. and A.M.N.; Supervision, A.M.N. All authors have read and agreed to the published version of the manuscript.
Funding
This research received no external funding.
Data Availability Statement
No new data were created or analyzed in this study.
Conflicts of Interest
The authors declare no conflict of interest.
References
- Service Area Map. Delta Regional Authority. Available online: https://dra.gov/map-room/ (accessed on 12 September 2024).
- Cosby, A.G.; Bowser, D.M. The health of the Delta Region: A story of increasing disparities. J. Health Hum. Serv. Adm. 2008, 31, 58–71. [Google Scholar] [CrossRef] [PubMed]
- Felix, H.; Stewart, M.K. Health status in the Mississippi River Delta region. South. Med. J. 2005, 98, 149–154. [Google Scholar] [CrossRef]
- Gennuso, K.P.; Jovaag, A.; Catlin, B.B.; Rodock, M.; Park, H. Assessment of Factors Contributing to Health Outcomes in the Eight States of the Mississippi Delta Region. Prev. Chronic Dis. 2016, 13, E33. [Google Scholar] [CrossRef]
- Azoulay, A.; Garzon, P.; Eisenberg, M.J. Comparison of the mineral content of tap water and bottled waters. J. Gen. Intern. Med. 2001, 16, 168–175. [Google Scholar] [CrossRef] [PubMed]
- National Research Council (US); Safe Drinking Water Committee. The Contribution of Drinking Water to Mineral Nutrition in Humans. In Drinking Water and Health; National Academies Press: Washington, DC, USA; National Research Council (US) Safe Drinking Water Committee: Washington, DC, USA, 1980. [Google Scholar]
- Whelton, P.K. Sodium, potassium, blood pressure, and cardiovascular disease in humans. Curr. Hypertens. Rep. 2014, 16, 465. [Google Scholar] [CrossRef]
- Cunha, A.R.; Umbelino, B.; Correia, M.L.; Neves, M.F. Magnesium and vascular changes in hypertension. Int. J. Hypertens. 2012, 2012, 754250. [Google Scholar] [CrossRef] [PubMed]
- Villa-Etchegoyen, C.; Lombarte, M.; Matamoros, N.; Belizan, J.M.; Cormick, G. Mechanisms Involved in the Relationship between Low Calcium Intake and High Blood Pressure. Nutrients 2019, 11, 1112. [Google Scholar] [CrossRef]
- Mohammadifard, N.; Humphries, K.H.; Gotay, C.; Mena-Sánchez, G.; Salas-Salvadó, J.; Esmaillzadeh, A.; Ignaszewski, A.; Sarrafzadegan, N. Trace minerals intake: Risks and benefits for cardiovascular health. Crit. Rev. Food Sci. Nutr. 2019, 59, 1334–1346. [Google Scholar] [CrossRef] [PubMed]
- Dubey, P.; Thakur, V.; Chattopadhyay, M. Role of Minerals and Trace Elements in Diabetes and Insulin Resistance. Nutrients 2020, 12, 1864. [Google Scholar] [CrossRef]
- Rehman, K.; Fatima, F.; Waheed, I.; Akash, M.S.H. Prevalence of exposure of heavy metals and their impact on health consequences. J. Cell Biochem. 2018, 119, 157–184. [Google Scholar] [CrossRef]
- CDC National Center for Emerging and Zoonotic Infectious Diseases. Well Testing. Available online: https://www.cdc.gov/healthywater/drinking/private/wells/testing.html (accessed on 14 May 2024).
- Qi, S.L.; Harris, A.C. Geochemical Database for the National Brackish Groundwater Assessment of the United States. Available online: https://www.usgs.gov/data/geochemical-database-national-brackish-groundwater-assessment-united-states (accessed on 1 July 2024).
- McKnight, P.E.; Najab, J. Mann-Whitney U Test. In The Corsini Encyclopedia of Psychology; John Wiley & Sons: Hoboken, NJ, USA, 2010; p. 1. [Google Scholar]
- World Health Organization. pH in Drinking-Water: Revised Background Document for Development of WHO Guidelines for Drinking-Water Quality; World Health Organization: Geneva, Switzerland, 2007. [Google Scholar]
- World Health Organization. Total Dissolved Solids in Drinking-Water: Background Document for Development of WHO Guidelines for Drinking-Water Quality; World Health Organization: Geneva, Switzerland, 2003. [Google Scholar]
- EPA. Drinking Water Infrastructure Needs Survey and Assessment: 7th Report to Congress. 2023. Available online: https://www.epa.gov/system/files/documents/2023-09/Seventh%20DWINSA_September2023_Final.pdf (accessed on 13 September 2024).
- Vorvolakos, T.; Arseniou, S.; Samakouri, M. There is no safe threshold for lead exposure: A literature review. Psychiatriki 2016, 27, 204–214. [Google Scholar] [CrossRef] [PubMed]
- Tajudin, M.H.M.Z.; Hamirudin, A.H. Effects of alkaline water intake on health: A systematic literature review. Int. J. Allied Health Sci. 2020, 4, 1284–1298. [Google Scholar] [CrossRef]
- Manoj, S.; Kartheeshwari, M.R.; Keerthan, L.; Elango, L. Effects of low mineral content in bottled drinking water on human health and evaluation of optimal requirements. J. Food Compos. Anal. 2024, 128, 106052. [Google Scholar] [CrossRef]
- Mozaffarian, D.; Fahimi, S.; Singh, G.M.; Micha, R.; Khatibzadeh, S.; Engell, R.E.; Lim, S.; Danaei, G.; Ezzati, M.; Powles, J. Global sodium consumption and death from cardiovascular causes. N. Engl. J. Med. 2014, 371, 624–634. [Google Scholar] [CrossRef]
- Blanch, N.; Clifton, P.M.; Petersen, K.S.; Willoughby, S.R.; Keogh, J.B. Effect of high potassium diet on endothelial function. Nutr. Metab. Cardiovasc. Dis. 2014, 24, 983–989. [Google Scholar] [CrossRef]
- Behringer, E.J. Calcium and electrical signaling in arterial endothelial tubes: New insights into cellular physiology and cardiovascular function. Microcirculation 2017, 24, e12328. [Google Scholar] [CrossRef] [PubMed]
- Schutten, J.C.; Joosten, M.M.; de Borst, M.H.; Bakker, S.J.L. Magnesium and Blood Pressure: A Physiology-Based Approach. Adv. Chronic Kidney Dis. 2018, 25, 244–250. [Google Scholar] [CrossRef]
- Drake, V.J. Micronutrient Inadequacies in the US Population: An Overview. Available online: https://lpi.oregonstate.edu/mic/micronutrient-inadequacies/overview (accessed on 1 August 2024).
- Grillo, A.; Salvi, L.; Coruzzi, P.; Salvi, P.; Parati, G. Sodium Intake and Hypertension. Nutrients 2019, 11, 1970. [Google Scholar] [CrossRef]
- Hu, J.R.; Sahni, S.; Mukamal, K.J.; Millar, C.L.; Wu, Y.; Appel, L.J.; Juraschek, S.P. Dietary Sodium Intake and Sodium Density in the United States: Estimates From NHANES 2005–2006 and 2015–2016. Am. J. Hypertens. 2020, 33, 825–830. [Google Scholar] [CrossRef]
- Talukder, M.R.R.; Rutherford, S.; Chu, C.; Hieu Nguyen, T.; Phung, D. Association between salinity and hospital admission for hypertension: An ecological case-control study in the Mekong Delta Region in Vietnam. J. Public Health 2018, 40, 75–81. [Google Scholar] [CrossRef]
- Vineis, P.; Chan, Q.; Khan, A. Climate change impacts on water salinity and health. J. Epidemiol. Glob. Health 2011, 1, 5–10. [Google Scholar] [CrossRef] [PubMed]
- Nolan, D. Saltwater Threat to Louisiana Drinking Water to Grow across US, Experts Warn. Available online: https://www.theguardian.com/us-news/2023/oct/10/louisiana-drinking-water-saltwater-mississippi-river (accessed on 31 July 2024).
- An Overview of the Mississippi River’s Saltwater Wedge. Available online: https://www.mvn.usace.army.mil/Missions/Engineering/Stage-and-Hydrologic-Data/SaltwaterWedge/SaltwaterWedgeOverview/#:~:text=When%20freshwater%20flows%20increase%20or,and%20artificially%20arrest%20the%20wedge (accessed on 12 September 2024).
- Naser, A.M.; Rahman, M.; Unicomb, L.; Doza, S.; Gazi, M.S.; Alam, G.R.; Karim, M.R.; Uddin, M.N.; Khan, G.K.; Ahmed, K.M.; et al. Drinking Water Salinity, Urinary Macro-Mineral Excretions, and Blood Pressure in the Southwest Coastal Population of Bangladesh. J. Am. Heart Assoc. 2019, 8, e012007. [Google Scholar] [CrossRef] [PubMed]
- Naser, A.M.; Doza, S.; Rahman, M.; Unicomb, L.; Ahmed, K.M.; Anand, S.; Selim, S.; Shamsudduha, M.; Narayan, K.V.; Chang, H.; et al. Consequences of access to water from managed aquifer recharge systems for blood pressure and proteinuria in south-west coastal Bangladesh: A stepped-wedge cluster-randomized trial. Int. J. Epidemiol. 2021, 50, 916–928. [Google Scholar] [CrossRef]
- Shlezinger, M.; Amitai, Y.; Goldenberg, I.; Shechter, M. Desalinated seawater supply and all-cause mortality in hospitalized acute myocardial infarction patients from the Acute Coronary Syndrome Israeli Survey 2002–2013. Int. J. Cardiol. 2016, 220, 544–550. [Google Scholar] [CrossRef]
- Naser, A.M.; Rahman, M.; Unicomb, L.; Parvez, S.M.; Islam, S.; Doza, S.; Khan, G.K.; Ahmed, K.M.; Anand, S.; Luby, S.P.; et al. Associations of drinking rainwater with macro-mineral intake and cardiometabolic health: A pooled cohort analysis in Bangladesh, 2016–2019. NPJ Clean Water 2020, 3, 20. [Google Scholar] [CrossRef]
- Bykowska-Derda, A.; Spychala, M.; Czlapka-Matyasik, M.; Sojka, M.; Bykowski, J.; Ptak, M. The Relationship between Mortality from Cardiovascular Diseases and Total Drinking Water Hardness: Systematic Review with Meta-Analysis. Foods 2023, 12, 3255. [Google Scholar] [CrossRef]
- Miller, J.L. Iron deficiency anemia: A common and curable disease. Cold Spring Harb. Perspect. Med. 2013, 3, a011866. [Google Scholar] [CrossRef] [PubMed]
- Saper, R.B.; Rash, R. Zinc: An essential micronutrient. Am. Fam. Physician 2009, 79, 768–772. [Google Scholar]
- Tchounwou, P.B.; Ayensu, W.K.; Ninashvili, N.; Sutton, D. Environmental exposure to mercury and its toxicopathologic implications for public health. Environ. Toxicol. 2003, 18, 149–175. [Google Scholar] [CrossRef]
- Urrutia-Pereira, M.; Chatkin, J.M.; Chong-Neto, H.J.; Solé, D. Radon exposure: A major cause of lung cancer in nonsmokers. J. Bras. Pneumol. 2023, 49, e20230210. [Google Scholar] [CrossRef]
Disclaimer/Publisher’s Note: The statements, opinions and data contained in all publications are solely those of the individual author(s) and contributor(s) and not of MDPI and/or the editor(s). MDPI and/or the editor(s) disclaim responsibility for any injury to people or property resulting from any ideas, methods, instructions or products referred to in the content. |
© 2024 by the authors. Licensee MDPI, Basel, Switzerland. This article is an open access article distributed under the terms and conditions of the Creative Commons Attribution (CC BY) license (https://creativecommons.org/licenses/by/4.0/).